Embed Size (px)
Citation preview
Boomers and Disease Detection with OCT:
Catalyst for Optometric Practice Growth
COPE 38496-PD
Michael Chaglasian, OD
Boomers and Disease Detection with OCT KOA 2014
Michael Chaglasian, O.D. 1
Boomers and DiseaseDetection with OCT:
Catalyst for Optometric Practice Growth
Michael Chaglasian, OD, FAAOIllinois Eye Institute
Illinois College of [email protected]
Disclosure:Boomers and Disease Detection with OCT: Catalyst for Optometric Practice Growth
Michael Chaglasian, OD, FAAO
COPE # 38496-PD
This course material and information was developed independently of any assistance.
I do have the following financial arrangements to disclose:
Alcon– Honorarium/Advisory Board Allergan - Honorarium/Advisory BoardCarl Zeiss Meditec - Honorarium/Advisory Board
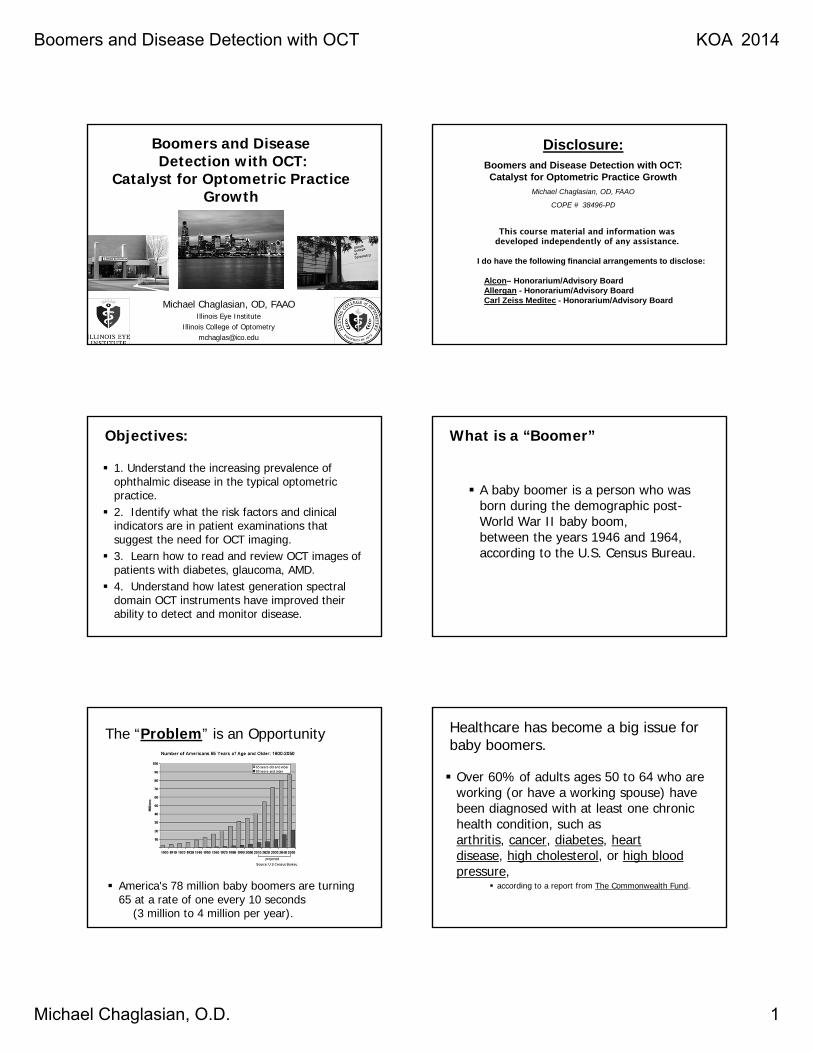
Objectives:
1. Understand the increasing prevalence of ophthalmic disease in the typical optometric practice.
2. Identify what the risk factors and clinical indicators are in patient examinations that suggest the need for OCT imaging.
3. Learn how to read and review OCT images of patients with diabetes, glaucoma, AMD.
4. Understand how latest generation spectral domain OCT instruments have improved their ability to detect and monitor disease.
What is a “Boomer”
A baby boomer is a person who was born during the demographic post-World War II baby boom,between the years 1946 and 1964, according to the U.S. Census Bureau.
The “Problem” is an Opportunity
America's 78 million baby boomers are turning 65 at a rate of one every 10 seconds
(3 million to 4 million per year).
Healthcare has become a big issue for baby boomers.
Over 60% of adults ages 50 to 64 who are working (or have a working spouse) have been diagnosed with at least one chronic health condition, such asarthritis, cancer, diabetes, heart disease, high cholesterol, or high blood pressure,
according to a report from The Commonwealth Fund.
Boomers and Disease Detection with OCT KOA 2014
Michael Chaglasian, O.D. 2
Where does optometry and OCT technology fit?
Possible Indications for Performing OCT
Elevated IOP > 21mm Hg C/D >.5 or Asymm. > 0.2 Poor visual field test-takers Narrow anterior chamber angles High myopia Personal or family history of
- diabetes- glaucoma- hypertension- field defects
Suspicious Optic Nerves- Marcus Gunn pupil- Acquired color defect- poor confrontation fields- Disc pallor
Unexplained decreased vision Drusen / AMD Numerous maculopathies and
retinopathies
And Many Others
Requirements of OCT Technology
Validation / Accuracy / Improved Outcomes Peer reviewed articles in the literature Not sales/marketing hype
Cost Effectiveness Can be challenging. Survey your patients for three months Consider “added value” to your practice
Ease of Use / Ease of Interpretation
OCT out performs Photography
Conclusions: For detection of a variety of retinal irregularities
evaluated in the current study, volume OCT scanning was more sensitive than non-mydriatic retinal photography in our asymptomatic individuals.
OCT detected clinically relevant disease features, such as subretinal fluid, that were missed by FP, and had a lower ungradable image rate.
It is likely that OCT will be added to photography screening in the near future for chorioretinal disease.
The Retinal Disease Screening Study: Prospective Comparison of Nonmydriatic Fundus Photography and Optical Coherence Tomography for Detection of Retinal Irregularities IOVS February
2013 54:1460-1468;published ahead of print January 15, 2013.
Boomers and Disease Detection with OCT KOA 2014
Michael Chaglasian, O.D. 3
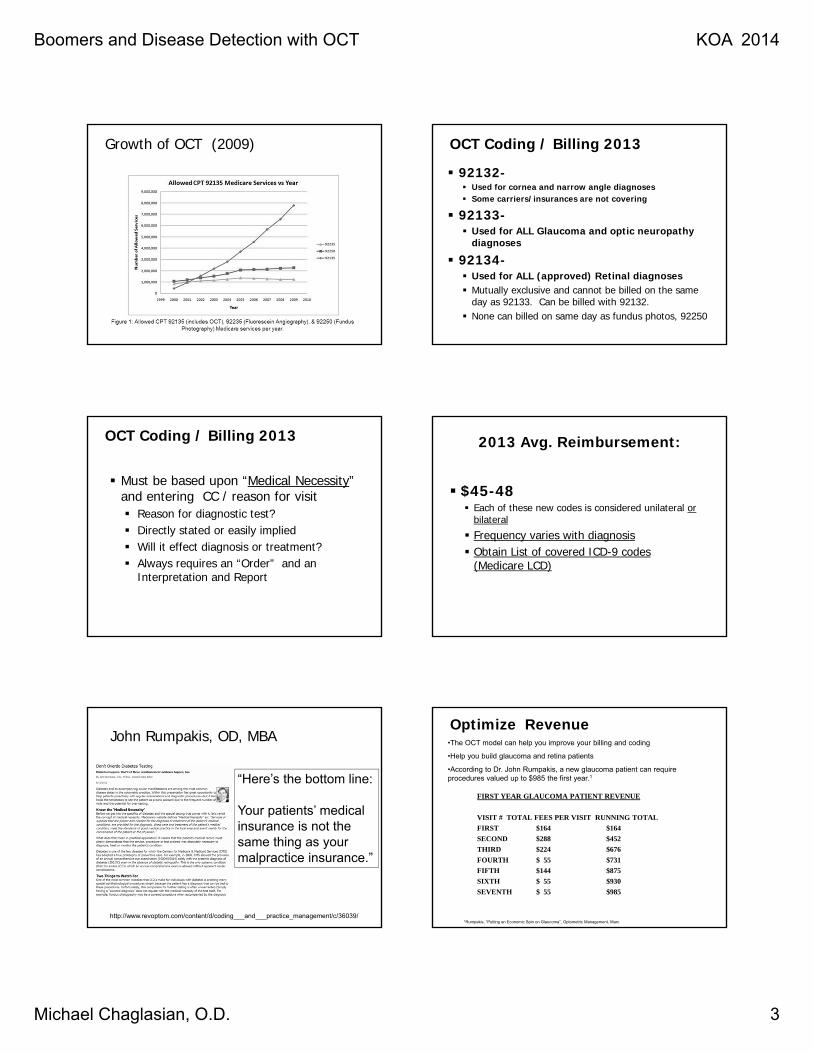
Growth of OCT (2009) OCT Coding / Billing 2013
92132- Used for cornea and narrow angle diagnoses Some carriers/insurances are not covering
92133- Used for ALL Glaucoma and optic neuropathy
diagnoses
92134- Used for ALL (approved) Retinal diagnoses Mutually exclusive and cannot be billed on the same
day as 92133. Can be billed with 92132. None can billed on same day as fundus photos, 92250
OCT Coding / Billing 2013
Must be based upon “Medical Necessity” and entering CC / reason for visit Reason for diagnostic test? Directly stated or easily implied Will it effect diagnosis or treatment? Always requires an “Order” and an
Interpretation and Report
2013 Avg. Reimbursement:
$45-48 Each of these new codes is considered unilateral or
bilateral
Frequency varies with diagnosis Obtain List of covered ICD-9 codes
(Medicare LCD)
John Rumpakis, OD, MBA
http://www.revoptom.com/content/d/coding___and___practice_management/c/36039/
“Here’s the bottom line:
Your patients’ medical insurance is not the same thing as your malpractice insurance.”
Optimize Revenue
FIRST YEAR GLAUCOMA PATIENT REVENUE
VISIT # TOTAL FEES PER VISIT RUNNING TOTAL
FIRST $164 $164
SECOND $288 $452
THIRD $224 $676
FOURTH $ 55 $731
FIFTH $144 $875
SIXTH $ 55 $930
SEVENTH $ 55 $985
1Rumpakis, “Putting an Economic Spin on Glaucoma”, Optometric Management, Marc
•The OCT model can help you improve your billing and coding
•Help you build glaucoma and retina patients
•According to Dr. John Rumpakis, a new glaucoma patient can require procedures valued up to $985 the first year.1
Boomers and Disease Detection with OCT KOA 2014
Michael Chaglasian, O.D. 4
ADDITIONAL INCOME DUE TO IMPROVEDCASE DETECTION
One ROI Example:
OCT only 13.5 per month or 3.4 week for breakeven
Procedures for each Glaucoma suspect and diagnosed, 2nd and 3rd visits2
92014 Ophthalmological services, comprehensive medical examination $ 113
92250 Fundus Photography $ 47
92020 Gonioscopy $ 26
92083 Threshold Visual Fields $ 52
76514 Corneal Pachymetry $ 12
92012 Ophthalmological services, intermediate $ 77
92132 Dqiagnostic Anterior Digital Imaging, - Spectralis $ 38
92133 Diagnostic Posterior ONH Digital Imaging, -Spectralis $ 42
Income generated by two follow-up visits of each glaucoma suspect $ 4072. Rumpakis, Putting an Economic Spin on Glaucoma, Optometric Management March 2004, pp 53-54.
There is no guarantee that your Medicare carrier will pay for these procedures when performed on the same day. Please contact your local Medicare carrier to determine appropriate billing guidelines.
It’s definitely not getting easier.
http://www.revoptom.com/content/c/22520/
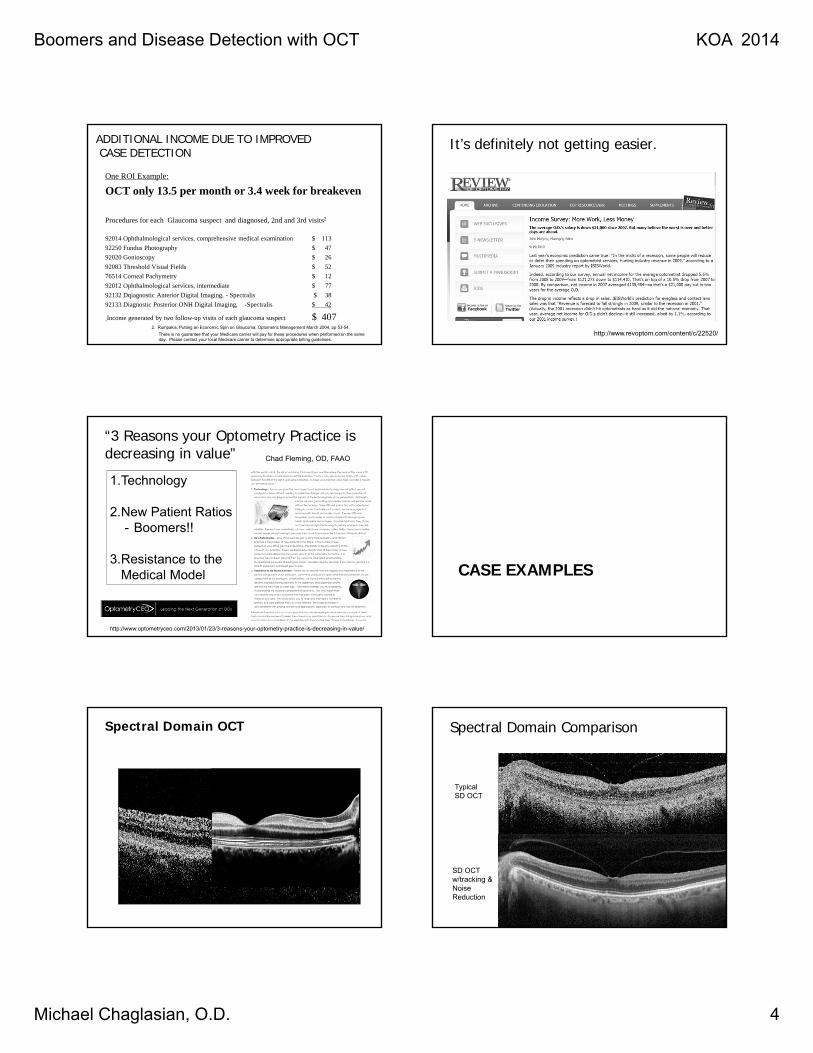
“3 Reasons your Optometry Practice is decreasing in value”
1.Technology
2.New Patient Ratios- Boomers!!
3.Resistance to the Medical Model
http://www.optometryceo.com/2013/01/23/3-reasons-your-optometry-practice-is-decreasing-in-value/
Chad Fleming, OD, FAAO
CASE EXAMPLES
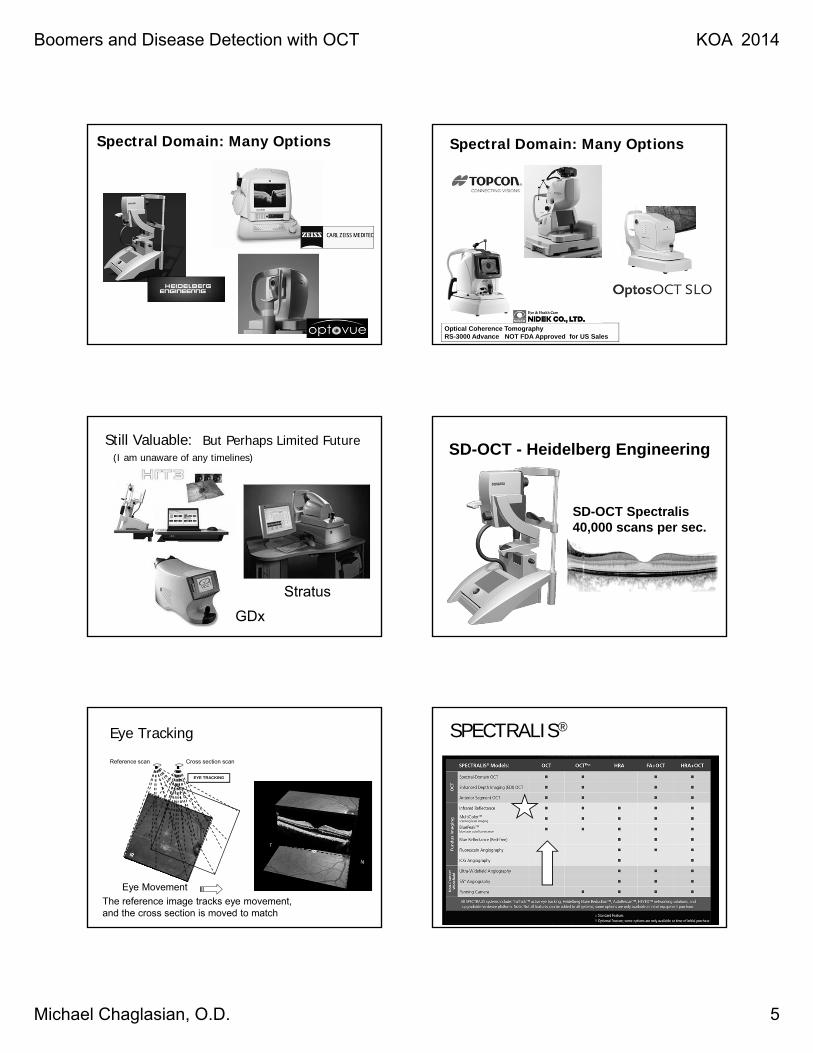
Spectral Domain OCT
Time Domain OCT SPECTRALIS
Stratus
Spectral Domain Comparison
Typical SD OCT
SD OCT w/tracking & Noise Reduction
Boomers and Disease Detection with OCT KOA 2014
Michael Chaglasian, O.D. 5
Spectral Domain: Many Options Spectral Domain: Many Options
Optical Coherence TomographyRS-3000 Advance NOT FDA Approved for US Sales
Still Valuable: But Perhaps Limited Future(I am unaware of any timelines)
GDx
Stratus
SD-OCT Spectralis40,000 scans per sec.
SD-OCT - Heidelberg Engineering
Eye Tracking
Cross section scanReference scan
Eye Movement
The reference image tracks eye movement, and the cross section is moved to match
EYE TRACKING
SPECTRALIS®
Boomers and Disease Detection with OCT KOA 2014
Michael Chaglasian, O.D. 6
Eye-Tracker Controls Scan Location in Real Time
Eye tracker recognizes eye movement and repositions scan pattern
Data acquired during eye movement is discarded
Stored data is free of motion artifacts
Cirrus™ HD-OCT
Cirrus™ HD-OCT
X6.5
Optovue: RTVue
Optovue Family
35
Optovue: iCam and Normative DB
Boomers and Disease Detection with OCT KOA 2014
Michael Chaglasian, O.D. 7
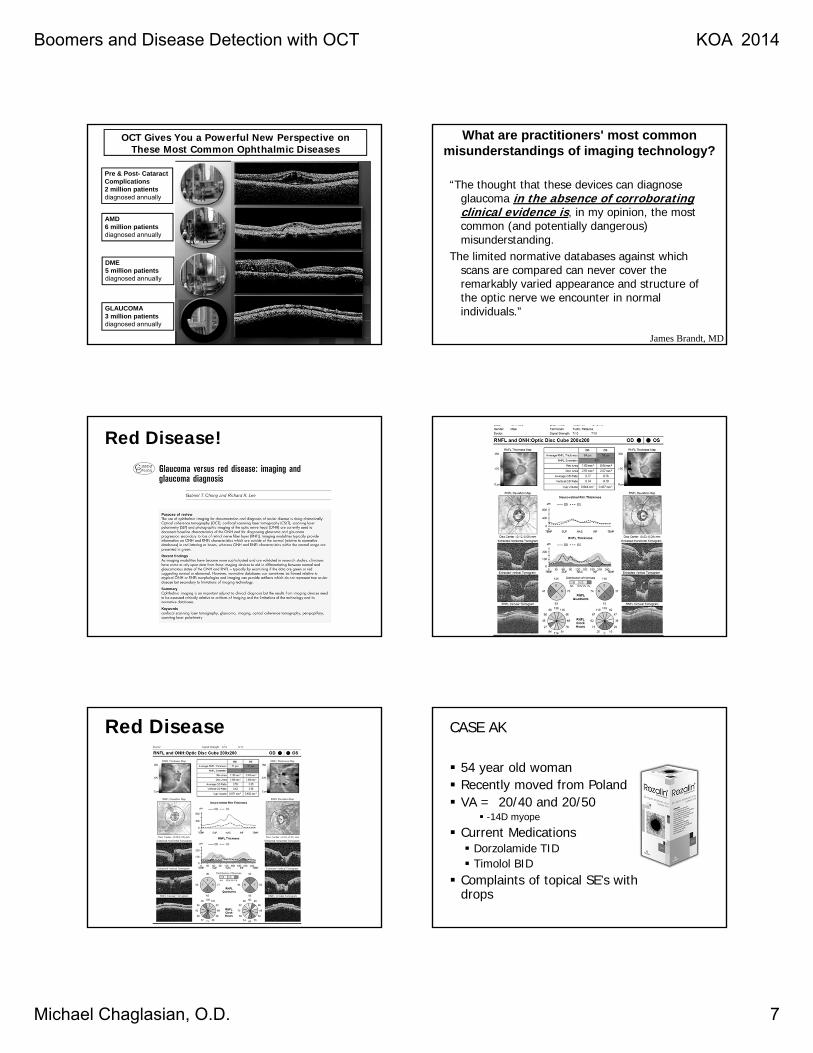
OCT Gives You a Powerful New Perspective on These Most Common Ophthalmic Diseases
Pre & Post- Cataract Complications2 million patientsdiagnosed annually
AMD6 million patientsdiagnosed annually
DME5 million patientsdiagnosed annually
GLAUCOMA3 million patientsdiagnosed annually
“The thought that these devices can diagnose glaucoma in the absence of corroborating clinical evidence is, in my opinion, the most common (and potentially dangerous) misunderstanding.
The limited normative databases against which scans are compared can never cover the remarkably varied appearance and structure of the optic nerve we encounter in normal individuals.”
James Brandt, MD
What are practitioners' most common misunderstandings of imaging technology?
Red Disease!
Red Disease CASE AK
54 year old woman Recently moved from Poland VA = 20/40 and 20/50
-14D myope
Current Medications Dorzolamide TID Timolol BID
Complaints of topical SE’s with drops
Boomers and Disease Detection with OCT KOA 2014
Michael Chaglasian, O.D. 8
CASE AK
Glaucoma Madness• Plethora of information
• Nothing Definitive in Early Stages• Nothing Stable• ONH –IOP-C/D Ratio• Pachymetry• Gonio – family history• Ethnicity –Stereo Photos• Pallor – Rim Area• Asymmetry-Blood Flow• Visual Fields
FRUSTRATION
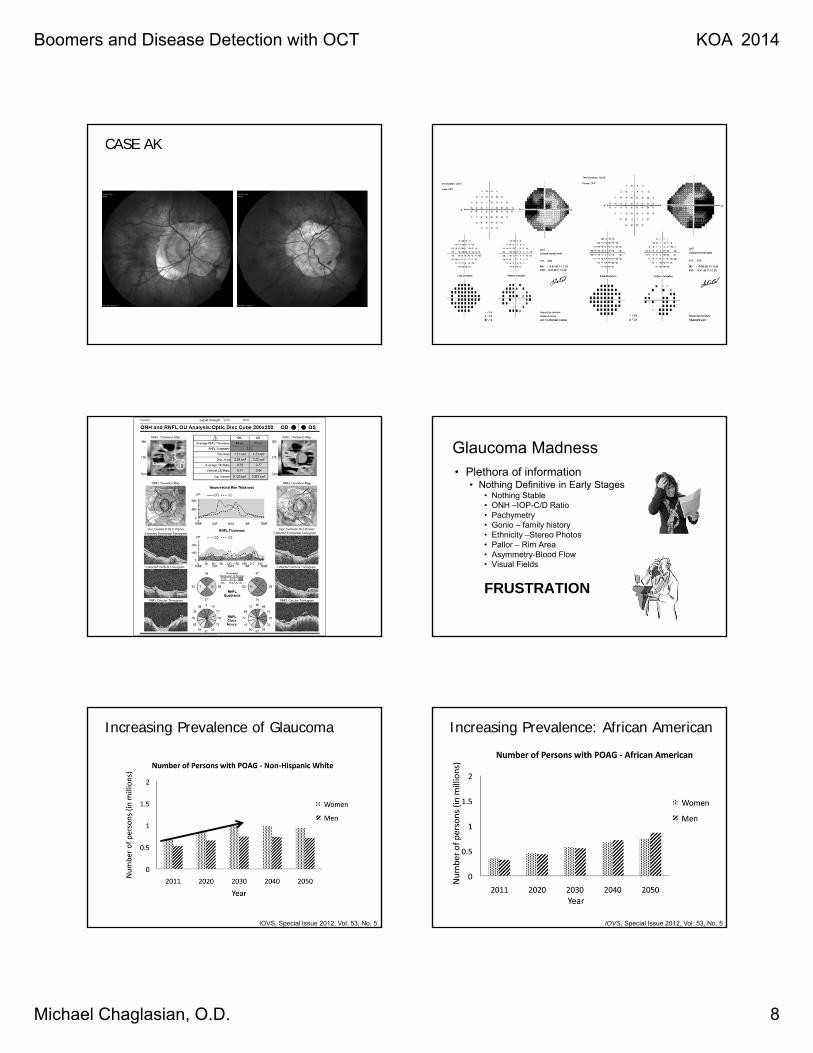
Increasing Prevalence of Glaucoma
IOVS, Special Issue 2012, Vol. 53, No. 5
Increasing Prevalence: African American
IOVS, Special Issue 2012, Vol. 53, No. 5
Boomers and Disease Detection with OCT KOA 2014
Michael Chaglasian, O.D. 9
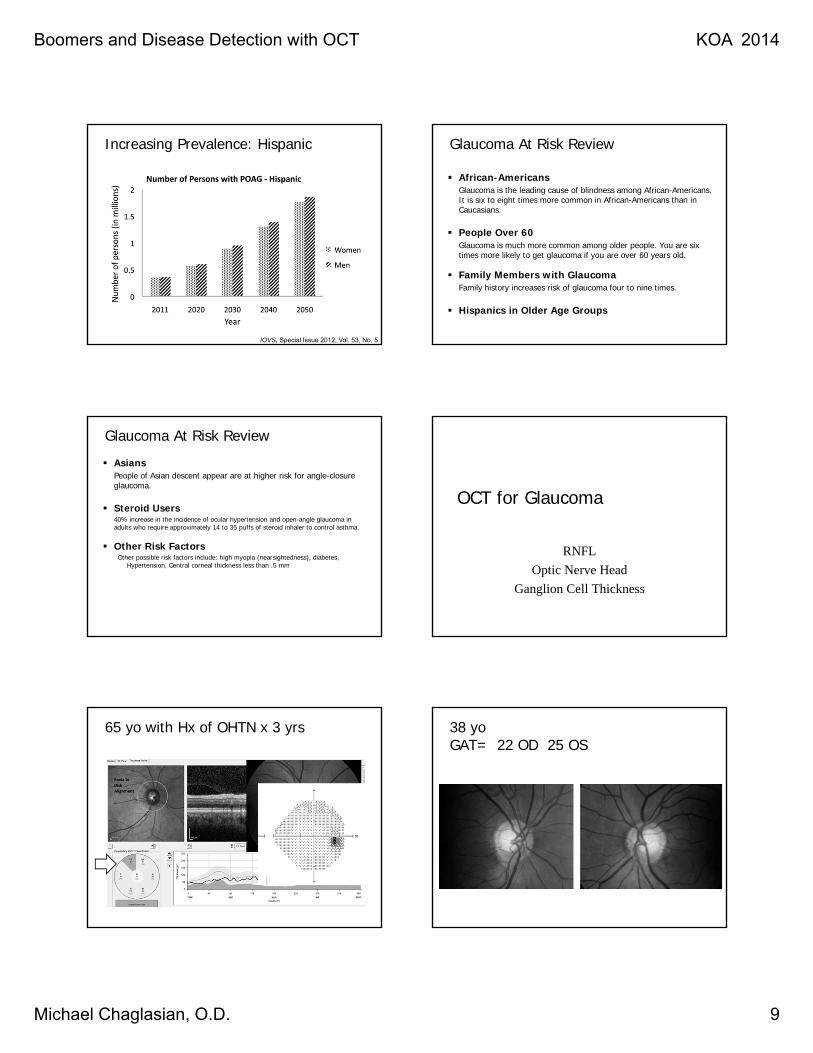
Increasing Prevalence: Hispanic
IOVS, Special Issue 2012, Vol. 53, No. 5
Glaucoma At Risk Review
African-AmericansGlaucoma is the leading cause of blindness among African-Americans. It is six to eight times more common in African-Americans than in Caucasians.
People Over 60Glaucoma is much more common among older people. You are six times more likely to get glaucoma if you are over 60 years old.
Family Members with GlaucomaFamily history increases risk of glaucoma four to nine times.
Hispanics in Older Age Groups
Glaucoma At Risk Review
AsiansPeople of Asian descent appear are at higher risk for angle-closure glaucoma.
Steroid Users40% increase in the incidence of ocular hypertension and open-angle glaucoma in adults who require approximately 14 to 35 puffs of steroid inhaler to control asthma.
Other Risk FactorsOther possible risk factors include: high myopia (nearsightedness), diabetes,
Hypertension, Central corneal thickness less than .5 mm
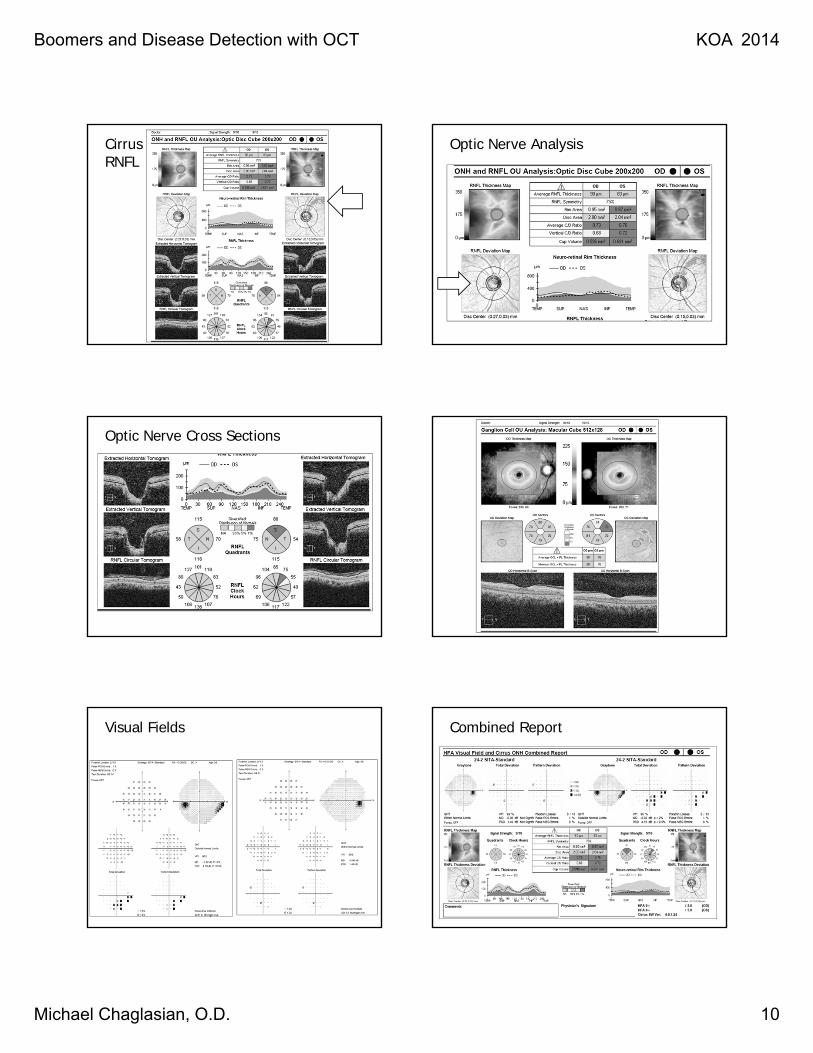
OCT for Glaucoma
RNFL
Optic Nerve Head
Ganglion Cell Thickness
65 yo with Hx of OHTN x 3 yrs 38 yoGAT= 22 OD 25 OS
Boomers and Disease Detection with OCT KOA 2014
Michael Chaglasian, O.D. 10
CirrusRNFL
Optic Nerve Analysis
Optic Nerve Cross Sections
Visual Fields Combined Report
Boomers and Disease Detection with OCT KOA 2014
Michael Chaglasian, O.D. 11
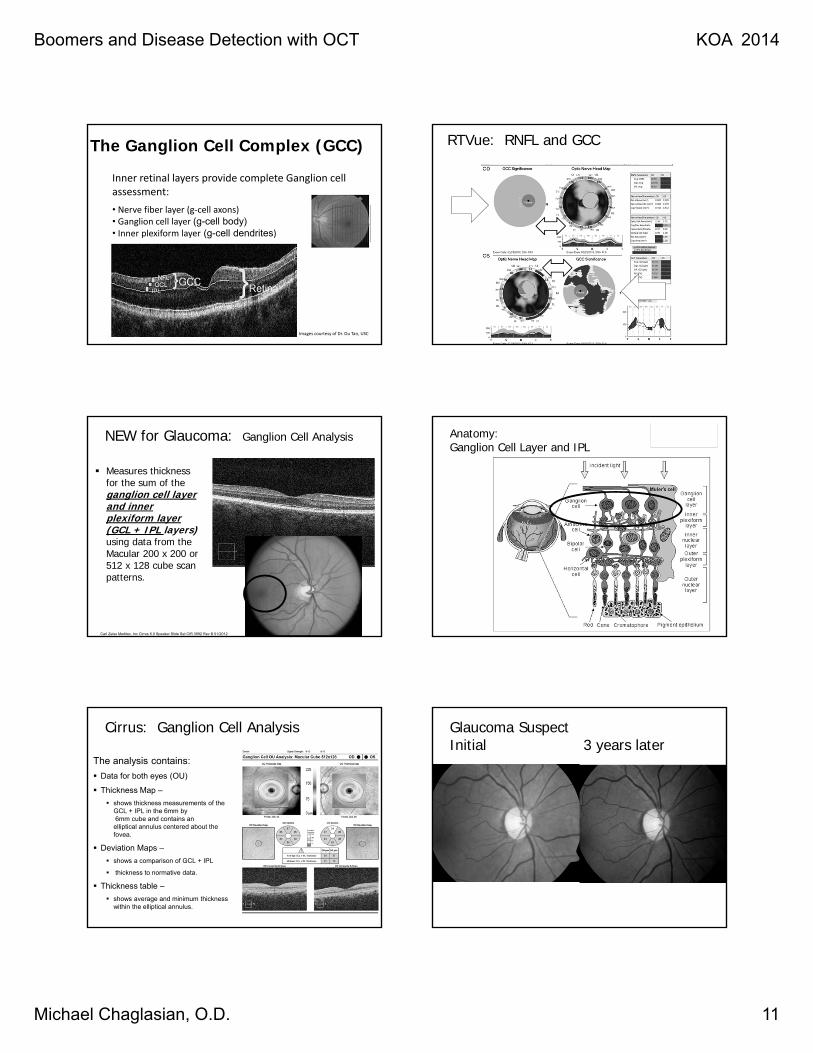
The Ganglion Cell Complex (GCC)
Inner retinal layers provide complete Ganglion cell assessment:
• Nerve fiber layer (g‐cell axons)• Ganglion cell layer (g-cell body)• Inner plexiform layer (g-cell dendrites)
Images courtesy of Dr. Ou Tan, USC
RTVue: RNFL and GCC
NEW for Glaucoma: Ganglion Cell Analysis
Measures thickness for the sum of the ganglion cell layer and inner plexiform layer (GCL + IPL layers) using data from the Macular 200 x 200 or 512 x 128 cube scan patterns.
Carl Zeiss Meditec, Inc Cirrus 6.0 Speaker Slide Set CIR.3992 Rev B 01/2012
Anatomy:Ganglion Cell Layer and IPL
Cirrus: Ganglion Cell Analysis
The analysis contains:
Data for both eyes (OU)
Thickness Map –
shows thickness measurements of the GCL + IPL in the 6mm by6mm cube and contains an
elliptical annulus centered about the fovea.
Deviation Maps –
shows a comparison of GCL + IPL
thickness to normative data.
Thickness table –
shows average and minimum thickness within the elliptical annulus.
Glaucoma SuspectInitial 3 years later
Boomers and Disease Detection with OCT KOA 2014
Michael Chaglasian, O.D. 12
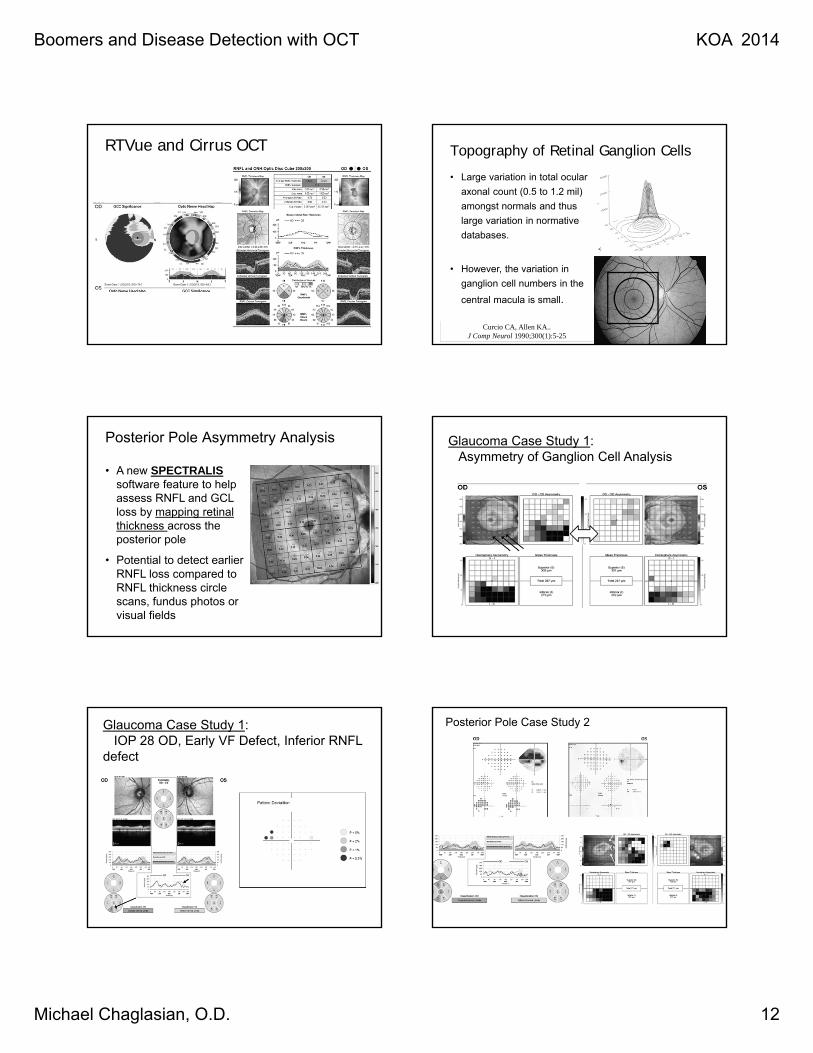
RTVue and Cirrus OCT Topography of Retinal Ganglion Cells
Curcio CA, Allen KA.. J Comp Neurol 1990;300(1):5-25
• Large variation in total ocular
axonal count (0.5 to 1.2 mil)
amongst normals and thus
large variation in normative
databases.
• However, the variation in
ganglion cell numbers in the
central macula is small.
Posterior Pole Asymmetry Analysis
• A new SPECTRALISsoftware feature to help assess RNFL and GCL loss by mapping retinal thickness across the posterior pole
• Potential to detect earlier RNFL loss compared to RNFL thickness circle scans, fundus photos or visual fields
Glaucoma Case Study 1: Asymmetry of Ganglion Cell Analysis
Glaucoma Case Study 1: IOP 28 OD, Early VF Defect, Inferior RNFL
defect
Posterior Pole Case Study 2
Boomers and Disease Detection with OCT KOA 2014
Michael Chaglasian, O.D. 13
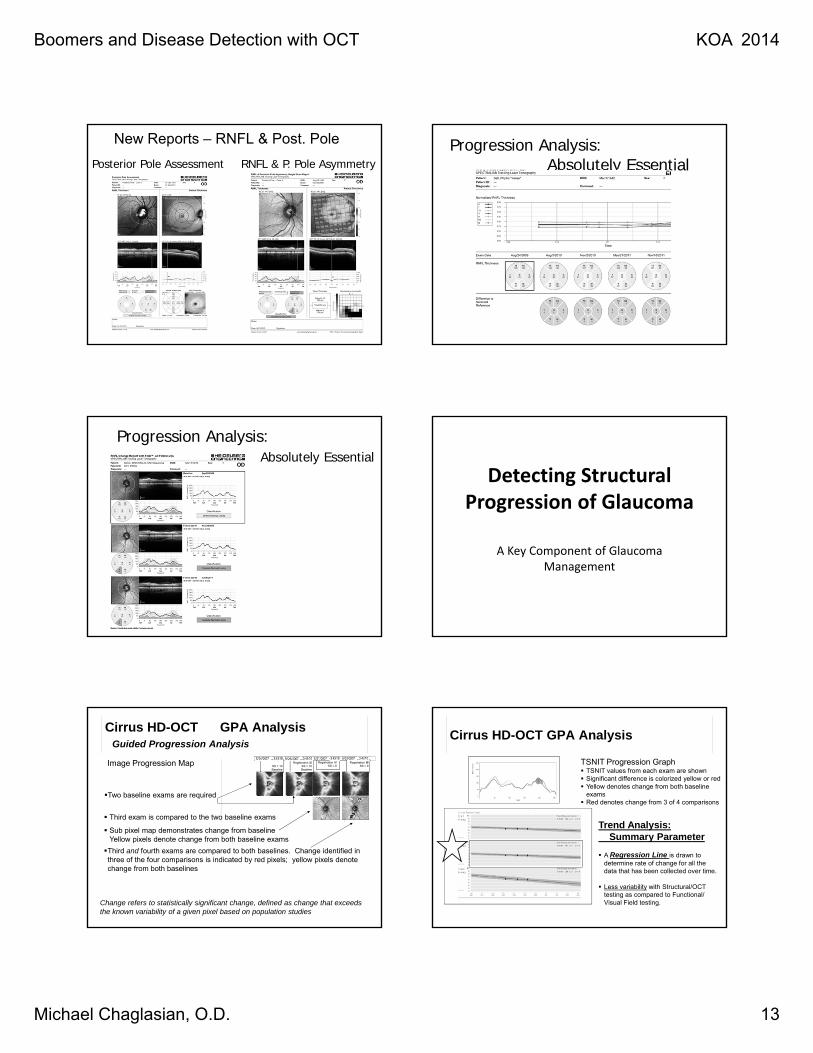
New Reports – RNFL & Post. Pole
Posterior Pole Assessment RNFL & P. Pole AsymmetryProgression Analysis:
Absolutely Essential
Progression Analysis: Absolutely Essential
Detecting Structural Progression of Glaucoma
A Key Component of Glaucoma Management
Cirrus HD-OCT GPA AnalysisGuided Progression Analysis
Two baseline exams are required
SS = 10Baseline Baseline
Registration SS = 10Baseline
Registration SS = 8
Third exam is compared to the two baseline exams
Sub pixel map demonstrates change from baseline Yellow pixels denote change from both baseline exams
Registration SS = 9
Third and fourth exams are compared to both baselines. Change identified in three of the four comparisons is indicated by red pixels; yellow pixels denote change from both baselines
Image Progression Map
Change refers to statistically significant change, defined as change that exceeds the known variability of a given pixel based on population studies
Cirrus HD-OCT GPA Analysis
Trend Analysis: Summary Parameter
A Regression Line is drawn to determine rate of change for all the data that has been collected over time.
Less variability with Structural/OCT testing as compared to Functional/ Visual Field testing.
TSNIT Progression Graph TSNIT values from each exam are shown Significant difference is colorized yellow or red Yellow denotes change from both baseline
exams Red denotes change from 3 of 4 comparisons
0
50
100
150
200
250
0 50 100 150 200 250
RN
FL
T (m
icro
ns)
TSNIT
Boomers and Disease Detection with OCT KOA 2014
Michael Chaglasian, O.D. 14
New Updates on Cirrus HD-OCT (Zeiss):Ganglion Cell Analysis
Ver 6.0
Updated Guided Progression Analysis (GPA™)Optic Nerve Head information now included
• Average Cup-to-Disc Ratio plotted on graph with rate of change information.
• RNFL/ONH Summary includes item “Average Cup-to-Disc Progression”.
• Printout includes an optional second page with table of values, including Rim Area, Disc Area, Average & Vertical Cup-to-Disc Ratio and Cup Volume. Each cell of the table can be color coded if change is detected.
Ver 6.0
Updated Guided Progression Analysis (GPA™)
81
Page 1 Page 2
Ver 6.0
Provide the best possible glaucoma care to your patients
1The Eye Diseases Prevalence Research Group. Causes and prevalence of visual impairment among adults in the United States. Arch Ophthalmol. 2004;122(4):477-485.
2Classe JG. Glaucoma--a clinicolegal review. J Am Optom Assoc. 1997; 68:389-394.
•Find more glaucoma suspects
•Diagnose glaucoma earlier
Glaucoma is a leading cause of blindness in the US
Over a million people in this country have glaucoma but don’t know it.1
Failure to diagnose open-angle glaucoma is a leading cause of liability claims involving eye care practitioners.2
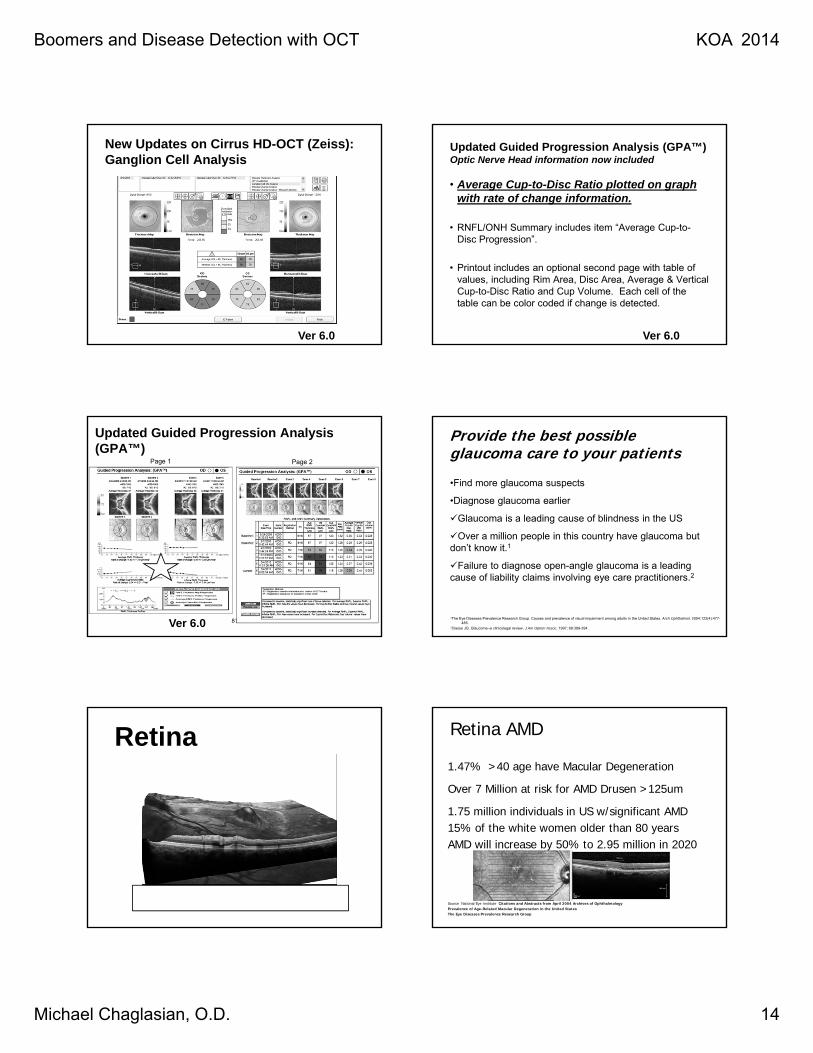
Retina Retina AMD
1.47% >40 age have Macular Degeneration
Over 7 Million at risk for AMD Drusen >125um
1.75 million individuals in US w/significant AMD15% of the white women older than 80 yearsAMD will increase by 50% to 2.95 million in 2020
Source National Eye Institute Citations and Abstracts from April 2004 Archives of OphthalmologyPrevalence of Age-Related Macular Degeneration in the United States The Eye Diseases Prevalence Research Group
Boomers and Disease Detection with OCT KOA 2014
Michael Chaglasian, O.D. 15
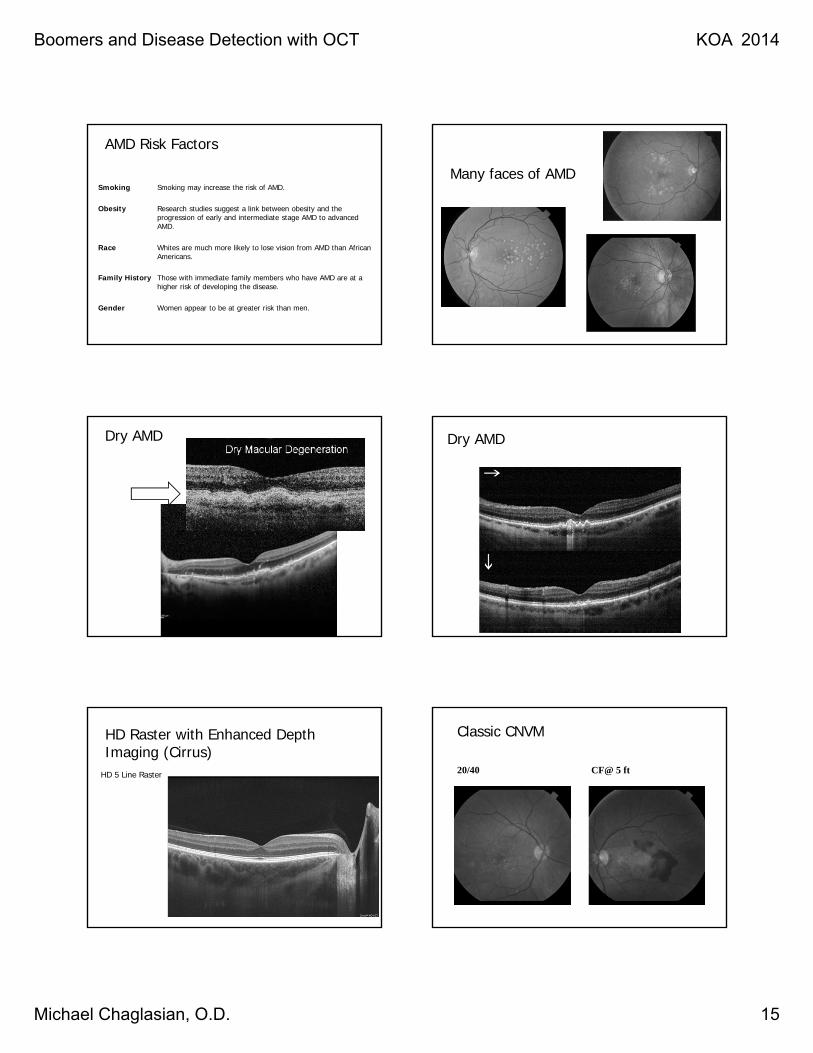
AMD Risk Factors
Smoking Smoking may increase the risk of AMD.
Obesity Research studies suggest a link between obesity and the progression of early and intermediate stage AMD to advanced AMD.
Race Whites are much more likely to lose vision from AMD than African Americans.
Family History Those with immediate family members who have AMD are at a higher risk of developing the disease.
Gender Women appear to be at greater risk than men.
Many faces of AMD
Dry AMD Dry AMD
HD Raster with Enhanced Depth Imaging (Cirrus)
HD 5 Line Raster
Classic CNVM
20/40 CF@ 5 ft
Boomers and Disease Detection with OCT KOA 2014
Michael Chaglasian, O.D. 16
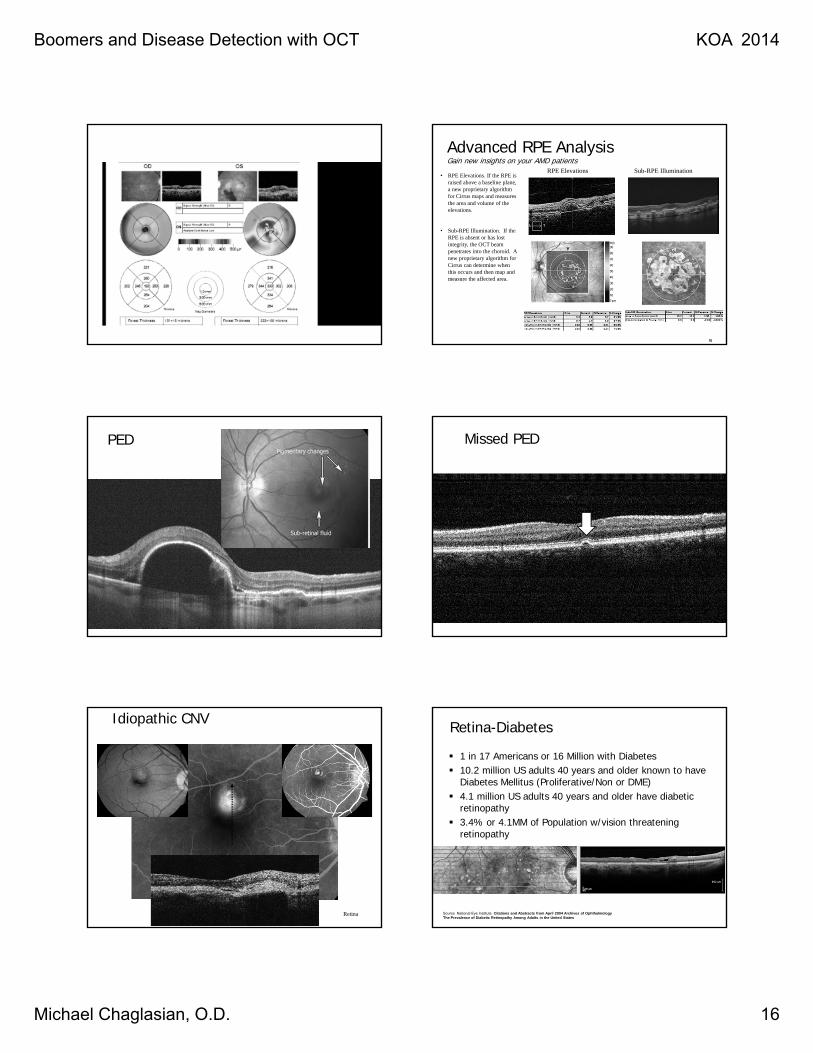
Advanced RPE AnalysisGain new insights on your AMD patients
• RPE Elevations. If the RPE is raised above a baseline plane, a new proprietary algorithm for Cirrus maps and measures the area and volume of the elevations.
• Sub-RPE Illumination. If the RPE is absent or has lost integrity, the OCT beam penetrates into the choroid. A new proprietary algorithm for Cirrus can determine when this occurs and then map and measure the affected area.
RPE Elevations Sub-RPE Illumination
92
PED Missed PED
Idiopathic CNV
Retina
Retina-Diabetes
1 in 17 Americans or 16 Million with Diabetes 10.2 million US adults 40 years and older known to have
Diabetes Mellitus (Proliferative/Non or DME) 4.1 million US adults 40 years and older have diabetic
retinopathy 3.4% or 4.1MM of Population w/vision threatening
retinopathy
Source National Eye Institute Citations and Abstracts from April 2004 Archives of OphthalmologyThe Prevalence of Diabetic Retinopathy Among Adults in the United States
Boomers and Disease Detection with OCT KOA 2014
Michael Chaglasian, O.D. 17
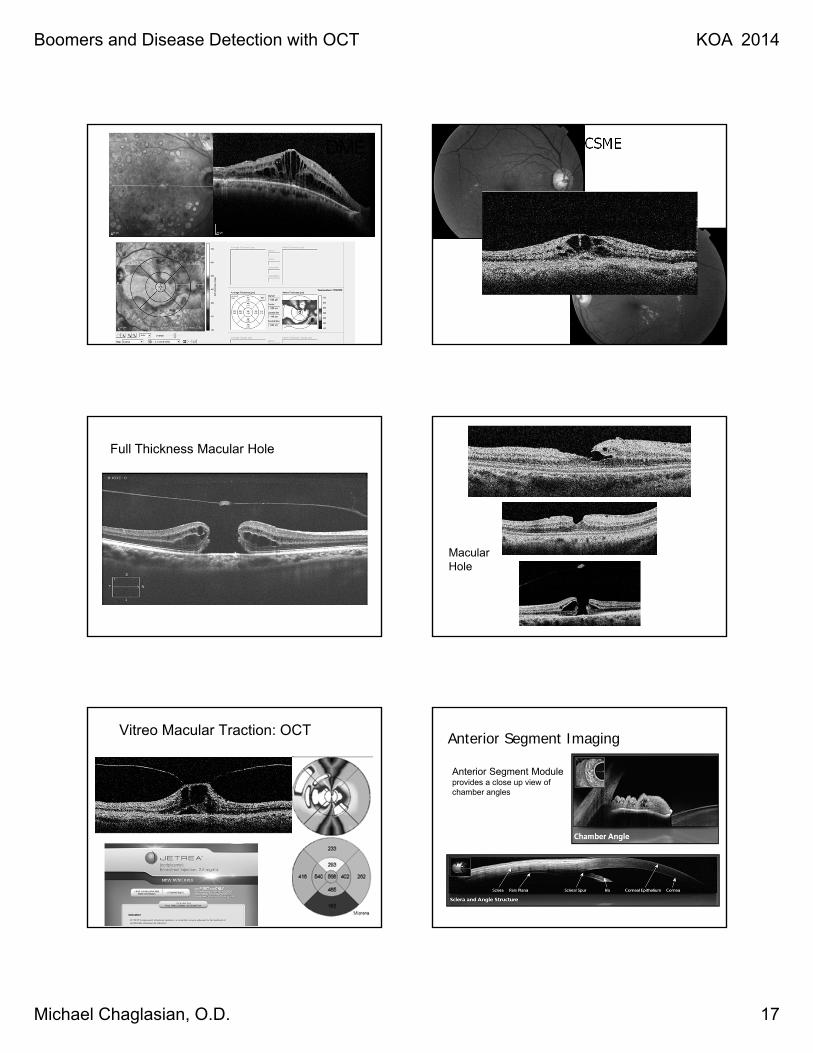
DME CSME
Full Thickness Macular Hole
Macular Hole
Vitreo Macular Traction: OCT
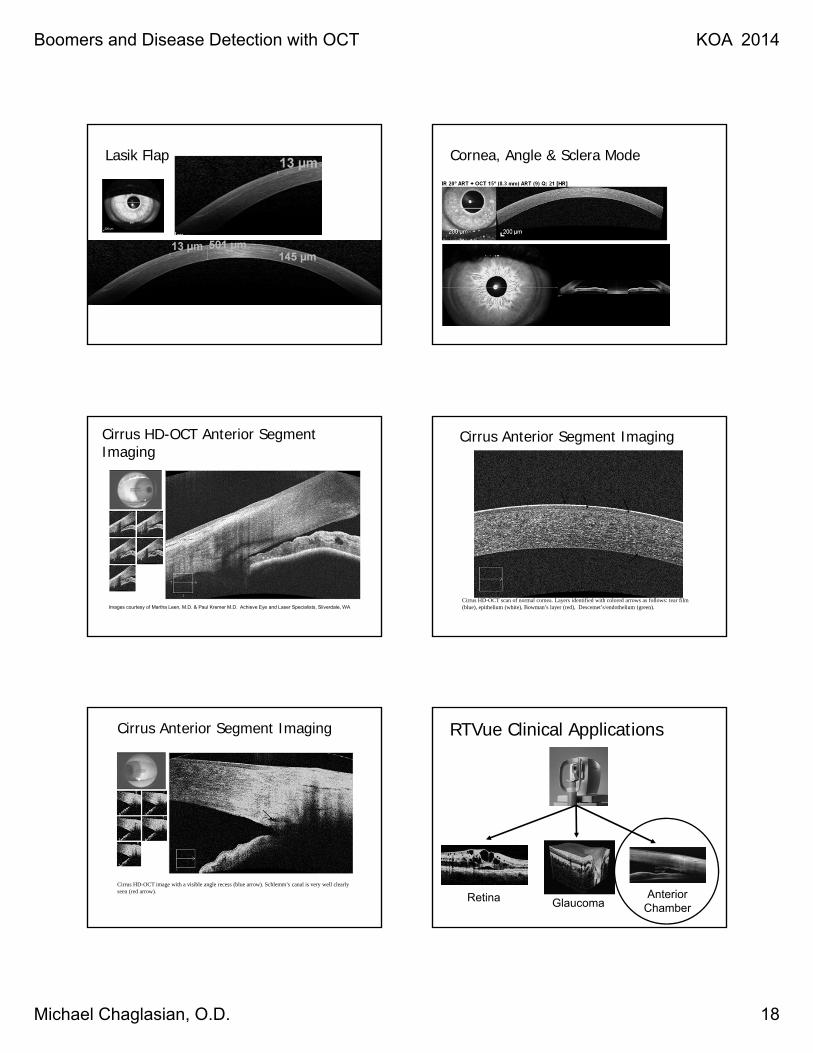
Anterior Segment Moduleprovides a close up view of chamber angles
Anterior Segment Imaging
Boomers and Disease Detection with OCT KOA 2014
Michael Chaglasian, O.D. 18
Lasik Flap Cornea, Angle & Sclera Mode
Cirrus HD-OCT Anterior Segment Imaging
Images courtesy of Martha Leen, M.D. & Paul Kremer M.D. Achieve Eye and Laser Specialists, Silverdale, WA
Cirrus Anterior Segment Imaging
Cirrus HD-OCT scan of normal cornea. Layers identified with colored arrows as follows: tear film (blue), epithelium (white), Bowman’s layer (red), Descemet’s/endothelium (green).
Cirrus Anterior Segment Imaging
Cirrus HD-OCT image with a visible angle recess (blue arrow). Schlemm’s canal is very well clearly seen (red arrow).
RTVue Clinical Applications
GlaucomaRetina Anterior Chamber
Boomers and Disease Detection with OCT KOA 2014
Michael Chaglasian, O.D. 19
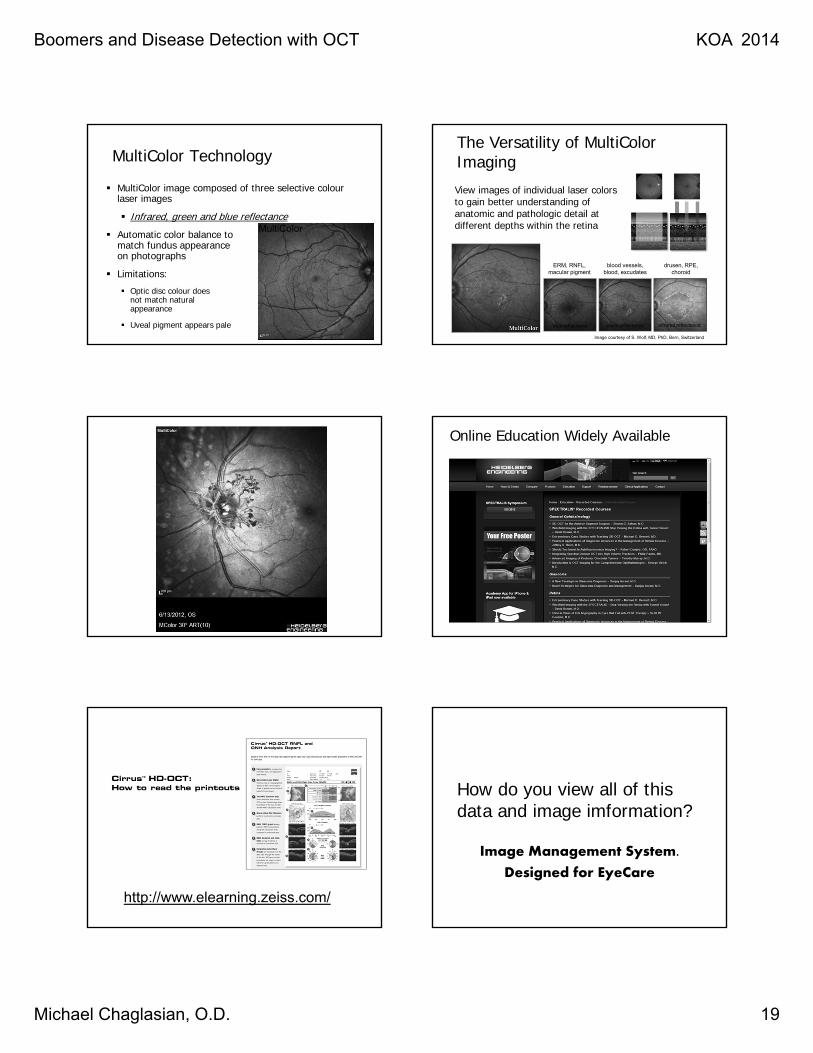
MultiColor Technology
MultiColor image composed of three selective colourlaser images
Infrared, green and blue reflectance
Automatic color balance to match fundus appearanceon photographs
Limitations:
Optic disc colour doesnot match natural appearance
Uveal pigment appears pale
MultiColor
The Versatility of MultiColor Imaging
View images of individual laser colors to gain better understanding of anatomic and pathologic detail at different depths within the retina
ERM, RNFL, macular pigment
blue reflectance
blood vessels, blood, excudates
green reflectance
drusen, RPE, choroid
infrared reflectance
Image courtesy of S. Wolf, MD, PhD, Bern, Switzerland
Online Education Widely Available
http://www.elearning.zeiss.com/
How do you view all of this data and image imformation?
Image Management System.
Designed for EyeCare
Boomers and Disease Detection with OCT KOA 2014
Michael Chaglasian, O.D. 20
“Why would I need more than an Electronic Health Record (EHR) system for my ophthalmic practice?
IMS
A Few Definitions
Acronym Term
DICOM Digital Imaging and Communications in Medicine
EHR Electronic Health Record
EMR Electronic Medical Record
IMS Image Management System
PACS Picture Archiving and Communication System
HIS Health Information System
PMS Practice Management System
117117
The IT Landscape in an Ophthalmic Practice IT integration is key
IMS
EHR / EMR
Medical charts. Documentation of clinical decisions, treatments and prescriptions
PMS or HIS
Manages the practice business (administration, scheduling, accounting, billing)
Manages and archives diagnostic reports and images.Viewing, comparing and reviewing ophthalmic data
Medical data standard protocols
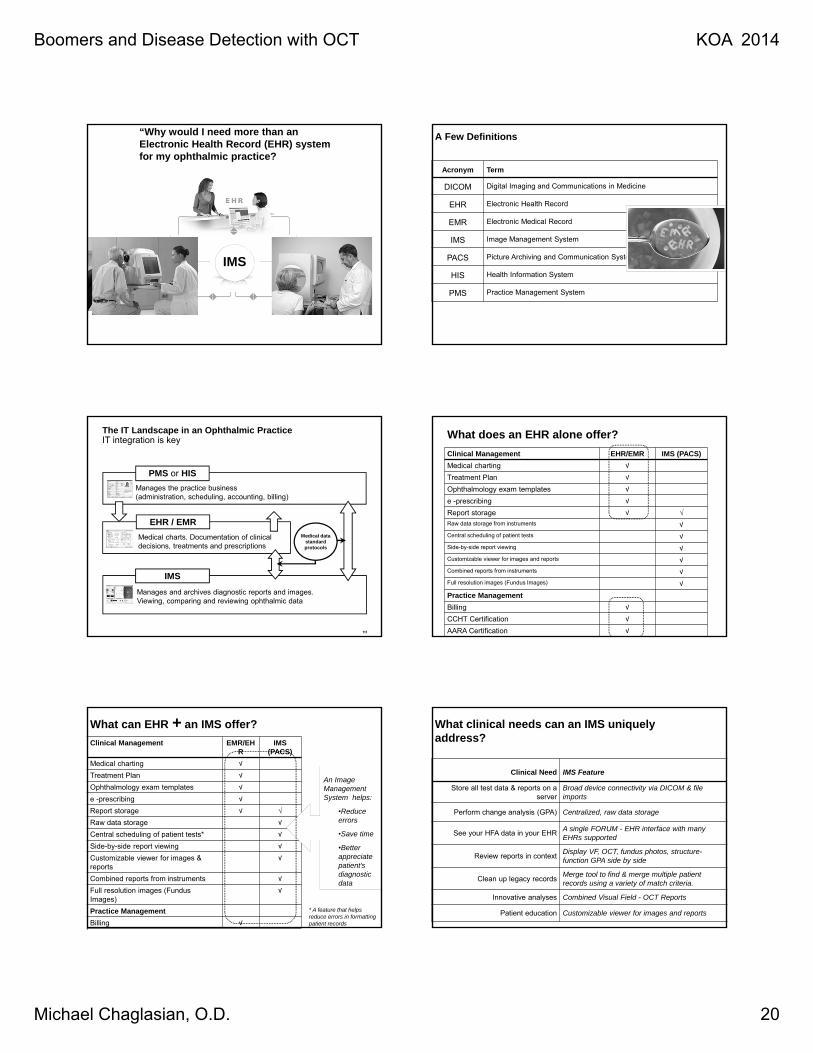
What does an EHR alone offer?
Clinical Management EHR/EMR IMS (PACS)
Medical charting √
Treatment Plan √
Ophthalmology exam templates √
e -prescribing √
Report storage √ √Raw data storage from instruments √
Central scheduling of patient tests √
Side-by-side report viewing √
Customizable viewer for images and reports √
Combined reports from instruments √
Full resolution images (Fundus Images) √
Practice Management
Billing √
CCHT Certification √
AARA Certification √
Clinical Management EMR/EHR
IMS (PACS)
Medical charting √
Treatment Plan √
Ophthalmology exam templates √
e -prescribing √
Report storage √ √
Raw data storage √
Central scheduling of patient tests* √
Side-by-side report viewing √
Customizable viewer for images & reports
√
Combined reports from instruments √
Full resolution images (FundusImages)
√
Practice Management
Billing √
* A feature that helps reduce errors in formatting patient records
What can EHR + an IMS offer?
An Image Management System helps:
•Reduce errors
•Save time
•Better appreciate patient’s diagnostic data
Clinical Need IMS Feature
Store all test data & reports on a server
Broad device connectivity via DICOM & file imports
Perform change analysis (GPA) Centralized, raw data storage
See your HFA data in your EHRA single FORUM - EHR interface with manyEHRs supported
Review reports in contextDisplay VF, OCT, fundus photos, structure-function GPA side by side
Clean up legacy recordsMerge tool to find & merge multiple patient records using a variety of match criteria.
Innovative analyses Combined Visual Field - OCT Reports
Patient education Customizable viewer for images and reports
What clinical needs can an IMS uniquely address?
Boomers and Disease Detection with OCT KOA 2014
Michael Chaglasian, O.D. 21
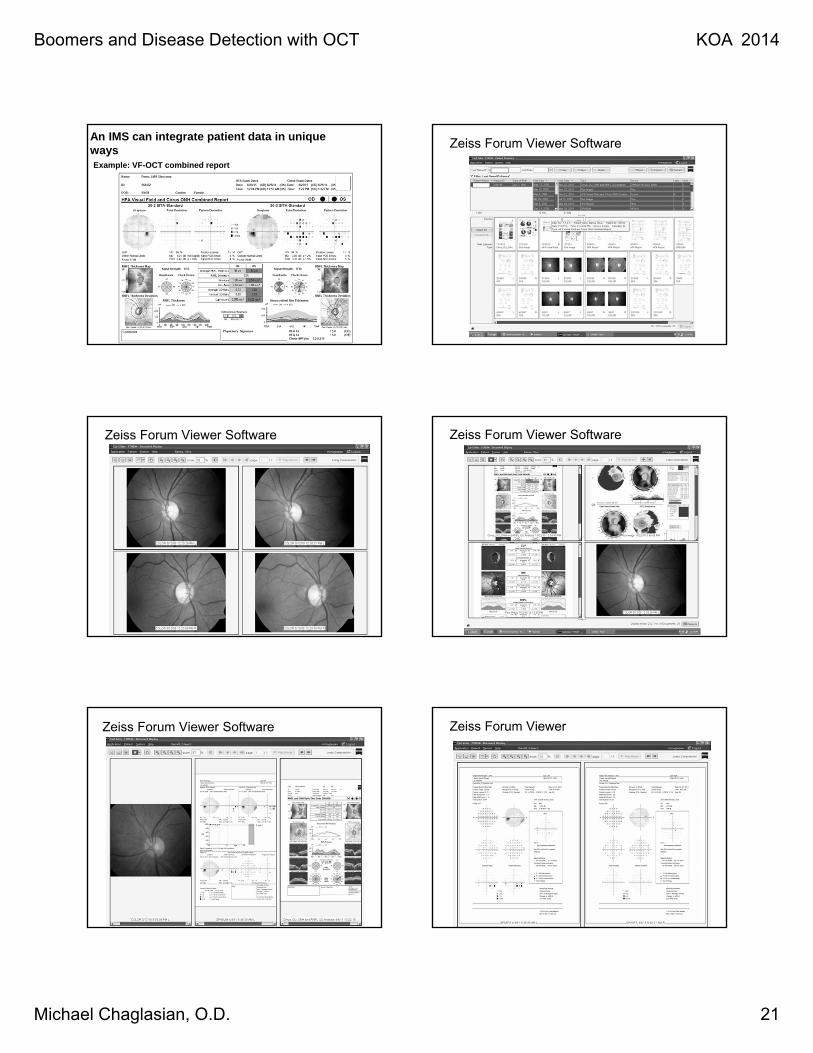
An IMS can integrate patient data in unique waysExample: VF-OCT combined report
Zeiss Forum Viewer Software
Zeiss Forum Viewer Software Zeiss Forum Viewer Software
Zeiss Forum Viewer Software Zeiss Forum Viewer
Boomers and Disease Detection with OCT KOA 2014
Michael Chaglasian, O.D. 22
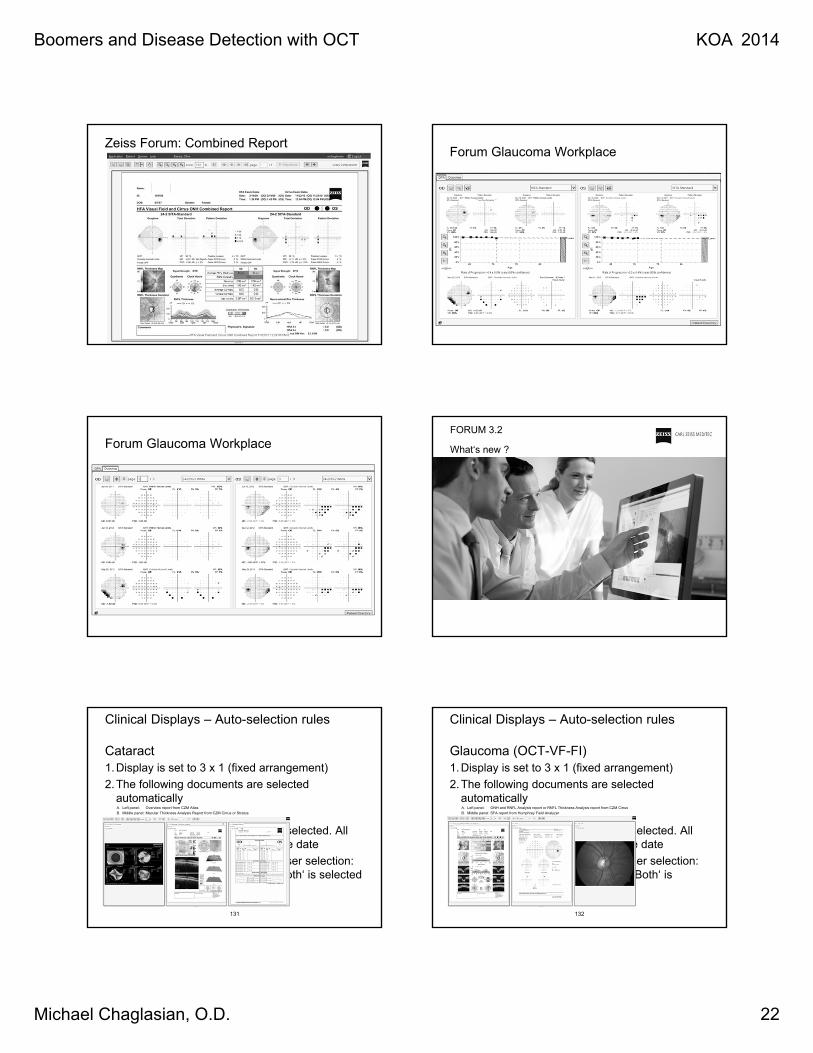
Zeiss Forum: Combined ReportForum Glaucoma Workplace
Forum Glaucoma WorkplaceFORUM 3.2
What‘s new ?
131
Clinical Displays – Auto-selection rules
Cataract 1.Display is set to 3 x 1 (fixed arrangement)
2.The following documents are selected automaticallyA. Left panel: Overview report from CZM Atlas
B. Middle panel: Macular Thickness Analysis Report from CZM Cirrus or Stratus
C. Right panel: IOLMaster report
3.The most recent visit date will be selected. All documents must be from the same date
4.Laterality (R/L) according to the user selection: IOLMaster report with laterality ‘Both‘ is selected in both cases (R/L)
132
Clinical Displays – Auto-selection rules
Glaucoma (OCT-VF-FI)1.Display is set to 3 x 1 (fixed arrangement)
2.The following documents are selected automaticallyA. Left panel: ONH and RNFL Analysis report or RNFL Thickness Analysis report from CZM Cirrus
B. Middle panel: SFA report from Humphrey Field Analyzer
C. Right panel: COLOR Fundus Image
3.The most recent visit date will be selected. All documents must be from the same date
4.Laterality (R/L) according to the user selection: ONH / RNFL report with laterality ‘Both‘ is selected in both cases (R/L)
Boomers and Disease Detection with OCT KOA 2014
Michael Chaglasian, O.D. 23
133
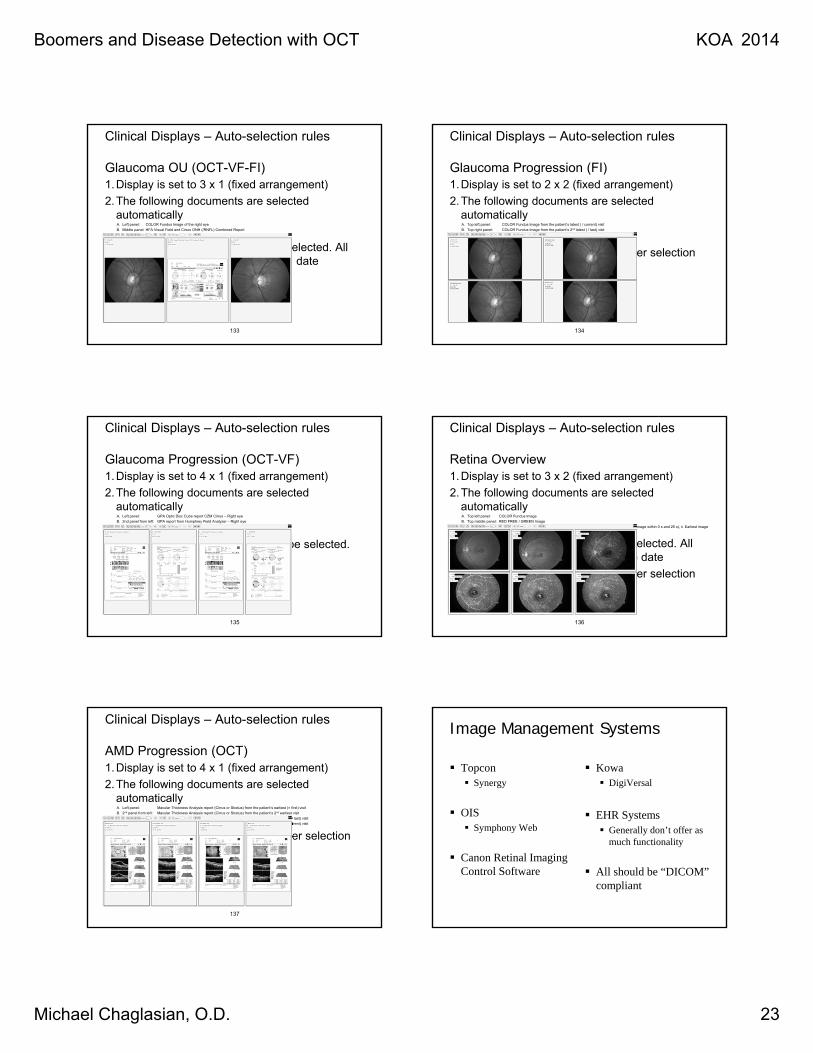
Clinical Displays – Auto-selection rules
Glaucoma OU (OCT-VF-FI)1.Display is set to 3 x 1 (fixed arrangement)
2.The following documents are selected automaticallyA. Left panel: COLOR Fundus Image of the right eye
B. Middle panel: HFA Visual Field and Cirrus ONH (/RNFL) Combined Report
C. Right panel: COLOR Fundus Image of the left eye
3.The most recent visit date will be selected. All documents must be from the same date
134
Clinical Displays – Auto-selection rules
Glaucoma Progression (FI)1.Display is set to 2 x 2 (fixed arrangement)
2.The following documents are selected automaticallyA. Top left panel: COLOR Fundus Image from the patient’s latest ( / current) visit
B. Top right panel: COLOR Fundus Image from the patient’s 2nd latest ( / last) visit
C. Bottom left panel: COLOR Fundus Image from the patient’s 2nd earliest visit
D. Bottom right panel: COLOR Fundus Image from the patient’s earliest ( = first) visit
3. Laterality (R/L) according to the user selection
135
Clinical Displays – Auto-selection rules
Glaucoma Progression (OCT-VF)1.Display is set to 4 x 1 (fixed arrangement)
2.The following documents are selected automaticallyA. Left panel: GPA Optic Disc Cube report CZM Cirrus – Right eye
B. 2nd panel from left: GPA report from Humphrey Field Analyzer – Right eye
C. 3rd panel from left: GPA Optic Disc Cube report CZM Cirrus – Left eye
D. Right panel: GPA report from Humphrey Field Analyzer – Left eye
3.The most recent GPA reports will be selected.
136
Clinical Displays – Auto-selection rules
Retina Overview1.Display is set to 3 x 2 (fixed arrangement)
2.The following documents are selected automaticallyA. Top left panel: COLOR Fundus Image
B. Top middle panel: RED FREE / GREEN Image
C. Top right panel and bottom panels (left to right): 4 phases of a FA or ICG series: i. Early phase (earliest image within 0 s and 25 s), ii. Earliest image within 25 s and 1 min, iii. Earliest image within 1 min and 2 min, iv. First image after 2 min
3.The most recent visit date will be selected. All documents must be from the same date
4.Laterality (R/L) according to the user selection
137
Clinical Displays – Auto-selection rules
AMD Progression (OCT)1.Display is set to 4 x 1 (fixed arrangement)
2.The following documents are selected automaticallyA. Left panel: Macular Thickness Analysis report (Cirrus or Stratus) from the patient’s earliest (= first) visit
B. 2nd panel from left: Macular Thickness Analysis report (Cirrus or Stratus) from the patient’s 2nd earliest visit
C. 3rd panel from left: Macular Thickness Analysis report (Cirrus or Stratus) from the patient’s 2nd latest ( / last) visit
D. Right panel: Macular Thickness Analysis report (Cirrus or Stratus) from the patient’s latest ( / current) visit
3. Laterality (R/L) according to the user selection
Image Management Systems
Topcon Synergy
OIS Symphony Web
Canon Retinal Imaging Control Software
Kowa DigiVersal
EHR Systems Generally don’t offer as
much functionality
All should be “DICOM” compliant
Boomers and Disease Detection with OCT KOA 2014
Michael Chaglasian, O.D. 24
Retain the glaucoma/retina patients that you identify
Increase patient retention rates by:• Diagnosing patients early
• Educating them on glaucoma and retina pathology
• Managing them with state-of-the art technology
YOU WILL MAXIMIZE YOUR RETURN ON INVESTMENT WHLE PROVIDING BETTER PATIENT CARE
OCT in Optometric Practice: