Embed Size (px)
Citation preview

1
Boomerang
Strategy
We look for short term strength or weakness
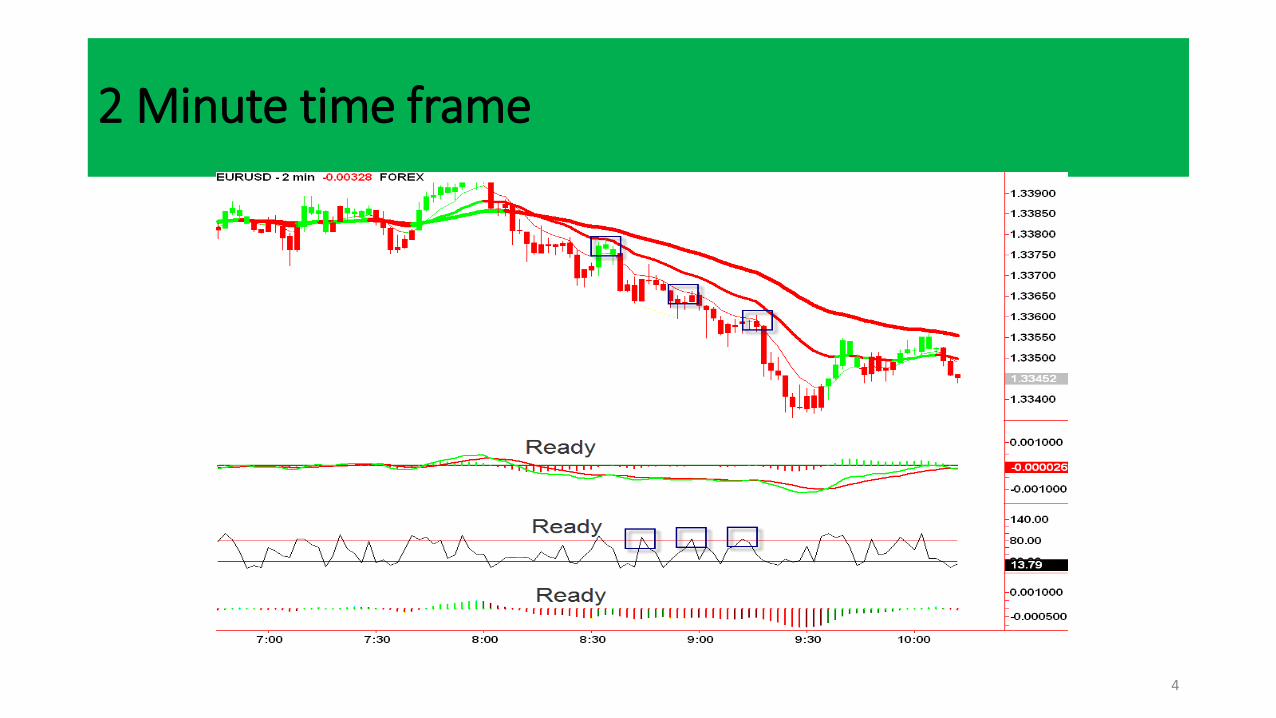
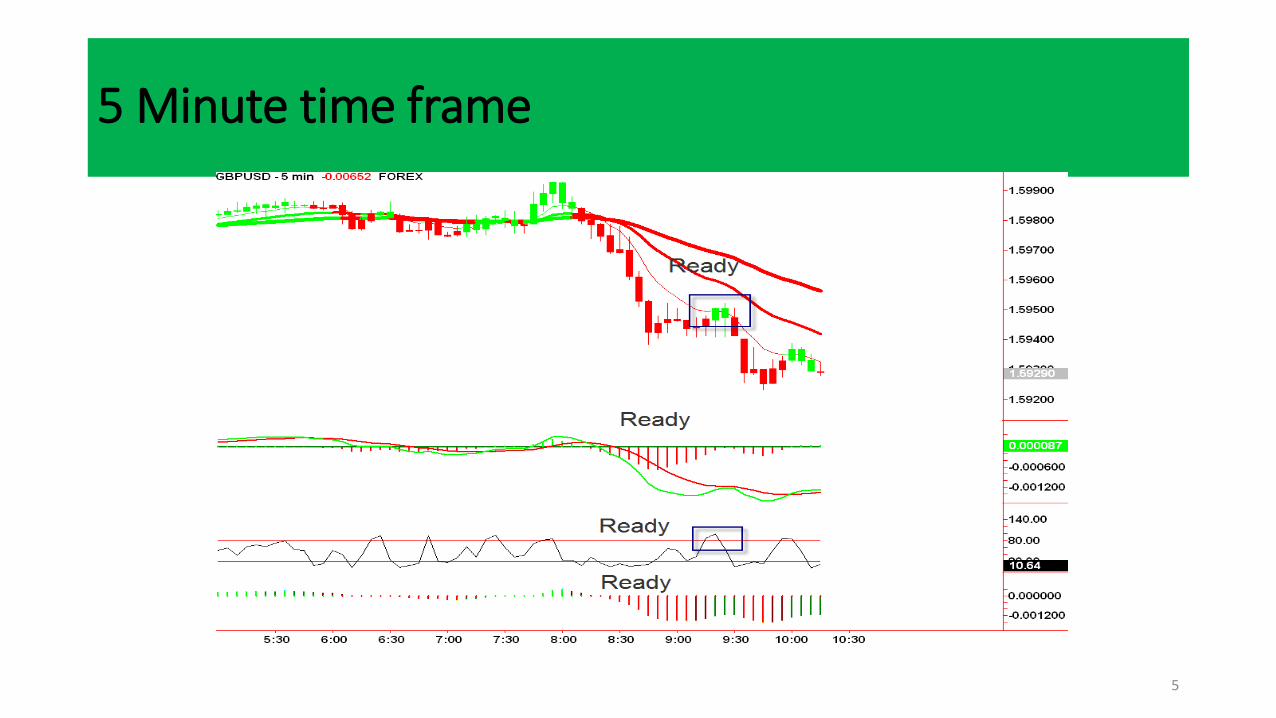
240, 60, 15, 5, 2 minute time frames
A ‘touch’ on the moving averages
Pro-MACD down for shorts, up for longs
Storyteller down for shorts, up for longs
High or low Pro-OBS
Use Fibonacci Symmetry for entry
2
Indicators
MACD – Lines above zero line = Long, Lines below zero look for shorts
Storyteller – Look for histogram count. Shows loss of momentum
The 20EMA can be resistance so trade on the right side of it
3
4
2 Minute time frame
5
5 Minute time frame
6
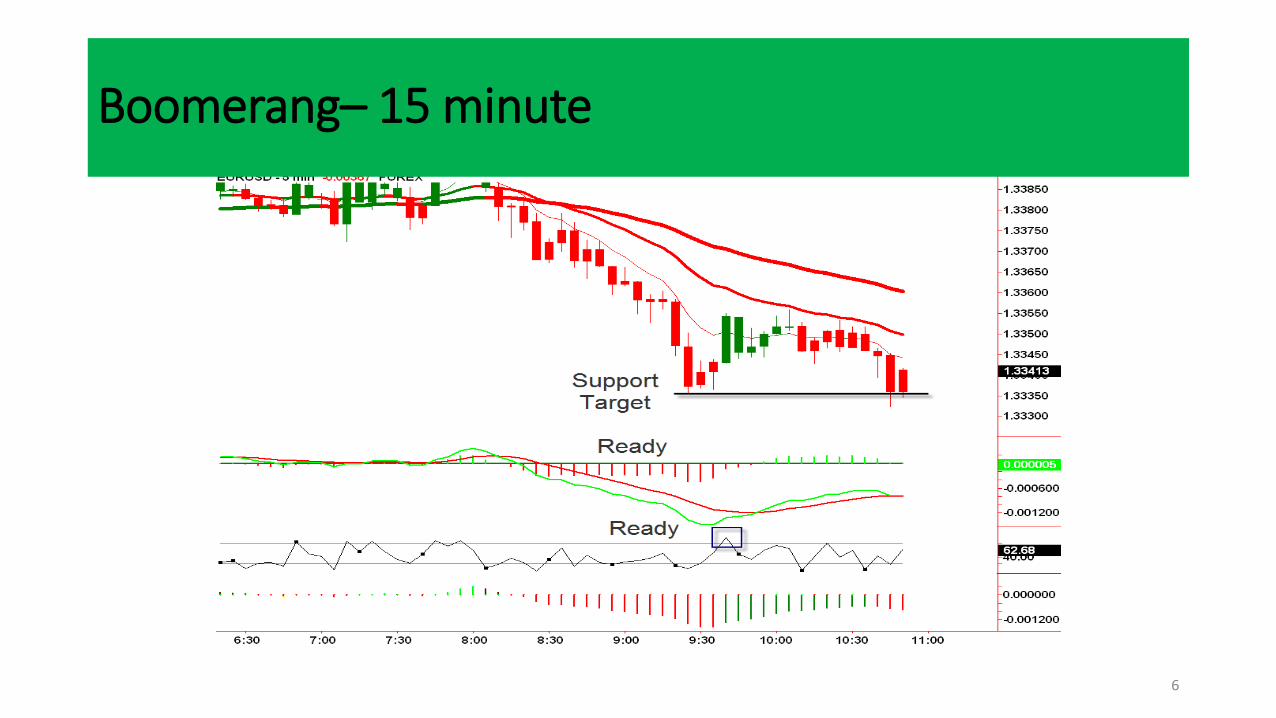
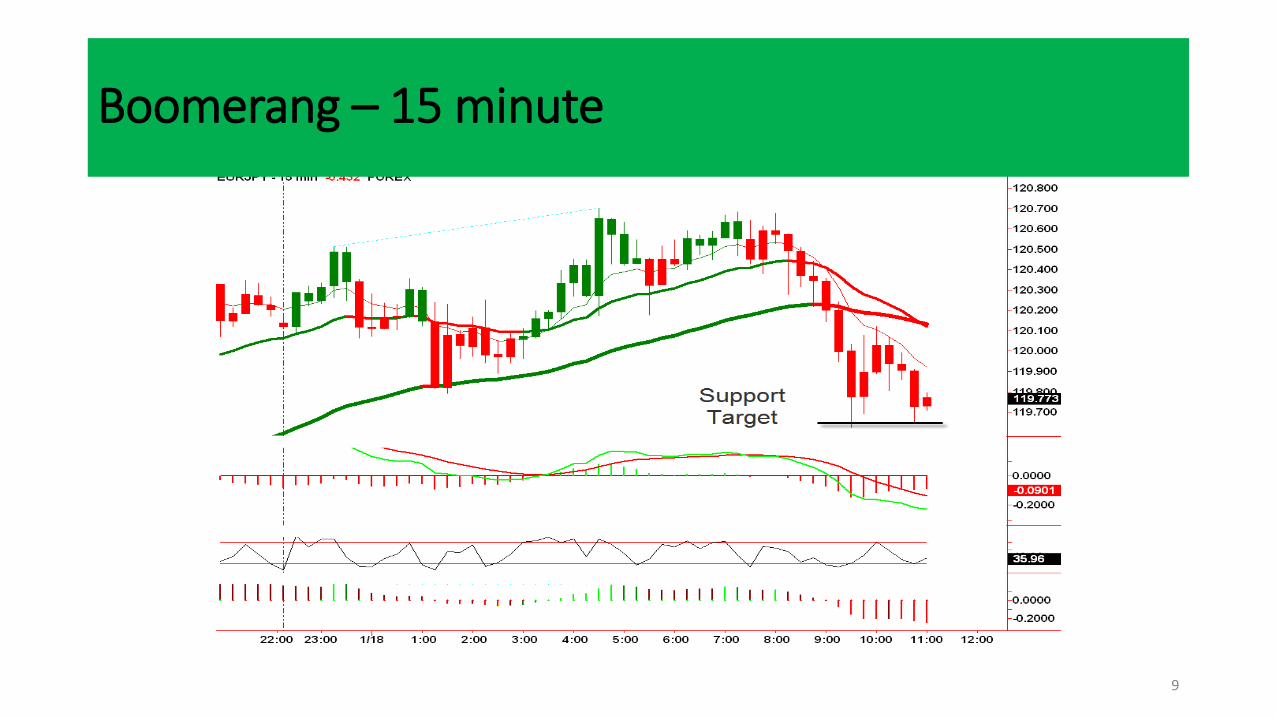
Boomerang– 15 minute
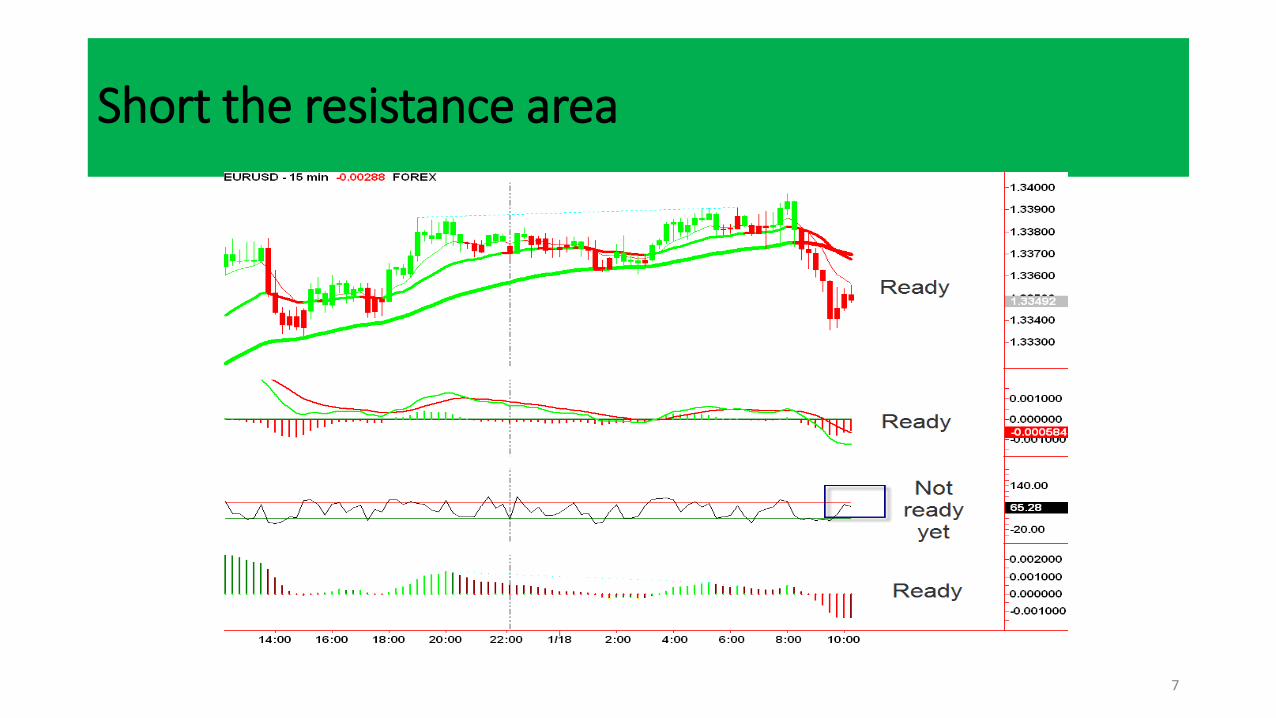
Short the resistance area
7
8
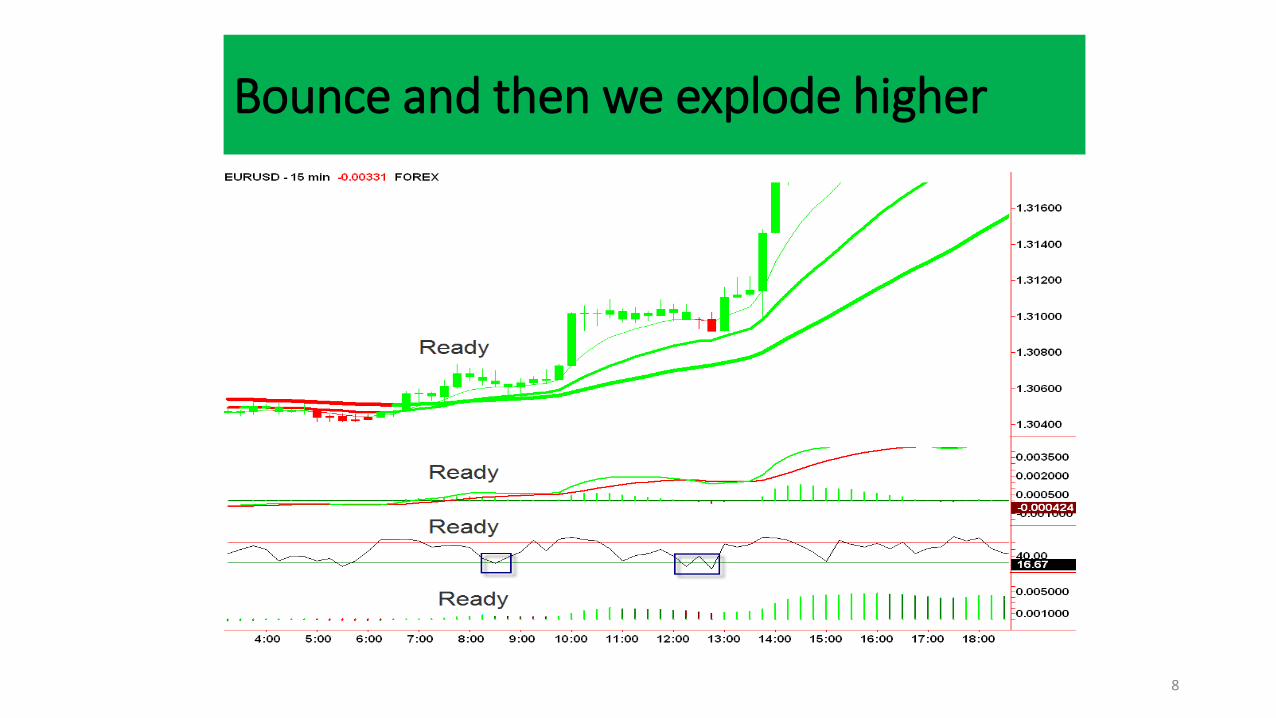
Bounce and then we explode higher
9
Boomerang – 15 minute

10
Boomerang – 15 minute
11
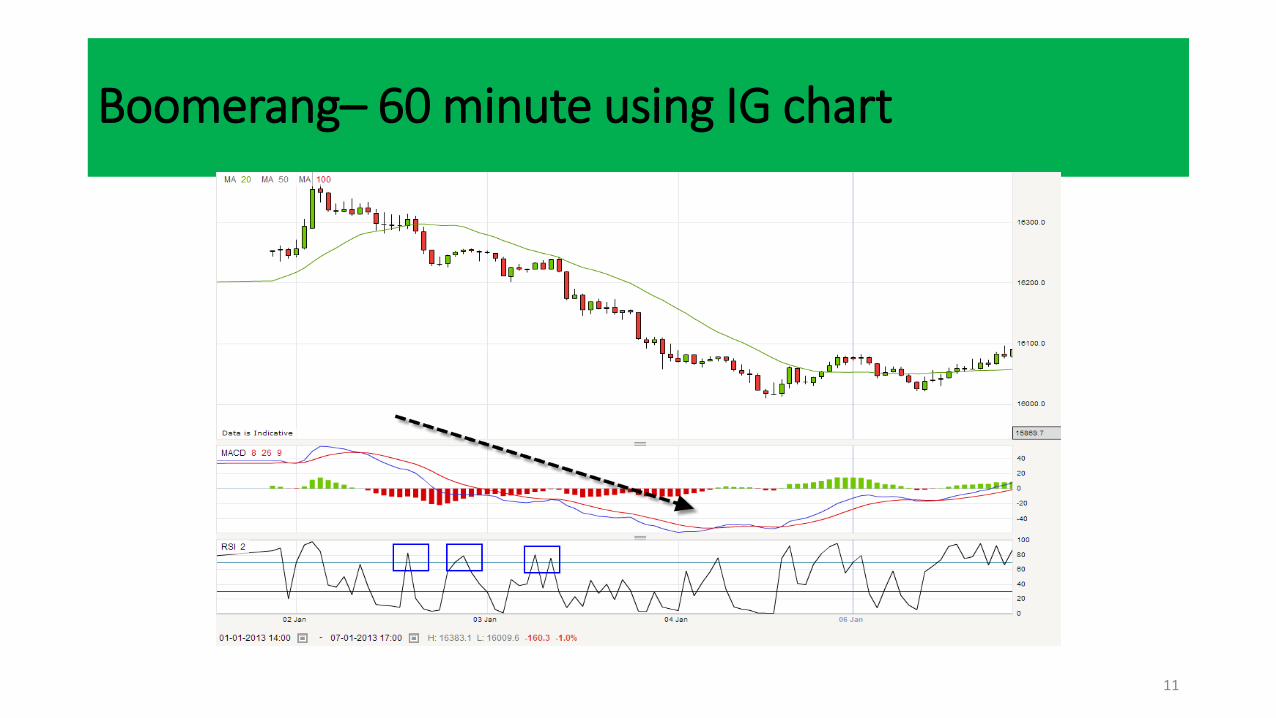
Boomerang– 60 minute using IG chart
12
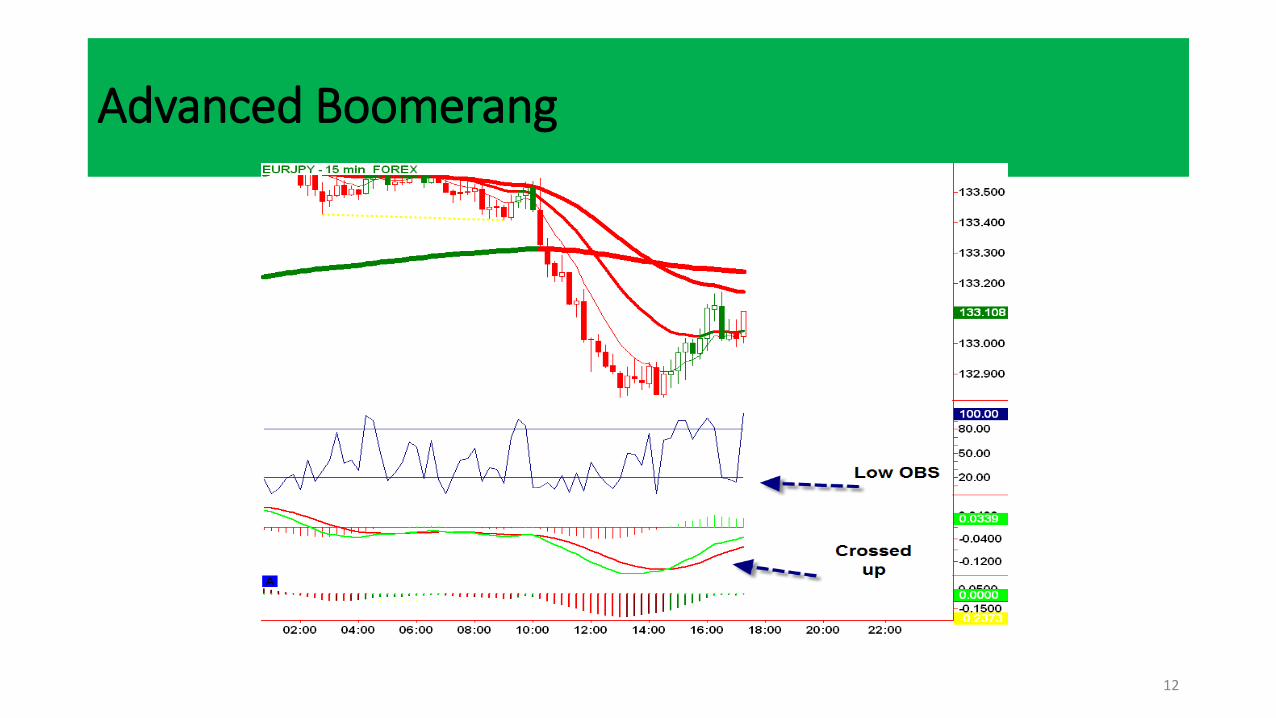
Advanced Boomerang
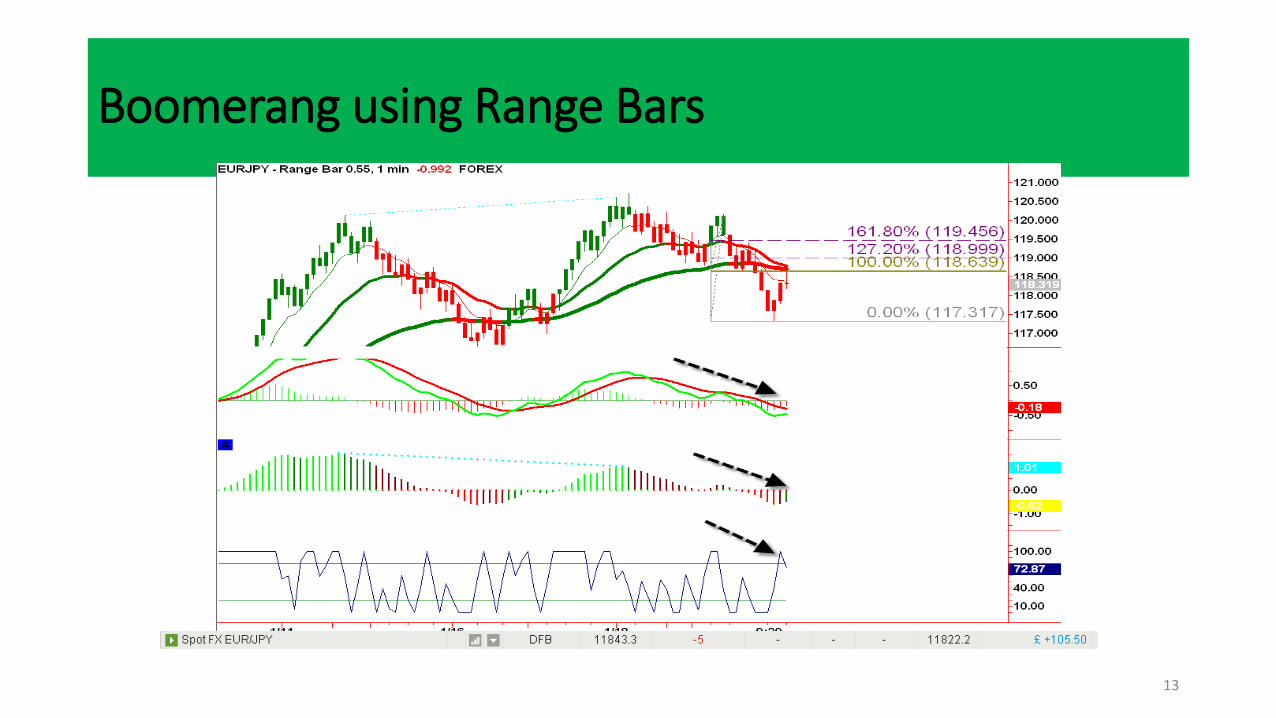
13
Boomerang using Range Bars
14
Fibonacci
Use Fibonacci Symmetry for entry price and resistance
15
Process
Pro-MACD weakness
Oscillator over bought or over sold
Use Fibonacci Symmetry for entry price
Small size accounts - wait for a move into the 20EMA
Targets at the U or n
THE SAME
I use this tool to give me an indication of an entry price
We use the
100% (entry)
1.272%
161.8% (stop)
16
Fibonacci Symmetry
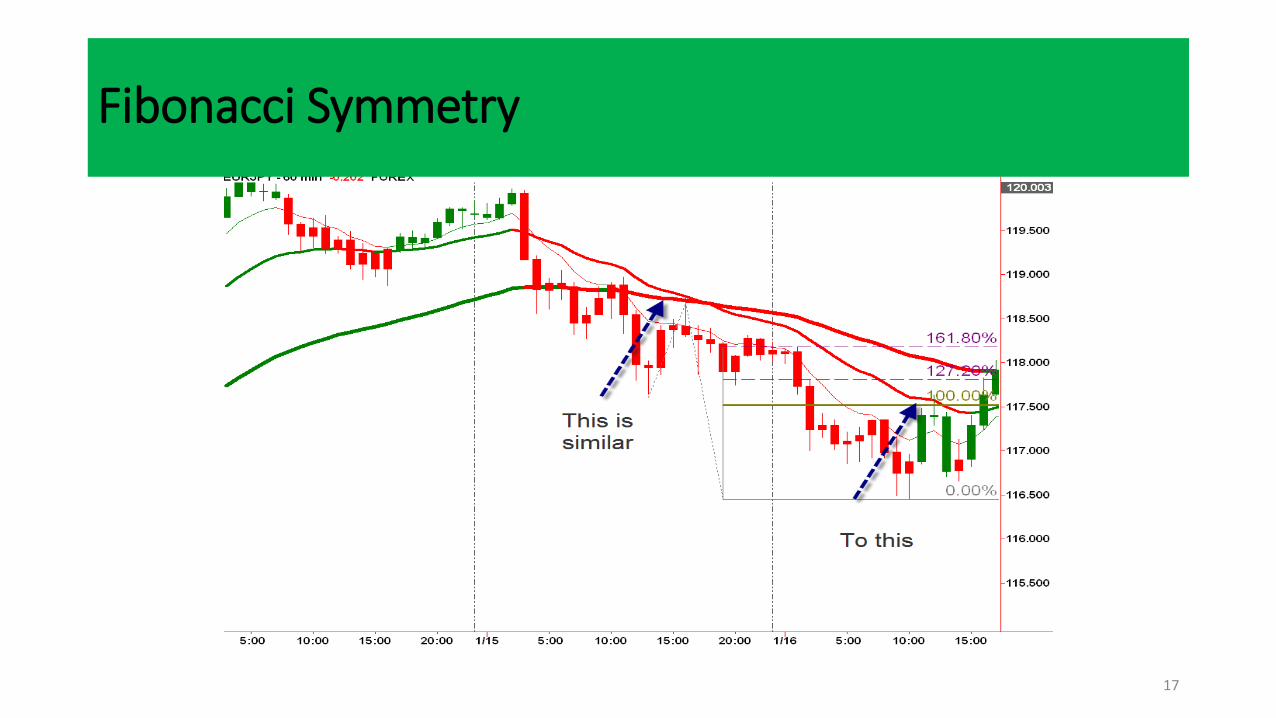
17
Fibonacci Symmetry
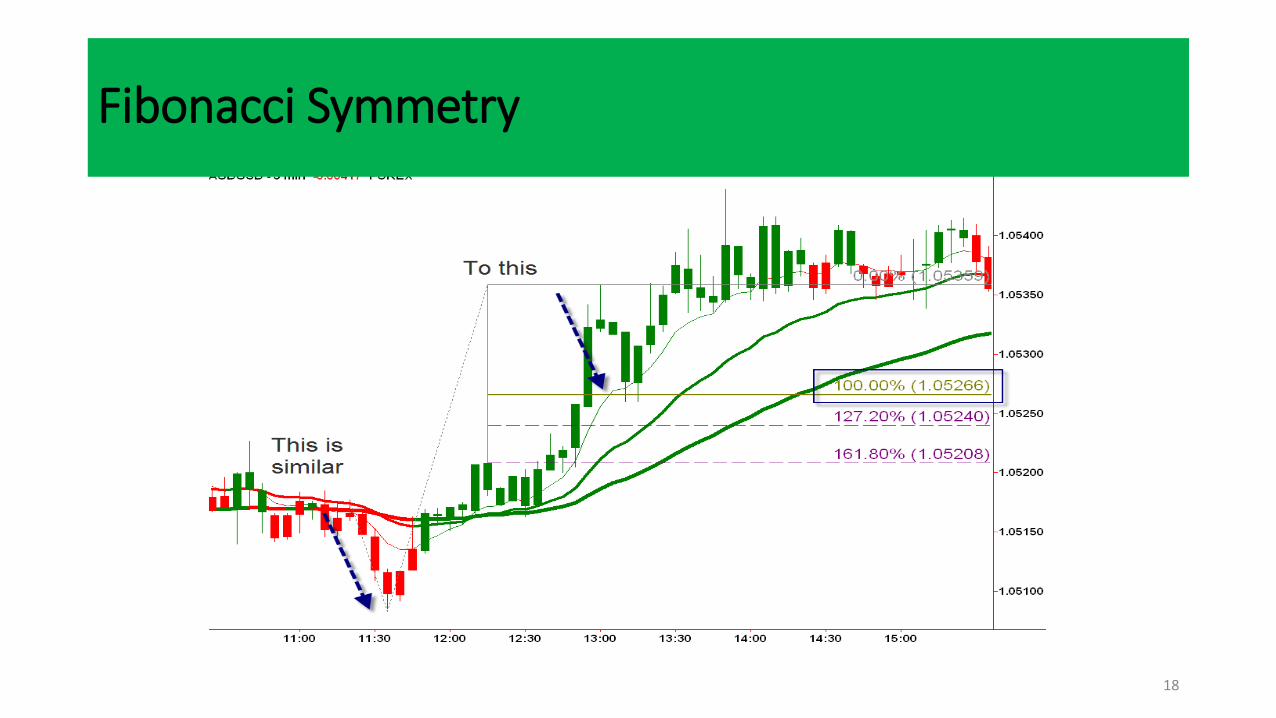
18
Fibonacci Symmetry

19
Depending on your account and time frame
+10 Pip move, stop to breakeven
Or use the U and n shape targets
Use the 127.2 Fibonacci Extension as a second target
20
Profit targets
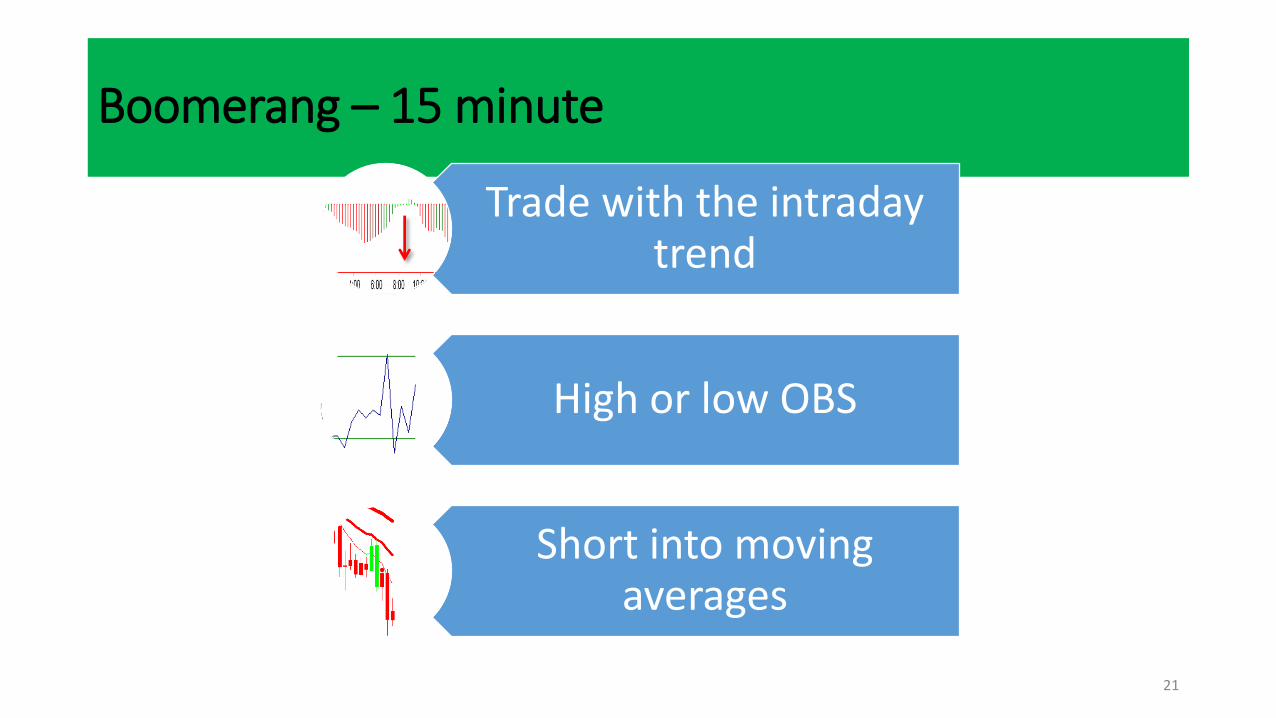
Boomerang – 15 minute
21
Trade with the intraday trend
High or low OBS
Short into moving averages
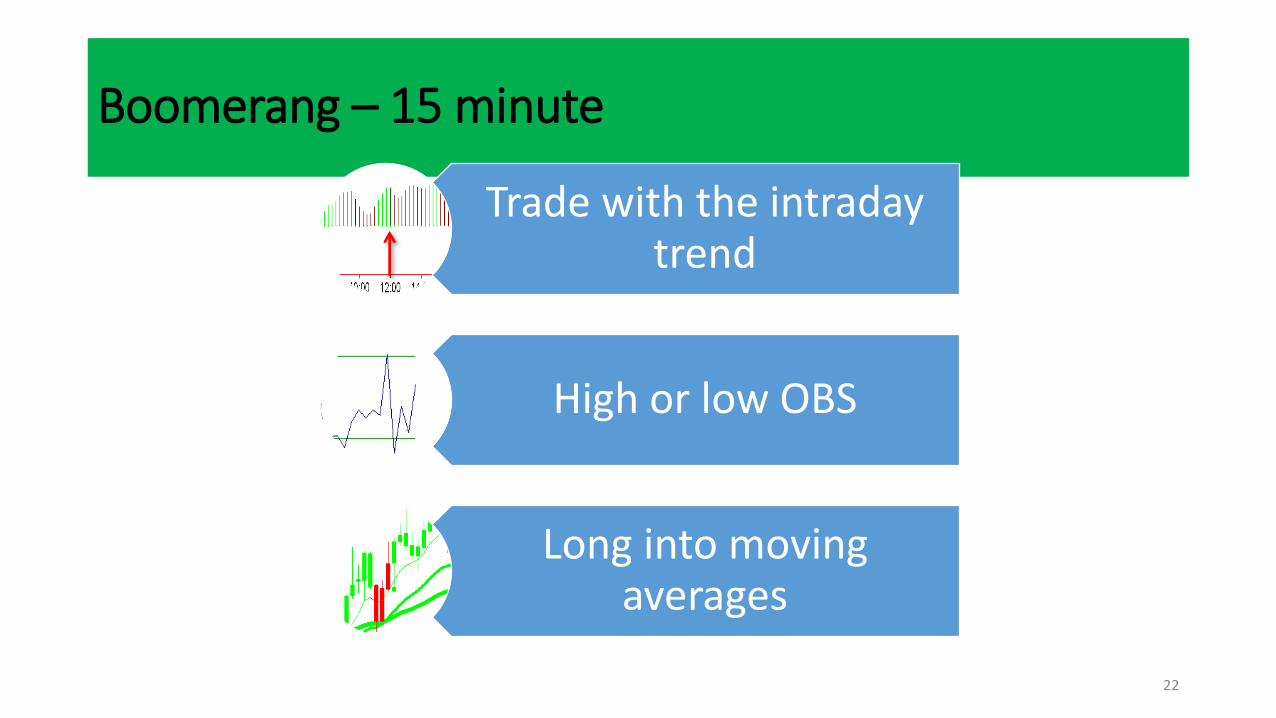
Boomerang – 15 minute
22
Trade with the intraday trend
High or low OBS
Long into moving averages
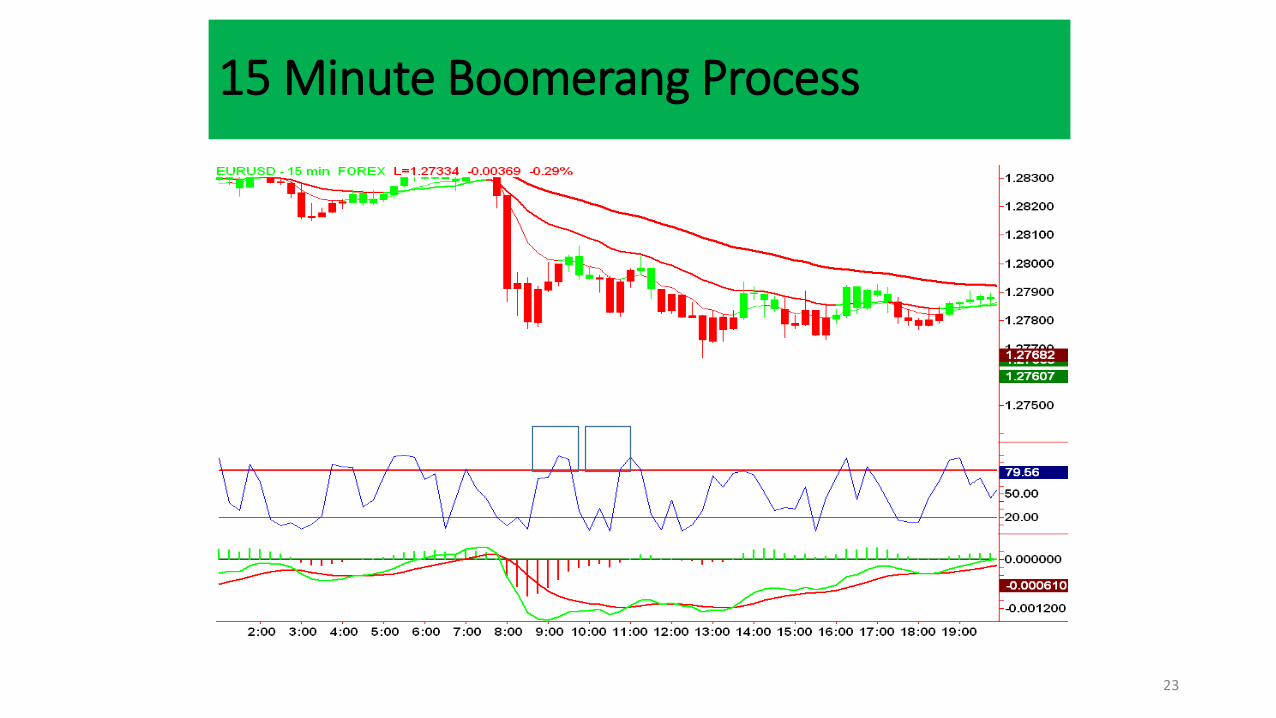
15 Minute Boomerang Process
23
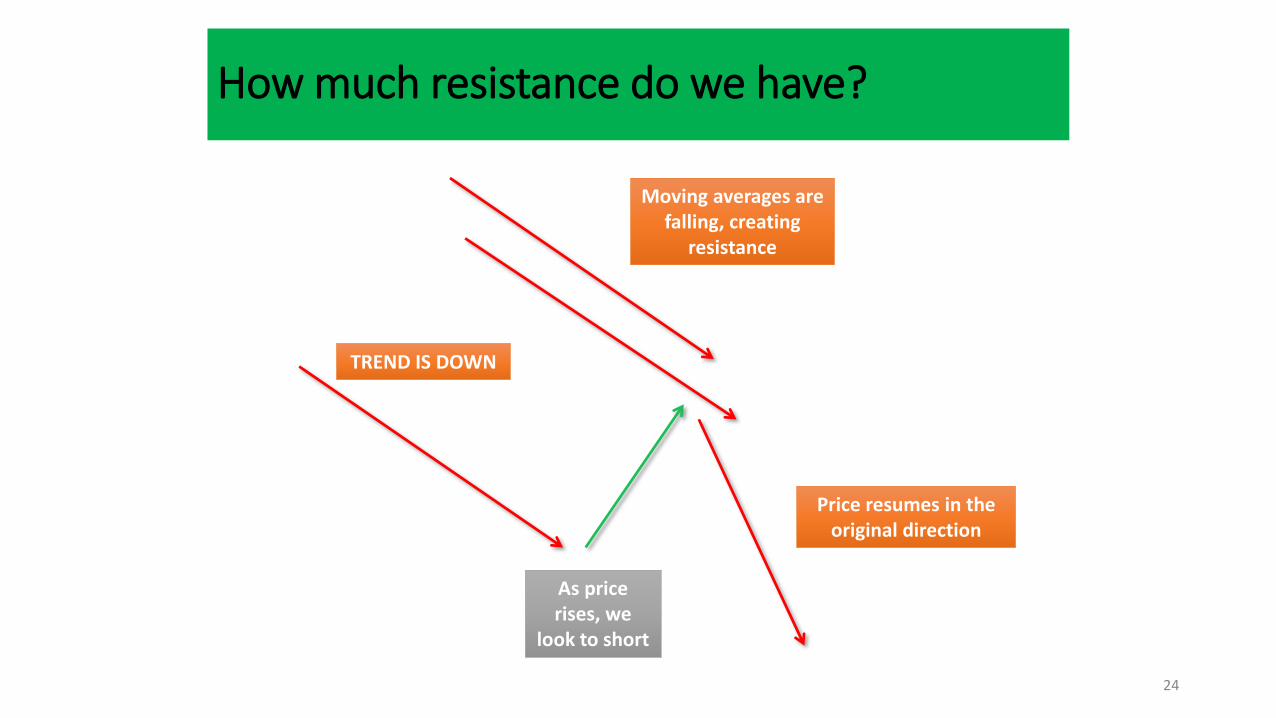
How much resistance do we have?
24
TREND IS DOWN
Moving averages are falling, creating
resistance
As price rises, we
look to short
Price resumes in the original direction
Look to only take the 1st or 2nd
Boomerangs (Wave principle)
25
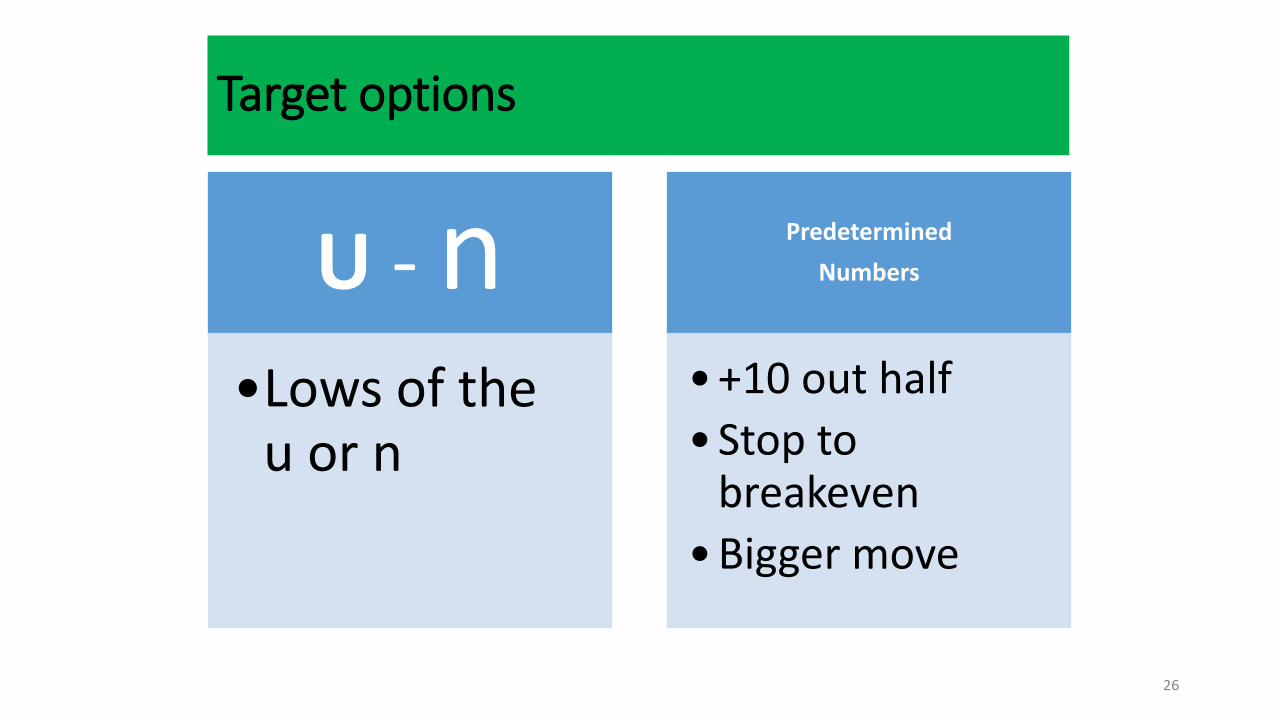
Target options
26
U - n•Lows of the
u or n
Predetermined
Numbers
• +10 out half
• Stop to breakeven
• Bigger move