Embed Size (px)
Citation preview
Boom and Bust 2017TRACKING THE GLOBAL COAL PLANT PIPELINE
Christine Shearer, Nicole Ghio, Lauri Myllyvirta, Aiqun Yu, and Ted Nace

BOOM AND BUST
REPORT | MARCH 2017 | 2COALSWARM / SIERRA CLUB / GREENPEACE
BOOM AND BUST
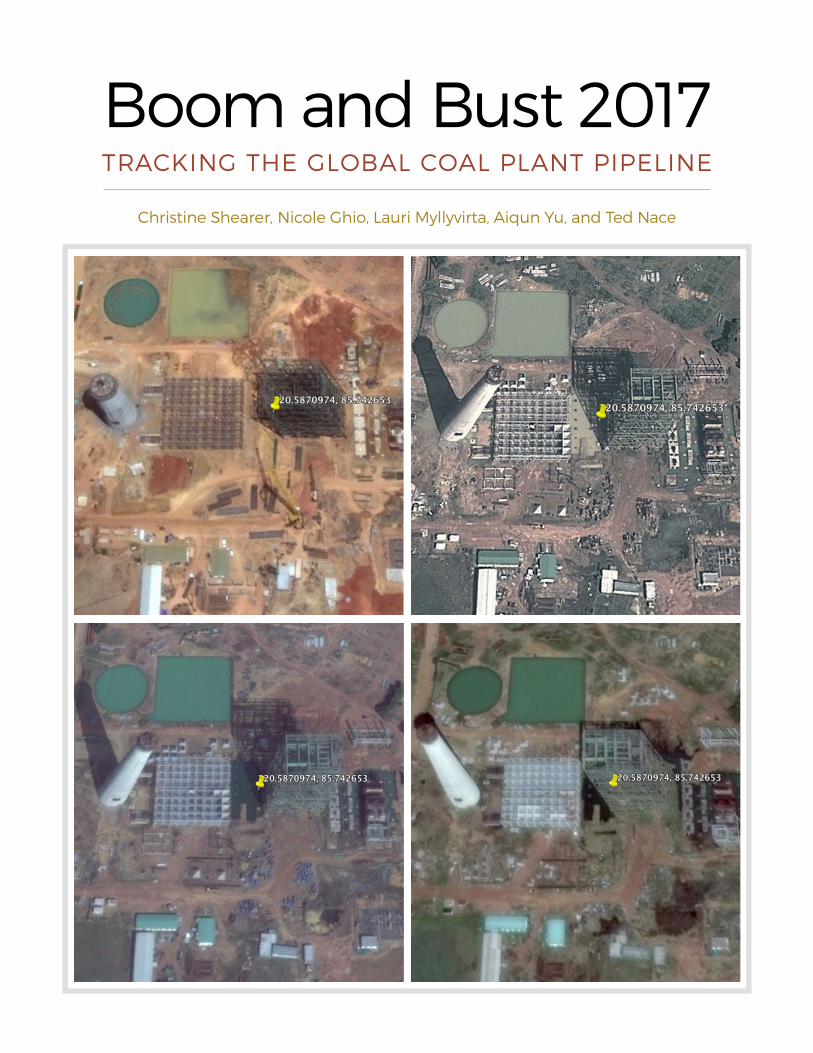
ABOUT THE COVERThe four satellite photos on the cover, taken at yearly intervals from April 2012 to October 2016, show frozen construction at the Cuttack KVK Nilachal power station in Odisha state, India. As explained in this report, construction is currently frozen at over 100 locations in China and India. (Photos: Google Earth)
ABOUT COALSWARMCoalSwarm is a global network of researchers seeking to develop collaborative informational resources on coal impacts and alternatives. Current projects include identifying and
mapping proposed and existing coal projects worldwide, including plants, mines, and infrastructure.
ABOUT THE SIERRA CLUBThe Sierra Club is America’s largest and most influential grassroots environmental organiza-tion, with more than 2.4 million members and supporters. In addition to helping people from
all backgrounds explore nature and our outdoor heritage, the Sierra Club works to promote clean energy, safeguard the health of our communities, protect wildlife, and preserve our remaining wild places through grassroots activism, pub-lic education, lobbying, and legal action.
ABOUT GREENPEACEGreenpeace uses peaceful protest
and creative communication to expose global environmental problems and to promote solutions that are essential to a green and peaceful future. With over 40 associated offices located throughout the world, Greenpeace works to protect our oceans and ancient forests, and to end toxic pollution, global warming, nuclear threats, and genetic engineering. Since 1971, Greenpeace has been the leading voice of the environmental movement by taking a stand against pow-erful political and corporate interests whose policies put the planet at risk. Greenpeace furthers its mission through research, advocacy, public education, lobbying, and litiga-tion with a staff that includes scientists, lawyers, campaign-ers, policy experts, and communications specialists.
ABOUT THE GLOBAL COAL PLANT TRACKERThe Global Coal Plant Tracker is an online database that identifies, maps, describes, and categorizes every known coal-fired generating unit and every new unit proposed since January 1, 2010 (30 MW and larger). Developed by CoalSwarm, the tracker uses wiki pages to document each plant and is designed to support longitudinal monitoring. For further details, see Tracker Methodology at EndCoal.org.
AUTHORSChristine Shearer is the Senior Researcher of CoalSwarm. Nicole Ghio is a Senior Campaign Representative for Sierra Club’s International Climate Program. Lauri Mylly-virta is Senior Global Campaigner, Coal and Air Pollution, at Greenpeace. Aiqun Yu is an independent journalist and a researcher for CoalSwarm. Ted Nace is Director of CoalSwarm.
ACKNOWLEDGEMENTSShen Xinyi and Yuan Baoyin at Greenpeace East Asia con-tributed valuable plant-level and policy research on China. Additional research was provided by GreenID, Greenpeace Akdeniz, CAN Europe, the Sierra Club, and Kiko Network.
PERMISSIONS/COPYRIGHTThis publication may be reproduced in whole or in part and in any form for educational or non-profit purposes without special permission from the copyright holders, provided that acknowledgement of the source is made. No use of this publication may be made for resale or other commercial purpose without the written permission of the copyright holders.
Copyright © March 2017 by CoalSwarm, Greenpeace USA, and Sierra Club
FURTHER RESOURCESFor additional data on proposed and existing coal plants, see Summary Statistics at EndCoal.org, which provides over 20 tables providing results from the Global Coal Plant Tracker (GPCT), broken down by province, nation, and region. For links to over 20 reports based on GPCT data, see Reports at EndCoal.org. To obtain primary data from the GCPT, contact Ted Nace ([email protected]).
REPORT | MARCH 2017 | 3COALSWARM / SIERRA CLUB / GREENPEACE
KEY FINDINGSAfter a decade of unprecedented expansion, the amount of coal power capacity under development worldwide saw a dramatic drop in 2016, mainly due to shifting policies and economic conditions in China and India, according to a survey by CoalSwarm’s Global Coal Plant Tracker. The drop occurred in all stages of coal plant development, including pre- construction planning, construction starts, and in-progress construction. Key developments include:
■■ A 48% drop in pre-construction activity, a 62% drop in construction starts, and a 19% drop in ongoing construction. As of January 2017 the amount of coal power capacity in pre- construction planning was 570 gigawatts (GW), compared to 1,090 GW in January 2016. (A typical coal-fired generating unit is 500 MW, or 0.5 GW, in size, with most power stations having two or more such units.)
■■ In China and India, 68 GW of construction is now frozen at over 100 project sites. Worldwide, more construction is now frozen than entered
construction in the past year. Coal plant retire-ments are taking place at an unprecedented pace, with 64 GW of retirements in the past two years, mainly in the European Union and the United States.
■■ The slowdown in the coal power pipeline brings the possibility of holding global warming to below 2°C from pre-industrial levels within feasible reach. The international climate agreement negotiated in Paris (well below 2°C and aiming for 1.5°C) remains possible but would require much faster retirement of existing capacity, particularly in the world’s historic emitters.
■■ Despite reason for optimism, more progress needs to be made to reduce the number of coal plants under development in Vietnam, Indonesia, Turkey, Japan, and elsewhere. In addition, recent progress at slowing the coal power pipeline in China and India needs to be reinforced and extended.
Boom and Bust 2017 TRACKING THE GLOBAL COAL PLANT PIPELINE
Christine Shearer, Nicole Ghio, Lauri Myllyvirta, Aiqun Yu, and Ted Nace
BOOM AND BUST
REPORT | MARCH 2017 | 4COALSWARM / SIERRA CLUB / GREENPEACE
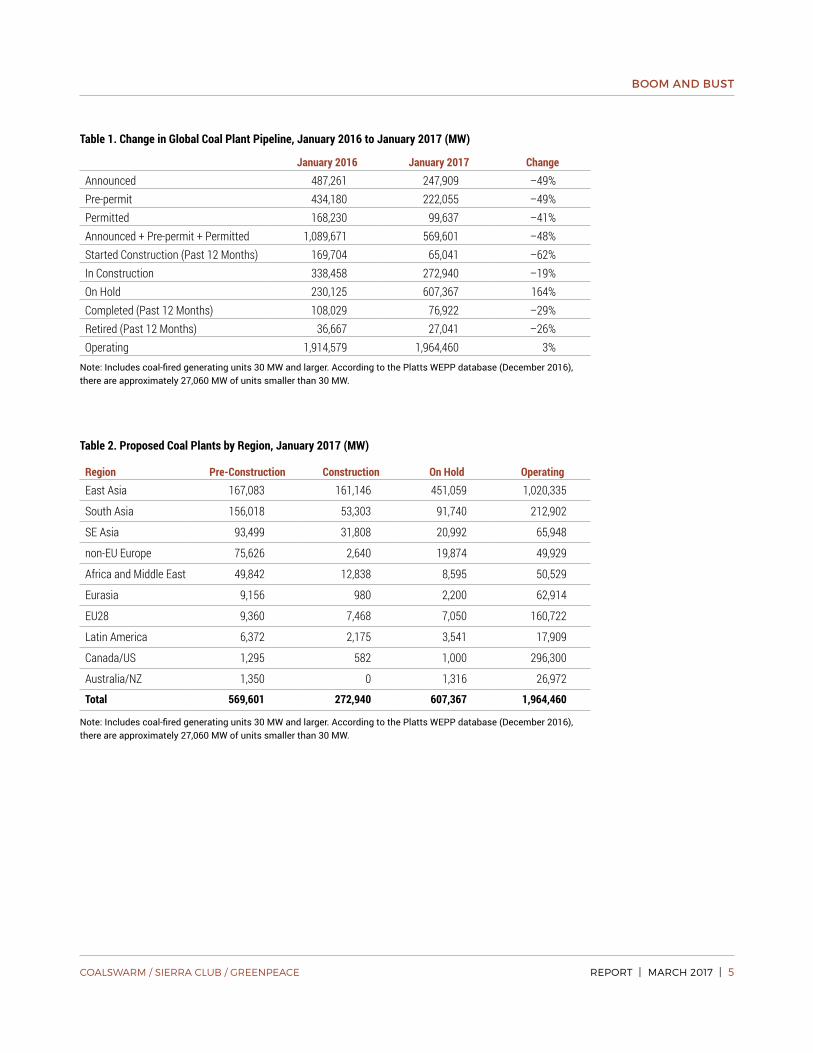
A SHRINKING PIPELINEThe amount of coal power capacity under develop-ment worldwide dropped dramatically from January 2016 to January 2017. As shown in Table 1, all catego-ries showed major declines, including a 48% drop in pre-construction activity, a 62% drop in construction starts, a 19% drop in ongoing construction, and a 29% drop in completed projects.
The main cause of the shrinkage in the coal plant pipeline was the imposition of unprecedented and far-reaching restrictive measures by China’s central government. Over 300 GW of projects in various stages of development were put on hold until after the 13th Five Year Plan (2016–2020), including 55 GW of projects that were already under construction. A typical coal-fired generating unit is 500 MW, or 0.5 GW, in size, with most power stations having two or more such units.
In parallel with China’s government-imposed slow-down, India also experienced a slowdown in coal plant development, driven primarily by the reluctance of banks and other financiers to provide further funds. Work at 13 locations is currently on hold, representing 13 GW of stranded assets.
Since China and India together accounted for 86% of coal power built globally from 2006 through 2016, the slowdown in these two countries carries global impli-cations. An end to the coal plant construction boom brings the possibility of a global phase-out of coal over the coming decades, a prerequisite to reining in climate change.
In addition to a shrinking coal power pipeline, retire-ments of older plants have steadily grown in the past decade, as shown in Figure 8, including 36,667 MW in 2015 and 27,041 MW in 2016.
In order to achieve critical climate goals, both end-ing new coal plant construction and retiring existing plants will be critical. For a phase-out plan to be effective, it is crucial that (1) construction currently on hold in China and India not be restarted at a future time, (2) coal power implementation rates worldwide continue to decline, with new power demand provided as far as possible by clean energy, (3) OECD countries move aggressively to replace aging coal plants with clean energy.
BOOM AND BUST
REPORT | MARCH 2017 | 5COALSWARM / SIERRA CLUB / GREENPEACE
Table 1. Change in Global Coal Plant Pipeline, January 2016 to January 2017 (MW)
January 2016 January 2017 ChangeAnnounced 487,261 247,909 –49%Pre-permit 434,180 222,055 –49%Permitted 168,230 99,637 –41%Announced + Pre-permit + Permitted 1,089,671 569,601 –48%Started Construction (Past 12 Months) 169,704 65,041 –62%In Construction 338,458 272,940 –19%On Hold 230,125 607,367 164%Completed (Past 12 Months) 108,029 76,922 –29%Retired (Past 12 Months) 36,667 27,041 –26%Operating 1,914,579 1,964,460 3%
Note: Includes coal-fired generating units 30 MW and larger. According to the Platts WEPP database (December 2016), there are approximately 27,060 MW of units smaller than 30 MW.
Table 2. Proposed Coal Plants by Region, January 2017 (MW)
Region Pre-Construction Construction On Hold OperatingEast Asia 167,083 161,146 451,059 1,020,335
South Asia 156,018 53,303 91,740 212,902
SE Asia 93,499 31,808 20,992 65,948
non-EU Europe 75,626 2,640 19,874 49,929
Africa and Middle East 49,842 12,838 8,595 50,529
Eurasia 9,156 980 2,200 62,914
EU28 9,360 7,468 7,050 160,722
Latin America 6,372 2,175 3,541 17,909
Canada/US 1,295 582 1,000 296,300
Australia/NZ 1,350 0 1,316 26,972
Total 569,601 272,940 607,367 1,964,460
Note: Includes coal-fired generating units 30 MW and larger. According to the Platts WEPP database (December 2016), there are approximately 27,060 MW of units smaller than 30 MW.
BOOM AND BUST
REPORT | MARCH 2017 | 6COALSWARM / SIERRA CLUB / GREENPEACE
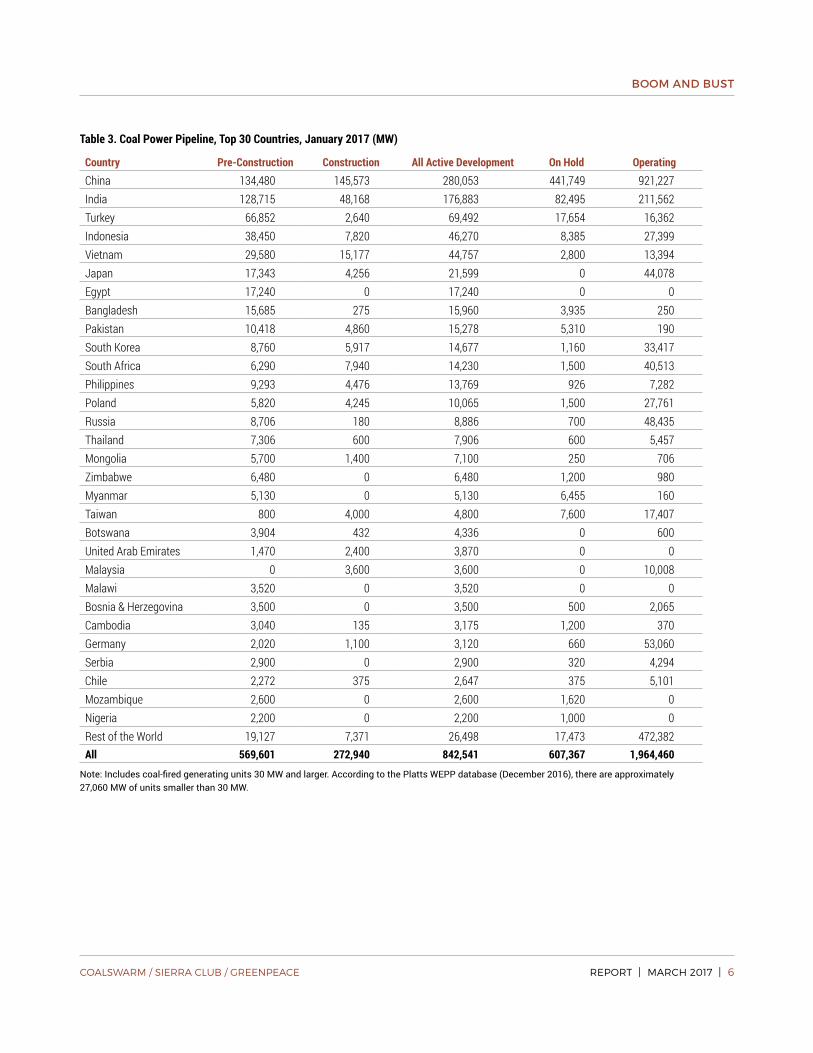
Table 3. Coal Power Pipeline, Top 30 Countries, January 2017 (MW)
Country Pre-Construction Construction All Active Development On Hold OperatingChina 134,480 145,573 280,053 441,749 921,227India 128,715 48,168 176,883 82,495 211,562Turkey 66,852 2,640 69,492 17,654 16,362Indonesia 38,450 7,820 46,270 8,385 27,399Vietnam 29,580 15,177 44,757 2,800 13,394Japan 17,343 4,256 21,599 0 44,078Egypt 17,240 0 17,240 0 0Bangladesh 15,685 275 15,960 3,935 250Pakistan 10,418 4,860 15,278 5,310 190South Korea 8,760 5,917 14,677 1,160 33,417South Africa 6,290 7,940 14,230 1,500 40,513Philippines 9,293 4,476 13,769 926 7,282Poland 5,820 4,245 10,065 1,500 27,761Russia 8,706 180 8,886 700 48,435Thailand 7,306 600 7,906 600 5,457Mongolia 5,700 1,400 7,100 250 706Zimbabwe 6,480 0 6,480 1,200 980Myanmar 5,130 0 5,130 6,455 160Taiwan 800 4,000 4,800 7,600 17,407Botswana 3,904 432 4,336 0 600United Arab Emirates 1,470 2,400 3,870 0 0Malaysia 0 3,600 3,600 0 10,008Malawi 3,520 0 3,520 0 0Bosnia & Herzegovina 3,500 0 3,500 500 2,065Cambodia 3,040 135 3,175 1,200 370Germany 2,020 1,100 3,120 660 53,060Serbia 2,900 0 2,900 320 4,294Chile 2,272 375 2,647 375 5,101Mozambique 2,600 0 2,600 1,620 0Nigeria 2,200 0 2,200 1,000 0Rest of the World 19,127 7,371 26,498 17,473 472,382All 569,601 272,940 842,541 607,367 1,964,460
Note: Includes coal-fired generating units 30 MW and larger. According to the Platts WEPP database (December 2016), there are approximately 27,060 MW of units smaller than 30 MW.
BOOM AND BUST
REPORT | MARCH 2017 | 7COALSWARM / SIERRA CLUB / GREENPEACE
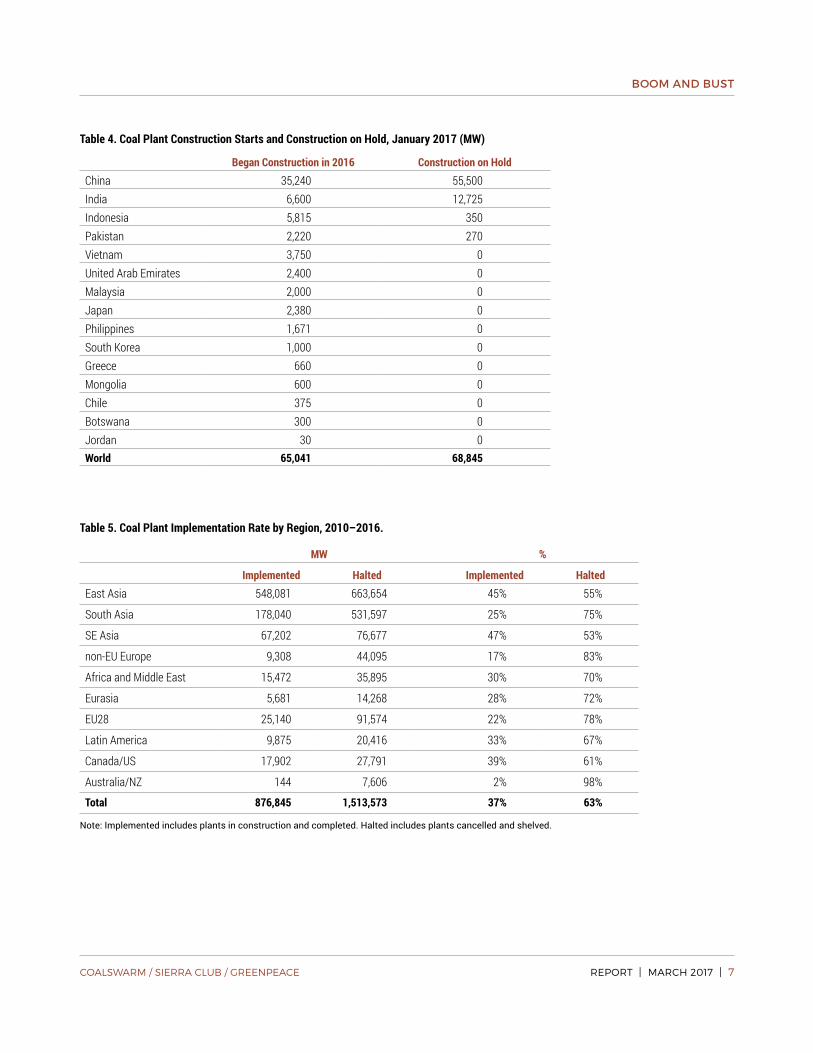
Table 4. Coal Plant Construction Starts and Construction on Hold, January 2017 (MW)
Began Construction in 2016 Construction on HoldChina 35,240 55,500India 6,600 12,725Indonesia 5,815 350Pakistan 2,220 270Vietnam 3,750 0United Arab Emirates 2,400 0Malaysia 2,000 0Japan 2,380 0Philippines 1,671 0South Korea 1,000 0Greece 660 0Mongolia 600 0Chile 375 0Botswana 300 0Jordan 30 0World 65,041 68,845
Table 5. Coal Plant Implementation Rate by Region, 2010–2016.
MW %
Implemented Halted Implemented HaltedEast Asia 548,081 663,654 45% 55%
South Asia 178,040 531,597 25% 75%
SE Asia 67,202 76,677 47% 53%
non-EU Europe 9,308 44,095 17% 83%
Africa and Middle East 15,472 35,895 30% 70%
Eurasia 5,681 14,268 28% 72%
EU28 25,140 91,574 22% 78%
Latin America 9,875 20,416 33% 67%
Canada/US 17,902 27,791 39% 61%
Australia/NZ 144 7,606 2% 98%
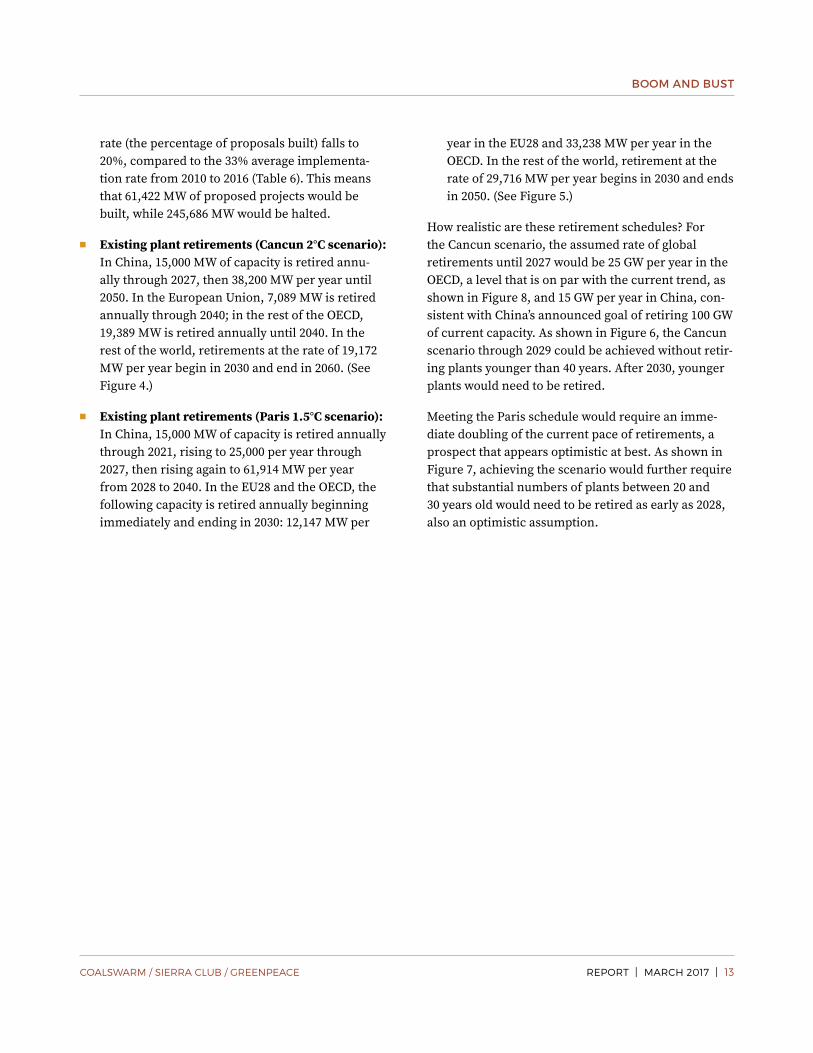
Total 876,845 1,513,573 37% 63%
Note: Implemented includes plants in construction and completed. Halted includes plants cancelled and shelved.
BOOM AND BUST
REPORT | MARCH 2017 | 8COALSWARM / SIERRA CLUB / GREENPEACE
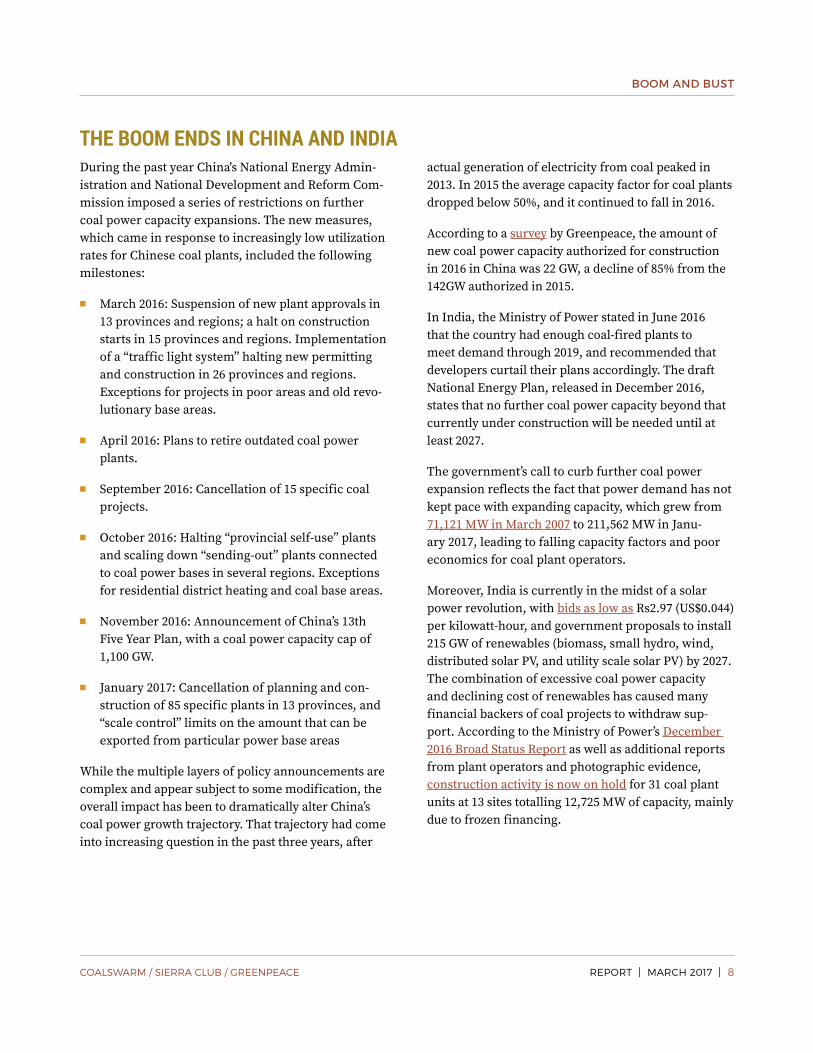
THE BOOM ENDS IN CHINA AND INDIADuring the past year China's National Energy Admin-istration and National Development and Reform Com-mission imposed a series of restrictions on further coal power capacity expansions. The new measures, which came in response to increasingly low utilization rates for Chinese coal plants, included the following milestones:
■■ March 2016: Suspension of new plant approvals in 13 provinces and regions; a halt on construction starts in 15 provinces and regions. Implementation of a “traffic light system” halting new permitting and construction in 26 provinces and regions. Exceptions for projects in poor areas and old revo-lutionary base areas.
■■ April 2016: Plans to retire outdated coal power plants.
■■ September 2016: Cancellation of 15 specific coal projects.
■■ October 2016: Halting “provincial self-use” plants and scaling down “sending-out” plants connected to coal power bases in several regions. Exceptions for residential district heating and coal base areas.
■■ November 2016: Announcement of China’s 13th Five Year Plan, with a coal power capacity cap of 1,100 GW.
■■ January 2017: Cancellation of planning and con-struction of 85 specific plants in 13 provinces, and “scale control” limits on the amount that can be exported from particular power base areas
While the multiple layers of policy announcements are complex and appear subject to some modification, the overall impact has been to dramatically alter China’s coal power growth trajectory. That trajectory had come into increasing question in the past three years, after
actual generation of electricity from coal peaked in 2013. In 2015 the average capacity factor for coal plants dropped below 50%, and it continued to fall in 2016.
According to a survey by Greenpeace, the amount of new coal power capacity authorized for construction in 2016 in China was 22 GW, a decline of 85% from the 142GW authorized in 2015.
In India, the Ministry of Power stated in June 2016 that the country had enough coal-fired plants to meet demand through 2019, and recommended that developers curtail their plans accordingly. The draft National Energy Plan, released in December 2016, states that no further coal power capacity beyond that currently under construction will be needed until at least 2027.
The government’s call to curb further coal power expansion reflects the fact that power demand has not kept pace with expanding capacity, which grew from 71,121 MW in March 2007 to 211,562 MW in Janu-ary 2017, leading to falling capacity factors and poor economics for coal plant operators.
Moreover, India is currently in the midst of a solar power revolution, with bids as low as Rs2.97 (US$0.044) per kilowatt-hour, and government proposals to install 215 GW of renewables (biomass, small hydro, wind, distributed solar PV, and utility scale solar PV) by 2027. The combination of excessive coal power capacity and declining cost of renewables has caused many financial backers of coal projects to withdraw sup-port. According to the Ministry of Power’s December 2016 Broad Status Report as well as additional reports from plant operators and photographic evidence, construction activity is now on hold for 31 coal plant units at 13 sites totalling 12,725 MW of capacity, mainly due to frozen financing.
BOOM AND BUST
REPORT | MARCH 2017 | 9COALSWARM / SIERRA CLUB / GREENPEACE
NEW HOPE FOR CLIMATE GOALS
1. The estimate takes into account planned retirements and otherwise assumes a 40-year lifespan; plants already operating more than 40 years are assumed to operate for five more years. More info on CO2 parameters can be found at http://www.sourcewatch.org/index.php/Estimating_carbon_dioxide_emissions_from_coal_plants
The surge in global coal power capacity over the past decade has been a source of deep concern due to the high carbon intensity of coal and the long lifespans of coal plants. The apparent likelihood that coal combus-tion would continue to grow for decades appeared to undermine any prospects for preventing irreversible climate change.
Beginning in 2013, power generation from coal began falling worldwide and has continued to decline. Now the dramatic shrinkage in the coal power pipeline—nearly 50% in a single year—shows that power capac-ity trends are moving into alignment with declining power generation and that climate goals are indeed within reach without massive asset stranding.
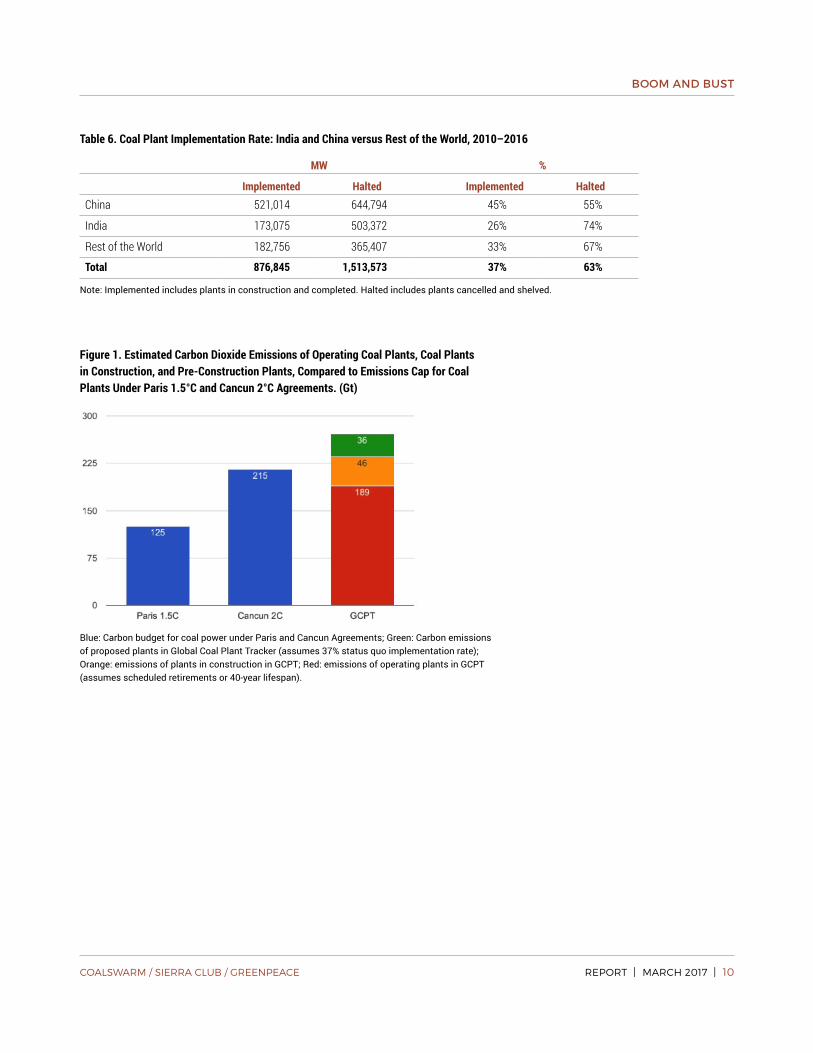
Holding warming to below 2°C was agreed to in Cancun in 2010 as part of the United Nations Frame-work Convention on Climate Change (UNFCCC). Holding warming to “well below” 2°C and pursuing 1.5°C was adopted in Paris and is legally binding on signatories. Figure 1 compares estimated carbon dioxide emissions from plants identified by the Global Coal Plant Tracker to carbon budgets for coal plants analyzed in November 2016 by Climate Analytics, “Implications of the Paris Agreement for Coal Use in the Power Sector.”
As shown in Figure 1, under the Paris 1.5°C and Can-cun 2°C Agreements, carbon dioxide emissions from coal power plants through 2050 need to be limited to 125 and 215 Gigatonnes (Gt) respectively. In com-parison, emissions from plants that are currently operating, under construction, or expected to be implemented at the rate observed since 2010 (37%) are estimated at 271 Gt.1 Given that estimated emissions by the plants currently operating or under develop-ment will exceed both the Paris and the Cancun bud-gets, it will be necessary to retire some plants earlier
than 40 years and further reduce the implementation rate of proposed plants.
To explore how such reductions might be accom-plished, we developed two scenarios based on the Global Coal Plant Tracker, applying the regional dead-lines for phase-out of coal power recommended by the Climate Analytics study, as shown in Figures 2–5. The scenarios attempt to answer the question: In light of the actual constellation of proposed coal projects being monitored by the Global Coal Plant Tracker (Tables 2 and 3), are the goals of recent climate agree-ments feasible?
A year ago, when there were 1,090 GW of projects in pre-construction planning and 338 GW in construc-tion, prospects appeared dim. Now, in the wake of massive curtailment of the pre-construction pipeline and construction frozen at over 100 project sites, the odds have improved markedly.
The scenarios that would meet the Cancun 2°C and Paris 1.5°C goals include the following elements:
■■ Active construction: Projects currently under active construction are completed. Such projects amount to 145,573 MW of new capacity in China, 7,468 MW in the EU28, 13,183 MW in the rest of the OECD, and 103,419 MW in the rest of the world.
■■ Shelved construction: Shelved construction is not reactivated. This includes 55,500 MW in China, 12,725 MW in India, 350 MW in Indonesia, and 270 MW in Pakistan. (See Table 4.)
■■ Pre-construction pipeline: Plants in the pre- construction pipeline in China and India do not proceed to construction. As shown in Table 3, this includes 134,480 MW in China and 128,715 MW in India. Outside China and India the implementation
BOOM AND BUST
REPORT | MARCH 2017 | 10COALSWARM / SIERRA CLUB / GREENPEACE
Table 6. Coal Plant Implementation Rate: India and China versus Rest of the World, 2010–2016
MW %
Implemented Halted Implemented HaltedChina 521,014 644,794 45% 55%
India 173,075 503,372 26% 74%
Rest of the World 182,756 365,407 33% 67%
Total 876,845 1,513,573 37% 63%
Note: Implemented includes plants in construction and completed. Halted includes plants cancelled and shelved.
Figure 1. Estimated Carbon Dioxide Emissions of Operating Coal Plants, Coal Plants in Construction, and Pre-Construction Plants, Compared to Emissions Cap for Coal Plants Under Paris 1.5°C and Cancun 2°C Agreements. (Gt)
Blue: Carbon budget for coal power under Paris and Cancun Agreements; Green: Carbon emissions of proposed plants in Global Coal Plant Tracker (assumes 37% status quo implementation rate); Orange: emissions of plants in construction in GCPT; Red: emissions of operating plants in GCPT (assumes scheduled retirements or 40-year lifespan).
BOOM AND BUST
REPORT | MARCH 2017 | 11COALSWARM / SIERRA CLUB / GREENPEACE
Figure 2. Global Coal Power Capacity, 2017–2060, Under Cancun 2°C Phase-Out Scenario (MW)
Blue: China, red: EU28, orange: OECD, green: rest of the world.
Figure 3. Global Coal Power Capacity, 2017–2060, Under Paris 1.5°C Phase-Out Scenario (MW)
Blue: China, red: EU28, orange: OECD, green: rest of the world.
Figure 4. Cumulative Coal Power Retirements by Region, 2017–2060, Under a Cancun 2°C Phase-Out Scenario. (MW)
Blue: China, red: EU28, orange: OECD, green: rest of the world.
Figure 5. Cumulative Coal Power Retirements by Region, 2017–2060, Under a Paris 1.5°C Phase-Out Scenario. (MW)
Blue: China, red: EU28, orange: OECD, green: rest of the world.
BOOM AND BUST
REPORT | MARCH 2017 | 12COALSWARM / SIERRA CLUB / GREENPEACE
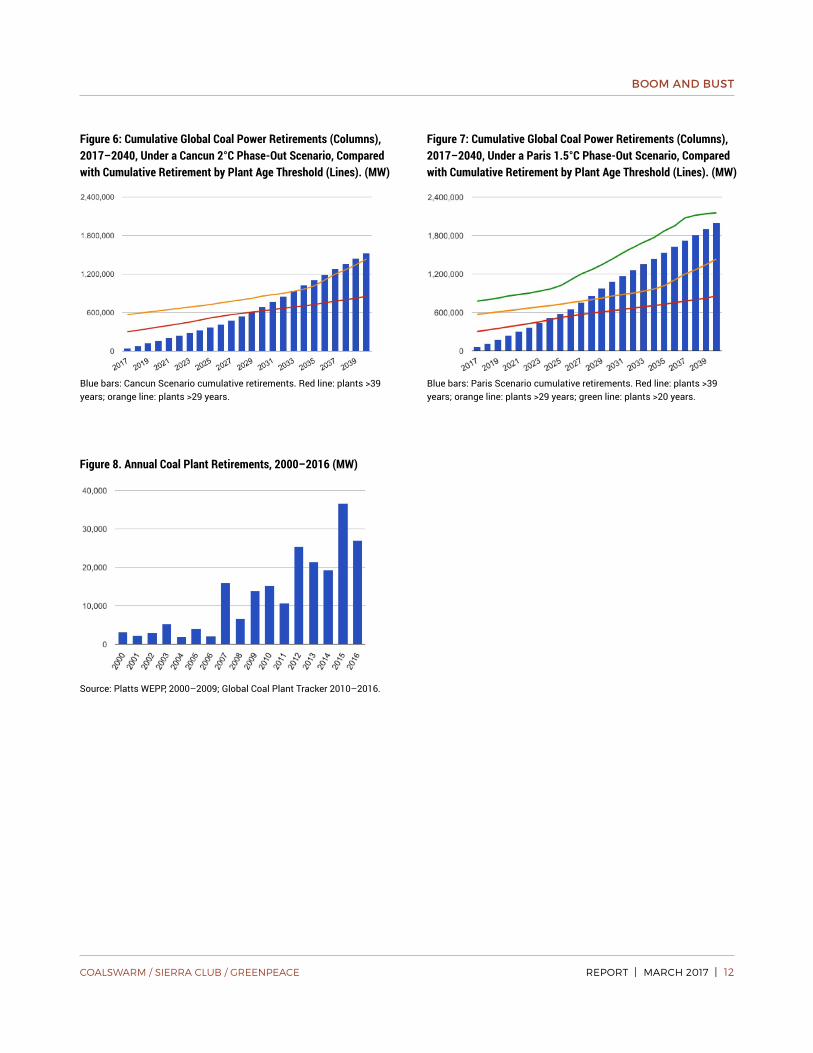
Figure 8. Annual Coal Plant Retirements, 2000–2016 (MW)
Source: Platts WEPP, 2000–2009; Global Coal Plant Tracker 2010–2016.
Figure 6: Cumulative Global Coal Power Retirements (Columns), 2017–2040, Under a Cancun 2°C Phase-Out Scenario, Compared with Cumulative Retirement by Plant Age Threshold (Lines). (MW)
Blue bars: Cancun Scenario cumulative retirements. Red line: plants >39 years; orange line: plants >29 years.
Figure 7: Cumulative Global Coal Power Retirements (Columns), 2017–2040, Under a Paris 1.5°C Phase-Out Scenario, Compared with Cumulative Retirement by Plant Age Threshold (Lines). (MW)
Blue bars: Paris Scenario cumulative retirements. Red line: plants >39 years; orange line: plants >29 years; green line: plants >20 years.
BOOM AND BUST
REPORT | MARCH 2017 | 13COALSWARM / SIERRA CLUB / GREENPEACE
rate (the percentage of proposals built) falls to 20%, compared to the 33% average implementa-tion rate from 2010 to 2016 (Table 6). This means that 61,422 MW of proposed projects would be built, while 245,686 MW would be halted.
■■ Existing plant retirements (Cancun 2°C scenario): In China, 15,000 MW of capacity is retired annu-ally through 2027, then 38,200 MW per year until 2050. In the European Union, 7,089 MW is retired annually through 2040; in the rest of the OECD, 19,389 MW is retired annually until 2040. In the rest of the world, retirements at the rate of 19,172 MW per year begin in 2030 and end in 2060. (See Figure 4.)
■■ Existing plant retirements (Paris 1.5°C scenario): In China, 15,000 MW of capacity is retired annually through 2021, rising to 25,000 per year through 2027, then rising again to 61,914 MW per year from 2028 to 2040. In the EU28 and the OECD, the following capacity is retired annually beginning immediately and ending in 2030: 12,147 MW per
year in the EU28 and 33,238 MW per year in the OECD. In the rest of the world, retirement at the rate of 29,716 MW per year begins in 2030 and ends in 2050. (See Figure 5.)
How realistic are these retirement schedules? For the Cancun scenario, the assumed rate of global retirements until 2027 would be 25 GW per year in the OECD, a level that is on par with the current trend, as shown in Figure 8, and 15 GW per year in China, con-sistent with China’s announced goal of retiring 100 GW of current capacity. As shown in Figure 6, the Cancun scenario through 2029 could be achieved without retir-ing plants younger than 40 years. After 2030, younger plants would need to be retired.
Meeting the Paris schedule would require an imme-diate doubling of the current pace of retirements, a prospect that appears optimistic at best. As shown in Figure 7, achieving the scenario would further require that substantial numbers of plants between 20 and 30 years old would need to be retired as early as 2028, also an optimistic assumption.
BOOM AND BUST
REPORT | MARCH 2017 | 14COALSWARM / SIERRA CLUB / GREENPEACE
BEYOND CHINA AND INDIA: TEN HOT SPOTSAs shown in Table 3, countries outside China and India account for 78,012 MW of construction activity (29% of the global total) and 307,108 MW of pre- construction activity (54% of the global total). While most projects now under construction are likely to be completed, pre-construction activity is a different story. Since 2010 only 33% of coal plant proposals out-side China and India have been implemented, while 67% have been halted, as shown in Table 6.
Applying the global implementation average to the pre-construction pipeline, approximately 114 GW of projects outside China and India will be implemented through 2030. For the scenarios described above, we assume a somewhat lower implementation rate, 20%, reflecting the rapidly dropping cost of renewables as well as the tightening of financing for coal projects. Under the 20% implementation rate, 61 GW of addi-tional projects currently in pre-construction would eventually be built.
A country-by-country consideration of the pre- construction pipeline indicates that much of it consists of projects whose prospects are fading, suggesting that the global implementation rate is indeed likely to decline:
■■ Turkey: With 66,852 MW in the pre-construction pipeline, Turkey represents by far the largest potential locus of new coal plant development outside India and China. However, power proj-ects face a strong public opposition movement that has already slowed or halted much of the pre-construction pipeline. As a result, only 13% of pre-construction projects have been fully permit-ted, suggesting that the ultimate implementation rate in the country will be low. Indeed, despite Turkey’s large pipeline, only 4,168 MW has actually been built so far, and only 2,640 MW is currently in construction.
■■ Indonesia: While Indonesia has 38,450 MW in pre-construction development, 25,440 MW of that capacity is in the Announced stage, the earliest developmental stage and the one most subject to delay or cancellation. In the past year, the Indo-nesian government has revised its ten-year plan, rescheduling over 7,000 MW of coal power to later years. With the cost of renewables falling, further coal plant delays and cancellations appear likely.
■■ Vietnam: Like Indonesia, Vietnam has made ambi-tious expansion of coal power the centerpiece of its long-range plan. But recent news, including an announcement in January 2016 by Prime Minister Nguyen Tan Dung that the government intends to “review development plans of all new coal plants and halt any new coal power development,” indi-cates that the country is shifting its policy stance away from coal. In March 2016 the National Power Development Plan VII was revised, with 20,000 MW of proposed coal plants cancelled or post-poned. In addition, a September 2016 proposal by Bac Lieu province to withdraw a coal-fired power plant was approved by the Prime Minister.
■■ Japan: Among OECD countries, Japan is an excep-tion to the general shift away from coal power, with numerous coal plants under development. While the country has only built 1,950 MW of coal in the past five years, 4,256 MW is currently under construction and 17,343 MW is in pre-construc-tion planning. Yet Japan faces strong pressure both internally and externally to raise its levels of commitment to international climate goals. In January 2017 a plan to convert the Ako power plant to coal was cancelled, the first time in recent years that any coal power capacity under development in the country has been halted and for that reason a milestone.
BOOM AND BUST
REPORT | MARCH 2017 | 15COALSWARM / SIERRA CLUB / GREENPEACE
■■ Egypt: In the past few years, Egypt has begun early consideration of several very large coal projects, including the 2,640 MW Ayoun Moussa power sta-tion, over 4,000 MW of power at Hamarawein, and 4,000 MW at Marsa Matruh. Few of these large pro-posals have moved forward in permitting or devel-opment, as financing is required not only for the coal plants but also for new coal import infrastruc-ture. Given the country’s immense solar potential and the rapidly declining costs of solar PV, these plants may soon be overtaken by the potential to deploy clean power more cheaply and quickly.
■■ Bangladesh: While intense controversy continues over the proposed Rampal power station, due to its siting in the environmentally sensitive Sund-arbans, a number of other projects remain in the early stages of planning. In November, a detailed study of Bangladesh’s energy system concluded that an alternative path based on renewables would provide a cleaner and more affordable alternative, could be implemented more quickly, and would attract strong international financial support. Both improved economics for renewables and a cooling of financial support for coal power suggests that Bangladesh’s coal power pipeline will be scaled back.
■■ Pakistan: The China-Pakistan Economic Corridor Agreement, announced in 2015, offered US$46 bil-lion for energy infrastructure, including financing for six new coal plants. As a potential market for coal plant equipment, Pakistan offers some relief to Chinese manufacturers facing a cooling domes-tic market. On the other hand, Pakistan faces serious water constraints, which have already affected many proposed and operating plants in neighboring India, and Pakistan’s solar potential is high. Moreover, coal power has faced repeated protests from farmers and others concerned about environmental impacts and competition for water resources.
■■ The Philippines: With thousands of deaths from five serious typhoons since 2006, including unprec-edented destruction caused by Typhoon Yolanda, the Philippines has already witnessed some of the dire implications of climate change. The country’s environmental movement enjoys the backing of the Catholic church, and the appointment of envi-ronmental advocate Gina Lopez to the Department of Environment and National Resources has raised hopes for opponents of coal plants. Nevertheless, the country still has numerous coal plants under development. The degree to which such propos-als are ultimately implemented is dependent on availability of financing, on the strength of citizen opposition to projects such as Batangas power sta-tion and Altimoan power station, and on the speed at which solar power can expand.
■■ South Korea: Fine particulate emissions from South Korea’s massive coal-fired power facilities, including the world’s largest coal plant, Dang-jin power station (6,040 MW), have become a high-profile political issue in the country. Comple-tion of the Dangjin Eco Power project, currently on hold, would make the plant even larger. In July 2016 the government announced plans to retire ten existing coal plants by 2025 and avoid adding further projects to its current roster of proposed plants. Yet Korea is still developing at least a dozen projects and the government still plans to rely on coal for over 32% of its power in 2029. However, like Japan, South Korea is likely to face increasing international pressure to accelerate its transition from heavy dependence on fossil power toward renewables.
■■ Thailand: While Russia has slightly more coal power in the pre-construction pipeline than Thailand, most of Russia’s potential expansion is accounted for by a single 8,000 MW plant proposed in Amur Province that appears to be an increas-ingly remote possibility. In Thailand, the proposed
BOOM AND BUST
REPORT | MARCH 2017 | 16COALSWARM / SIERRA CLUB / GREENPEACE
Krabi power station faces intense grassroots opposition. The country’s planners continue to include three 1,000-MW coal plants in Thailand’s long-range supply plan, yet there has been little progress on these projects and public opposition to them is strong.
The countries profiled above account for 75% of the coal power capacity under pre-construction develop-ment outside China and India. The remaining 25% is spread out across 41 other countries, mainly as isolated new plants or additions to existing ones. In countries that lack extensive experience in building coal-fired generation, implementation proceeds more slowly than in active developers of coal power. Conse-quently, such projects are more vulnerable to displace-ment by increasingly inexpensive renewables.
CONCLUSIONFor the first time since the beginning of the global coal boom a decade ago, developments in East and South Asia—in particular China’s wide-reaching restrictions on new coal plants and India’s indication that no new coal power is needed through at least the next decade—appear to have brought global climate goals within feasible reach, raising the prospect that the worst levels of climate change might be avoided. More progress is needed and the margin for error is tight, but the results of the past year provide good reason for optimism.