Embed Size (px)
Citation preview

SUPPLEMENTARY RENEWABLE ENERGIES
BOOKLETS
DECEMBER 2015 | YEAR 2 | No. 4 | ISSN 2358-5277


SUPPLEMENTARY RENEWABLE ENERGIES

DIRECTOR Carlos Otavio de Vasconcellos Quintella TECHNICAL STAFF Editorial coordination Lavinia Hollanda Paulo César Fernandes da Cunha Authors Bruno Moreno R. de Freitas Lavinia Hollanda Renata Hamilton de Ruiz
PRODUCTION STAFF Operational Coordination Simone Corrêa Lecques de Magalhães Desktop Publishing Bruno Masello and Carlos Quintanilha [email protected]
FIRST FOUNDING PRESIDENT Luiz Simões Lopes
PRESIDENT Carlos Ivan Simonsen Leal
VICE-PRESIDENTS Sergio Franklin Quintella, Francisco Oswaldo Neves Dornelles and Marcos Cintra Cavalcanti de Albuquerque
BOARD OF DIRECTORS
President Carlos Ivan Simonsen Leal
Vice-Presidents Sergio Franklin Quintella, Francisco Oswaldo Neves Dornelles and Marcos Cintra Cavalcanti de Albuquerque
Members Armando Klabin, Carlos Alberto Pires de Carvalho e Albuquerque, Ernane Galvêas, José Luiz Miranda, Lindolpho de Carvalho Dias, Marcílio Marques Moreira and Roberto Paulo Cezar de Andrade
Deputies Antonio Monteiro de Castro Filho, Cristiano Buarque Franco Neto, Eduardo Baptista Vianna, Gilberto Duarte Prado, Jacob Palis Júnior, José Ermírio de Moraes Neto and Marcelo José Basílio de Souza Marinho.
TRUSTEE COUNCIL
President Carlos Alberto Lenz César Protásio
Vice-President João Alfredo Dias Lins (Klabin Irmãos e Cia)
Members - Alexandre Koch Torres de Assis, Angélica Moreira da Silva (Brazilian Federation of Banks), Ary Oswaldo Mattos Filho (EDESP/FGV), Carlos Alberto Lenz Cesar Protásio,
Carlos Moacyr Gomes de Almeida, Eduardo M. Krieger, Fernando Pinheiro e Fernando Bomfiglio (Souza Cruz S/A), Heitor Chagas de Oliveira, Jaques Wagner (State of Bahia), João Alfredo Dias Lins (Klabin Irmãos & Cia), Leonardo André Paixão (IRB - Brasil Resseguros S.A.), Luiz Chor (Chozil Engenharia Ltda.), Marcelo Serfaty, Marcio João de Andrade Fortes, Orlando dos Santos Marques (Publicis Brasil Comunicação Ltda.), Pedro Henrique Mariani Bittencourt
(Banco BBM S.A.), Raul Calfat (Votorantim Participações S.A.), Ronaldo Mendonça Vilela (Trade Union of Private Insurance, Capitalization and Reinsurance Companies of the State of Rio de Janeiro and Espírito Santo), Sandoval Carneiro Junior (DITV - Dept. Vale Technology Institute) and Tarso Genro (State of Rio Grande do Sul).
Deputies - Aldo Floris, José Carlos Schmidt Murta Ribeiro, Luiz Ildefonso Simões Lopes (Brookfield Brasil Ltda.), Luiz Roberto Nascimento Silva, Manoel Fernando Thompson Motta Filho, Roberto Castello Branco (Vale S.A.), Nilson Teixeira (Banco de Investimentos Crédit Suisse S.A.), Olavo Monteiro de Carvalho (Monteiro Aranha Participações S.A.), Patrick de Larragoiti Lucas (Sul América Companhia Nacional de Seguros), Rui Barreto (Café Solúvel Brasília S.A.), Sérgio Lins Andrade (Andrade Gutierrez S.A.), and Victório Carlos De Marchi (AMBEV).
EXECUTIVE BOARD Carlos Otavio de Vasconcellos Quintella
RESEARCH COORDINATION Lavinia Hollanda
COORDINATION OF INSTITUTIONAL RELATION Luiz Roberto Bezerra
COORDINATION OF TEACHING AND R&D Felipe Gonçalves
OPERATIONAL COORDINATION Simone Corrêa Lecques de Magalhães
RESEARCHERS Bruno Moreno R. de Freitas Camilo Poppe de Figueiredo Muñoz Mônica Coelho Varejão Rafael da Costa Nogueira Renata Hamilton de Ruiz
ADMINISTRATIVE ASSISTANT Ana Paula Raymundo da Silva
CONSULTANT Paulo César Fernandes da Cunha
PRAIA DE BOTAFOGO, 190, RIO DE JANEIRO - RJ - POSTAL CODE 22250-900 OR POSTAL BOX 62.591 - POSTAL CODE 22257-970 - TELEPHONE (21) 3799-5498 - WWW.FGV.BR
Institution of technical and scientific, educational, and charitable nature created on December 20, 1944 as a private legal entity with the purpose of fully acting in all scientific matters, and emphasizing in the field of social sciences: administration, law and economy, thus contributing to the country’s social and economic development.

Supplementary Renewable Energies: Benefits and Challenges Luciano Freire The Brazilian potential for Supplementary Renewable Energies is enormous. We have excellent solar irradiation indices of centralized or distributed photovoltaic power generation, from Oiapoque to Chuí, from east to west, with greater intensity throughout the northeastern semi-arid region. Our winds are differentiated: constant, unidirectional and provide high productivity factors, as well as above to those found in Europe. The potential for power generation associated to sugarcane biomass, reforestation and wood waste, and there are thousands of small power plants located throughout the country. As if the abundance was not enough, these sources are highly supplementary in several forms of seasonality. In the Southeast Region, for example, during the dry period in which
power production is reduced, sugarcane is harvested and therefore power is intensively produced with bagasse burning. Production of wind power in the Northeast is also supplementary during the dry period in the Southeast, because wind is more intense in that region. Finding regions where wind speed is greater in the evening with perfect daytime association photovoltaic solar generation is common in daily seasonality. There are several other forms of complementarity, which separate or combined, give the same time, flexibility and consistency in power production. To leverage and color with sustainable reality all such benefits we will face enormous challenges: from the technology development,

through the break of paradigms in transmission and distribution power grids, and to a new regulation. More than inevitable, the progress of renewable energy sources is desirable due to the many added benefits that can be synthetized in sustainable development where the social and economic growth is obtained preserving the environment for current and future generations. This journey involves the entire society: Government, institutions, economy sectors and citizens.
In this context, FGV Energia took the initiative to collect several perspectives on the theme starting with important concepts to understand the problem, going through the global and Brazilian outlook and to the dilemmas noted in the sector. Such an initiative shall contribute to start a debate intended to solve these dilemmas, forecast new challenges and seek robustness in our power sector model.
Luciano Freire - Director of Engineering at QG Energia. He was the former member of CCEE, works in the power distribution, generation and trade for over 25 years. Luciano is an electrical engineer graduated from PUC - MG and master in automation by UNICAMP.

Acknowledgements We would like to thank the collaboration from several professionals of the Brazilian power sector. The support of those who spent their time giving us interviews, sharing experiences, their views on challenges and problems of the sector and that helped this work become possible. On behalf of FGV Energia, we thank Adriano Pires, Amilcar Guerreiro, Elbia Gannoum, Ivo Pugnaloni, Leontina Pinto, Luciano Freire, Mathias Becker, Maurício Imoto, Nelson Rocha, Renato Volponi and Rodrigo Sauaia, and other professionals who also contributed for the project. We also take this opportunity to express our gratitude to our colleagues at FGV Energia. The collaboration spirit improved by questions and differences are the basis for a broader and multidisciplinary perspective on the sector.
BRUNO MORENO R. DE FREITAS Researcher FGV Energia LAVINIA HOLLANDA Coordinator of Research FGV Energia PAULO CÉSAR FERNANDES DA CUNHA Senior Consultant of FGV Energia RENATA H. RUIZ Researcher FGV Energia

Table of Contents 8 EXECUTIVE SUMMARY
13 INITIAL CONCEPTS
25 OUTLOOK FOR COMMERCIAL FRE
41 EXPANSION DILEMMAS
50 OPERATION DILEMMAS
55 BUSINESS MODEL DILEMMAS
58 CONCLUSION AND FINAL CONSIDERATIONS
59 LIST OF ACRONYMS
60 BIBLIOGRAPHY

Executive Summary • Electricity became essential for the activities
of the modern society. Virtually any activity we perform requires electricity - or a form of power. However, from generation to consumption, the entire power production chain causes significant environmental impacts, as well as social and economic. The magnitude of such externalities will depend on the technologies we are using to generate electricity.
• Since the moment the power matrix is being
planned, from the definition of the percentage of each source in the energy mix, other possible grids are being waived, with their opportunity costs. Therefore, the power matrix chosen must have the best return possible - not only financial and economic, but also
social and environmental - inside a limited options chain.
• Choosing to include alternative sources
indicates a lower social and environmental impact matrix; however, it will also have an economic repercussion. Alternative sources as wind, solar, biomass and PCH are known for being able to reduce the emission of greenhouse gas - GHG, as well as to prevent the removal of populations and impacts on soil use. However, the higher costs of such sources in relation to traditional sources, increased operation complexity and eventual transaction costs associated to the need of changes in current regulatory and business models of the sector bring important challenges to be overcome.

• The Brazilian power matrix is recognized as
renewable because it was built mainly based on hydraulic generation. Over the years, fossil thermal and nuclear sources were introduced in the matrix, leading to a hydrothermal matrix, with majority flow and on the basis of hydraulic source and complementary thermal flow. With the dissemination of concepts related to sustainability included in the political agenda of several countries - and also due to water difficulties faced in the last years - the Brazilian power matrix needs to be renovated and diversified. It becomes even more relevant in this scenario to discuss about possible impacts and dilemmas from an inexorable transformation of the Brazilian electric mix.
• From this scenario, FGV Energia brings another publication: FGV Energia Supplementary Renewable Energies Booklet - FRE. The purpose of the Booklet is to bring a vision on the theme, noting possible impacts of including FRE in the matrix and the system, and to promote discussions about the theme. We will introduce some concepts, as well as a brief description of technologies comprising such new sources in the first chapter. In the second chapter, we will address the global and Brazilian scene, reporting the current inclusion stage in major world markets. In the third and last chapter, we will address some of the dilemmas that need to be discussed and faced in order to achieve a sustainable energy mix.


Initial Concepts The so-called conventional power sources1 already present a very high competitiveness level due to past technology advances. However, due to related discussions primarily related to environmental matters and energy independence and safety, new technologies were developed to supply power - alternative sources of power. All of these technologies have a characteristic in common: they use a primary energy2 source considered renewable. The renewability of these sources occurs through their continuous cycles that will be repeated in relatively short periods of time - unlike fossil fuels used in the conventional generation, which have a period of formation of millions of years and are present in the nature in limited quantity. Some renewable sources for the generation of power already exist in commercial scale such as wind, solar photovoltaic, biomass thermal and mainly hydraulic. Large hydraulics usually have regularization reservoirs, being called controllable power plants. New arrangements of
large power plants are being designed without regularization reservoir (run-of-river) in order to reduce flooded areas and environmental impacts. Some smaller power plants with low environmental impact can be classified as Small Power Plants
1. In this publication, fossil fuel and nuclear thermal and large power plants will be considered conventional
power sources. 2. Primary energy is any form of power available in the nature before being converted or transformed.

- PCH according to a few regulatory specifications that will be reported later. Within the concept of renewable sources that will be addressed in this document, the so-called Supplementary Renewable Energies (FRE) only include PCH. Renewable sources have an intrinsic and common characteristic: they all present variability3 in the availability of energy resource. Variability is defined as the fluctuation in power or energy delivery presented by a source due to the energy resource availability - which may vary because of the weather, plant location and period of the year (or even the day). Wind and photovoltaic sources may undergo a sudden drop in power delivery due to reduced intensity in power resource. Thus, these sources are considered high variability FRE. In the case of PCH and biomass, the availability of the power resource is more constant at least for a time of the year - during the dry period, in the case of PCH, and in crops, for the case of biomass - then being considered low variability FRE. Another aspect related to renewable generation is the dispatchability. A technology is implementable when it can be triggered when
the system operator requires. FRE are not considered dispatchable once they only start to operate when the power resource triggering the generation plant is available.4 The concept of dispatchable source also comprises a technology’s flexibility. Such concept has two forms: (i) from a technical point of view, it happens when a source achieves optimal operation quickly (a few minutes) and can be turned on and off/reduced several times within a short time; or (ii) from the economic and financial point of view, for contract terms of fuel supply. That is, flexible sources can be used to better optimize the dispatch to meet the load. Alternative renewable sources are considered variable and non-dispatachle and thus do not have a flexibility level.5 Thus, these sources usually act supplementing conventional sources, which are dispatched on load basis - hence the term FRE. There are several ways to reduce FRE variability. One of them would be through energy storage, which will be further detailed below. However, storage technologies still do not have economic feasibility. Today, developing these technologies is a major challenge for the industry of renewable power sources. On the other hand,
3. In the case of forest biomass thermal plants, depending on the project, they may provide steady energy to the
system. 4. Controllable, fossil thermal en nuclear power plants are considered dispatched plants. 5. Forest biomass thermal plants, depending on the project, may present dispatch possibility.

GHG emission levels in FRE generation are significantly lower than those of conventional thermal sources, and generate less waste and thus are technologies that have low environmental impact.
In addition, using these resources is also an advantage from the strategic point of view once they reduce the dependence on foreign fuels6 to generate electricity.
FRE TECHNOLOGY
SMALL CENTRAL POWER PLANTS (PCH) PCHs do not have large reservoirs; therefore, their generation varies according to the period of rain. Its productivity depends on the available flow and water drop height - so the most favorable locations to install these plants are rivers with steep slopes. Its greater advantage is the greater simplicity in project design and implementation steps, and operation. Through Brazilian regulatory definition, PCHs installed power varies from 3 to 30 MW and their reservoirs have smaller areas than 13 km2, excluding the channel of the regular riverbed. WIND POWER Wind power consists in turbines that convert kinetic wind power into electricity. Wind power is only available when wind speed reaches certain minimum and maximum levels, and generation varies depending on such speed. It is an extremely low operating cost source, almost zero, which means it is a priority in the system operator dispatch whenever it is available. However, its low predictability and high variability increase the uncertainty in generation. Wind parks installed dispersedly tend to present lower variability risks than a single park. Thus, countries where wind potential is spread have greater advantages exploring this source than countries with a limited geographic potential. Technology developments over the past two decades have improved this source’s performance and equipment reliability, making the installation cost drop considerable and being already competitive in relation to conventional sources in places where wind conditions are favorable. SOLAR POWER Solar power is the most abundant source of power in the planet and can be reused through two different types of plants: (i) photovoltaic, which consists in photovoltaic panels installed in the same relatively large area, usually made of silicon, capable of converting sunlight directly into electricity; and (ii) heliotherm focused on electricity generation by heating a fluid and working similarly to a conventional thermal plant. Out of these two, photovoltaic technology is being proved as the most competitive one. In the global market, the cost of solar modules presented a 5-time reduction in the last 6 years and its expansion is being faster than expected. Despite the drop in prices, this source still needs incentive mechanisms to reach competitive levels. However, its operational cost, as in the wind energy, is almost zero. Therefore, this source should be always given dispatch priority when available. Solar power also has high variability varying the level of direct sun radiation, which changes due to the day of the years and place, and also instantaneous conditions as the presence of clouds.
CONTINUES ► 6. Pereira, Camacho, Freitas, & Silva, 2012.

FRE TECHNOLOGY
BIOMASS THERMAL The main biomass advantages related to fossil fuels are in the low amount of toxic elements and the fact that the biomass has neutral GHG emissions. While biomass is being cultivated, atmosphere carbon is being stored due to the process of photosynthesis. When there is combustion of biomass the same carbon stored is released again, so that this cycle has neutral GHG emissions. The efficiency of this source is quite variable because the composition of the biomass depends on the raw material growth conditions. In general, the biomass has low energy density if compared to fossil fuels. However, this technical disadvantage is offset by the environmental gains provided by this source. But biomass cultivation for energy use is arguable’ due to the confrontation with the agricultural and food industry. Thus, the trend is to have a power biomass use from by-products of other industrial processes as in the case of ethanol and sugar, through sugarcane bagasse.
STORAGE As previously described, one of FRE major disadvantages is the fact that it does not guarantee continuous power supply for the system due to variability in renewable energy resources availability. Despite all the advantages related to environmental issues, energy independence and use of a low-cost energy resource, the variability of such sources may cause undesirable impacts in the operation of a system with high inclusion of FRE. One of the factors that may reduce such impacts in the system is energy storage. From the point of view of a centralized system , the most common form to store energy - andwith the lowest cost - is through
conventional power plants reservoirs. Depending on the design, the useful volume of these reservoirs can have multiannual regularization, which ensures good availability of hydroelectric power throughout the operating year. Other technologies can be used for storage; however, at a lower scale and for small time intervals.7 These have the task of shaping the energy load to the instant demand curve; however, they are not yet used on a large scale in the world. On the other hand, in a distributed system - in which electricity generation will also be in residences, shopping centers and industries, and not only power plants dispatched
7. The storage technology that most stands out for small time intervals is Pumped Hydro Power Plants that have
two reservoirs (one upper and one lower), used for daily regularization. Other storage technologies are mainly several batteries and others still being tested.

by a central operator - energy storage may represent a change in the power sector paradigm. For presenting a modular nature, FRE (especially solar photovoltaic) have great potential to be an alternative generation source in the consumer unit close to the load center, without incurring power transmission costs. However, distributed generation was not fully established, mainly due to the high costs of
distributed storage technologies, making the consumer/generator unit still depend on centralized generation. New and promising technologies are emerging in the market, with an interesting potential of costs reduction and that may promote an intense reorganization of the power sector in the world, as in the case of Tesla batteries.
Distributed Storage Technology Chemical batteries tend to be used for storage on a small scale. The American company Tesla Motors started to invest heavily in highly efficient lithium-ion batteries, with the initial aim of storing electricity in electric car engines. However, this new technology may also be used in residences to storage distributed power. This device is expected to allow FRE producing units to storage it during lower consumption periods and thus disconnect entirely from distribution networks - which would mean a major technological breakthrough in the current power sector model, in addition to being a great solution for remote locations. Among the different types of batteries, the lithium-ion battery showed the largest decline in cost, from U$ 2,000/kWh in 2009 to approximately U$350/kWh. A rechargeable lithium-ion battery with 7 kWh capacity today costs approximately US$ 3,000, while the model with capacity to 10 kWh (enough to supply for a 4-people house for nearly 5 hours) costs US$ 3,500. Such price tends to drop even more after the inauguration of Gigafactory, expected for 2017. The Tesla plant, in partnership with Panasonic, received investment of US$ 5 billion and is expected to increase total storage capacity for this type of technology to 35 GWh by 2020.
CONTINUES ►

FIGURE 1: TESLA MOTORS POWERWALL BATTERY
Source: Tesla, 2015
Weight 100 kg
Powerwall 10 kWh Rechargeable lithium-ion battery with temperature control by liquid.
Storage 10 kWh. Enough to supply for a 4-people house for almost 5 hours.
Continuous supply 2 kW, with peaks of up to 3.3 kW
Voltage 350-450 volts
Modularity Up to 9 units can be couple together to obtain 90 kWh
Warranty 10 years
Price US$ 3,500
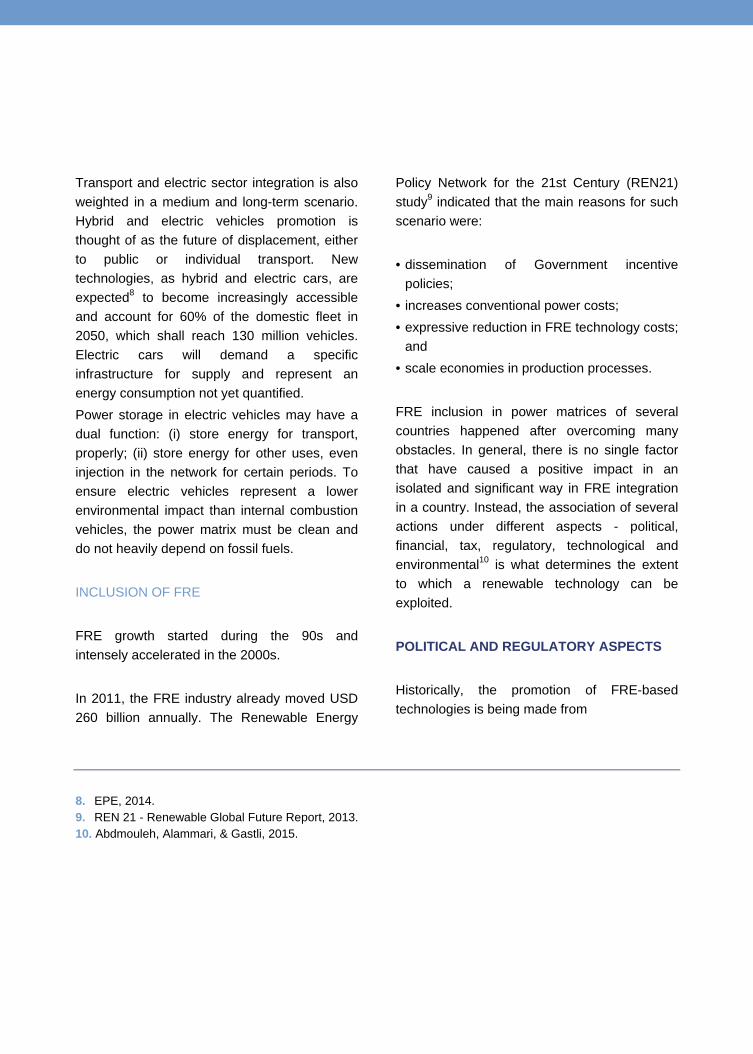
Transport and electric sector integration is also weighted in a medium and long-term scenario. Hybrid and electric vehicles promotion is thought of as the future of displacement, either to public or individual transport. New technologies, as hybrid and electric cars, are expected8 to become increasingly accessible and account for 60% of the domestic fleet in 2050, which shall reach 130 million vehicles. Electric cars will demand a specific infrastructure for supply and represent an energy consumption not yet quantified. Power storage in electric vehicles may have a dual function: (i) store energy for transport, properly; (ii) store energy for other uses, even injection in the network for certain periods. To ensure electric vehicles represent a lower environmental impact than internal combustion vehicles, the power matrix must be clean and do not heavily depend on fossil fuels. INCLUSION OF FRE FRE growth started during the 90s and intensely accelerated in the 2000s. In 2011, the FRE industry already moved USD 260 billion annually. The Renewable Energy
Policy Network for the 21st Century (REN21) study9 indicated that the main reasons for such scenario were: • dissemination of Government incentive
policies; • increases conventional power costs; • expressive reduction in FRE technology costs;
and • scale economies in production processes. FRE inclusion in power matrices of several countries happened after overcoming many obstacles. In general, there is no single factor that have caused a positive impact in an isolated and significant way in FRE integration in a country. Instead, the association of several actions under different aspects - political, financial, tax, regulatory, technological and environmental10 is what determines the extent to which a renewable technology can be exploited. POLITICAL AND REGULATORY ASPECTS Historically, the promotion of FRE-based technologies is being made from
8. EPE, 2014. 9. REN 21 - Renewable Global Future Report, 2013. 10. Abdmouleh, Alammari, & Gastli, 2015.

Besides setting Energy Policy goals associated to the greater inclusion of FRE, softening regulatory issues by defining clear rules for the market is necessary
guidelines established by the governors of a country in their Energy Policy. Many assumed, for example, the inclusion of FRE in their matrices through GHG emission reduction goals or related to sustainable development. Others, for geopolitical matters, in order to stop having to import fuels for power generation. However, in order to achieve expressive development of such sources, besides setting Energy Policy goals associated to the greater inclusion of FRE, softening regulatory issues by defining clear rules for the market is necessary. Thus, risks associated to projects are reduced, thus attracting the participation of different players. The public interest to disseminate FRE also favors the introduction of financial incentive mechanisms so as to enable projects whose costs are not yet competitive, but considered interesting for the country due to its Energy Policy.
As a form of inducing investments risk, regulatory instruments are important to encourage the FRE market. Such instruments can be implemented through different mechanisms that can be generally classified in two categories: (i) energy purchase mechanisms; and (ii) mechanisms of access to the connection network. Arrangements in energy purchase mechanisms ensure that there will be market to acquire energy from a certain source. For mechanisms of access to the connection network, the regulation enables access of the generation system to the network, thus ensuring the flow of energy generated by the current system. FINANCIAL AND TAX ASPECTS FRE projects not only present a high initial investment compared to conventional sources, but are also of high risk due to the innovative technology and uncertainty in resources availability in some cases. Still, ERCs are

Regulatory Alternatives to Promote FRE Feed-in-Tariffs (FiT): Energy purchase arrangements with fixed prices for electricity generated by FRE with long-term agreements (15-20 years) and purchase obligation of such power by utility companies. These prices are pre-established by the Government, usually above power prices of other conventional sources and vary according to the source of FRE. Power auctions: Made to enable the contracting of a pre-determined amount of power under a long-term PPA11 (15-30 years). Competition in the auction can be intrasource (in the cause of specific auctions for each source) or intersources (when there is more than one source in the same auction). The auctions system encourages intrasource competition, making the best projects of each technology win the action and resulting in reduced significant costs for several technologies. On the other hand, in the case of auctions with different sources participating, FRE projects may not be as competitive with other technologies. However, compared to FiT auctions tend to provide less guarantees for developers mainly because of uncertain occurrence frequency and long periods between auctions. Renewable Portfolio Standard (RPS): Regulatory term that requires supplier companies or group of power consumers to produce or use a certain part of their power from FRE. Green Pricing Schemes: Consists in the payment of a voluntary premium by consumers to support the generation of FRE electricity. Green Certificates: Certificate obtained to ensure the generation of a power unit from FRE, usually 1 MWh of electricity. Such certificates can be combined to achieve RPS and also promote a tool for trade between consumers and generators.
11. Power Purchase Agreement.

are usually lower scale technologies and their greatest potential lies precisely in smaller - and often decentralized projects. In this context, the role of the Government has been essential in the early stages of technology development, and also in commercial scale technologies’ development. Structures and conditions can be created to encourage initial incentives by financial entities in specific technologies. On
the financial side, incentives can be created as the fund with attractive rates and conditions, provided that the source is renewable. Other types would include market guarantee with purchase price that enable projects. On the fiscal side, incentives could be used in two ways: (i) exemption/reduction for FRE, which caused low social and environmental impact; and/or (ii) surcharge of conventional generation by such externalities.

TECHNOLOGICAL ASPECT In early development stages, FRE needed to overcome technology and economic barriers, which can be accelerated through public sector incentive and funding programs for R&D. Such programs help to reduce capital and operating costs, improve the efficiency of these technologies and increase their reliability. Progresses in storage technologies and greater intelligence of the electrical systems in the world allows for a greater penetration of renewables without damaging energy safety. As they mature, technologies provide innovative options for policy, regulation and market. ENVIRONMENTAL ASPECT Air quality is being affected in several countries due to increased consumption of power mainly through fossil fuels. In fact, 84% of total emissions of
CO2 and 64% of GHG emissions globally come from the power sector.12 Thus, environmental concerns are being increasingly highlighted in the international scenario. With the diffusion of carbon footprint13 in the 90s, environmental pressure is being conducted in countries that have large amounts of carbon emissions as a result of power generation from coal thermal, fuel oil and natural gas. ERCs are being included in the matrices of several countries. Technologies are being increasingly enhanced, thus causing an impact in generation plants’ efficiency and reliability, as well as in power costs. To include these new technologies, several aspects equally important should be noted in order to make such inclusion efficient. Several countries already presented high levels of renewable participation, thus reducing emissions and diversifying their matrices. Brazil is also being positions with the annual contracting of thousands of FRE mega-watts.
12. Abdmouleh, Alammari, & Gastli, 2015. 13. Carbon footprint measures the total quantity of greenhouse gas emissions caused directly or indirectly by a
person, organization, event or product.


Outlook for Commercial FRE Most countries have enacted policies to regulate and promote renewable sources in the power sector, influenced by the need to mitigate climatic changes, reduce the import of fossil fuels, develop more resilient and flexible power systems and create economic opportunities. Until 2014, the world had already installed 700 GW of capacity in renewable sources. EUROPEAN UNION Mainly guided by socio-environmental and climatic matters, the European Union understood the need to formulate an effective strategy to change the power matrix in Member States since 1980. Several policies were
created gradually until today in order to include FRE generation participation in the EU, addressing regulation, technology aspects and financial incentives. Today, still motivated by its 20-20-20 policy in 202014, some Member States of the EU stood out in relation to the installed capacity of FRE technologies as Germany.15
14. Goal of 20% reduction in GHG emissions to 1990 levels, increase for 20% of participation in energy
consumption from renewable sources and increase in 20% of energy efficiency by 2020. 15. Ernst & Young, 2015.

CHART 1: INSTALLED CAPACITY OF SELECTED RENEWABLES IN THE WORLD, 2006-2014 (MW)
Source: Prepared by the author from IRENA data, 2015. * Others - Tidal+Geothermal+Heliotherm ** Wind - Onshore+Offshore *** Biomass - Solid Biomass+Renewable Waste+Biogas+Biofuels UNITED STATES Due to the greater autonomy, several initiatives were adopted by different states in order to respond to the growth of popular interest in a renewable power matrix and less intensive in
carbon. In general, the implementation of such incentive policies is encouraged by diversification, decarbonization and decentralization16 pillars along with plans to reduce dependence on imported fuels
16. Carley, 2009.
Wind**
MW
Photovoltaic Small Power Plants (< 10 MW) Biomass*** Others*
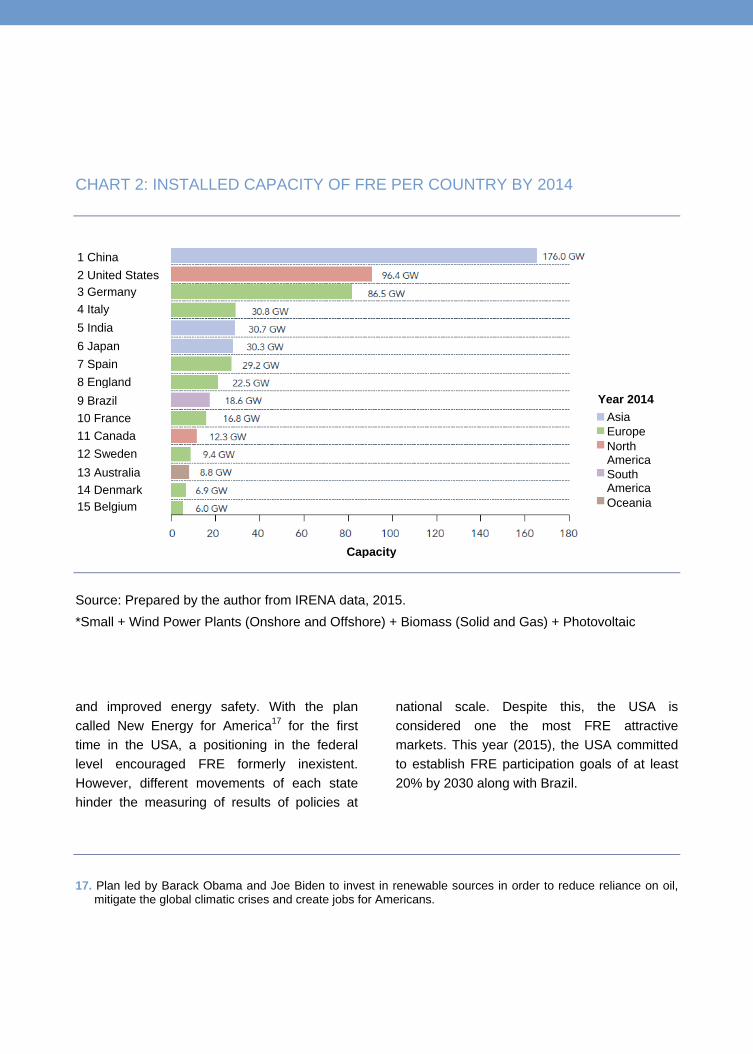
CHART 2: INSTALLED CAPACITY OF FRE PER COUNTRY BY 2014
Source: Prepared by the author from IRENA data, 2015. *Small + Wind Power Plants (Onshore and Offshore) + Biomass (Solid and Gas) + Photovoltaic
and improved energy safety. With the plan called New Energy for America17 for the first time in the USA, a positioning in the federal level encouraged FRE formerly inexistent. However, different movements of each state hinder the measuring of results of policies at
national scale. Despite this, the USA is considered one the most FRE attractive markets. This year (2015), the USA committed to establish FRE participation goals of at least 20% by 2030 along with Brazil.
17. Plan led by Barack Obama and Joe Biden to invest in renewable sources in order to reduce reliance on oil,
mitigate the global climatic crises and create jobs for Americans.
1 China 2 United States 3 Germany 4 Italy 5 India 6 Japan 7 Spain 8 England 9 Brazil 10 France 11 Canada 12 Sweden 13 Australia 14 Denmark 15 Belgium
Year 2014 Asia Europe North America South America Oceania
Capacity

TABLE 1: RANKING RENEWABLE ENERGY COUNTRY ATTRACTIVENESS
INDEX (RECAI) OF FRE MARKETS ATTRACTIVENESS
Rank Previous Rank Market RECAI
Index
Specific Rank per Technology
Wind Onshore
Wind Offshore Photovoltaic Heliotherm Biomass Geothermal Hydraulic Sea
1 (1) China 75.8 1 2 1 3 1 13 1 16
2 (2) USA 73.4 2 8 2 1 2 1 3 9
3 (3) Germany 66.5 3 3 5 27 8 8 10 27
4 (5) India 64.1 5 16 4 5 15 14 6 11
5 (4) Japan 63.0 14 9 3 26 3 3 4 10
6 (6) Canada 60.4 4 12 11 23 13 18 5 6
7 (7) France 59.0 9 7 7 27 9 15 15 5
8 (8) United Kingdom 58,2 11 1 13 27 5 20 25 2
9 (9) Brazil 57.0 6 25 10 8 4 32 2 24
10 (10) Australia 56.2 19 19 9 9 20 11 24 12
11 (11) Chile 55.6 25 22 6 2 21 10 17 14
12 (13) The Netherlands 54.3 12 4 23 27 10 24 32 30
13 (15) South Africa 54.0 18 28 8 4 33 35 18 19
14 (14) Belgium 53.6 26 5 19 27 11 21 29 31
15 (12) South Korea 52.3 23 14 12 24 12 28 16 3
16 (16) Italy 52.1 24 21 15 11 14 7 14 23
17 (18) Turkey 52.0 10 24 26 14 34 6 9 20
18 (17) Denmark 51.8 13 6 32 27 16 35 36 17
19 (20) Sweden 51.4 8 11 36 27 7 26 12 13
20 (22) Mexico 50.6 17 30 16 18 31 9 30 21
Source: Ernst & Young, 2015.

ASIA The markets that most stand out in the advance of FRE in Asia are China, India and Japan. After enacting the Renewable Energies Act in 2005, China presented expressive growth in FRE offer and now is the greatest global market with approximately 180 GW installed. However, its power matrix remains predominantly thermal with a representative inclusion of coal. Encouraged by the diversification in its matrix and reduced local emission of pollutant gases, which have great impact in public health, China intends to increase the renewable participation in its matrix. In India, FRE had a significant increase in participation in its power matrix and the country represents one of the largest global markets with great attractiveness. In 2008, the Federal Government launched the National Action Plan on Climate Change (NAPCC) consisting in 8 core missions, one of which is the Jawaharlal Nehru National Solar Mission (JNNSM). The greatest purpose of the solar mission was to achieve rate parity from solar technologies in 2022, with a 20 GW capacity - expected to increase to 100 GW by 2030 and 200 GW by 2050. Japan has energy safety as its main purpose,
also presenting expressive goals to reduce GHG emissions. Nuclear expansion was rethought by its governors after Fukushima accident in 2011, but it is now being resumed. However, the scarcity of fossil energy resources makes Japan find an alternative in FRE being ranked 4 in the installed capacity ranking of these sources. AFRICA The North African region located in the sun belt, comprised by Morocco, Algeria, Tunisia, Libya and Egypt, have great physical potential for FRE development, particularly wind and solar sources. This region not only draws the attention of local Governments, but also Europe due to the geographic proximity and for already having an incipient possibility to interchange electricity between the continents. There is a strong current, represented by Desertec18 concept, spreading the existence of a robust transmediterraneum system in a medium- or long-term horizon, thus promoting greater decarbonized electrical supply for Europe and a significant increase in FRE participation in these countries - now based on fossil fuels, especially natural gas. However, important geopolitical matters are preventing the feasibility of such projects.
18. Desertec Concept http://www.desertec.org/.

LATIN AMERICA Over the last 20 years, the economy and power consumption average growth in Latin America was greater than global averages, and electricity production more than doubled from 1991 to 2001. This region is known for having the cleanest power generation matrix in the
world in terms of carbon intensity. Currently, small and large power generation represents nearly 50% of the power matrix in this region. Fossil fuels with high environmental impact as fuel are being gradually replaced by natural gas and FRE have gained more prominence, representing 9% of current

Wind generation is promising with a total potential of 143 GW for towers 50 meters-high.
installed capacity in the continent. Ten countries (including Brazil) have official targets to increase FRE implementation. Chile established a goal to reduce GHG emissions in the power sector and intends to have 10% of its generation through FRE by 2024. Along with Mexico, the country has been achieving significant increases in solar and wind installed capacity. Uruguay is currently the continent country with the greatest development and foreign investments in FRE with the greatest wind per capita installed capacity in 2014. Brazil has also played an important role in this sense, mainly because it has 37% of Latin America installed capacity. This will be addressed below.
HOW IS BRAZIL NOW? Brazil has several energy resources throughout its territory, and the renewables are the most available ones. The Brazilian hydroelectric potential is one of the greatest in the world, reaching 260 GW, out of which only 35% is being used mainly in the Southeast region. Wind generation is also promising with a total potential of 143 GW for towers 50 meters-high, mainly in the Northeast and South Brazilian regions. If measures are made at greater heights, this potential may reach 500 GW considering the latest technology advances. The quality of Brazilian winds is also something that draws the attention as they are constant and without major sudden bursts.

We are located in the sun belt of the planet. The place with the worst irradiation in Brazil has better indices than the best place in Germany, the country with the greatest solar power market in the world.
From biomass, the potential is closely linked to the sugar industry, with waste from sugarcane bagasse, whose production is mainly concentrated in the Southeast and Northeast. However, since the agricultural industry is highly relevant for the country’s economy, Brazil also has potential to use other types of agricultural waste to generate power, if there is technology development for such. Lastly, solar power also has great potential since we are located in the sun belt of the planet. Solar irradiation throughout the Brazilian territory is interesting. As a comparison, the place with the worst irradiation in Brazil (the South) has better indices than the best place in Germany (also in the South), the country with the greatest solar power market in the world. Brazil has one of the largest interconnected power systems in the world, the National
Interconnected System - SIN. It is comparable to the European interconnected system with extensive transmission networks connecting the four subsystems: SE/CO, S, NE and N. SIN was designed to use energy power throughout Brazil, thus making power reach these places in case one of them had availability and the other hadn’t, and mitigating risks and stabilizing global energy costs. FRE availability in Brazil is supplementary to the hydroelectric regimen, especially in the Southeast, which has the greatest storage capacity. It is also supplementary to the SIN load especially concentrated in the Southeast. Wind generation reaches its peak in September/October when water availability is still not abundant in Brazil.19 Biomass generation, for being linked to
19. In Brazil, the wet period of the Southeast is during summer (November to February), while the dry period is in
the winter (June to September).
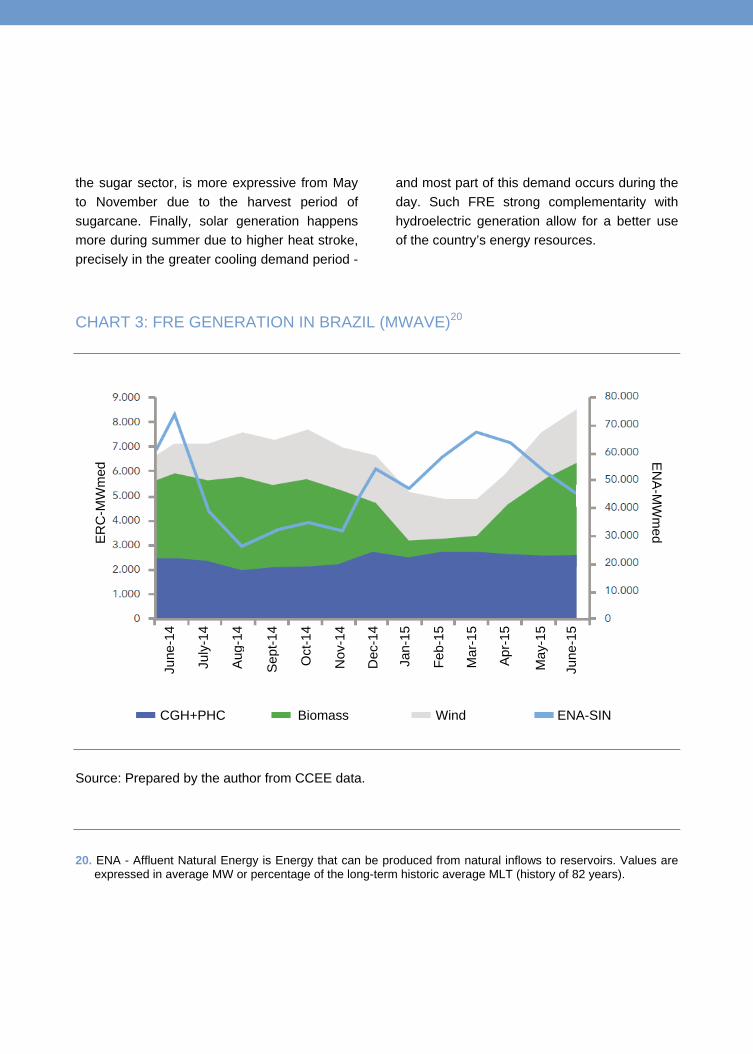
the sugar sector, is more expressive from May to November due to the harvest period of sugarcane. Finally, solar generation happens more during summer due to higher heat stroke, precisely in the greater cooling demand period -
and most part of this demand occurs during the day. Such FRE strong complementarity with hydroelectric generation allow for a better use of the country’s energy resources.
CHART 3: FRE GENERATION IN BRAZIL (MWAVE)20
Source: Prepared by the author from CCEE data. 20. ENA - Affluent Natural Energy is Energy that can be produced from natural inflows to reservoirs. Values are
expressed in average MW or percentage of the long-term historic average MLT (history of 82 years).
ERC
-MW
med
ENA-M
Wm
ed
June
-14
July
-14
Aug-
14
Sept
-14
Oct
-14
Nov
-14
Dec
-14
Jan-
15
Feb-
15
Mar
-15
Apr-1
5
May
-15
June
-15
CGH+PHC Biomass Wind ENA-SIN

PCH participation is also significant; however, its expansion has been restricted due to environmental matters.
After the 2001 rationing, its was noted the need to increase the offer of electricity with the expansion of other unconventional sources, in addition to hydrothermal dyad. To include electricity conversion technologies with renewable nature, the Federal Government launched the Program of Incentives for Alternative Sources - PROINFA, in 2002. The Program first established the expansion of 3.3 GW of installed capacity equally distributed among wind, biomass and PCH sources. Still, energy sale contracts would be entered into with Eletrobrás and generators for a 20-year period based on a reference value established by technology and set by the Ministry for Mines and Energy - that is, they would work as some kind of FiT. PROINFA is still in force and its costs are shared among all SIN consumers (except those benefited by the Social Rate). PROINFA is considered an important movement to include FRE in Brazil by sector agents.
However, since the inclusion of FRE in auctions in 2009 (LER 2009), FRE has been expanded rapidly in Brazil, especially the wind source. Annually, dozens of wind parks projects won Federal generation auctions and today this source already represents over 7 GW of installed capacity in the country.21 Biomass is also important in fluctuating renewable energy generation. Today, it is the first FRE and the third source in SIN installed capacity22 with almost 13 GW installed, only behind the natural gas hydroelectric and thermal source. Many sugar plants had the opportunity to increase their cash flow, investing in combined heat and power plants that use process wastes as sugarcane bagasse to generate electricity. PCH participation is also significant; however, its expansion has been restricted due to environmental matters.
21. According to ABEEólica data (http://www.portalabeeolica.org.br/). 22. According to BIG/ANEEL data (http://www.aneel.gov.br/aplicacoes/capacidadebrasil/capacidadebrasil.cfm).

CHART 4 - INSTALLED CAPACITY PER SOURCE IN 2015
Source: Prepared by the author from ANEEL data.
Agroindustrial biomass
Natural Gas
Solar
Forest Biomass+Others
Oil
Import
Wind
Water
Mineral coal
Nuclear

The Brazilian market is one of the ten most attractive FRE markets in the world
Solar photovoltaic expansion is still incipient and started to be configured with micro and mini generation projects due to its modular nature, since 2012, with the enactment of Normative Resolution 482.23 However, since 2014, the Government has been including solar source in power auctions to supply the regulated market. Several projects were enabled in Reserve Auctions 6 and 724 from solar source, thus exceeding 1.5 GW of installed power. The Brazilian market is one of the ten most attractive FRE markets in the world.25 The Brazilian commitment to encourage FRE development and participation in the matrix is
not solely encouraged by energy safety reasons. Despite not having a quantitative commitment for the reduction of GHG emissions set, such as the countries in Attachment I26 of the Kyoto Protocol,27 Brazil has several other commitments in its National Program on Climate Change (PNMC) that will culminate in reduced emissions. Among the mitigating measures, PNMC28 indicates that Brazil should:
“seek to maintain the renewable energy participation in the power matrix high, thus maintaining the stand out position Brazil always had in the international scenario”
23. In ANEEL Normative Resolution no. 482, dated April 17, 2012. 24. The Energy Reserve contracting mechanism was created to increase the safety of SIN electricity supply, with
energy from plants especially contracted for this purpose - whether for new generation projects or existing projects.
25. Ernst & Young, 2015. 26. Attachment I is the group of developed countries whose responsibility for reduced GHG emissions is
considered higher than developing countries. Countries are listed at http://unfccc.int/ parties_and_observers/parties/annex_i/items/2774.php.
27. The Kyoto Protocol was signed in 1998 defining specific goals within the United Nations Framework Convention on Climate Change.
28. National Plan on Climate Change (http://www.mma.gov.br/clima/politica-nacional-sobre-mudanca-do- clima/plano-nacional-sobre-mudanca-do-clima).

Self-Production and FRE - Honda Case Honda invested a total of R$ 100 million in the construction of a wind park in order to become self-producer of energy. The project was framed within REIDI (Special Incentive Scheme for Infrastructure Development) and launched in November 26, 2014 in the city of Xangri-lá, State of Rio Grande do Sul, in order to supply for the entire Sumaré plant power demand in the State of São Paulo. This plant has a production capacity of 120 thousand cars per year. Xangri-lá, in Rio Grande do Sul, was chosen to have the park installed since it already had a proper logistics and infrastructure scheme, in addition to a wind regime that favors power generation. The park has nine turbines of 3 MW each, totaling an installed capacity of 27 MW and annual generation estimated at 95 thousand MWh per year. Honda’s main reason for such an investment was to reduce GHG emissions. In order to increase sustainability in its production chain, the company established an emission reduction goal of 30% in all Honda plants in the world. In the case of Sumaré plant, this goal was exceeded and almost 50% of emissions are already avoided thanks to the use of wind power, which is equivalent to approximately 2.2 thousand tons of CO2 avoided per year, according to information provided by Honda Energy, subsidiary responsible for power generation. Honda also has plans to supply other plants in Brazil with wind power. Cars produced by the automaker in this plant receive a stamp, created by ABEEólica in partnership with ABRAGEL certifying that they were produced by 100% renewable sources. Initiatives like these are expected to be reproduced in other places by companies that seek to receive the certification seal.

This measure has been observed, given the rapid growth of FRE in the Brazilian matrix. FRE penetration, especially the wind, has been taking place mainly due to the power auctions scheme implemented in Brazil. Annually, the Government holds power generation auctions in order to promote energy contracting for the captive consumers market - the so-called Regulated Contracting Environment (ACR).29 Since 2007, the Government already conducted 22 auctions with FRE contracting. Self-production is another possibility for power acquisition, in which self-producers receive grant to produce their own energy and could eventually market the surplus of electric power generated. Some agents choose this type of generation, no longer depending on electricity
supply through the captive market or bilateral contracts for supply reaching some sort of independence in their consumption of electricity. FRE are increasing their participation in the world electricity generation. The world already presents over 700 GW installed and each year with expected expansion and new incentive policies being adopted. Brazil is not getting behind. With a predominantly renewable power matrix, each year thousands of MW are added both to supply the regulated market through generation auctions, and to the free market. However, some dilemmas with the significant inclusion of FRE are emerging and will be discussed below.
29. There are two types of energy trade options in the Brazilian market: Regulated Contracting Environment -
ACR, Free Contracting Environment - ACL. Most part of the power trade in Brazil is conducted through ACR. 30. ABDI, 2014.

Production Chain Development PCH: Today, the national industry has manufacturers qualified to meet the internal PCH market providing almost all hydromechanics and electric components as gates, valves, turbines and generators. National manufacture covers virtually all micro, mini and small power plant central application fields. One of the matters that decrease PCH industry competitiveness is the customization of projects without having a standard, as in the case of wind plants that reduce scale gains. Biomass: The biomass thermal plants components industry is almost 100% domestic. Brazil has manufacturers producing turbines, one of the components with highest added value, for average capacity biomass plants. Since most biomass plants are small or can be modulated with some medium turbines, the plants nationalization index is very high. Other components as boilers are also manufactured here. Wind: Brazil has two major production poles for large components in the wind industry: in the Northeast and South/Southeast region. There are assemblers and manufactures of wind turbines, towers and blades, and most part of components they use are produced domestically. Until recently, importing almost all components was very common. However, in 2012, the Brazilian Bank for Economic and Social Development - BNDES implemented incentives to develop the country’s production chain in order to gradually increase the local content for the wind generation equipment industry. The availability and internal cost of steel is one of the bottlenecks in local supply.30 Another important topic is the fact that part of components are imported, which makes local production feasibility depend on exchange. Solar: There is an intense debate about whether Brazil should develop the national industry of photovoltaic panels or not, including the production of silicon cells, or whether it should only focus on the assembly and installation of modules. Brazil has one of the largest global reserves of silicon, a raw material for the production of commercial photovoltaic cells. However, cell production is a technology-intensive process, thus it is argued that Brazil would not have comparative advantage or conditions to perform this step.


Expansion Dilemmas PLANNING, FINANCING OF EXPANSION AND COST OF POWER PDE 2024 indicates an average growth of the economy from 3.2% p.y. between 2015 and 2024, compared to an expected global average growth of 3.8% p.y. in the same period. In this scenario, Brazilian electricity consumption will increase at an average rate of 3.9% p.y., which would result in an annual average increase of the electricity load at SIN of 2.9 GWave in a ten-year horizon (from the current 62 GWave to 91 GWave). In terms of power expansion, the maximum demand of power is expected to grow 3.8 GW per year, also in the same horizon. According to the offer expansion planning, the hydroelectric expansion shall offer approximately 28 GW to SIN by 202731 (almost 57% of the total) with emphasis for Belo Monte
and São Luiz do Tapajós projects with 11,233 and 8,040 MW of total power, respectively. Hydroelectric expansion shall occur mostly in the North of the country and through hydroelectric without regulation capacity. The fossil thermal growth shall add 10.5 GW to the system in the ten-year horizon, reaching 14.3% in matrix participation. PDE places natural gas as the main fuel for the expansion of the electricity thermal offer (10%). However, fossil thermal expansion will depend on having fuel at a competitive price for future auctions, which also represents a major uncertainty. Regarding FRE offer expansion, PDE estimates it will go from the current 16.1% in power matrix participation to 27.3% in 2024, and shall mainly occur in the Brazilian Northeast region. This because the region has the highest wind and solar potential of the country. Expansion
31. Due to plants motorization, part of the capacity can only be added to the system after the ten-year horizon.

of wind source shall lead the renewable expansion since this source has been reaching competitive prices throughout its inclusion, since LER 2009, and shall contribute to 11.6% of the power matrix compared to the 3.7% in 2014. In turn, PCH should not achieve such competitiveness in auction projects and shall represent 3.8% (compared to 4.1% in 2014). Biomass may have a 8.7% participation and its electricity offer potential may come in two ways in Brazil: through forest biomass or as by-product of the sugar industry using sugarcane bagasse as fuel - currently the most common offer in the country. Lastly, solar power may also have its expansion with great potential in the Northeast reaching 3.3% of the power matrix installed capacity - today close to zero. However, it is still a very incipient market in Brazil with only small32 and R&D projects implemented. Its inclusion in the SIN has been made through reserve auctions until now. BNDES has been the main long-term funding agent for infrastructure investments in Brazil. The Bank has been an important instrument in the power sector to achieve the feasibility of
many projects, thus promoting attractive rates with high financing percentages for financeable items. The power sector has specific funding facilities for distribution, transmission and generation projects. Within generation projects, there is a division between renewable and non-renewable sources. Funding rates are the same for renewable and non-renewable - the difference is the percentage of financeable items. Renewables reach 70% - except power plants of over 30 MW in which the percentage is 50% - while non-renewables have the limit of 70% only fore Micro, Small and Medium Companies. Factors that most contribute to FRE projects’ feasibility are maximum funding and amortization term, which have greater incentives for FRE, as well as attractive rates that make projects more competitive. However, in the current Brazilian economic scenario, BNDES capacity to continue promoting FRE with as much attractive rates and conditions is uncertain. According to some news, BNDES has been restricting financing to 50% of FRE projects.33
32. Mini and micro generation projects related to REN 482 and in World Cup stadiums. 33. Available at: http://www.canalenergia.com.br/zpublisher/materias/Investimentos_e_Financas.asp?id=107575.
Access on: 10/21/2015.

CHART 5: EXPANSION OF GENERATION 2014-2024
Process gas
Diesel oil
Fuel oil
Coal
Uranium
Import
Natural Gas
ERC
Water
Source: Prepared by the author from EPE data

An alternative to increase the funded percentage are infrastructure debentures, which provide fiscal benefits and count on BNDES participation in their structuring. Investors trend in seeking supplementary funding mechanisms mainly with commercial banks is noted. Some of these already promote financial
support for renewable projects. However, interest rates and funding conditions are far from those offered by BNDES, which makes projects more expensive. Increased costs with funding will be reflected in the final power cost, and will end up causing an impact for consumers.
CHART 6: AVERAGE ANNUAL RATE OF ALL TYPES OF CONSUMERS - NOMINAL VALUES
Source: Prepared by the author from ANEEL data.

DIFFICULTY TO EXPAND PCH AND BIOMASS THERMAL PLANTS Average contracting of FRE in auctions reaches approximately 2.5 GW per year, despite being very different for each source. If we count only after the year that had the first inclusion of the
source in an ACR auction, the wind has the higher average with approximately 2GW/year, while biomass had an average of 500 MW/year and PCH only 100 MW/year. The solar, which was included only in 2014, is already the second source with the highest average of annual contracting.

CHART 7: EVOLUTION OF CONTRACTED POWER AND ANNUAL AVERAGE
PRICE CORRECTED IN ACR AUCTIONS WITH FRE
Source: Prepared by the author from CCEE and Acende Brasil Institute data. Monetary Adjustment IPCA (Sept./2015).
Biomass
Biomass average
PCH
PCH average
Wind
Wind average
Solar
Solar average
Biomass PCH Wind Solar

Biomass sugarcane power generation is strongly related to the sugar and ethanol market dynamics.
The causes for renewables expansion to be so different in ACR are questioned. One of the arguments addresses the fact that the ceiling price in auctions defined by EPE is not realistic for PCH and biomass, which makes many of the power contracts from PCH and biomass be performed in ACL. That is, there is a relative competitiveness difference between FRE and apparently wind has been showing better results among FRE. What explains the lower competitiveness in PCH and biomass sources compared to wind? Biomass in Brazil is closely linked to the sugar sector, and electricity is generated through combined heat and power and is a by-product
of sugar and ethanol production. Power generation is significantly higher when ethanol is produced - and lower when sugar is produced. Thus, biomass sugarcane power generation is strongly related to the sugar and ethanol market dynamics. Hydrated gasoline and ethanol compete in the liquid fuels market, being replaced products34 - in general, ethanol is more advantageous for consumers when its price is 70% below the gasoline price. Since the price of gasoline was being controlled in refineries over the past years, this has influenced the ethanol/sugar market and made it less advantageous for producers to choose the production of ethanol. As a consequence, electricity generation was also threatened.
34. Anhydrous ethanol is blended with gasoline to lower fuel price, increase its octane rating and reduce
emissions of pollutants.

Two factors may reduce the dependence of expanded power generation based on sugarcane on the fuels policy. The first one is linked to the technology development with a trend to use sugarcane straw thermo energy, previously disposed - not only bagasse - with the modernization of such plants, thus increasing the plant’s efficiency. In addition, the alcohol market development, not only for the
vehicle fuels industry but also for biochemistry has potential to grow. A second and extremely important topic is related to a proper policy of relative prices between fuels allowing greater transparency in the liquid fuels and other energies market. Damming the prices of gasoline in refineries had crucial impact in the ethanol market, thus affecting the feasibility of biomass projects.
CHART 8: TOTAL ETHANOL PRODUCTION AND ANNUAL AVERAGE PRICES
OF GASOLINE AND ETHANOL
Source: Prepared by the author from ANP data.
Prod
uctio
n –
Thou
sand
m³
Price R$/L
Production of hydrous ethanol + anhydrous (Thousand m³)
Price of hydrous ethanol Price of regular gasoline

Wind source has reached a greater competitiveness level than other FRE over the years.
Among the four FRE sources present in Brazil, PCH have the lower annual hiring average of installed capacity in ACR auctions. Some facts are relevant and cause a great impact on the sector. The first one is regarding difficulties with environmental licensing. Since its implementation often takes place in rivers that usually are not federal, licensing for such projects is granted by State environmental agencies and, eventually, municipal. It is estimated35 that the technical staff responsible for licensing such bodies is reduced and overloaded, thus hindering the release of projects that need their Prior Licenses36 to enroll in ACR auctions. Throughout over 10 years of ACR auctions with inclusion of FRE, several PCH projects almost
10 GW37, are waiting a technical analysis and are not authorized to participation in auctions. Because of this, projects risk increases significantly and affects costs and prices of power to be offered in auctions. With this, ceiling prices of ACR auctions for PCH end up not enabling such projects mainly because of the risks associated to environmental licensing. FRE expansion is unbalanced with a bias for wind contracting. In fact, the wind source has reached a greater competitiveness level than other FRE over the years. Some obstacles pointed to other sources certainly hamper the feasibility of projects that could be part of our power matrix and provide clean and renewable energy to the system.
35. ABRAPCH, 2015. 36. First in the licenses chain in the environmental licensing process in Brazil. 37. ABRAPCH, 2015.

Operation Dilemmas ERCS AND THE ROLE OF REGULARIZATION RESERVOIRS With a new matrix being characterized from a significant inclusion of variable sources, as in the case of FRE and run-of-river plants, the system operation will become more complex. Variability in sources increases uncertainty related to the energy resource availability, which causes investments in alternatives to cope with such variability. Still, there is a difference between power variability and energy variability. Power variability refers to the idea of instantaneous generation and is linked to a very short time period. Energy variability has a medium-long-term nature. Both problems should be faced in a different way. Power variability is seen in wind and solar photovoltaic sources. Wind may stop blowing in minutes, thus reducing turbine speed and a passing cloud can increase the effect of shading on the photovoltaic panels, sharply reducing the delivery of power. This can cause instability on the network. How to mitigate
power variability in these sources for the system? Since there is a set of parks with the same source concentrated in the same area, connecting them in the same point of the basic network is a possibility, thus making total generation of the set of parks become less variable than that of each park connected separately to the network. A second possibility would be through the hybridization of plants using the same point of connection to the system. For example, for the Brazilian case, which has greater wind and solar potential in the Northeast region, if a photovoltaic plant and a wind one were allocated in the same site it could mitigate power variability, if the wind regime was supplementary to solar generation - as in the case of the Northeast. Besides, hybridization may include other types of technologies - the Brazilian Northeast also has biomass generation potential, which could be used in case of low wind and solar availability at the same time. Lastly,

inclusion of energy storage through batteries could also be used; however, they still have an elevated price. In addition to hybridization and connection at the same point of the network, the expansion of flexible plants in the system is essential to cope with power variability of wind and solar sources. Flexible sources are represented by controllable power plants and modern thermal plants with source charge or fast starting time that generally use natural gas. Other issues as the improvement of methods and tools to estimate wind and wind generation, and the improvement of wind turbines and wind and solar plants performance to withstand impacts on the network would also help mitigating these
variations. All types of FRE present variability in power generation. However, FRE and the system hydrological regime are complementary to each other in a way. The new arrangement of large run-of-river power plants - that is, also variable and not dispatchable that sum approximately 30 GW - will promote a great power variability to the system in the wet period. In addition, other sources as fossil thermal and nuclear may act as supplementary. At first, regarding the technology to be used, the power variability problem is less complex than power variability. However, other matters related to energy planning may arise with an strategic and political nature hard to solve.

Controllable hydroelectric expansion with reservoirs have a restriction and will be well reduced - 885 MW out of 30 GW expected for hydroelectric expansion will have regularization reservoir. The expansion of storable energy will be 2.6 MWave and represents less than 1% of the total storable power by 2015. What will be the role of reservoirs in the system with FRE inclusion? If controllable power plants are intended to cope with FRE power variability, the sector
paradigm will be changed. Hydroelectric dispatch has always been made based on load, mainly because it is the cheapest power source in the system and for having rate mode as one of the pillars in the power sector model. With the current records of stored energy compared to system load, we note a reduced capacity of regularization evidencing a trend of reconfiguring the role of reservoirs in the system. Thermal dispatch may become the system’s basis, at least during some time in the operating year.
CHART 9: EQUIVALENT SUPPLY MONTHS
Source: Prepared by the author from ONS data.
Mon
ths

One of the ways to achieve emissions reduction goals and have rate mode, as well as to act reliably and safely in supply would be through the expansion of controllable power plants
However, if the role of reservoirs continues to be for dispatch on load basis, other sources with high flexibility to cope with FRE power variability should be implemented being represented by modern fossil thermal, usually of natural gas. INCREASE IN THERMAL DISPATCH, RATE MODE AND EMISSIONS Reconfiguring the current system operation forms predictable scenarios under two points of view. First, if fossil thermal dispatch increases the power price should increase once fossil thermal power generation costs are significantly higher than hydraulic, going against one of the pillars of the new power sector model, the rate mode. Second, GHG
emissions in SIN also tend to increase. One of the ways to achieve emissions reduction goals and have rate mode, as well as to act reliably and safely in supply would be through the expansion of controllable power plants since this technology is already implemented in Brazil. For example, the expansion in thermal dispatch in the triennium 13/14/15, influenced by unfavorable hydrological scenario, presented an increase in GHG emissions in SIN. However, there is also a very important aspect related to social and environmental impacts and climatic changes, since the hydroelectric expansion would take place in the North region causing the flooding of large areas with native forests in the Amazon.

CHART 10: INCREASED CO2 EMISSIONS DUE TO THERMAL DISPATCH
Source: Prepared by the author from ONS and MCTI data.
MW
med
Jan-
06
Aug-
06
Mar
-07
Oct
-07
May
-08
Dec
-08
July
-09
Feb-
10
Sept
-10
Apr-1
0
Nov
-11
June
-12
Jan-
13
Aug-
13
Mar
-14
Oct
-14
May
-15
tCO
2 /MW
h
Thermal generation Average annual factor (tCO2/MWh)

Business Model Dilemmas CHANGE OF THE POWER SECTOR PARADIGM: DG EXPANSION AND THE NEW BUSINESS MODEL OF DISTRIBUTION In addition to inclusion in ACR auctions, there is a major potential to include FRE in a decentralized way as distributed generation - especially solar photovoltaic. Resolution 482 was essential to expand micro and mini distributed generation and gave rise to a new figure in SEB: the generator/consumer unit. Unit generation is primarily targeted to self-consumption with eventual injections of power in the distribution network. This injection causes a virtual storage of power on the network to be used at another time by the unit, thus promoting a bidirectional flow of electricity in the network.
Such fact causes an increase in the operation and maintenance complexity requiring investments in the network’s modernization and intelligence. In the current power sector model, Brazilian utility companies play the role of distribution itself, offering the so-called “wire service”. Moreover, they are responsible for the forecast of demand in their concession area, so that they can hire the necessary power in ACR auctions. Compensation comes from rates, which are different depending on the consumer group. For Group B - captive low voltage consumers - the energy rate is monomial.38 With this, there is no difference
38. Monomial rate is the rate of power supply comprised by prices solely applicable to active power consumption
and does not discriminate the remuneration of the various services associated with energy that reaches consumer units.

between what is compensated by the distribution service or the power purchase service. In a scenario of decentralized power generation, this rate mode can bring important aspects for utility companies’ business. With the inclusion of micro/mini distributed generation, the binomial rate model that includes a rate for power consumption and
another related to the use of the distribution network is more proper. Still, the distribution rate could also be itemized among power delivery services where all connected consumers should pay, and injection services in which only micro/mini generators would pay. Being aware of the transaction costs arising from such transformations to be properly addressed is important.

Expansion of FRE participation under the form of distributed generation needs to be followed by an adjustment of the current regulatory model and power sector businesses.
These rate arrangements could enable the participation of several trade agents in the same distribution concession area, causing a competition with possible efficiency gains and reduced energy costs. In this scenario, utility companies would only be responsible for the management and operation of its distribution assets. Clearly there would be an important transformation in the current business model of the power sector bringing several impacts for the several sector agents - in particular, for utility companies. Thus, expansion of FRE participation under the form of distributed generation needs to be followed by an adjustment of the current regulatory model and power sector businesses. For being generally based on variable energy resources, the distributed generation will still depend on the network when the generation of the system installed in the unit is low. However, as described in Chapter 1,
some technology advances in relation to power storage are being made, and such products are becoming more commercially viable. The promotion of hybrid and electric cars technologies and the integration of transport means to the power sector is also advancing, even though without a forecast of its large scale commercial feasibility. Finally, a scenario of greater inclusion of distributed generation and new technologies will require investment in intelligence and modernization of the network. Such investments enabled to leverage the benefits of distributed generation, optimizing resources, increasing efficiency and bringing new possibilities for services to be made available to consumers. On the other hand, the necessary investments are enormous, and ultimately will be passed on to the consumer. How to enable such investments in the current scenario with higher rates and funding difficulties?

CONCLUSION AND FINAL CONSIDERATIONS FRE inclusion in power matrices of several countries is being made fast. In order to increase energy independence and safety, and also address social and environmental matters closely related to GHG and air pollutant gases emission, the strategy in the power sector - main responsible for GHG emissions globally - is the increased participation of power generation technologies with low environmental impact. This trend is no different in Brazil. Despite having one of the most renewable power matrices in the world for having its generation basis from hydraulic source, following the global trend, Brazil has been expanding FRE inclusion in its energy mix in order to maintain the renewable nature of its power matrix. With the abundant and often supplementary energy availability of renewable sources in its territory, Brazil has great potential to use several generation technologies from the main renewable sources - biomass, PCH, wind and solar.
However, FRE expansion in the power matrix is being followed by important dilemmas. The regulation and business model were created when the system was purely hydrothermal, with hydropower dispatch in the basis and supplementary thermoelectric. With the expressive inclusion of FRE in the system, updates and even changes in the system’s expansion and operation, not only in practice, but also in relevant regulation, should be made to make the system more robust and reliable bringing efficiency and low cost on rates. Through this Booklet, FGV Energia brought dilemmas and raised some questions observing some possible impacts FRE can bring to the system. After launching this Booklet, FGV Energia intends to continue the due searches by promoting discussions and debates, listening to sector and Government agents not only about the dilemmas addressed in the document, but also other relevant dilemmas, that were not indicated in our analyses.
LIST OF ACRONYMS ABEEólica - Brazilian Association of Wind Energy
ABDI - Brazilian Association for Industrial Development
ABRAPCH - Brazilian Association of Small Hydropower Plants Development
ACR - Regulated Contracting Environment
ACL - Free Contracting Environment
ANEEL - Brazilian Electricity Regulatory Agency
ANP - Brazilian National Agency of Oil
BIG - Information Generation Bank
BNDES - National Bank for Economic and Social Development
CCEE - Electric Power Trade Board
CGH - Hydroelectric Generation Central
ENA - Affluent Natural Energy
EPE - Energy Research Company
FRE - Fluctuating Renewable Energies
USA - United States of America
FiT - Feed-in-Tariff
GHG - Greenhouse Gases
IPCA - Brazilian Broad Consumer Price Index
IRENA - International Renewable Energy Agency
JNNSM - Jawaharlal Nehru National Solar Mission
LER - Reserve Energy Auctions
MCTI - Ministry of Science, Technology and Innovation
NAPCC - National Action Plan on Climate Change
OFA - Other Alternative Sources
ONS - National Electric System Operator
OPEX - Operational Expenditure
PCH - Small Central Power Plants
PDE - Ten-Year Energy Expansion Plan
R&D - Research and Development
PLD - Settlement Price for Differences
PPA - Power Purchase Agreement
PNMC - National Climate Change Program
PROINFA - Program of Incentives for Alternative Sources
RECAI - Renewable Energy Country Attractiveness Index
REIDI - Special Incentive Scheme for Infrastructure Development
REN 21 - Renewable Energy Policy Network for the 21st Century
REN 482 - Normative Resolution 482
RPS - Renewable Portfolio Standard
SEB - Brazilian Electricity Sector
SIN - National Interconnected System
EU - European Union
UHE - Power Plant

Bibliography ASSOCIAÇÃO BRASILEIRA DE ARMAZENAMENTO E QUALIDADE DE ENERGIA. Fundamentos básicos das tecnologias de armazenamento de eletricidade. Belo Horizonte: ABAQUE (2015). Available at: http://www.abaque.com. br/uploads/armazenamento-energia.pdf. Access on: September 21, 2015. AGÊNCIA BRASILEIRA DE DESENVOLVIMENTO INDUSTRIAL. Mapeamento da cadeia produtiva da indústria eólica no Brasil. Brasília: ABDI (2014). Available at:http://www.abdi.com.br/Estudo_Backu p/Mapeamento%20 da%20Cadeia%20Produtiva%20da%20Ind%-C3%BAstria%20E%C3%B3lica%20no%20Brasil.pdf. Access on: September 24, 2015. Abdmouleh, Z. et al. Review of policies encouraging renewable energy integration & best practices. Renewable and Sustainable Energy Reviews, 45, pp. 249-262 (2015). ASSOCIAÇÃO BRASILEIRA DE ENERGIA EÓLICA. ABEEólica. Available at: http://www. portalabeeolica.org.br/. Access on: 09/05/2015. ASSOCIAÇÃO BRASILEIRA DE FOMENTO ÀS PEQUENAS CENTRAIS HIDROELÉTRICAS.
Relatório ABRAPCH 003/2015 - As Origens da Crise do Setor Elétrico Brasileiro 2013-2015. Curitiba: ABRAPCH (2015). Available at: http://abrapch.com.br/biblioteca-2/. Access on: 10/28/2015. AGÊNCIA NACIONAL DE ENERGIA ELÉTRICA. Atlas de energia elétrica do Brasil - 2a edição. Brasília: ANEEL (2005). Available at: http://www. aneel.gov.br/aplicacoes/atlas/download.htm Acesso em: August 4, 2015. _______. Banco de Informações de Geração. Available at: http://www.aneel.gov.br/aplica- coes/capacidadebrasil/capacidadebrasil.cfm. Access on: October 10, 2015 _______. Resolução Normativa 673 de 04 de agosto de 2015. _______. Resolução Normativa 482 de 17 de abril de 2012. _______. Tarifa Média por Classe de Consumo e por Região. Available at: http://www.aneel.gov.br/area. cfm?idArea=550 Access on: October 10, 2015

AGÊNCIA NACIONAL DO PETRÓLEO. Série Histórica do Levantamento de Preços e de Margens de Comercialização de Combustíveis Available at: http://www.anp.gov.br/?pg=66510. Access on: October 4, 2015. BANCO CENTRAL DO BRASIL. Relatório Focus de 16 de outubro de 2015. Available at: http://www.bcb.gov.br/?FOCUSRELMERC. Access on: October 18, 2015. BANCO NACIONAL DE DESENVOLVIMENTO ECONÔMICO E SOCIAL. Geração de Energia e Vapor Renovável. Available at: http://www. bndes.gov.br/SiteBNDES/bndes/bndes_pt/ Institucional/Apoio_Financei ro/Produtos/FI- NEM/energia_geracao_vapor_renovavel.html. Access on: October 20, 2015. _______ Geração de Energia Não Renovável. Available at: http://www.bndes. gov.br/SiteBNDES/bndes/bndes_pt/Ins- titu cional/Apoio_Financeiro/Produtos/FI- NEM/energia_geracao_nao_renovavel.html. Access on: October 20, 2015. CANAL ENERGIA. Mercado de capitais pode ajudar no financiamento da eólica, mas custo é maior. September 30, 2015. Available at: http://www.canalenergia.com.br/zpublisher/ma-
terias/Investimentos_e_Financas.asp?id=107575. Access on: October 30, 2015. Carley, S.. Distributed generation: An empirical analysis of primary motivators. Energy Policy, pp. 1648-1659. (2009). Cavados, G.. Análise do impacto da introdução das fontes intermitentes no setor elétrico brasileiro: estudo de caso da região Nordeste. PPE/ COPPE/UFRJ, Rio de Janeiro, Brazil (2015). CÂMARA DE COMERCIALIZAÇÃO DE ENERGIA ELÉTRICA. Preço de Liquidação das Diferenças: Preços Médios. Available at: http://www.ccee. org.br/portal/faces/pages_publico/o-que-fa- zemos/como_ccee_atua/precos/precos_me- dios?_afrLoop=1983362997625821#%40%3F_ afrLoop%3D1983362997625821%26_adf. ctrl-state%3D119tj6ddc7_4. Access on: October 21, 2015. CENTRO NACIONAL DE REFERÊNCIA EM PEQUENAS CENTRAIS HIDRELÉTRICAS. PCH Notícias. Itajubá: CNRPCH (2015). Available at: http://cerpch.unifei.edu.br/wp-content/uploads/ revistas/revista-45.pdf. Access on: September 28, 2015.
CONTINUE ►

Chen, H. et al. Progress in electrical energy storage system: a critical review. Progress in Natural Science, 19, pp. 291-312 (2009). Desertec Concept. Available at: http://www. desertec.org/concept/. Access on: October 15, 2015. ECOFYS. Flexibility options in electricity systems. Ecofys Consultancy (2014). Available at: http://www.ecofys.com/files/files/ecofys-eci- 2014-flexibility-options-in-electricity-systems. pdf. Access on September 8, 2015. EMPRESA DE PESQUISA ENERGÉTICA. Nota Técnica DEA 13/14 - Demanda de energia 2050. EPE, Rio de Janeiro, Brazil (2014). _______ Estimativa da capacidade instalada de geração distribuída no SIN: aplicações no horário de ponta. EPE Rio de Janeiro, Brazil (2015). _______. Plano Decenal de Expansão da Energia 2024. EPE Rio de Janeiro, Brazil (2015). _______. Previsões de carga para o planejamento anual da operação energética 2015-2019, 2a revisão quadrimestral. EPE Rio de Janeiro, Brazil (2015). _______. Resenha mensal do mercado de energia elétrica, ano VIII, número 94. EPE, Rio de Janeiro, Brazil (2015).
ELECTRIC POWER RESEARCH INSTITUTE. Electricity energy storage technology options - a white paper primer on applications, costs and benefits. Palo Alto, USA: EPRI (2010). Available at: http://www.epri.com/abs-tracts/pages/productabstract.aspx?ProductI- D = 000000000001020676&Mode = download Access on: September 21, 2015. ERNST & YOUNG. Renewable Energy Country Atractiveness Index. 44. (June, 2015). ESTADÃO. Itaú capta R$ 1 bi para água e energia renovável. January 27, 2015. Available at: http://economia.estadao.com.br/noticias/geral,itau-capta-r-1-bi-para-agua-e-energia-re-novavel-imp-,1625250. Access on: October 10, 2015. FGV ENERGIA. Cadernos FGV Energia: Gás Natural. Rio de Janeiro: FGV (2014). GLOBAL ENERGY NETWORK INSTITUTE. Energy storage technologies and their role in renewable integration. San Diego, USA: GENI (2012). Available at: http://www.geni.org/glo- balenergy/research/energy-storage-technolo- gies/Energy-Storage-Tech nologies.pdf. Access on: September 29, 2015. INTERNATIONAL ENERGY AGENCY. Prospects for large-scale energy storage in decarbonised power grids. Paris, France: IEA (2009).

Available at: https://www.iea.org/publica- tions/freepublications/publication/energy_ storage.pdf. Access on: August 25, 2015.
INTERNATIONAL ENERGY AGENCY. Energy technology perspectives 2014. Paris, France: IEA (2014). Available at: http://www.iea.org/pu- blications/freepublications/publication/Energy- TechnologyPerspectives_ES.pdf. Access on: March 18, 2015.
INTERNATIONAL ENERGY AGENCY. Technology roadmap - solar photovoltaic energy. Paris, France: IEA (2014). Available at: https:// www.iea.org/publications/freepublications/pu- blication/TechnologyRoadmapSolarPhotovol- taicEnergy_2014edition.pdf. Access on: September 8, 2015.
INTERNATIONAL ENERGY AGENCY. Technology roadmap - solar thermal electricity. Paris, France: IEA (2014). Available at: http://www. iea.org/publications/freepublications/publica- tion/technologyroadmapsolarthermalelectrici- ty_2014edition.pdf. Access on: August 25, 2015.
INTERNATIONAL ENERGY AGENCY. The power of transformation - wind, sun and the economics of flexible power systems (executive summary). Paris, France: IEA (2014). Available at: http:// www.iea.org/textbase/npsum/givar2014sum. pdf.
Access on: September 8, 2015.
INTERNATIONAL ENERGY AGENCY. Wind energy - roadmap development and implementation. Paris, France: IEA (2014). Available at: https://www.iea.org/publications/freepubli- cations/publication/How2GuideforWindEner- gyRoadmapDevelopementandImplementa- tion.pdf. Access on: September 8, 2015.
INSTITUTO ACENDE BRASIL. Available at: http://www.acendebrasil.com.br/br/analises. Access on: October 20, 2015.
InterAcademy Council. Lighting the way toward a sustainable energy future. Amsterdam, The Netherlands: InterAcademy Council (2007). Available at: http://www.interacademycouncil.net/File.as- px?id=24548. Access on: August 26, 2015.
INTERNATIONAL RENEWABLE ENERGY AGENCY. Renewable Energy Statistics Capacity 2015. Abu Dhabi: United Arab Emirates IRENA (2015).
INTERNATIONAL RENEWABLE ENERGY AGENCY. Renewable Power Capacity Statistics 2000-2014. Abu Dhabi: United Arab Emirates IRENA (2015). Available at: http://resour- ceirena.irena.org/gateway/dashboard/. Access on: October 11, 2015.
CONTINUES ►

Jong, P. d., Kiperstock, A., & Torres, E. A.. Economic and environmental analysis of electricity generation technologies in Brazil. Renewable and Sustainable Energy Reviews, 52, pp. 725-739 (2015). Lodi, C. (2011). Perspectivas para a geração de energia elétrica no Brasil utilizando a tecnologia solar térmica concentrada. PPE/COPPE/ UFRJ, Rio de Janeiro, Brazil. Mahto, T., & Mukherjee, V. Energy storage systems for mitigating the variability of isolated hybrid power system. Renewable and Sustainable Energy Reviews, 51, pp. 1564-1577 (2015). MINISTÉRIO DE CIÊNCIA TECONOLOGIA E INOVAÇÃO. Fator de Emissão de CO2. Available at: http://www.mct.gov.br/index.php/content/view/321144.html. Access on: 10/26/2015 . MINISTÉRIO DE MEIO AMBIENTE. Política Nacional sobre Mudança do Clima. Available
at: http://www.mma.gov.br/clima/politica-nacional- sobre-mudanca-do-clima/plano-nacional- sobre-mudanca-do-clima. Access on: September 18, 2015. Nowakowski, G. A. Critério para análise de limites e potencialidades da sustentabilidade de fontes de energia: um estudo da cadeia produtiva das Pequenas Centrais Hidrelétricas no Brasil. Programa de Pós-Graduação em Tecnologia/UTFPR, Curitiba, Brazil (2015). OPERADOR NACIONAL DO SISTEMA ELÉTRICO. Histórico da Operação. Available at: http://www.ons.org.br/historico/. Access on: October 17, 2015. ORGANIZAÇÃO DAS NAÇÕES UNIDAS. Declaração do Rio sobre o meio ambiente e desenvolvimento. Conferência das Nações Unidas sobre o Meio Ambiente e Desenvolvimento, Rio de Janeiro, Brazil (1992). Available at http://www.onu.org.br/rio20/ img/2012/01/rio92.pdf. Access on: September 27, 2015.

Pao, H.-T., & Fu, H.-C. Renewable energy, non-renewable energy and economic growth in Brazil. Renewable and Sustainable Energy Reviews, 25, pp. 381-392 (2013). Pereira, M. G. et al. The renewable energy market in Brazil: Current status and potential. Renewable and Sustainable Energy Reviews, 16, pp. 3786-3802 (2012). RENEWABLE ENERGY POLICY NETWORK FOR THE 21 ST CENTURY. Renewables Global Futures Report. Paris, France> REN21 (2013). Available at: http://www.ren21.net/future-of- -renewables/global-futures-report/. Access on: October 15, 2015. Santos, M. A. et al. Gross greenhouse gas fluxes from hydro-power reservoir compared to thermo-power plants. Energy Policy, 34, pp. 481-488 (2006). TESLA. Tesla Powerwall. Available at: http:// www.teslamotors.com/powerwall. Access on: November 25, 2015. UNITED NATIONS FRAMEWORK
CONVENTION ON CLIMATE CHANGE. List of Countries from Attachment I. Available at: http://unfccc. int/parties_and_observers/parties/annex_i/ items/2774.php. Access on October 22, 2015. Vassilev, S. V., Vassileva, C. G., & Vassilev, V. S.. Advantages and disadvantages of composition and properties of biomass in comparison with coal: An overview. Fuel, 158, pp. 330-350 (2015). WORLD RESOURCE INSTITUTE. Bridgind the gap between energy and climate policies in Brazil., Washington, USA: WRI. (2015). Available at http://www.wri.org/sites/default/files/ bridging-the-gap-energy-climate-brazil_1.pdf. Access on: September 22, 2015. Zhang, J. et al.. Electricity generation from renewables in the United States: Resource potential, current usage, technical status, challenges, strategies, policies, and future directions. Renewable and Sustainable Energy Reviews, 24, pp. 454-472 (2013).

Transparency and sustainability
Furnas represents a complex of 19 Power Plants, 68 substations and 43 wind parks. • 40% of Brazil’s energy goes through Furnas. • Energy for over 60% Brazilian houses. • 24,000 km of transmission lines interconnecting Brazil. • 100% clean energy generation for Brazil.

IN NATURE, NOTHING IS LOST. EVERYTHING IS TRANSFORMED.
To learn more, visit www.cibiogas.org
ITAIPU GENERATES MORE THAN CLEAN ENERGY FROM RIO PARANÁ WATERS. It also develops several initiatives in the renewable energies field, such as the use of biomethane from animal waste and organic waste from regional parks. With this, it fights greenhouse gas emissions, protects the nature by avoiding waste to reach rivers and provides an income alternative to local producers, in addition to developing the technology of vehicles moved with this biofuel. today, Itaipu already has 56 of them and will soon expand its biomethane fleet even further. Economy result already proven and income generation and sustainable development factor for the entire operation territory.


FGV Energia Supporting Entities