Embed Size (px)
DESCRIPTION
data
Citation preview
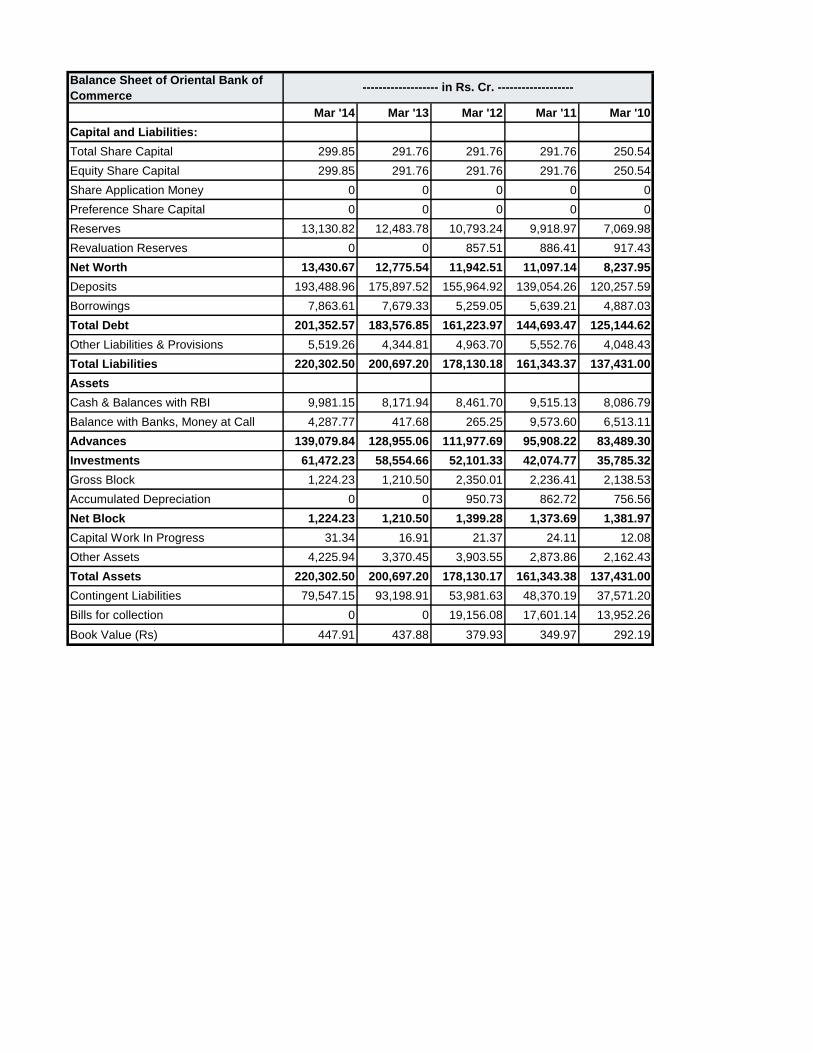
Balance Sheet of Oriental Bank of
Commerce
Mar '14 Mar '13 Mar '12 Mar '11 Mar '10
Capital and Liabilities:
Total Share Capital 299.85 291.76 291.76 291.76 250.54
Equity Share Capital 299.85 291.76 291.76 291.76 250.54
Share Application Money 0 0 0 0 0
Preference Share Capital 0 0 0 0 0
Reserves 13,130.82 12,483.78 10,793.24 9,918.97 7,069.98
Revaluation Reserves 0 0 857.51 886.41 917.43
Net Worth 13,430.67 12,775.54 11,942.51 11,097.14 8,237.95
Deposits 193,488.96 175,897.52 155,964.92 139,054.26 120,257.59
Borrowings 7,863.61 7,679.33 5,259.05 5,639.21 4,887.03
Total Debt 201,352.57 183,576.85 161,223.97 144,693.47 125,144.62
Other Liabilities & Provisions 5,519.26 4,344.81 4,963.70 5,552.76 4,048.43
Total Liabilities 220,302.50 200,697.20 178,130.18 161,343.37 137,431.00
Assets
Cash & Balances with RBI 9,981.15 8,171.94 8,461.70 9,515.13 8,086.79
Balance with Banks, Money at Call 4,287.77 417.68 265.25 9,573.60 6,513.11
Advances 139,079.84 128,955.06 111,977.69 95,908.22 83,489.30
Investments 61,472.23 58,554.66 52,101.33 42,074.77 35,785.32
Gross Block 1,224.23 1,210.50 2,350.01 2,236.41 2,138.53
Accumulated Depreciation 0 0 950.73 862.72 756.56
Net Block 1,224.23 1,210.50 1,399.28 1,373.69 1,381.97
Capital Work In Progress 31.34 16.91 21.37 24.11 12.08
Other Assets 4,225.94 3,370.45 3,903.55 2,873.86 2,162.43
Total Assets 220,302.50 200,697.20 178,130.17 161,343.38 137,431.00
Contingent Liabilities 79,547.15 93,198.91 53,981.63 48,370.19 37,571.20
Bills for collection 0 0 19,156.08 17,601.14 13,952.26
Book Value (Rs) 447.91 437.88 379.93 349.97 292.19
------------------- in Rs. Cr. -------------------


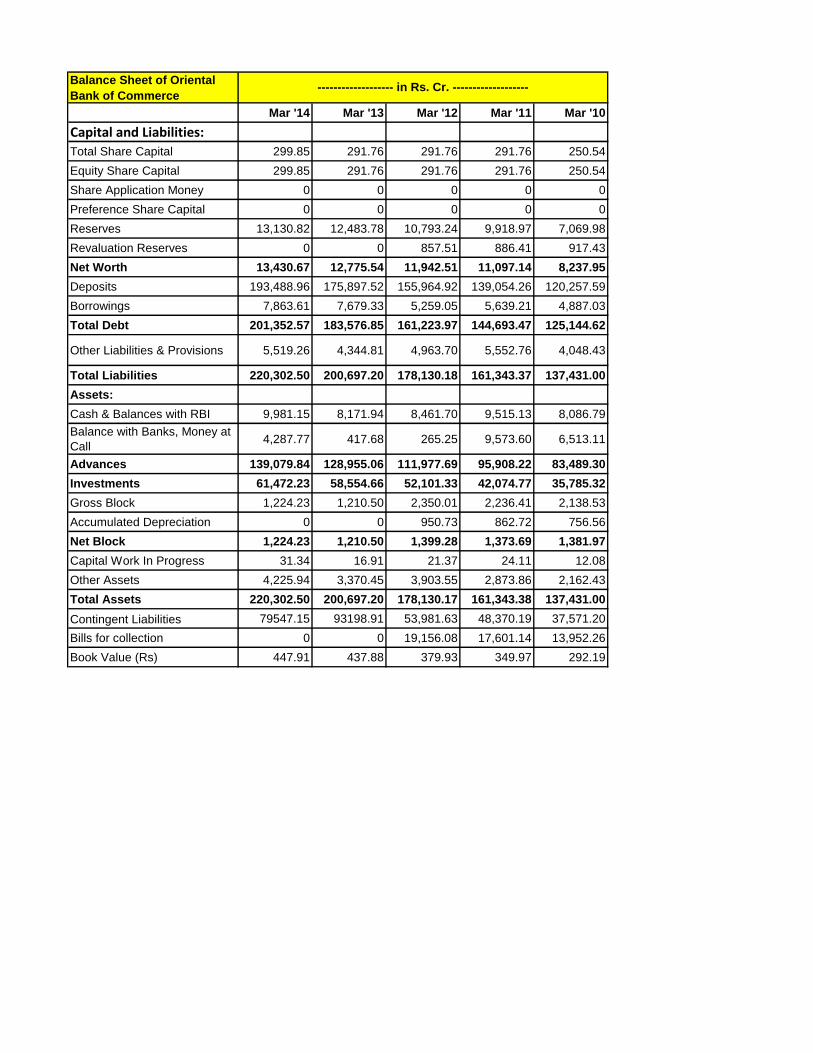
Balance Sheet of Oriental
Bank of Commerce
Mar '14 Mar '13 Mar '12 Mar '11 Mar '10
Capital and Liabilities:
Total Share Capital 299.85 291.76 291.76 291.76 250.54
Equity Share Capital 299.85 291.76 291.76 291.76 250.54
Share Application Money 0 0 0 0 0
Preference Share Capital 0 0 0 0 0
Reserves 13,130.82 12,483.78 10,793.24 9,918.97 7,069.98
Revaluation Reserves 0 0 857.51 886.41 917.43
Net Worth 13,430.67 12,775.54 11,942.51 11,097.14 8,237.95
Deposits 193,488.96 175,897.52 155,964.92 139,054.26 120,257.59
Borrowings 7,863.61 7,679.33 5,259.05 5,639.21 4,887.03
Total Debt 201,352.57 183,576.85 161,223.97 144,693.47 125,144.62
Other Liabilities & Provisions 5,519.26 4,344.81 4,963.70 5,552.76 4,048.43
Total Liabilities 220,302.50 200,697.20 178,130.18 161,343.37 137,431.00
Assets:
Cash & Balances with RBI 9,981.15 8,171.94 8,461.70 9,515.13 8,086.79
Balance with Banks, Money at
Call4,287.77 417.68 265.25 9,573.60 6,513.11
Advances 139,079.84 128,955.06 111,977.69 95,908.22 83,489.30
Investments 61,472.23 58,554.66 52,101.33 42,074.77 35,785.32
Gross Block 1,224.23 1,210.50 2,350.01 2,236.41 2,138.53
Accumulated Depreciation 0 0 950.73 862.72 756.56
Net Block 1,224.23 1,210.50 1,399.28 1,373.69 1,381.97
Capital Work In Progress 31.34 16.91 21.37 24.11 12.08
Other Assets 4,225.94 3,370.45 3,903.55 2,873.86 2,162.43
Total Assets 220,302.50 200,697.20 178,130.17 161,343.38 137,431.00
Contingent Liabilities 79547.15 93198.91 53,981.63 48,370.19 37,571.20
Bills for collection 0 0 19,156.08 17,601.14 13,952.26
Book Value (Rs) 447.91 437.88 379.93 349.97 292.19
------------------- in Rs. Cr. -------------------
Contingent Liabilities 79547.15 93198.91 53,981.63

48,370.19 37,571.20
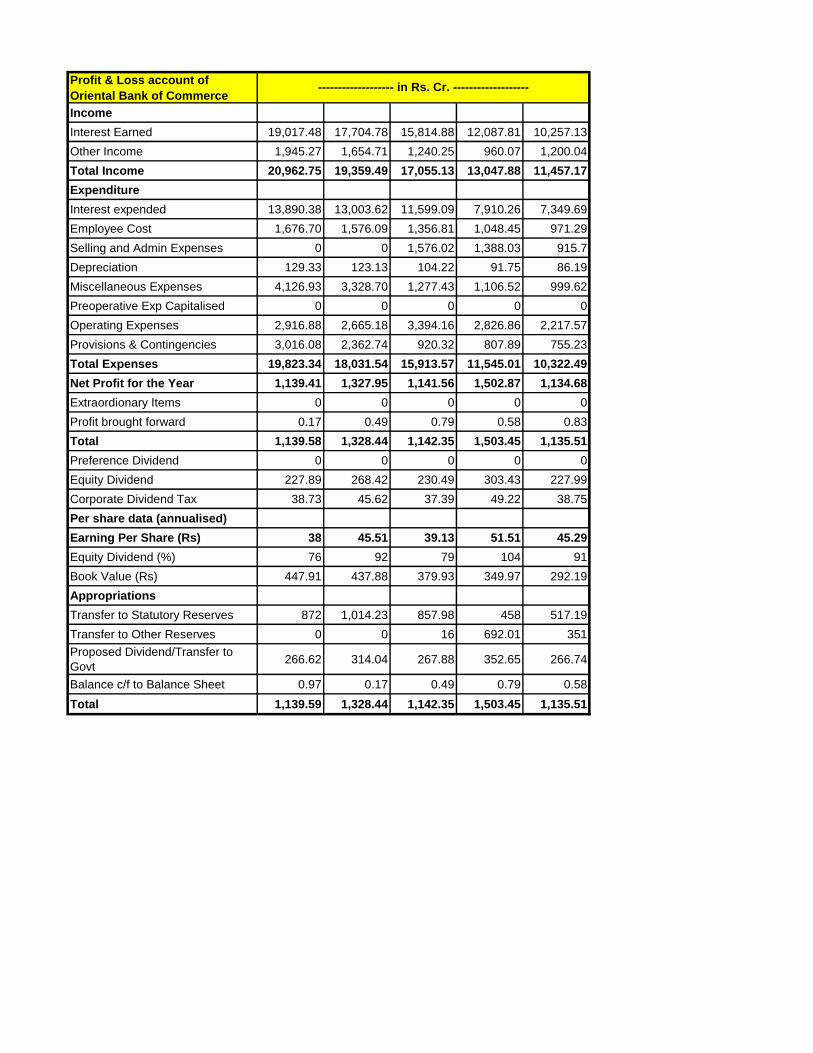
Profit & Loss account of
Oriental Bank of Commerce
Income
Interest Earned 19,017.48 17,704.78 15,814.88 12,087.81 10,257.13
Other Income 1,945.27 1,654.71 1,240.25 960.07 1,200.04
Total Income 20,962.75 19,359.49 17,055.13 13,047.88 11,457.17
Expenditure
Interest expended 13,890.38 13,003.62 11,599.09 7,910.26 7,349.69
Employee Cost 1,676.70 1,576.09 1,356.81 1,048.45 971.29
Selling and Admin Expenses 0 0 1,576.02 1,388.03 915.7
Depreciation 129.33 123.13 104.22 91.75 86.19
Miscellaneous Expenses 4,126.93 3,328.70 1,277.43 1,106.52 999.62
Preoperative Exp Capitalised 0 0 0 0 0
Operating Expenses 2,916.88 2,665.18 3,394.16 2,826.86 2,217.57
Provisions & Contingencies 3,016.08 2,362.74 920.32 807.89 755.23
Total Expenses 19,823.34 18,031.54 15,913.57 11,545.01 10,322.49
Net Profit for the Year 1,139.41 1,327.95 1,141.56 1,502.87 1,134.68
Extraordionary Items 0 0 0 0 0
Profit brought forward 0.17 0.49 0.79 0.58 0.83
Total 1,139.58 1,328.44 1,142.35 1,503.45 1,135.51
Preference Dividend 0 0 0 0 0
Equity Dividend 227.89 268.42 230.49 303.43 227.99
Corporate Dividend Tax 38.73 45.62 37.39 49.22 38.75
Per share data (annualised)
Earning Per Share (Rs) 38 45.51 39.13 51.51 45.29
Equity Dividend (%) 76 92 79 104 91
Book Value (Rs) 447.91 437.88 379.93 349.97 292.19
Appropriations
Transfer to Statutory Reserves 872 1,014.23 857.98 458 517.19
Transfer to Other Reserves 0 0 16 692.01 351
Proposed Dividend/Transfer to
Govt266.62 314.04 267.88 352.65 266.74
Balance c/f to Balance Sheet 0.97 0.17 0.49 0.79 0.58
Total 1,139.59 1,328.44 1,142.35 1,503.45 1,135.51
------------------- in Rs. Cr. -------------------


