Embed Size (px)
DESCRIPTION
Ensayos de aptitud
Citation preview
BOOK OF ABSTRACTS
Bild „© by_Gordon Gross_pixelio.de

8th WORKSHOP
PROFICIENCY TESTING IN
ANALYTICAL
CHEMISTRY,
MICROBIOLOGY
AND LABORATORY
MEDICINE
Current Practice and Future Directions
In co-operation with
Book of Abstracts 1

2 8th Workshop on Proficiency Testing in Analytical Chemistry, Microbiology
and Laboratory Medicine, Berlin, October 2014
List of contents
Keynote Lectures
K01 Review of ISO/IEC 17043 - an accreditation perspective Delia Geary UKAS, UK
K02 Nestlé users' perspectives of proficiency testing Laura Coisne
Nestec Ltd, Switzerland
K03 Proficiency testing of wastewater sampling: What can
we learn? Magda Cotman, Albin Pintar National Institute of Chemistry, Slovenia
K04 Revision of ISO 13528
Dan Tholen Dan Tholen Statistical Consulting, USA
K05 External Quality Assessment (EQA) / Proficiency
Testing (PT) in Developing Countries - in the Medical
Field Sibongile Zimuto ZINQAP Trust, Zimbabwe
K06 Harmonisation of performance assessment in
qualitative PT/EQA Vivienne James Public Health England, UK
Book of Abstracts 3
Short oral presentations
O01 ISO/IEC 17043:2010 Accreditation: An Accreditation Body’s Perspective Robert Knake American Association for Laboratory Accreditation (A2LA), Frederick, MD, U.S.A.
O02 Mobile system for waste water sampling proficiency tests Frank Baumeister, Michael Koch
AQS Baden-Württemberg, Univ. of Stuttgart, Germany
O03 Proposed statistical analysis to evaluate the qualitative PT of Salmonella
serotyping Marzia Mancin, Lisa Barco, Cristina Saccardin, Antonia Ricci Istituto Zooprofilattico Sperimentale delle Venezie, Padua, Italy
O04 Qualitative PT data analysis with easy-to-interpret scores Christian Bläul, Steffen Uhlig Quodata, Dresden, Germany
O05 Co-ordination of an organochlorine pesticides in water proficiency testing scheme
in South(ern) Africa Désirée Prevoo-Franzsen, Nontete Nhlapo, Laura Quinn, Maria Fernandes-Whaley National Metrology Institute of South Africa, Pretoria, South Africa
O06 The question of homogeneity inside a chimney: application of ISO 13528 to stack
emission proficiency tests Jens Cordes, Benno Stoffels, Dominik Wildanger Hessian Agency for the Environment and Geology, Kassel, Germany
O07 Round Frequency + Participation Longevity: An Assessment of the Critical
Parameters for Determining Proficiency in the Analysis of Occupational Hygiene
Samples Mary Ann Latko, Angela Oler, Daniel Tholen AIHA PAT Programs, Falls Church, USA and Dan Tholen Statistical Consulting, Traverse City, USA
O08 Systematic errors of colony count methods revealed by microbiology PT Katrin Luden, Ernst-August Heinemeyer Governmental Institute of Public Health of Lower Saxony, Aurich, Germany
O09 A comparison of statistical procedures using 8000 datasets from the Quasimeme
proficiency testing scheme Wim Cofino, Paul Torfs, Steven Crum, Joop Harmsen Wageningen University and Research Centre, The Netherlands
O10 Asymmetric proficiency test distributions – cause and analysis Mark Sykes FAPAS, York, UK
4 8th Workshop on Proficiency Testing in Analytical Chemistry, Microbiology
and Laboratory Medicine, Berlin, October 2014
Poster contributions
P01 Inorganic gas pollutants proficiency testing scheme within Air Quality
Measurement program Maurizio Barbiere, Annette Borowiak, Friedrich Lagler European Commission - Joint Research Centre, Ispra, Italy
P02 IMEP at the service of the EURL-HM - The case of IMEP-117: Determination of
total As, Cd, Pb and Hg in compound feed Yiannis Fiamegos, Fernando Cordeiro, Beatriz de la Calle, Piotr Robouch European Commission, Joint Research Centre, Institute for Reference Materials and Measurements, Geel, Belgium
P03 Proficiency testing as a tool to point out criticalities in the strategy for control of
antibiotic residues in milk: the Italian experience Anna Maria Ferrini, Umberto Agrimi, Brunella Appicciafuoco, Renata Borroni, Gianni Ciccaglioni, Fabio Galati, Marina Patriarca Istituto Superiore di Sanità, Roma, Italy
P04 Performances of the Italian official control laboratories for the content of cadmium
in infant formula in view of new European Union legislation Antonella Semeraro, Valeria Patriarca, Augusto Pastorelli, Stefania Morelli, Elisabetta Sagratella, Maria Ciprotti, Laura Ciaralli, Paolo Stacchini, Marina Patriarca Istituto Superiore di Sanità, Roma, Italy
P05 Preparation of an infant formula proficiency testing material and assessment of its
homogeneity and stability Angela Sorbo, Maria Ciprotti, Andrea Colabucci, Marco Di Gregorio, Anna Chiara Turco, Laura Ciaralli Istituto Superiore di Sanità, Rome, Italy
P06 Ad-hoc material for proficiency testing: freeze-dried liver Andrea Colabucci, Alessandra Sepe, Maria Ciprotti, Laura Ciaralli Istituto Superiore di Sanità, Rome, Italy
P07 Improvement in the detection of viral contamination in shellfish in Italy through
interlaboratory exercises Elisabetta Suffredini, Gianni Ciccaglioni, Loredana Cozzi, Marina Patriarca Istituto Superiore di Sanità, Rome, Italy
P08 Nematode sample preparation for a reclaimed water proficiency testing scheme Raquel Múrtula, Adela Yañez, Melissa Fernández, Elena Soria, Vicente Catalán ielab Calidad, Alicante, Spain
Book of Abstracts 5
P09 Proficiency testing carried out by the European Reference Laboratory for
Parasites, EURLP Patrizia Rossi, Gianluca Marucci, Marco Lalle, Adriano Casulli, Alessia Possenti, Edoardo Pozio Istituto Superiore di Sanità, Rome, Italy
P10 Detection and typing of Verocytotoxin-producing Escherichia coli (VTEC): the
proficiency test program of the European Union Reference Laboratory Clarissa Ferreri, Stefano Morabito, Gaia Scavia, Rosangela Tozzoli, Antonella Maugliani, Fabio Minelli, Maria Luisa Marziano, Susan Babsa, Fabio Galati, Marina Patriarca, Alfredo Caprioli Istituto Superiore di Sanità, Rome, Italy
P11 The effects of transport on microbiological proficiency test samples Tracey Noblett LGC, Bury, UK
P12 Developing of test items using native microorganism cultures Graciela O. Davel, Gladys M. Mastromonaco, Marta G. Mazza, Fernando Kornblit, Mariana Mazza1, Nicolás Refojo Administración Nacional de Laboratorios e Institutos de Salud, Buenos Aires, and Instituto Nacional de Tecnología Industrial, Pdo. De San Martín, Argentina
P13 Algae proficiency testing Philip Briggs Proficiency Testing Australia, Sydney, Australia
P14 Proficiency testing schemes in biological area of Brazilian accredited laboratories Priscila Yuvamoto, Gilberto O. J. Jr., Lúcia Moreira, Mário Fernandes, Renata Borges CGCRE, Rio de Janeiro, Brazil
P15 Metrological comparability of analytical results in the area of food safety Marina Patriarca, Antonella Semeraro, Angela Sorbo, Ferdinando Chiodo, Valeria Patriarca, Augusto Pastorelli, Stefania Morelli, Elisabetta Sagratella, Laura Ciaralli, Paolo Stacchini Istituto Superiore di Sanità, Roma, Italy
P16 Honey as a material for proficiency testing Andrea Colabucci, AnnaChiara Turco, Angela Sorbo, Maria Ciprotti, Marco Di Gregorio, Laura Ciaralli Istituto Superiore di Sanità, Roma, Italy
P17 European Union proficiency tests in fruits and vegetables Screening Methods
(EUPT-FV-SM) Carmen Ferrer, Octavio Malato, Milagros Mezcua, Ana lozano, Amadeo R. Fernández-Alba University of Almería, Almería, Spain
6 8th Workshop on Proficiency Testing in Analytical Chemistry, Microbiology
and Laboratory Medicine, Berlin, October 2014
P18 European Union proficiency tests in fruits and vegetables. Main results obtained
during the last 10 years Carmen Ferrer, Milagros Mezcua, Octavio Malato, Ana Lozano, Amadeo R. Fernández-Alba University of Almería, Almería, Spain
P19 Proficiency Tests on olive oil organized by the Italian National Reference
Laboratory for pesticides residues: laboratories long-term performance Tiziana Generali, Patrizia Stefanelli, Silvana Girolimetti, Danilo Attard Barbini Istituto Superiore di Sanità, Roma, Italy
P20 Incurred and spiked pesticide residues in a feed for laying hens EU PT-CF7, 2013 Mette Erecius Poulsen, Gitte Andersen National Food Institute, Technical University of Denmark, Soeborg, Denmark
P21 Proficiency testing scheme in sensory – an innovative tool for quality assurance in
sensory Ute Braun, Anita Schott muva, Kempten, Germany
P22 Organization of proficiency testing schemes on physicochemical properties of
pesticides formulations Alain Dubois, Franck Defeijt, Geert De Poorter Federal Agency for the Safety of the Food Chain, Gembloux, Belgium
P23 Experience feedback from proficiency testing for pesticides in food Eric Ziegler, Caroline Laurent BIPEA, Paris, France
P24 Difficulties to evaluate the participant’s proficiency: the case of the PT for the confirmation of carbadox residues in pig muscle Régine Fuselier, Michel Laurentie, Eric Verdon Anses, Fougères, France
P25 Evaluation of proficiency test for the determination of total arsenic in fresh fish Luciana V. de Santana, Jorge E.S. Sarkis Institute of Energy and Nuclear Research-National (IPEN/CNEN-SP), São Paulo, Brazil
P26 Proficiency testing on natural vs artificial milk samples Marleen Abdel Massih, Fabiola Monterrosso, Marie-Julie Goffaux, Florence Ferber, Jacques Mahillon Université catholique de Louvain, Louvain-La-Neuve, and REQUASUD ASBL, Gembloux, Belgium
P27 Proficiency testing in hygiene of raw milk: enumeration of total bacteria count and
somatic cells count Jolanta G. Rola, Maciej Sosnowski, Piotr Kostrzewa, Jacek Osek National Veterinary Research Institute, Pulawy, Poland
Book of Abstracts 7
P28 Proficiency testing program in milk and milk products microbiology: enumeration
of Staphylococcus aureus and detection of staphylococcal enterotoxins Jolanta G. Rola, Weronika Korpysa–Dzirba, Anna Czubkowska, Monika Ostrowska, Jacek Osek National Veterinary Research Institute, Pulawy, Poland
P29 Experience of the first Italian public veterinary institute accredited as provider of
food microbiological proficiency testing in conformity to ISO/IEC 17043 Paola Carnieletto, Maria Grimaldi, Marzia Mancin, Romina Trevisan, Fabio Loriggiola, Marica Toson, Stefano Marangon Istituto Zooprofilattico Sperimentale delle Venezie, Padua, Italy
P30 Estimation of ammonium nitrogen concentration uncertainty in wastewater
effluent arising from sampling by means of proficiency testing Magda Cotman, Andreja Drolc, Albin Pintar National Institute of Chemistry, Ljubljana, Slovenia
P31 Proficiency test on field measurements of oxygen, temperature, pH and electrical
conductivity in waters Mirja Leivuori, Katarina Björklöf, Ritva Väisänen, Teemu Näykki Finnish Environment Institute, Helsinki, Finland
P32 Design and assessment of a water-analysis proficiency testing scheme Asmaïl Asgadaouan, Piet Speksnijder KWR Watercycle Research Institute, Nieuwegein, The Netherlands
P33 PT program for Argentine soil analysis Mirta Garcia, Daniela Rodriguez Ierace, Fernando Kornblit, Gladys Mastromonaco Universidad Nacional de La Plata, La Plata, and Instituto Nacional de Tecnología Industrial, Pdo. de San Martín, Argentina
P34 PAH analysis in the CONTEST proficiency testing scheme Matthew Whetton, Helen Finch LGC, Bury, United Kingdom
P35 The viability of drugs in oral fluid as a proficiency testing scheme Christina Nugent, Karen Morgan LGC, Bury, United Kingdom
P36 Assessment of practice of the laboratories participating in Korean proficiency test
for biological samples Mi-Young Lee Korea occupational safety and health agency, Ulsan, South Korea
P37 Development of the AIR Materials Emissions proficiency testing scheme for the
analysis of volatile organic compounds Owen Butler, Helen Finch, Ian Pengelly, Matthew Whetton Health and Safety Laboratory, Buxton, and LGC, Bury, United Kingdom
8 8th Workshop on Proficiency Testing in Analytical Chemistry, Microbiology
and Laboratory Medicine, Berlin, October 2014
P38 A new proficiency testing scheme for asbestos analysis by scanning electron
microscopy Laurie Davies, Emma Tan Health and Safety Laboratory, Buxton, UK
P39 Proficiency testing to protect worker health Mary Ann Latko, Angela Oler, Daniel Tholen AIHA PAT Programs, Falls Church, and Dan Tholen Statistical Consulting, Traverse City, USA
P40 Delivering external quality assessment for the World Health Organisation Barbara De la Salle, Vatsala Soni, Paul McTaggart, Mary West, Laura Ahmed, Keith Hyde UK NEQAS (H), Watford, and Manchester Metropolitan University, Manchester, United Kingdom
P41 Review of a PT program for clinical markers Hugo Gasca CENAM, Querétaro, México
P42 Six years of proficiency tests for the identification of Prion protein genotype in
sheep Barbara Chiappini, Gaia Scavia, Luisella Morelli, Michela Conte, Paola Fazzi, Umberto Agrimi, Marina Patriarca, Gabriele Vaccari Istituto Superiore di Sanità, Roma, Italy
P43 Performance assessment of blood parasite detection in haematology Barbara De la Salle, Dan Pelling, Keith Hyde UK NEQAS (H), Watford, UK
P44 An interlaboratory trial to determine the titre of the new batch of the OIE
antirabies positive reference serum from dog origin Marine Wasniewski, Anouck Labadie, Jonathan Rieder, Jean-Luc Schereffer, Laetitia Tribout, Florence Cliquet French Agency for Food, Environmental and Occupational Health & Safety, Malzéville, France
P45 Proficiency testing programme of cement chemical analysis in 2013 Xiaoling Zhu, Ruihai Wang, Zhujun Ni, Manli Ge, Shasha Wu China Building Material Test & Certification Group Co. and China National Accreditation Service for Conformity Assessment, Beijing, China
P46 Organization and evaluation of PTs for the determination of VOC-emissions from
materials in emission test chambers Olaf Wilke, Wolfgang Horn BAM Federal Institute for Materials Research and Testing, Belin, Germany
Book of Abstracts 9
P47 State of field measurement of facade sound insulation in buildings: Evaluation of
Proficiency Testing data according to ISO 140-5:1998 José Luis Martínez, José Alberto Trujillo, Pedro Rosario, Juan Sancho RPS-Qualitas and Acustilab, Madrid, Spain
P48 PT Schemes from Colombia Camilo DAleman C., Eliana Chavarro M., Immer Caicedo G. Mol Labs, Bogotá, Colombia
P49 Quality control of chemical measurements Camilo DAleman C., Eliana P. Chavarro M., Immer M. Caicedo G. Mol Labs, Bogotá, Colombia
P50 The painstaking road to accreditation as a proficiency testing provider Simone Fajardo, Ramiro Pérez-Zambra, Ana Silva, Elizabeth Ferreira Laboratorio Tecnológico del Uruguay, Montevideo, Uruguay
P51 First Indonesian experience of proficiency testing for pH measurements Sujarwo, Nuryatini, Oman Zuas Indonesian Institute of Sciences, Banten, Indonesia
P52 First Indonesian proficiency testing scheme using reference valuesfor Cd, Cu and
Fe in drinking water Eka M. Handayani, Isna Komalasari, Christine Elishian, Rosi Ketrin Indonesian Institute of Sciences, Banten, Indonesia
P53 The impact of test item matrix on performance evaluation of PT-INR in a
proficiency testing program Joy J Mammen, Sukesh C Nair, Surendar Singh, Soumya S, Alok Srivastava ISHBT- CMCEQAS, Department of Transfusion Medicine, and Department of Haematology, Christian Medical College, Vellore, India
P54 Development cooperation: Quality control in environmental analysis – Case study
from Kyrgyz Republic Riitta Koivikko, Mirja Leivuori Finnish Environment Institute SYKE, Helsinki, Finland
P55 Survey of interpretation of external quality assessment (EQA) results in developing
countries Azarm Nami, Farideh Razi, Marjan Rahnamaye Farzami, Alireza Mehrabi, Mehdi Hajikhani, Mohammad Abassi Pishgam e Iranian Co. and University of Medical Sciences and Ministry of Health, Tehran, Iran
P56 Overcoming the challenges – potable water in an African microbiology PT scheme Pinkie Malebe Botswana Bureau of Standards, Gaborone, Botswana
10 8th Workshop on Proficiency Testing in Analytical Chemistry, Microbiology
and Laboratory Medicine, Berlin, October 2014
P57 Proficiency testing scheme for chemical analyses of water in Africa Merylinda Conradie, Michael Koch, Donald Masuku NamWater, Windhoek, Namibia, and University of Stuttgart, Germany, and National Metrology Institute, Pretoria, South Africa
P58 Making the case for continuous improvement: Sample generation processes and
the impact on participant performance Mary Ann Latko, Angela Oler, Daniel Tholen AIHA PAT Programs, Falls Church, and Dan Tholen Statistical Consulting, Traverse City, USA
P59 Project management practices in proficiency testing schemes: the Brazilian
accredited providers’ case Filipe Albano, Carla Schwengber ten Caten University UFRGS, Porto Alegre, Brazil
P60 Comparison of different approaches in interpretation and presentation of PT
results Aida Jotanović, Šemsa Suljagić Institute of Metrology, Sarajevo, Bosnia and Herzegovina
P61 Bilateral PT Schemes - a flexible tool when PT results are needed quickly Al Ramsay, Claudia Ketteler Waters, Milford, MA, USA, and Frechen, Germany
P62 The trueness criterion: an alternative concept for the evaluation of proficiency tests Birgit Karin Schindler PROOF-ACS GmbH, Hamburg, Germany
P63 Use of the “reference change value” concept in comparison of two results from blind identical proficiency testing samples Berna Aslan, Julia Stemp, Neela Khatri Institute of Quality Management in Healthcare, Toronto, Ontario, Canada
P64 Consensus means in drinking water PTs – reliable or biased? Michael Koch, Frank Baumeister AQS Baden-Württemberg, University of Stuttgart, Germany
P65 The variation of test results due to analyst interpretation Rachael Smith LGC, Bury, United Kingdom
P66 How the consensus program standard deviation affected the success of fuel
laboratory proficiency test participants Caglar Sinayuc, Sevtac Bulbul, Hale Uckardes, Bercem Duzol, Didem N. Saglam, Gaye Yucayurt, Emrah Soysal, Hatice Adalan, Ender Okandan Middle East Technical University, Ankara, Turkey
Book of Abstracts 11
P67 Could z-scores replace the target limits in the EQA schemes? Ulla Tiikkainen, Päivi Rauvo, Jari Leinonen, Marko Laine Labquality and HUSLAB and Finnish Meteorological Institute, Helsinki, Finland
P68 Evaluation of proficiency tests – Use of combination scores Manfred Stoyke, Wolfgang Radeck, Joachim Polzer Federal Office of Consumer Protection and Food Safety, Berlin, Germany
P69 Introduction of Z-Score Arrow Ranges (ZSAR) in proficiency testing Kees van Putten, Robert-Jan Lamers DUCARES B.V., Utrecht, The Netherlands
P70 Long-term study of the proficiency testing scheme in textiles (2001-2012) Juana Isabel Ferreiro López-Riobóo Laboratorio de Consumo de Galicia, Xunta de Galicia, A Coruña, Spain
P71 Criteria of using results from proficiency testings for measurement uncertainty
calculation on the example of various feeds Waldemar Korol, Jolanta Rubaj, Grażyna Bielecka, Sławomir Walczyński National Research Institute of Animal Production, Lublin, Poland
P72 The role of proficiency testing schemes in method development Steven Crum, Steven Tito, Joop Harmsen Wageningen University and Research Centre, Wageningen, The Netherlands
P73 Use of Proficiency testing results in method validation Jesús Laso Sánchez, Ana Peris García-Patrón Gabinete de Servicios para la Calidad (GSC), Madrid, Spain
P74 New approach working with outliers in Proficiency Testing Jesús Laso Sánchez, Ana Peris García-Patrón Gabinete de Servicios para la Calidad (GSC), Madrid, Spain
P75 Bootstrap statistical approach using R software to evaluate multimodal
quantitative results in food microbiology PTs Marzia Mancin, Marica Toson, Maria Grimaldi, Barco Lisa, Romina Trevisan, Paola Carnieletto, Antonia Ricci Istituto Zooprofilattico Sperimentale delle Venezie, Padua, Italy
P76 Monte Carlo simulation as a possible approach to determine the standard deviation
for proficiency assessment for an external quality assessment programme in clinical
chemistry Gina Chew, Pui Sze Cheow, Qinde Liu, Richard Shin, Tang Lin Teo, Tong Kooi Lee Health Sciences Authority, Singapore
12 8th Workshop on Proficiency Testing in Analytical Chemistry, Microbiology
and Laboratory Medicine, Berlin, October 2014
P77 A model for the statistical assessment of proficiency tests using the moments of the
Bhattacharyya centroid of a set of probability density functions Wim P Cofino, Paul Torfs, Steven Crum, Joop Harmsen Wageningen University and Research Centre, Wageningen, The Netherlands
Book of Abstracts 13

14 8th Workshop on Proficiency Testing in Analytical Chemistry, Microbiology
and Laboratory Medicine, Berlin, October 2014

Keynote
lectures
Book of Abstracts 15
Review of ISO 17043 - an Accreditation Perspective
Delia GearyUnited Kingdom Accreditation Service, UK
Overview:
ISO 17043 was published in 2010 and replaced ILAC G13 / ISO Guide 43 for accreditationbodies in the assessment of EQA/PT providers thus potentially enabling a more harmonizedapproach to accreditation between different bodies. This presents a number of challengeswhich will be explored in the presentation.
Accreditation:
Although the format of ISO 17043 differs somewhat to others in the series, the main aim aswith all accreditation is to enable comment on the competence of the provider for a definedscope against established criteria. The scope of ISO 17043 however is somewhat different tomost other standards in that it also specifically includes development of EQA /PT schemes:‘….specifies general requirements for the competence of providers of proficiency testingschemes and for the development and operation of proficiency testing schemes.’To various extents this is reflected in the scopes of accreditation cross different accreditationbodies and the presentation will include specific examples.
During the presentation there will be an overview of some key requirements in ISO 17043 andthe principles behind a UKAS assessment of these areas highlighting some challengesbetween different sectors and schemes. The main focus will be on the significance andimportance of the setting of scheme objectives and how these are established andcommunicated to potential participants. The significance of EQA/PT in the accreditation toother standards such as ISO 15189 and ISO/IEC 17025 and the specific requirements inISO/IEC 17011 for accreditation bodies with regards to required policies will also beexplored.
.
16 8th Workshop on Proficiency Testing in Analytical Chemistry, Microbiology
and Laboratory Medicine, Berlin, October 2014
Keynote lecture 1
Nestlé users’ perspectives of proficiency testing
Laura Coisne
Nestlé Research Centre, Nestec Ltd, Lausanne, Switzerland
More than 900 laboratories participate in the Nestlé Proficiency Testing (PT) program. Theprogram is organised and managed centrally by the Nestlé Research Centre in Switzerland. Ithas been in operation for 30 years and has continuously developed to meet the needs of theNestlé Organisation (e.g. increasing number of participants, new products, emerginganalytes). Today, the Nestlé PT program includes 200 analytes and 40 food matrices coveringchemical and microbiological domains. Nestlé operates more than 70% of this programinternally, under its ISO/IEC 17043:2010(1) accreditation. 30% of the program is executed byexternal organisations, and some of these PT schemes are operated and customised uniquelyfor Nestlé participants.
The ownership of the PT program by Nestlé offers multiple benefits to its 900 end-users. Thisincludes for instance, the use of realistic PT materials since actual Nestlé products are used.An annual reference material program is also generated using the same PT products, whichassists laboratories to monitor their chemical analytical methods on a daily basis. Laboratoriesapply validated analytical methods and PT generates valuable data supporting methodvalidation studies. By centralising its PT program, the laboratory performance can betherefore monitored at Corporate and local Management levels. In this respect, a specialemphasis is placed at Nestlé on the follow-up of non-satisfactory laboratory performance. On-site technical assistance or transfer of analysis to another laboratory can be triggered based onthe PT results.
At Nestlé, participation in PT is mandatory for all routine analyses which emphasis the valuegiven to the PT, but generates an additional workload for the participants. While PT is apowerful tool, Nestlé participants and Nestlé PT provider are both facing challenges. From aNestlé participant perspective, PT samples can be perceived as non-routine samples sinceadditional steps (e.g. extra dilution) may be required to execute the analytical protocols.Equally, the unavailability of some specific analytes or matrices is a recurrent concern forsome participants. Here, the challenge faced by the Nestlé PT provider is to engage eightparticipating laboratories in order to accurately assess their performance.
A close collaboration between Nestlé laboratories, Nestlé PT provider and external PTproviders is essential to guarantee the fitness for purpose of its PT program. The benefits andchallenges associated to the participation in PT will be shared during this presentation andboth perspectives (i.e. participants vs. provider) will be therefore illustrated.
(1)ISO/IEC 17043: 2010- Conformity assessment — General requirements for proficiency testing
Book of Abstracts 17
Keynote lecture 2
Proficiency testing of wastewater sampling: What can we learn?
Magda Cotman and Albin Pintar
Laboratory for Environmental Sciences and Engineering, National Institute of Chemistry(NIC), Ljubljana, Slovenia
Since sampling errors were recognized in the context of ISO/IEC 17025 as an importantfactor affecting the quality of an analytical result, the needs for consistency of data arisingfrom the European Water Framework Directive 2000/60/EC rendered enhancement ofmetrological knowledge in this step of the measurement chain more significant. Samplingproficiency testing (SPT) is the counterpart of the analytical proficiency testing. The basicformat of the SPT is for each participating sampler to visit in succession a single target andtake an independent sample using a protocol of their choice.
The proficiency testing of wastewater sampling was organized by the Laboratory forEnvironmental Sciences and Engineering at NIC in partnership with the SlovenianEnvironment Agency and Central Wastewater Treatment Plant from Ljubljana. Preliminarytests started in 2010 at both candidate sites to choose for a trial the most convenient one. Thesampling site was prepared in advance for all participants. In the year 2012, we consequentlyorganized a collaborative field trial on wastewater sampling that is particularly important inthe environmental field, e.g. for exact analysis of wastewater. The trial was the first nationalattempt to improve knowledge of the effect in wastewater sampling undertaken as part ofregulatory monitoring. In the years 2013 and 2014, we continued with the organization ofsuch trials. From 16 to 20 sampling teams were selected among those that (i) participate in thenational wastewater monitoring programme, and (ii) perform analytical activities inlaboratories. The participants used 6 hour time-proportional sampling, however, they wereallowed to follow their own sampling protocols as well. The monitoring consisted of bothfield (i.e. pH value, temperature) and laboratory measurements (i.e. ammonium nitrogen,BOD5, COD, TOC, TSS and sulphate ion). All acquired samples were also analyzed at NIC inorder to minimize the analytical impact on global uncertainty. The purpose of this work wastherefore to carry out three collaborative field trials of wastewater sampling, to thoroughlyevaluate several sampling procedures, including standardized, as well as to determine thevariability induced by sampling operations in subsequent analytical processes. Particularattention was given to the estimation of measuring uncertainty containing contributions fromboth sampling and chemical analyses.
The scope of the exercises were to obtain a realistic picture of wastewater sampling, whichwas performed on a real sampling site, additionally settled in order to reduce an impact ofsampling site on the measurement uncertainty.
In contrast to the improvements that have occurred in analytical measurements, developmentsin the field of sampling are less intensive. With this respect, further collaborative trials will beconducted on a regular basis, in which the used methodology for measuring uncertaintyevaluation will be upgraded with other approaches.
18 8th Workshop on Proficiency Testing in Analytical Chemistry, Microbiology
and Laboratory Medicine, Berlin, October 2014
Keynote lecture 3
Revision of ISO 13528
Daniel W. Tholen, M.S.
Dan Tholen Statistical Consulting, Traverse City, Michigan, USA
Background
The International Standard ISO 13528 (2005): Statistical methods for use in proficiency
testing by interlaboratory comparisons is widely cited as the basis for statistical methods usedto evaluate performance of laboratories in proficiency testing schemes. The Standard wasdeveloped by ISO Technical Committee 69 on Application of Statistical Methods,Subcommittee 6 on Measurement methods and results. It was written as a requirementsdocument to accompany ISO Guide 43-1 (1997): Proficiency testing by interlaboratory
comparisons – Part 1: Development and operation of proficiency testing schemes. ISO Guide43-1 was revised as ISO/IEC 17043 (2010): Conformity assessment – General requirements
for proficiency testing, so it became necessary to revise ISO 13528.
Current document
While many proficiency testing schemes claim that the statistical methods used are asdescribed in ISO 13528, no schemes actually follow the requirements in the Standard. Mostschemes use a limited subset of the techniques and guidance of ISO 13528, which primarilyare the robust technique to estimate the mean and standard deviation of the participant resultsin a round of proficiency testing (“Algorithm A”), the techniques to evaluate whether the
proficiency test items are sufficiency homogeneous and stable, and the use of performancescores z and En. Many schemes also use one of the five options described for determiningthe assigned value and five options for determining the performance criterion. There are agreat many requirements in ISO 13528 that are generally ignored, primarily related to thedesign of the scheme and checks on the appropriateness of assigned values and performancecriteria.
Changes in the Revision
The revision of the Standard is a complete rewrite of the current version, but it retains themost commonly used methods. There will be the addition of several robust techniques andperformance statistics, and there will be substantial additional guidance on the use ofstatistical methods. There will be changes to some of the notation used, which will not beconsistent with ISO/IEC 17043. The most significant changes are in the design elements,which are based on a simplified statistical model. The new model is consistent with currentgeneral objective for proficiency testing, which is to evaluate the fitness of routine laboratorymeasurement results (rather than the model in the current Standard, which seeks to evaluatelaboratory bias). There are few requirements in the revised Standard, the most significant ofwhich are that statistical methods shall be appropriate for the objectives of the scheme, for theassumed distribution of results, and for the expected number of results.
Expected publication
The final approved Standard will be published by June, 2015, if the FDIS ballot is successful.
Book of Abstracts 19
Keynote lecture 4
External Quality Assessment (EQA) / Proficiency Testing (PT) in
Developing Countries – in the Medical Laboratory Field
Sibongile Nyaradzo Zimuto1, Phoebe Sekai Nzombe
2, Patince Dabula
2, Nqobile
Ndlovu3, Talkmore Maruta
3
1Zimbabwe National Quality Assurance Programme (ZINQAP) trust, HarareZimbabwe
2National Health Laboratory Services (NHLS), Johannesburg, South Africa3African Society for Laboratory Medicine (ASLM), Addis Ababa, Ethiopia
Background
The implementation of Quality Systems has increased particularly in health caresystems. The drive towards accreditation of clinical laboratories by the World HealthOrganisation – Regional Office for Africa (WHO-AFRO) is aimed at strengtheninghealth systems, provide better results for patient care and improved quality of resultsfor clinical trials1. External Quality Assessment (EQA) was introduced into laboratorymedicine over 60 years ago, as tool monitoring and benchmarking laboratoryperformance2. EQA is now commonly used as a tool for assessing the quality oftesting services provided.3
Methodology
A survey of the current EQA/PT practices in developing countries, focusing on Africawas conducted. Literature review of published reports was carried out to determineEQA availability, participation and challenges in developing countries.
Results
Proficiency Testing (PT), Re-testing / Rechecking and On-site Evaluation are allforms of EQA used in developing countries. EQA is at various stages of developmentin these countries. In the more developed countries also known as emerging markets,such as India, China, Brazil and South Africa, EQA is well established. There arelocal PT service providers in these countries offering a wide range of testing services.Laboratory professionals in these countries are aware of the value of EQA andactively participate in the programmes, following up results and addressing poorperformance.
Medium and low-income developing countries have less developed EQA systems.Although some countries have national EQA programmes coordinated by theirgovernments or in some cases the private sector, the majority of the countries have toimport EQA services. Participation in EQA in these countries is limited, due to factorssuch as, lack of readily available service, the high costs involved and in some caseslow appreciation of the value of EQA. There are initiatives to strengthen QualitySystems and EQA in developing countries particularly in the health sector led bygovernments, development agencies and various funding partners. These agencies
20 8th Workshop on Proficiency Testing in Analytical Chemistry, Microbiology
and Laboratory Medicine, Berlin, October 2014
Keynote lecture 5
have provided funding and technical support for the laboratory systems strengthening,the provision, laboratory participation and the establishment of local EQAprogrammes.
In Sub Saharan Africa five countries have established and accredited PT programmes.Other countries run inter-laboratory comparisons or rely on services from othercountries. In most of the countries, EQA participation is voluntary and there are noconsequences for poor performance or non-returns.
Conclusion
There is need to strengthen EQA in developing countries in support of theimplementation of Quality Systems for improved service delivery in developingcountries. This can be achieved through initiatives such as legislating satisfactoryEQA performance as a requirement for continued registration. Providing training andtechnical assistance on the importance of EQA, how establishing local EQAprogramme and access of low cost inputs for the EQA programme such as PT panelsand PT data analysis software. The establishment of twinning arrangement betweenEQA providers in the developing countries and countries that have established EQAprogrammes would go a long way in further strengthening EQA in developingcountries.
References:
1. Ibrahim, I; Dosoo, D; Kronmann, K. C; Ouedraogo, I; Anyorigiya, T; Abdul,H; Sodiomon, S; Owusu-Agyei, S; Koram, K; June 2012; Good ClinicalLaboratory Practices Improved Proficiency Testing Performance at ClinicalTrials and in Centers in Ghana and Burkina Faso
2. Miller, W. G; Jones, G. R. D; Horowitz, G. L; Weykamp, C; AmericanAssociation for Clinical Chemistry; 2011; Proficiency Testing / ExternalQuality Assessment: Current Challenges and Future Directions. Accessed on26th July 2014 on http://www.who.int/ihr/lyon/EQA__NPHL_Africa.pdf
3. Overview of External Quality Assurance (EQA): World Health Organisation(WHO): Accessed 28th July 2014 onhttp://www.who.int/ihr/training/laboratory_quality/10_b_eqa_contents.pdf
4. List of Developing Countries; 2012; World Bankhttp://ddt//dataworldbank.org. Accessed 28 July 2014.
5. John Frean, Olga Perovic, Vivian Fensham, Kerrigan McCarthy, Anne vonGottberg, Linda de Gouveia, Bhavani Poonsamy, Leigh Dini, Jenny Rossouw,Karen Keddy, Wondimagegnehu Alemu, Ali Yahaya, Antoine Pierson,Virginie Dolmazon, Sébastien Cognat & Jean Bosco Ndihokubwayo;Bulleting of the World Health Organisation – External Quality Assessment ofNational Public Health Laboratories in Africa, 2002-2009. Accessed on 26th
July 2014 from http://www.who.int/bulletin/volumes/90/3/11-091876/en/
Book of Abstracts 21
Harmonisation of performance assessment in qualitative PT/EQA
Vivienne L A James
UK NEQAS for Microbiology, Public Health England, London, UK
Evaluation of participant performance is a pre-requisite in PT/EQA scheme design. At itsmost basic the evaluation is used to determine whether the result reported is correct or not.This of course requires a means of determining the correct result. For qualitative testing wherethe result is presence or absence assignment of the correct result is simple. Were the resultrequires accurate identification/ interpretation there may be a sliding scale for grading howclose the reported result is to the assigned result.
For quantitative PT/EQA schemes variability of the reported result from the correct result(assigned value) can be assessed in terms of precision, accuracy and bias using statistical toolsto determine acceptability. The statistical tools commonly used are described in ISO13528.Performance assessment is often based on the difference between the reported result and theassigned value and a performance score assigned.
For qualitative PT/EQA schemes there is no commonly accepted statistical evaluation. Someproviders apply scoring schemes that transform the qualitative results into a quantifiable datathat can then be used to apply a performance score. However scoring schemes vary, are notuniversally applied, challenges are not necessarily equivalent and many providers only assessacceptability of performance on an annual basis following completion of several PT/EQArounds.
Use of a harmonized approach across all PT/EQA schemes is seen by some as the Holy Grailwith the performance understood by participants, their customers and other stakeholders. Theissues associated with harmonization of performance assessment will be discussed.
22 8th Workshop on Proficiency Testing in Analytical Chemistry, Microbiology
and Laboratory Medicine, Berlin, October 2014
Keynote lecture 6

Short oral
presentations
Book of Abstracts 23
ISO/IEC 17043:2010 Accreditation: an Accreditation Body’s perspective
Robert Knake
The American Association for Laboratory Accreditation (A2LA), Frederick, MD, U.S.A
A2LA began the proficiency testing provider accreditation program in 1999 and currentlyaccredits 27 organizations offering proficiency testing schemes across a wide range ofmeasurement. The presentation will cover our assessment approach for these organizations toensure they are meeting the requirements of the standard and have appropriate technicalknowledge to conduct their proficiency testing schemes. Discussion will also include how weadapt to assessing providers across a wide range of measurement and varying organizationalstructures. Proficiency testing is critical to laboratory operations and accreditation ofproficiency testing providers has increased stakeholders’ confidence in their proficiency
testing schemes. The presentation will also include discussion on how A2LA has worked withstakeholders to promote further confidence in their proficiency testing providers throughaccreditation.
24 8th Workshop on Proficiency Testing in Analytical Chemistry, Microbiology
and Laboratory Medicine, Berlin, October 2014
Oral presentation 1
Mobile system for waste water sampling proficiency tests
Frank Baumeister, Michael Koch
AQS Baden-Württemberg, University of Stuttgart, Stuttgart, Germany
According to ISO/IEC 17025 laboratories shall have quality control procedures for monitoring thevalidity of tests and calibrations undertaken. Such monitoring usually includes quality measures likethe participation in interlaboratory comparisons such as proficiency testing (PT) activities. Theserequirements apply to testing and calibration as well as to sampling activities. In Germany, as inmany other European countries, there are no suitable PTs available in the field of waste watersampling. Therefore, a PT scheme for waste water sampling was implemented in Germany incooperation between the accreditation body, notification bodies and AQS Baden-Württemberg, a PTprovider situated at the University of Stuttgart.
This PT scheme is based on a mobile system for waste water sampling which was developed by AQSBaden-Württemberg. The system allows the execution of waste water sampling PTs under constantand normalized conditions and consists of a storage tank with an open channel (as sampling point) anda pumping system. A stirring unit in the storage tank homogenizes the waste water in order to ensurestable conditions for waste water sampling. This system can easily be established on different wastewater treatment plants.
Different sampling conditions can be simulated. The level of difficulty of the sampling procedure canbe increased by adding suspended solids or other substances. The complete procedure from samplingunder controlled conditions including homogenization, sample splitting and the measurement of on-site parameters can be realized. The participating laboratory takes samples according to a pre-definedtask given by the PT provider. The evaluation is based on an audit of the sampling procedure and onthe analytical results of the samples. For this purpose parallel samples are analysed in the participant’s
laboratory as well as in a reference laboratory chosen by the PT provider. The performance of thecomplete sampling procedure is certified and the audit can directly be used as a surveillance audit foraccreditation.
In the meantime three PTs were executed and the experiences and results are presented in thepresentation.
Book of Abstracts 25
Oral presentation 2
Proposed statistical analysis to evaluate the qualitative PT of Salmonella
serotyping
Marzia Mancin, Lisa Barco, Cristina Saccardin, Antonia Ricci
Istituto Zooprofilattico Sperimentale delle Venezie, Padua, Italy
The ISO/IEC 17043:2010 standard regarding proficiency testing (PT) specifies the importance ofparticipant performance evaluation using both quantitative and qualitative interlaboratorycomparisons. As far as Salmonella is concerned, more than 2500 serovars have been described.Correct identification of the serovar, once a strain has been isolated, is essential, since theidentification of different serovars in animal populations and foodstuffs has completely differentimplications in terms of corrective measures to be taken according to the food and animallegislations currently in place.
From 2007 the OIE and National Reference Laboratory for Salmonella (CRNs), within the IstitutoZooprofilattico Sperimentale delle Venezie (IZSVe), organizes annually the PT for Salmonella
serotyping “AQUA”. The performance of the participant laboratories is assessed based on theircapability to correctly identify serovars for 20 Salmonella strains. The strains used for the PT arechosen in order to include the serotypes of particular epidemiological interest, or those presentingan unexpected increase in their prevalence or those providing higher number of incorrect resultsduring previous PTs.
Two weeks before the beginning of the PT, the protocol and the form to report the PT results aresent via e-mail to all participants. A code is assigned to each PT participant to guarantee anonymity.Since for serotyping a standardized method is not currently available, each laboratory can use itsown protocol to perform the analysis. Each participant has to provide the organizer with theidentification of Salmonella serotype, somatic and flagellar antigen for each strain sent.
To evaluate the overall PT performance a detailed descriptive analysis of all results (identificationof serovar - somantic and flagellar antigens for each strain) is provided. Moreover, performance ofeach participant (in terms of identification of serovar) is assessed by using the Cohen’s K statistic
for multiple categories. K statistic is used both to estimate the agreement among all PT participantsand the agreement between each participant and the expected result (as defined by the PT provider).The K statistic allows estimating the agreement taking into account that a certain level of agreementcan be due to chance. This is defined as actual agreement beyond chance out of potential agreementbeyond chance. For each K value the 95 % confidence interval and value of significance iscalculated. Finally, both the overall performance and the performance of each participant areevaluated according to the Landis and Koch scale, which states that K values < 0 indicate noagreement, 0–0.20 slight agreement, 0.21–0.40 fair agreement, 0.41–0.60 moderate agreement,0.61–0.80 substantial agreement and 0.81–1 almost perfect agreement.
In 2013, 12 laboratories participated in the PT for Salmonella serotyping. All participants obtainedsignificant values of K>0.78 indicating substantial or almost perfect agreement with the expectedresults. The overall performance of the PT resulted equal to 0.8642 (CI95[0.769-0.893]; p<0.001).From 2007 to 2013, the K value over time was always >0.75, indicating a substantial agreementamong all participants in the qualitative PT of Salmonella serotyping.
26 8th Workshop on Proficiency Testing in Analytical Chemistry, Microbiology
and Laboratory Medicine, Berlin, October 2014
Oral presentation 3
Qualitative PT data analysis with easy-to-interpret scores
Christian Bläul, Steffen Uhlig
QuoData, Dresden, Germany
Introduction
Many important test methods are qualitative. Typical examples include methods for correctlyidentifying and counting microbiological specimens and medical screening methods yieldingyes/no statements. In the case of quantitative test methods, there are widely used standards forthe assessment of laboratory performance in proficiency tests. However, as far as qualitativetest methods are concerned, proficiency testing is not well standardized and there is noconsensus as to appropriate mathematical-statistical methods to be applied for the purpose oflaboratory assessment. Numerical scores for qualitative test methods with the same propertiesas z scores would prove very useful. In particular, rather than a mere countdown of true/falseresults, participants would obtain a much more differentiated picture for use in their internalquality decisions. Furthermore, such numerical scores would allow for participantperformance monitoring across PT rounds.
Proposed score calculation
In this presentation, it will be shown that numerical scores with properties similar to those ofz scores can be calculated for proficiency tests involving qualitative test methods. Thesescores do not require the use of replicates and are defined in such a way as to reflect both theLevel of Competence of the Laboratory (LCL) and the Level of Difficulty of the Task (LDT).On the basis of a logit statistical model, the parameters corresponding to the LCL’s and theLTD’s along with associated standard errors are determined via maximum likelihoodestimation [1]. With p denoting the probability for a positive result for a specific laboratoryand a specific task, the model can be interpreted as follows:
1 = .
The estimated parameters and their standard errors are then the quantities which are used tocompute the z scores for the participating laboratories:
= .
If z is in the range -2 … 2, the competence of the participant is not significantly different from
the average competence. If z is greater than 2, the competence is significantly higher and if zis less than -2, the competence is significantly lower.
References
[1] Schilling P, Powilleit M, Uhlig S. Macrozoobenthos interlaboratory comparison ontaxonomical identification and counting of marine invertebrates in artificial sediment samplesincluding testing various statistical methods of data evaluation. Accred Qual Assur Vol. 11(2006): 422–429.
Book of Abstracts 27
Oral presentation 4
Co-ordination of an organochlorine pesticides in water proficiency testing
scheme in South(ern) Africa
Désirée Prevoo-Franzsen, Nontete Nhlapo, Laura Quinn, Maria Fernandes-Whaley
National Metrology Institute of South Africa (NMISA), Pretoria, South Africa
Introduction
There are over 200 water testing laboratories in South Africa, of these, less than 60 areaccredited for some or all of the physical, chemical and microbiological testing requirementsdescribed in the South African National Standard for drinking water (SANS 241-1 and 241-2).Only 8 % of these accredited laboratories monitor for organic contaminants. A surveydistributed to these laboratories, indicated a need for a proficiency testing (PT) scheme tomonitor competence in quantifying organic contaminants in water. This paper will discuss theapproaches used to prepare and evaluate the PT samples and results, while highlightingchallenges identified in coordinating and participating in the PT scheme.
Results
The National Metrology Institute of South Africa (NMISA) has conducted four rounds of thePT scheme for trace levels of organochlorine pesticides (OCPs) in water, where 2 x 1L ofwater spiked with a selection of OCPs, was distributed to participants. A maximum number of11 participants registered in any one round. The assigned value was determined as the purityand density-corrected gravimetric preparation value of the solutions. The expanded uncertaintyon the preparation was reported at an approximate 95 % level of confidence with a coveragefactor of 2. The purity of the reference material; repeatability of the bottling and gravimetricspiking; and homogeneity, were included in the uncertainty estimation of the assigned value.Homogeneity was assessed using gas chromatography isotope dilution mass spectrometry (GC-IDMS). It was not possible to perform two independent assessments of each sub-unit, as themeasurement method uses the entire sample for analysis. Therefore, the use of ANOVA forhomogeneity assessment as recommended in ISO 13528, was not applicable, and the standarddeviation of replicate analyses was used as an indicator of homogeneity. Participants achievedsimilar reproducibility (% RSD) as those predicted by the Horwitz interlaboratoryreproducibility standard deviation model. The model predicts an exponential increase for resultvariation as the concentration of the analyte decreases, resulting in % RSDs in the range of 60-100 %. This casts doubt on the absence or presence of the analyte. The alternatative Horwitzmodel, for concentrations below 10 µg/L, was thus employed to describe the participant‘s
performance, where the maximum expected % RSD is between 20-25 %.
Challenges
Distribution of samples across African borders is particularly costly; often tripling the cost toparticipate in the PT scheme. Due to the limited stability of the analytes in the PT samples,rapid and reliable distribution of the samples is particularly important. The most commonchallenge for the participants was achieving the required detection limit, as the OCPconcentrations were in the parts per trillion range, resulting in laboratories either failing tosubmit results or reporting analytes as “not detected”. This challenge can be largely attributedto limited recovery due to a lack of appropriate pre-concentration techniques in themeasurement method.
28 8th Workshop on Proficiency Testing in Analytical Chemistry, Microbiology
and Laboratory Medicine, Berlin, October 2014
Oral presentation 5
The question of homogeneity inside a chimney:
application of ISO 13528 to stack emission proficiency tests
Jens Cordes, Benno Stoffels, Dominik Wildanger
Hessian Agency for the Environment and Geology, Department I3 – Air Pollution, Emission(Hessisches Landesamt für Umwelt und Geologie (HLUG)), Kassel, Germany
Background
Quality control in the field of industrial emission measurements is an important issue forhuman health and the environment. Since 1994, the Hessian Agency for the Environment andGeology (HLUG) offers stack emission proficiency tests (PTs) on a self-made emissionsimulation apparatus (ESA). The PTs include gaseous (organic and inorganic) and particulatematter (heavy metal doped dust) emissions. Participation in such PTs is mandatory by law forinstitutes authorized to perform legally valid emission measurements in Germany.
HLUG’s ESA
The ESA was designed to serve as a reasonable approximation to an industrial factorychimney. It has a total length of 110 m and reaches over 7 floors of the HLUG building.Central part is a 23 m high vertical round conduit with a diameter of 40 cm. The measurementpoints for the PT participants are positioned along this section of the ESA. The “stack
emission” gas flow is generated using ambient air, usually with 10 m/s and 4500 m³/h.Pollutants are added at the dosing lab in the basement, which is equipped with rotary gasmeters, a calibration gas generator, and thermal mass flow meters for gas and liquid vapordosing, as well as a brush powder disperser for dust dosing. Volume flow, temperature,humidity, and concentrations of fine particles, SO2, NOx, organic components, and other gasesare continuously measured during PTs to double-check the concentrations generated by thedosing lab.
The Question of Homogeneity
A unique challenge arises when ISO 13528 is applied to our PTs. While homogeneity of theused gases, liquids, and dusts can easily be demonstrated, the equivalence of the measurementpoints along the ESA is a completely different matter. Since each test item batch (in our casethe pollution-doped ESA “stack emission” gas) only exists during one measurement, thestandard procedure for determination of homogeneity (in our case equivalence of thesampling openings) is not applicable to determine compliance to the standard.
Our Solution
To demonstrate the equivalence of the measurement points on our ESA, we conducted avalidation measurement program, interpreting ISO 13528 Annex B according to our uniquecircumstances.
Book of Abstracts 29
Oral presentation 6
Round frequency & participation longevity:
An assessment of the critical parameters for determining proficiency
in the analysis of occupational hygiene samples
Mary Ann Latko1, Angela Oler
1, Daniel Tholen
2
1AIHA PAT Programs, Falls Church, USA2Dan Tholen Statistical Consulting, Traverse City, USA
Introduction
A study was conducted for the AIHA Proficiency Analytical Testing (PAT) Programs’
Industrial Hygiene (IHPAT) and Environmental Lead (ELPAT) Proficiency AnalyticalTesting Programs to evaluate performance of laboratories related to the length and level ofproficiency testing program participation. Ten years of data was analyzed for trends inparticipant performance over time.
Background
The IHPAT and ELPAT schemes require proficiency testing to be completed four times eachyear and consist of four concentration levels per round. IHPAT analytes include metals (lead,cadmium, nickel, manganese, chromium), silica, asbestos, organic solvents (benzene, ethylacetate, n-butyl acetate, methanol, 2-propanol, chloroform, 1,2-dichloroethane, 1,1,1-trichloroethane, o-xylene, toluene, trichlorethylene, tetrachlorethylene), and diffusive samplerbadges (benzene, toluene, o-xylene). The analytes are deposited on appropriate sample media-- filters, charcoal tubes, or diffusive sampler badges. Matrices for ELPAT Program samplesinclude paint chips, soil, dust wipes, and air samples.
Statistical methods use the consensus of a reference group of experts, and a winsorizationtechnique similar to what is described in ISO 13528:2005. The definition of the referencegroup has changed recently, to better represent the larger body of participants. The IHPATand ELPAT Programs are accredited to ISO/IEC 17043:2010 by A2LA.
The study
Participant performance data from the most recent ten years was analyzed to identify trendsand critical points of performance improvement as related to the frequency of proficiencytesting and the length laboratory participation in the IHPAT or ELPAT program. The studycompares the performance of long-time IHPAT and ELPAT participants to those who have ashorter period of participation to determine if there is a critical minimum length ofparticipation or number of round completions that are required before a participant’s
proficiency shows marked and sustainable improvement. Finally, the study analyzes theimpact of round frequency on participant performance and proficiency determination. Thestudy analyzes the impact of missed rounds and irregular or sporadic participation onproficiency.
30 8th Workshop on Proficiency Testing in Analytical Chemistry, Microbiology
and Laboratory Medicine, Berlin, October 2014
Oral presentation 7
Systematic errors of colony count methods revealed by microbiology
proficiency testing
Katrin Luden, Ernst-August Heinemeyer
Governmental Institute of Public Health of Lower Saxony (NLGA), Aurich, Germany
Microbiology PT in drinking water analysis
The Governmental Institute of Public Health of Lower Saxony (NLGA) provides proficiency testing (PT) schemes for drinking water in Germany. For the microbiology scheme the methods of analysis are determined by the German drinking water ordinance based on the EU-drinking water directive 98/83/EC. Usually samples are prepared as liquid samples containing pure or mixed cultures of known organisms and target values are determined as consensus values using robust statistics (Hampel-method; DIN 38402-45). Colony count methods as used in this particular PT have always been the backbone of the quality control of drinking water monitoring. These methods are a good indicator for changes in the system.
Findings: colony count methods
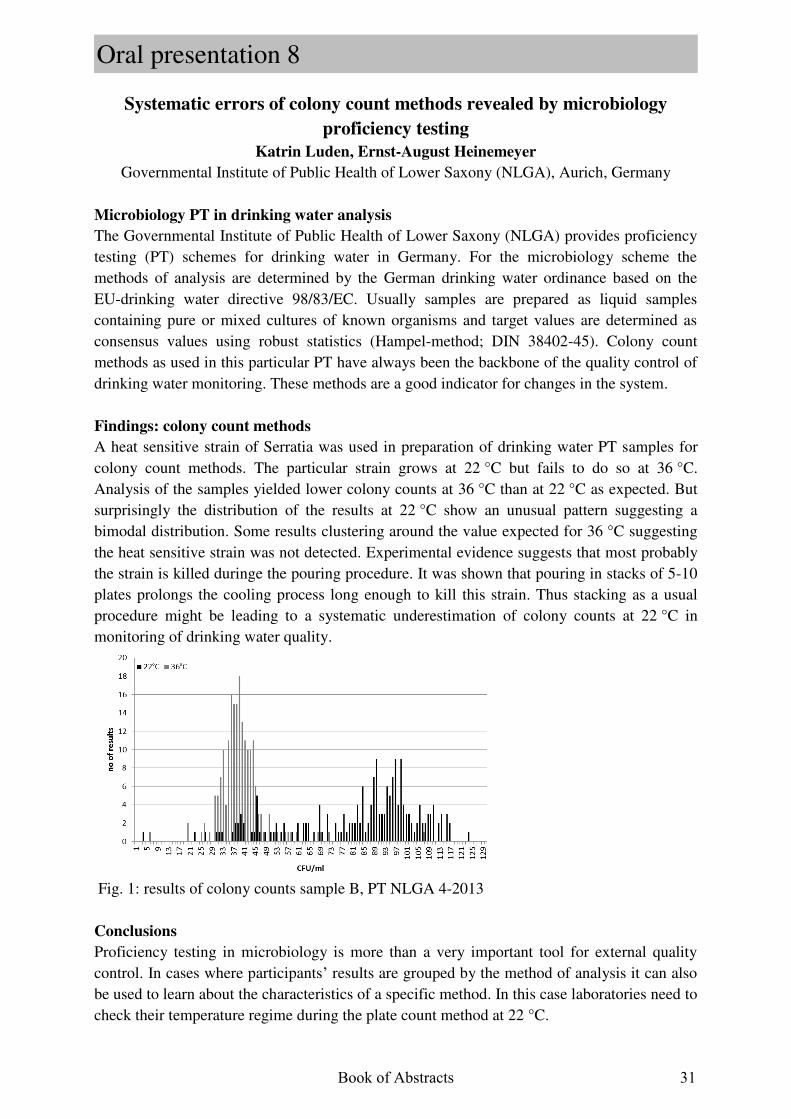
A heat sensitive strain of Serratia was used in preparation of drinking water PT samples for colony count methods. The particular strain grows at 22 °C but fails to do so at 36 °C. Analysis of the samples yielded lower colony counts at 36 °C than at 22 °C as expected. But surprisingly the distribution of the results at 22 °C show an unusual pattern suggesting a bimodal distribution. Some results clustering around the value expected for 36 °C suggesting the heat sensitive strain was not detected. Experimental evidence suggests that most probably the strain is killed duringe the pouring procedure. It was shown that pouring in stacks of 5-10 plates prolongs the cooling process long enough to kill this strain. Thus stacking as a usual procedure might be leading to a systematic underestimation of colony counts at 22 °C in monitoring of drinking water quality.
Fig. 1: results of colony counts sample B, PT NLGA 4-2013
Conclusions
Proficiency testing in microbiology is more than a very important tool for external quality control. In cases where participants’ results are grouped by the method of analysis it can also be used to learn about the characteristics of a specific method. In this case laboratories need to check their temperature regime during the plate count method at 22 °C.
Book of Abstracts 31
Oral presentation 8
A comparison of statistical procedures using 8000 datasets from the
Quasimeme proficiency testing scheme
Wim Cofino1, Paul Torfs
2, Steven Crum
1, Joop Harmsen
1
1Wageningen University and Research Centre, Environmental Science Group, Alterra, Wageningen, The Netherlands
2 Wageningen University, Hydrology and Quantitative Water Management Group , Wageningen, The Netherlands
In the past decades, a number of robust statistical techniques have been introduced and used to evaluate proficiency tests. Commonly employed approaches include the Huber implementations described by Lischer, the UK Analytical Methods Committee and ISO 13528 (2005 edition) and the DIN A45 38402 standard which employs the Q method for the reproducibility standard deviation and Hampel’s redescending M estimator to obtain a robust mean. In the WEPAL proficiency scheme up to 2009 an approach was used based on successively discarding outliers [1] After 2009, WEPAL switched to NDA the model used in Quasimeme published by our team in 2000 [2] and recently reformulated. Up to today, no systematic large scale study has been carried out to compare these approaches on real datasets. In this paper, we report a study which compares the means obtained with the statistical methods listed above and the FASTS method [3] on more than 8000 datasets obtained in the Quasimeme proficiency testing scheme. The datasets encompass different analytes, matrices concentration levels and number of participants. The results are analysed according to the number of data [4] and the distribution characteristics of the datasets. It is found that the three procedures using the Huber M estimator and the method employing the redescending M estimator of Hampel can differ by factors up to ten from the results obtained with the FASTS and the NDA methods for datasets with 9<=n<20 data. The differences between robust means obtained by the different methods becomes much less as the datasets increase, and are within about 5 % when n is about 50. The relationships of the robust means normalized to the NDA mean were studied in relation to the robust skewness. Strong positive and significant correlations of the normalized means and robust skewness are found for the three Huber methods and Hampel. In our interpretation the observations imply that these methods are more susceptible for skewness. The normalized means of FASTS depicts a negative correlation with robust skewness, which may imply that it is less susceptible to skewness than the NDA approach. The variability of the FASTS robust means, however, seems to be much higher. [1] van Montfort M A J, “Statistical remarks on laboratory-evaluating programmes for comparing
laboratories and methods.,” Commun Soil Sci Plant Anal, vol. 27, pp. 463–478, 1996. [2] W. P. Cofino, I. H. M. van Stokkum, D. E. Wells, F. Ariese, J. W. M. Wegener, and R. A. L. Peerboom,
“A new model for the inference of population characteristics from experimental data using uncertainties. Application to interlaboratory studies,” Chemom. Intell. Lab. Syst., vol. 53, no. 1–2, pp. 37–55, 2000.
[3] M. Saliban-Barrera and V. J. Yohai, “A Fast Algorithm for S-Regression Estimates,” J. Comput. Graph. Stat., vol. 15, no. 2, pp. 1–14, 2006.
[4] M. Belli, S. L. R. Ellison, A. Fajgelj, I. Kuselman, U. Sansone, and W. Wegscheider, “Implementation of proficiency testing schemes for a limited number of participants,” Accredit. Qual. Assur., vol. 12, no. 8, pp. 391–398, Feb. 2007.
32 8th Workshop on Proficiency Testing in Analytical Chemistry, Microbiology
and Laboratory Medicine, Berlin, October 2014
Oral presentation 9
Asymmetric proficiency test distributions – cause and analysis
Mark Sykes
FAPAS, York, UK
Observations
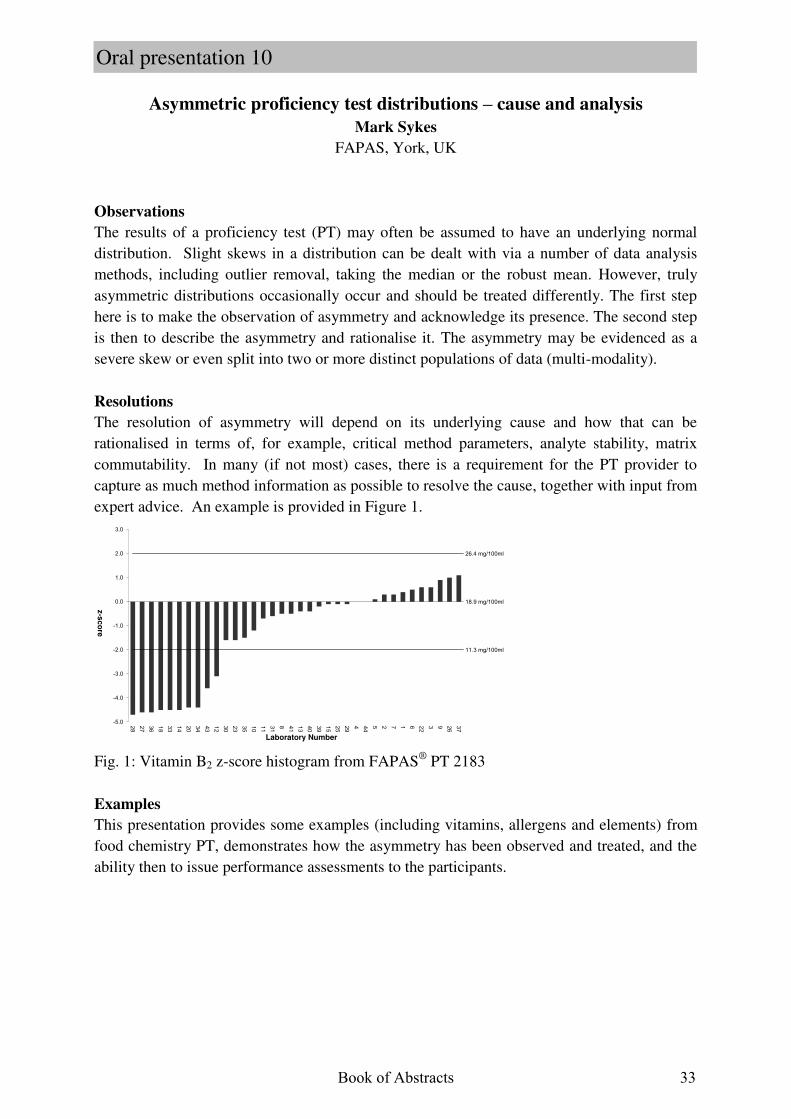
The results of a proficiency test (PT) may often be assumed to have an underlying normal distribution. Slight skews in a distribution can be dealt with via a number of data analysis methods, including outlier removal, taking the median or the robust mean. However, truly asymmetric distributions occasionally occur and should be treated differently. The first step here is to make the observation of asymmetry and acknowledge its presence. The second step is then to describe the asymmetry and rationalise it. The asymmetry may be evidenced as a severe skew or even split into two or more distinct populations of data (multi-modality).
Resolutions
The resolution of asymmetry will depend on its underlying cause and how that can be rationalised in terms of, for example, critical method parameters, analyte stability, matrix commutability. In many (if not most) cases, there is a requirement for the PT provider to capture as much method information as possible to resolve the cause, together with input from expert advice. An example is provided in Figure 1.
28
27
36
18
33
14
20
34
43
12
30
23
35
10
11
31
8 41
13
40
39
15
25
29
4 44
5 2 7 1 6 22
3 9 26
37
26.4 mg/100ml
18.9 mg/100ml
11.3 mg/100ml
-5.0
-4.0
-3.0
-2.0
-1.0
0.0
1.0
2.0
3.0
z-s
co
re
Laboratory Number
Fig. 1: Vitamin B2 z-score histogram from FAPAS® PT 2183
Examples
This presentation provides some examples (including vitamins, allergens and elements) from food chemistry PT, demonstrates how the asymmetry has been observed and treated, and the ability then to issue performance assessments to the participants.
Book of Abstracts 33
Oral presentation 10

34 8th Workshop on Proficiency Testing in Analytical Chemistry, Microbiology
and Laboratory Medicine, Berlin, October 2014

Poster
presentations
Book of Abstracts 35
Inorganic gas pollutants proficiency testing scheme within
Air Quality Measurement program
Maurizio Barbiere, Annette Borowiak, Friedrich Lagler European Commission - Joint Research Centre, Ispra, Italy
Through the Ambient Air Quality Directive (2008/50/EC) a major step has been made forward to harmonised air quality data in Europe. One of the objectives of this Directive is to ‘assess the ambient air quality in Member States on the basis of common methods and
criteria’. This Directive specifies the reference method for specific atmospheric pollutants and sets Data Quality Objectives (DQO) for the uncertainty, minimum data capture and time coverage. Among others the Directive asks for the organisation of quality assurance programs at European level. For this purpose since the early 90’s the European Reference Laboratory for Air Pollution (ERLAP) of the European Commission’s Joint Research Centre, carries out proficiency testing (PT) on a regular basis for member states, associated and candidate countries of the EU. ERLAP organizes PTs covering several pollutants like organic gases, inorganic gases, Particulate Matters (PM), heavy metals and Elemental Carbon/Organic Carbon (EC/OC).
All the European National Reference Laboratories (NRLs), joined in the AQUILA Network, are obliged to participate to PTs. More than 45 NRLs, which are responsible for QA/QC of measurements in their countries, coming from 35 European countries, including EFTA, Central and Eastern Europe, participated in these PTs. The PTs were carried out in line with ISO Guide 43-1 and more recently to ISO/IEC 17043. One of the main objectives of these IEs is to harmonise the calibration and testing procedures used by the NRLs through the evaluation of their comparability.
The results of PTs on inorganic gaseous pollutants (sulphur dioxide - SO2, carbon monoxide -
CO, ozone – O3, oxides of nitrogen - NOx) which took place from 2003 to 2013 are described. Gaseous mixtures containing varying concentrations of SO2, CO, O3 and NOx were generated and then measured. The participants calibrated the automatic analysers versus
their own travelling standards. The performance parameters z-score, En number, repeatability and reproducibility of the submitted results were evaluated. Generally z-score, En Number and repeatability showed a good performance. The reproducibility at the limit values from the
last ten years of PTs were compared with the DQO and the requirements from the EN standards. The best results were achieved for NO and O3, followed by CO while for SO2 and NO2 results are more complex. The PTs allow sharing experiences and know-how among NRLs and are seen as a tool to improve the comparability of measurement methods. They have demonstrated that the use of metrologically traceable standards and the implementation of a standardised quality
management system are key issues for improving the quality of measurements.
36 8th Workshop on Proficiency Testing in Analytical Chemistry, Microbiology
and Laboratory Medicine, Berlin, October 2014
Poster 1
IMEP at the service of the EURL-HM. The case of IMEP-117: Determination of total As, Cd, Pb and Hg in
compound feed
Yiannis Fiamegos, Fernando Cordeiro, Beatriz de la Calle, Piotr Robouch
European Commission, Joint Research Centre, Institute for Reference Materials and Measurements, Geel, Belgium
The International Measurement Evaluation Programme (IMEP®) is a proficiency test provider owned by the European Commission and accredited according to ISO 17043:2010. It is designed to support the European legislation, the harmonisation of analytical measurements and the improvement of the analytical capabilities of laboratories. The outcome of the IMEP-117 project – Determination of total As, Cd, Pb and Hg in compound feed - organised on behalf of the European Union Reference Laboratory for Heavy Metals (EURL-HM) will be presented and the following topics will be thoroughly discussed:
1. The IMEP experimental design, including the characterisation of the homogeneity and stability of the test items, and the "atypical" benchmarking of the laboratories measurements results against the IMEP certified reference value (independently assigned by laboratories expert in the field).
2. The assessment of the performance of the participating laboratories according to ISO 13528: 2005 and the additional evaluation of the measurement uncertainty reported.
3. The novel assessment of the reported "less than" values.
These IMEP practices have resulted in an improvement of the analytical skills of the recurrently participating laboratories to IMEP's proficiency tests (EURL-HM network of laboratories). As an example could be mentioned the small number of laboratories (3 out of 25 for total As, 0 out of 29 for total Cd, 1 out of 29 for total Pb and 4 out of 28 for total Hg) having underestimated their uncertainties in IMEP-117.
Book of Abstracts 37
Poster 2
Proficiency testing as a tool to point out criticalities in the strategy
for control of antibiotic residues in milk: the Italian experience
Anna Maria Ferrini, Umberto Agrimi, Brunella Appicciafuoco,
Renata Borroni, Gianni Ciccaglioni, Fabio Galati, Marina Patriarca
Istituto Superiore di Sanità, Roma, Italy
Introduction and objectives
Since antibiotic treatment in lactating animals may cause the presence of residues in milk,maximum residue levels (MRLs) were established to guarantee the safety of food of animalorigin in this respect. According to Commission Decision 2002/657/EC, screening is the firststep in the strategy for residue control, thus making the choice of the screening methods acritical point of the entire control procedure. As part of its tasks, according to Regulation (EC)882/2004, the Italian National Reference Laboratory (NRL) for veterinary antimicrobialresidues in food from animal origin organized a proficiency test (PT) for the detection ofantibiotic residues in milk with the aim to:
o assess the competence of official control laboratories with regard to the screening ofthe most used antibiotics in the dairy sector;
o get an insight of the screening methods applied in Italy;o point out criticalities, if any;o evaluate the effect of the milk fat content level (1.8 % and 3.5 %) on the identification
of equal concentrations of the same antibiotics in milk samples.
Method
Thirty-eight laboratories received 2 series (respectively at 1.8 % and 3.5 % of fat content) of 9lyophilized milk samples, spiked with cloxacillin, benzyl penicillin, sulfadiazine andoxytetracycline at concentrations of 1x and 2x MRLs. An unspiked sample was also enclosedin each series.
Results
As a whole, a good global laboratory performance was observed, as assessed by:sensibility = 78.8 %; specificity = 100 %; accuracy = 81.3 %; false positive rate = 0 %; falsenegative rate = 62.3 %. However, it was documented that each laboratory used only one screeningmethod and, in total, only two commercial kits, based on similar principles, were applied (“DelvoSP NT”, 35 labs - or “Copan test”, 3 labs). A criticality was then identified in oxytetracyclinecontrol, even for milk samples with reduced fat content, due to the fact that both screeningmethods, as indicated also by the manufacturers, show low sensitivity for this molecule.
Conclusions
Considering that at present the “ideal screening method” does not exist, with this PT thethe NRL provided guidance to participating laboratories in Italy in order to ensure thedetection of a wider spectrum of antibiotic families implementing different screeningmethods. Following the issuing of the report, the laboratories involved undertook correctiveactions. The effectiveness of these actions will be evaluated with a new PT round currentlybeing planned.
38 8th Workshop on Proficiency Testing in Analytical Chemistry, Microbiology
and Laboratory Medicine, Berlin, October 2014
Poster 3
Performances of the Italian official control laboratories for the content of
cadmium in infant formula in view of new European Union legislation
Antonella Semeraro1, Valeria Patriarca
1, Augusto Pastorelli
1, Stefania Morelli
1, Elisabetta
Sagratella1, Maria Ciprotti
2, Laura Ciaralli
2, Paolo Stacchini
1, Marina Patriarca
1
1NRL for Heavy Metals in Food, Istituto Superiore di Sanità, Rome, Italy2EURL for Chemical Elements in Food of Animal Origin, Istituto Superiore di Sanità, Rome, Italy
Introduction
Following an initiative of the EURL-CEFAO and to support the Italian official controllaboratories, in 2013 the Italian National Reference Laboratory for Heavy Metals in Food(NRL-HM) organized a proficiency testing (PT) for the content of lead and cadmium in apowdered infant formula. On the 12th of May 2014 the EU Regulation 1881/2006 settingmaximum levels for certain contaminants in foodstuffs was amended as regards maximumlevels of cadmium in certain foodstuffs (EU Regulation 488/2014). According to this new EUlegislation, new limits, ranging from 0.005 to 0.040 mg/kg, will apply for the content ofcadmium in foods for infants and young children starting from the 1st January 2015.
Materials and methods
On request and financial support of the Italian NRL-HM, the EURL-CEFAO produced alarger number of items for PT, alongside the batch for their own activities as a PT provider.The starting material was a commercial infant formula based on animal protein, spiked withknown amounts of the elements of interest. The samples were distributed to the Network ofNRLs and, subsequently, the Italian NRL distributed them to the Italian official controllaboratories. Participants were asked to report their results along with some information onthe performances of the analytical procedures applied, in particular as regard to the limits ofdetection and quantification. The assigned values were calculated as the robust mean of theNRLs results using algorithm A according to ISO 13528. Analytical performance wasassessed by z-scores. The standard deviation for proficiency assessment (σ p) was derived fromthe Horwitz equation.
Results
The assigned value was established as 0.00710 mg/kg with a standard uncertainty of 0.00030mg/kg. This value is comparable with the limit of 0.010 mg/kg set by the new EU legislation.Of the thirteen laboratories who submitted results for the content of cadmium, all but twoachieved acceptable z-scores. The limits of detection and quantification were compared to therequirements stated in EC Regulation 333/2007 to assess the suitability of the availablemethods for the determination of the cadmium content in food for infants and young children.
Conclusion
One of the activities of NRL-HM is to provide support to the analytical capabilities ofnational laboratories involved in official control. The organization of this exercise provided anopportunity for Italian laboratories to test their performances in a new field and for the NRLto document their capabilities and address potential criticalities in the implementation of thenew EU legislation.
Book of Abstracts 39
Poster 4
Preparation of an infant formula proficiency testing material and
assessment of its homogeneity and stability
Angela Sorbo, Maria Ciprotti, Andrea Colabucci, Marco Di Gregorio,
Anna Chiara Turco, Laura Ciaralli
European Union Reference Laboratory for Chemical Elements in Food of Animal Origin (EURL-CEFAO), Istituto Superiore di Sanità, Rome, Italy
Introduction
Commission Regulation (EC) 1881/2006 sets Maximum Levels (MLs) for lead (Pb) in infant formula (IF) and follow-on formula “ready to use” (liquid form or powder reconstituted as instructed by manufacturer), but the introduction of a ML for cadmium (Cd) in the product “as sold” (liquid or powder without reconstitution) was debated at EU level. As a consequence the EURL-CEFAO organized in 2012 the 17th proficiency test (PT) on the determination of Cd and Pb in powdered IF based on animal protein so as to give the National Reference Laboratories of the EU Member States the opportunity to check their performance when low levels of Cd and Pb have to be determined in the powdered matrix.
PT material: preparation, homogeneity and stability
The procedure of the material production was tested by preparing a preliminary batch: some commercial infant formulae based on animal proteins were analysed for the content of Cd and Pb. As the level of these analytes in all products was found negligible, the material had to be spiked with both Cd and Pb. Furthermore, several brands were checked in order to select the formula that could be dissolved with the least quantity of water in order to avoid a long and expensive lyophilisation process. The procedure set up on the test batch was followed to prepare the material for PT. Briefly, the starting powder was reconstituted with the spiked solution, transferred into plastic boxes, stored frozen and finally lyophilized. The stability test was performed on the preliminary batch containing Cd and Pb at around the same levels planned for the PT material. The stability was proven for the duration of the exercise but further tests demonstrated that the material was stable for at least 12 months. The sufficient homogeneity was evaluated on the PT material before the shipment by means of a method included in the flexible scope of accreditation and based on microwave acid assisted digestion
and ICP-MS[1]. The standard deviation for proficiency assessment (p) used in the tests was
more restrictive than that coming from Horwitz.
Conclusion
The material prepared for the 17th EURL-CEFAO PT was found homogenous and stable over a period of time much longer than the duration of the exercise. These results were valuable
taking particularly into account the low levels proposed and the restrictive p used to perform
the tests. Furthermore, the PT was particularly valuable considering that Commission Regulation (EC) 1881/2006 has been recently amended (Commission Regulation (EU) 488/2014) with the introduction of the new ML for Cd in formulae based on cows' milk proteins (0,010 mg/kg in force from 1 January 2015) and that this new ML is consistent with the concentration value proposed in the 17th PT. 1A. Sorbo, A.C. Turco, M. Di Gregorio, L. Ciaralli, Food Control 44 (2014): 159-165
40 8th Workshop on Proficiency Testing in Analytical Chemistry, Microbiology
and Laboratory Medicine, Berlin, October 2014
Poster 5
Ad-hoc material for proficiency testing: freeze-dried liver
Andrea Colabucci1, Alessandra Sepe
2, Maria Ciprotti
1,Laura Ciaralli
1
1European Union Reference Laboratory for Chemical Elements in Food of Animal Origin(EURL-CEFAO), Istituto Superiore di Sanità, Rome, Italy
2Dept. of Food Safety and Veterinary Public Health, Istituto Superiore di Sanità, Rome, Italy
Introduction
EU Reference Laboratories for food safety have been designated to contribute to theachievement of high quality and uniformity of analytical results among the Member States.Their tasks, as in Regulation (EC) No 882/2004, include the organization of ProficiencyTesting (PT) for the network of National Reference Laboratories (NRLs) of EU MemberStates according to the area of competence. This crucial assignment leads the EURL-CEFAOto plan PTs including various combinations of chemical elements/matrix/concentrations inorder to organize a profitable exercise for the NRLs network, especially in those cases whereMaximum Levels (MLs) are set in EU legislation (Commission Regulation (EC) No1881/2006) and therefore acceptance of sample is required (Commission Regulation (EC)333/2007), being NRLs third parties in legal controversies.
PT items preparation
Offal was considered as a matrix of interests for participants, therefore a PT was scheduled onthe determination of Cadmium (Cd) and Lead (Pb) in freeze-dried liver. After the purchase ofa suitable amount of material at a retail store, a preliminary study was conducted to assess themass fraction of Cd and Pb in the fresh sample and the yield of the lyophilisation process. Thegoal was the achievement of a sample with a content of Cd and Pb around the ML (0.50mg/kg for both analytes). The bulk material for the PT was divided into seven parts that werespiked with a calculated amount of analytes; afterwards each portion was homogenized andanalyzed. All the material was then lyophilized, gathered up and after sieving, quartering,bottling and labelling, the final PT items were γ -irradiated.
Results and conclusions
The sufficient homogeneity test of the material was carried out by Graphite Furnace AtomicAbsorption Spectrometry after microwave assisted sample digestion on 10 of the 130 itemsproduced. It was evaluated using a standard deviation for proficiency assessment (10 % forCd, and 13 % for Pb) set a priori by the EURL on the basis of the performance required to theNRLs according to their role. The congruence between the planned concentration and thevalues found in the homogeneity test was confirmed by the assigned value obtained byconsensus from participants. This result proved the suitability of the procedures implementedby the EURL to achieve the concentration planned and the “fitness for purpose” of thisinterlaboratory comparison.
Book of Abstracts 41
Poster 6
Improvement in the detection of viral contamination in shellfish in Italy
through interlaboratory exercises
Elisabetta Suffredini, Gianni Ciccaglioni, Loredana Cozzi, Marina Patriarca
Department of Veterinary Public Health and Food Safety, Istituto Superiore di Sanità, Rome, Italy
Introduction
Bivalve shellfish are internationally recognized as a potential vehicle for human enteric viruses transmission, especially when consumed raw or improperly cooked. In view of the definition of a standardized reference method for detection of viruses in foods, later published as ISO/TS 15216-2:2013, the Istituto Superiore di Sanità, as the Italian National Reference Laboratory (NRL) for monitoring of viral contamination in bivalve molluscs, developed in 2012 a proficiency testing (PT) scheme to verify the progressive harmonization of detection procedures and ensure the quality of results produced by Italian official control laboratories.
Materials and methods
A standardized procedure based on ISO/TS 15216-2, validated in-house and accredited by the NLR, was made available to the laboratories, together with training activities and reference materials for its implementation. Three sample distributions were organized in 2012, 2013 and 2014; a minimum of 11 laboratories participated in the exercises, covering the whole network of the Istituti Zooprofilattici Sperimentali (II.ZZ.SS., the Italian public veterinary institutes involved in official controls). Each distribution included up to 6 liquid suspensions (extracts from shellfish naturally or experimentally contaminated) and 2 shellfish homogenates. Liquid suspensions allowed to control the nucleic acid extraction procedure and the detection of target viruses (Hepatitis A, Norovirus genogroup I and II) by real-time PCR, while shellfish homogenates were used to verify the entire analytic procedure, including sample preparation. The participants’ results were evaluated to calculate sensitivity, specificity and accuracy.
Results and discussion
Altogether, the results obtained by the laboratories showed, over the years, a relevant improvement of the performance for all of the three targets, reaching for all of them an accuracy >90 % in 2014 (100 % for Hepatitis A, 92.5 % for Norovirus GI and 93.6 % for Norovirus GII). The more significant progresses were shown in the analysis of the more complex matrix, the shellfish homogenate, with an accuracy of the detection increasing from 38.8% to 100% for Hepatitis A, and from 55.0 % and 65.0 % to 95.2 % and 100 % respectively for Norovirus GI and GII.
42 8th Workshop on Proficiency Testing in Analytical Chemistry, Microbiology
and Laboratory Medicine, Berlin, October 2014
Poster 7
Nematode sample preparation for a reclaimed water proficiency testing
scheme
Raquel Múrtula, Adela Yañez, Melissa Fernández, Elena Soria, Vicente Catalán
ielab Calidad, Alicante, Spain
With the scarcity of water in some parts of the world and with water management being so important nowadays, the reuse of the treated wastewater is becoming more important. Reclaimed water can be used for gardens and landscaping irrigation and other uses such as street-sweeping apparatus, power generation, fire protection, aquifer recharge and natural system restoration. Due to the increasing use of reclaimed water, its quality control has become mandatory for public health protection. Different standards and national regulations include analytical procedures and parameters for its control depending on the final use.
In order to externally assess the performance of laboratories doing these analyses, ielab developed a proficiency testing (PT) scheme for reclaimed water, where around 35 laboratories analyzed natural samples looking for the established parameters in the regulations (Escherichia
coli, intestinal nematodes, Legionella spp., turbidity and suspended solids). This work presents the preparation of intestinal nematode eggs samples for this PT scheme and the statistical evaluation of the submitted results.
Aliquots containing a defined concentration of eggs were prepared under optical microscope from a pull of the species of interest (Ascaris lumbricoides, Trichuris spp., Taenia solium, Diphyllobothrium spp., Fasciola spp. and Schistosoma spp.). Since counting helminthes eggs at the microscope is a time-consuming task, homogeneity and stability studies were performed using a portable/benchtop flow cytometer CytoSense (Cytobuoy), and following ISO 13528. This PT consisted of two rounds per year. In each round, participants received a vial containing 10 mL of spiked reclaimed water to perform the nematode assay, not only for quantification but also for their identification. This 10 mL sample was added to 10 L which is the volume of water to be analyzed following the regulations, and the sample was analyzed applying the methods usually used in each laboratory. Reported results were statistically treated following ISO 13528 and the tests were performed: (i) Kernel density distribution, (ii) recovery study to show the effect of the concentration process, (iii) calculation of the assigned value and its uncertainty, (iv) z-score calculation to assess the performance of each participant and finally, (v) evaluation of identification activities. The average nematode eggs recovery rate of 55% was in agreement with data previously reported by different authors. Moreover, 95% of participants obtained satisfactory results (z-score ≤2) and 90% of them also produced a correct identification of nematodes present in the sample. As a conclusion, the preparation of nematode samples with the help of flow cytometry tehcnology, resulted in homogeneous and stable test materials suitable for the assessment of laboratory performances for analyzing this parameter in reclaimed water.
Book of Abstracts 43
Poster 8
Proficiency testing carried out by the European Reference Laboratory for
Parasites, EURLP
Patrizia Rossi, Gianluca Marucci, Marco Lalle, Adriano Casulli, Alessia Possenti,
Edoardo Pozio
Istituto Superiore di Sanità, Rome, Italy, One of the core duties of the European Union Reference Laboratories for Feed and Food is to organize proficiency testing (PT), as stated in the Regulation (EC) No 882/2004 of the European Parliament and the Council. The European Union Reference Laboratory for Parasites (EURLP) organizes PT for the National Reference Laboratories for Parasites (NRLs) of the Member States and for Italian laboratories performing official controls, in order to assess their competence and to improve laboratory performance. We report the results of 8 years activity on PT, showing the achievement of these goals. In March 2014, EURLP was accredited as PT provider in conformity with the ISO/IEC 17043:2010 standard, by the Italian accreditation body, ACCREDIA. Since its appointment in July 2006, the EURLP organized almost 40 PTs for NRLs and Italian laboratories on different methods to detect and to identify foodborne parasites. Round parasite worms (Nematodes) of the genus Trichinella are zoonotic parasites circulating in most European countries in both wild and domestic animals. Humans acquire the infection by the consumption of raw or undercooked meat from pigs, horses, wild boars and other game animals. According to the Commission Regulation (EC) 2075/2005, all animals which are potential carriers of Trichinella spp. larvae, should be tested at the slaughterhouse by one of the methods reported in the Regulation 2075/2005. Since 2007, the EURLP has organized eight annual PTs for the NRLs. PT samples consisted of a panel of 100g minced meat balls (pork or horse), spiked with Trichinella larvae. As a result, the participation to the PTs during the years lead to a constant improvement in the performance of all participating laboratories, as accounted by the decreasing overall mean of relative differences between expected and observed values (number of spiked larvae/number of collected larvae). Moreover, four PTs (from 2011 to 2014) on the identification of Trichinella parasites at species level by molecular methods were organised, Trichinella larvae preserved in 95% ethanol were used as matrix to be analyzed. Of fifteen labs participating to at least 3 PT rounds, five had always positive results and eight increased their performance by correctly identifying all four Trichinella species, at least during the last PT. Nematode worms of the Anisakidae family are zoonotic parasites circulating in most of marine fish and cephalopods. Humans acquire the infection by the consumption of raw or undercooked fish. The EURLP organized 3 PTs to test the competence of NRLs to detect Anisakidae larvae in fish fillets. During the last PT in 2014, five out of 27 labs failed to pass the PT and were given the possibility of a second round, which was successful for all of them. Flat parasite worms (Cestodes) of the genus Echinococcus are zoonotic parasites circulating in most European countries in both wild and domestic animals. Humans can accidentally acquire the infection by the ingestion of eggs shed by dogs and wild canids. Six PTs (from 2008 to 2014) were organised to test the competence of NRLs to detect Echinococcus sp. worms or their parts in the intestinal mucosa of canids. A dramatic improvement was observed in laboratory performance, the percentage of NRLs obtaining correct results increasing from 13% in 2008 to 96% in 2014. The PT results obtained during eight years of EURLP activity, clearly show how useful they were to improve NRL performance on different methods to detect and identify foodborne parasites.
44 8th Workshop on Proficiency Testing in Analytical Chemistry, Microbiology
and Laboratory Medicine, Berlin, October 2014
Poster 9
Detection and typing of Verocytotoxin-producing Escherichia coli (VTEC):
the proficiency test program of the European Union Reference Laboratory Clarissa Ferreri
1, Stefano Morabito
1, Gaia Scavia
1, Rosangela Tozzoli
1, Antonella Maugliani
1, Fabio
Minelli1, Maria Luisa Marziano
1, Susan Babsa
1, Fabio Galati
2, Marina Patriarca
1, Alfredo Caprioli
1
1 DSPVSA and 2 SIDBAE, Istituto Superiore di Sanità, Rome, Italy
Introduction
The European Union Reference Laboratory (EU-RL) for Verocytotoxin-producing Escherichia coli (VTEC) was established in 2006 by the Directorate General for Health and Consumers of the European Commission, according to the Regulation (EC) No. 882/2004 on official controls. It coordinates a network of 35 EU National Reference Laboratories (NRLs) with the main objective to ensure that the methods used by the NRLs for the identification and typing of pathogenic E. coli strains and their detection in food and animal samples are standardized.
Materials and methods
Since 2006, the EU-RL has developed and evaluated standard operating procedures for the identification and typing of VTEC and for their detection in food, mainly based on PCR detection of virulence genes. In particular, it coordinated the development of the Technical Specification CEN/ISO/TS 13136:2012 on the detection of VTEC in food and animal feed, based on the Real Time PCR (RT-PCR) screening of food enrichment cultures. To evaluate both the methods and the performance of the NRL network in their application, the EU-RL organized 13 rounds of proficiency testing (PT).
Results
Seven PTs were dedicated to bacterial typing and involved the detection of VTEC virulence genes by PCR and the identification of the serogroups most involved in human disease in Europe both by serological and molecular methods. The last three PTs also included molecular (PFGE) typing of VTEC strains, with the quality of PFGE images being evaluated according to criteria of the PulseNet International Protocol. Six PTs were dedicated to the detection of VTEC in different matrices, including carcass swabs, milk, spinach, water, seeds and sprouts, by using CEN/ISO/TS 13136. From 2010, participants can submit their PT results directly through an on-line system, located in the “Restricted Area” of the PT Section of the EU-RL website, and print out their own individual reports at the end of each study. A positive trend was observed in both the number of participating laboratories (from 30 to over 50) and their performance.
Conclusions
The control of pathogenic VTEC in food and animals represents a challenge for the development of specific detection methods and requires a network of skilled and trained laboratories throughout the EU for their detection in the vehicles of infection. The EU-RL is working to consolidate such a network, in order: i) to contribute to the knowledge of the epidemiology of VTEC infections in Europe; ii) to gather harmonized data on the prevalence of these pathogens in the food samples finalized to the definition of microbiological criteria for VTEC; iii) to provide the EC with more standardized operative structures and tools to face possible emergencies in this field of food safety, as happened during the large outbreak sustained by the mosaic VTEC-EAggEC O104:H4 strain, occurred in Germany in 2011.
Book of Abstracts 45
Poster 10
The effects of transport on microbiological proficiency test samples
Tracey Noblett
LGC, Bury, UK
Introduction
LGC have been organising proficiency testing (PT) schemes for over 30 years, including schemes for the food, beverages, environmental and consumer goods industries. Participants in LGC’s PT schemes are located in over 150 countries around the world. Participants often question whether the transport conditions, particularly time and temperature, could affect their sample and subsequently their performance scores. The test materials for the microbiology PT schemes contain living microorganisms and therefore pose a significant challenge in ensuring stability during a range of different transport conditions. In order to stabilize the test materials, all LGC PT microbiological test materials use lyophilized microorganisms.
Method
Although stability tests can be performed in-house, it is impossible to predict and reproduce all possible environmental conditions that samples are exposed to during transport. Data from PT rounds was therefore analysed by comparing participant results against a number of different transport factors. A number of LGC PT scheme samples were selected in order to observe the effects of transport on a range of different microorganisms and matrices used in LGC PT schemes. These included;
Total aerobic mesophilic count in a food microbiology scheme (QMS)
Staphylococcus aureus in a pharmaceutical scheme (Pharmassure)
Legionella species in a water microbiology scheme (QWAS)
Enterobacteriaceae in a food microbiology scheme (QMS)
For each microorganism over a number of rounds, the participant results were compared against date of analysis, average distance travelled (km) and average temperature (o
C) of destination country in order to determine if there were any significant trends between participants’ results and the different transport conditions.
Conclusion
More than half of participants (62%) received and tested the PT samples within 4 days of the despatch date and 90% of participants received and tested the samples within 10 days of the despatch date. Distance travelled by samples ranged from 0 to 16,000 km and the average temperature of destination countries ranged from -10 oC to +25 oC. The results varied by round and microorganism but overall the date of analysis, distance travelled and average temperature of destination country were not found to have a significant effect on participant results. Even participants from the same country receiving and testing the same sample at the same time could obtain very different results which are therefore unlikely to be due to transport factors.
46 8th Workshop on Proficiency Testing in Analytical Chemistry, Microbiology
and Laboratory Medicine, Berlin, October 2014
Poster 11
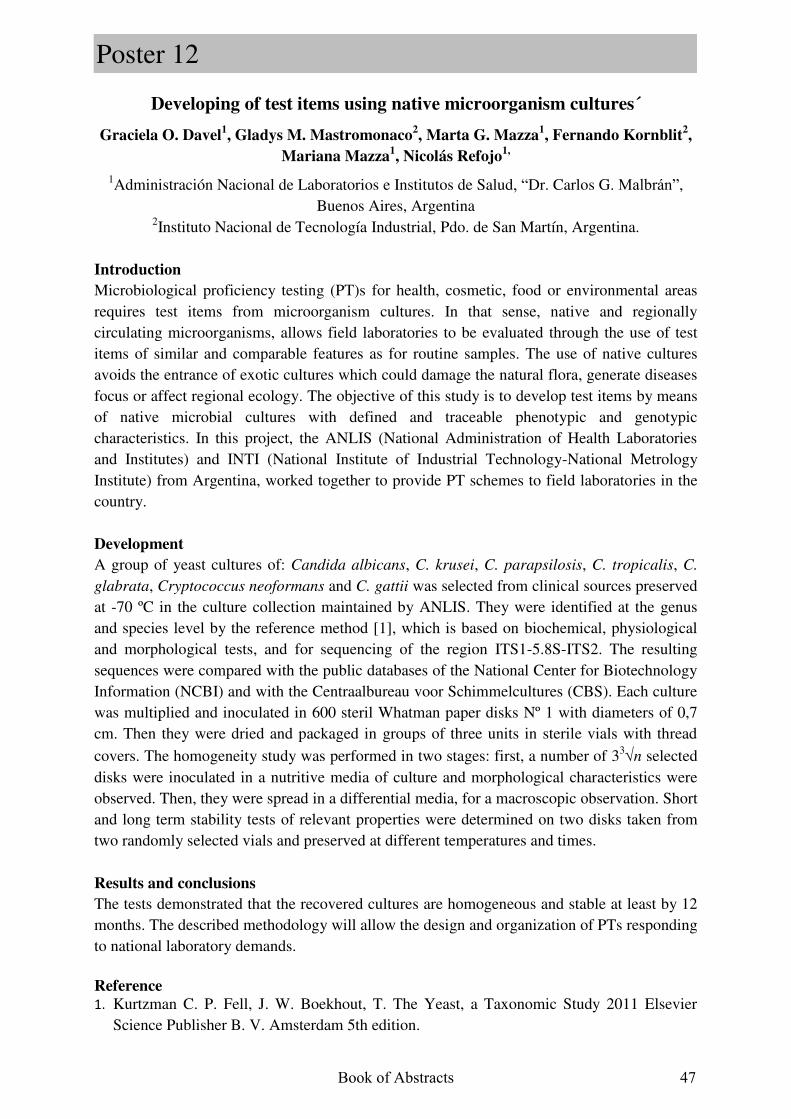
Developing of test items using native microorganism cultures´
Graciela O. Davel1, Gladys M. Mastromonaco
2, Marta G. Mazza
1, Fernando Kornblit
2,
Mariana Mazza1, Nicolás Refojo
1,
1Administración Nacional de Laboratorios e Institutos de Salud, “Dr. Carlos G. Malbrán”, Buenos Aires, Argentina
2Instituto Nacional de Tecnología Industrial, Pdo. de San Martín, Argentina.
Introduction
Microbiological proficiency testing (PT)s for health, cosmetic, food or environmental areas requires test items from microorganism cultures. In that sense, native and regionally circulating microorganisms, allows field laboratories to be evaluated through the use of test items of similar and comparable features as for routine samples. The use of native cultures avoids the entrance of exotic cultures which could damage the natural flora, generate diseases focus or affect regional ecology. The objective of this study is to develop test items by means of native microbial cultures with defined and traceable phenotypic and genotypic characteristics. In this project, the ANLIS (National Administration of Health Laboratories and Institutes) and INTI (National Institute of Industrial Technology-National Metrology Institute) from Argentina, worked together to provide PT schemes to field laboratories in the country.
Development
A group of yeast cultures of: Candida albicans, C. krusei, C. parapsilosis, C. tropicalis, C.
glabrata, Cryptococcus neoformans and C. gattii was selected from clinical sources preserved at -70 ºC in the culture collection maintained by ANLIS. They were identified at the genus and species level by the reference method [1], which is based on biochemical, physiological and morphological tests, and for sequencing of the region ITS1-5.8S-ITS2. The resulting sequences were compared with the public databases of the National Center for Biotechnology Information (NCBI) and with the Centraalbureau voor Schimmelcultures (CBS). Each culture was multiplied and inoculated in 600 steril Whatman paper disks Nº 1 with diameters of 0,7 cm. Then they were dried and packaged in groups of three units in sterile vials with thread
covers. The homogeneity study was performed in two stages: first, a number of 33n selected
disks were inoculated in a nutritive media of culture and morphological characteristics were observed. Then, they were spread in a differential media, for a macroscopic observation. Short and long term stability tests of relevant properties were determined on two disks taken from two randomly selected vials and preserved at different temperatures and times.
Results and conclusions
The tests demonstrated that the recovered cultures are homogeneous and stable at least by 12 months. The described methodology will allow the design and organization of PTs responding to national laboratory demands.
Reference 1. Kurtzman C. P. Fell, J. W. Boekhout, T. The Yeast, a Taxonomic Study 2011 Elsevier
Science Publisher B. V. Amsterdam 5th edition.
Book of Abstracts 47
Poster 12
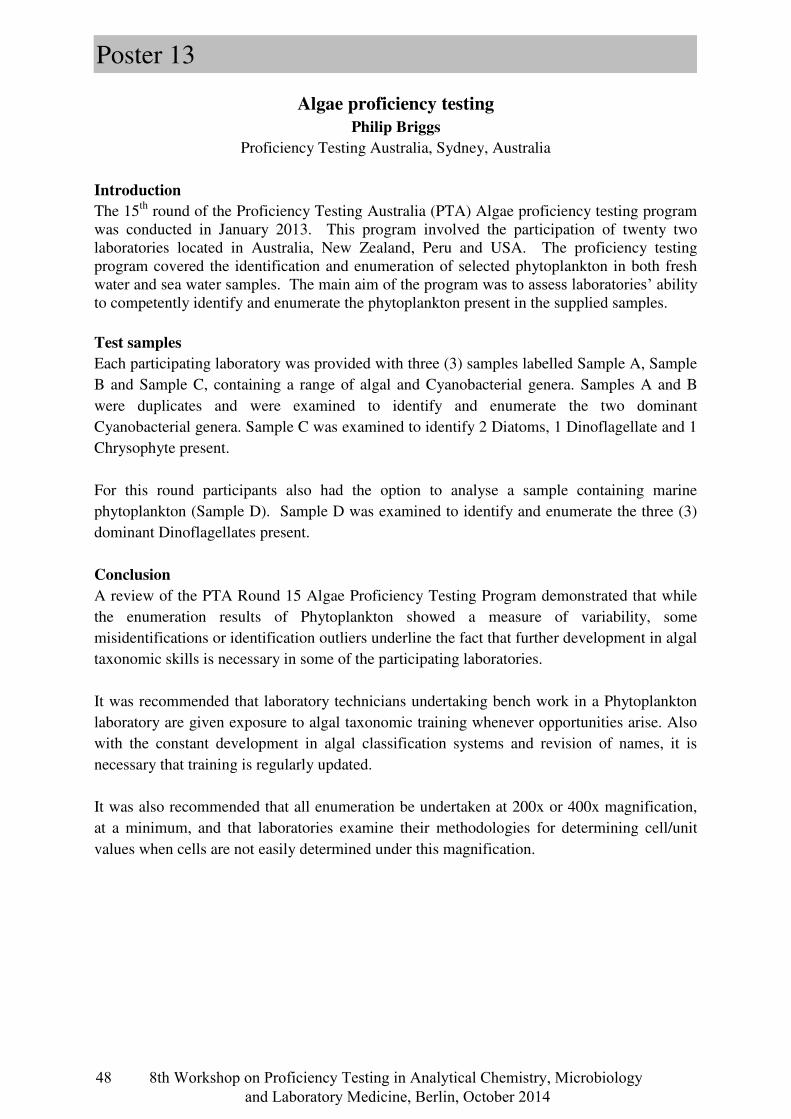
Algae proficiency testing
Philip Briggs
Proficiency Testing Australia, Sydney, Australia
Introduction
The 15th round of the Proficiency Testing Australia (PTA) Algae proficiency testing program was conducted in January 2013. This program involved the participation of twenty two laboratories located in Australia, New Zealand, Peru and USA. The proficiency testing program covered the identification and enumeration of selected phytoplankton in both fresh water and sea water samples. The main aim of the program was to assess laboratories’ ability to competently identify and enumerate the phytoplankton present in the supplied samples.
Test samples
Each participating laboratory was provided with three (3) samples labelled Sample A, Sample B and Sample C, containing a range of algal and Cyanobacterial genera. Samples A and B were duplicates and were examined to identify and enumerate the two dominant Cyanobacterial genera. Sample C was examined to identify 2 Diatoms, 1 Dinoflagellate and 1 Chrysophyte present. For this round participants also had the option to analyse a sample containing marine phytoplankton (Sample D). Sample D was examined to identify and enumerate the three (3) dominant Dinoflagellates present.
Conclusion
A review of the PTA Round 15 Algae Proficiency Testing Program demonstrated that while the enumeration results of Phytoplankton showed a measure of variability, some misidentifications or identification outliers underline the fact that further development in algal taxonomic skills is necessary in some of the participating laboratories. It was recommended that laboratory technicians undertaking bench work in a Phytoplankton laboratory are given exposure to algal taxonomic training whenever opportunities arise. Also with the constant development in algal classification systems and revision of names, it is necessary that training is regularly updated. It was also recommended that all enumeration be undertaken at 200x or 400x magnification, at a minimum, and that laboratories examine their methodologies for determining cell/unit values when cells are not easily determined under this magnification.
48 8th Workshop on Proficiency Testing in Analytical Chemistry, Microbiology
and Laboratory Medicine, Berlin, October 2014
Poster 13
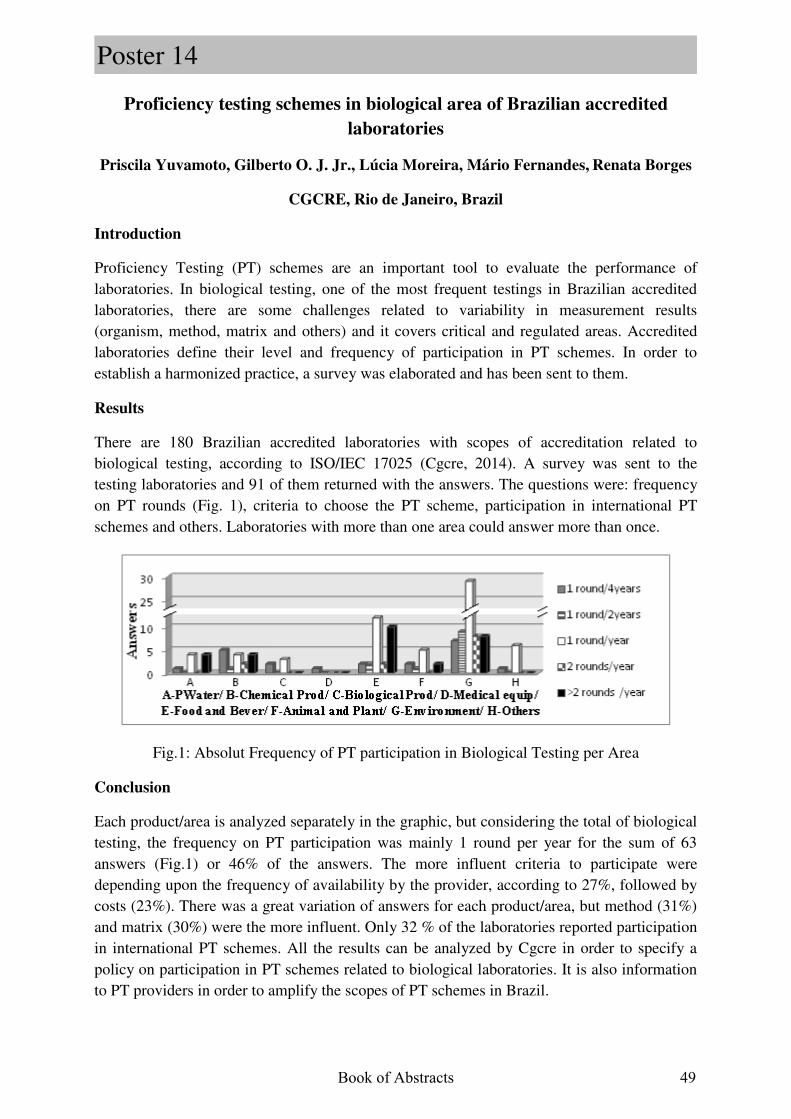
Proficiency testing schemes in biological area of Brazilian accredited
laboratories
Priscila Yuvamoto, Gilberto O. J. Jr., Lúcia Moreira, Mário Fernandes, Renata Borges
CGCRE, Rio de Janeiro, Brazil
Introduction
Proficiency Testing (PT) schemes are an important tool to evaluate the performance of laboratories. In biological testing, one of the most frequent testings in Brazilian accredited laboratories, there are some challenges related to variability in measurement results (organism, method, matrix and others) and it covers critical and regulated areas. Accredited laboratories define their level and frequency of participation in PT schemes. In order to establish a harmonized practice, a survey was elaborated and has been sent to them.
Results
There are 180 Brazilian accredited laboratories with scopes of accreditation related to biological testing, according to ISO/IEC 17025 (Cgcre, 2014). A survey was sent to the testing laboratories and 91 of them returned with the answers. The questions were: frequency on PT rounds (Fig. 1), criteria to choose the PT scheme, participation in international PT schemes and others. Laboratories with more than one area could answer more than once.
Fig.1: Absolut Frequency of PT participation in Biological Testing per Area
Conclusion
Each product/area is analyzed separately in the graphic, but considering the total of biological testing, the frequency on PT participation was mainly 1 round per year for the sum of 63 answers (Fig.1) or 46% of the answers. The more influent criteria to participate were depending upon the frequency of availability by the provider, according to 27%, followed by costs (23%). There was a great variation of answers for each product/area, but method (31%) and matrix (30%) were the more influent. Only 32 % of the laboratories reported participation in international PT schemes. All the results can be analyzed by Cgcre in order to specify a policy on participation in PT schemes related to biological laboratories. It is also information to PT providers in order to amplify the scopes of PT schemes in Brazil.
Book of Abstracts 49
Poster 14
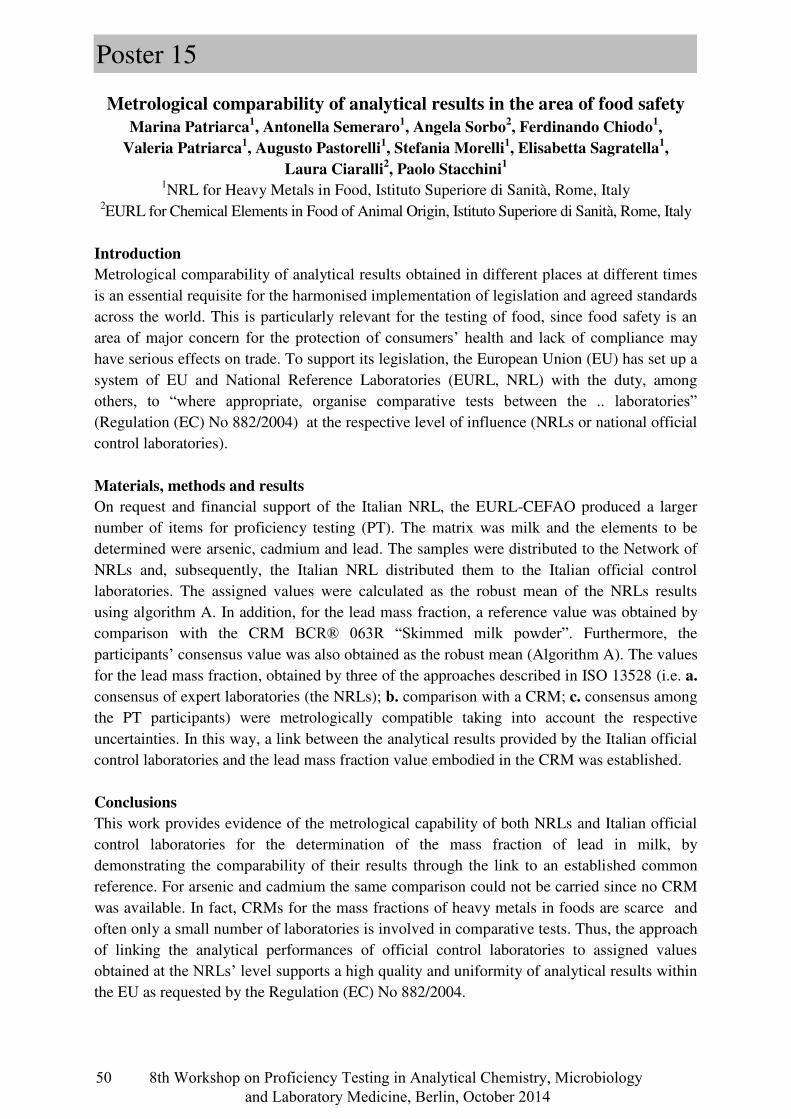
Metrological comparability of analytical results in the area of food safety
Marina Patriarca1, Antonella Semeraro
1, Angela Sorbo
2, Ferdinando Chiodo
1,
Valeria Patriarca1, Augusto Pastorelli
1, Stefania Morelli
1, Elisabetta Sagratella
1,
Laura Ciaralli2, Paolo Stacchini
1
1NRL for Heavy Metals in Food, Istituto Superiore di Sanità, Rome, Italy 2EURL for Chemical Elements in Food of Animal Origin, Istituto Superiore di Sanità, Rome, Italy
Introduction
Metrological comparability of analytical results obtained in different places at different times is an essential requisite for the harmonised implementation of legislation and agreed standards across the world. This is particularly relevant for the testing of food, since food safety is an area of major concern for the protection of consumers’ health and lack of compliance may have serious effects on trade. To support its legislation, the European Union (EU) has set up a system of EU and National Reference Laboratories (EURL, NRL) with the duty, among others, to “where appropriate, organise comparative tests between the .. laboratories” (Regulation (EC) No 882/2004) at the respective level of influence (NRLs or national official control laboratories).
Materials, methods and results
On request and financial support of the Italian NRL, the EURL-CEFAO produced a larger number of items for proficiency testing (PT). The matrix was milk and the elements to be determined were arsenic, cadmium and lead. The samples were distributed to the Network of NRLs and, subsequently, the Italian NRL distributed them to the Italian official control laboratories. The assigned values were calculated as the robust mean of the NRLs results using algorithm A. In addition, for the lead mass fraction, a reference value was obtained by comparison with the CRM BCR® 063R “Skimmed milk powder”. Furthermore, the participants’ consensus value was also obtained as the robust mean (Algorithm A). The values for the lead mass fraction, obtained by three of the approaches described in ISO 13528 (i.e. a. consensus of expert laboratories (the NRLs); b. comparison with a CRM; c. consensus among the PT participants) were metrologically compatible taking into account the respective uncertainties. In this way, a link between the analytical results provided by the Italian official control laboratories and the lead mass fraction value embodied in the CRM was established.
Conclusions
This work provides evidence of the metrological capability of both NRLs and Italian official control laboratories for the determination of the mass fraction of lead in milk, by demonstrating the comparability of their results through the link to an established common reference. For arsenic and cadmium the same comparison could not be carried since no CRM was available. In fact, CRMs for the mass fractions of heavy metals in foods are scarce and often only a small number of laboratories is involved in comparative tests. Thus, the approach of linking the analytical performances of official control laboratories to assigned values obtained at the NRLs’ level supports a high quality and uniformity of analytical results within the EU as requested by the Regulation (EC) No 882/2004.
50 8th Workshop on Proficiency Testing in Analytical Chemistry, Microbiology
and Laboratory Medicine, Berlin, October 2014
Poster 15
Honey as a material for proficiency testing
Andrea Colabucci, AnnaChiara Turco, Angela Sorbo, Maria Ciprotti,
Marco Di Gregorio, Laura Ciaralli
European Union Reference Laboratory for Chemical Elements in Food of Animal Origin (EURL-CEFAO)-Department of Food Safety and Veterinary Public Health,
Istituto Superiore di Sanità, Rome, Italy
Introduction
The participation in proficiency testing (PT) required by most accreditation bodies, is an effective way to ensure reliability and quality of analytical data especially when produced by a laboratory accredited according to ISO/IEC 17025:2005. The European Union Reference Laboratory for Chemical Elements in Food of Animal Origin (EURL-CEFAO) organized the 19th PT for the determination of cadmium (Cd) and lead (Pb) in honey. Most of the member states of the European Union (EU) include the measurands in their National Residue Monitoring Plans (NRCPs), even though no Maximum Levels (MLs) are set in the European Commission Regulation No 1881/2006.
Material and methods
An adequate procedure for the preparation of the honey samples was developed and tested on a “preliminary batch” before producing the final PT test items. A commercial wildflower honey was spiked at proper concentration levels, suitable fluidity and homogeneity was achieved by stirring with mild heating. Homogeneity was investigated using Inductively Coupled Plasma Mass Spectrometry (ICP-MS) after microwave assisted digestion. Similarly the material was found to be stable over a period of 50 days, covering the time span of the PT. Twenty-five National Reference Laboratories (NRLs) of the EURL network and four additional laboratories participated in the exercise. The assigned values were determined by consensus (Cd 0.0199 mg/kg, Pb 0.102 mg/kg) using the robust mean, while the standard deviation for proficiency assessment was set to Cd 0.0026 mg/kg, Pb 0.012 mg/kg. Laboratory performance was expressed as z-scores. More than 86% of the laboratories reported satisfactory results (|Z| ≤ 2).
Conclusion
The general performance of the network for this PT was satisfactory; this outcome not only shows the high quality of data produced by NRLs but also confirms the “fitness for purpose” of the EURL-CEFAO material.
Book of Abstracts 51
Poster 16
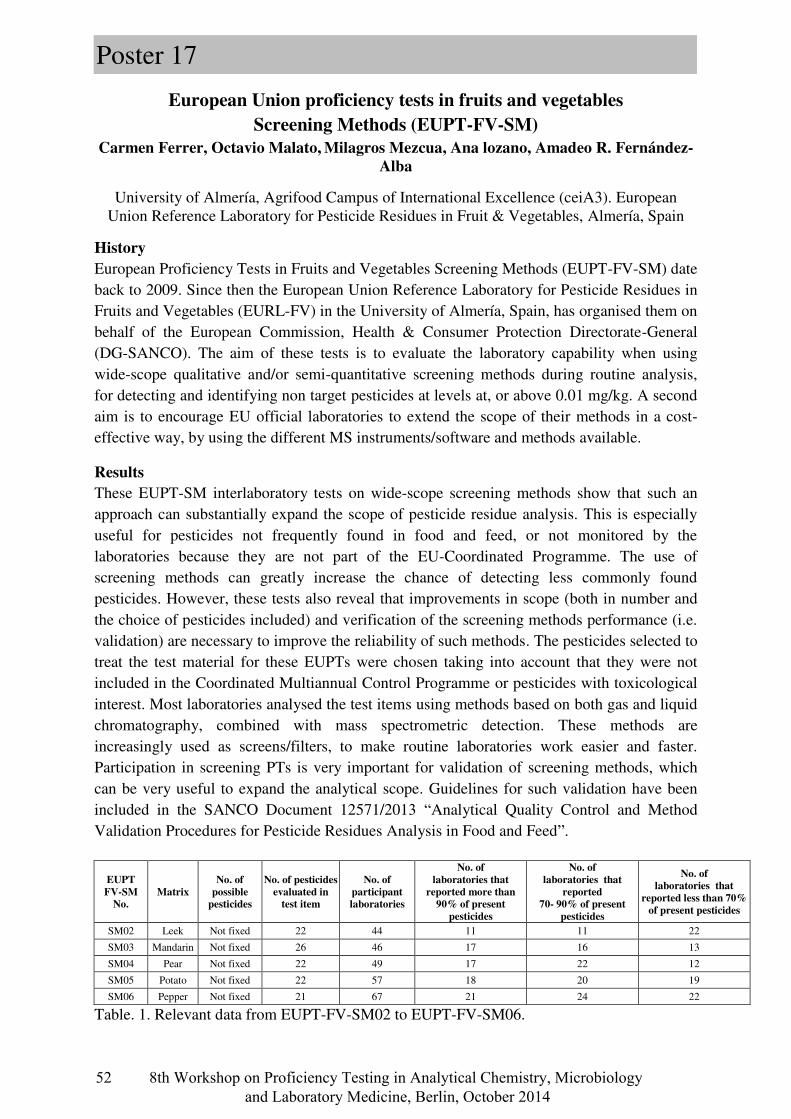
European Union proficiency tests in fruits and vegetables
Screening Methods (EUPT-FV-SM)
Carmen Ferrer, Octavio Malato, Milagros Mezcua, Ana lozano, Amadeo R. Fernández-
Alba
University of Almería, Agrifood Campus of International Excellence (ceiA3). European Union Reference Laboratory for Pesticide Residues in Fruit & Vegetables, Almería, Spain
History
European Proficiency Tests in Fruits and Vegetables Screening Methods (EUPT-FV-SM) date back to 2009. Since then the European Union Reference Laboratory for Pesticide Residues in Fruits and Vegetables (EURL-FV) in the University of Almería, Spain, has organised them on behalf of the European Commission, Health & Consumer Protection Directorate-General (DG-SANCO). The aim of these tests is to evaluate the laboratory capability when using wide-scope qualitative and/or semi-quantitative screening methods during routine analysis, for detecting and identifying non target pesticides at levels at, or above 0.01 mg/kg. A second aim is to encourage EU official laboratories to extend the scope of their methods in a cost-effective way, by using the different MS instruments/software and methods available.
Results
These EUPT-SM interlaboratory tests on wide-scope screening methods show that such an approach can substantially expand the scope of pesticide residue analysis. This is especially useful for pesticides not frequently found in food and feed, or not monitored by the laboratories because they are not part of the EU-Coordinated Programme. The use of screening methods can greatly increase the chance of detecting less commonly found pesticides. However, these tests also reveal that improvements in scope (both in number and the choice of pesticides included) and verification of the screening methods performance (i.e. validation) are necessary to improve the reliability of such methods. The pesticides selected to treat the test material for these EUPTs were chosen taking into account that they were not included in the Coordinated Multiannual Control Programme or pesticides with toxicological interest. Most laboratories analysed the test items using methods based on both gas and liquid chromatography, combined with mass spectrometric detection. These methods are increasingly used as screens/filters, to make routine laboratories work easier and faster. Participation in screening PTs is very important for validation of screening methods, which can be very useful to expand the analytical scope. Guidelines for such validation have been included in the SANCO Document 12571/2013 “Analytical Quality Control and Method Validation Procedures for Pesticide Residues Analysis in Food and Feed”.
Table. 1. Relevant data from EUPT-FV-SM02 to EUPT-FV-SM06.
EUPT
FV-SM No.
Matrix
No. of
possible pesticides
No. of pesticides
evaluated in test item
No. of
participant laboratories
No. of
laboratories that
reported more than 90% of present
pesticides
No. of
laboratories that
reported 70- 90% of present
pesticides
No. of laboratories that
reported less than 70%
of present pesticides
SM02 Leek Not fixed 22 44 11 11 22
SM03 Mandarin Not fixed 26 46 17 16 13
SM04 Pear Not fixed 22 49 17 22 12
SM05 Potato Not fixed 22 57 18 20 19
SM06 Pepper Not fixed 21 67 21 24 22
52 8th Workshop on Proficiency Testing in Analytical Chemistry, Microbiology
and Laboratory Medicine, Berlin, October 2014
Poster 17
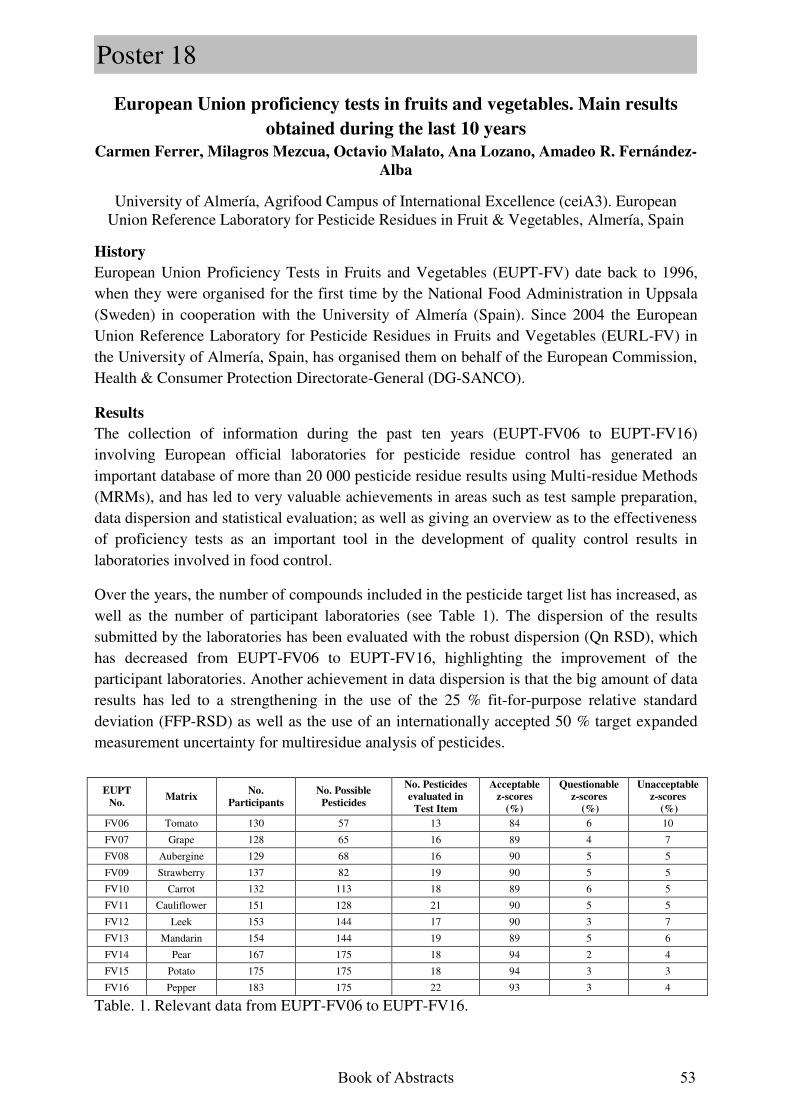
European Union proficiency tests in fruits and vegetables. Main results
obtained during the last 10 years
Carmen Ferrer, Milagros Mezcua, Octavio Malato, Ana Lozano, Amadeo R. Fernández-
Alba
University of Almería, Agrifood Campus of International Excellence (ceiA3). European Union Reference Laboratory for Pesticide Residues in Fruit & Vegetables, Almería, Spain
History
European Union Proficiency Tests in Fruits and Vegetables (EUPT-FV) date back to 1996, when they were organised for the first time by the National Food Administration in Uppsala (Sweden) in cooperation with the University of Almería (Spain). Since 2004 the European Union Reference Laboratory for Pesticide Residues in Fruits and Vegetables (EURL-FV) in the University of Almería, Spain, has organised them on behalf of the European Commission, Health & Consumer Protection Directorate-General (DG-SANCO).
Results
The collection of information during the past ten years (EUPT-FV06 to EUPT-FV16) involving European official laboratories for pesticide residue control has generated an important database of more than 20 000 pesticide residue results using Multi-residue Methods (MRMs), and has led to very valuable achievements in areas such as test sample preparation, data dispersion and statistical evaluation; as well as giving an overview as to the effectiveness of proficiency tests as an important tool in the development of quality control results in laboratories involved in food control.
Over the years, the number of compounds included in the pesticide target list has increased, as well as the number of participant laboratories (see Table 1). The dispersion of the results submitted by the laboratories has been evaluated with the robust dispersion (Qn RSD), which has decreased from EUPT-FV06 to EUPT-FV16, highlighting the improvement of the participant laboratories. Another achievement in data dispersion is that the big amount of data results has led to a strengthening in the use of the 25 % fit-for-purpose relative standard deviation (FFP-RSD) as well as the use of an internationally accepted 50 % target expanded measurement uncertainty for multiresidue analysis of pesticides.
Table. 1. Relevant data from EUPT-FV06 to EUPT-FV16.
EUPT
No. Matrix
No.
Participants
No. Possible
Pesticides
No. Pesticides evaluated in
Test Item
Acceptable z-scores
(%)
Questionable z-scores
(%)
Unacceptablez-scores
(%)
FV06 Tomato 130 57 13 84 6 10
FV07 Grape 128 65 16 89 4 7
FV08 Aubergine 129 68 16 90 5 5
FV09 Strawberry 137 82 19 90 5 5
FV10 Carrot 132 113 18 89 6 5
FV11 Cauliflower 151 128 21 90 5 5
FV12 Leek 153 144 17 90 3 7
FV13 Mandarin 154 144 19 89 5 6
FV14 Pear 167 175 18 94 2 4
FV15 Potato 175 175 18 94 3 3
FV16 Pepper 183 175 22 93 3 4
Book of Abstracts 53
Poster 18
Proficiency Tests on olive oil organized by the Italian National Reference
Laboratory for pesticides residues: laboratories long-term performance
Tiziana Generali, Patrizia Stefanelli, Silvana Girolimetti, Danilo Attard Barbini
Istituto Superiore di Sanità – Dipartimento Ambiente e Connessa Prevenzione Primaria – Reparto Antiparassitari, Roma, Italy
The Italian National Reference Laboratory (NRL) for pesticide residues yearly organizes Proficiency Tests (PTs) on olive oil, addressed to: Mediterranean laboratories of International Olive Council (IOC), European laboratories (NRLs, official control laboratories and private laboratories), involved in the National and European monitoring programs. The main aim of these PTs is to compare the performances of the laboratories in Mediterranean and European countries in order to promote mutual acceptance of pesticide residue data regarding the analytical controls of olive oil. Since 2011 the protocol of the last three PTs has not been changed and also the list of participants has been steady, in the range of 40 – 44 laboratories. The test material consisted of commercial olive oil spiked with six different pesticides chosen in each exercise from a possible list of 25-26 compounds. In particular the pesticide residues selected in our PTs are mainly those considered in the Official Control Plans, with spiked concentration levels around their reference values set in the European Regulations. Pertinent and detailed information regarding multi-residue methods have been demanded to all participants, and an overall evaluation by means of a combined index of performance, such as the sum of the weighted z-scores – SWZ and the sum of squared z-scores – SZ2, has been performed. This type of exercise provides the possibility for the laboratories to control and improve the performance of their analytical methods employed during the official control on more parameters over the years. In this paper a comparison of the overall performance of the laboratories was shown by using the SWZ or SZ2 parameters, giving significance to the Italian participants. In particular the SWZ values were between 86-91% as laboratories as total while for Italian laboratories the improvement obtained was from 70 to 100%. Moreover the effect of the analytical methods on the dispersion of the results was evaluated in order to review the long-term performance of the participants.
54 8th Workshop on Proficiency Testing in Analytical Chemistry, Microbiology
and Laboratory Medicine, Berlin, October 2014
Poster 19
Incurred and spiked pesticide residues in a feed for laying hens EU PT-CF7, 2013
Mette Erecius Poulsen, Gitte Andersen National Food Institute, Technical University of Denmark, Soeborg, Denmark
The EURL for Pesticide Residues in Cereals and Feedingstuff in Copenhagen (EURL-CF) has in 2013 organised a proficiency test (PT) on pesticide residues in feed for laying hens. This was the first PT on feed and due to the more complex composition of feed it was foreseen that the test item would be more difficult to analyse than e.g. a more simple cereal matrix. A feed was produced by IFF Braunschweig, by milling, mixing and pelleting 100 kg raw materials. The composition of the feed was done according to an industrial recipe. The raw materials consisted of pesticide field treated cereals, wheat, barley and rye plus maize, soybean meal, soybean cake, soybean oil, lime, mineral and vitamin premix. The field threated cereals were leftovers from earlier EUPTs. After receiving the feed pellets, it was thoroughly mixed to ensure a high degree of homogeneity. Then the feed was milled on a centrifugal mill with a sieve of 0.1 mm and subsequently mixed once more, before it was weighed out into screw-capped polyethylene plastic bottles, sealed, numbered, and stored in a freezer at about -20 °C prior to homogeneity testing and distribution to participants. The test material included 23 incurred and spiked pesticides in range from 0.057 to 0.404 mg/kg, 14 was incurred, 4 spiked and 5 was both incurred and spiked. Additionally, the test material contained residues of 6 pesticides in levels below 0.04 mg/kg. These 6 pesticides were not evaluated, because the concentration levels were too low. All EU NRLs and Official laboratories in the field were invited to participate in the PT. Also third countries were invited. In total, 106 EU and EFTA laboratories, representing 29 countries (27 EU member states), agreed to participate in this PT. Additionally, 14 third country laboratories registered. The participants were asked to identify the pesticides in the test item from a list of 116 target pesticides and subsequently determine the concentration of the pesticides found. The evaluation was done by detecting false positive and negative results and calculating the z-scores. Both the number of false positives and false negatives were relatively high in comparison with previous EUPTs on cereals. In total, 15 false positive results of 9 different pesticides were reported and 50 false negative results of 17 different pesticides. The consensus assigned values were calculated as the median of the result excluded outlier (z-scores above 5) The average Qn-RSD (robust RSD) was at 20 %, close to the Fit for Purpose-RSD of 25 % ranging from 15 to 29 % for the individual compounds. For 14 pesticides 90-96 % of the laboratories obtained acceptable results, and for the rest only 84-89 % of the laboratories obtained acceptable results. The level of acceptable results was in line with earlier PTs on cereals. The presentation will cover the production of test material, the main results as well as a comparison between the participant's performance of the incurred pesticides and the spiked pesticides. The results will also be compared to results from earlier PTs on pesticide residues in cereals.
Book of Abstracts 55
Poster 20
Proficiency testing scheme in sensory – an innovative tool for quality
assurance in sensory
Ute Braun, Anita Schott
muva kempten, Laboratory & Quality Service Center, Kempten, Germany
Introduction
Meanwhile proficiency testing is an established tool for external and internal quality assurance in sensory. Panels could prove and demonstrate their performance by these studies to costumers, accreditation bodies or within their own panel. But one study is just an exposure of one analysis in one sense with one methodology. So muva kempten created an innovative reference system for the evaluation of nearly all senses and the plurality of different methods, used in the daily routine work. According to this variety muva intends to create a performance evaluation for each panelist and panel.
Description of the Sensory Proficiency Testing Scheme
The reference system contains the senses of taste, odour, feel and sight. The methods are a rank order with detection of an unknown attribute, triangle test, profile testing and a sensory proficiency testing study for packaging material by determination of the intensity combined with a triangle test. The rank orders are sessions of 4 samples which should be ranked according the intensity of the quested attribute. In the proficiency testing study “Four sensuous” the senses taste, odour, feel and sight are asked. In the proficiency testing study “triangle test” each person has to analyze 6 triangle tests. According to the results of the determined differing sample the significant level of the panelist and the whole panel is evaluated. The profile testing study is the profiling of one testing sample in mostly 5 attributes in taste, odour, consistency and colour by the help of 2 given references. Last of all in our innovative reference system is the proficiency testing study “packaging”. This study consists of the high interests in the sensory evaluation and analyses of daily used articles. The sensory testing of the influences of packaging material on food is an important field for the industry. Moreover external influences like temperature or light (UV, day light) to the packaging material should not transfer some odour or taste components to the food inside.
Conclusion
According to future trends in sensory the reference system of muva kempten is an innovative tool for quality assurance in sensory. It covers all requirements of quality assurance in all fields of sensory. It is the basis for a continuous evaluation of the performance of a panelist, similar to a control chart or performance criteria in chemical analyses.
56 8th Workshop on Proficiency Testing in Analytical Chemistry, Microbiology
and Laboratory Medicine, Berlin, October 2014
Poster 21
Organization of proficiency testing schemes on physicochemical properties
of pesticides formulations
Alain Dubois, Franck Defeijt, Geert De Poorter
Federal Agency for the Safety of the Food Chain – BU PT Schemes, Gembloux, Belgium The laboratories involved in the quality control analyses of pesticides placed on the European market are generally ISO/IEC 17025:2005 accredited. This standard requires these laboratories to ensure the quality of their results, for instance, through participation in proficiency testing (PT) programs. These PT programs are not organized by “classical” PT providers probably due to the lack of profitability. In 2008, after consulting potentially interested laboratories, the Business Unit Proficiency Testing Schemes (BU PT Schemes) of the Federal Agency for the Safety of the Food Chain (FASFC) decided to organize an annual PT scheme at European level on the physicochemical properties of pesticides. The aim was to propose to the participants to analyze real formulations for which official analytical methods are available (CIPAC methods) for the active ingredient content and physicochemical parameters with, if possible, an alternation of the used analytical technique (GC, HPLC). The analyzed parameters are typical of the proposed formulation (active ingredient content, density, pH, foaming properties, suspensibility, sieving test, … according to FAO specifications). A technical working group of experts in plant protection products assists the organizers. Due to the lack of reference materials and historical data to define a panel of expert laboratories, the organizers have chosen to use the consensus value from participants’ results as the assigned value. The z-score is used for the performance assessment. The statistical treatment has been carried out according to the ISO 13528:2005 standard (robust statistics according to algorithm A). In 2011, the BU PT Schemes obtained ISO/IEC 17043:2010 accreditation for the organization of this type of PT.
Year Number of Participants
Formulation Number of parameters
2008-2009 13 Soluble concentrate (SL) 5
2010 14 Aqueous suspension concentrate (SC) 8
2011 17 Water dispersible granules (WG) 7
2012 17 Aqueous suspension concentrate (SC) 9
2013 17 Soluble granules (SG) 7
Table 1: evolution of the program After 5 PT rounds, the main conclusions are: the results are in general very good but some participants do not strictly follow the analytical conditions mentioned in the protocols, which leads to “poor” results; some “simple” methods cause problems to participants; the assessment of results is not always feasible (statistical requirements not met). The participants are generally very satisfied with the organization. In the future, the organizers want to increase the number of participants and the frequency of PTs.
Book of Abstracts 57
Poster 22
Experience feedback from proficiency testing for pesticides in food
Eric Ziegler, Caroline Laurent
BIPEA, Paris, France
Context The European Commission's Directorate General for Health and Consumer Protection (DG SANCO), established in 1999, provides a guidance document on analytical quality control and validation procedures for pesticide residues analysis in food and feed. This document defines good practices for all the different steps of the analysis of pesticides but also some commodity groups. Bipea’s Proficiency Tests In order to help the laboratories to meet these requirements, Bipea provides proficiency tests (PTs) for pesticides determination in a large range of products (through six families of products). Some of these tests are based on a defined list of pesticides (at least 30) and some others are blind. Bipea manages all the steps of the comparisons, from the production of the samples as close as possible to those laboratories are used to receive to the treatment of the data. Some results of our twenty-five year experience are presented below. Determination of the assigned values One of the first issues has been to establish assigned values as relevant as possible. As laboratories for all around the world take part, not always familiar to analyze all the matrices, the assigned values is supported by the theoretical spiking values. This spiking is performed on organic products for which a screening is first performed. Nevertheless, due to stability reasons, interaction with the matrix and so on, it is not possible to rely only on the spiked value. However, this spiking value is used to define an interval into which results will be taken into account to estimate the assigned value. This allows for example to remove laboratories with poor recovery rates and avoid these results to give a bias to the assigned value. Consequently, the assigned value is often a little higher and closer to the spiking value, compared to the robust mean (graphical representation of spiked, assigned and mean values obtained for lindane in 2012-2013).
Results From the results of the previous tests, all products together, dispersions graphs, representing twice the robust standard deviation as a function of the concentration, can be plotted (graphical illustration for pyrimicarb). It enables to establish trends and to set up a determined SDPA (standard deviation for proficiency assessment) for next rounds.
Differences of results between the products are also studied (sum up table of gaps between the assigned value and the spiking value for azoxystrobin).
It can reveal some extraction issues by the laboratories for some products and also help to improve the production of some samples. Trends can also be compared by products family. In the case of chlorpyriphos-ethyl (graphical example), the results are quite similar for vegetables, wines and honey but are often more dispersed for fat products (cheese, meat, oil). Conclusion These multiple and various PTs allow the whole profession to improve (graphical illustration of the decrease of the CV% of acetamiprid over the past 9 years).
58 8th Workshop on Proficiency Testing in Analytical Chemistry, Microbiology
and Laboratory Medicine, Berlin, October 2014
Poster 23
Difficulties to evaluate the participant’s proficiency: the case of the PT for
the confirmation of carbadox residues in pig muscle
Régine Fuselier, Michel Laurentie, Eric Verdon
Anses - French Agency for Food, Environmental and Occupational Health and Safety, Laboratory of Fougeres, Fougères, France
Introduction
The organization of proficiency tests for the National Reference Laboratories (NRLs) is one of the duties of the European Union Reference Laboratory (EU-RL) according to the Directive no 96/23/EC in its Annex V Chapter2 paragraph g. The participation in these proficiency testing (PT) schemes allows national reference and official field laboratories to assess their competence and to prove the reliability of their results.
Assessment of proficiency
The organization and statistical analysis of this study were performed within an in-house quality management system according to ISO/IEC 17043 and ISO 13528:2005 standards, to national document LABCIL ref 02 rev2 and to specific official procedures. An evaluation of the laboratory’s performance to confirm carbadox residues was planned by means of z-scores if the criteria uX 0.3 ̂ is respected. The assigned value (X) was determined as the consensus of the results of all participants using robust statistics with the algorithm A. The robust standard deviation (s*) and the standard uncertainty (uX) of the assigned value were also calculated. The standard deviation value for the proficiency test ̂ can be derived from predictive models, as the Horwitz equation or the complementary models from Thompson and was selected. The case of the carbadox residues PT: Participants were asked to analyze the samples by implementing their confirmatory method(s) in order to confirm and quantify for a possible content of carbadox metabolite residues, i.e. QCA and DCBX, according to the decision 657/2002/EC.
The assigned value for material containing DCBX is 2.974 µg/kg with an uncertainty of 0.613, the value for standard deviation ̂ H is 0.654 µg/kg but s*is 1.626 µg/kg. The assigned value for material 3 containing QCA is 20.199 µg/kg with an uncertainty of 1.578, the value for standard deviation ̂ His 4.443 µg/kg but s*is 5.357 µg/kg. The analytical limit CCα for QCA is ranging from 0.096 to 6.36 µg/kg and from 0.016 to 5.07 µg/kg for DCBX. For DCBX material as for QCA material still efforts have to be carried out for improving the efficiency of the analysis and the accuracy of the results. The criteria uX 0.3 ̂ is not respected when using σ̂ H but is right when using s* as standard deviation for the PT. Participants were not evaluated by means of z-scores, the PT provider investigated the problem and the decision was taken that for future PT s* will be used instead of ̂ as standard deviation. In our case the general model is not suitable to determine the standard deviation. Consequently the standard deviation will be determined by a consensus approach.
Book of Abstracts 59
Poster 24
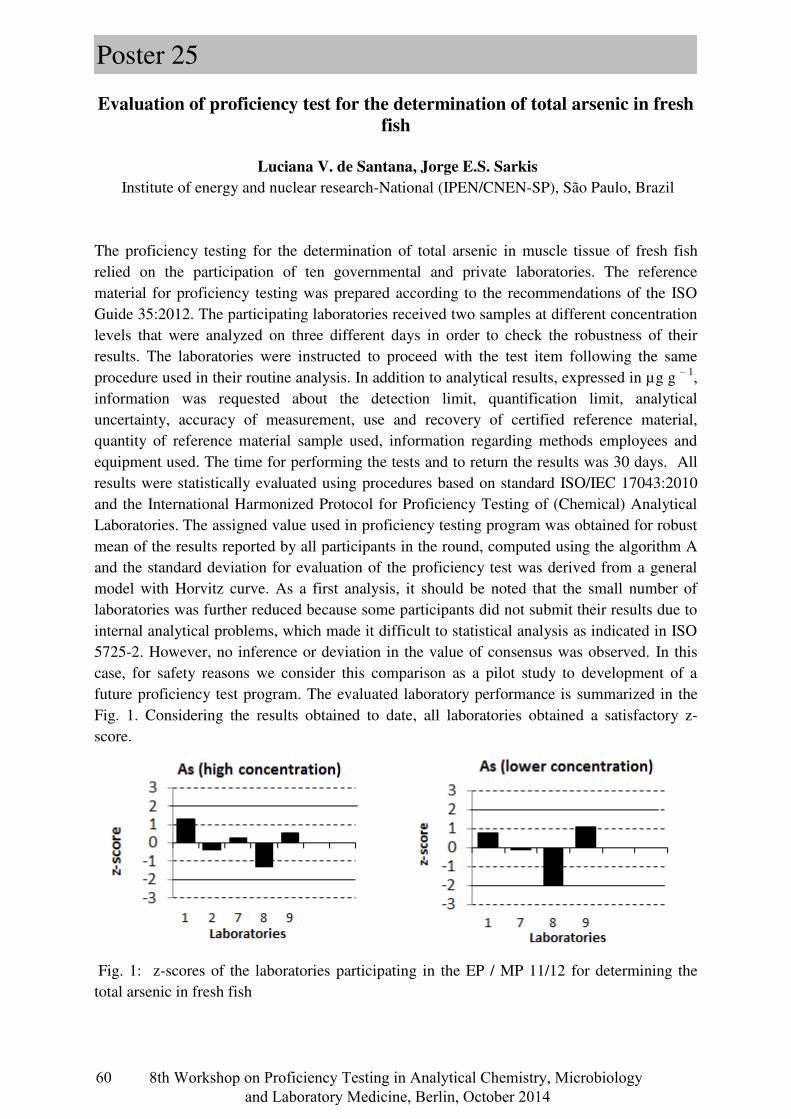
Evaluation of proficiency test for the determination of total arsenic in fresh fish
Luciana V. de Santana, Jorge E.S. Sarkis
Institute of energy and nuclear research-National (IPEN/CNEN-SP), São Paulo, Brazil
The proficiency testing for the determination of total arsenic in muscle tissue of fresh fish relied on the participation of ten governmental and private laboratories. The reference material for proficiency testing was prepared according to the recommendations of the ISO Guide 35:2012. The participating laboratories received two samples at different concentration levels that were analyzed on three different days in order to check the robustness of their results. The laboratories were instructed to proceed with the test item following the same procedure used in their routine analysis. In addition to analytical results, expressed in µg g – 1, information was requested about the detection limit, quantification limit, analytical uncertainty, accuracy of measurement, use and recovery of certified reference material, quantity of reference material sample used, information regarding methods employees and equipment used. The time for performing the tests and to return the results was 30 days. All results were statistically evaluated using procedures based on standard ISO/IEC 17043:2010 and the International Harmonized Protocol for Proficiency Testing of (Chemical) Analytical Laboratories. The assigned value used in proficiency testing program was obtained for robust mean of the results reported by all participants in the round, computed using the algorithm A and the standard deviation for evaluation of the proficiency test was derived from a general model with Horvitz curve. As a first analysis, it should be noted that the small number of laboratories was further reduced because some participants did not submit their results due to internal analytical problems, which made it difficult to statistical analysis as indicated in ISO 5725-2. However, no inference or deviation in the value of consensus was observed. In this case, for safety reasons we consider this comparison as a pilot study to development of a future proficiency test program. The evaluated laboratory performance is summarized in the Fig. 1. Considering the results obtained to date, all laboratories obtained a satisfactory z-score.
Fig. 1: z-scores of the laboratories participating in the EP / MP 11/12 for determining the total arsenic in fresh fish
60 8th Workshop on Proficiency Testing in Analytical Chemistry, Microbiology
and Laboratory Medicine, Berlin, October 2014
Poster 25
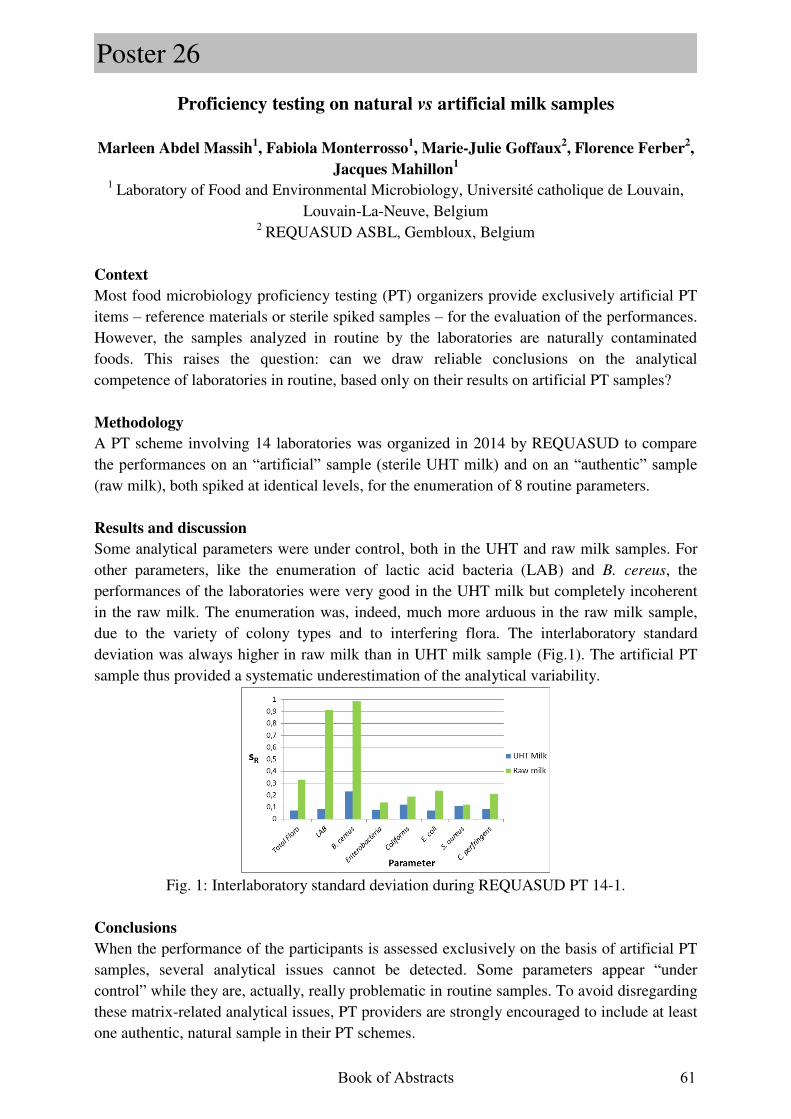
Proficiency testing on natural vs artificial milk samples
Marleen Abdel Massih1, Fabiola Monterrosso
1, Marie-Julie Goffaux
2, Florence Ferber
2,
Jacques Mahillon1
1 Laboratory of Food and Environmental Microbiology, Université catholique de Louvain,
Louvain-La-Neuve, Belgium 2 REQUASUD ASBL, Gembloux, Belgium
Context
Most food microbiology proficiency testing (PT) organizers provide exclusively artificial PT items – reference materials or sterile spiked samples – for the evaluation of the performances. However, the samples analyzed in routine by the laboratories are naturally contaminated foods. This raises the question: can we draw reliable conclusions on the analytical competence of laboratories in routine, based only on their results on artificial PT samples?
Methodology
A PT scheme involving 14 laboratories was organized in 2014 by REQUASUD to compare the performances on an “artificial” sample (sterile UHT milk) and on an “authentic” sample (raw milk), both spiked at identical levels, for the enumeration of 8 routine parameters.
Results and discussion
Some analytical parameters were under control, both in the UHT and raw milk samples. For other parameters, like the enumeration of lactic acid bacteria (LAB) and B. cereus, the performances of the laboratories were very good in the UHT milk but completely incoherent in the raw milk. The enumeration was, indeed, much more arduous in the raw milk sample, due to the variety of colony types and to interfering flora. The interlaboratory standard deviation was always higher in raw milk than in UHT milk sample (Fig.1). The artificial PT sample thus provided a systematic underestimation of the analytical variability.
Fig. 1: Interlaboratory standard deviation during REQUASUD PT 14-1.
Conclusions
When the performance of the participants is assessed exclusively on the basis of artificial PT samples, several analytical issues cannot be detected. Some parameters appear “under control” while they are, actually, really problematic in routine samples. To avoid disregarding these matrix-related analytical issues, PT providers are strongly encouraged to include at least one authentic, natural sample in their PT schemes.
Book of Abstracts 61
Poster 26
Proficiency testing in hygiene of raw milk:
enumeration of total bacteria count and somatic cells count
Jolanta G. Rola, Maciej Sosnowski, Piotr Kostrzewa, Jacek Osek
National Veterinary Research Institute, Pulawy, Poland
Introduction
In Section IX of EC Regulation 853/2004, hygienic criteria have been fixed for raw milk
(Chapter I, III). They include microbiological criteria on plate counts at 30 C and number of somatic cells. The EC Regulation 2074/2005 includes the description of reference testing methods as well as condition for the use of alternative methods. This paper presents organisation of proficiency testing program of the official control laboratories performing microbiological and cytological examinations of raw milk. The presented result concern the proficiency testing trials organized in years 2008 – 2012.
Material and methods
The interlaboratory comparison were organized by the National Veterinary Research Institute, Department of Hygiene of Food of Animal Origin as a National Reference Laboratory for Milk and Milk Products (NRL MMP) according to the ISO/IEC 17043 standard and ISO/TS 22117. The samples for analyses, chemically preserved raw milk, naturally and/or artificially contamination, were prepared by the organizer and shipped to the laboratories by express carrier, under refrigeration condition. Laboratories launched the analysis on the same day. Statistical analysis complies with ISO 13528. Participants mostly used reference methods – the plate count and microscopic methods according ISO standards described in the EU Regulation (EC) No. 2074/2005. Assigned values and standard deviation were used to assess the performance of participants. For each laboratory an individual z – score was calculated. According to the ISO/IEC 17043 standard the rules of interpretation were satisfactory (|z| ≤ 2), questionable (2 < |z| < 3) and unsatisfactory (|z| ≥ 3) results, respectively.
Results During 2008 – 2012, twenty-three laboratories participated in proficiency testing for the enumeration of total bacteria (five in all rounds, four in four rounds, fourteen in three or less rounds). For somatic cells enumeration seventeen laboratories participated (three in all rounds, four in four rounds, nine in three or less rounds). The percentages of satisfactory results for total bacteria count and somatic cells count were 97 and 96, respectively. Twelve laboratories obtained exclusively satisfactory results. Two laboratories obtained unsatisfactory results in two consecutive rounds. Follow up actions taken by laboratories with unsatisfactory results were correct. These high numbers of satisfactory results obtained during PTs indicate good level of competence of laboratories performing official control of hygiene of raw milk.
62 8th Workshop on Proficiency Testing in Analytical Chemistry, Microbiology
and Laboratory Medicine, Berlin, October 2014
Poster 27
Proficiency testing program in milk and milk products microbiology:
enumeration of Staphylococcus aureus and detection of staphylococcal
enterotoxins
Jolanta G. Rola, Weronika Korpysa – Dzirba, Anna Czubkowska, Monika Ostrowska,
Jacek Osek
National Veterinary Research Institute, Pulawy, Poland
Introduction
The National Veterinary Research Institute, Department of Hygiene of Food of Animal Origin as a National Reference Laboratory for Staphylococci (NRL CPS) organized proficiency testing (PT) to evaluate the ability of official laboratories to perform enumeration of coagulase-positive staphylococci (CPS) as well as detection of staphylococcal enterotoxins (SEs) types SEA – SEE. In this paper methods used to set up a PT scheme for quantitative and qualitative tests are presented, including preparation of test samples, statistical methods for estimating their homogeneity and stability, results processing and z – score calculation. The presented results concern the PT on enumeration of CPS and detection of SEs in milk and milk products organized in the years 2008 – 2013.
Material and methods
The PT scheme was organized and performed according to the ISO/IEC 17043 standard and ISO/TS 22117. The samples for analyzes were prepared by the organizer. The milk products were represented by cheese and milk powder matrix, artificially contaminated with Staphylococcus aureus or spiked with SEs (SEA and SEB). The coded samples were shipped to the laboratories under refrigeration condition by express carrier. Laboratories launched the analysis on the same day. Participants mostly used the reference methods according to the ISO standards described in the EU Regulation (EC) No. 2073/2005. All results obtained were compared to assigned results and were defined as consistent or inconsistent (qualitative methods). Assigned values and standard deviation were used to assess the performance of participants (quantitative methods). These values were calculated using robust statistics of Algorithm A (ISO 13528 standard). For each laboratory an individual z – score was calculated. According to ISO/IEC 17043 standard the rules of interpretation were satisfactory results (|z| ≤ 2), questionable (2 < |z| < 3) and unsatisfactory (|z| ≥ 3), respectively.
Results
A total of 122 laboratories participated in the rounds of the PT program. The number of participants ranged from three to five laboratories for detection of SEs and from 18 to 23 for CPS enumeration. The percentage of satisfactory results ranged from 93 to 100 (SEs) and from 86 to 100 (CPS). For the detection of SEs, depending on the round, consistent results were obtained by 67 – 100 % participant, for enumeration of CPS satisfactory results were reached by 83 – 100% laboratories. The overall performance of network of microbiological food diagnostic laboratories for official control was good. Follow – up action taken by laboratories with unsatisfactory results proved successful.
Book of Abstracts 63
Poster 28
Experience of the first Italian public veterinary institute accredited as provider
of food microbiological proficiency testing in conformity to ISO/IEC 17043
Paola Carnieletto, Maria Grimaldi, Marzia Mancin, Romina Trevisan, Fabio Loriggiola,
Marica Toson, Stefano Marangon
Istituto Zooprofilattico Sperimentale delle Venezie (IZSVe), Padua, Italy
IZSVe is a public veterinary Institute and it is part of the veterinary laboratory network in Italy. Its mission is to promote veterinary public health, animal welfare, and food safety. All of the laboratory tests performed in IZSVe comply with the ISO/IEC 17025:2005 standard. In conformity with the ISO/IEC 17043:2010 standard, IZSVe organizes the AQUA proficiency testing (PT) programme, which provides schemes for: food and diagnostics microbiology, fish pathology, virology, serology, and molecular biology. The PT provider acts as both provider and participant to the AQUA PT. The main role of PT provider is to control that key support personnel do not participate themselves in the PT schemes. This guarantees the impartiality and objectivity in managing the activities of the PT, and avoids any conflict of interest. The food microbiology PT includes quantitative (CFU and MPN techniques) and qualitative tests. The homogeneity and the stability of test samples are checked in accordance to the IUPAC technical report (2006) and the ISO 13528:2005 respectively. The z-score, used for the evaluation of PT results, is calculated by the assigned value obtained as a consensus value from the participants and by the standard deviation as standard deviation for proficiency assessment, equal to 0.25log10, derived from the experience of previous PTs. MPN quantitative methods are evaluated by ISO/TS 22117:2010. The Italian accreditation body (Accredia) did not allow accreditation in conformity to guides, only to standards. For this reason IZSVe asked Accredia about accreditation only in 2010 when ISO/IEC 17043 was published. The scheme of accreditation of PT providers was introduced only in 2011 by Accredia. IZSVe obtained accreditation in 2012, being the first Italian public Institute to have an accredited food microbiological PT. Following the accreditation experience, measures were taken to improve and optimize some managerial aspects. The activities included: formalization of a group of technical experts, encompassing key figures inside the PT
provider itself; editing and formalization of the terms of sale; development of a web site to submit the results of each participant, and to publish documents and reports; a customer satisfaction survey, resulting in 47% feedback and receiving different valuable suggestions which were then used to improve the quality system; organization of two conferences about ISO/IEC 17043 and PT provider management.
Other activities implemented to enhance the PT program, included: periodical re-training of key personnel for all PT process, to demonstrate improvements in
competences and skills; drafting of annual trend performance summaries, to yearly evaluate the conformity of PT, and to indicate any differences between the expected values and the assigned values; production of annual summaries to be submitted to each participant, to verify its annual performances.
64 8th Workshop on Proficiency Testing in Analytical Chemistry, Microbiology
and Laboratory Medicine, Berlin, October 2014
Poster 29
Estimation of ammonium nitrogen concentration uncertainty in wastewater effluent arising from sampling by means of proficiency testing
Magda Cotman, Andreja Drolc, Albin Pintar
Laboratory for Environmental Sciences and Engineering, National Institute of Chemistry, Ljubljana, Slovenia
Reliable measurement results are highly important for environmental protection. Wastewater emissions as point sources of contamination are monitored with a goal to protect the environment; therefore, only high quality analytical results can provide the basis for decision-making about the environmental pollution and the influence of existing or future potential contaminants. Requirements for comparable measurement results are also demonstrated by extensive adoption of quality management systems, among them laboratory accreditation against ISO/IEC 17025 is common in the environmental sector nowadays. Since sampling errors were recognized as an important factor affecting the quality of an analytical result, the needs for consistency of data arising from the European Water Framework Directive 2000/60/EC2 rendered enhancement of metrological knowledge in this step of the measurement chain more significant. Sampling of wastewater is conducted using the procedures as described in the standard ISO 5667-10. Experimental determination of sampling uncertainty contribution is costly and time intensive, especially for single laboratory experiment. The most convenient and robust way to estimate sampling uncertainty is thus participation in proficiency testing organized in agreement with international guides. In this work, we developed a methodology for the determination of SI traceable reference value of ammonium nitrogen concentration in wastewater in sampling proficiency testing (SPT). Reference measurements, based on distillation and titration method were developed, traceability to SI was established and measurement uncertainty evaluated by using a modelling approach. Later on, that reference value was used in wastewater SPT which was performed on a real sampling site. Sampling teams took part in the trial in a well known sampling site. The monitoring parameters selected were either field parameters (pH value and temperature) or laboratory measurements (ammonium nitrogen, biochemical oxygen demand (BOD5), chemical oxygen demand (COD) and total organic carbon (TOC)). The variability between reported results of participants in the SPT, expressed as CVs, were found to be 5.4 % for ammonium nitrogen, 11.1 % for COD, 19.2 % for BOD5 and 23.7 % for TOC, respectively. Based on these values, one can conclude that sampling might significantly influence results of analytical measurements. Obviously, the contribution to uncertainty from sampling is in all cases significantly larger than the contribution resulting from analytical measurements.
Book of Abstracts 65
Poster 30
Proficiency test on field measurements of oxygen, temperature, pH and
electrical conductivity in waters
Mirja Leivuori, Katarina Björklöf, Ritva Väisänen, Teemu Näykki
Finnish Environment Institute, Laboratory Centre, Helsinki, Finland
Background
New promising technology, together with pressure to improve and economize monitoring programmes, result in increasing use of field equipment for the evaluation of ecological parameters in waters in Finland. Little has been done to show the reliability of this equipment. Proftest SYKE organized the first interlaboratory comparison in Finland for field measurements of natural river water temperature, conductivity and dissolved oxygen concentration, oxygen saturation, and pH-value. The aim was to evaluate the quality of fields sensor used for natural water analysis, as well as the comparability of the results between different instruments in field conditions. Also overall quality assurance procedures were studied.
Organizing of the proficiency test
In total, 9 participants and 16 field meters took part in this proficiency test that was arranged in river Kerava, Vantaa, Finland in June 2013. The homogeneity of the test site was investigated by three different YSI 600 XLM V2 meters. All participants were interviewed about sensors used as well as quality control procedures. For evaluations of performance of each participant, z-scores were calculated allowing 3-8 % deviation from the assigned value. The mean of the reported results was used as the assigned value except for oxygen measurements were robust mean values were used, due to the non-normality of the distribution of the results.
Results
The water column was homogeneous and suited well for this proficiency test and also the total standard deviation of the participant’s results was lower than expected. In this proficiency test 80 % for pH, 70 % for conductivity and 69 % for dissolved oxygen results were regarded to be satisfactory. All sensors were less than five years old and they were calibrated according to the manufacturer’s instructions. In many cases a person responsible for the sensor has been named, but more attention should be paid to training and handling of the equipment. In addition, several participants had some quality control procedures. However, none of the participants had estimated measurement uncertainty for their sensor measurements. Results will be complemented with data from a similar test performed in June 2014.
Conclusions
Regular proficiency tests on field meters are needed to increase the credibility of use of field measurements. In addition, proficiency tests are an effective way of demonstrating the importance of quality assurance procedures also in field work, where actions of the measuring personnel are critical for representative results.
66 8th Workshop on Proficiency Testing in Analytical Chemistry, Microbiology
and Laboratory Medicine, Berlin, October 2014
Poster 31
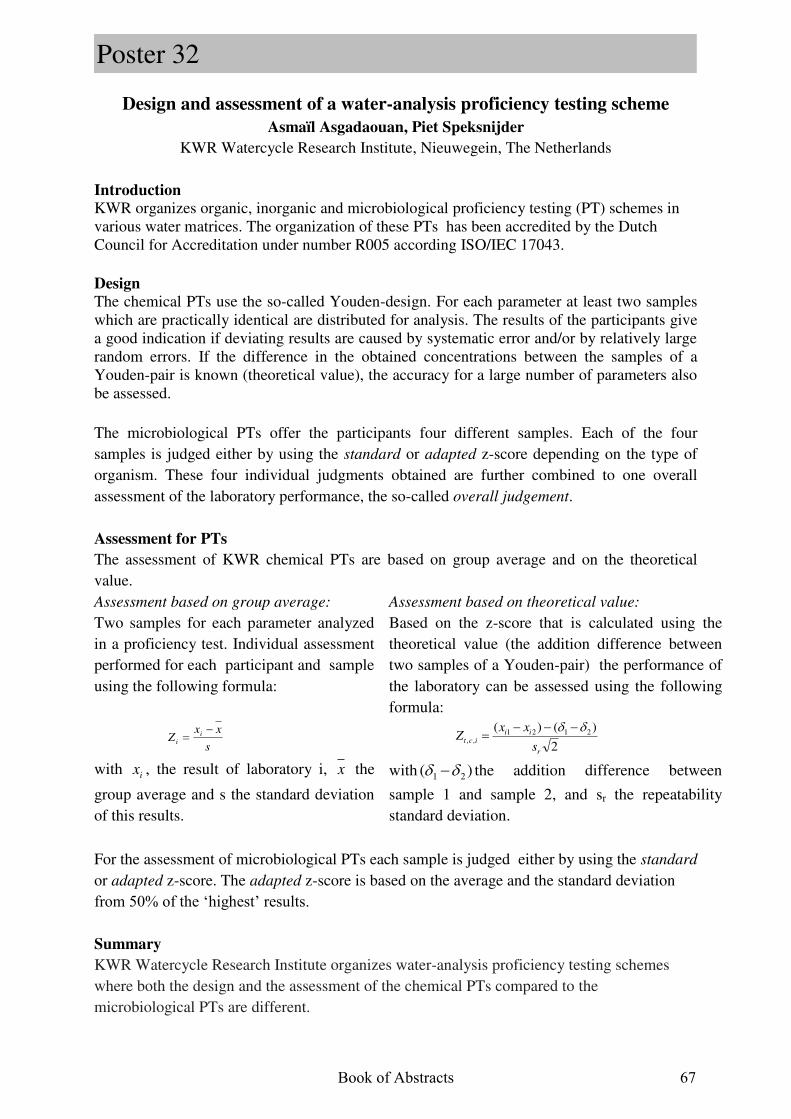
Design and assessment of a water-analysis proficiency testing scheme
Asmaïl Asgadaouan, Piet Speksnijder
KWR Watercycle Research Institute, Nieuwegein, The Netherlands
Introduction KWR organizes organic, inorganic and microbiological proficiency testing (PT) schemes in various water matrices. The organization of these PTs has been accredited by the Dutch Council for Accreditation under number R005 according ISO/IEC 17043.
Design The chemical PTs use the so-called Youden-design. For each parameter at least two samples which are practically identical are distributed for analysis. The results of the participants give a good indication if deviating results are caused by systematic error and/or by relatively large random errors. If the difference in the obtained concentrations between the samples of a Youden-pair is known (theoretical value), the accuracy for a large number of parameters also be assessed. The microbiological PTs offer the participants four different samples. Each of the four samples is judged either by using the standard or adapted z-score depending on the type of organism. These four individual judgments obtained are further combined to one overall assessment of the laboratory performance, the so-called overall judgement.
Assessment for PTs
The assessment of KWR chemical PTs are based on group average and on the theoretical value. Assessment based on group average:
Two samples for each parameter analyzed in a proficiency test. Individual assessment performed for each participant and sample using the following formula:
Assessment based on theoretical value:
Based on the z-score that is calculated using the theoretical value (the addition difference between two samples of a Youden-pair) the performance of the laboratory can be assessed using the following formula:
s
xxZ i
i
with ix , the result of laboratory i, x the
group average and s the standard deviation of this results.
2
)()( 2121,,
r
iiict
s
xxZ
with )( 21 the addition difference between
sample 1 and sample 2, and sr the repeatability standard deviation.
For the assessment of microbiological PTs each sample is judged either by using the standard or adapted z-score. The adapted z-score is based on the average and the standard deviation from 50% of the ‘highest’ results.
Summary
KWR Watercycle Research Institute organizes water-analysis proficiency testing schemes where both the design and the assessment of the chemical PTs compared to the microbiological PTs are different.
Book of Abstracts 67
Poster 32
PT program for Argentine soil analysis
Mirta Garcia1, Daniela Rodriguez Ierace
2, Fernando Kornblit
2, Gladys Mastromonaco
2
1 Universidad Nacional de La Plata, La Plata, Argentina, 2 Instituto Nacional de Tecnología Industrial, Pdo. de San Martín, Argentina
Introduction
Agriculture and grain commercialization represent a relevant proportion of economical activities in Argentina. An extended group of laboratories analyzes the soil composition, in order to optimize agriculture decisions as the best time to sowing, or the type or amount of fertilizers. So, the quality of the results delivered from these laboratories has a relevant economic impact. However, their analytical reliabilities are variable. There was not much evidence of technical competence available up to a few years ago. In this context, a proficiency testing (PT) program called PROINSA (National Interlaboratory Program of Soils for Agriculture) was created by the Ministry of Agriculture, with the participation of other public institutions as the University of Buenos Aires, the National Institute of Agriculture Technology (INTA) which advises to the producers on best sowing practices and the National Institute of Industrial Technology (INTI), the National Institute of Metrology in Argentina which is experienced in PT organization. The soil composition presents high geographic variability and the application of analytical methods have particularities in different countries. Fertilization criteria depend on these specific variables. Therefore, the existent global interlaboratory offer in soils did not responded exactly to the national needs, and it was necessary to design a national PT scheme. Results obtained PROINSA was launched in 2010, with the participation of 69 laboratories. In the last round performed in 2013 this number had grown to 98. The most relevant soil analytes, as the content of removable P, oxidable C, nitrates, sulphates, total N, Ca2, Mg2, Na+, K+, and pH were measured in each round. For most analytes, the overall performance was acceptable when compared to the customers needs. Reproducibility figures are comparable to those achieved in other global PT schemes as Wageningen Evaluating Programmes for Analytical Laboratories (WEPAL) either in terms of classical standard deviations or in robust alternatives as the algorithm A given in the ISO 13528 standard or the MAD. Results from laboratories with continuous participation since 2010 were analyzed independently. In general, they got slightly lower spread than the others. Detailed examination of the results has been made for some specific analytes: comparison of different methodologies in order to detect significant differences, correlations between pairs of samples to detect systematic effects, evolution of reproducibility standard deviations, among others. All this information is extremely useful in future improvement tasks.
Future actions The continuous participation in the PT program allows the self assessment and improvement of the laboratories. However, after 4 rounds, we can say that further actions are needed. The reproducibility figures should be improved for some relevant analytes. The results show that training/technical assistance is needed to promote improvement. A training program will be launched this year. Also, more strict criteria of performance should be used in the next rounds for some analytes. Standard deviations taken from precision experiments will be adopted in place of Algorithm A.
68 8th Workshop on Proficiency Testing in Analytical Chemistry, Microbiology
and Laboratory Medicine, Berlin, October 2014
Poster 33
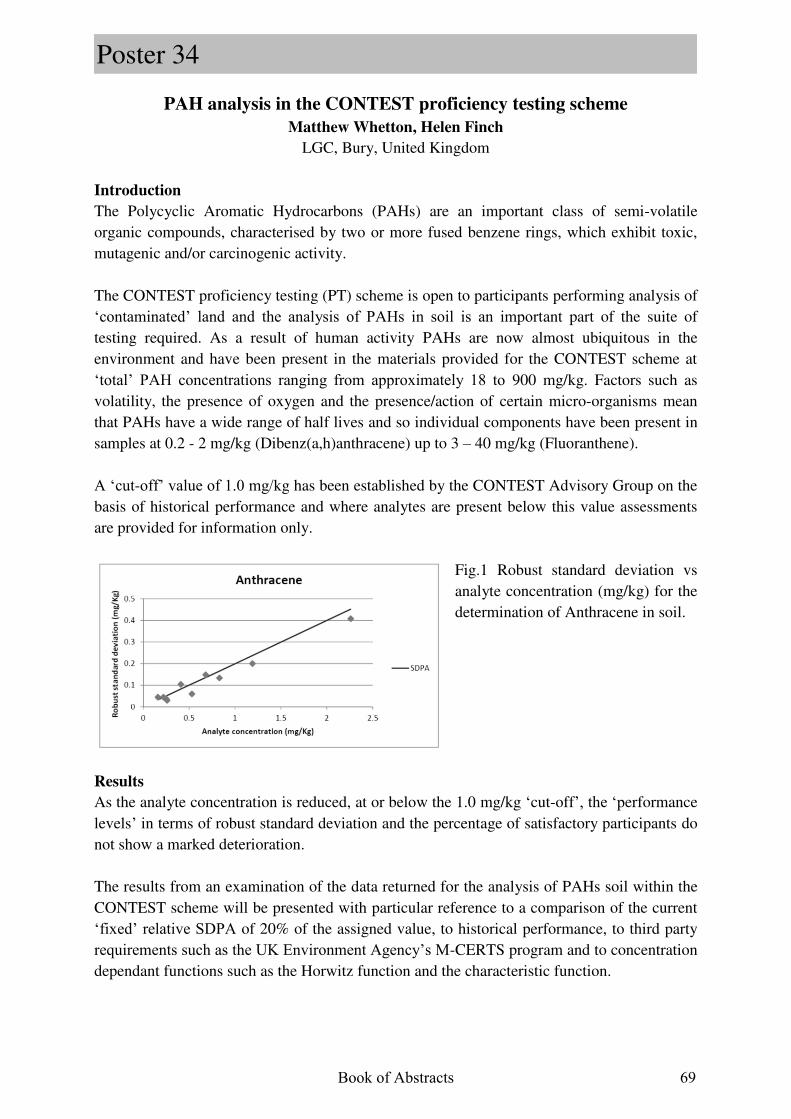
PAH analysis in the CONTEST proficiency testing scheme
Matthew Whetton, Helen Finch
LGC, Bury, United Kingdom
Introduction
The Polycyclic Aromatic Hydrocarbons (PAHs) are an important class of semi-volatile organic compounds, characterised by two or more fused benzene rings, which exhibit toxic, mutagenic and/or carcinogenic activity. The CONTEST proficiency testing (PT) scheme is open to participants performing analysis of ‘contaminated’ land and the analysis of PAHs in soil is an important part of the suite of testing required. As a result of human activity PAHs are now almost ubiquitous in the environment and have been present in the materials provided for the CONTEST scheme at ‘total’ PAH concentrations ranging from approximately 18 to 900 mg/kg. Factors such as volatility, the presence of oxygen and the presence/action of certain micro-organisms mean that PAHs have a wide range of half lives and so individual components have been present in samples at 0.2 - 2 mg/kg (Dibenz(a,h)anthracene) up to 3 – 40 mg/kg (Fluoranthene). A ‘cut-off’ value of 1.0 mg/kg has been established by the CONTEST Advisory Group on the basis of historical performance and where analytes are present below this value assessments are provided for information only.
Fig.1 Robust standard deviation vs analyte concentration (mg/kg) for the determination of Anthracene in soil.
Results
As the analyte concentration is reduced, at or below the 1.0 mg/kg ‘cut-off’, the ‘performance levels’ in terms of robust standard deviation and the percentage of satisfactory participants do not show a marked deterioration. The results from an examination of the data returned for the analysis of PAHs soil within the CONTEST scheme will be presented with particular reference to a comparison of the current ‘fixed’ relative SDPA of 20% of the assigned value, to historical performance, to third party requirements such as the UK Environment Agency’s M-CERTS program and to concentration dependant functions such as the Horwitz function and the characteristic function.
Book of Abstracts 69
Poster 34
The viability of drugs in oral fluid as a proficiency testing scheme
Christina Nugent, Karen Morgan
LGC, Proficiency Testing, Bury, United Kingdom
Over the last ten years, there has been an increase in the use of oral fluid as an alternative matrix for drug testing. Current applications are predominantly in the field of workplace drug testing and increasingly in forensic toxicology. The main advantages of oral fluid as a matrix choice are that the collection is quick and, unlike more traditional matrices such as blood, it is non-invasive. It is also much more easily monitored, thus significantly reducing the chances of any adulteration or substitution. The Drugs of Abuse in Oral Fluid (DOF) Scheme produced by LGC provides a qualitative proficiency testing (PT) scheme that is fit-for-purpose for this ever increasing market. The scheme is into its fifth year, and the data reflects the increasing number of laboratories that participate in this scheme. Looking in detail at specific commonly analyzed drugs; the analysis of Morphine, Methadone, Amfetamine and Diazepam, shows consistently high performance. The data also demonstrates an increase in the number of participants analyzing for these drugs over the years. Newer drugs of abuse, such as Ketamine and New Psychoactive Substances (NPS), including Mephedrone and MDPV, that have risen in prevalence over the past five years are included, and the results from participants reflect this. Mephedrone first began to be seen in quantity in 2009 by law enforcement agencies, and became increasing more prevalent over the next two years, especially in the United Kingdom. When the DOF Scheme first introduced Mephedrone in June 2010, no participants detected its presence. It has since been in two further rounds of the scheme and there has been an increase in the number of participants who have successfully detected the drug. This reflects how a PT scheme can be used as a relevant and useful tool for laboratories analyzing for drugs of abuse in oral fluid. In order for a drugs of abuse in oral fluid proficiency testing scheme to remain relevant it must use official thresholds, such as European Workplace Drug Testing Society Thresholds (EWDTS), and in addition it should also include the newer drugs, when appropriate.
70 8th Workshop on Proficiency Testing in Analytical Chemistry, Microbiology
and Laboratory Medicine, Berlin, October 2014
Poster 35
Assessment of practice of the laboratories participating in Korean
proficiency test for biological samples
Mi-Young Lee Occupational safety and health research institute, Korea occupational safety and health
agency, Ulsan, South Korea
Background
The Korea occupational safety and health agency (KOSHA) has been managing mandatory proficiency test (PT) program for analytical laboratories involved in special health examination. One hundred laboratories participated in PT program for organic metabolite and trace elements in biological samples to enhance the accuracy and reliability of biological monitoring of workers exposed to chemicals since 1995. After 20 years’ practice, the percentage of laboratories proficient for the PT program on organic and inorganic analysis went up over 90 percent. As further approach for total quality assurance system, KOSHA started assessment of practice of the laboratories including management system and the facilities as well as training for the employee of the laboratories since 2013.
Methods
Among the four categories of assessment for the organization participating in proficiency tests, three categories including analytical capability, laboratory management system and training of the employees were investigated for 149 laboratories. As for analytical capability assessment, five items including the performance of proficiency tests in chemical analysis and clinical tests were checked. Total operating systems of laboratory including standard operating procedures (SOP) for management of the laboratory and safety facilities were investigated by checking 15 items while visiting each laboratory. Four items of training concerning education and participating in seminars or conferences of analytical field were included in the assessment.
Result
The score of the assessment was announced as three groups such as S, A, and B. The percentages of upper S group were 31 % for analytical capability, 6 % for laboratory management system and 6 % for training. The practice improved the total management of the laboratory by providing them chances to prepare for the items for the assessment.
Book of Abstracts 71
Poster 36
Development of the AIR Materials Emissions proficiency testing scheme for
the analysis of volatile organic compounds
Owen Butler1, Helen Finch
2, Ian Pengelly
1, Matthew Whetton
2
1Health and Safety Laboratory, Buxton, UK 2LGC, Bury, UK
Background
Increased awareness of the potential health risks associated with poor indoor air quality has resulted in consumer-driven initiatives focused on the development of lower-emitting ‘green’ products. This in turn has stimulated calls for improved assessment and labelling of products used indoors, specifically construction materials. Regulations, such as the European Construction Products Regulation (CPR) require that manufacturers understand and measure emissions of volatile and semi-volatile organic compounds (VOCs and SVOCs) from their products, and comply with national limits. Manufacturers of building materials, adhesives and sealants, coatings, flooring, wall coverings, furniture, polymers and plastics are therefore required to carry such measurements. Here test items, or representative portions thereof, are placed in climate controlled chambers and (S)VOCs that are released are sampled onto sorbent tubes. These in turn are analysed using a thermal desorption gas chromatographic method as codified in ISO 16000-6 [1] or equivalent standards. This work describes the development of a new proficiency testing scheme designed to assist laboratories undertaking this analytical measurement step.
Method
Test samples are prepared by sampling metered volumes of VOC enriched air onto individual sorbent tubes from a stable atmosphere based upon procedures described in ISO 6145-4 [2]. This ISO standard specifies a method for the continuous production of stable gas mixtures, containing two or more components, generation via the vaporisation of solvent mixes, through their continuous injection into a gas stream by means of a syringe. The merits of the approach are: a substantial quantity of a gas mixture atmosphere can be prepared economically on a continuous and stable basis; individually metered flow rates ensures that highly precise test samples are produced and by loading from the gas-phase, test samples mimic how real world samples are collected. Outcome
This work will present details of the development of a sorbent tube loading rig used to produce replicate test samples. Associated test sample homogeneity and stability data will also be presented. Summary results from the first five rounds of this new PT scheme involving twenty laboratories will then be presented and evaluated against analytical quality requirements set out in ISO 16000-6 and CEN TS 16516:2013 [3]. [1] ISO 16000-6:2011 Indoor air – Part 6: Determination of volatile organic compounds in indoor and test chamber air by active sampling on Tenax TA sorbent, thermal desorption and gas chromatography using MS or MS-FID. [2] ISO 6145-4:2004 Gas analysis – Preparation of calibration gas mixtures using dynamic volumetric methods – Part 4: Continuous syringe injection method. [3] PD CEN/TS 16516:2013 Construction products – Assessment of release of dangerous substances – Determination of emissions into indoor air.
72 8th Workshop on Proficiency Testing in Analytical Chemistry, Microbiology
and Laboratory Medicine, Berlin, October 2014
Poster 37
A new proficiency testing scheme for asbestos analysis by scanning electron
microscopy
Laurie Davies, Emma Tan
Health and Safety Laboratory, Buxton, UK
A new proficiency testing scheme has been established which aims to improve laboratory measurement of asbestos and other inorganic fibres by scanning electron microscopy (SEM) and energy dispersive X-ray analysis (EDX). The scheme is in its fourth year and includes over 50 European laboratories. Participating laboratories are recommended to use either the ISO 14966 or VDI 3492 methods, although any appropriate analytical method may be used.
Scheme samples are produced in the laboratory using a novel combination of a modified dustiness tester and a multi-port sampling “Sputnik” device. Pre-gold coated filters are loaded with different densities of amphibole asbestos fibres, chrysotile, other inorganic fibres or mixtures of fibre types. Non-fibrous particulate material can also be included by choosing an appropriate “source” material.
Data analysis is being undertaken in a number of different ways. To date laboratories have received feedback which mirrors existing asbestos fibre counting proficiency testing schemes. However, quantification of variability in fibre counts has received little attention. Variability can be partitioned into between-laboratory variability (variability in counts from laboratory to laboratory) and within-laboratory variability (which may include random variability in the true counts from slide to slide and measurement error). Where a laboratory submits several measurements per sample or per round, “laboratory” effects may result in correlation between counts; certain laboratories will report counts that are consistently higher than average whilst some will report counts that are consistently lower, inducing between-laboratory variability.
Such effects have been accounted for in statistical analyses using a random effects model to quantify between-laboratory variability, within laboratory variability, and laboratory random effects, estimates of which will be presented.
Book of Abstracts 73
Poster 38
Proficiency testing to protect worker health
Mary Ann Latko1, Angela Oler
1, Daniel Tholen
2
1AIHA PAT Programs, Falls Church, USA 2Dan Tholen Statistical Consulting, Traverse City, USA
Introduction
Sampling followed by chemical analysis is used by occupational health and safety professionals to assess workplace contaminants and associated worker exposures. The validity of such assessments is based, in part, on the procedures used for sample collection and analysis, and data interpretation. In many instances these collection and interpretation procedures use approaches that have been refined over many years and are accepted by the professionals as good practice. Accredited occupational hygiene sample proficiency testing (PT) programs fulfill the need for similar validity in sample analysis. This paper presents a case study of long-term, stable PT programs that support the needs of such professionals and related laboratory accreditation programs.
Background
The Proficiency Analytical Testing (PAT) Programs have been in existence since 1972. In 1987, the National Institute of Occupational Safety and Health (NIOSH) transferred administration of accreditation and proficiency testing to the American Industrial Hygiene Association (AIHA). AIHA PAT Programs, LLC was created as a separate legal entity in 2009. AIHA PAT Programs currently has more than 800 participants from private and government laboratories, educational institutions, and other interested parties in over 25 countries and territories. AIHA PAT Programs administers five PT programs – industrial hygiene (IHPAT), environmental lead (ELPAT), bulk asbestos (BAPAT), Beryllium (BePAT), and environmental microbiology (EMPAT). The programs’ statistical methods use the consensus of a reference group of experts and a statistical technique similar to what is described in ISO 13528:2005. The IHPAT and ELPAT Programs are accredited to ISO/IEC 17043:2010 by A2LA.
The study
This case study provides an overview of the evolution and growth of a comprehensive suite of occupational hygiene PT programs. These programs have been designed to meet the needs of regulators and laboratories that analyze samples for the purposes of evaluating workplace exposures. Workplace exposure concerns have evolved over the 40 years PAT Programs have been operated as have the Programs’ scheme plans. Over the span of the Programs’ operations there have been more than 650 rounds completed and over 25,000 samples analyzed by program participants. Summary statistics regarding length and level of participation, overall participant pool performance and other parameters are presented.
74 8th Workshop on Proficiency Testing in Analytical Chemistry, Microbiology
and Laboratory Medicine, Berlin, October 2014
Poster 39
Delivering external quality assessment for the World Health Organisation
Barbara De la Salle 1, Vatsala Soni
1, Paul McTaggart
1, Mary West
1, Laura Ahmed
2,
Keith Hyde 1
1 UK NEQAS (H), Watford, UK
2 Manchester Metropolitan University, Manchester, UK.
UK NEQAS General Haematology (UK NEQAS (H)) is a designated World Health Organisation (WHO) Collaborating Centre for Quality Assurance in Haematology. This role includes the delivery of the International External Quality Assessment Scheme for Haematology (IEQAS (H)) to 66 laboratories in 58 WHO member states. The participants include government funded district and rural laboratories, all WHO sponsored, based in various countries in Africa, Eastern Mediterranean, Pacific Asia, South East Asia and the Western Pacific, presenting diverse challenges. The objective of the WHO is that the centre should be one of excellence, which has the skills to develop and promote external quality assessment (EQA) in the region. The IEQAS (H) scheme assesses the ability of the laboratory to measure haemoglobin, white blood count and platelets in survey material comprising haemolysate with the addition of fixed chicken cells to simulate white blood cells and fixed human platelets. In addition, blood films are provided for reticulocyte count, white cell differential, blood film morphology and parasite identification. There are many challenges to the provision of the IEQAS (H) scheme. IEQAS (H) survey material was developed for basic haematology technology, which has been superseded by fully automated analysers in many laboratories. IEQAS (H) withdrew haemoglobicyanide preparations some years ago, as few laboratories are able to analyse this type of material. Although the laboratories would benefit from receiving the standard UK NEQAS (H) whole blood material, this is not sufficiently robust to withstand the long postal transit times typically experienced to the participating sites. Financial restraints make courier delivery difficult. The remote location of some sites, regional and local conflict, language barriers and inadequate fax or internet connections pose barriers to efficient communications. Despite the challenges, IEQAS (H) has demonstrated improvements in performance, especially in morphology skills, where the proportion of participants with unsatisfactory morphology performance fell from 18 % to 5 % in the first 7 years and those with poor parasite identification performance from 32 % to 8 %. Looking to the future, IEQAS (H) participants have collaborated in the testing of new e-learning technology to support improvement in malaria diagnostic skills.
Book of Abstracts 75
Poster 40
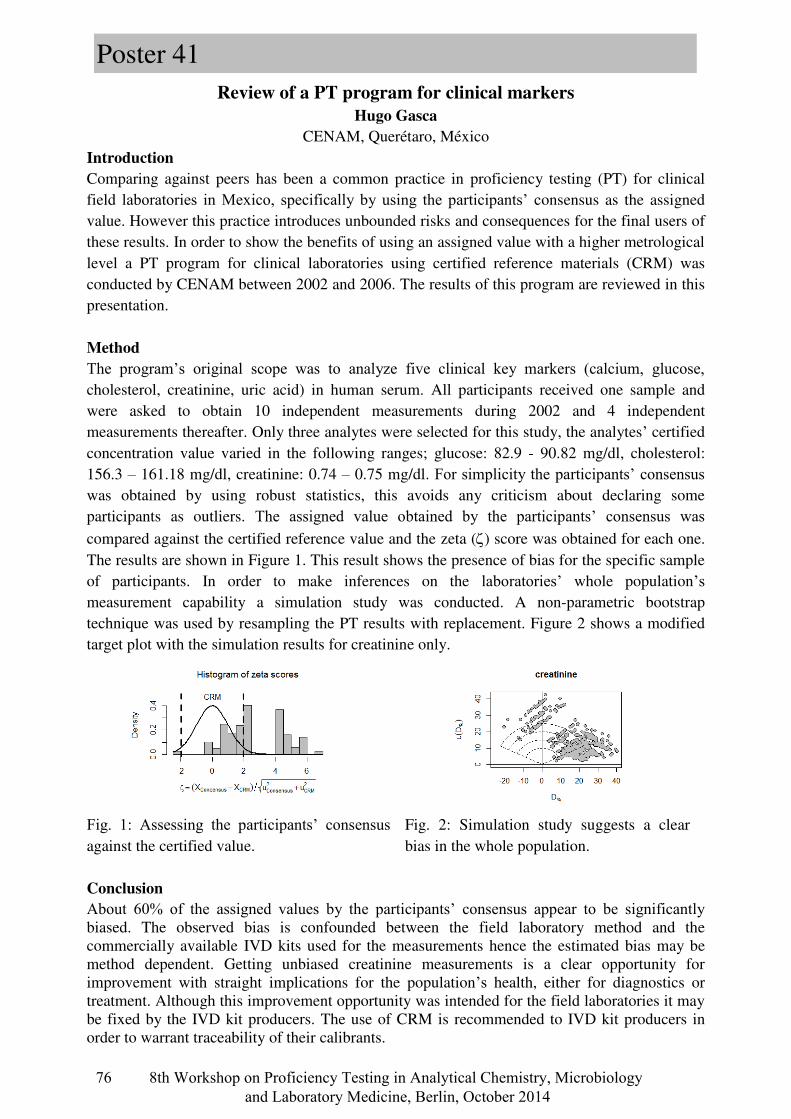
Review of a PT program for clinical markers
Hugo Gasca
CENAM, Querétaro, México
Introduction
Comparing against peers has been a common practice in proficiency testing (PT) for clinical field laboratories in Mexico, specifically by using the participants’ consensus as the assigned value. However this practice introduces unbounded risks and consequences for the final users of these results. In order to show the benefits of using an assigned value with a higher metrological level a PT program for clinical laboratories using certified reference materials (CRM) was conducted by CENAM between 2002 and 2006. The results of this program are reviewed in this presentation.
Method
The program’s original scope was to analyze five clinical key markers (calcium, glucose, cholesterol, creatinine, uric acid) in human serum. All participants received one sample and were asked to obtain 10 independent measurements during 2002 and 4 independent measurements thereafter. Only three analytes were selected for this study, the analytes’ certified concentration value varied in the following ranges; glucose: 82.9 - 90.82 mg/dl, cholesterol: 156.3 – 161.18 mg/dl, creatinine: 0.74 – 0.75 mg/dl. For simplicity the participants’ consensus was obtained by using robust statistics, this avoids any criticism about declaring some participants as outliers. The assigned value obtained by the participants’ consensus was compared against the certified reference value and the zeta () score was obtained for each one.
The results are shown in Figure 1. This result shows the presence of bias for the specific sample of participants. In order to make inferences on the laboratories’ whole population’s measurement capability a simulation study was conducted. A non-parametric bootstrap technique was used by resampling the PT results with replacement. Figure 2 shows a modified target plot with the simulation results for creatinine only.
Fig. 1: Assessing the participants’ consensus against the certified value.
Fig. 2: Simulation study suggests a clear bias in the whole population.
Conclusion
About 60% of the assigned values by the participants’ consensus appear to be significantly biased. The observed bias is confounded between the field laboratory method and the commercially available IVD kits used for the measurements hence the estimated bias may be method dependent. Getting unbiased creatinine measurements is a clear opportunity for improvement with straight implications for the population’s health, either for diagnostics or treatment. Although this improvement opportunity was intended for the field laboratories it may be fixed by the IVD kit producers. The use of CRM is recommended to IVD kit producers in order to warrant traceability of their calibrants.
76 8th Workshop on Proficiency Testing in Analytical Chemistry, Microbiology
and Laboratory Medicine, Berlin, October 2014
Poster 41
Six years of proficiency tests for the identification
of Prion protein genotype in sheep
Barbara Chiappini, Gaia Scavia, Luisella Morelli, Michela Conte, Paola Fazzi,
Umberto Agrimi, Marina Patriarca, Gabriele Vaccari
Department of Veterinary Public Health and Food Safety, Istituto Superiore di Sanità, Rome, Italy
Introduction
Scrapie of sheep belongs to a group of fatal neurodegenerative diseases known as prion diseases. Other members of the group are Creutzfeldt – Jakob disease in humans and bovine spongiform encephalopathy in cattle. Scrapie is an infectious disease and sheep susceptibility is under the control of the host genotype. On this basis, the European Union has established management strategies for scrapie, to be achieved both by means of ad hoc breeding programmes for the ovine population and selective culling based upon the Prion protein genotype. Since 2009, the Istituto Superiore di Sanità organises proficiency testing (PT) focused on genotype identification from sheep blood for the detection of genetically susceptible or resistant animals, aimed to assess the analytical accuracy of the tests conducted by the participants.
Results
Six PTs were organized between 2005 and 2013, in which 20 (18 on one occasion) blood samples with different genotypes were submitted for analysis to the 11 or 12 laboratories (depending on year) performing such tests on a routine basis. Participants were allowed to use their own method and different molecular techniques (Real-Time PCR, Sanger sequencing, Primer extension, Pyrosequencing or a combination of Real-Time PCR and Restriction fragment length polymorphism) were applied. The laboratory results were used to evaluate the accuracy, specificity, sensitivity and inter-annotator agreement applying the Cohen's kappa coefficient of the method used. Since 2005, the performance of the laboratories improved over the years.
Conclusion
The low number of laboratories failing the PT is indicative of an overall good technical level of the laboratories involved in the management of scrapie. Moreover the positive trend of the percentages of laboratories passing the PT is representative of an improved performance on the correct identification of animals resistant or susceptible to scrapie.
Book of Abstracts 77
Poster 42
Performance assessment of blood parasite detection in haematology
Barbara De la Salle, Dan Pelling, Keith Hyde
UK NEQAS (H), Watford, UK
The UK National External Quality Assessment Scheme for General Haematology (UK NEQAS (H)) provides external quality assessment (EQA) for blood parasite identification to approximately 500 clinical haematology laboratories. For many years, the performance criteria have required all participants not only to detect parasites in blood films but also to identify the species present correctly. Feedback from participants has shown that some feel unduly penalised by this system, as it does not take into account the scope of their clinical practice. UK NEQAS (H) is introducing a two-stage performance assessment system that better reflects the clinical significance of performance and supports laboratories in demonstrating quality practice.
Stage one of the proposed scheme would be undertaken by all subscribing laboratories and would require them only to indicate whether a specimen is positive or negative for parasites and to which category the parasite belongs; e.g. malaria, microfilaria, trypanosome; stage one would not ask for the genus, or species to be identified. Stage two of the proposed scheme would be undertaken by selected laboratories and would require them to classify the parasite in cases positive only for Plasmodium species, and perform parasite counts where necessary. Thus laboratories that only offer parasite screening services would participate in the scheme to an extent that reflects their service repertoire.
Initial, retrospective modelling of the stage one performance assessment reviewed returns from 16 cases distributed in 2011 and 2012 – a total of 7255 submissions from 490 laboratories. The cases included P.falciparum (6 cases), mixed P.falciparum/P.ovale (1), P.vivax (1), P.malariae (2), P.ovale (1), Filaria (2), Trypanasoma (1) and negative for parasites (2); all, bar two, were thin films. 96 % (6994) of returns correctly identified the presence and type of parasite, 0.14 % (10) gave the correct parasite plus an incorrect parasite, 0.48 % (35) gave the incorrect parasite and 3.4 % (246) reported either false positive or false negative. 301/490 participants made no errors in the 2 years studied, 106 made one error, 69 made 2 errors and 14 more than 2 errors. Participating laboratories are allocated an adverse performance score of for each out of consensus return and a cumulative score calculated over a rolling time window of 6 cases. Unsatisfactory performance (UP) is classified as an incorrect return for 1/6 cases, persistent unsatisfactory performance (PUP) as an out of consensus return for 2/6 cases and unresolved PUP as an out of consensus return for 3/6 cases. 68/490 laboratories would have been classified as PUPs and 6 as unresolved PUPs in the study period.
The proposal has been accepted by the UK NEQAS (H) expert advisory group as appropriate for the demonstration of confidence and competence in parasite identification; scoring of parasite detection (stage one) is currently being implemented in shadow format.
78 8th Workshop on Proficiency Testing in Analytical Chemistry, Microbiology
and Laboratory Medicine, Berlin, October 2014
Poster 43
An interlaboratory trial to determine the titre of the new batch of the OIE
antirabies positive reference serum from dog origin
Marine Wasniewski, Anouck Labadie, Jonathan Rieder, Jean-Luc Schereffer,
Laetitia Tribout, Florence Cliquet
French Agency for Food, Environmental and Occupational Health & Safety (ANSES), Nancy
Laboratory for Rabies and Wildlife, Malzéville, France
Rabies vaccination of domestic carnivores and wildlife is a powerful tool to prevent, control and eliminate rabies. The presence of neutralising rabies antibodies in blood is considered as a reliable indicator of adequate vaccination ensuring satisfactory protection against the disease.
Most countries have relaxed their quarantine measures and adopted a scheme combining vaccination of pets against rabies followed by a serological test to check the efficacy of vaccination. This new scheme has been strongly supported by the OIE (World Organisation for Animal Health), WHO (World Health Organisation) and the European Commission to facilitate the free movements of people and pets around the world. To be considered as protective, the minimal level of neutralising rabies antibodies required by international authorities is 0.5 IU/mL in vaccinated animals.
Nowadays, only two reference methods are recognized and prescribed to measure rabies antibody levels in serum samples for international trade: the FAVN test (Fluorescent Antibody Virus Neutralisation test) and the RFFIT (Rapid Fluorescent Focus Inhibition Test). Although they are reliable and valuable methods for assessing the efficacy of rabies vaccination, it is necessary to have an international positive reference control to validate the test and to obtain harmonized titres between worldwide laboratories as well. That is why, for the FAVN test, the OIE recommends the use of the OIE reference serum from dog origin to express the titre of sample in IU/mL. This expression results in a comparison of neutralising dilution between samples and OIE serum of dog origin under the same experimental conditions. To be reliable and robust, the titre of this OIE reference serum should be a consensus value determined by international OIE reference laboratories for rabies during an interlaboratory test.
During this ring trial, involving 5 international laboratories, the diagnostic specificity criterion has been assessed in addition to the determination of the consensus titre.
The organization of this interlaboratory test and the statistical analyses performed on the results given by the participating laboratories will be presented on the poster.
Book of Abstracts 79
Poster 44
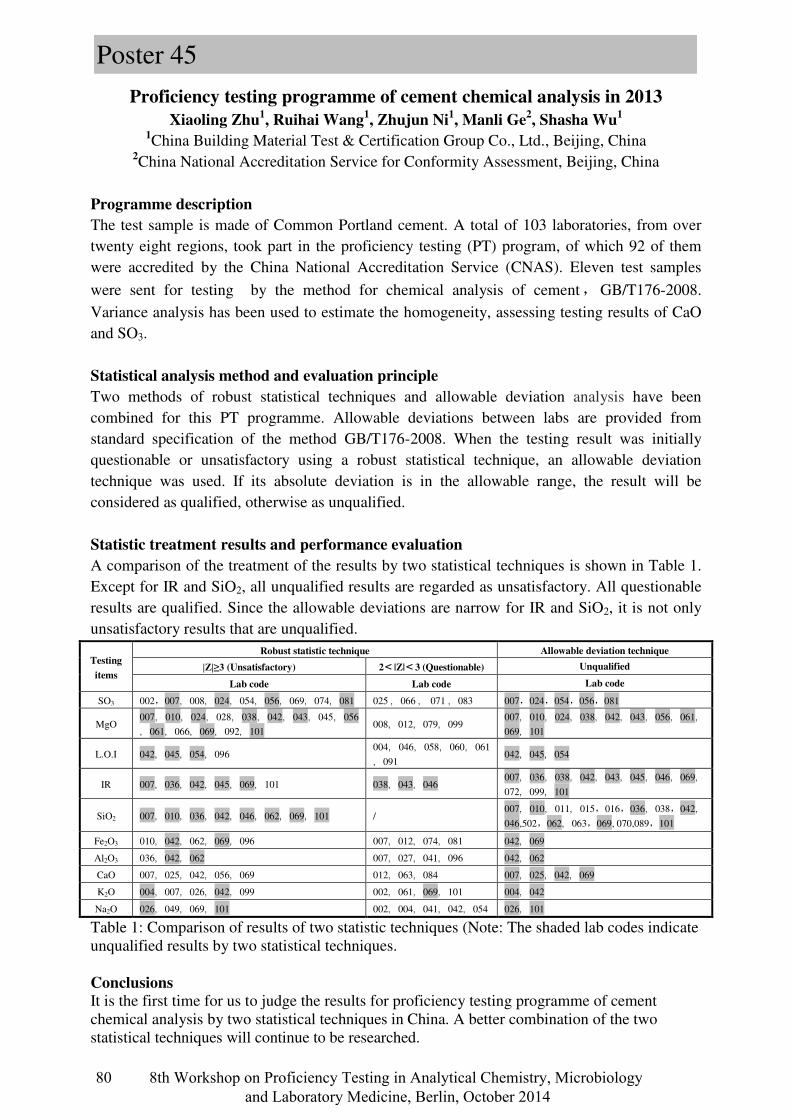
Proficiency testing programme of cement chemical analysis in 2013
Xiaoling Zhu1, Ruihai Wang
1, Zhujun Ni
1, Manli Ge
2, Shasha Wu
1 1China Building Material Test & Certification Group Co., Ltd., Beijing, China
2China National Accreditation Service for Conformity Assessment, Beijing, China
Programme description
The test sample is made of Common Portland cement. A total of 103 laboratories, from over twenty eight regions, took part in the proficiency testing (PT) program, of which 92 of them were accredited by the China National Accreditation Service (CNAS). Eleven test samples
were sent for testing by the method for chemical analysis of cement,GB/T176-2008.
Variance analysis has been used to estimate the homogeneity, assessing testing results of CaO and SO3.
Statistical analysis method and evaluation principle
Two methods of robust statistical techniques and allowable deviation analysis have been combined for this PT programme. Allowable deviations between labs are provided from standard specification of the method GB/T176-2008. When the testing result was initially questionable or unsatisfactory using a robust statistical technique, an allowable deviation technique was used. If its absolute deviation is in the allowable range, the result will be considered as qualified, otherwise as unqualified.
Statistic treatment results and performance evaluation
A comparison of the treatment of the results by two statistical techniques is shown in Table 1. Except for IR and SiO2, all unqualified results are regarded as unsatisfactory. All questionable results are qualified. Since the allowable deviations are narrow for IR and SiO2, it is not only unsatisfactory results that are unqualified.
Testing
items
Robust statistic technique Allowable deviation technique
|Z|≥3 (Unsatisfactory) 2<|Z|<3 (Questionable) Unqualified
Lab code Lab code Lab code
SO3 002,007,008,024,054,056,069,074,081 025 ,066 , 071 ,083 007,024,054,056,081
MgO 007,010,024,028,038,042,043,045,056
,061,066,069,092,101 008,012,079,099
007,010,024,038,042,043,056,061,
069,101
L.O.I 042,045,054,096 004,046,058,060,061
,091 042,045,054
IR 007,036,042,045,069,101 038,043,046 007,036,038,042,043,045,046,069,
072,099,101
SiO2 007,010,036,042,046,062,069,101 / 007,010,011,015,016,036,038,042,
046,502,062,063,069, 070,089,101
Fe2O3 010,042,062,069,096 007,012,074,081 042,069
Al2O3 036,042,062 007,027,041,096 042,062
CaO 007,025,042,056,069 012,063,084 007,025,042,069
K2O 004,007,026,042,099 002,061,069,101 004,042
Na2O 026,049,069,101 002,004,041,042,054 026,101
Table 1: Comparison of results of two statistic techniques (Note: The shaded lab codes indicate unqualified results by two statistical techniques. Conclusions It is the first time for us to judge the results for proficiency testing programme of cement chemical analysis by two statistical techniques in China. A better combination of the two statistical techniques will continue to be researched.
80 8th Workshop on Proficiency Testing in Analytical Chemistry, Microbiology
and Laboratory Medicine, Berlin, October 2014
Poster 45
Organization and evaluation of PTs for the determination of VOC-
emissions from materials in emission test chambers
Olaf Wilke, Wolfgang Horn
BAM Federal Institute for Materials Research and Testing, Belin, Germany
Introduction
The document CEN TS 16516 of CEN/TC 351/WG 2 “Construction products – Assessment of emissions of regulated dangerous substances from construction products” is a standard for the determination of emissions from construction products into indoor air. The determination is done by the use of emission test chambers in combination with appropriate sampling and analysis methods. A major problem for the execution of proficiency tests in this field is the lack of reference materials with known emission rates of target substances and appropriate concentrations in the test chambers in the range of 50 to 150 µg/m³.
Methodologies
From 2008 BAM conducted 4 proficiency tests using 4 different materials (sealing, lacquer, wooden board and lacquer, again). 29 participants took part in 2008 and until 2014 the number of participants increased to 55. Homogeneity of the test material was verified at BAM by doing up to 12 parallel chamber tests. Samples were shipped within a few days to the participants shortly before the common start (loading of test chambers). For the evaluation the mean (robust statistic) of all results was used as the assigned value. The evaluation was done by calculating z-scores using the commercial software PROLab. The requirement for a successful participation is a z score between -2 and 2 for 80 % of the target compounds.
Results and discussion
In each proficiency test about 20 % of the participants could not fulfil the requirement for a successful participation. The standard deviations for most compounds (e.g. butanol, butyl acetate, styrene, phenol, limonene, tridecane) in the 4 proficiency tests were between 20 and 30 %. According to Horwitz (2006) the results are in the expected range for the standard deviation. However, the standard deviation for each compound depends on the analytical behaviour of the compound and on its concentration in chamber air.
Book of Abstracts 81
Poster 46
State of field measurement of facade sound insulation in buildings:
Evaluation of Proficiency Testing data according to ISO 140-5:1998
José Luis Martínez1, José Alberto Trujillo
2, Pedro Rosario
1, Juan Sancho
2
1 RPS-Qualitas, Madrid, Spain 2 Acustilab, Madrid, Spain
The ISO 140-5:1998 specifies the testing methods to evaluate the sound insulation in buildings and building elements for facades. For each method, procedures are established using the broadband emission of a loudspeaker as an artificial sound source, or using real noise available on the spot where the facade or facade element is located. From the year 2011, the Spanish network of laboratories ACUSTILAB, set up within EUROLAB-ESPAÑA organization, has accomplished three rounds of a proficiency testing scheme at the national level for airborne sound insulation measurements. The tests have been performed according to the methods specified in the standard for a whole facade by using an external loudspeaker as the noise source. The global parameter (calculated according to ISO 717-1:2013) is Dls,2m,nT and the measurements have been carried out in bands of a third of octave, in the frequency range 100 to 5000 Hz. The development of this interlaboratory program includes a series of planned stages related to the supervision, follow-up and control of the measurement item to assure the stability of the scenario. These aspects are fully considered to guarantee the adequacy of the interlaboratory comparison by means of the assessment of some global precision criteria in compliance with the scope stipulated by the normative references, since no regulatory or prescribed values are available for reproducibility verification in this scope. The statistical design intended for the analysis of the proficiency testing results is carried out according to the standard ISO 5725-2:1994 in order to determine the limits of reproducibility in a regulated measurement method. To evaluate the participant performance, given that the global parameter is determined from the individual measures in each frequency, the corresponding combined scores as composite indexes are calculated on the basis of the determination of the SSZ values. If this assessment is performed along the number of interlaboratory rounds carried out up to date, since they are comparable enough, it allows to settle those participants that show an overall satisfactory performance by monitoring their achievement over time. Therefore, in order to establish a reference value in terms of precision level to determine the obtained standard deviation for proficiency assessment, an approach based on the development of a collaborative test in controlled conditions is proposed. The goal is to provide reliable and updated criteria for the evaluation of repeatability and reproducibility values in this field, particularly in those scopes in which nowadays there is no normative reference or this is very poor. Furthermore, these prescribed values of precision should be verified regularly, as well as the definition of practical conditions of application.
82 8th Workshop on Proficiency Testing in Analytical Chemistry, Microbiology
and Laboratory Medicine, Berlin, October 2014
Poster 47
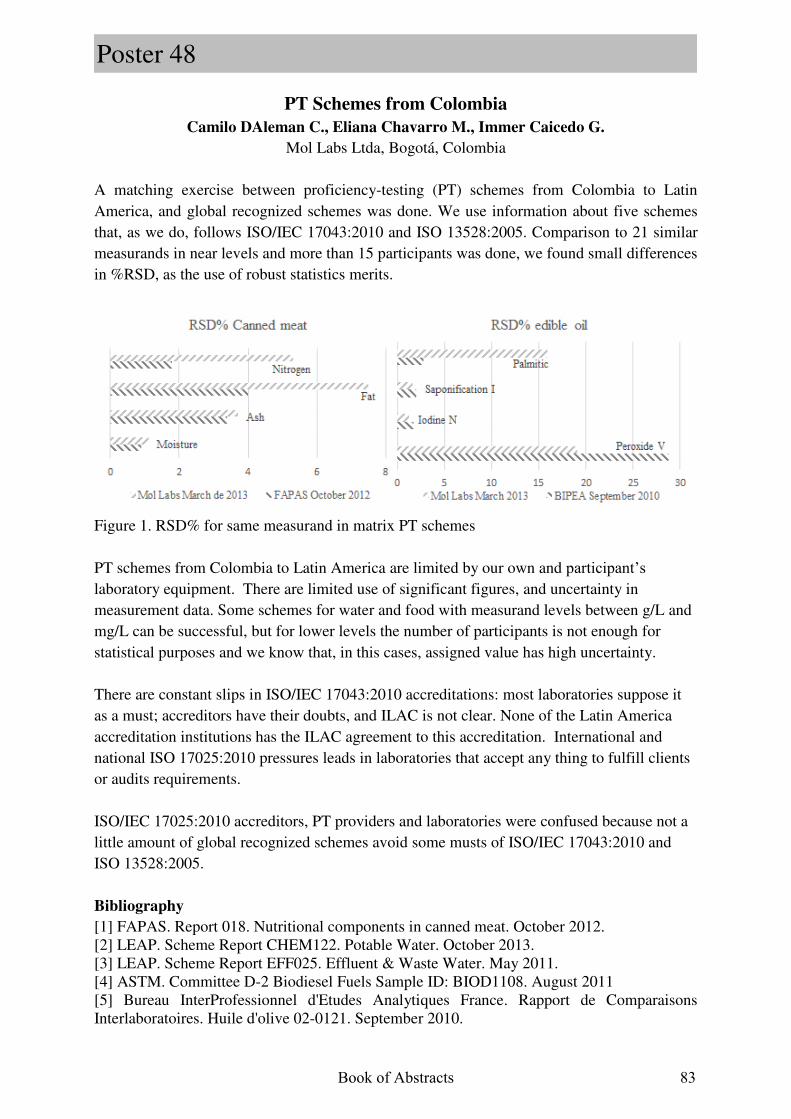
PT Schemes from Colombia
Camilo DAleman C., Eliana Chavarro M., Immer Caicedo G.
Mol Labs Ltda, Bogotá, Colombia
A matching exercise between proficiency-testing (PT) schemes from Colombia to Latin America, and global recognized schemes was done. We use information about five schemes that, as we do, follows ISO/IEC 17043:2010 and ISO 13528:2005. Comparison to 21 similar measurands in near levels and more than 15 participants was done, we found small differences in %RSD, as the use of robust statistics merits.
Figure 1. RSD% for same measurand in matrix PT schemes PT schemes from Colombia to Latin America are limited by our own and participant’s laboratory equipment. There are limited use of significant figures, and uncertainty in measurement data. Some schemes for water and food with measurand levels between g/L and mg/L can be successful, but for lower levels the number of participants is not enough for statistical purposes and we know that, in this cases, assigned value has high uncertainty. There are constant slips in ISO/IEC 17043:2010 accreditations: most laboratories suppose it as a must; accreditors have their doubts, and ILAC is not clear. None of the Latin America accreditation institutions has the ILAC agreement to this accreditation. International and national ISO 17025:2010 pressures leads in laboratories that accept any thing to fulfill clients or audits requirements. ISO/IEC 17025:2010 accreditors, PT providers and laboratories were confused because not a little amount of global recognized schemes avoid some musts of ISO/IEC 17043:2010 and ISO 13528:2005.
Bibliography
[1] FAPAS. Report 018. Nutritional components in canned meat. October 2012. [2] LEAP. Scheme Report CHEM122. Potable Water. October 2013. [3] LEAP. Scheme Report EFF025. Effluent & Waste Water. May 2011. [4] ASTM. Committee D-2 Biodiesel Fuels Sample ID: BIOD1108. August 2011 [5] Bureau InterProfessionnel d'Etudes Analytiques France. Rapport de Comparaisons Interlaboratoires. Huile d'olive 02-0121. September 2010.
Book of Abstracts 83
Poster 48
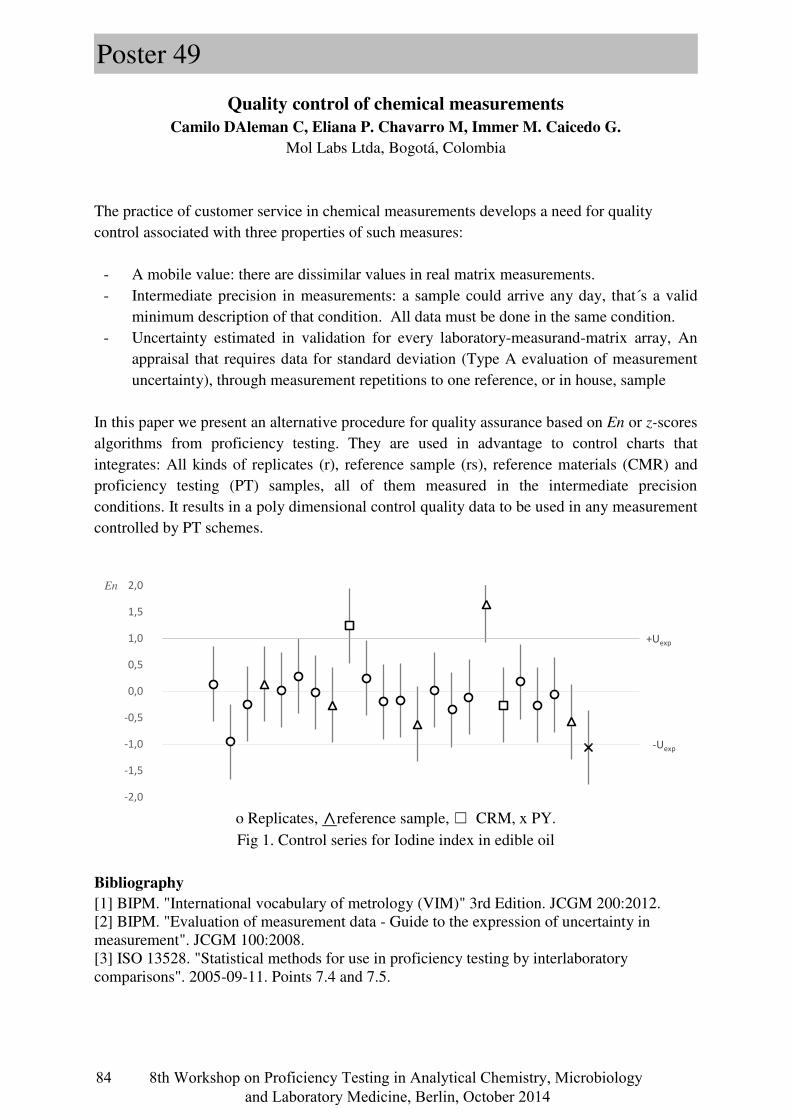
Quality control of chemical measurements
Camilo DAleman C, Eliana P. Chavarro M, Immer M. Caicedo G.
Mol Labs Ltda, Bogotá, Colombia
The practice of customer service in chemical measurements develops a need for quality control associated with three properties of such measures:
- A mobile value: there are dissimilar values in real matrix measurements. - Intermediate precision in measurements: a sample could arrive any day, that´s a valid
minimum description of that condition. All data must be done in the same condition. - Uncertainty estimated in validation for every laboratory-measurand-matrix array, An
appraisal that requires data for standard deviation (Type A evaluation of measurement uncertainty), through measurement repetitions to one reference, or in house, sample
In this paper we present an alternative procedure for quality assurance based on En or z-scores algorithms from proficiency testing. They are used in advantage to control charts that integrates: All kinds of replicates (r), reference sample (rs), reference materials (CMR) and proficiency testing (PT) samples, all of them measured in the intermediate precision conditions. It results in a poly dimensional control quality data to be used in any measurement controlled by PT schemes.
o Replicates, ∧reference sample, ☐ CRM, x PY.
Fig 1. Control series for Iodine index in edible oil
Bibliography [1] BIPM. "International vocabulary of metrology (VIM)" 3rd Edition. JCGM 200:2012. [2] BIPM. "Evaluation of measurement data - Guide to the expression of uncertainty in measurement". JCGM 100:2008. [3] ISO 13528. "Statistical methods for use in proficiency testing by interlaboratory comparisons". 2005-09-11. Points 7.4 and 7.5.
+Uexp
-Uexp
-2,0
-1,5
-1,0
-0,5
0,0
0,5
1,0
1,5
2,0En
84 8th Workshop on Proficiency Testing in Analytical Chemistry, Microbiology
and Laboratory Medicine, Berlin, October 2014
Poster 49
The painstaking road to accreditation as a proficiency testing provider
Simone Fajardo, Ramiro Pérez-Zambra, Ana Silva, Elizabeth Ferreira
Laboratorio Tecnológico del Uruguay, Montevideo, Uruguay
Introduction
Laboratorio Tecnológico del Uruguay (LATU) has developed several proficiency testing (PT) Programmes in diverse matrixes (milk, wine, rice, soybean, sunflower, etc.) covering a wide range of commercially relevant parameters. The Chemical Metrology Department at LATU is currently responsible for the execution of the PT Programmes Process, along with the participation of other technical departments at LATU.
Main obstacles in PT programme development and accreditation
In general terms, some of the obstacles faced in the development of PT Programmes were the lack of available subcontractors outside LATU as well as their contract conditions and assuring information confidentiality in a small country like Uruguay. Moreover, the statistical guidelines available (e.g.: ISO 13528, IUPAC, ISO/TS 22117) are not suitable for neither quantitative nor qualitative PTs with small number of participants and reduced lot sizes, making it a challenge to find appropriate statistical tools. Additionally, technical training opportunities in both ISO/IEC 17043 and ISO 13528 were scarce at the beginning of the project.
Our first step into accreditation: Microbiological PT
In the year 2011, a PT programme in the microbiological area was developed according to ISO/IEC 17043, focusing on the detection of food borne pathogens (meat and dairy products). Once the corresponding quality management system was fully implemented and sufficient experience was gathered on the subject, the accreditation of this PT programme was requested. Given their experience of accrediting more than 200 assays (microbiological ones included), the accreditation of this PT programme was requested to the United Kingdom Accreditation Service (UKAS). This project highlighted several difficulties, among which was the elevated cost of transport for biological hazardous material to fulfil national and international requirements
Final outcome
The microbiological programme was accredited in 2014 according to ISO/IEC 17043, resulting in national and international recognition which triggered a significant increase in the number of participant laboratories to our PT schemes.
Book of Abstracts 85
Poster 50
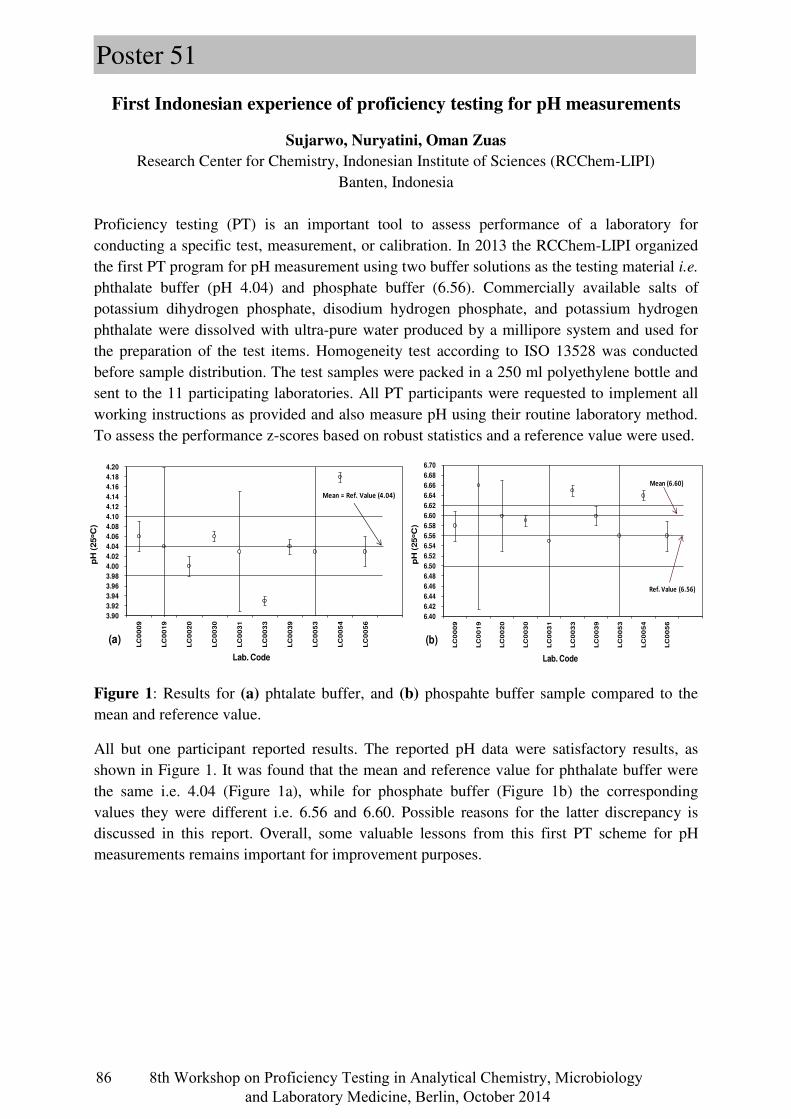
3.90
3.92
3.94
3.96
3.98
4.00
4.02
4.04
4.06
4.08
4.10
4.12
4.14
4.16
4.18
4.20
LC
00
09
LC
00
19
LC
00
20
LC
00
30
LC
00
31
LC
00
33
LC
00
39
LC
00
53
LC
00
54
LC
00
56
pH
(25
oC
)
Lab. Code
(a)
Mean = Ref. Value (4.04)
6.40
6.42
6.44
6.46
6.48
6.50
6.52
6.54
6.56
6.58
6.60
6.62
6.64
6.66
6.68
6.70
LC
00
09
LC
00
19
LC
00
20
LC
00
30
LC
00
31
LC
00
33
LC
00
39
LC
00
53
LC
00
54
LC
00
56
pH
(25
oC
)
Lab. Code
(b)
Ref. Value (6.56)
Mean (6.60)
First Indonesian experience of proficiency testing for pH measurements
Sujarwo, Nuryatini, Oman Zuas
Research Center for Chemistry, Indonesian Institute of Sciences (RCChem-LIPI) Banten, Indonesia
Proficiency testing (PT) is an important tool to assess performance of a laboratory for conducting a specific test, measurement, or calibration. In 2013 the RCChem-LIPI organized the first PT program for pH measurement using two buffer solutions as the testing material i.e. phthalate buffer (pH 4.04) and phosphate buffer (6.56). Commercially available salts of potassium dihydrogen phosphate, disodium hydrogen phosphate, and potassium hydrogen phthalate were dissolved with ultra-pure water produced by a millipore system and used for the preparation of the test items. Homogeneity test according to ISO 13528 was conducted before sample distribution. The test samples were packed in a 250 ml polyethylene bottle and sent to the 11 participating laboratories. All PT participants were requested to implement all working instructions as provided and also measure pH using their routine laboratory method. To assess the performance z-scores based on robust statistics and a reference value were used.
Figure 1: Results for (a) phtalate buffer, and (b) phospahte buffer sample compared to the mean and reference value.
All but one participant reported results. The reported pH data were satisfactory results, as shown in Figure 1. It was found that the mean and reference value for phthalate buffer were the same i.e. 4.04 (Figure 1a), while for phosphate buffer (Figure 1b) the corresponding values they were different i.e. 6.56 and 6.60. Possible reasons for the latter discrepancy is discussed in this report. Overall, some valuable lessons from this first PT scheme for pH measurements remains important for improvement purposes.
86 8th Workshop on Proficiency Testing in Analytical Chemistry, Microbiology
and Laboratory Medicine, Berlin, October 2014
Poster 51
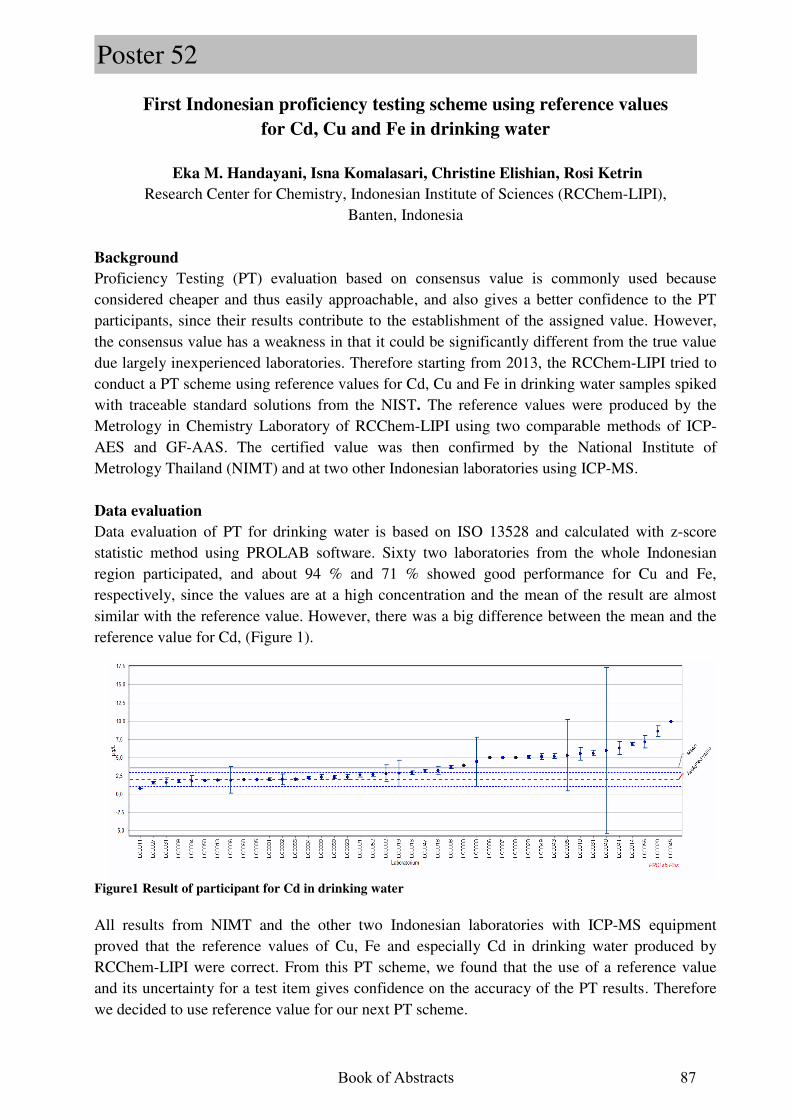
First Indonesian proficiency testing scheme using reference values
for Cd, Cu and Fe in drinking water
Eka M. Handayani, Isna Komalasari, Christine Elishian, Rosi Ketrin
Research Center for Chemistry, Indonesian Institute of Sciences (RCChem-LIPI), Banten, Indonesia
Background
Proficiency Testing (PT) evaluation based on consensus value is commonly used because considered cheaper and thus easily approachable, and also gives a better confidence to the PT participants, since their results contribute to the establishment of the assigned value. However, the consensus value has a weakness in that it could be significantly different from the true value due largely inexperienced laboratories. Therefore starting from 2013, the RCChem-LIPI tried to conduct a PT scheme using reference values for Cd, Cu and Fe in drinking water samples spiked with traceable standard solutions from the NIST. The reference values were produced by the Metrology in Chemistry Laboratory of RCChem-LIPI using two comparable methods of ICP-AES and GF-AAS. The certified value was then confirmed by the National Institute of Metrology Thailand (NIMT) and at two other Indonesian laboratories using ICP-MS.
Data evaluation
Data evaluation of PT for drinking water is based on ISO 13528 and calculated with z-score statistic method using PROLAB software. Sixty two laboratories from the whole Indonesian region participated, and about 94 % and 71 % showed good performance for Cu and Fe, respectively, since the values are at a high concentration and the mean of the result are almost similar with the reference value. However, there was a big difference between the mean and the reference value for Cd, (Figure 1).
Figure1 Result of participant for Cd in drinking water
All results from NIMT and the other two Indonesian laboratories with ICP-MS equipment proved that the reference values of Cu, Fe and especially Cd in drinking water produced by RCChem-LIPI were correct. From this PT scheme, we found that the use of a reference value and its uncertainty for a test item gives confidence on the accuracy of the PT results. Therefore we decided to use reference value for our next PT scheme.
Book of Abstracts 87
Poster 52
The impact of test item matrix on performance evaluation of PT-INR in a
proficiency testing program
Joy J Mammen 1, Sukesh C Nair
1, Surendar Singh
1, Soumya S
1, Alok Srivastava
2
1ISHBT- CMCEQAS, Department of Transfusion Medicine, Vellore, India 2Department of Haematology, Christian Medical College, Vellore, India,
Introduction
The purpose of a proficiency testing (PT) program as stated in the ISO/IEC 17043:2010 is to be able to assess the performance of all participants performing the same tests on comparable proficiency test items. The effect of the matrix of the test items is an important consideration during preparation, since the measuring systems (reagents, analyzer and end point detection system) of participants affect the result obtained. Artificially depleted plasmas may be different in their clotting factor composition as compared with plasmas from patients treated with vitamin K-antagonists (1). This can affect the variance of the assigned value especially when derived from participant results. In the Haemostasis module of the ISHBT-CMC EQAS program, we have 450 participants enrolled and here we demonstrate the matrix effect on the results of Prothrombin time in a recent survey.
Materials and methods
Lyophilized human plasma in glass vials with reconstitution instructions are provided to participants. Participants submit Prothrombin time (seconds) and International Normalized Ratio (INR) for evaluation. Algorithm A is used for analysis and the assigned value, standard deviation and coefficient of variation are determined. Appropriate limits of acceptability have been defined based on clinical considerations as determined by the EQAS Committee.
Results It was observed that the assigned value (median value) from the peer groups with prothrombin time reagents having relatively higher ISI (International Sensitivity Index) appeared to be more prolonged than those with lower ISI. This phenomenon was evident with different plasma samples provided for different surveys, having normal and prolonged prothrombin time. This was reflected in higher INR in the same groups.
Conclusion: PT reagents with low ISI are expected to show marked prolongation of prothrombin time (increased diagnostic sensitivity). However, there is an apparent reversal of sensitivity indicated by lesser prolongation of prothrombin time in reagents with lower ISI. The change in INR is more marked and may have influence on the treatment related decision that needs to be made. The contribution of matrix effect to this phenomenon will be discussed. This can be largely overcome by the creation of “peer groups” based on one or more analytic variables mentioned above.
Reference: 1. van den Besselaar AMHP. J Thromb Haemost 2012; 10: 303–5.
88 8th Workshop on Proficiency Testing in Analytical Chemistry, Microbiology
and Laboratory Medicine, Berlin, October 2014
Poster 53
Development cooperation: Quality control in environmental analysis – Case
study from Kyrgyz Republic
Riitta Koivikko, Mirja Leivuori
Finnish Environment Institute SYKE, Helsinki, Finland
The quality control issues are facing increasing importance and interest within the development cooperation projects focusing on the strengthening the environmental management. Within the project financed through the Institutional Cooperation Instrument (ICI), the Finnish Environment Institute (SYKE) is participating in the capacity building to adopt broadly recognized good practices to carry out water quality monitoring for water management in the Kyrgyz Republic. The SYKE reference laboratory is participating in the revision and reformation of the procedures for the quality assurance and quality control of the Ecological Monitoring Administration (EMA) laboratory of the State Agency on Environment Protection and Forestry (SAEPF) under the Government of the Kyrgyz Republic. In order to increase the means for the internal quality control, the user-friendly tool for the measurement uncertainty estimations, the Measurement Uncertainty Kit (MUkit) software application, in which the calculations are based on the Nordtest TR 537 report, has been introduced to the EMA laboratory and, thus, the software has also been translated into Russian.
Recently, the EMA laboratory participated in two proficiency tests (PT) organized by Proftest SYKE as well as in two other interlaboratory comparisons. The latest of those was the first joint monitoring of the transboundary River Chu and of the River Kara-Balta together with EMA, SYKE and Administration on Control over Environment Pollution (ACEP) of Kyrgyz Hydromet under the Ministry of Emergency Situations of Kyrgyz Republic.
The first PT was for the natural waters where the EMA laboratory participated by analyzing pH and nitrogen concentrations from the synthetic samples, and the second was for the waste waters in which the EMA laboratory analysed chloride, nitrogen and sulphate concentrations in the synthetic samples. Within these PTs the performance of the EMA increased from no satisfactory results up to 62.5 % of satisfactory result, bearing in mind the different nature of the sample waters. The interlaboratory comparisons have been producing valuable information when strengthening the performance. In the workshop we will present the results from the PTs as well as from the interlaboratory comparison studies in the context of strengthening the quality assurance.
Book of Abstracts 89
Poster 54
Survey of interpretation of external quality assessment (EQA) results in
developing countries
Azarm Nami1, Farideh Razi
2, Marjan Rahnamaye Farzami
3, Alireza Mehrabi
1,
Mehdi Hajikhani1, Mohammad Abassi
1
1Pishgam e Iranian (PI) Co. Tehran, Iran 2Diabetes Research Center, Endocrinology and Metabolism Clinical Science Institute, Tehran
University of Medical Sciences, Tehran, Iran 3Reference Health Laboratory, Ministry of Health, Tehran, Iran
Introduction Laboratory quality assurance and accreditation programs have made participating in EQA schemes a necessity for medical labs in developing countries. A thorough understanding of EQA program, statistical model, source of target value and acceptable limits in interpretation of results although certainly advisable is not a viable option for every user. Poor knowledge of the concept of program, its value and technical considerations diminish the expected benefits and lead to insufficient achievements in Quality Assurance Planning in laboratory. A step by step guidance or a flowchart with clear explanation may assist the laboratories in their reviews, monitoring, and analysis.
Method In this survey four of the most frequently used EQA schemes in Iranian medical laboratories consisting of domestic and international commercial programs and their result interpretation guide were studied.
Discussions and conclusion A review of frequently asked questions of more than 20 rounds of EQA schemes and 8 benchmarking of EQA- related corrective actions in different medical laboratories were performed. The results did not find EQA to be effective enough in Quality Assurance programs of medical laboratories. This discrepancy between predicted results and reality might have the following reasons: 1-upon receiving an unacceptable result in the medical lab it was not clear for the user which points should be considered and how the EQA results are to be used in order to find possible errors. 2-It was not clear if there is a relationship between EQA result and the internal quality programs and how the performance of the laboratory affects the EQA results. 3-Since the “acceptable limit of error” and statistical model of each EQA program is exclusive to the provider, the interpretation guidance present limited information which might not be sufficiently useful. There is a need for more educational programs. A general and comprehensive flowchart on EQA interpretations would help to make EQA schemes an effective tool in improvement of QA in medical laboratories.
90 8th Workshop on Proficiency Testing in Analytical Chemistry, Microbiology
and Laboratory Medicine, Berlin, October 2014
Poster 55
SADC1 – Southern African Development Community
Overcoming the challenges – potable water in an African microbiology PT scheme
Pinkie Malebe
Botswana Bureau of Standards, Gaborone, Botswana
Introduction The SADCMET (SADC1 Cooperation in Measurement Traceability) proficiency testing (PT) scheme for Microbiology was established by the SADC Waterlab Association, a union of water testing laboratories in Southern Africa, whose mandate is to conduct proficiency testing schemes to facilitate collaboration among laboratories in support of the SADC trade protocol. Spiking liquid samples with microorganisms proved to be an unsuitable type of material for the African region. Sample transport across borders caused long delivery times and high sample temperature leading to deterioration of sample quality. Switching to freeze dried material resolved the problem of sample instability. The high number of participants with high variability of test results presented an urgent need for a microbiological PT scheme in the region. Freeze-dried PT material Freeze-dried samples Dw2013:A, contained in a 2ml vacuum-sealed glass vial were used in the 2013 PT. The material consisted of a mixture of microorganisms of interest in drinking water: Coliforms, E. coli, Enterococci, Pseudomonas aeruginosa, sulphite-reducing clostridia and Total Plate Count at 22 C and 37 C. Some samples were analysed at BOBS upon receipt from the supplier National Food Agency, Sweden and after storage at -18 C for 31 days to verify the bacterial content and stability. The other two samples were analysed after storage at ~30 C for 10 days to mimic transport conditions. No deterioration was detected proving suitability of the sample type. Assigned value Usually assigned values in microbiological PT schemes are calculated from the participants’ results. Unfortunately the test results reported by the participating laboratories (n=59) varied strongly and no consensus value could be determined. Therefore, the manufacturer’s quality control data was used to assign a target value and a range for evaluation. Methods used in the PT Different methods were used for analysis of the PT samples by the participants and discrepancies were obvious between the cited method and/or media and incubation conditions, sometimes because the needed materials are not available but also because the importance of following the given instructions is not acknowledged. Therefore test results of laboratories from the SADC region seemed to lack comparability. Conclusion It was established that freeze-dried PT material is a suitable choice for microbiological PT scheme in the African region. The high variability of participants results show that the methods used do not give comparable results or may not be properly applied. Improvement on the methods used for microbiological analysis of drinking water in the region is therefore essential.
Book of Abstracts 91
Poster 56
Proficiency testing scheme for chemical analyses of water in Africa
Merylinda Conradie1, Michael Koch
2, Donald Masuku
3
1NamWater, Windhoek, Namibia 2University of Stuttgart, Stuttgart, Germany
3National Metrology Institute, SADCMET Regional Coordinator, Pretoria, South Africa
Introduction
The Southern African Development Community Association of Water Testing Laboratories (SADCWaterLab) was established in 2005 to carry out water Proficiency Testing (PT) and to facilitate collaboration among participating water testing laboratories. The financial support of the Physikalische Technische Bundesanstalt (PTB) is gratefully acknowledged.
Purpose
Access to safe drinking water quality is a human right and it is further dependent on the quality of the analyses conducted. This proficiency testing system offers the opportunity to laboratories to demonstrate their competence to customers, authorities and accreditation bodies.
Parameters
The following parameters are included in the PT scheme: Anions: chloride, fluoride, nitrate, phosphate, Sulphate and total dissolved solids. Cations: calcium, magnesium, potassium, sodium, iron, manganese, aluminium, arsenic, cadmium, chromium, cobalt, copper, lead, nickel and zinc.
Samples
The PT samples are prepared based on pure water by spiking with the relevant chemicals. This enables us to derive the assigned value directly from the formulation with a very low uncertainty.
Evaluation and Assessment
The assessment of performance is based on z-scores, using the robust standard deviation of the data set as the standard deviation for proficiency assessment, provided it is lower than the fitness-for-purpose value agreed on between participants. The standard deviation is annually discussed to reflect the real needs of the participants. Challenges and improvements over the years Various challenges and problems were addressed over the past years to improve the quality of laboratories. Some laboratories struggle with equipment, chemicals, trained personnel and access and implementation of international of methods. – The SADCMet website was used to improve networking and communication. – SADCWaterLab provides an organised interface at the regional level between laboratories
and conformity assessment issues to facilitate better technical cooperation. – Local coordinators were appointed in SADC countries for awareness and marketing of the
schemes trough PT leaflets. – Guidance for corrective actions was documented and distributed to all participants. – Focus on the harmonisation of methods through a working group that was established. – Training on quality management topics was provided at workshops and courses.
92 8th Workshop on Proficiency Testing in Analytical Chemistry, Microbiology
and Laboratory Medicine, Berlin, October 2014
Poster 57
Making the case for continuous improvement:
Sample generation processes and the impact on participant performance
Mary Ann Latko1, Angela Oler
1, Daniel Tholen
2
1AIHA PAT Programs, Falls Church, USA 2Dan Tholen Statistical Consulting, Traverse City, USA
Introduction
A study was conducted of historical performance of participants in the AIHA Proficiency Analytical Testing (PAT) Programs’ Industrial Hygiene Proficiency Analytical Testing (IHPAT) related to airborne silica occupational hygiene samples and the revisions to the sample generation process over time.
Background
There have been nearly 200 IHPAT rounds of testing completed, with more than 55 laboratories participating in each of the silica rounds from 2004 to present. In the past decade, the sample generation process for silica has undergone several significant changes to improve consistency and homogeneity of the PT samples. The IHPAT Program is accredited to ISO/IEC 17043:2010 by A2LA.
The study
An examination of IHPAT Program participant performance for silica analysis was conducted to quantify the impact of changes in sample generation procedures on participant performance. The study reviewed the relative standard deviation (RSD) values and other key statistical measures for participants and reference laboratories in the following conditions:
Change in sample disposition method from air to liquid
Change in reference material from Minusil 5 to U.S. National Institute of Standards and Technology (NIST) Standard Reference Material (SRM) 1878a alpha quartz
The combined impact of changes in sample disposition method and reference material Additionally, the study analyzed the impact of the sample generation process changes related to reference or target sample concentrations. In particular, analysis of the impact on participant performance in the lower level concentrations versus mid-range and higher level concentrations was conducted. Finally, the impact of process improvements was analyzed with respect to outliers. AIHA PAT Programs use statistical methods that are similar to what is described in ISO 13528:2005, Statistical methods for use in proficiency testing by interlaboratory comparisons. This study compared the frequency and range of outliers for the various sample generation iterations.
Book of Abstracts 93
Poster 58
Project management practices in proficiency testing schemes: the Brazilian
accredited providers’ case
Filipe Albano, Carla Schwengber ten Caten
University UFRGS, Porto Alegre, Brazil
Introduction
Proficiency Testing (PT) schemes are developed by providers, who seek competence recognition through accreditation. For the PT implementation, these competences are based in ISO/IEC 17043 standard. Providers could also use other standards and guides in the PT management, such as PMBok (Project Management Body of Knowledge) and ISO 10006 (Guidelines for Quality Management in Projects). The main objective of this study is to analyze the PT projects management from accredited providers in Brazil. The specific objectives are: to assess the declared knowledge of providers concerning the ISO 10006, ISO/IEC 17043 standards and the PMBoK; to assess the relationship areas (common areas) between the references mentioned above; and to assess the opportunities of improvement for the management of the PT developed in Brazil.
Method
The research developed was classified as an exploratory study, which uses a survey with Brazilian PT providers, with a quantitative approach. The method proposed is based on four steps: identification of accredited providers; questionnaire preparation and submission; result analysis (descriptive analysis of providers, identification of the level of knowledge about standards and guidelines of Project Management and PT, analysis of correlation between researched factors); and discussion of results.
Results and conclusions
The activity of PT scheme provision in Brazil is relevant for the support of the laboratory accreditation process. There are few accredited providers in comparison with the market demand for PT (only 12). The country’s accredited providers have high qualification in terms of academic background (58 % have at least master degree). Their experience and staff members involved with the PTs were inconstant, since they work with a number of people that ranges from 2 to 100, and the organizations have from 2.5 to 35 years of experience. Most of the providers are related to the testing area (75 %). The level of providers declared knowledge in relation to standards and project management guides, like PMBoK and ISO 10006, was considered significantly low (p-value < 0.05) when compared to the ISO/IEC 17043 standard. PMBoK and the ISO 10006 standard have no meaningful difference of providers declared knowledge (p-value=0.391). Despite this fact, it was possible to notice that the providers also use project management knowledge to develop their activities, excluding risk management, which is one of the biggest gaps in PT activities. The cost area also evidenced possible improvements. It is worth mentioning that both of them are not included in the ISO/IEC 17043 standard. It was also observed that most providers consider PT as projects (58 %). When a PT project is well succeeded, it might become a process, which can be performed cyclically. A suggestion for future researches could be to develop procedures for managing costs and risks in PT, including the analysis of which practices would be applicable for this kind of activity. Another proposal would be to carry out this survey with other accredited providers from other countries, in order to compare the results between Brazil and other nations.
94 8th Workshop on Proficiency Testing in Analytical Chemistry, Microbiology
and Laboratory Medicine, Berlin, October 2014
Poster 59
Comparison of different approaches in interpretation and presentation of PT results
Aida Jotanović, Šemsa Suljagić
Institute of Metrology of Bosnia and Herzegovina – IMBIH, Sarajevo, Bosnia and Herzegovina
Introduction Technical specifications for the quality of precious metals articles and mandatory precious metals market control are defined under national legislations of the majority of European countries, therefore making the continuous confirmation of the testing capabilities of the responsible laboratories very important. The laboratory for precious metals within the Institute of Metrology of Bosnia and Herzegovina (IMBH) acts as a state reference laboratory in this field. Dissemination of the reference values is done through the organisation of proficiency testing (PT) schemes. Two separate PTs for the determination of gold content in typical jewellery alloy (Au=585 mg/g) were conducted in 2013 and in 2014.
PT scheme description Testing materials for the purpose of both PTs have been prepared by a competent jewellery manufacturer. The IMBH was the organizer of the PT and was responsible for the sample analysis and distribution, as well as for the creation of the PT protocol and final report using the required statistical models and data processing tools. 11 laboratories participated in the PT organized in 2013, and 14 in 2014. The testing method defined by the PT protocol is based on the standards testing method ISO 11426 – “Determination of gold in gold jewellery alloys -
Cupellation method (fire assay)”. This method is accepted as a reference method by the consensus of stakeholders. The PT protocol was done in accordance with ISO 13528:2005 and with the IUPAC guide -”The international harmonized protocol for the proficiency
testing of analytical chemistry laboratories“. Different approaches in the evaluation of the PT results and the design of the final report were used with the purpose of determining the most adequate way for the interpretation of the results. For the purpose of the PT from 2013, a consensus assigned value derived from the results of the participants and robust statistics was used for calculating the z-scores that were used to demonstrate the performance of the participating laboratories. The second PT had the assigned value predetermined by IMBIH which has proved its capabilities by accreditation of ISO 11426 testing method. The assigned value was traceable to NIST SRM No. 685-R that was used as a control sample. The PT results were processed using different approaches to cover the heterogeneity of PT participants:
a. By the means of a z-score using the maximum reproducibility standard deviation of the testing method (0.5 mg/g) prescribed by the normative acts covering the field of precious metals articles control as a standard deviation of the PT (p).
b. By the means of z- score incorporating the measurement uncertainty of the assigned value. In this particular case the uncertainty of the assigned value is thought to be negligible, but z was calculated in order to demonstrate that.
c. Using the alternative approach that expresses the relative difference of the results in relation to the assigned value, known as the Q-score.
Results of both PTs with each participating laboratory under designated code and the impact of the individual models for “scoring” the participants are given in this paper as well as suggestions regarding the most adequate approach for this particular PT scheme.
Book of Abstracts 95
Poster 60
Bilateral PT Schemes - a flexible tool when PT results are needed quickly
Al Ramsay1, Claudia Ketteler
2
1Waters, Milford, MA, USA 2Waters, Frechen, Germany
When laboratories have had an unacceptable result requiring corrective action, reported results too late, when they want to develop methods, extend their scope of accreditation or when they want to monitor laboratory staff performance, a flexible schedule for participation and quick reporting of PT results is often critical. Waiting for regular PT rounds and especially until the reports are issued, may take too much time to allow the laboratory to successfully meet their objective. Bilateral PT schemes provide the laboratory greater flexibility to participate and obtain PT results when they need them. These schemes are widely used across the world with growing interest by laboratories and accreditation bodies. This presentation will highlight how a bilateral scheme is accepted by accreditation bodies, which information are provided in the reports and which further services have been developed over time following the advice of accreditation bodies and customer feedback.
96 8th Workshop on Proficiency Testing in Analytical Chemistry, Microbiology
and Laboratory Medicine, Berlin, October 2014
Poster 61
The trueness criterion: an alternative concept for the evaluation of
proficiency tests
Birgit Karin Schindler
PROOF-ACS GmbH, Hamburg, Germany
Introduction
Proficiency testing (PT) is a key element of external quality assurance in analytical laboratories according to ISO/IEC 17025. Data from PTs are used to assure and demonstrate the validity of applied analytical methods. Most PT providers assess the analytical performance of laboratories according to the comparability criterion. In doing so, the laboratories’ results are compared with the average performance of all participants. A statistically derived mean of the results of all participants is thus used as reference. The z-score model and a fit-for-purpose criterion of a two-fold target standard deviation according to Horwitz are widely used for the evaluation of PT. However, food safety requires reliable and therefore true laboratory results. In day-to-day routines, results are not compared with a statistical average to evaluate the food quality. Results are used as “one-off” results. Consequently, it is necessary to consider the trueness as an additional aspect in evaluating analytical data in PTs.
Concepts
The trueness criterion is presented as an alternative concept to evaluate the PT data with respect to the actual analyte concentration level in the test sample. The spiked value is used as a reference. The reference value is thus independent of the statistical mean of results of the participants. A recovery of 70 up to 120 % of the spiked value is defined as the accepted range (bias) according to the trueness criterion. The application of the trueness criterion requires specific prerequisites during the selection of suitable raw material as well as during the preparation of the test material. Important aspects like the absence of analytes in the raw material have to be considered. Stability testing is demonstrated as a key aspect to verify the stability of the analytes in the test material and consequently the actual analyte concentration levels in the test samples.
Application
Differences between the two concepts in evaluating PTs are demonstrated using real-life examples. The informative value with respect to the performance of the laboratory is discussed with respect to ranges of results considered as satisfying. The consequences of the accepted ranges are assessed taking into consideration the point of view of the laboratories` clients.
Conclusion
The application of the trueness criterion provides information on the ability of a laboratory to reliably quantify the actual analyte concentration in the sample. This information contributes significantly to identify shortcomings in order to improve the laboratories’ performances and consequently to deliver reliable results to the laboratories` clients.
Book of Abstracts 97
Poster 62
Use of the “reference change value” concept in comparison of two results
from blind identical proficiency testing samples
Berna Aslan, Julia Stemp, Neela Khatri
Institute of Quality Management in Healthcare, Toronto, Ontario, Canada
Background
Proficiency testing (PT) providers assess laboratory performance by comparing a laboratory’s results with the assigned value and the acceptable range of performance, and assessments are based on total allowable error. It is possible to assess repeatability by comparing results obtained in blind identical PT samples.
Comparing two test results from the same patient is common practice for monitoring the change in the disease status. The reference change value (RCV) concept was introduced to assess if the difference between two consecutive test results for the same patient arises from assay imprecision and biological variation or from a real change that has occurred in the patient’s clinical status. The RCV concept is applied in IQMH PT schemes as a pilot to provide laboratories with additional information of repeatability of their assay methods.
Method
RCV is calculated using the formula RCV = √2 * z * CV, where CV represent the precision targets determined by the scientific committee for PT purposes and z value of 1.96 for the 95 % probability level, an acceptable RCV value was determined for each analyte and was called the precision flagging limit for PT purposes.
Blind identical samples were distributed to participants and the per cent differences between the results obtained were calculated for the following analytes (Precision goals are indicated in the brackets): albumin (2.5 %), bicarbonate (4 %), calcium (2 %), chloride (1.3 mmol/L [1.2 %]), creatinine (3μmol/L [3.6 %]), glucose (2.5 %), magnesium (2.5 %), osmolality (1.7 %), phosphate (2.5 %), potassium (2 %), protein-total (2 %), sodium (1.3 mmol/L [0.9 %]), iron (5 %), TIBC (5 %), transferrin saturation (7 %), transferrin (4 %), urate (3 %), urea (0.3 mmol/L [8 %]). Then the per cent difference (D%) and the RCV was compared.
Results
A total of 19 out of 1321 results were flagged, since the per cent difference between identical samples is higher than the RCV for bicarbonate, chloride, creatinine, magnesium, osmolality, protein-total, sodium, iron, TIBC, and transferrin saturation. This indicates that the change in analyte concentration is beyond the acceptable analytical CV, even though the two samples in the survey are identical. In 15 of these flagged per cent differences (79 %), both results obtained in the blind identical samples were in the acceptable range when assessed against assigned value and total allowable error base acceptance criteria.
Conclusion
Results of the first pilot PT program indicate that incorporating assessment of repeatability in PT programs may facilitate in the identification of potential analytical errors, and provide a tool in the determination of the root causes.
98 8th Workshop on Proficiency Testing in Analytical Chemistry, Microbiology
and Laboratory Medicine, Berlin, October 2014
Poster 63
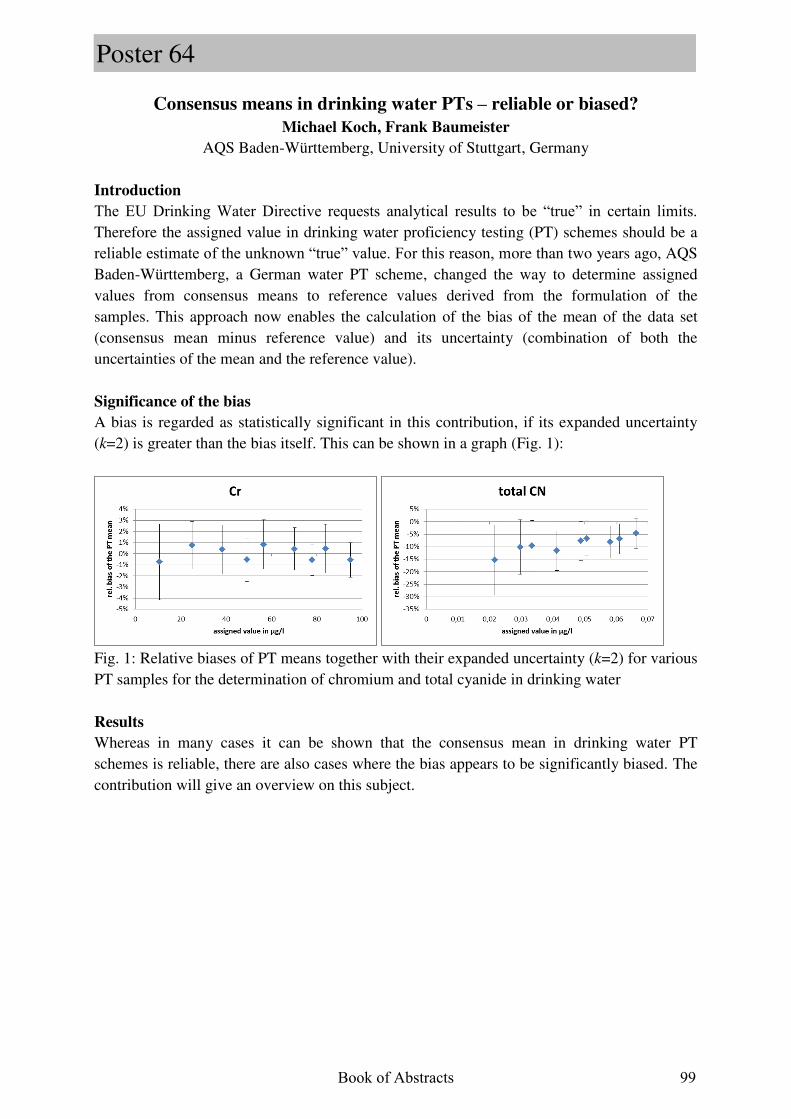
Consensus means in drinking water PTs – reliable or biased?
Michael Koch, Frank Baumeister
AQS Baden-Württemberg, University of Stuttgart, Germany
Introduction
The EU Drinking Water Directive requests analytical results to be “true” in certain limits. Therefore the assigned value in drinking water proficiency testing (PT) schemes should be a reliable estimate of the unknown “true” value. For this reason, more than two years ago, AQS Baden-Württemberg, a German water PT scheme, changed the way to determine assigned values from consensus means to reference values derived from the formulation of the samples. This approach now enables the calculation of the bias of the mean of the data set (consensus mean minus reference value) and its uncertainty (combination of both the uncertainties of the mean and the reference value).
Significance of the bias
A bias is regarded as statistically significant in this contribution, if its expanded uncertainty (k=2) is greater than the bias itself. This can be shown in a graph (Fig. 1):
Fig. 1: Relative biases of PT means together with their expanded uncertainty (k=2) for various PT samples for the determination of chromium and total cyanide in drinking water
Results
Whereas in many cases it can be shown that the consensus mean in drinking water PT schemes is reliable, there are also cases where the bias appears to be significantly biased. The contribution will give an overview on this subject.
Book of Abstracts 99
Poster 64
The variation of test results due to analyst interpretation
Rachael Smith
LGC, Proficiency Testing, Bury, UK
Introduction
LGC have been organising proficiency testing (PT) schemes for over 30 years, including PT schemes for the food, beverages, environmental and consumer goods industries. However, until March 2013, there has not been a PT scheme that concentrates solely on analyst interpretation of colonies visible on an agar plate. The results gained from the QMIS (Microbiology Investigation Competency Assessment Scheme) 103 test material – a paper exercise that has been sent out over the past 18months - illustrate that the removal of all other variables does not guarantee that all analysts will interpret the information provided in the same manner. There are a number of variables that should be taken into account when investigating the root cause of poor performance results, both analytical and non-analytical. All possible reasons for a poor performance should be investigated fully in order to identify the most likely cause and to enable action to be taken to prevent recurrence. These investigations can be time-consuming and can often be inconclusive. The QMIS 103 paper exercise removes the majority of these variables, leaving only analyst error from incorrect interpretation and/or calculation of the information provided.
Results
Although all participants are given the same information, the range of counted results varied for each analyte and each exercise distributed. This shows that counting technique alone can have a significant effect on the final result depending upon what the analyst chooses to enumerate. There were also a number of participants returning results that were 10 times lower or higher than the assigned value. These participants were advised to investigate the possibility of calculation error, particularly noting if the 100µl volume (where applicable) has also been taken into consideration. We would also expect participants to use a weighted mean where possible as this minimises the effects of variation between duplicate plates and different dilutions. For example, for the exercise distributed in March 2014 (showing images of plates containing Haemophilus
influenza colonies at a dilution of 10-2 and 10-3, using 100µl aliquots in duplicate, giving a total of four separate images), had the final concentration been calculated solely from image A (the first of four images provided in this distribution) then the result based on the median would have been 280,956 cfu/g. This when compared to image C (the third of the four images provided in this distribution) with a median count of 360,000 cfu/g represents a 22% difference.
Conclusion
Each exercise has been a clear demonstration that providing a number of analysts with precisely the same information, and removing a wide range of possible sources of error, it does not necessarily follow that these analysts will interpret the information in the same way. This can therefore highlight any requirements for further training required in enumeration and calculation of results.
100 8th Workshop on Proficiency Testing in Analytical Chemistry, Microbiology
and Laboratory Medicine, Berlin, October 2014
Poster 65
How the consensus program standard deviation affected the success of fuel
laboratory proficiency test participants
Caglar Sinayuc, Sevtac Bulbul, Hale Uckardes, Bercem Duzol, Didem N. Saglam, Gaye
Yucayurt, Emrah Soysal, Hatice Adalan, Ender Okandan
Petroleum Research Center, Middle East Technical University, Ankara, Turkey
Since 2006, the proficiency testing (PT) scheme LABKAR has been conducted by the Middle East Technical University Petroleum Research Center (METU PAL) which is accredited according to ISO/IEC 17025:2005 and ISO/IEC 17043:2010. PAL is the only institution that conducts PT schemes between national fuel analysis laboratories in Turkey. The participants receive gas-oil, gasoline, biodiesel, fuel oil, lubricating oil, jet fuel and LPG samples twice a year. In 2013, 68 laboratories participated in LABKAR and the results of the analysis of 148 parameters for different fuel types were collected, evaluated statistically and reported. The statistical analysis is carried out according to ISO 13528:2005. The homogeneity and stability of the samples are tested before being sent to the participants. Since a reference material cannot be prepared for the fuel due to its complex composition, for each fuel type, the consensus values are calculated from the results of the participants using ISO 13528:2005 Annex C. For each analysis, a robust mean of the data is used as the assigned value. The reproducibility standard deviations given in the relevant standard test methods (ISO/EN/TS) were initially used to obtain the standard deviation for proficiency assessment. Since the 2nd round of LABKAR 2011, a robust standard deviation calculated according to ISO 13528:2005 Annex C is used since the participants are free to choose the standard analysis method. After the statistical analysis of results, z-scores or z’-scores, zeta-scores and a time series plot of the z-scores/z’-scores are presented in the report, together with the ‘warning’ and ‘action’ signals. An ‘‘Action’’ is issued to participants, whose z-score/z’-scores is above 3.0 or below -3.0. If the z-score/z’-scores of the participant is between 2.0 and 3.0 or -3.0 and-2.0, then a ‘‘Warning’’ is issued. In this study, the effect of the standard deviation determination method to the number of ‘‘Action” and ‘‘Warning’’ signals given to participants is investigated. Data from 2010 to 2013 for different fuel types are considered. Data show that some analytes are more sensitive to the use of participant results in estimating the standard deviation for proficiency assessment, especially if the majority of the participant results are close to each other. Since round 2 in 2011, an increase in the warning and action signals is observed due to the shrinkage in the consensus standard deviation for proficiency assessment. Since this causes a false perception of decreasing laboratory performance, the statistical analysis procedure needs to be re-evaluated and account for the relevant ISO standard method in determination of the standard deviation. The evaluation has been done for different fuel types.
Book of Abstracts 101
Poster 66
Could z-scores replace the target limits in the EQA schemes?
Ulla Tiikkainen1, Päivi Rauvo
1, Jari Leinonen
2, Marko Laine
3
1 Labquality, Helsinki, Finland 2HUSLAB, Helsinki, Finland
3Finnish Meteorological Institute, Helsinki, Finland
Introduction
In laboratory medicine the participants’ performance in the external quality assurance (EQA) schemes is traditionally assessed using the total error approach. The target limits (acceptance limits) are calculated as follows: Target limits = assigned value ± total error %. The criteria used in setting the analyte-specific total error % are within- and between-subject biological variation, clinical needs and analytical performance. The performance of the laboratory is presented using the difference (Diff %) of the measured result from the assigned value (X) and the performance is acceptable when within the target limits. The other possibility of assessing participant performance, commonly used in the analytical chemistry proficiency testing (PT) schemes, is the z-score approach. The z-score is calculated as z = (x-X) / σ , where x is a laboratory result and σ is the standard deviation for proficiency assessment (which could be an externally set target). The performance is usually regarded to be satisfactory when ǀz-scoreǀ ≤ 2, questionable when 2<ǀz-scoreǀ<3, and unsatisfactory when ǀz-scoreǀ≥ 3.
Methods and results
We examined and compared the usage of total error approach and z-score approach in the Labquality’s Prostate specific antigen (PSA) schemes. PSA is an important plasma marker of prostate cancer and is used both in diagnosis and in follow-up of the disease. The target limit of 20% has been set for the acceptance limit for the PSA results. For the z-score calculations we used the robust standard deviation (ISO 13528) of all results of each sample as the target standard deviation (s). The laboratory results from two EQA rounds organized in 2014 were evaluated. The EQA samples were pooled human sera spiked with sera having elevated levels of PSA. The mean PSA concentrations in the 4 different EQA samples were 3.1 µg/L (s = 0.17 µg/L), 7.1 µg/L (s = 0.44 µg/L), 18.0 µg/L (s= 1.19 µg/L) and 8.0 µg/L (s = 0.44 µg/L). Altogether 253 results were included in the analysis and 5.9 % of them deviated over ±10 % from the assigned value (but less than 20 %), moreover 3.2 % of the results deviated over the 20% the target. The corresponding figures when z-values were used as a performance score were as follows: 3.6 % of the results were between the scores 2 and 3 and 3.9 % over the z-
score 3. The standard deviation of each EQA sample results was used for z-score calculation
accordingly. The correlation between the total error performance assessment compared to z-scoring was good (r=0.997).
Conclusion
We conclude that both ways of assessing participants’ performance can be used and they give quite similar interpretation of the results. The z-scores calculated with the σ-value from the EQA data give more correct evaluation compared to the fixed analyte-specific total error approach when sample-related effects e.g. low concentration or matrix effects occur.
102 8th Workshop on Proficiency Testing in Analytical Chemistry, Microbiology
and Laboratory Medicine, Berlin, October 2014
Poster 67
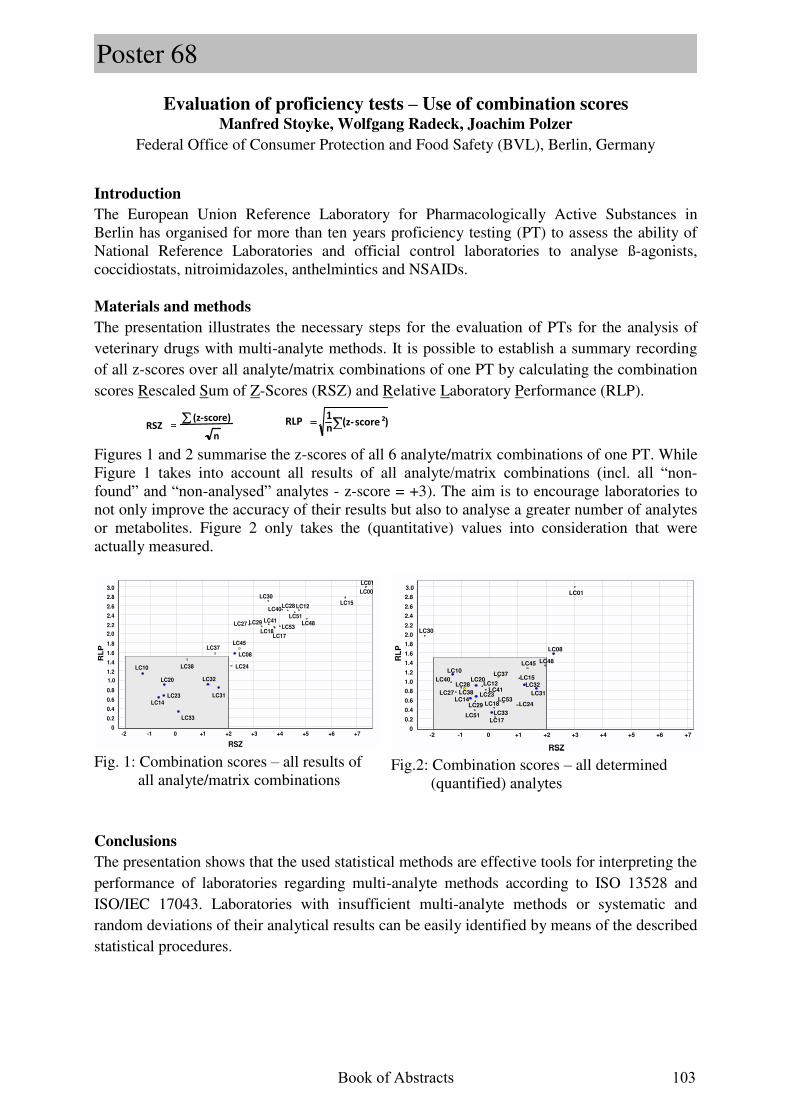
Evaluation of proficiency tests – Use of combination scores Manfred Stoyke, Wolfgang Radeck, Joachim Polzer
Federal Office of Consumer Protection and Food Safety (BVL), Berlin, Germany
Introduction
The European Union Reference Laboratory for Pharmacologically Active Substances in Berlin has organised for more than ten years proficiency testing (PT) to assess the ability of National Reference Laboratories and official control laboratories to analyse ß-agonists, coccidiostats, nitroimidazoles, anthelmintics and NSAIDs. Materials and methods
The presentation illustrates the necessary steps for the evaluation of PTs for the analysis of veterinary drugs with multi-analyte methods. It is possible to establish a summary recording of all z-scores over all analyte/matrix combinations of one PT by calculating the combination scores Rescaled Sum of Z-Scores (RSZ) and Relative Laboratory Performance (RLP).
Figures 1 and 2 summarise the z-scores of all 6 analyte/matrix combinations of one PT. While Figure 1 takes into account all results of all analyte/matrix combinations (incl. all “non-found” and “non-analysed” analytes - z-score = +3). The aim is to encourage laboratories to not only improve the accuracy of their results but also to analyse a greater number of analytes or metabolites. Figure 2 only takes the (quantitative) values into consideration that were actually measured.
RSZ
+7+6+5+4+3+2+10-1-2
RL
P
3.0
2.8
2.6
2.4
2.2
2.0
1.8
1.6
1.4
1.2
1.0
0.8
0.6
0.4
0.2
0
LC10
LC14LC23
LC20
LC33
LC32
LC31
LC08
LC27 LC29
LC30
LC41
LC18LC17
LC53
LC40LC28
LC51
LC12
LC48
LC15
LC01
LC38
LC37
LC24
LC45
LC00
RSZ
+7+6+5+4+3+2+10-1-2
RL
P
3.0
2.8
2.6
2.4
2.2
2.0
1.8
1.6
1.4
1.2
1.0
0.8
0.6
0.4
0.2
0
LC10
LC14LC23
LC20
LC33
LC32
LC31
LC08
LC27 LC29
LC30
LC41
LC18LC17
LC53
LC40LC28
RSZ
+7+6+5+4+3+2+10-1-2
RL
P
3.0
2.8
2.6
2.4
2.2
2.0
1.8
1.6
1.4
1.2
1.0
0.8
0.6
0.4
0.2
0
LC10
LC14LC23
LC20
LC33
LC32
LC31
LC08
LC27 LC29
LC30
LC41
LC18LC17
LC53
LC40LC28
LC51
LC12
LC48
LC15
LC01
LC38
LC37
LC24
LC45
LC00
Fig. 1: Combination scores – all results of all analyte/matrix combinations
RSZ
+7+6+5+4+3+2+10-1-2
RL
P
3.0
2.8
2.6
2.4
2.2
2.0
1.8
1.6
1.4
1.2
1.0
0.8
0.6
0.4
0.2
0
LC10
LC14LC23
LC20
LC33
LC32
LC31
LC08
LC30
LC40
LC27
LC28
LC51
LC29
LC12LC41
LC18
LC17
LC53
LC15
LC48
LC01
LC38
LC37
LC24
LC45
RSZ
+7+6+5+4+3+2+10-1-2
RL
P
3.0
2.8
2.6
2.4
2.2
2.0
1.8
1.6
1.4
1.2
1.0
0.8
0.6
0.4
0.2
0
LC10
LC14LC23
LC20
LC33
LC32
LC31
LC08
LC30
LC40
LC27
LC28
LC51
LC29
LC12LC41
LC18
RSZ
+7+6+5+4+3+2+10-1-2
RL
P
3.0
2.8
2.6
2.4
2.2
2.0
1.8
1.6
1.4
1.2
1.0
0.8
0.6
0.4
0.2
0
LC10
LC14LC23
LC20
LC33
LC32
LC31
LC08
LC30
LC40
LC27
LC28
LC51
LC29
LC12LC41
LC18
LC17
LC53
LC15
LC48
LC01
LC38
LC37
LC24
LC45
Fig.2: Combination scores – all determined (quantified) analytes
Conclusions
The presentation shows that the used statistical methods are effective tools for interpreting the performance of laboratories regarding multi-analyte methods according to ISO 13528 and ISO/IEC 17043. Laboratories with insufficient multi-analyte methods or systematic and random deviations of their analytical results can be easily identified by means of the described statistical procedures.
RSZ n
-score) (z score ) (z- 2
n 1
RLP
Book of Abstracts 103
Poster 68
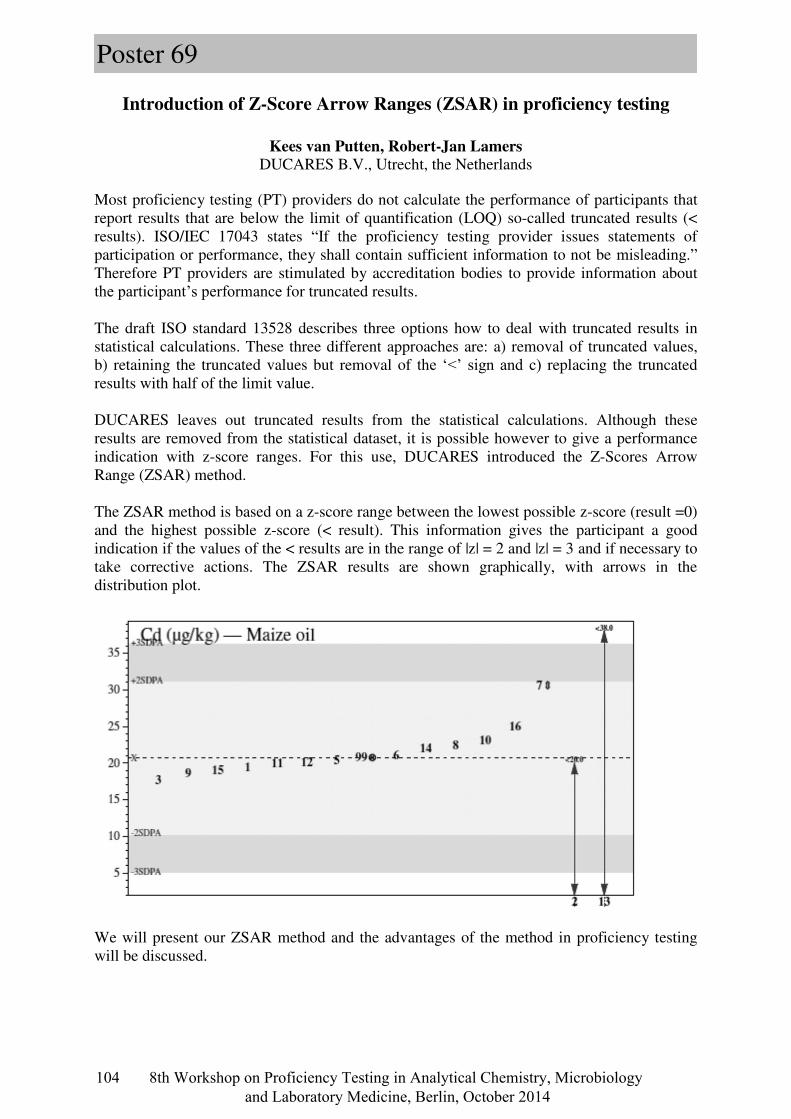
Introduction of Z-Score Arrow Ranges (ZSAR) in proficiency testing
Kees van Putten, Robert-Jan Lamers
DUCARES B.V., Utrecht, the Netherlands
Most proficiency testing (PT) providers do not calculate the performance of participants that report results that are below the limit of quantification (LOQ) so-called truncated results (< results). ISO/IEC 17043 states “If the proficiency testing provider issues statements of participation or performance, they shall contain sufficient information to not be misleading.” Therefore PT providers are stimulated by accreditation bodies to provide information about the participant’s performance for truncated results. The draft ISO standard 13528 describes three options how to deal with truncated results in statistical calculations. These three different approaches are: a) removal of truncated values, b) retaining the truncated values but removal of the ‘<’ sign and c) replacing the truncated results with half of the limit value. DUCARES leaves out truncated results from the statistical calculations. Although these results are removed from the statistical dataset, it is possible however to give a performance indication with z-score ranges. For this use, DUCARES introduced the Z-Scores Arrow Range (ZSAR) method. The ZSAR method is based on a z-score range between the lowest possible z-score (result =0) and the highest possible z-score (< result). This information gives the participant a good indication if the values of the < results are in the range of |z| = 2 and |z| = 3 and if necessary to take corrective actions. The ZSAR results are shown graphically, with arrows in the distribution plot.
We will present our ZSAR method and the advantages of the method in proficiency testing will be discussed.
104 8th Workshop on Proficiency Testing in Analytical Chemistry, Microbiology
and Laboratory Medicine, Berlin, October 2014
Poster 69
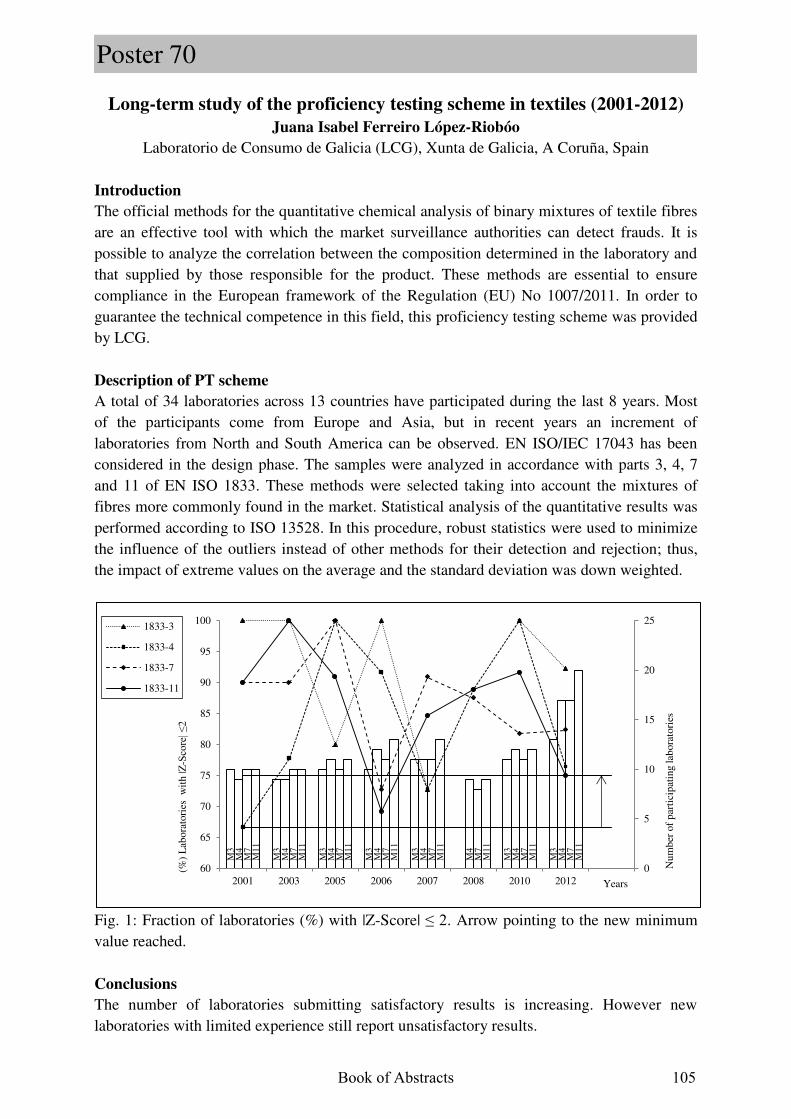
Long-term study of the proficiency testing scheme in textiles (2001-2012)
Juana Isabel Ferreiro López-Riobóo
Laboratorio de Consumo de Galicia (LCG), Xunta de Galicia, A Coruña, Spain
Introduction
The official methods for the quantitative chemical analysis of binary mixtures of textile fibres are an effective tool with which the market surveillance authorities can detect frauds. It is possible to analyze the correlation between the composition determined in the laboratory and that supplied by those responsible for the product. These methods are essential to ensure compliance in the European framework of the Regulation (EU) No 1007/2011. In order to guarantee the technical competence in this field, this proficiency testing scheme was provided by LCG.
Description of PT scheme
A total of 34 laboratories across 13 countries have participated during the last 8 years. Most of the participants come from Europe and Asia, but in recent years an increment of laboratories from North and South America can be observed. EN ISO/IEC 17043 has been considered in the design phase. The samples were analyzed in accordance with parts 3, 4, 7 and 11 of EN ISO 1833. These methods were selected taking into account the mixtures of fibres more commonly found in the market. Statistical analysis of the quantitative results was performed according to ISO 13528. In this procedure, robust statistics were used to minimize the influence of the outliers instead of other methods for their detection and rejection; thus, the impact of extreme values on the average and the standard deviation was down weighted.
Fig. 1: Fraction of laboratories (%) with |Z-Score| ≤ 2. Arrow pointing to the new minimum value reached.
Conclusions
The number of laboratories submitting satisfactory results is increasing. However new laboratories with limited experience still report unsatisfactory results.
M3
M3
M3
M3
M3
M3
M3
M4
M4
M4
M4
M4
M4
M4
M4
M7
M7
M7
M7
M7
M7
M7
M7
M11
M11
M11
M11
M11
M11
M11
M11
0
5
10
15
20
25
60
65
70
75
80
85
90
95
100
2001 2003 2005 2006 2007 2008 2010 2012
Num
ber
of p
arti
cipa
ting
labo
rato
ries
(%)
Lab
orat
orie
s w
ith
|Z-S
core
| ≤2
Years
1833-3
1833-4
1833-7
1833-11
Book of Abstracts 105
Poster 70
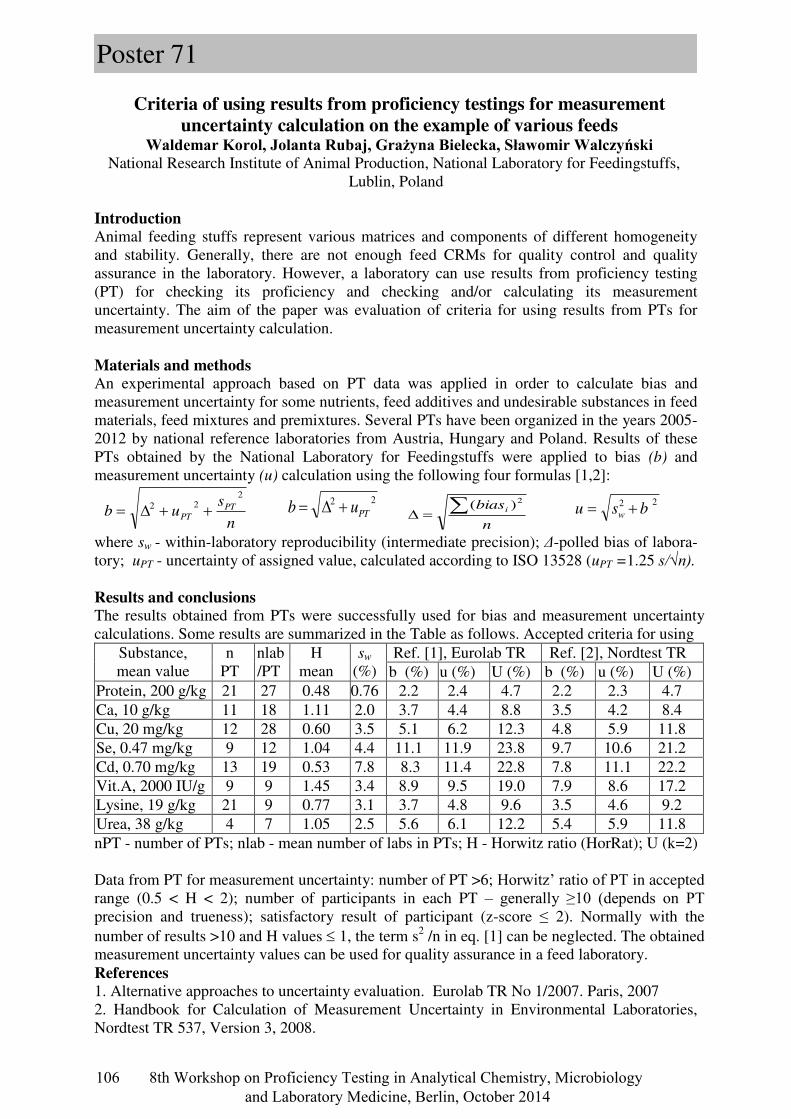
Criteria of using results from proficiency testings for measurement uncertainty calculation on the example of various feeds
Waldemar Korol, Jolanta Rubaj, Grażyna Bielecka, Sławomir Walczyński
National Research Institute of Animal Production, National Laboratory for Feedingstuffs, Lublin, Poland
Introduction Animal feeding stuffs represent various matrices and components of different homogeneity and stability. Generally, there are not enough feed CRMs for quality control and quality assurance in the laboratory. However, a laboratory can use results from proficiency testing (PT) for checking its proficiency and checking and/or calculating its measurement uncertainty. The aim of the paper was evaluation of criteria for using results from PTs for measurement uncertainty calculation.
Materials and methods An experimental approach based on PT data was applied in order to calculate bias and measurement uncertainty for some nutrients, feed additives and undesirable substances in feed materials, feed mixtures and premixtures. Several PTs have been organized in the years 2005-2012 by national reference laboratories from Austria, Hungary and Poland. Results of these PTs obtained by the National Laboratory for Feedingstuffs were applied to bias (b) and measurement uncertainty (u) calculation using the following four formulas [1,2]:
n
sub PT
PT
222
n
biasi 2)(
where sw - within-laboratory reproducibility (intermediate precision); Δ-polled bias of labora-tory; uPT - uncertainty of assigned value, calculated according to ISO 13528 (uPT =1.25 s/√n).
Results and conclusions The results obtained from PTs were successfully used for bias and measurement uncertainty calculations. Some results are summarized in the Table as follows. Accepted criteria for using
Substance, mean value
n PT
nlab /PT
H mean
sw (%)
Ref. [1], Eurolab TR Ref. [2], Nordtest TR b (%) u (%) U (%) b (%) u (%) U (%)
Protein, 200 g/kg 21 27 0.48 0.76 2.2 2.4 4.7 2.2 2.3 4.7 Ca, 10 g/kg 11 18 1.11 2.0 3.7 4.4 8.8 3.5 4.2 8.4 Cu, 20 mg/kg 12 28 0.60 3.5 5.1 6.2 12.3 4.8 5.9 11.8 Se, 0.47 mg/kg 9 12 1.04 4.4 11.1 11.9 23.8 9.7 10.6 21.2 Cd, 0.70 mg/kg 13 19 0.53 7.8 8.3 11.4 22.8 7.8 11.1 22.2 Vit.A, 2000 IU/g 9 9 1.45 3.4 8.9 9.5 19.0 7.9 8.6 17.2 Lysine, 19 g/kg 21 9 0.77 3.1 3.7 4.8 9.6 3.5 4.6 9.2 Urea, 38 g/kg 4 7 1.05 2.5 5.6 6.1 12.2 5.4 5.9 11.8 nPT - number of PTs; nlab - mean number of labs in PTs; H - Horwitz ratio (HorRat); U (k=2) Data from PT for measurement uncertainty: number of PT >6; Horwitz’ ratio of PT in accepted range (0.5 < H < 2); number of participants in each PT – generally ≥10 (depends on PT precision and trueness); satisfactory result of participant (z-score ≤ 2). Normally with the number of results >10 and H values 1, the term s2 /n in eq. [1] can be neglected. The obtained measurement uncertainty values can be used for quality assurance in a feed laboratory. References 1. Alternative approaches to uncertainty evaluation. Eurolab TR No 1/2007. Paris, 2007 2. Handbook for Calculation of Measurement Uncertainty in Environmental Laboratories, Nordtest TR 537, Version 3, 2008.
22PTub 22
bsu w
106 8th Workshop on Proficiency Testing in Analytical Chemistry, Microbiology
and Laboratory Medicine, Berlin, October 2014
Poster 71
The role of proficiency testing schemes in method development
Steven Crum, Steven Tito, Joop Harmsen
Wageningen University and Research Centre, Wepal/Quasimeme, Wageningen, The Netherlands
. Proficiency tests deliver a large amount of data. These data are normally used by the individual laboratories to show their performance to accreditation bodies. Wageningen UR organizes the proficiency tests of WEPAL and QUASIMEME on soil, sediments, plant, water and biota. We think that our schemes must have a wider use, and we wish to expand on the work that we already undertake. Within WEPAL and QUASIMEME we have collected data for almost 60 and 25 years, respectively. We have also a huge amount of method related information. This gives the possibility to use the data to improve the results of all participating laboratories. Within QUASIMEME this is already formalized by the organization of workshops. Although several standardized procedures are available, we know that our members are using different methods. The difference can be marginal, but also completely different analytical principles are also used. In spite of these differences in methods, results should still be comparable. In practice, however, very often different results are reported. Using appropriate statistics these differences can be made visible, which can provide an appropriate basis to discuss the performance of the different analytical methods be used for a particular analyte. We will show the results from the test on chlorophyll-a in seawater. For this analysis two different methods are used. The ‘traditional’ analysis based on extraction and spectrophotometry, and a recent development using HPLC. With both methods chlorophyll-a contents are reported. Using our data it was possible to show that there was a significant difference between the two analytical methods used. We used the tools present in the NDA model (Cofino et al, CILS 53, 37, 2000) to visualize the differences. Youden plots also showed to be a proper tool. Results were discussed in a two day workshop in Belgium earlier this year.
Book of Abstracts 107
Poster 72
Use of Proficiency testing results in method validation
Jesús Laso Sánchez, Ana Peris García-Patrón
Gabinete de Servicios para la Calidad (GSC), Madrid, Spain
Introduction
The ISO/IEC 17025 standard establishes the need for validation of internal methods, and the verification of compliance of parameters published in the standards, in case of standard based methods. When a laboratory participates regularly in proficiency testing (PT) with evaluation “fit for purpose”, and obtains good results, we can suppose the method is validated. This communication proposes a system that uses the results of several rounds to confirm and review validation parameters such as trueness, precision and uncertainty, as part of a better documented validation or verification process as well as a way to assess the estimated uncertainty
System
For every round we can obtain xi (Laboratory result), Xi (assigned value) and uXi (uncertainty of the assigned value).
It could be calculated for each round: 100(%); i
iiiiii X
XxDXxD .
The mean of Di and the sDi represents the trueness expressed as absolute error and the intermediate precision. The mean of Di (%), and its standard deviation, sDi, represents the trueness expressed as relative error (%) and intermediate precision expressed as coefficient of variation (%). Those results should be compared with legal requirements or parameters published in standards. The calculation of uncertainty using a top down methodology is also possible using the uncertainties of Xi, the uncertainty of the mean of Di value, the uncertainty of precision (sDi% or CVDi%), and the uncertainty of non applied correction, if there is a bias with statistical signification.
Example of application results
Parameter: acidity of olive oil. Number of rounds: 20 (From 2002 to 2011). Results rank for acidity performed in the 20 rounds: from 0,08 to 1,28 % of acidity. D mean = 0,008 / Dmean %= 3,82 / sDi = 0,0386 / CVDi% = 12,5 Bias was found not statistically significant. With the different components of uncertainty as described above, and after confirming that bias was found not statistically significant, the global expanded (k=2) relative uncertainty is estimated in 26 %.
Conclusion
The participation in PT permits also the calculation of the parameters of the analytical method, to review its compliance with requirements of validation or verification. This approach is very useful in case of absence of commercial reference materials, or when the ones that are available haven´t enough stability to perform a “classic” validation (precision in reproducibility conditions as different days, i.e.), but the laboratory have a long “history” and many data on different assigned values due to its regular participation in PT.
108 8th Workshop on Proficiency Testing in Analytical Chemistry, Microbiology
and Laboratory Medicine, Berlin, October 2014
Poster 73
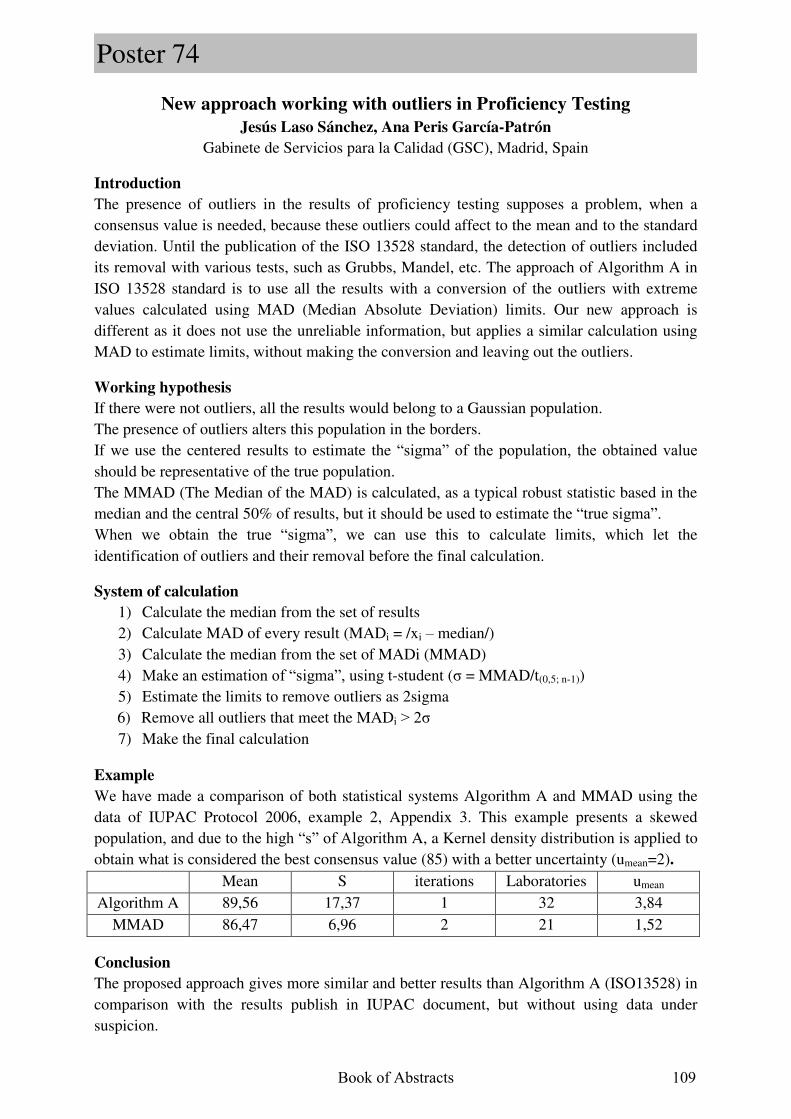
New approach working with outliers in Proficiency Testing
Jesús Laso Sánchez, Ana Peris García-Patrón
Gabinete de Servicios para la Calidad (GSC), Madrid, Spain
Introduction
The presence of outliers in the results of proficiency testing supposes a problem, when a consensus value is needed, because these outliers could affect to the mean and to the standard deviation. Until the publication of the ISO 13528 standard, the detection of outliers included its removal with various tests, such as Grubbs, Mandel, etc. The approach of Algorithm A in ISO 13528 standard is to use all the results with a conversion of the outliers with extreme values calculated using MAD (Median Absolute Deviation) limits. Our new approach is different as it does not use the unreliable information, but applies a similar calculation using MAD to estimate limits, without making the conversion and leaving out the outliers.
Working hypothesis
If there were not outliers, all the results would belong to a Gaussian population. The presence of outliers alters this population in the borders. If we use the centered results to estimate the “sigma” of the population, the obtained value should be representative of the true population. The MMAD (The Median of the MAD) is calculated, as a typical robust statistic based in the median and the central 50% of results, but it should be used to estimate the “true sigma”. When we obtain the true “sigma”, we can use this to calculate limits, which let the identification of outliers and their removal before the final calculation.
System of calculation
1) Calculate the median from the set of results 2) Calculate MAD of every result (MADi = /xi – median/) 3) Calculate the median from the set of MADi (MMAD) 4) Make an estimation of “sigma”, using t-student (σ = MMAD/t(0,5; n-1)) 5) Estimate the limits to remove outliers as 2sigma 6) Remove all outliers that meet the MADi > 2σ 7) Make the final calculation
Example
We have made a comparison of both statistical systems Algorithm A and MMAD using the data of IUPAC Protocol 2006, example 2, Appendix 3. This example presents a skewed population, and due to the high “s” of Algorithm A, a Kernel density distribution is applied to obtain what is considered the best consensus value (85) with a better uncertainty (umean=2).
Mean S iterations Laboratories umean
Algorithm A 89,56 17,37 1 32 3,84
MMAD 86,47 6,96 2 21 1,52
Conclusion
The proposed approach gives more similar and better results than Algorithm A (ISO13528) in comparison with the results publish in IUPAC document, but without using data under suspicion.
Book of Abstracts 109
Poster 74
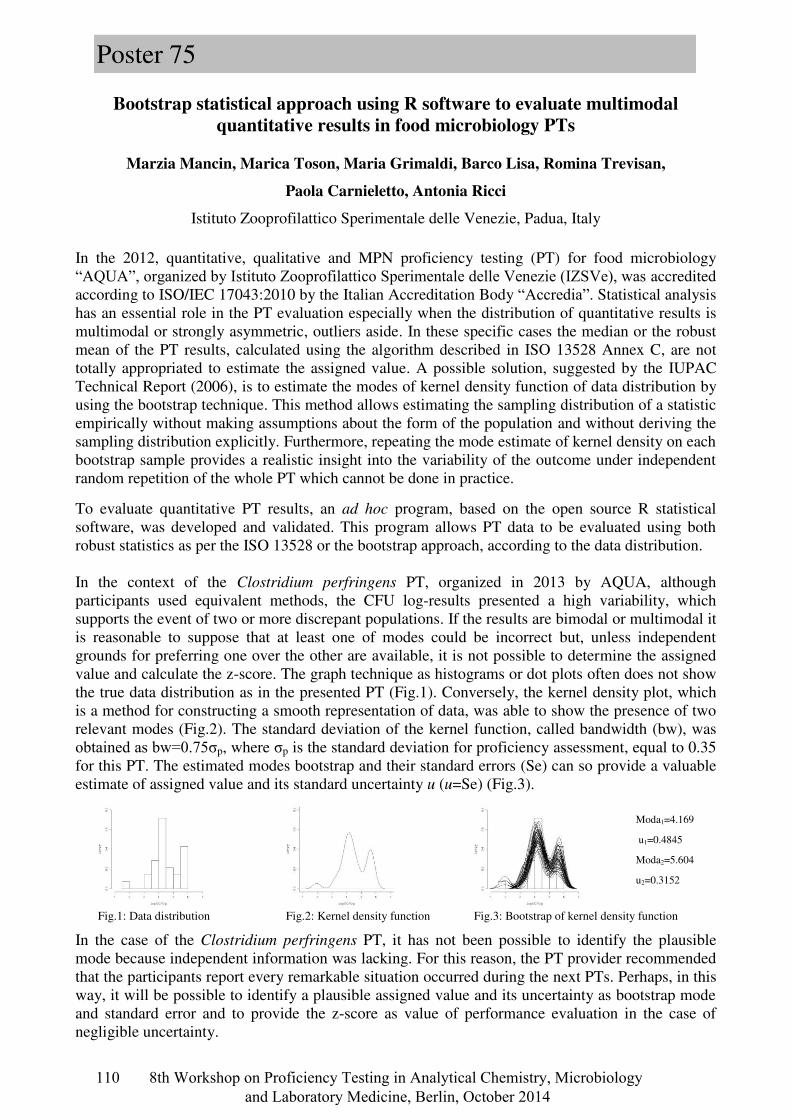
Bootstrap statistical approach using R software to evaluate multimodal
quantitative results in food microbiology PTs
Marzia Mancin, Marica Toson, Maria Grimaldi, Barco Lisa, Romina Trevisan,
Paola Carnieletto, Antonia Ricci
Istituto Zooprofilattico Sperimentale delle Venezie, Padua, Italy
In the 2012, quantitative, qualitative and MPN proficiency testing (PT) for food microbiology “AQUA”, organized by Istituto Zooprofilattico Sperimentale delle Venezie (IZSVe), was accredited according to ISO/IEC 17043:2010 by the Italian Accreditation Body “Accredia”. Statistical analysis has an essential role in the PT evaluation especially when the distribution of quantitative results is multimodal or strongly asymmetric, outliers aside. In these specific cases the median or the robust mean of the PT results, calculated using the algorithm described in ISO 13528 Annex C, are not totally appropriated to estimate the assigned value. A possible solution, suggested by the IUPAC Technical Report (2006), is to estimate the modes of kernel density function of data distribution by using the bootstrap technique. This method allows estimating the sampling distribution of a statistic empirically without making assumptions about the form of the population and without deriving the sampling distribution explicitly. Furthermore, repeating the mode estimate of kernel density on each bootstrap sample provides a realistic insight into the variability of the outcome under independent random repetition of the whole PT which cannot be done in practice.
To evaluate quantitative PT results, an ad hoc program, based on the open source R statistical software, was developed and validated. This program allows PT data to be evaluated using both robust statistics as per the ISO 13528 or the bootstrap approach, according to the data distribution. In the context of the Clostridium perfringens PT, organized in 2013 by AQUA, although participants used equivalent methods, the CFU log-results presented a high variability, which supports the event of two or more discrepant populations. If the results are bimodal or multimodal it is reasonable to suppose that at least one of modes could be incorrect but, unless independent grounds for preferring one over the other are available, it is not possible to determine the assigned value and calculate the z-score. The graph technique as histograms or dot plots often does not show the true data distribution as in the presented PT (Fig.1). Conversely, the kernel density plot, which is a method for constructing a smooth representation of data, was able to show the presence of two relevant modes (Fig.2). The standard deviation of the kernel function, called bandwidth (bw), was obtained as bw=0.75σp, where σp is the standard deviation for proficiency assessment, equal to 0.35 for this PT. The estimated modes bootstrap and their standard errors (Se) can so provide a valuable estimate of assigned value and its standard uncertainty u (u=Se) (Fig.3).
Moda1=4.169
u1=0.4845
Moda2=5.604
u2=0.3152
Fig.1: Data distribution Fig.2: Kernel density function Fig.3: Bootstrap of kernel density function
In the case of the Clostridium perfringens PT, it has not been possible to identify the plausible mode because independent information was lacking. For this reason, the PT provider recommended that the participants report every remarkable situation occurred during the next PTs. Perhaps, in this way, it will be possible to identify a plausible assigned value and its uncertainty as bootstrap mode and standard error and to provide the z-score as value of performance evaluation in the case of negligible uncertainty.
110 8th Workshop on Proficiency Testing in Analytical Chemistry, Microbiology
and Laboratory Medicine, Berlin, October 2014
Poster 75
Monte Carlo simulation as a possible approach to determine the standard
deviation for proficiency assessment for an external quality assessment
programme in clinical chemistry
Gina Chew, Pui Sze Cheow, Qinde Liu, Richard Shin, Tang Lin Teo, Tong Kooi Lee
Chemical Metrology Laboratory, Chemical Metrology Division, Applied Sciences Group, Health Sciences Authority, Singapore
A challenging task in organising an external quality assessment (EQA) programme in clinical chemistry is to determine the standard deviation for proficiency assessment (σ) used for the calculation of z-scores to evaluate the participating laboratories’ performance when new analytes are first introduced into the programme. Unlike analytes in food matrices, σ for clinical analytes cannot be predicted from a general model such as the Horwitz function. In such a situation, Monte Carlo Simulations (MCS)1 may be a useful tool to simulate laboratory results for the evaluation of participating laboratories’ performances in an EQA programme. EQA programmes in clinical chemistry are organised for the local testing laboratories by the Chemical Metrology Laboratory (CML) of the Health Sciences Authority, Singapore. The assigned values for these programme are determined by CML using isotope dilution mass spectrometry or standard addition technique that are both traceable to the International System of Units (SI). In the EQA programme organised in 2013, a prescribed σ was determined from the pooled robust CV of the participating laboratories’ data collected over several cycles of the programmes organised in 2011 and 2012, rounded up to the nearest 1.0 %. In this work, the MCS technique is being explored as a possible approach to determine σ. Laboratory measurements were simulated based on a normal distribution using the assigned value, between-bottle homogeneity and repeatability of a routine testing laboratory reported in literature2 as input parameters. We have only evaluated analytes for which information on laboratory repeatability is available; namely: creatinine, glucose, total cholesterol, triglycerides, uric acid, potassium, calcium and sodium. An appropriate σ is one in which the proportion of simulated results with acceptable z-scores just reaches 95 %. Comparisons were made using the prescribed and simulated σ for approximately sixty reported results per analyte at three different concentration levels. Our findings show that with the exception of potassium, the relative difference between the simulated σ and the prescribed σ for all other analytes are less than 20 % (3 % - 17 %), resulting in no change or only minor changes to the z-score distribution. Despite its limitations for potassium and possibly for analytes that are not currently included in our investigation, the MCS technique is a possible approach to determine σ for new analytes introduced in future EQA programmes. Further work is necessary to improve the simulation model. 1. Wong, S., Evaluation of the use of consensus values in proficiency testing programmes.
Accredit. Qual. Assur. 2005, 10 (8), 409-414. 2. Ramamohan, V., Yih, Y., Abbott, J.T., Klee, G.G., Category-specific uncertainty
modelling in clinical laboratory measurement processes. Clin. Chem. Lab. Med. 2013, 51(12), 2273-2280.
Book of Abstracts 111
Poster 76
A model for the statistical assessment of proficiency tests using the
moments of the Bhattacharyya centroid of a set of probability density
functions
Wim P Cofino1, Paul Torfs
2, Steven Crum
1, Joop Harmsen
1
1Wageningen University and Research Centre, Environmental Science Group, Alterra, Wageningen, The Netherlands
2 Wageningen University, Hydrology and Quantitative Water Management Group, Wageningen, The Netherlands
From the eighties onwards, much attention has been paid to the statistical evaluation of proficiency tests. The statistical analysis may be cumbersome owing to a number of factors as a limited number of participants, the presence of outliers and complicated distributions owing to gross errors, the use of different analytical methods, concentrations near the detection limits or the presence of substances which interfere with the analytical determinations. Robust analysis was introduced to overcome a number of difficulties. Robust statistics encompass different theories which can be characterized as approximate parametric models as it is assumed that the majority of data is described by a specific parametric model. It seeks to establish model parameters with a high efficiency against outliers. Generally accepted standards and approaches in the field of proficiency testing include the Huber implementations described by Lischer, the UK Analytical Methods Committee and ISO 13528 (2005 edition) and the DIN A45 38402 standard which employs the Q method for the reproducibility standard deviation and the Hampel estimator to estimate a robust mean. In 2000, our team published a different approach based on an analogy with quantum chemistry[1]. The model can be used with reported uncertainties or implemented in a way which can be classified as a robust analysis. The incomplete mathematical methodology, the use of the Hilbert space with its different terminology and the lack of a well-defined statistical fundament hampered acceptance of the approach. We have recently elaborated a complete new mathematical formulation for our model. A probability density function (pdf) is attributed to each laboratory result i. It is shown that
the previously reported algorithm describes the Bhattacharyya centroid of the set of pdfs. The mathematical elaboration invokes the establishment of the Fréchet mean of the set of pdf’s and takes two steps: firstly, it is shown that the pdf ̅ of the centroid takes the
form √ ̅ ∑ √ , an expression which was assumed in the previous paper. In a
second step, it is proved the coefficients are obtained by solving the eigenvector-
eigenvalue equation , i.e. the same equation as reported previously. The mean and
standard deviation of the centroid ̅ provide the population characteristics of the proficiency
test. The mathematical elaboration will be presented, examples will be given to illustrate the mathematics.
[1] W. P. Cofino, I. H. M. van Stokkum, D. E. Wells, F. Ariese, J. W. M. Wegener, and R. A. L. Peerboom, “A new model for the inference of population characteristics from experimental data using uncertainties. Application to interlaboratory studies,” Chemom. Intell. Lab. Syst., vol. 53, no. 1–2, pp. 37–55, 2000.
112 8th Workshop on Proficiency Testing in Analytical Chemistry, Microbiology
and Laboratory Medicine, Berlin, October 2014
Poster 77
Supporting organizationS