Embed Size (px)
Citation preview
© 2018 Transit X, LLC. All rights reserved. Page �1
High capacity • High speed • Nonstop • 24/7Solar powered • Wait-free • Door-to-door • Resilient26-page companion Transit X Handbook is available at transitx.com/transitxhandbook.pdf
Bontang, East Kalimantan, Indonesia
2018-02-27
217 km network with 3,226 pods95% of population within a 10 min. walkNonstop 72 km/h service to 220 stops
Transit X, LLC presents a preliminary proposal for a privately-funded fleet of fully-autonomous shared electric vehicle network for
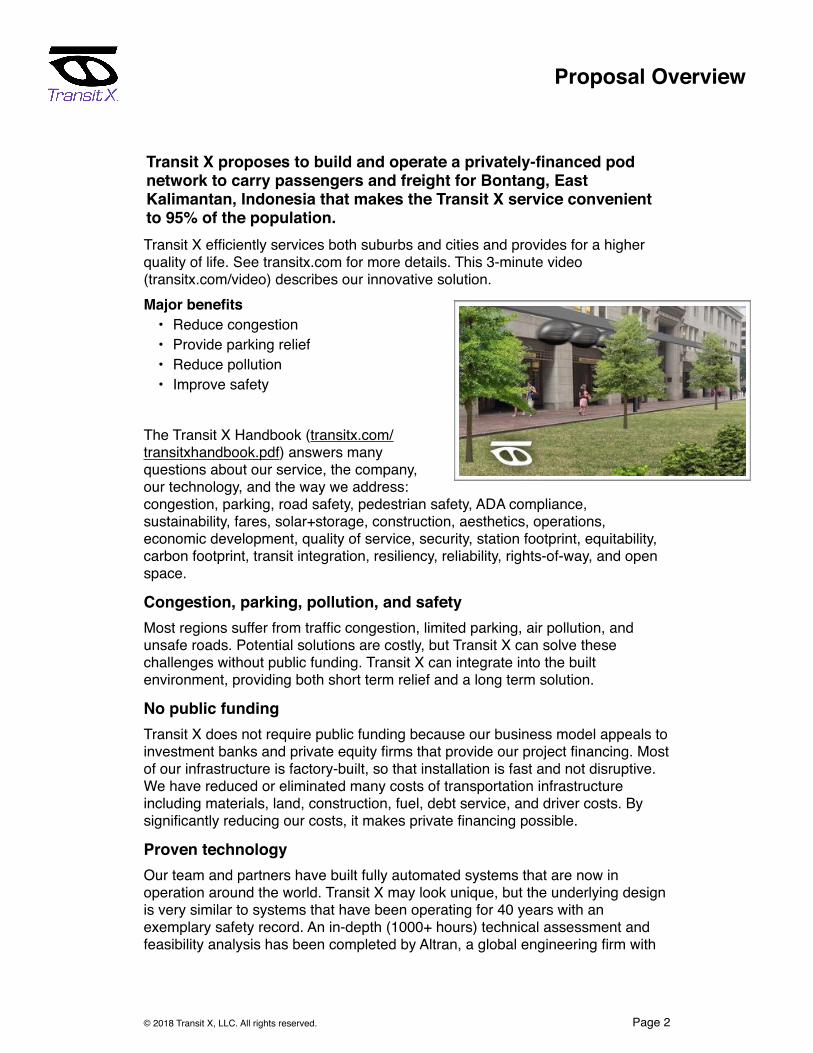
Transit X efficiently services both suburbs and cities and provides for a higher quality of life. See transitx.com for more details. This 3-minute video (transitx.com/video) describes our innovative solution. Major benefits
• Reduce congestion• Provide parking relief• Reduce pollution• Improve safety
The Transit X Handbook (transitx.com/transitxhandbook.pdf) answers many questions about our service, the company, our technology, and the way we address: congestion, parking, road safety, pedestrian safety, ADA compliance, sustainability, fares, solar+storage, construction, aesthetics, operations, economic development, quality of service, security, station footprint, equitability, carbon footprint, transit integration, resiliency, reliability, rights-of-way, and open space.
Congestion, parking, pollution, and safetyMost regions suffer from traffic congestion, limited parking, air pollution, and unsafe roads. Potential solutions are costly, but Transit X can solve these challenges without public funding. Transit X can integrate into the built environment, providing both short term relief and a long term solution.
No public fundingTransit X does not require public funding because our business model appeals to investment banks and private equity firms that provide our project financing. Most of our infrastructure is factory-built, so that installation is fast and not disruptive. We have reduced or eliminated many costs of transportation infrastructure including materials, land, construction, fuel, debt service, and driver costs. By significantly reducing our costs, it makes private financing possible.
Proven technologyOur team and partners have built fully automated systems that are now in operation around the world. Transit X may look unique, but the underlying design is very similar to systems that have been operating for 40 years with an exemplary safety record. An in-depth (1000+ hours) technical assessment and feasibility analysis has been completed by Altran, a global engineering firm with
Transit X proposes to build and operate a privately-financed pod network to carry passengers and freight for Bontang, East Kalimantan, Indonesia that makes the Transit X service convenient to 95% of the population.
© 2018 Transit X, LLC. All rights reserved. Page � 2
Proposal Overview
extensive expertise in automated transit systems. The first pilots of Transit X will be deployed by the end of 2018.Before any groundbreaking, the system will be safety-certified and fully insured.
Service QualityTransit X provides on-demand, last-mile service that is superior to cars or buses. An operating agreement will guarantee high levels of availability and reliability. Our use of small vehicles (pods) makes this possible. By reducing car use, Transit X creates walkable and bike-friendly neighborhoods.
Less pollution: Air, Sound, Light, Visual, WaterTransit X offers a much higher quality of life by eliminating many forms of pollution. Pods are quiet and have no emissions. Pods offer less visual impact than the existing roads and vehicles, and utility lines can be hidden within the track. At night, there is no light pollution from headlights or taillights. Water pollution from road runoff is significantly reduced.
SustainableTransit X runs on 100% sustainable energy. The energy generated from solar panels on the track and stored within the poles is sufficient in most cases, but sustainable power contracts may used to buy and sell power to the grid. Transit X makes it possible to reduce the amount of impervious surfaces and increase green space by reducing the need for parking and roads. By replacing cars, Transit X has a negative carbon footprint.
More Transit & Fewer CarsTransit X provides the convenience and privacy that people value in cars, yet without the negative impacts of personal cars. Transit X combines the best of mass transit and personal transportation modes which will lead to higher use of mass transit and less use of personal vehicles.
De-risking ProjectsTransit X is working with large, established firms to provide fixed-price contracts for the engineering, certification, construction, and operations of a Transit X system. Theses partnerships enable Transit X to de-risk all of the major elements of the project, and provide performance guarantees.We would work with regional urban planning and construction firms who are familiar with permitting and applicable codes.
Jobs and Workforce DevelopmentMany jobs will be created to build a new transportation infrastructure, and many new types of job will be created as transportation becomes more efficient. Municipalities that first embrace Transit X will be offered the opportunity to have Transit X manufacturing and assembly jobs in their area. The vast majority of the construction jobs will be locally sourced. Preferential hiring would be given to those workers displaced by the transition to automated vehicles.
© 2018 Transit X, LLC. All rights reserved. Page � 3
Revenue GeneratorNot only does Transit X not require public financing, but the local municipality and right-of-ways owners receive 5% of gross revenue, which would be per year average over the first 10 years. For specifics, please see the "Taxes and Fees" section of this proposal.
Short and Long Term SolutionA project could be operational within 24 months from the start of a project. Transit X offers a rapidly-deployable solution that provides long term benefits. We would form a local company to build, operate, and maintain the network. At least 75% of the profits would be invested back into the region.
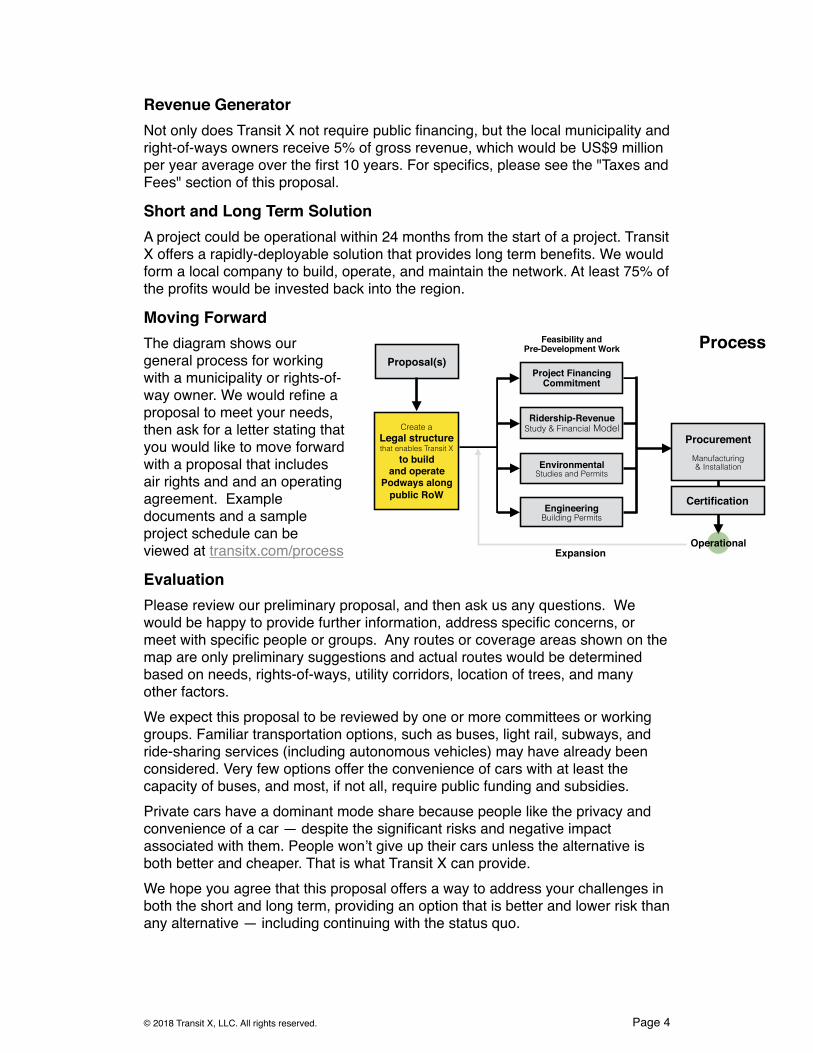
Moving ForwardThe diagram shows our general process for working with a municipality or rights-of-way owner. We would refine a proposal to meet your needs, then ask for a letter stating that you would like to move forward with a proposal that includes air rights and and an operating agreement. Example documents and a sample project schedule can be viewed at transitx.com/process
EvaluationPlease review our preliminary proposal, and then ask us any questions. We would be happy to provide further information, address specific concerns, or meet with specific people or groups. Any routes or coverage areas shown on the map are only preliminary suggestions and actual routes would be determined based on needs, rights-of-ways, utility corridors, location of trees, and many other factors.We expect this proposal to be reviewed by one or more committees or working groups. Familiar transportation options, such as buses, light rail, subways, and ride-sharing services (including autonomous vehicles) may have already been considered. Very few options offer the convenience of cars with at least the capacity of buses, and most, if not all, require public funding and subsidies.Private cars have a dominant mode share because people like the privacy and convenience of a car — despite the significant risks and negative impact associated with them. People won’t give up their cars unless the alternative is both better and cheaper. That is what Transit X can provide.We hope you agree that this proposal offers a way to address your challenges in both the short and long term, providing an option that is better and lower risk than any alternative — including continuing with the status quo.
© 2018 Transit X, LLC. All rights reserved. Page � 4
ProcessProposal(s)
Project FinancingCommitment
Create a Legal structure that enables Transit X
to build and operate
Podways alongpublic RoW
Ridership-Revenue Study & Financial Model
Engineering Building Permits
EnvironmentalStudies and Permits
Feasibility and Pre-Development Work
ProcurementManufacturing & Installation
Certification
OperationalExpansion
US$9 million

Whatever process you use to evaluate this proposal, Transit X is open to working with you on refining this proposal to meet your needs. We hope you will conclude that moving forward with Transit X is an excellent opportunity to meet your current and future challenges.Once we agree to move forward, we need a memorandum of understanding (example at transitx.com/process/mou.html) stating that you intend to pass an ordinance that enables our use of air rights along with an operating agreement.
Other ResourcesThe links below provide general information about Transit X:• 2 minute video overview (transitx.com/video)• Transit X Handbook (transitx.com/transitxhandbook.pdf)• Letters of Project Financing, Due Diligence, Contracts (transitx.com/letters.pdf)• Example Resolution (transitx.com/process/resolution.html)• Operating Agreement (transitx.com/process/operating_agreement.html)• General Q & A (transitx.com/QandA.html)
Addendum The remaining pages of this proposal provide project-specific details:• Financial Project Summary with Pro Forma, pages 6-7• Project Overview, Impact, and Model inputs, pages 8-9• Taxes and Fees, pages 10-11• Fares, page 12
Sincerely,
Mike StanleyCEO, Transit X
Telephone: +1 508-596-7024 (also via WhatsApp)Email: [email protected] eRoom: https://zoom.us/j/8229009123Website: transitx.comLinkedIn: http://linkedin.com/in/mikestanleymit/Skype: mikestanley49WeChat: MikeTransitXFacebook Messanger: m.me/MikeStanleyMITTwitter: https://twitter.com/MikeTransitXMail: 1127 Commonwealth Ave #30, Boston, MA 02134 USA
The buildout of the network would be rolled out in phases, where a first phase could be a 15 to 30 km pilot.
We look forward to working with you to improve the quality of life for Bontang through better transportation.
© 2018 Transit X, LLC. All rights reserved. Page � 5

© 2018 Transit X, LLC. All rights reserved. Page � 6
3 Travel distance per year by all people (residents and visitors) 1,758,300,0006 Service area size 372.88 Estimate #1 for network length based on desired coverage 2179 Length of paved roads in region 75310 Estimate #2 for network length based on length of public roadways 179
1 Transit X network length 217 km
2 People (resident-equivalent) in region 175,830 resident-equivalent population3 Route density ratio (route length to service area) 0.584 Number of stops 2205 Triple-speed route length 0 km6 Water crossing route length 0 km7 Cost of fixed infrastructure $786,346,5548 …per person $4,4729 Mode share of travel on Transit X 79%
10 Distance traveled on Transit X, per year 1,244,399,022 km11 …per day 3,409,312 km12 Daily potential energy generation with standard panels on tracks 1,665 MWh13 Sustainable energy use per day 41 MWh 2% of max capacity14 Energy storage capital cost for 1 day(s) of supply at $800 per kWh $33,029,97215 Size (rated power) of solar installation 9,599 KW16 Cost to generate sustainable energy (at $2,000 per kWh) $19,197,35617 Cost of buying sustainable energy at $0.15 per kWh $6,193 per day 5% of OPEX18 Daily passengers riding Transit X 138,267 customers 79% of the pop.19 Distance per passenger per day 25 km20 Average distance per trip (assuming 3 trips per day) 8 km21 Single passenger fare for shared 8 km trip $0.55 8 K IDR22 Passenger distance traveled during peak hour 681,862 km23 Breakeven 126,654 customers per day
24 (76% of people convenient to Transit X)
25 Number of pods for peak demand 3,226 pods26 Number of passengers per pod 54.5 and 43 customers per pod27 Distance per pod per year 168,170 km28 Two-layer pod garage area (2% of route with side−parking) 3,549 m2 0.1% of car parking29 Cost of pods $20,969,000 is $92 per person30 Capital cost of energy generation and storage $67,895,526 is $386 per person
31 Project Finances32 Total Project Cost $875,211,080 12,007,896,014 K IDR33 Equity $262,563,324 3,602,368,804 K IDR34 Financed $612,647,756 8,405,527,210 K IDR35 Gross Revenue from fares $260,470,475 3,573,654,913 K IDR
36 OPEX (O&M) per year. Does not include cost of sustainable electricity/energy. $43,760,554 600,394,801
K IDR37 EBITA (Profit) $216,709,921 2,973,260,113 K IDR38 Debt service $91,897,163 1,260,829,081 K IDR39 Fees and taxes (US$74 per capita) $13,023,524 178,682,746 K IDR40 OPEX + Debt service + Tax + Fees $148,681,241 2,039,906,628 K IDR41 Net income $111,789,234 1,533,748,286 K IDR42 Operating Margin 83%43 Project costs — per person $4,978 68,293 K IDR44 Number of motor vehicles displaced 124,440 motor vehicles45 Yearly cost of cars displaced — per person $6,370 87,390 K IDR
46 Operating costs per passenger-km $0.1247 Breakeven revenue distance per day 3,122,985 km48 Number of tracks in one direction needed to satisfy peak demand 0.01
Project Overview
2018-02-27
© 2018 Transit X, LLC. All rights reserved. Page � 7
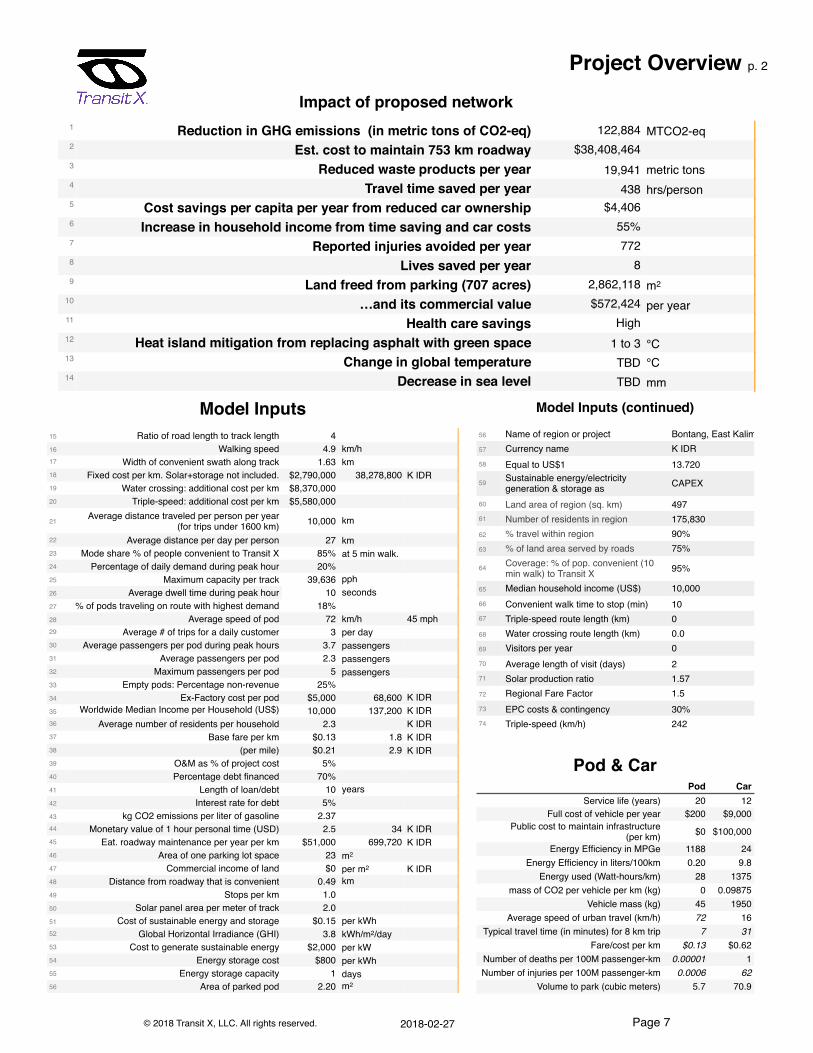
Model Inputs15 Ratio of road length to track length 416 Walking speed 4.9 km/h17 Width of convenient swath along track 1.63 km18 Fixed cost per km. Solar+storage not included. $2,790,000 38,278,800 K IDR19 Water crossing: additional cost per km $8,370,00020 Triple-speed: additional cost per km $5,580,000
21 Average distance traveled per person per year (for trips under 1600 km) 10,000 km
22 Average distance per day per person 27 km23 Mode share % of people convenient to Transit X 85% at 5 min walk.24 Percentage of daily demand during peak hour 20%25 Maximum capacity per track 39,636 pph26 Average dwell time during peak hour 10 seconds27 % of pods traveling on route with highest demand 18%28 Average speed of pod 72 km/h 45 mph29 Average # of trips for a daily customer 3 per day30 Average passengers per pod during peak hours 3.7 passengers31 Average passengers per pod 2.3 passengers32 Maximum passengers per pod 5 passengers33 Empty pods: Percentage non-revenue 25%34 Ex-Factory cost per pod $5,000 68,600 K IDR35 Worldwide Median Income per Household (US$) 10,000 137,200 K IDR36 Average number of residents per household 2.3 K IDR37 Base fare per km $0.13 1.8 K IDR38 (per mile) $0.21 2.9 K IDR39 O&M as % of project cost 5%40 Percentage debt financed 70%41 Length of loan/debt 10 years42 Interest rate for debt 5%43 kg CO2 emissions per liter of gasoline 2.3744 Monetary value of 1 hour personal time (USD) 2.5 34 K IDR45 Eat. roadway maintenance per year per km $51,000 699,720 K IDR46 Area of one parking lot space 23 m2
47 Commercial income of land $0 per m2 K IDR48 Distance from roadway that is convenient 0.49 km49 Stops per km 1.050 Solar panel area per meter of track 2.051 Cost of sustainable energy and storage $0.15 per kWh52 Global Horizontal Irradiance (GHI) 3.8 kWh/m2/day53 Cost to generate sustainable energy $2,000 per kW54 Energy storage cost $800 per kWh55 Energy storage capacity 1 days56 Area of parked pod 2.20 m2
Pod & CarPod Car
Service life (years) 20 12Full cost of vehicle per year $200 $9,000
Public cost to maintain infrastructure (per km) $0 $100,000
Energy Efficiency in MPGe 1188 24Energy Efficiency in liters/100km 0.20 9.8
Energy used (Watt-hours/km) 28 1375mass of CO2 per vehicle per km (kg) 0 0.09875
Vehicle mass (kg) 45 1950Average speed of urban travel (km/h) 72 16
Typical travel time (in minutes) for 8 km trip 7 31Fare/cost per km $0.13 $0.62
Number of deaths per 100M passenger-km 0.00001 1Number of injuries per 100M passenger-km 0.0006 62
Volume to park (cubic meters) 5.7 70.9
Model Inputs (continued)
56 Name of region or project Bontang, East Kalimantan, Indonesia57 Currency name K IDR58 Equal to US$1 13.720
59 Sustainable energy/electricity generation & storage as CAPEX
60 Land area of region (sq. km) 49761 Number of residents in region 175,83062 % travel within region 90%63 % of land area served by roads 75%
64 Coverage: % of pop. convenient (10 min walk) to Transit X 95%
65 Median household income (US$) 10,00066 Convenient walk time to stop (min) 1067 Triple-speed route length (km) 068 Water crossing route length (km) 0.069 Visitors per year 070 Average length of visit (days) 271 Solar production ratio 1.5772 Regional Fare Factor 1.573 EPC costs & contingency 30%74 Triple-speed (km/h) 242
Impact of proposed network1 Reduction in GHG emissions (in metric tons of CO2-eq) 122,884 MTCO2-eq2 Est. cost to maintain 753 km roadway $38,408,4643 Reduced waste products per year 19,941 metric tons4 Travel time saved per year 438 hrs/person5 Cost savings per capita per year from reduced car ownership $4,4066 Increase in household income from time saving and car costs 55%7 Reported injuries avoided per year 7728 Lives saved per year 89 Land freed from parking (707 acres) 2,862,118 m2
10 …and its commercial value $572,424 per year11 Health care savings High12 Heat island mitigation from replacing asphalt with green space 1 to 3 °C13 Change in global temperature TBD °C14 Decrease in sea level TBD mm
Project Overview p. 2
2018-02-27
© 2018 Transit X, LLC. All rights reserved. Page �8
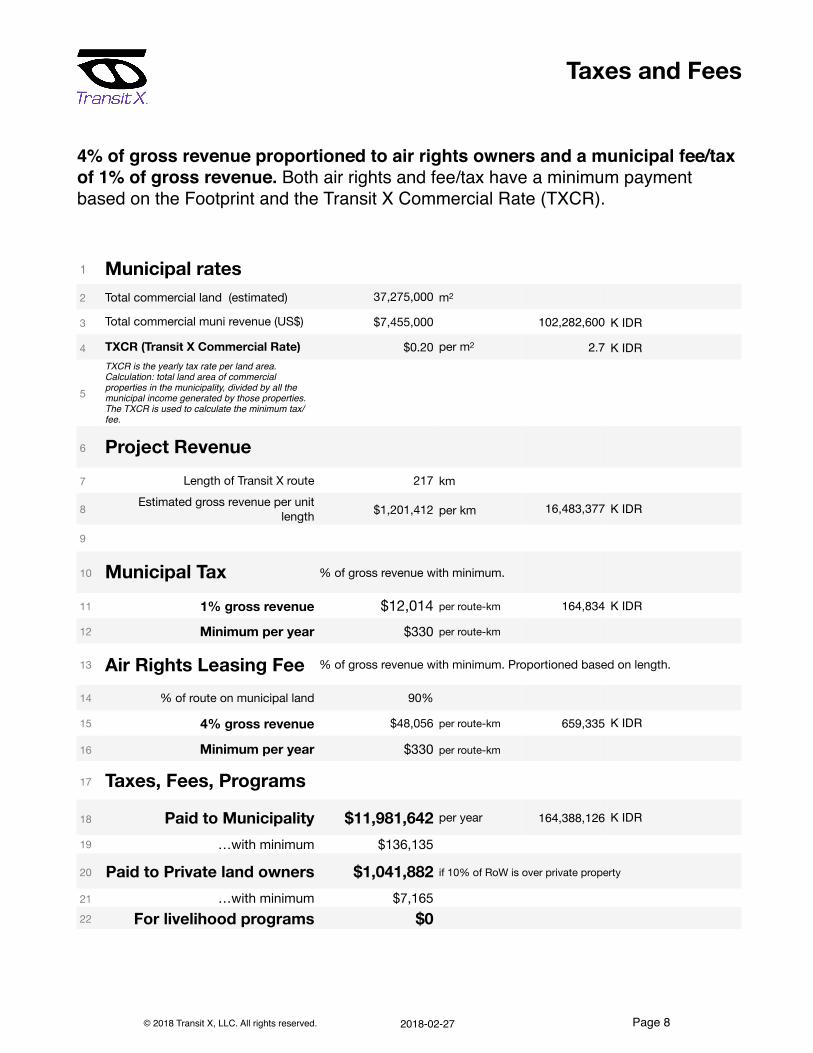
1 Municipal rates2 Total commercial land (estimated) 37,275,000 m2
3 Total commercial muni revenue (US$) $7,455,000 102,282,600 K IDR
4 TXCR (Transit X Commercial Rate) $0.20 per m2 2.7 K IDR
5
TXCR is the yearly tax rate per land area. Calculation: total land area of commercial properties in the municipality, divided by all the municipal income generated by those properties. The TXCR is used to calculate the minimum tax/fee.
6 Project Revenue7 Length of Transit X route 217 km
8 Estimated gross revenue per unit length $1,201,412 per km 16,483,377 K IDR
9
10 Municipal Tax % of gross revenue with minimum.
11 1% gross revenue $12,014 per route-km 164,834 K IDR
12 Minimum per year $330 per route-km
13 Air Rights Leasing Fee % of gross revenue with minimum. Proportioned based on length.
14 % of route on municipal land 90%
15 4% gross revenue $48,056 per route-km 659,335 K IDR
16 Minimum per year $330 per route-km
17 Taxes, Fees, Programs
18 Paid to Municipality $11,981,642 per year 164,388,126 K IDR
19 …with minimum $136,135
20 Paid to Private land owners $1,041,882 if 10% of RoW is over private property
21 …with minimum $7,16522 For livelihood programs $0
Taxes and Fees
4% of gross revenue proportioned to air rights owners and a municipal fee/tax of 1% of gross revenue. Both air rights and fee/tax have a minimum payment based on the Footprint and the Transit X Commercial Rate (TXCR).
2018-02-27
© 2018 Transit X, LLC. All rights reserved. Page � 9
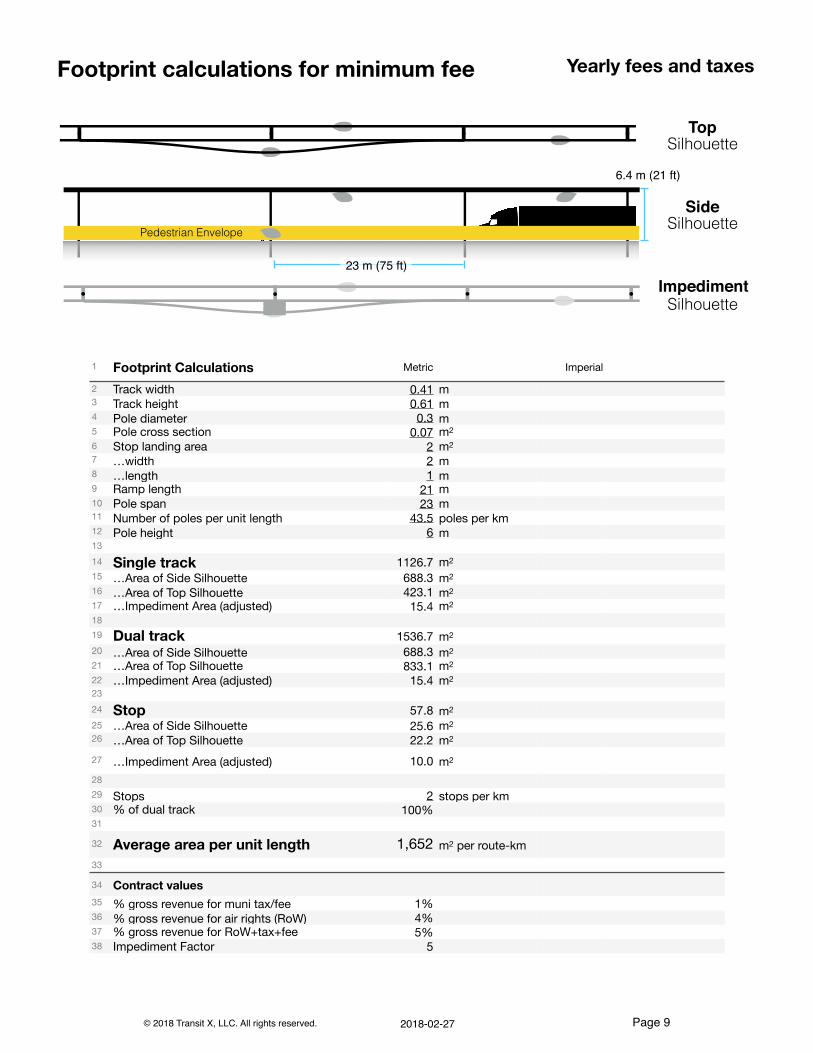
1 Footprint Calculations Metric Imperial
2 Track width 0.41 m3 Track height 0.61 m4 Pole diameter 0.3 m5 Pole cross section 0.07 m2
6 Stop landing area 2 m2
7 …width 2 m8 …length 1 m9 Ramp length 21 m10 Pole span 23 m11 Number of poles per unit length 43.5 poles per km12 Pole height 6 m1314 Single track 1126.7 m2
15 …Area of Side Silhouette 688.3 m2
16 …Area of Top Silhouette 423.1 m2
17 …Impediment Area (adjusted) 15.4 m2
1819 Dual track 1536.7 m2
20 …Area of Side Silhouette 688.3 m2
21 …Area of Top Silhouette 833.1 m2
22 …Impediment Area (adjusted) 15.4 m2
2324 Stop 57.8 m2
25 …Area of Side Silhouette 25.6 m2
26 …Area of Top Silhouette 22.2 m2
27 …Impediment Area (adjusted) 10.0 m2
2829 Stops 2 stops per km30 % of dual track 100%31
32 Average area per unit length 1,652 m2 per route-km33
34 Contract values35 % gross revenue for muni tax/fee 1%36 % gross revenue for air rights (RoW) 4%37 % gross revenue for RoW+tax+fee 5%38 Impediment Factor 5
Yearly fees and taxesFootprint calculations for minimum fee
Top Silhouette
Pedestrian Envelope
Note: Diagrams for illustrative purposes.
Side Silhouette
Impediment Silhouette
23 m (75 ft)
6.4 m (21 ft)
2018-02-27
© 2018 Transit X, LLC. All rights reserved. Page � 10
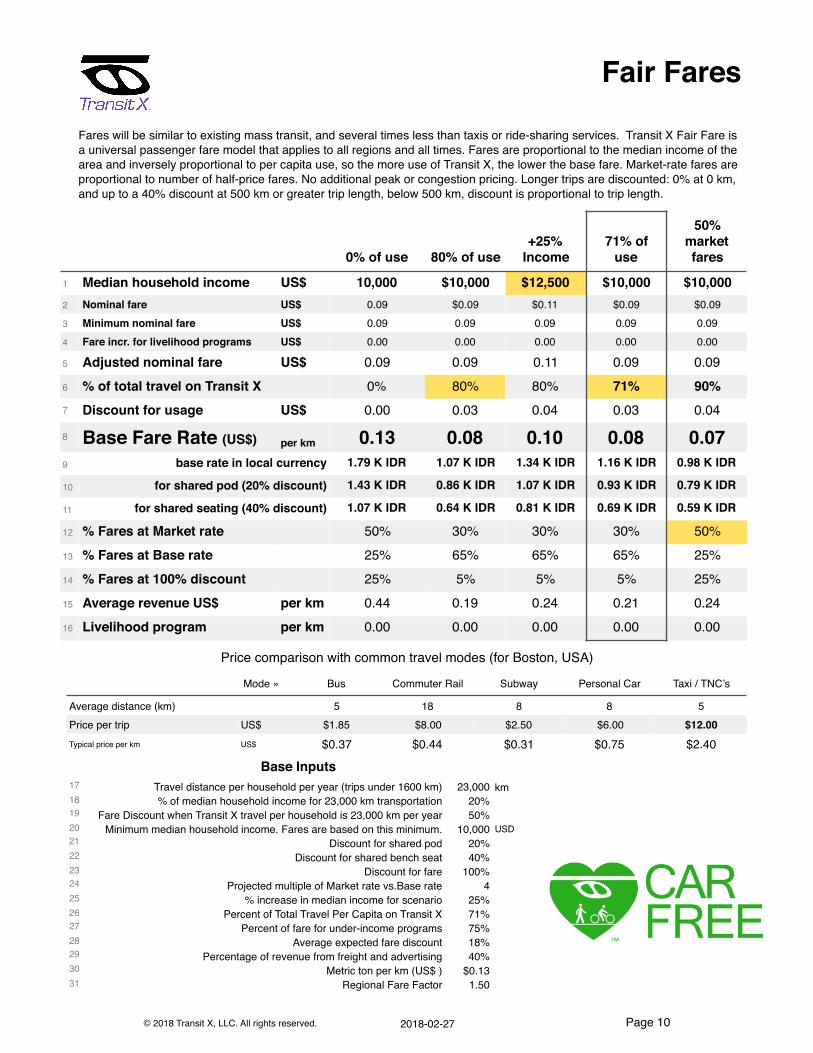
0% of use 80% of use+25%
Income71% of
use
50% market fares
1 Median household income US$ 10,000 $10,000 $12,500 $10,000 $10,0002 Nominal fare US$ 0.09 $0.09 $0.11 $0.09 $0.093 Minimum nominal fare US$ 0.09 0.09 0.09 0.09 0.094 Fare incr. for livelihood programs US$ 0.00 0.00 0.00 0.00 0.00
5 Adjusted nominal fare US$ 0.09 0.09 0.11 0.09 0.096 % of total travel on Transit X 0% 80% 80% 71% 90%7 Discount for usage US$ 0.00 0.03 0.04 0.03 0.04
8 Base Fare Rate (US$) per km 0.13 0.08 0.10 0.08 0.079 base rate in local currency 1.79 K IDR 1.07 K IDR 1.34 K IDR 1.16 K IDR 0.98 K IDR
10 for shared pod (20% discount) 1.43 K IDR 0.86 K IDR 1.07 K IDR 0.93 K IDR 0.79 K IDR
11 for shared seating (40% discount) 1.07 K IDR 0.64 K IDR 0.81 K IDR 0.69 K IDR 0.59 K IDR
12 % Fares at Market rate 50% 30% 30% 30% 50%13 % Fares at Base rate 25% 65% 65% 65% 25%14 % Fares at 100% discount 25% 5% 5% 5% 25%15 Average revenue US$ per km 0.44 0.19 0.24 0.21 0.2416 Livelihood program per km 0.00 0.00 0.00 0.00 0.00
Fair Fares
Base Inputs17 Travel distance per household per year (trips under 1600 km) 23,000 km18 % of median household income for 23,000 km transportation 20%19 Fare Discount when Transit X travel per household is 23,000 km per year 50%20 Minimum median household income. Fares are based on this minimum. 10,000 USD21 Discount for shared pod 20%22 Discount for shared bench seat 40%23 Discount for fare 100%24 Projected multiple of Market rate vs.Base rate 425 % increase in median income for scenario 25%26 Percent of Total Travel Per Capita on Transit X 71%27 Percent of fare for under-income programs 75%28 Average expected fare discount 18%29 Percentage of revenue from freight and advertising 40%30 Metric ton per km (US$ ) $0.1331 Regional Fare Factor 1.50
Fares will be similar to existing mass transit, and several times less than taxis or ride-sharing services. Transit X Fair Fare is a universal passenger fare model that applies to all regions and all times. Fares are proportional to the median income of the area and inversely proportional to per capita use, so the more use of Transit X, the lower the base fare. Market-rate fares are proportional to number of half-price fares. No additional peak or congestion pricing. Longer trips are discounted: 0% at 0 km, and up to a 40% discount at 500 km or greater trip length, below 500 km, discount is proportional to trip length.
Price comparison with common travel modes (for Boston, USA)
Mode » Bus Commuter Rail Subway Personal Car Taxi / TNC’s
Average distance (km) 5 18 8 8 5Price per trip US$ $1.85 $8.00 $2.50 $6.00 $12.00Typical price per km US$ $0.37 $0.44 $0.31 $0.75 $2.40
2018-02-27

© 2018 Transit X, LLC. All rights reserved. Page �11
© 2017 Transit X, LLC. All rights reserved. Page � of �1 12
High capacity • High speed • Nonstop • 24/7Solar powered • Wait-free • Door-to-door • Resilient26-page companion Transit X Handbook is available at transitx.com/transitxhandbook.pdf
Transit X, LLC presents a preliminary proposal for a privately-funded shared mobility service for
_____________
2017-12-23
952 mile network with 66,709 pods
95% of population within a 5 min. walk
Nonstop 45 mph service to 3,100 stops
General information available at transitx.com. Detailed information and references can be provided under appropriate non-disclosure/non-compete/non-circumvent agreements. Contact: Mike Stanley, CEO, Transit X, [email protected], 508-596-7024
About Transit X
Transit X designs, builds, and operates solar-electric shared mobility infrastructure to supplant buses, trains, cars, and trucks. Transit X offers its service to municipalities and commercial developers. First pilots will begin operations by 2019. Transit X is a privately held company founded in 2015, based in Boston, Mass, and intends to be certified as a public benefit company.
Project Description
Solar-powered automated transportation network infrastructure
Project type Project financing of Green Infrastructure
Project cost $875 million
Structure Equity and Debt
Debt term 10 years @ 5%
Equity terms A waterfall profit distribution of:1. 90/10 split until Return of Capital, 2. then 50/50 until Target IRR met3. then 10/90 onwards
Benefits to society and environment Extremely high
Rate of return -6% average IRR over 12 yrsCap rate 0%
Financials
Year 1Total
Years 1-12
Gross Revenues 87 2,113
Taxes and fees 4 106Debt service $79 $793
Operating Expenses 44 1,269Net Operating Income -$36 $51
Clean energy yesEnergy security yesEmissions-free yes
GHG-free yesLowers pollution yes
Clean water yesImproved Safety yes
Fixe Infrastructure yes
Resiliency yesSustainable yes
Equitable yesRecyclable mat. yes
Affordable housing yesImproved Health yesEconomic Devel. yes
Food security yes
ESG (Environmental, Social, Governance) Benefits
Project Summary
Bontang, East Kalimantan, Indonesia
217 km network with 3,226 pods
95% of population within a 10 min. walk
Nonstop 72 km/h service to 220 stops
StatusNow Prior to close
Project financing Letter of Interest YesDemonstration system In development Yes
Rider-Revenue study Proposals YesEnvironmental study Yes
Air rights Resolution OrdinancePermits Known process Yes
Safety certification Guar. fixed price YesInstallation Letter of intent Guar. fixed price
Operations & Maint Letter of intent Guar. fixed priceProject Management Appointed Yes
EPC Appointed Yes
Transit X, LLC presents a preliminary proposal fora privately-funded fleet of fully-autonomous shared electric vehicle network for
(US$ in millions)
2018-02-27

© 2018 Transit X, LLC. All rights reserved. Page � 12
Pro FormaYears 0 1 2 3 4 5 6 7 8 9 10 11 12
Revenue 0 86,796,578 99,816,065 114,788,474 132,006,745 151,807,757 174,578,921 200,765,759 230,880,623 265,512,716 305,339,624 351,140,567 403,811,652
5% RoW÷tax÷fee 0% 4,339,829 4,990,803 5,739,424 6,600,337 7,590,388 8,728,946 10,038,288 11,544,031 13,275,636 15,266,981 17,557,028 20,190,583
Debt service 0 $79,340,687 $79,340,687 $79,340,687 $79,340,687 $79,340,687 $79,340,687 $79,340,687 $79,340,687 $79,340,687 $79,340,687 0 0
Investor balance $ (262,563,324)-$262,563,324 -$262,563,324 -$262,563,324 -$262,563,324 -$262,563,324 -$256,065,208 -$245,963,082 -$228,395,086 -$207,410,538 -$184,451,266 -$151,286,995 -$115,511,152
Investor IRR 0% 0% 0% 0% 0% 0% -0% 4% 7% 8% 9% 13% 14%
Avg. return to date loss loss loss loss loss loss -46% -34% -24% -18% -13% -9% -6%
IRR row $ (262,563,324) $0 $0 $0 $0 $0 $6,498,116 $10,102,126 $17,567,996 $20,984,549 $22,959,272 $33,164,271 $35,775,842
OPEX 0 43,760,554 50,324,637 57,873,333 66,554,333 76,537,482 88,018,105 101,220,821 116,403,944 133,864,535 153,944,215 177,035,848 203,591,225
Free cash flow 0 0 0 0 0 0 7,220,129 20,204,251 35,135,992 52,307,494 72,054,721 174,104,720 200,220,427
Waterfall distribution
1. Capital return 0 $0 $0 $0 $0 $0 7,220,129 0 0 0 0 0 0
2. Expected return 0 $0 $0 $0 $0 $0 $0 $20,204,251 $35,135,992 $39,384,499 $39,384,499 $39,384,499 $39,384,499
3. Over Exp return 0 0 0 0 0 0 0 0 0 12,922,995 32,670,222 134,720,221 160,835,929
Investor share 0 0 0 0 0 0 6,498,116 10,102,126 17,567,996 20,984,549 22,959,272 33,164,271 35,775,842
Investor profit share 90% 50% 50% 40% 32% 19% 18%
Route length (km) 217
Starting number of pods 1,075
Projected revenue growth 15%
Project Cost $875,211,080
% Debt financed 70%
Debt $612,647,756
Equity $262,563,324
Capital return per year $52,512,665
Debt payment (per year) $79,340,687
Target IRR 15%
Target return per year $39,384,499
Travel per year per pod (km) 168,170
Revenue per vehicle-km (US$) 0.48
OPEX as % of project cost 5%
Debt Interest rate 5%
Debt term (yrs) 10
Years to return equity capital 5
Profit share when below capital return 90%
Profit share when below Target IRR 50%
Profit share when above Target IRR 10%
12-year Pro Forma
Model Inputs and Assumptions
The revenue estimates are conservative because they only show revenue from passenger fares, freight, and advertising, which may be less than 60% of total revenue. A substantial revenue stream can be expected from developer fees, private leasing, private branch & stops, subsidies, municipal contracts, carbon credits, water delivery, conduit leasing, 3rd-party services, mail & package delivery, para-transit, private shuttles, sale of surplus power to grid, and naming rights.
Important NoticesThe information contained in this document is not an offer to sell or a solicitation to buy any security. These materials and documents and information from which they are derived or which are referred to by or accessible from them may contain forward looking statements within the meaning of Section 27A of the Securities Act of 1933, Section 2E of the Securities Exchange Act of 1934 and the Private Securities Litigation Reform Act of 1995. All statements other than statements of historical fact are forward looking statements and are subject to risks and uncertainties. Forward looking statements generally can be identified by the use of forward looking terminology such as "may," "will," "expect," "intend," "estimate," “project,” "anticipate," "believe" or "plan" or the negative thereof or variations thereon or similar terminology. Although Transit X believes that the expectations reflected in such forward looking statements are reasonable, it can give no assurance that such expectations will prove to be correct. All forward looking statements speak only as of the date made. Except as required by law, Transit X undertakes no obligation to update any forward looking statement to reflect events or circumstances after the date on which it is made or to reflect the occurrence of anticipated or unanticipated events or circumstances. These materials and documents and information from which they are derived or which are referred to by or accessible from them represent Transit X’s best estimate as to the allocation of the funding proceeds based upon its present business plan and financial condition. The costs and expenses to be incurred in pursuing the Company’s business plan cannot be predicted with certainty. There can be no assurance that unforeseen events will not occur or that the Company’s business plan will be achieved or that it will not be changed, and it is possible that the funding proceeds may be applied in a manner other than that described herein.
2018-02-27