Embed Size (px)
Citation preview
1
ss
Bondholder information pack Year end 2015
Contents
Introduction
Business highlights for the year ended 31 December 2015
Management’s Discussion and Analysis of financial condition and results of operations
Business
R&R Ice Cream plc consolidated financial information
2
INTRODUCTION FORWARD-LOOKING STATEMENTS
This Bondholder Information Pack includes “forward-looking statements” within the meaning of the U.S. securities laws and
the laws of certain other jurisdictions, which are based on our current expectations and projections about future events. All
statements other than statements of historical facts included in this Bondholder Information Pack including, without limitation,
statements regarding our future financial position, risks and uncertainties related to our business, strategy, capital expenditure,
projected costs and our plans and objectives for future operations, may be deemed to be forward-looking statements. Words such
as “believe,” “expect,” “anticipate,” “may,” “assume,” “plan,” “intend,” “will,” “should,” “estimate,” “risk,” and similar
expressions or the negatives of these expressions are intended to identify forward-looking statements. These statements are based
on management’s current views and assumptions and involve known and unknown risks and uncertainties that could cause
actual results, performance or events to differ materially from those anticipated by such statements. Factors that could cause such
differences in actual results include:
our inability to address significant changes in consumer preferences;
increased price, or decreased availability, of commodities we use to produce our products;
adverse changes in general economic conditions and/or reductions in consumer spending;
our ability to accurately predict demand for our summer selling season;
inclement weather in the regions in which our ice cream is sold;
our inability to effectively compete in our highly competitive industry;
the size and sophistication of our customers;
the loss of any of our major customers;
our dependence on the value and perception of our brands;
our reliance on licences from third parties;
increased shipping prices or disrupted shipping services;
significant damage to any of our factories;
significant charges incurred due to the closing or divesting of all or a portion of a manufacturing plant or facility;
the shipment of contaminated products or lawsuits relating to product liability;
health concerns which may cause a decreased demand for our products;
the damaged image or reputation of our customers, which could adversely affect the sales of our products;
our failure to comply with existing or future government regulations;
costs and liabilities imposed by environmental regulations;
our inability to retain or attract key personnel;
detrimental fluctuations in currency exchange rates;
our inability to adequately protect our confidential information due to the absence of patent protection;
our inability to successfully integrate our recently acquired businesses;
our inability to maintain adequate infrastructure and resources to support any future gro wth;
adverse economic, social or political conditions in any of the several different countries in which we operate; and
disruptions in our information technology systems.
We disclose important factors that could cause our actual results to differ materially from our expectations under the
“Management’s Discussion and Analysis of Financial Condition and Results of Operations” section in this Bondholder
Information Pack. Other sections of this Bondholder Information Pack describe additional factors that could adversely affect
our business, financial condition or results of operations. Moreover, we operate in a very competitive and rapidly changing
environment. New risk factors emerge from time to time and it is not possible for us to predict all such risk factors, nor can we
assess the impact of all such risk factors on our business or the extent to which any factor, or combination of factors, may
cause actual results to differ materially from those contained in any forward-looking statements. Given these risks and
uncertainties, you should not place undue reliance on forward-looking statements as a prediction of actual results.
3
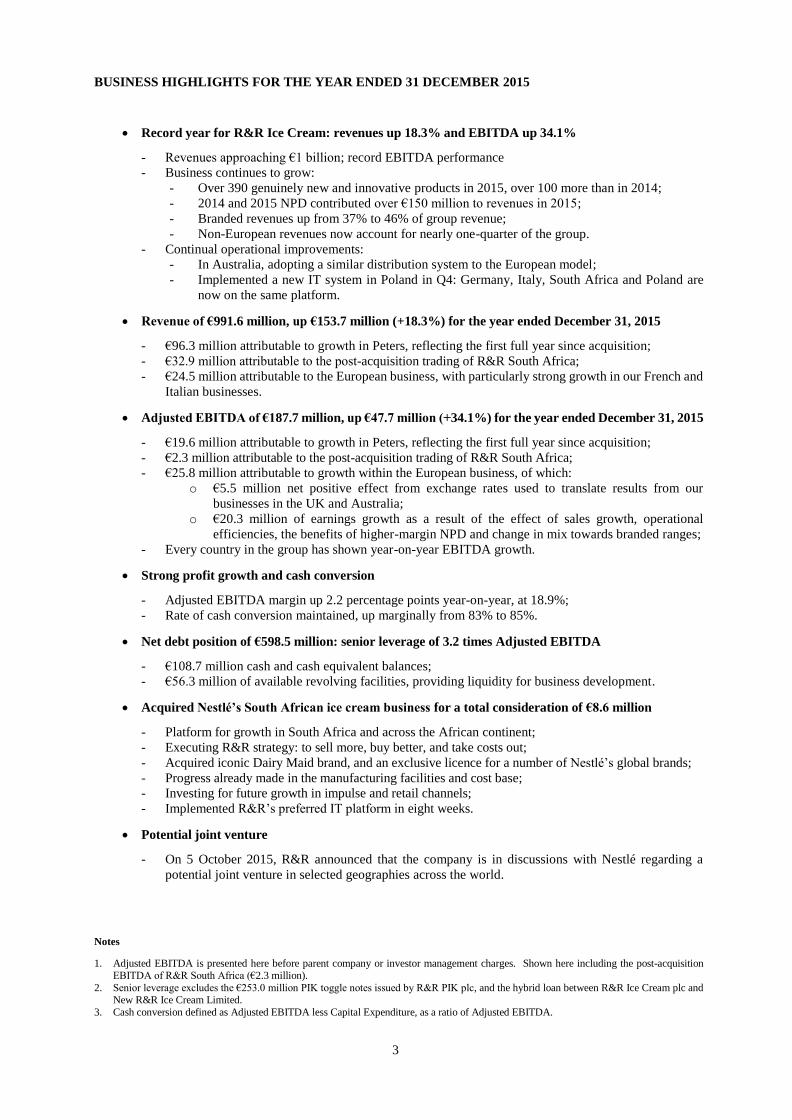
BUSINESS HIGHLIGHTS FOR THE YEAR ENDED 31 DECEMBER 2015
Record year for R&R Ice Cream: revenues up 18.3% and EBITDA up 34.1%
- Revenues approaching €1 billion; record EBITDA performance
- Business continues to grow:
- Over 390 genuinely new and innovative products in 2015, over 100 more than in 2014;
- 2014 and 2015 NPD contributed over €150 million to revenues in 2015;
- Branded revenues up from 37% to 46% of group revenue;
- Non-European revenues now account for nearly one-quarter of the group.
- Continual operational improvements:
- In Australia, adopting a similar distribution system to the European model;
- Implemented a new IT system in Poland in Q4: Germany, Italy, South Africa and Poland are
now on the same platform.
Revenue of €991.6 million, up €153.7 million (+18.3%) for the year ended December 31, 2015
- €96.3 million attributable to growth in Peters, reflecting the first full year since acquisition;
- €32.9 million attributable to the post-acquisition trading of R&R South Africa;
- €24.5 million attributable to the European business, with particularly strong growth in our French and
Italian businesses.
Adjusted EBITDA of €187.7 million, up €47.7 million (+34.1%) for the year ended December 31, 2015
- €19.6 million attributable to growth in Peters, reflecting the first full year since acquisition;
- €2.3 million attributable to the post-acquisition trading of R&R South Africa;
- €25.8 million attributable to growth within the European business, of which:
o €5.5 million net positive effect from exchange rates used to translate results from our
businesses in the UK and Australia;
o €20.3 million of earnings growth as a result of the effect of sales growth, operational
efficiencies, the benefits of higher-margin NPD and change in mix towards branded ranges;
- Every country in the group has shown year-on-year EBITDA growth.
Strong profit growth and cash conversion
- Adjusted EBITDA margin up 2.2 percentage points year-on-year, at 18.9%;
- Rate of cash conversion maintained, up marginally from 83% to 85%.
Net debt position of €598.5 million: senior leverage of 3.2 times Adjusted EBITDA
- €108.7 million cash and cash equivalent balances;
- €56.3 million of available revolving facilities, providing liquidity for business development.
Acquired Nestlé’s South African ice cream business for a total consideration of €8.6 million
- Platform for growth in South Africa and across the African continent;
- Executing R&R strategy: to sell more, buy better, and take costs out;
- Acquired iconic Dairy Maid brand, and an exclusive licence for a number of Nestlé’s global brands;
- Progress already made in the manufacturing facilities and cost base;
- Investing for future growth in impulse and retail channels;
- Implemented R&R’s preferred IT platform in eight weeks.
Potential joint venture
- On 5 October 2015, R&R announced that the company is in discussions with Nestlé regarding a
potential joint venture in selected geographies across the world.
Notes
1. Adjusted EBITDA is presented here before parent company or investor management charges. Shown here including the post-acquisition EBITDA of R&R South Africa (€2.3 million).
2. Senior leverage excludes the €253.0 million PIK toggle notes issued by R&R PIK plc, and the hybrid loan between R&R Ice Cream plc and New R&R Ice Cream Limited.
3. Cash conversion defined as Adjusted EBITDA less Capital Expenditure, as a ratio of Adjusted EBITDA.
4
MANAGEMENT’S DISCUSSION AND ANALYSIS OF FINANCIAL CONDITION AND RESULTS OF
OPERATIONS
You should read the following discussion in conjunction with the audited financial statements and related notes
thereto and other financial information included with this document. The statements in this discussion regarding
industry outlook, our expectations regarding our future performance, liquidity and capital resources and other non-
historical statements in this discussion are forward-looking statements. These forward-looking statements are
subject to numerous risks and uncertainties, including, but not limited to, the risks and uncertainties described in
the “Forward-Looking Statements” section of this document. Our actual results may differ materially from those
contained in or implied by any forward-looking statements.
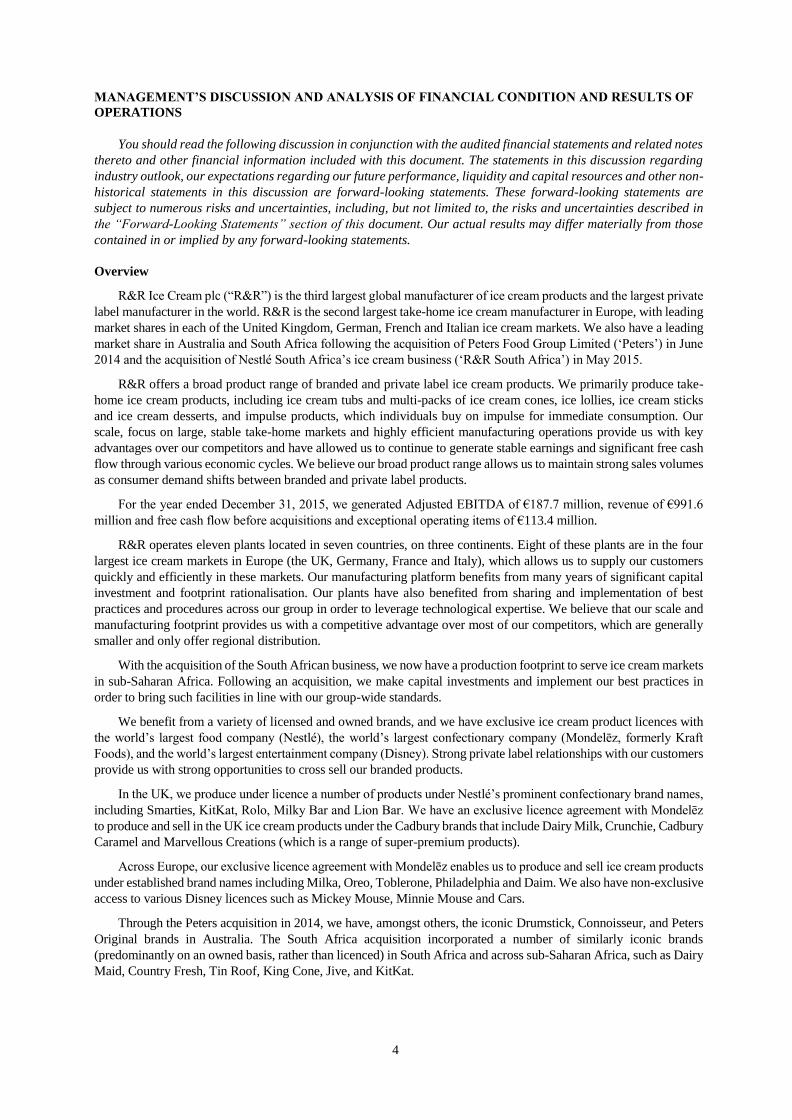
Overview
R&R Ice Cream plc (“R&R”) is the third largest global manufacturer of ice cream products and the largest private
label manufacturer in the world. R&R is the second largest take-home ice cream manufacturer in Europe, with leading
market shares in each of the United Kingdom, German, French and Italian ice cream markets. We also have a leading
market share in Australia and South Africa following the acquisition of Peters Food Group Limited (‘Peters’) in June
2014 and the acquisition of Nestlé South Africa’s ice cream business (‘R&R South Africa’) in May 2015.
R&R offers a broad product range of branded and private label ice cream products. We primarily produce take-
home ice cream products, including ice cream tubs and multi-packs of ice cream cones, ice lollies, ice cream sticks
and ice cream desserts, and impulse products, which individuals buy on impulse for immediate consumption. Our
scale, focus on large, stable take-home markets and highly efficient manufacturing operations provide us with key
advantages over our competitors and have allowed us to continue to generate stable earnings and significant free cash
flow through various economic cycles. We believe our broad product range allows us to maintain strong sales volumes
as consumer demand shifts between branded and private label products.
For the year ended December 31, 2015, we generated Adjusted EBITDA of €187.7 million, revenue of €991.6
million and free cash flow before acquisitions and exceptional operating items of €113.4 million.
R&R operates eleven plants located in seven countries, on three continents. Eight of these plants are in the four
largest ice cream markets in Europe (the UK, Germany, France and Italy), which allows us to supply our customers
quickly and efficiently in these markets. Our manufacturing platform benefits from many years of significant capital
investment and footprint rationalisation. Our plants have also benefited from sharing and implementation of best
practices and procedures across our group in order to leverage technological expertise. We believe that our scale and
manufacturing footprint provides us with a competitive advantage over most of our competitors, which are generally
smaller and only offer regional distribution.
With the acquisition of the South African business, we now have a production footprint to serve ice cream markets
in sub-Saharan Africa. Following an acquisition, we make capital investments and implement our best practices in
order to bring such facilities in line with our group-wide standards.
We benefit from a variety of licensed and owned brands, and we have exclusive ice cream product licences with
the world’s largest food company (Nestlé), the world’s largest confectionary company (Mondelēz, formerly Kraft
Foods), and the world’s largest entertainment company (Disney). Strong private label relationships with our customers
provide us with strong opportunities to cross sell our branded products.
In the UK, we produce under licence a number of products under Nestlé’s prominent confectionary brand names,
including Smarties, KitKat, Rolo, Milky Bar and Lion Bar. We have an exclusive licence agreement with Mondelēz
to produce and sell in the UK ice cream products under the Cadbury brands that include Dairy Milk, Crunchie, Cadbury
Caramel and Marvellous Creations (which is a range of super-premium products).
Across Europe, our exclusive licence agreement with Mondelēz enables us to produce and sell ice cream products
under established brand names including Milka, Oreo, Toblerone, Philadelphia and Daim. We also have non-exclusive
access to various Disney licences such as Mickey Mouse, Minnie Mouse and Cars.
Through the Peters acquisition in 2014, we have, amongst others, the iconic Drumstick, Connoisseur, and Peters
Original brands in Australia. The South Africa acquisition incorporated a number of similarly iconic brands
(predominantly on an owned basis, rather than licenced) in South Africa and across sub-Saharan Africa, such as Dairy
Maid, Country Fresh, Tin Roof, King Cone, Jive, and KitKat.
5
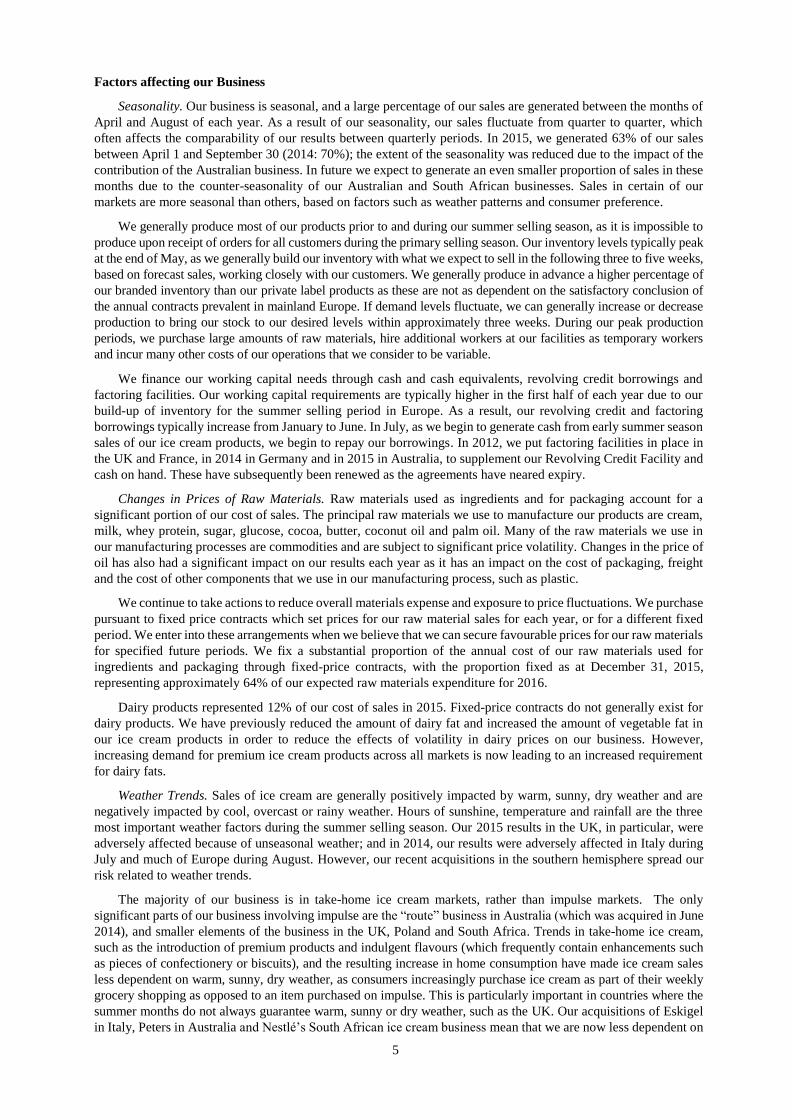
Factors affecting our Business
Seasonality. Our business is seasonal, and a large percentage of our sales are generated between the months of
April and August of each year. As a result of our seasonality, our sales fluctuate from quarter to quarter, which
often affects the comparability of our results between quarterly periods. In 2015, we generated 63% of our sales
between April 1 and September 30 (2014: 70%); the extent of the seasonality was reduced due to the impact of the
contribution of the Australian business. In future we expect to generate an even smaller proportion of sales in these
months due to the counter-seasonality of our Australian and South African businesses. Sales in certain of our
markets are more seasonal than others, based on factors such as weather patterns and consumer preference.
We generally produce most of our products prior to and during our summer selling season, as it is impossible to
produce upon receipt of orders for all customers during the primary selling season. Our inventory levels typically peak
at the end of May, as we generally build our inventory with what we expect to sell in the following three to five weeks,
based on forecast sales, working closely with our customers. We generally produce in advance a higher percentage of
our branded inventory than our private label products as these are not as dependent on the satisfactory conclusion of
the annual contracts prevalent in mainland Europe. If demand levels fluctuate, we can generally increase or decrease
production to bring our stock to our desired levels within approximately three weeks. During our peak production
periods, we purchase large amounts of raw materials, hire additional workers at our facilities as temporary workers
and incur many other costs of our operations that we consider to be variable.
We finance our working capital needs through cash and cash equivalents, revolving credit borrowings and
factoring facilities. Our working capital requirements are typically higher in the first half of each year due to our
build-up of inventory for the summer selling period in Europe. As a result, our revolving credit and factoring
borrowings typically increase from January to June. In July, as we begin to generate cash from early summer season
sales of our ice cream products, we begin to repay our borrowings. In 2012, we put factoring facilities in place in
the UK and France, in 2014 in Germany and in 2015 in Australia, to supplement our Revolving Credit Facility and
cash on hand. These have subsequently been renewed as the agreements have neared expiry.
Changes in Prices of Raw Materials. Raw materials used as ingredients and for packaging account for a
significant portion of our cost of sales. The principal raw materials we use to manufacture our products are cream,
milk, whey protein, sugar, glucose, cocoa, butter, coconut oil and palm oil. Many of the raw materials we use in
our manufacturing processes are commodities and are subject to significant price volatility. Changes in the price of
oil has also had a significant impact on our results each year as it has an impact on the cost of packaging, freight
and the cost of other components that we use in our manufacturing process, such as plastic.
We continue to take actions to reduce overall materials expense and exposure to price fluctuations. We purchase
pursuant to fixed price contracts which set prices for our raw material sales for each year, or for a different fixed
period. We enter into these arrangements when we believe that we can secure favourable prices for our raw materials
for specified future periods. We fix a substantial proportion of the annual cost of our raw materials used for
ingredients and packaging through fixed-price contracts, with the proportion fixed as at December 31, 2015,
representing approximately 64% of our expected raw materials expenditure for 2016.
Dairy products represented 12% of our cost of sales in 2015. Fixed-price contracts do not generally exist for
dairy products. We have previously reduced the amount of dairy fat and increased the amount of vegetable fat in
our ice cream products in order to reduce the effects of volatility in dairy prices on our business. However,
increasing demand for premium ice cream products across all markets is now leading to an increased requirement
for dairy fats.
Weather Trends. Sales of ice cream are generally positively impacted by warm, sunny, dry weather and are
negatively impacted by cool, overcast or rainy weather. Hours of sunshine, temperature and rainfall are the three
most important weather factors during the summer selling season. Our 2015 results in the UK, in particular, were
adversely affected because of unseasonal weather; and in 2014, our results were adversely affected in Italy during
July and much of Europe during August. However, our recent acquisitions in the southern hemisphere spread our
risk related to weather trends.
The majority of our business is in take-home ice cream markets, rather than impulse markets. The only
significant parts of our business involving impulse are the “route” business in Australia (which was acquired in June
2014), and smaller elements of the business in the UK, Poland and South Africa. Trends in take-home ice cream,
such as the introduction of premium products and indulgent flavours (which frequently contain enhancements such
as pieces of confectionery or biscuits), and the resulting increase in home consumption have made ice cream sales
less dependent on warm, sunny, dry weather, as consumers increasingly purchase ice cream as part of their weekly
grocery shopping as opposed to an item purchased on impulse. This is particularly important in countries where the
summer months do not always guarantee warm, sunny or dry weather, such as the UK. Our acquisitions of Eskigel
in Italy, Peters in Australia and Nestlé’s South African ice cream business mean that we are now less dependent on
6
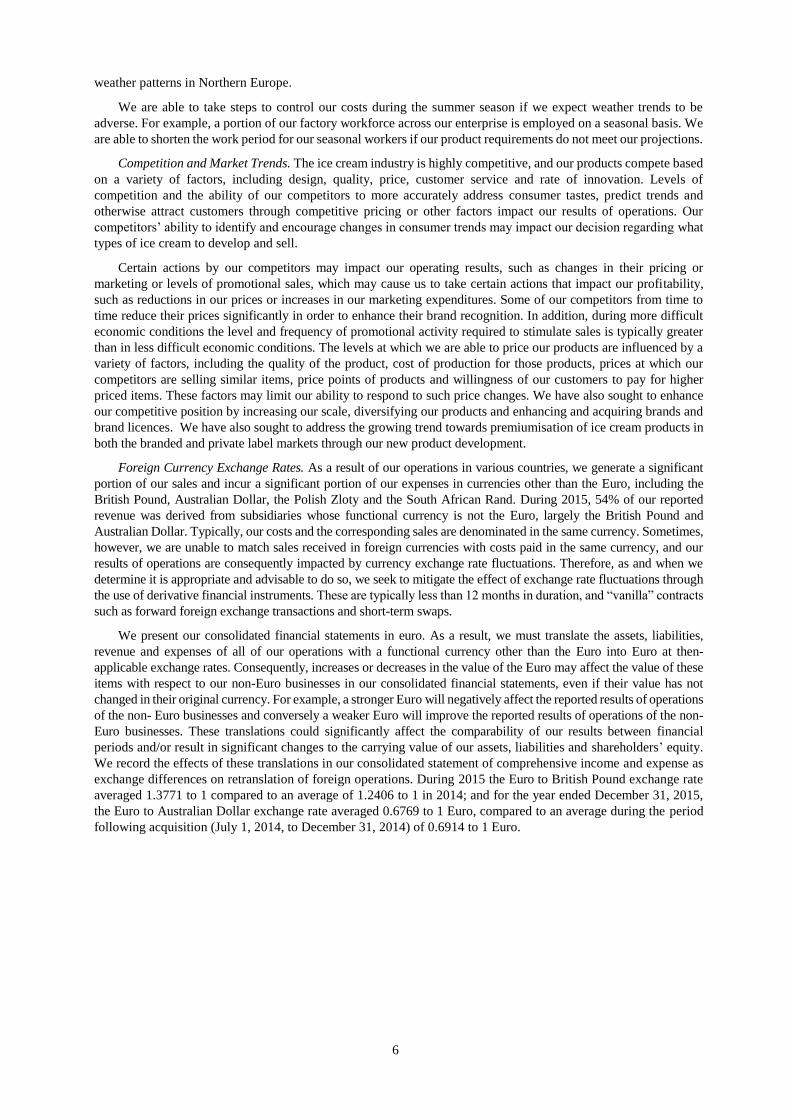
weather patterns in Northern Europe.
We are able to take steps to control our costs during the summer season if we expect weather trends to be
adverse. For example, a portion of our factory workforce across our enterprise is employed on a seasonal basis. We
are able to shorten the work period for our seasonal workers if our product requirements do not meet our projections.
Competition and Market Trends. The ice cream industry is highly competitive, and our products compete based
on a variety of factors, including design, quality, price, customer service and rate of innovation. Levels of
competition and the ability of our competitors to more accurately address consumer tastes, predict trends and
otherwise attract customers through competitive pricing or other factors impact our results of operations. Our
competitors’ ability to identify and encourage changes in consumer trends may impact our decision regarding what
types of ice cream to develop and sell.
Certain actions by our competitors may impact our operating results, such as changes in their pricing or
marketing or levels of promotional sales, which may cause us to take certain actions that impact our profitability,
such as reductions in our prices or increases in our marketing expenditures. Some of our competitors from time to
time reduce their prices significantly in order to enhance their brand recognition. In addition, during more difficult
economic conditions the level and frequency of promotional activity required to stimulate sales is typically greater
than in less difficult economic conditions. The levels at which we are able to price our products are influenced by a
variety of factors, including the quality of the product, cost of production for those products, prices at which our
competitors are selling similar items, price points of products and willingness of our customers to pay for higher
priced items. These factors may limit our ability to respond to such price changes. We have also sought to enhance
our competitive position by increasing our scale, diversifying our products and enhancing and acquiring brands and
brand licences. We have also sought to address the growing trend towards premiumisation of ice cream products in
both the branded and private label markets through our new product development.
Foreign Currency Exchange Rates. As a result of our operations in various countries, we generate a significant
portion of our sales and incur a significant portion of our expenses in currencies other than the Euro, including the
British Pound, Australian Dollar, the Polish Zloty and the South African Rand. During 2015, 54% of our reported
revenue was derived from subsidiaries whose functional currency is not the Euro, largely the British Pound and
Australian Dollar. Typically, our costs and the corresponding sales are denominated in the same currency. Sometimes,
however, we are unable to match sales received in foreign currencies with costs paid in the same currency, and our
results of operations are consequently impacted by currency exchange rate fluctuations. Therefore, as and when we
determine it is appropriate and advisable to do so, we seek to mitigate the effect of exchange rate fluctuations through
the use of derivative financial instruments. These are typically less than 12 months in duration, and “vanilla” contracts
such as forward foreign exchange transactions and short-term swaps.
We present our consolidated financial statements in euro. As a result, we must translate the assets, liabilities,
revenue and expenses of all of our operations with a functional currency other than the Euro into Euro at then-
applicable exchange rates. Consequently, increases or decreases in the value of the Euro may affect the value of these
items with respect to our non-Euro businesses in our consolidated financial statements, even if their value has not
changed in their original currency. For example, a stronger Euro will negatively affect the reported results of operations
of the non- Euro businesses and conversely a weaker Euro will improve the reported results of operations of the non-
Euro businesses. These translations could significantly affect the comparability of our results between financial
periods and/or result in significant changes to the carrying value of our assets, liabilities and shareholders’ equity.
We record the effects of these translations in our consolidated statement of comprehensive income and expense as
exchange differences on retranslation of foreign operations. During 2015 the Euro to British Pound exchange rate
averaged 1.3771 to 1 compared to an average of 1.2406 to 1 in 2014; and for the year ended December 31, 2015,
the Euro to Australian Dollar exchange rate averaged 0.6769 to 1 Euro, compared to an average during the period
following acquisition (July 1, 2014, to December 31, 2014) of 0.6914 to 1 Euro.
7
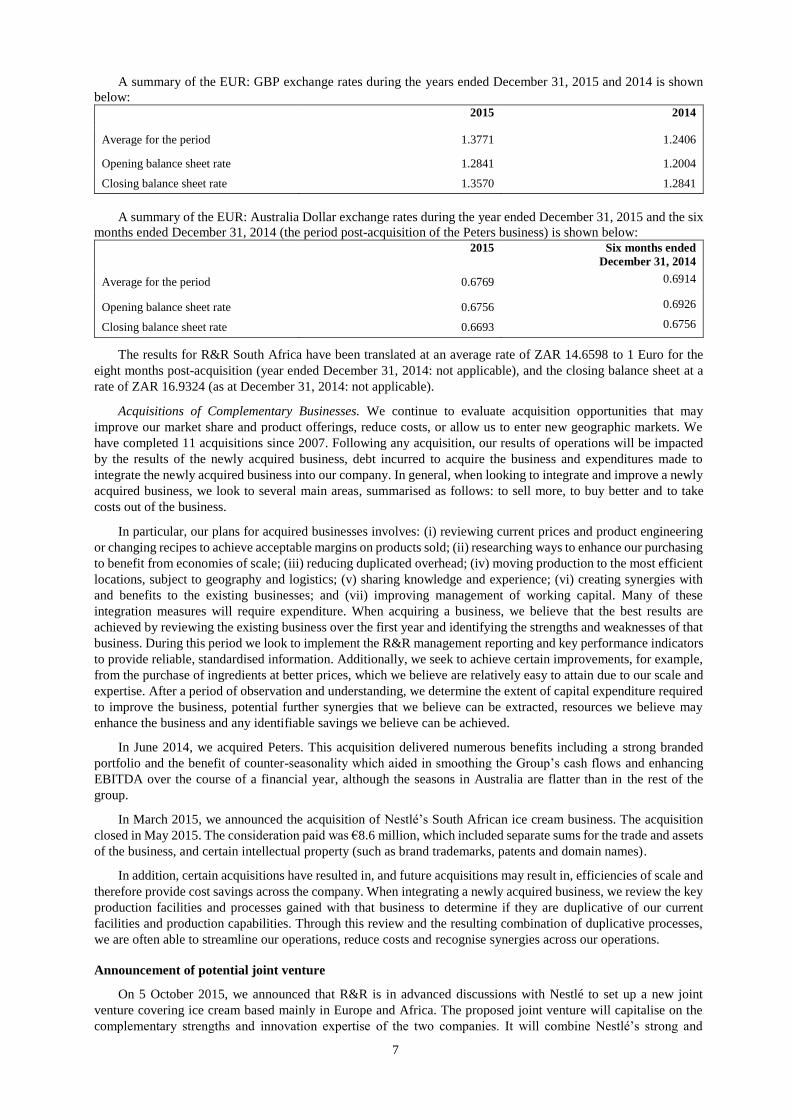
A summary of the EUR: GBP exchange rates during the years ended December 31, 2015 and 2014 is shown
below: 2015 2014
Average for the period 1.3771 1.2406
Opening balance sheet rate 1.2841 1.2004
Closing balance sheet rate 1.3570 1.2841
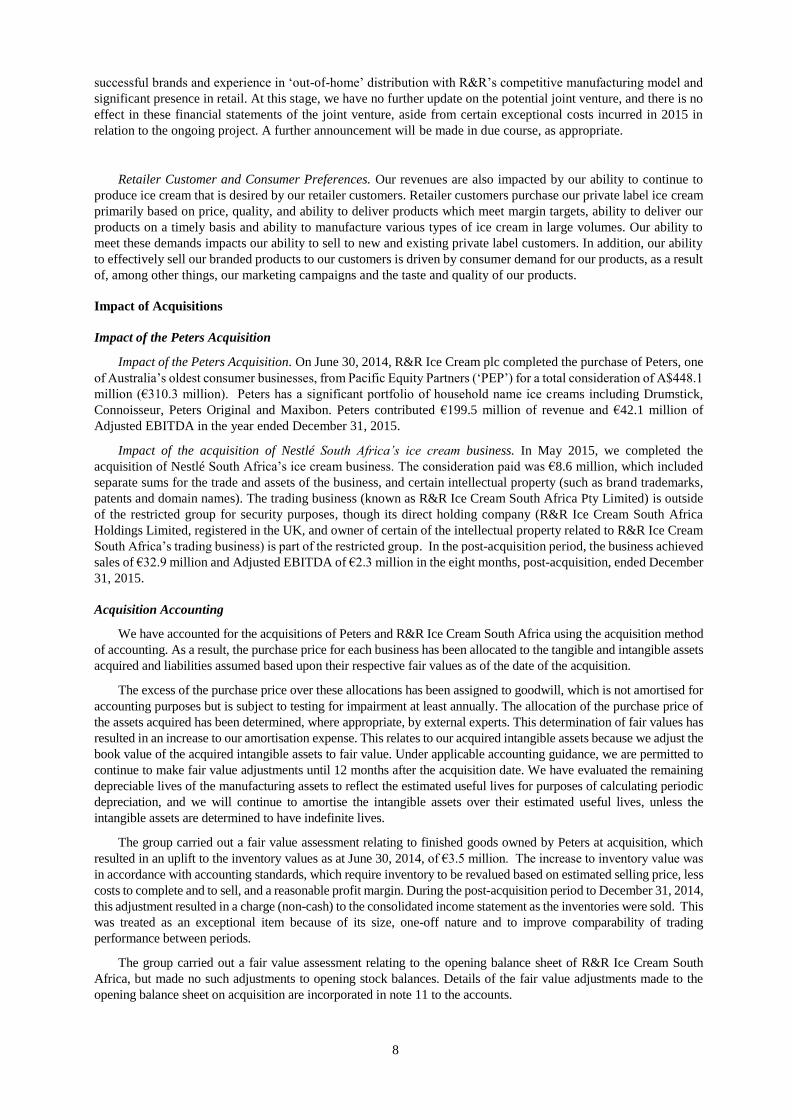
A summary of the EUR: Australia Dollar exchange rates during the year ended December 31, 2015 and the six
months ended December 31, 2014 (the period post-acquisition of the Peters business) is shown below: 2015 Six months ended
December 31, 2014
Average for the period 0.6769 0.6914
Opening balance sheet rate 0.6756 0.6926
Closing balance sheet rate 0.6693 0.6756
The results for R&R South Africa have been translated at an average rate of ZAR 14.6598 to 1 Euro for the
eight months post-acquisition (year ended December 31, 2014: not applicable), and the closing balance sheet at a
rate of ZAR 16.9324 (as at December 31, 2014: not applicable).
Acquisitions of Complementary Businesses. We continue to evaluate acquisition opportunities that may
improve our market share and product offerings, reduce costs, or allow us to enter new geographic markets. We
have completed 11 acquisitions since 2007. Following any acquisition, our results of operations will be impacted
by the results of the newly acquired business, debt incurred to acquire the business and expenditures made to
integrate the newly acquired business into our company. In general, when looking to integrate and improve a newly
acquired business, we look to several main areas, summarised as follows: to sell more, to buy better and to take
costs out of the business.
In particular, our plans for acquired businesses involves: (i) reviewing current prices and product engineering
or changing recipes to achieve acceptable margins on products sold; (ii) researching ways to enhance our purchasing
to benefit from economies of scale; (iii) reducing duplicated overhead; (iv) moving production to the most efficient
locations, subject to geography and logistics; (v) sharing knowledge and experience; (vi) creating synergies with
and benefits to the existing businesses; and (vii) improving management of working capital. Many of these
integration measures will require expenditure. When acquiring a business, we believe that the best results are
achieved by reviewing the existing business over the first year and identifying the strengths and weaknesses of that
business. During this period we look to implement the R&R management reporting and key performance indicators
to provide reliable, standardised information. Additionally, we seek to achieve certain improvements, for example,
from the purchase of ingredients at better prices, which we believe are relatively easy to attain due to our scale and
expertise. After a period of observation and understanding, we determine the extent of capital expenditure required
to improve the business, potential further synergies that we believe can be extracted, resources we believe may
enhance the business and any identifiable savings we believe can be achieved.
In June 2014, we acquired Peters. This acquisition delivered numerous benefits including a strong branded
portfolio and the benefit of counter-seasonality which aided in smoothing the Group’s cash flows and enhancing
EBITDA over the course of a financial year, although the seasons in Australia are flatter than in the rest of the
group.
In March 2015, we announced the acquisition of Nestlé’s South African ice cream business. The acquisition
closed in May 2015. The consideration paid was €8.6 million, which included separate sums for the trade and assets
of the business, and certain intellectual property (such as brand trademarks, patents and domain names).
In addition, certain acquisitions have resulted in, and future acquisitions may result in, efficiencies of scale and
therefore provide cost savings across the company. When integrating a newly acquired business, we review the key
production facilities and processes gained with that business to determine if they are duplicative of our current
facilities and production capabilities. Through this review and the resulting combination of duplicative processes,
we are often able to streamline our operations, reduce costs and recognise synergies across our operations.
Announcement of potential joint venture
On 5 October 2015, we announced that R&R is in advanced discussions with Nestlé to set up a new joint
venture covering ice cream based mainly in Europe and Africa. The proposed joint venture will capitalise on the
complementary strengths and innovation expertise of the two companies. It will combine Nestlé’s strong and
8
successful brands and experience in ‘out-of-home’ distribution with R&R’s competitive manufacturing model and
significant presence in retail. At this stage, we have no further update on the potential joint venture, and there is no
effect in these financial statements of the joint venture, aside from certain exceptional costs incurred in 2015 in
relation to the ongoing project. A further announcement will be made in due course, as appropriate.
Retailer Customer and Consumer Preferences. Our revenues are also impacted by our ability to continue to
produce ice cream that is desired by our retailer customers. Retailer customers purchase our private label ice cream
primarily based on price, quality, and ability to deliver products which meet margin targets, ability to deliver our
products on a timely basis and ability to manufacture various types of ice cream in large volumes. Our ability to
meet these demands impacts our ability to sell to new and existing private label customers. In addition, our ability
to effectively sell our branded products to our customers is driven by consumer demand for our products, as a result
of, among other things, our marketing campaigns and the taste and quality of our products.
Impact of Acquisitions
Impact of the Peters Acquisition
Impact of the Peters Acquisition. On June 30, 2014, R&R Ice Cream plc completed the purchase of Peters, one
of Australia’s oldest consumer businesses, from Pacific Equity Partners (‘PEP’) for a total consideration of A$448.1
million (€310.3 million). Peters has a significant portfolio of household name ice creams including Drumstick,
Connoisseur, Peters Original and Maxibon. Peters contributed €199.5 million of revenue and €42.1 million of
Adjusted EBITDA in the year ended December 31, 2015.
Impact of the acquisition of Nestlé South Africa’s ice cream business. In May 2015, we completed the
acquisition of Nestlé South Africa’s ice cream business. The consideration paid was €8.6 million, which included
separate sums for the trade and assets of the business, and certain intellectual property (such as brand trademarks,
patents and domain names). The trading business (known as R&R Ice Cream South Africa Pty Limited) is outside
of the restricted group for security purposes, though its direct holding company (R&R Ice Cream South Africa
Holdings Limited, registered in the UK, and owner of certain of the intellectual property related to R&R Ice Cream
South Africa’s trading business) is part of the restricted group. In the post-acquisition period, the business achieved
sales of €32.9 million and Adjusted EBITDA of €2.3 million in the eight months, post-acquisition, ended December
31, 2015.
Acquisition Accounting
We have accounted for the acquisitions of Peters and R&R Ice Cream South Africa using the acquisition method
of accounting. As a result, the purchase price for each business has been allocated to the tangible and intangible assets
acquired and liabilities assumed based upon their respective fair values as of the date of the acquisition.
The excess of the purchase price over these allocations has been assigned to goodwill, which is not amortised for
accounting purposes but is subject to testing for impairment at least annually. The allocation of the purchase price of
the assets acquired has been determined, where appropriate, by external experts. This determination of fair values has
resulted in an increase to our amortisation expense. This relates to our acquired intangible assets because we adjust the
book value of the acquired intangible assets to fair value. Under applicable accounting guidance, we are permitted to
continue to make fair value adjustments until 12 months after the acquisition date. We have evaluated the remaining
depreciable lives of the manufacturing assets to reflect the estimated useful lives for purposes of calculating periodic
depreciation, and we will continue to amortise the intangible assets over their estimated useful lives, unless the
intangible assets are determined to have indefinite lives.
The group carried out a fair value assessment relating to finished goods owned by Peters at acquisition, which
resulted in an uplift to the inventory values as at June 30, 2014, of €3.5 million. The increase to inventory value was
in accordance with accounting standards, which require inventory to be revalued based on estimated selling price, less
costs to complete and to sell, and a reasonable profit margin. During the post-acquisition period to December 31, 2014,
this adjustment resulted in a charge (non-cash) to the consolidated income statement as the inventories were sold. This
was treated as an exceptional item because of its size, one-off nature and to improve comparability of trading
performance between periods.
The group carried out a fair value assessment relating to the opening balance sheet of R&R Ice Cream South
Africa, but made no such adjustments to opening stock balances. Details of the fair value adjustments made to the
opening balance sheet on acquisition are incorporated in note 11 to the accounts.
9
Potential Acquisitions and Financing
We have completed numerous acquisitions in recent years and continue to evaluate acquisition opportunities.
We will also consider obtaining additional licensing agreements that would allow us to sell well-established brand
name products to improve our market share and product offerings.
Components of Revenue and Expenses
Revenue
We generate revenue from the sale of ice cream and related products. We generate sales under contracts with
retailers, and by individual orders through sales personnel and independent brokers. In the UK, we generally enter
into purchase orders or other contracts for sale that have a rolling thirteen-week term. In Germany and France we
generally enter into longer-term contracts, typically for twelve months. In many cases, subject to certain exceptions,
these contracts have fixed prices for products but do not provide for specific volumes to be purchased. Rather, the
terms in the contracts govern individual purchase orders to be delivered to us as required by the retailer. In our
contracts for sale of goods in Germany, certain of our prices for our goods vary based on our costs of raw materials,
allowing us to pass some of our increased costs through to consumers. In Poland, we typically enter into contracts
with distributors and retailers early in the calendar year, fixing pricing and retrospective rebate levels for the coming
summer season. In Italy, relationships with customers are regulated by framework contracts setting quality standards
and payment terms, while other metrics (such as prices, discounts, promotional campaigns and new products) are
negotiated annually. In Australia, there are generally long standing arrangements with grocery customers. These
arrangements are reviewed annually, including the range of products and fixed pricing. Volumes are not specified,
however agreed promotional and marketing activity is undertaken to drive growth with additional incentives provided
to the retailer based on achieving stepped volume growth thresholds. In South Africa, there are generally long
standing arrangements with grocery customers and with distributors. In similar arrangements to Australia, these
arrangements are reviewed annually, including the range of products and fixed pricing, though volumes are not
specified.
Revenues include sales of products less allowances, trade discounts and volume rebates. Revenue from sales
of products is recognised when the significant risks of ownership have been transferred to the buyer (which is
typically when the goods are dispatched). Our relationships with our retailer customers do not include a right of
return for unsold merchandise.
In the year ended December 31, 2015, our ten largest customers by revenue, represented 42% of our sales
(2014: 42%). Transactions with our largest customer accounted for 5.6% of our total revenue in the year ended
December 31, 2015, compared to 6.4% during the year ended December 31, 2014.
Expenses
Cost of Sales. Cost of sales includes directly attributable costs such as material, labour, energy, product-specific
research and development, maintenance and consumables. Our costs of sales are primarily variable in nature based
on the amount of products we are selling at a given time.
Our raw material costs are the primary driver of our cost of sales, accounting for approximately 63% of our
cost of sales for the year ended December 31, 2015 compared to 64% for the year ended December 31, 2014 (for
Europe). Personnel expenses, which are salaries and wages, paid to our officers and employees, also significantly
impact our cost of sales, accounting for approximately 13% of our cost of sales for the year ended December 31,
2015 (2014: 13%, of European cost of sales). Our raw material costs and personnel expenses are expected to
continue to be key components of our operating expenses in the future.
Distribution Expenses. Distribution expenses represent the costs associated with the storage and shipping of
our products. These costs include freight, storage and other related distribution costs.
Administrative Expenses. Administrative expenses include sales and marketing but also those costs associated
with support functions, such as finance, human resources, IT, professional fees (legal and accounting) and senior
management, and also include costs relating to impairment and amortisation of intangibles.
Typically, costs of these support functions are salaries and benefits, systems costs, insurance costs and costs of
professional services. Administrative costs are relatively fixed in nature and were 12% of our sales for the year
ended December 31, 2015 compared to 11% for the year ended December 31, 2014. The change in the ratio of
administrative expenses to revenue is largely a result of the cost structure of Peters, which is primarily a branded
business and carries higher overheads servicing a large land mass in Australia. The results for the year ended
December 31, 2015, incorporate a full year of trading results (and such administrative costs), compared to only a
six month period, post-acquisition, in the year ended December 31, 2014.
10
Finance Expenses. Finance expense consists primarily of cash interest expense on financial debt, interest rate
derivative instruments, capital lease and other financing obligations in addition to non-cash interest on loans from
our shareholders.
Income Tax Expenses. Our income tax expense includes UK and non-UK income taxes and is based on pre-tax
income or loss. The effective rate is higher than the income tax rate in our countries of operation because of the non-
deductibility of interest expense on some of our existing related party debt.
Adjusted EBITDA. Adjusted EBITDA is defined as profit/(loss) for the period before income tax (credit)
charge, net finance expenses, depreciation and amortisation, plus certain additional supplemental adjustments as
described in Note 3 to our financial statements. Adjusted EBITDA for 2013, 2014 and 2015 is stated after any
parent company or investor management charges, unless otherwise disclosed in this document. For further details
of the calculation of Adjusted EBITDA, see note 3 to our financial statements.
11
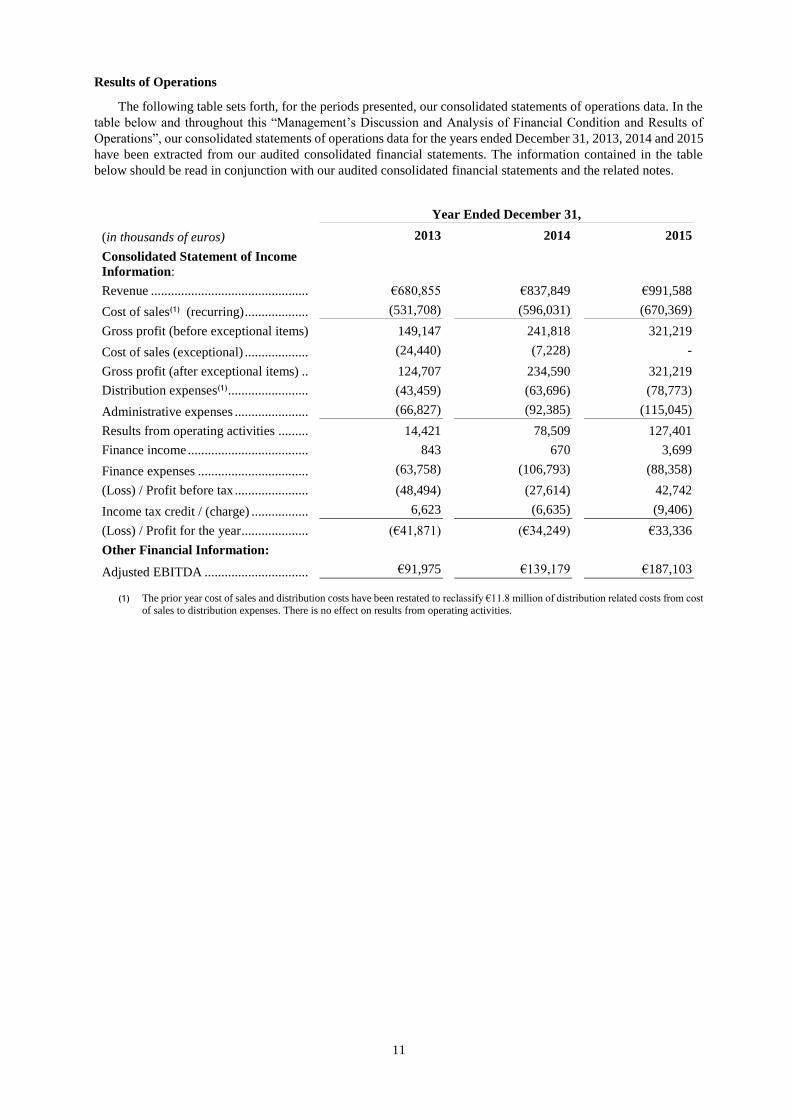
Results of Operations
The following table sets forth, for the periods presented, our consolidated statements of operations data. In the
table below and throughout this “Management’s Discussion and Analysis of Financial Condition and Results of
Operations”, our consolidated statements of operations data for the years ended December 31, 2013, 2014 and 2015
have been extracted from our audited consolidated financial statements. The information contained in the table
below should be read in conjunction with our audited consolidated financial statements and the related notes.
Year Ended December 31,
(in thousands of euros) 2013 2014 2015
Consolidated Statement of Income
Information:
Revenue ............................................... €680,855 €837,849 €991,588
Cost of sales(1) (recurring) ................... (531,708) (596,031) (670,369)
Gross profit (before exceptional items) 149,147 241,818 321,219
Cost of sales (exceptional) ................... (24,440) (7,228) -
Gross profit (after exceptional items) .. 124,707 234,590 321,219
Distribution expenses(1) ........................ (43,459) (63,696) (78,773)
Administrative expenses ...................... (66,827) (92,385) (115,045)
Results from operating activities ......... 14,421 78,509 127,401
Finance income .................................... 843 670 3,699
Finance expenses ................................. (63,758) (106,793) (88,358)
(Loss) / Profit before tax ...................... (48,494) (27,614) 42,742
Income tax credit / (charge) ................. 6,623 (6,635) (9,406)
(Loss) / Profit for the year .................... (€41,871) (€34,249) €33,336
Other Financial Information:
Adjusted EBITDA ............................... €91,975 €139,179 €187,103
(1) The prior year cost of sales and distribution costs have been restated to reclassify €11.8 million of distribution related costs from cost
of sales to distribution expenses. There is no effect on results from operating activities.
12
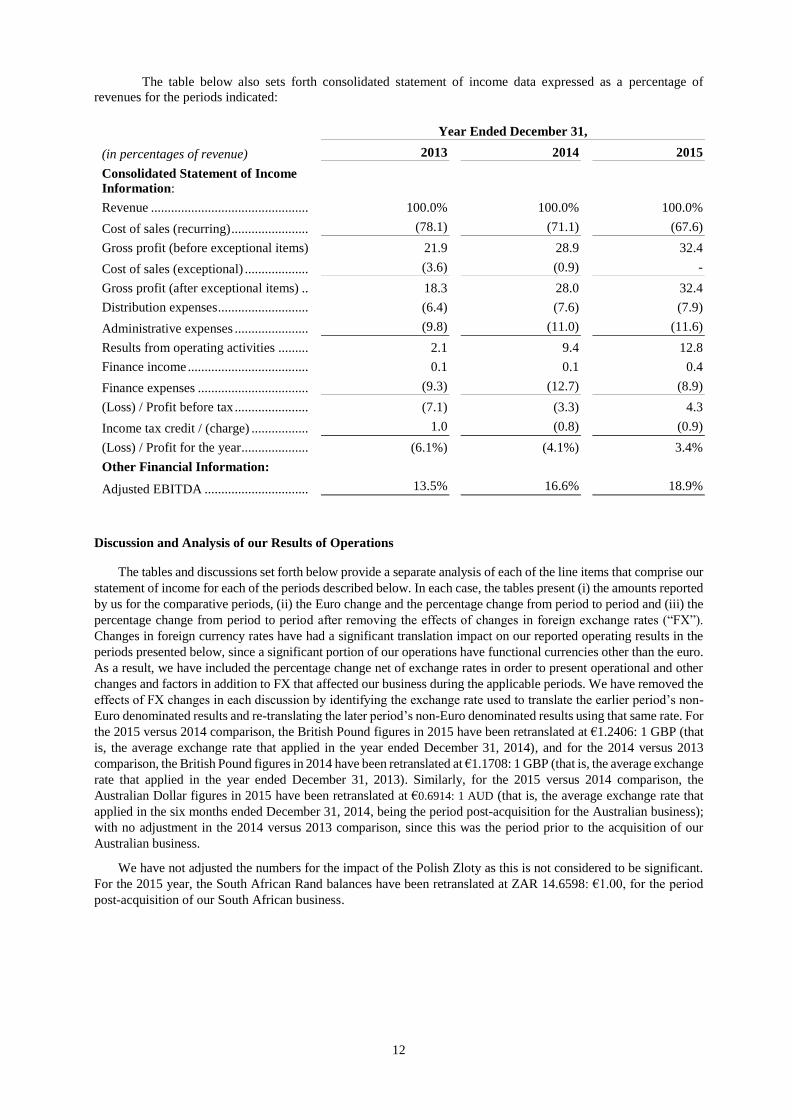
The table below also sets forth consolidated statement of income data expressed as a percentage of
revenues for the periods indicated:
Year Ended December 31,
(in percentages of revenue) 2013 2014 2015
Consolidated Statement of Income
Information:
Revenue ............................................... 100.0% 100.0% 100.0%
Cost of sales (recurring) ....................... (78.1) (71.1) (67.6)
Gross profit (before exceptional items) 21.9 28.9 32.4
Cost of sales (exceptional) ................... (3.6) (0.9) -
Gross profit (after exceptional items) .. 18.3 28.0 32.4
Distribution expenses ........................... (6.4) (7.6) (7.9)
Administrative expenses ...................... (9.8) (11.0) (11.6)
Results from operating activities ......... 2.1 9.4 12.8
Finance income .................................... 0.1 0.1 0.4
Finance expenses ................................. (9.3) (12.7) (8.9)
(Loss) / Profit before tax ...................... (7.1) (3.3) 4.3
Income tax credit / (charge) ................. 1.0 (0.8) (0.9)
(Loss) / Profit for the year .................... (6.1%) (4.1%) 3.4%
Other Financial Information:
Adjusted EBITDA ............................... 13.5% 16.6% 18.9%
Discussion and Analysis of our Results of Operations
The tables and discussions set forth below provide a separate analysis of each of the line items that comprise our
statement of income for each of the periods described below. In each case, the tables present (i) the amounts reported
by us for the comparative periods, (ii) the Euro change and the percentage change from period to period and (iii) the
percentage change from period to period after removing the effects of changes in foreign exchange rates (“FX”).
Changes in foreign currency rates have had a significant translation impact on our reported operating results in the
periods presented below, since a significant portion of our operations have functional currencies other than the euro.
As a result, we have included the percentage change net of exchange rates in order to present operational and other
changes and factors in addition to FX that affected our business during the applicable periods. We have removed the
effects of FX changes in each discussion by identifying the exchange rate used to translate the earlier period’s non-
Euro denominated results and re-translating the later period’s non-Euro denominated results using that same rate. For
the 2015 versus 2014 comparison, the British Pound figures in 2015 have been retranslated at €1.2406: 1 GBP (that
is, the average exchange rate that applied in the year ended December 31, 2014), and for the 2014 versus 2013
comparison, the British Pound figures in 2014 have been retranslated at €1.1708: 1 GBP (that is, the average exchange
rate that applied in the year ended December 31, 2013). Similarly, for the 2015 versus 2014 comparison, the
Australian Dollar figures in 2015 have been retranslated at €0.6914: 1 AUD (that is, the average exchange rate that
applied in the six months ended December 31, 2014, being the period post-acquisition for the Australian business);
with no adjustment in the 2014 versus 2013 comparison, since this was the period prior to the acquisition of our
Australian business.
We have not adjusted the numbers for the impact of the Polish Zloty as this is not considered to be significant.
For the 2015 year, the South African Rand balances have been retranslated at ZAR 14.6598: €1.00, for the period
post-acquisition of our South African business.
13
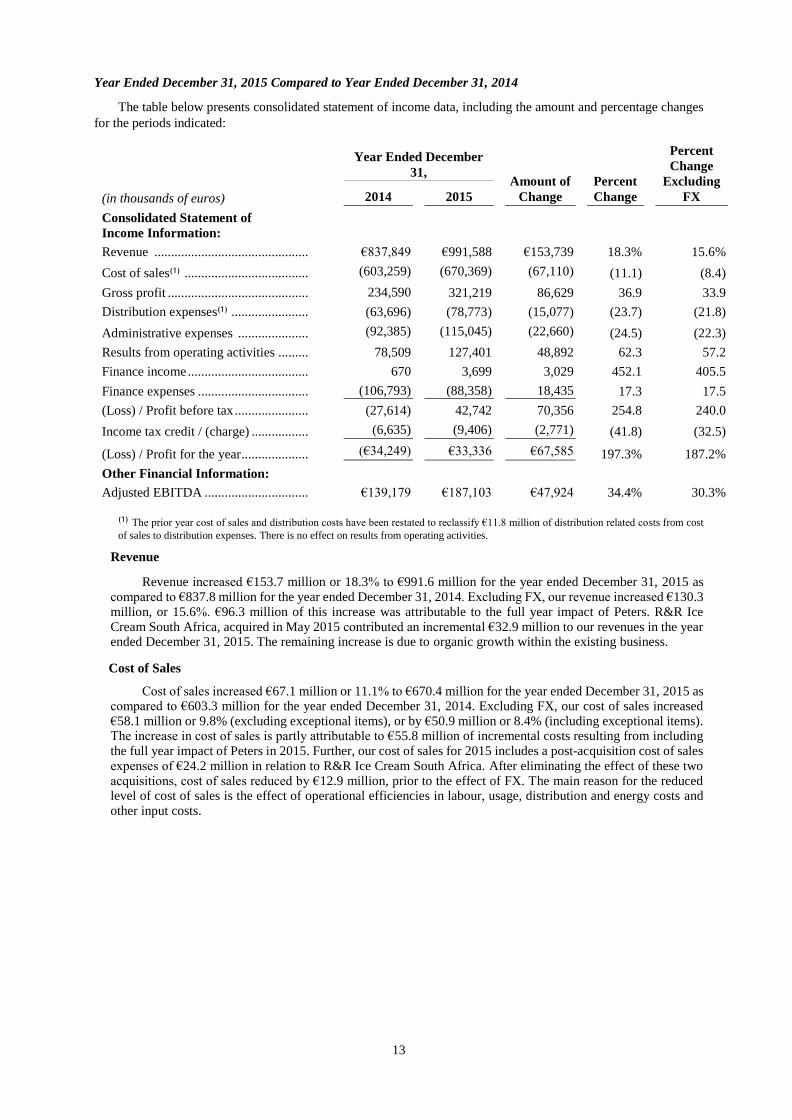
Year Ended December 31, 2015 Compared to Year Ended December 31, 2014
The table below presents consolidated statement of income data, including the amount and percentage changes
for the periods indicated:
Year Ended December
31, Amount of
Change
Percent
Change
Percent
Change
Excluding
FX (in thousands of euros) 2014 2015
Consolidated Statement of
Income Information:
Revenue .............................................. €837,849 €991,588 €153,739 18.3% 15.6%
Cost of sales(1) ..................................... (603,259) (670,369) (67,110) (11.1) (8.4)
Gross profit .......................................... 234,590 321,219 86,629 36.9 33.9
Distribution expenses(1) ....................... (63,696) (78,773) (15,077) (23.7) (21.8)
Administrative expenses ..................... (92,385) (115,045) (22,660) (24.5) (22.3)
Results from operating activities ......... 78,509 127,401 48,892 62.3 57.2
Finance income .................................... 670 3,699 3,029 452.1 405.5
Finance expenses ................................. (106,793) (88,358) 18,435 17.3 17.5
(Loss) / Profit before tax ...................... (27,614) 42,742 70,356 254.8 240.0
Income tax credit / (charge) ................. (6,635) (9,406) (2,771) (41.8) (32.5)
(Loss) / Profit for the year .................... (€34,249) €33,336 €67,585 197.3% 187.2%
Other Financial Information:
Adjusted EBITDA ............................... €139,179 €187,103 €47,924 34.4% 30.3%
(1) The prior year cost of sales and distribution costs have been restated to reclassify €11.8 million of distribution related costs from cost
of sales to distribution expenses. There is no effect on results from operating activities.
Revenue
Revenue increased €153.7 million or 18.3% to €991.6 million for the year ended December 31, 2015 as compared to €837.8 million for the year ended December 31, 2014. Excluding FX, our revenue increased €130.3 million, or 15.6%. €96.3 million of this increase was attributable to the full year impact of Peters. R&R Ice Cream South Africa, acquired in May 2015 contributed an incremental €32.9 million to our revenues in the year ended December 31, 2015. The remaining increase is due to organic growth within the existing business.
Cost of Sales
Cost of sales increased €67.1 million or 11.1% to €670.4 million for the year ended December 31, 2015 as compared to €603.3 million for the year ended December 31, 2014. Excluding FX, our cost of sales increased €58.1 million or 9.8% (excluding exceptional items), or by €50.9 million or 8.4% (including exceptional items). The increase in cost of sales is partly attributable to €55.8 million of incremental costs resulting from including the full year impact of Peters in 2015. Further, our cost of sales for 2015 includes a post-acquisition cost of sales expenses of €24.2 million in relation to R&R Ice Cream South Africa. After eliminating the effect of these two acquisitions, cost of sales reduced by €12.9 million, prior to the effect of FX. The main reason for the reduced level of cost of sales is the effect of operational efficiencies in labour, usage, distribution and energy costs and other input costs.
14
Distribution Expenses
Distribution expenses increased by €15.1 million or 23.7% to €78.8 million for the year ended December 31, 2015 as compared to €63.7 million for the year ended December 31, 2014. Excluding FX, our distribution expenses increased €13.9 million, or 21.8%. The increase is principally attributable to a €12.0 million full year effect of distribution expenses in connection with Peters in 2015 compared to six months in 2014, and to the part-year impact of the South African business in 2015, which contributed an incremental €0.2 million to our distribution expenses.
Administrative Expenses
Administrative expenses increased €22.7 million or 24.5% to €115.0 million for the year ended December 31, 2015 as compared to €92.4 million for the year ended December 31, 2014. Excluding FX, our administrative expenses increased €20.6 million, or 22.3%. As with other cost categories, the increase is principally attributable to the full year effect of €8.6 million (including exceptional items) in relation to expenses in connection with Peters in 2015 compared to six months in 2014, and to the €7.1 million part-year impact of the South African business in 2015. The remaining increase is largely due to a €7.6 million increase in the non-cash impairments and amortisation of intangible assets in 2015.
Finance Expenses
Net finance expenses decreased €21.5 million or 20.2% to €84.7 million for the year ended December 31, 2015 as compared to €106.1 million for the year ended December 31, 2014. Excluding FX, our net finance expenses decreased €21.4 million, or 20.1%. This decrease reflects the exceptional financing cost in 2014 of the group’s refinancing, offset by the negative effect of compounding interest of €2.7 million on our subordinated shareholder loans, an increase in senior secured notes interest costs of €6.7 million (being the cost of additional debt finance in the group, offset by lower interest rates after the mid-2014 refinancing), and lower net charges arising from foreign exchange and derivative instruments losses of €2.3m (non-cash items, i.e. unrealised).
Of the €84.7 million finance charges (2014: €106.1 million), €32.7 million (2014: €30.0 million) relates to non-cash interest on the subordinated shareholder loan.
Income Tax Charge
Income tax charge increased €2.8 million to a €9.4 million charge for the year ended December 31, 2015 as compared to a €6.6 million charge for the year ended December 31, 2014. Excluding FX, our income tax charge increased €2.2 million. This increase was principally due to the improvement in underlying profitability of our businesses across Europe and in Australia, the effects of one-off tax deductible costs that the group incurred in 2014 (which were not repeated in 2015) and effects of non-cash movements in deferred tax balances across the group.
Adjusted EBITDA
Adjusted EBITDA (being EBITDA after taking account of parent company and investor charges) increased €47.9 million or 34.4% to €187.1 million for the year ended December 31, 2015 as compared to €139.2 million for the year ended December 31, 2014. Excluding FX, our Adjusted EBITDA increased €42.2 million, or 30.3%. €19.6 million of this increase was attributable to the full year impact of Peters in 2015 and a further €2.3 million was attributable to the part year impact of R&R South Africa. €20.3 million was attributable to growth in the European business, excluding FX, due to earnings growth as a result of the effect of sales growth, operational efficiencies, the benefits of higher-margin NPD and change in mix towards branded ranges.
Overall, a significant factor in the higher gross margin, higher overhead levels and much increased Adjusted EBITDA margin year-on-year is the effect of Peters. The reason for this is that Peters is a predominantly branded business, which entails a higher level of marketing, advertising and promotional expense, together but with substantially higher gross margins than our European business. There is an additional expense of servicing a large land mass like Australia, which entails higher distribution costs, and its larger impulse business. However, the overall effect of Peters is significantly margin-accretive at gross margin and Adjusted EBITDA margin levels.
15
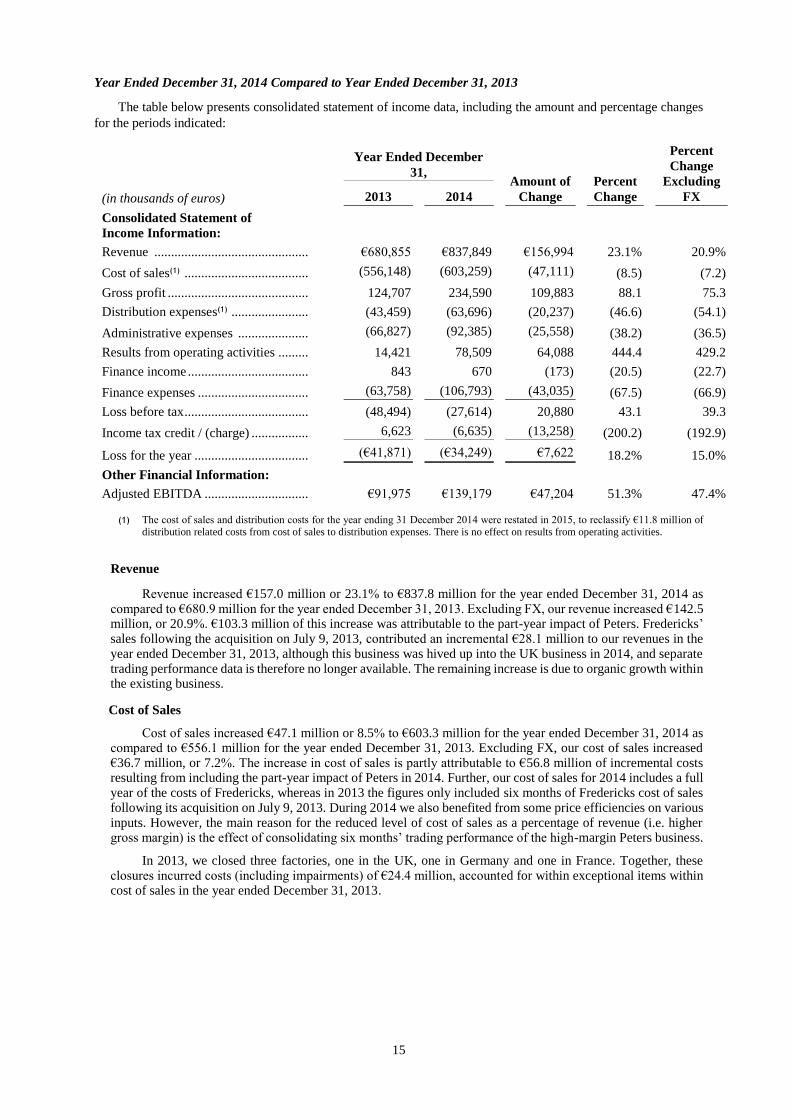
Year Ended December 31, 2014 Compared to Year Ended December 31, 2013
The table below presents consolidated statement of income data, including the amount and percentage changes
for the periods indicated:
Year Ended December
31, Amount of
Change
Percent
Change
Percent
Change
Excluding
FX (in thousands of euros) 2013 2014
Consolidated Statement of
Income Information:
Revenue .............................................. €680,855 €837,849 €156,994 23.1% 20.9%
Cost of sales(1) ..................................... (556,148) (603,259) (47,111) (8.5) (7.2)
Gross profit .......................................... 124,707 234,590 109,883 88.1 75.3
Distribution expenses(1) ....................... (43,459) (63,696) (20,237) (46.6) (54.1)
Administrative expenses ..................... (66,827) (92,385) (25,558) (38.2) (36.5)
Results from operating activities ......... 14,421 78,509 64,088 444.4 429.2
Finance income .................................... 843 670 (173) (20.5) (22.7)
Finance expenses ................................. (63,758) (106,793) (43,035) (67.5) (66.9)
Loss before tax ..................................... (48,494) (27,614) 20,880 43.1 39.3
Income tax credit / (charge) ................. 6,623 (6,635) (13,258) (200.2) (192.9)
Loss for the year .................................. (€41,871) (€34,249) €7,622 18.2% 15.0%
Other Financial Information:
Adjusted EBITDA ............................... €91,975 €139,179 €47,204 51.3% 47.4%
(1) The cost of sales and distribution costs for the year ending 31 December 2014 were restated in 2015, to reclassify €11.8 million of distribution related costs from cost of sales to distribution expenses. There is no effect on results from operating activities.
Revenue
Revenue increased €157.0 million or 23.1% to €837.8 million for the year ended December 31, 2014 as compared to €680.9 million for the year ended December 31, 2013. Excluding FX, our revenue increased €142.5 million, or 20.9%. €103.3 million of this increase was attributable to the part-year impact of Peters. Fredericks’ sales following the acquisition on July 9, 2013, contributed an incremental €28.1 million to our revenues in the year ended December 31, 2013, although this business was hived up into the UK business in 2014, and separate trading performance data is therefore no longer available. The remaining increase is due to organic growth within the existing business.
Cost of Sales
Cost of sales increased €47.1 million or 8.5% to €603.3 million for the year ended December 31, 2014 as compared to €556.1 million for the year ended December 31, 2013. Excluding FX, our cost of sales increased €36.7 million, or 7.2%. The increase in cost of sales is partly attributable to €56.8 million of incremental costs resulting from including the part-year impact of Peters in 2014. Further, our cost of sales for 2014 includes a full year of the costs of Fredericks, whereas in 2013 the figures only included six months of Fredericks cost of sales following its acquisition on July 9, 2013. During 2014 we also benefited from some price efficiencies on various inputs. However, the main reason for the reduced level of cost of sales as a percentage of revenue (i.e. higher gross margin) is the effect of consolidating six months’ trading performance of the high-margin Peters business.
In 2013, we closed three factories, one in the UK, one in Germany and one in France. Together, these closures incurred costs (including impairments) of €24.4 million, accounted for within exceptional items within cost of sales in the year ended December 31, 2013.
16
Distribution Expenses
Distribution expenses increased by €20.2 million or 46.6.% to €63.7 million for the year ended December 31, 2014 as compared to €43.5 million for the year ended December 31, 2013. Excluding FX, our distribution expenses increased €19.5 million, or 54.1%. The increase is principally attributable to a full year of distribution expenses in connection with Fredericks in 2014 compared to six months in 2013, and to the part-year impact of the Peters business in 2014, which contributed an incremental €7.8 million to our distribution expenses.
Administrative Expenses
Administrative expenses increased €25.6 million or 38.2% to €92.4 million for the year ended December 31, 2014 as compared to €66.8 million for the year ended December 31, 2013. Excluding FX, our administrative expenses increased €24.4 million, or 36.5%. As with other cost categories, the increase is principally attributable to a full year of administrative expenses in connection with Fredericks in 2014 compared to six months in 2013, and to the part-year impact of the Peters business in 2014, which contributed an incremental €25.9 million to our administrative expenses – although after excluding the effects of Peters and FX, administrative expenses are lower year-on-year.
Finance Expenses
Net finance expenses increased €43.2 million or 68.7% to €106.1 million for the year ended December 31, 2014 as compared to €62.9 million for the year ended December 31, 2013. Excluding FX, our net finance expenses increased €42.8 million, or 68.1%. This increase reflects compounding interest in the amount of €2.4 million with respect to our subordinated shareholder loans, an increase in net foreign exchange losses of €6.2m (non-cash items, i.e. unrealised), one off exceptional costs of €30.4m in relation to the refinancing of the €350 million senior secured loan notes together with additional interest costs of €8.1m from the additional debt used to support the Peters acquisition. This is all partly offset by €4.7m savings made as a result of the refinancing.
Of the €106.8 million finance charges (2013: €63.8 million), €32.7 million (2013: €29.3 million) relates to non-cash interest on the subordinated shareholder loan.
Income Tax Charge/Credit
Income tax charge increased €13.3 million to a €6.6 million charge for the year ended December 31, 2014 as compared to a €6.6 million credit for the year ended December 31, 2013. Excluding FX, our income tax charge increased €12.8 million. This increase was principally due to the improvement in underlying profitability of our businesses across Europe and, from mid-2014, in Australia, the effects of one-off tax deductible costs that the group incurred in 2013 (which were not repeated to the same extent in 2014) and effects of non-cash movements in deferred tax balances across the group. Prior year adjustments of €2.6 million relate to the finalisation of UK payments for group relief to intermediate parent undertakings outside of the R&R Ice Cream plc group.
Adjusted EBITDA
Adjusted EBITDA (after taking account of parent company and investor charges) increased €47.2 million or 51.3% to €139.2 million for the year ended December 31, 2014 as compared to €92.0 million for the year ended December 31, 2013. Excluding FX, our Adjusted EBITDA increased €43.6 million, or 47.4%. €22.5 million of this increase was attributable to the full year impact of Peters in 2014 and a further €3.3 million was attributable to the full year impact of Fredericks. A further €2.2 million results from the organic sales growth with the remaining increase being as a result of cost savings with the significant savings being made from the closure of three factories in 2013 and input price efficiencies, especially on dairy related products and some promotional gains.
Overall, a significant factor in the higher gross margin, higher overhead levels and much increased Adjusted EBITDA margin year-on-year is the effect of Peters. The reason for this is that Peters is a predominantly branded business, which entails a higher level of marketing, advertising and promotional expense, together but with substantially higher gross margins than our European business. There is an additional expense of servicing a large land mass like Australia, which entails higher distribution costs, and its larger impulse business. However, the overall effect of Peters is significantly margin-accretive at gross margin and Adjusted EBITDA margin levels.
17
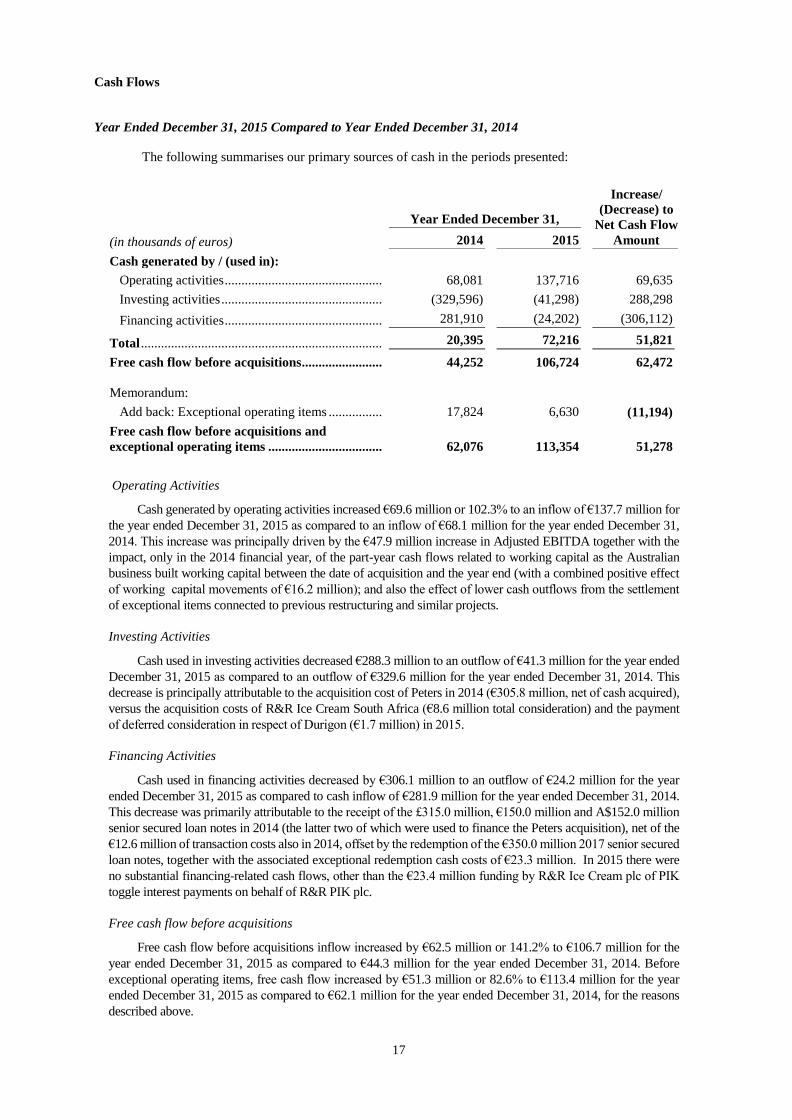
Cash Flows
Year Ended December 31, 2015 Compared to Year Ended December 31, 2014
The following summarises our primary sources of cash in the periods presented:
Year Ended December 31,
Increase/
(Decrease) to
Net Cash Flow
Amount (in thousands of euros) 2014 2015
Cash generated by / (used in):
Operating activities ............................................... 68,081 137,716 69,635
Investing activities ................................................ (329,596) (41,298) 288,298
Financing activities ............................................... 281,910 (24,202) (306,112)
Total ........................................................................ 20,395 72,216 51,821
Free cash flow before acquisitions........................ 44,252 106,724 62,472
Memorandum:
Add back: Exceptional operating items ................ 17,824 6,630 (11,194)
Free cash flow before acquisitions and
exceptional operating items .................................. 62,076 113,354 51,278
Operating Activities
Cash generated by operating activities increased €69.6 million or 102.3% to an inflow of €137.7 million for
the year ended December 31, 2015 as compared to an inflow of €68.1 million for the year ended December 31,
2014. This increase was principally driven by the €47.9 million increase in Adjusted EBITDA together with the
impact, only in the 2014 financial year, of the part-year cash flows related to working capital as the Australian
business built working capital between the date of acquisition and the year end (with a combined positive effect
of working capital movements of €16.2 million); and also the effect of lower cash outflows from the settlement
of exceptional items connected to previous restructuring and similar projects.
Investing Activities
Cash used in investing activities decreased €288.3 million to an outflow of €41.3 million for the year ended
December 31, 2015 as compared to an outflow of €329.6 million for the year ended December 31, 2014. This
decrease is principally attributable to the acquisition cost of Peters in 2014 (€305.8 million, net of cash acquired),
versus the acquisition costs of R&R Ice Cream South Africa (€8.6 million total consideration) and the payment
of deferred consideration in respect of Durigon (€1.7 million) in 2015.
Financing Activities
Cash used in financing activities decreased by €306.1 million to an outflow of €24.2 million for the year
ended December 31, 2015 as compared to cash inflow of €281.9 million for the year ended December 31, 2014.
This decrease was primarily attributable to the receipt of the £315.0 million, €150.0 million and A$152.0 million
senior secured loan notes in 2014 (the latter two of which were used to finance the Peters acquisition), net of the
€12.6 million of transaction costs also in 2014, offset by the redemption of the €350.0 million 2017 senior secured
loan notes, together with the associated exceptional redemption cash costs of €23.3 million. In 2015 there were
no substantial financing-related cash flows, other than the €23.4 million funding by R&R Ice Cream plc of PIK
toggle interest payments on behalf of R&R PIK plc.
Free cash flow before acquisitions
Free cash flow before acquisitions inflow increased by €62.5 million or 141.2% to €106.7 million for the
year ended December 31, 2015 as compared to €44.3 million for the year ended December 31, 2014. Before
exceptional operating items, free cash flow increased by €51.3 million or 82.6% to €113.4 million for the year
ended December 31, 2015 as compared to €62.1 million for the year ended December 31, 2014, for the reasons
described above.
18
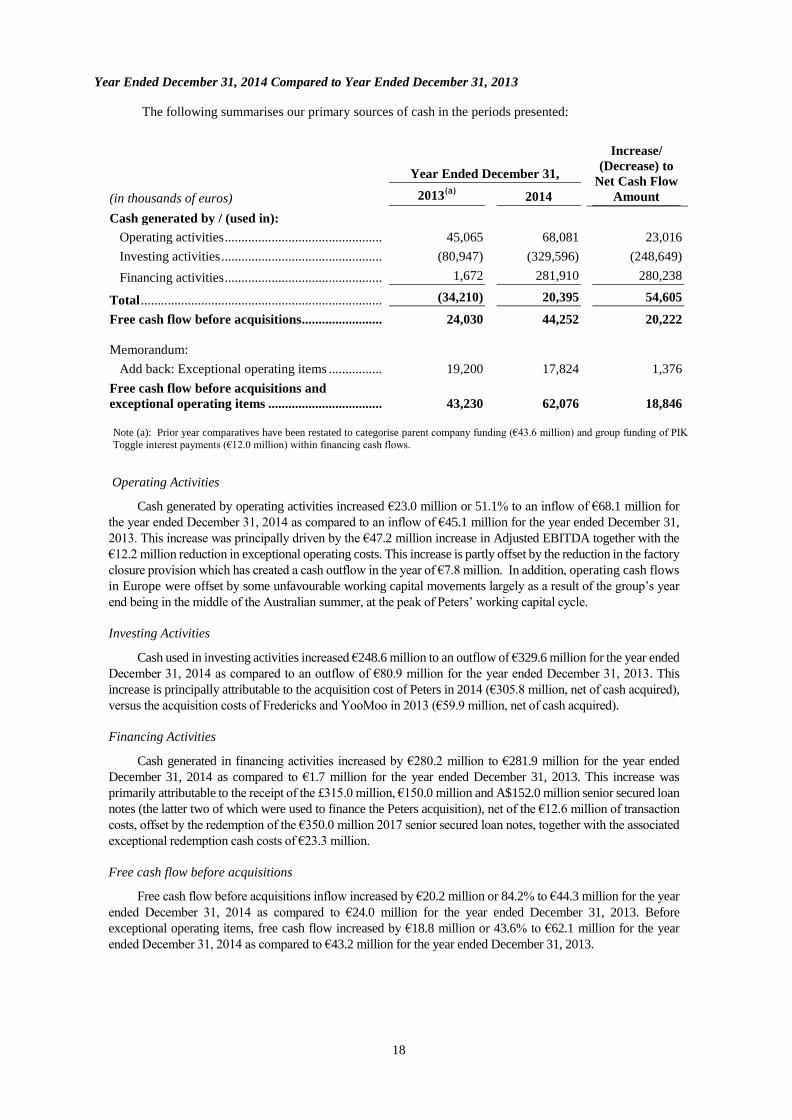
Year Ended December 31, 2014 Compared to Year Ended December 31, 2013
The following summarises our primary sources of cash in the periods presented:
Year Ended December 31,
Increase/
(Decrease) to
Net Cash Flow
Amount (in thousands of euros) 2013(a)
2014
Cash generated by / (used in):
Operating activities ............................................... 45,065 68,081 23,016
Investing activities ................................................ (80,947) (329,596) (248,649)
Financing activities ............................................... 1,672 281,910 280,238
Total ........................................................................ (34,210) 20,395 54,605
Free cash flow before acquisitions........................ 24,030 44,252 20,222
Memorandum:
Add back: Exceptional operating items ................ 19,200 17,824 1,376
Free cash flow before acquisitions and
exceptional operating items .................................. 43,230 62,076 18,846
Note (a): Prior year comparatives have been restated to categorise parent company funding (€43.6 million) and group funding of PIK
Toggle interest payments (€12.0 million) within financing cash flows.
Operating Activities
Cash generated by operating activities increased €23.0 million or 51.1% to an inflow of €68.1 million for
the year ended December 31, 2014 as compared to an inflow of €45.1 million for the year ended December 31,
2013. This increase was principally driven by the €47.2 million increase in Adjusted EBITDA together with the
€12.2 million reduction in exceptional operating costs. This increase is partly offset by the reduction in the factory
closure provision which has created a cash outflow in the year of €7.8 million. In addition, operating cash flows
in Europe were offset by some unfavourable working capital movements largely as a result of the group’s year
end being in the middle of the Australian summer, at the peak of Peters’ working capital cycle.
Investing Activities
Cash used in investing activities increased €248.6 million to an outflow of €329.6 million for the year ended
December 31, 2014 as compared to an outflow of €80.9 million for the year ended December 31, 2013. This
increase is principally attributable to the acquisition cost of Peters in 2014 (€305.8 million, net of cash acquired),
versus the acquisition costs of Fredericks and YooMoo in 2013 (€59.9 million, net of cash acquired).
Financing Activities
Cash generated in financing activities increased by €280.2 million to €281.9 million for the year ended
December 31, 2014 as compared to €1.7 million for the year ended December 31, 2013. This increase was
primarily attributable to the receipt of the £315.0 million, €150.0 million and A$152.0 million senior secured loan
notes (the latter two of which were used to finance the Peters acquisition), net of the €12.6 million of transaction
costs, offset by the redemption of the €350.0 million 2017 senior secured loan notes, together with the associated
exceptional redemption cash costs of €23.3 million.
Free cash flow before acquisitions
Free cash flow before acquisitions inflow increased by €20.2 million or 84.2% to €44.3 million for the year
ended December 31, 2014 as compared to €24.0 million for the year ended December 31, 2013. Before
exceptional operating items, free cash flow increased by €18.8 million or 43.6% to €62.1 million for the year
ended December 31, 2014 as compared to €43.2 million for the year ended December 31, 2013.
19
Capital Expenditure
We continually undertake capital expenditure projects in order to increase our production capacity, facilitate
new product innovation, generate manufacturing efficiencies and consolidate production capabilities.
Capital expenditure in the UK in 2015 has focused on further development of the Leeming Bar site following
on from significant investments in the preceding three years to allow for the consolidation of production following
the closure of the Crossgates site in 2014. The Skelmersdale factory has also had significant capital expenditure in
2015 both in terms of land, with the purchase of the site where the factory is located, and in terms of plant and
machinery to improve operational efficiencies, most of which benefit will be generated in 2016.
In France, our recent capital expenditure programs have focused on developing our factories in Plouédern,
Brittany and Vayres, Bordeaux, to generate production efficiencies and reduce labour costs. Also significant
investment in France has been incurred to allow for local production capability of the branded Mondelēz products
which has reduced the French intercompany production requirements, lowered cost of sales and generated improved
customer service levels for this product range. As well as the Mondelēz investment, we have also undertaken
significant capital expenditure projects in all French factories to generate operational improvements. This has
resulted in year-on-year direct labour cost reductions.
In Germany, we have focused our capital expenditure on both cost reduction programmes and investment in
production capabilities that have facilitated new product innovations. Following on from the success of a combined
heat and power plant investment in the UK, a similar investment has been made in Germany. This investment will
span two years, with the first benefits expected in mid-2016. Also increased investment in packing automations will
drive further cost reductions in 2016.
In Poland, we have continued the expansion of the factory in Mielec, by significantly investing in a new
extruded stick line facility which will alleviate capacity issues for the group as well as supporting the fast growing
Mondelēz sticks market. We continue to make capital investment in respect of freezers and cabinets to support the
growth of our Zielona Budka brand and also help develop the Mondelēz brand in the local market.
In Italy, our main investment has been to develop our IT infrastructure with the installation of the newly
developed JD Edwards platform and the associated factory performance systems, which have resulted in significant
factory benefits in terms of quality, traceability and stock planning as well as generating other back office
improvements. As with Germany, Italy has also had first stage investment in a combined heat and power plant.
In Australia, the majority of capital investment for the period has been into the impulse business with the on-
going replacement of freezer assets and distribution vehicles. Minor upgrades have also occurred across the
manufacturing facility together with IT improvements and replacements. Early capital expenditure investments
have also been made in terms of an office relocation and new product pilot investment.
Liquidity Arrangements
Our principal uses of cash have been to finance working capital, capital expenditure, debt servicing and
acquisitions. Our principal sources of liquidity have been net cash provided by operating activities and borrowings
under revolving credit facilities and factoring facilities and unsecured subordinated loans from our parent entities.
We anticipate that we will continue to use cash provided by operating activities and borrowings under the Revolving
Credit Facility and factoring facilities to finance our operations, and that this will allow us to meet our needs with
respect to investment activities, manage our working capital and repay debt on its scheduled maturity dates.
Credit Facilities in Place
Note: definitions used herein are drawn from the senior secured notes indenture and/or offering memoranda.
Revolving Facility Agreement
The Issuer, the Existing Notes Guarantors, the other companies named therein, Barclays Bank PLC, Credit Suisse
International and HSBC Bank plc, as mandated lead arrangers, the financial institutions named therein, as original
lenders, Barclays Bank PLC, as agent and security trustee, and Barclays Bank PLC and HSBC Bank plc, as issuing
banks, have entered into the Revolving Facility Agreement. Our Revolving Credit Facility provides for borrowings up
to €60.0 million on a committed basis but will allow for borrowings of a further €15.0 million on an uncommitted
basis. Of the €60.0 million currently committed, €17.6 million is committed as ancillary facilities, €13.9 million in the
form of overdrafts and €3.7 million in the form of various guarantee facilities (including €2.2 million in relation to a
guarantee of the rental contract for our Australian property). Loans may be borrowed, repaid and reborrowed at any
time. Borrowings under the Revolving Credit Facility accrue interest at EURIBOR, LIBOR or WIBOR plus a
margin of 3.00% per annum. Under its current terms, the Revolving Credit Facility will mature on March 15, 2020.
20
Subordinated Shareholder Funding Instrument
Prior to completion of the offering of the senior secured notes in 2010, in connection with the novation of
shareholder funding instruments to a parent entity, the Issuer entered into a subordinated shareholder funding
instrument with its direct parent. The subordinated shareholder funding instrument bears interest at a fixed rate
payable to the extent, among other things, of the Issuer’s interest income, dividends and capital gains received by the
Issuer from its investments, less interest payable on the Existing Senior Secured Notes. The interest is payable in
cash at our option (but if interest is not paid, it is accrued and carried forward). The subordinated shareholder funding
instrument will mature in November 2110, and no mandatory put or call rights or mandatory redemption features are
applicable prior to maturity. Obligations under the subordinated shareholder funding instrument are subordinated to
all other debt obligations of the Issuer. If the Issuer cannot make the required payment upon maturity, or if the
instrument cannot be redeemed at par, the maturity date will extend until payment or redemption at par can be
achieved without breaching the applicable payment or redemption restrictions and conditions. As at December 31,
2015, we have €398.8 million in aggregate principal amount and accrued interest outstanding under the subordinated
shareholder funding instrument. No cash interest on this loan was paid in 2015.
Existing Factoring Facilities
Rolland entered into a €30.0 million (for the period April to September) and €15.0 million (for the period
October to March) non-recourse invoice discounting agreement with HSBC Factoring (France) SA on May 4,
2012 (the “French Factoring Agreement”). HSBC Factoring (France) SA may terminate the agreement in the event
of a change of control of Rolland, including an indirect change of control of our Group. The French Factoring
Agreement was renewed for a further two years, until May 2017, and will be renewed automatically on the same
terms for another two years unless either party gives three months’ prior written notice to terminate prior to
renewal. The minimum service fee over the two year contract is €284,200 (i.e. €142,100 per annum).
On March 30, 2012, R&R Ice Cream UK Limited entered into a non-recourse receivables financing agreement
with Barclays Bank PLC with a facility limit of up to £27.5 million. The facility was renewed such that it expires
on May 31, 2016, and may be terminated early by R&R Ice Cream UK Limited on six months’ written notice. We
have recently agreed with Barclays Bank PLC to renew the facility to 31 May 2018, with an amended facility limit
of up to £22.0 million, to better match the UK business’ funding requirements.
On February 4, 2014, R&R Ice Cream Deutschland GmbH entered into a non-recourse factoring agreement with
HSBC Trinkaus & Burkhardt AG (the “German Factoring Agreement”) with a facility limit of up to €25.0 million
(for the period from April to September) and €15.0 million (for the period from October to March). The facility
carried a maturity date of July 31, 2015, and therefore has subsequently been renewed on a rolling basis: that is, the
contract has been extended by one year, provided that neither party terminates the agreement (with a prior notice
period of three months).
On October 16, 2015, Australian Food Group Pty Ltd (“AFG”) entered into a non-recourse debtor finance
facility with HSBC Bank Australia Limited with a facility limit of A$20.0 million (with a reduced seasonal limit of
A$10.0 million for the off-peak season from March to September). The facility matures on 30 September 2016
unless a termination or default event occurs earlier. AFG also entered into a guarantee facility on 16 October 2015
with a limit of A$6.05 million, which has subsequently been increased to A$7.0 million. The facility is repayable
on demand and cancellable at any time. Instruments issued under the facility have a maximum tenor of 5 years.
Peters’ Finance Lease
Peters has A$21.0 million of debt outstanding as of December 31, 2015, in connection with a finance lease
relating to the Mulgrave property. This is a “development lease” dated 24 January 2015 with The Trust Company
(Australia) Limited as trustee for the CLP Mulgrave Trust (the “Landlord”). Pursuant to the terms of the lease, the
Landlord is required to design and construct a new office building at 254-294 Wellington Road, Mulgrave in Victoria
(“Mulgrave Site”) for Peters. Upon completion of construction of the new office building (“Mulgrave Office
Premises”), Peters is required to take a lease of the whole of the premises for a term which will expire on 23 January
2034. The rent payable in the first year of the lease will be the greater of 10% of all costs and expenses incurred by
the Landlord in the design and construction of the base building of the Mulgrave Office Premises and approximately
AUD 800,000. The annual rent will increase by 3.5% on 24 January of each year of the lease term. This lease is
treated as a finance lease for accounting purposes.
Contractual Obligations and Commercial Commitments
The following table represents the principal payments associated with our debt and other contractual obligations
as of December 31, 2015. The actual amount that we may be required to repay on our Revolving Credit Facility may
be different, including as a result of additional borrowings under that facility. Amounts shown in the table below that
represent obligations and commitments not denominated in Euro have been presented based on their Euro equivalent,
21
based on the exchange rates prevailing on December 31, 2015.
Payments Due By Period
Less than
More
than
(in thousands of euros) Total 1 Year 1-5 Years 5 Years
Long term cash pay debt obligations(1) .............. 855,032 39,028 816,004 -
Finance lease obligations(2) ................................ 33,015 1,767 6,812 24,436
Other financial liabilities(3) ................................ 1,053 - - 1,053
Purchase commitments(4) ................................... 6,635 6,635
Total .................................................................. 895,735 47,430 822,816 25,489
(1) Represents the Euro equivalent of £315.0 million, AUD 152.0 million and Euro 150.0 million of principal
payments on the Notes and assumes that our Revolving Credit Facility remains undrawn. For further detail, see
note 20 to our audited financial statements for the year ended December 31, 2015.
(2) Consists of payments under finance leases for various property, plant and equipment, including the finance
lease on the Australian property. For further detail, see note 21 to our audited financial statements for the year
ended December 31, 2015.
(3) Represents payments under an operating lease for land in Australia. For further detail, see note 26 to our audited
financial statements for the year ended December 31, 2015.
(4) Consists of obligations to purchase goods or services, primarily fixed assets, which are enforceable and legally
binding. Excludes purchase orders made in the ordinary course of business that are short-term or cancellable.
For further detail, see note 25 to our audited financial statements for the year ended December 31, 2015.
Off Balance Sheet Arrangements
As of December 31, 2015 we did not have any material off balance sheet obligations other than those operating
lease and purchase obligations identified above.
Inflation
We believe inflation has not had a material effect on our financial condition or results of operations in recent
years. However, there can be no assurance that we will not be affected by inflation in the future.
Critical Accounting Policies and Estimates
Our discussion and analysis of results of operations and financial condition are based upon our audited financial
statements. These audited financial statements have been prepared in accordance with IFRS as applied in the
European Union. The preparation of these financial statements requires us to make estimates and judgments that
affect the amounts reported in those financial statements. On an ongoing basis, we evaluate estimates. We base our
estimates on historical experiences and assumptions believed to be reasonable under the circumstances. Those
estimates form the basis for our judgments that affect the amounts reported in the financial statements. Actual results
could differ from our estimates under different assumptions or conditions.
Estimates are in particular required in the following cases:
the determination of the necessity and measurement of impairment losses on intangible assets, items of
property, plant and equipment and inventories;
the measurement of fair value of assets and liabilities acquired as part of business combinations;
the outstanding liability owed, at the balance sheet date, in respect of volume pricing rebates owed to
customers;
the measurement and recognition of current and deferred tax assets and provisions; and
the recognition and measurement of pension obligations and anniversary bonuses.
Our significant accounting policies, which may be affected by our estimates and assumptions, are described in
the Accounting Policies section of our consolidated financial statements for the year ended December 31, 2015.
22
Determination of Fair Values
A number of the Group’s accounting policies and disclosures require the determination of fair value, for both
financial and non-financial assets and liabilities. Fair values have been determined for measurement and/or disclosure
purposes based on the following methods. The fair value of property, plant and equipment recognised as a result of
a business combination is based on market values. The market value of property is the estimated amount for which a
property could be exchanged on the date of valuation between a willing buyer and a willing seller in an arm’s length
transaction after proper marketing wherein the parties had each acted knowledgeably, prudently and without
compulsion. The market value of items of plant and equipment is based on the quoted market prices for similar items
or depreciated replacement cost where quoted market prices are not available.
The fair value of intangible assets is calculated using methods which reflect the value that the Group would
have paid for the assets in an arm’s length transaction. Such methods include where appropriate, discounting
estimated future net cash flows from the asset and applying multiples to royalty streams that could be obtained by
licensing the intangible asset.
The fair value of inventories acquired in a business combination is determined based on its estimated selling
price in the ordinary course of business less the estimated costs of completion and sale, and a reasonable profit
margin based on the effort required to complete and sell the inventory.
The fair value of trade and other receivables is estimated as the present value of the amounts to be received,
determined at appropriate interest rates less allowance for bad debts. Discounting has not been applied to current
receivables.
The fair value of interest rate and foreign exchange derivatives is the estimated amount that the Group would
receive or pay to terminate the derivative at the balance sheet date, taking into account current interest rates and the
current creditworthiness of the derivative counterparties.
The fair value of trade and other payables is estimated as the present value of the amounts to be paid, determined
at appropriate interest rates. Discounting has not been applied to current payables.
Qualitative and Quantitative Disclosures About Market Risk
Our operations are exposed to market risks primarily as a result of changes in prices of our raw materials and
changes in interest and foreign currency exchange rates. Derivatives that we use are primarily foreign currency
forward contracts. Our derivative activities are subject to the management, direction, and control of our senior
financial officers. Risk management practices, including the use of financial derivative instruments, are presented
to the board of directors of the Issuer at least annually.
We perform a sensitivity analysis to determine the effects that market risk exposures may have on our debt and
other financial instruments. Information provided by the sensitivity analysis does not necessarily represent the
actual changes in fair value that would be incurred under normal market conditions because, due to practical
limitations, all variables other than the specific market risk factor are held constant.
Commodity Risk
We require substantial amounts of raw materials in our operations, including cream, milk, whey protein, sugar,
glucose, cocoa, butter, coconut oil and palm oil. We are exposed to commodity price and supply risks with respect
to these raw materials. In addition, we are exposed to fluctuations in the price of energy (primarily electricity and
natural gas), the cost of freight, which is impacted by fluctuations in the price of oil, and the cost of other
components that we use in our manufacturing process, such as plastic which is impacted by a number of commodity
prices and fluctuations of the U.S. dollar. To the extent we are not able to leverage our purchasing power in the
future as successfully as we have in the past, we may not be able to increase the selling price of our products to
reflect increases in the costs of raw materials, or if we experience any interruptions or shortages in the supply of
raw materials, our operating margins could be adversely affected. We seek to mitigate the effects of increased costs
by entering into fixed price contracts and by implementing increases in our prices when possible.
We manage supply risks by consolidating our purchases among a select group of suppliers and through provisions
in sales agreements that allow for certain increases in raw material costs to be passed through to our customers.
However, an interruption in the ability of these suppliers to provide raw materials could have a material adverse effect
on our financial position, results of operations and cash flows. The availability and price of raw materials may also be
subject to shortages in supply, suppliers’ allocations to other purchasers, interruptions in production by suppliers,
changes in exchange rates, global demand and worldwide price levels.
23
Credit Risk
Our management has a credit policy in place and the exposure to credit risk is monitored on an ongoing basis.
Credit evaluations are performed on all customers requiring credit over a certain amount. The Group does not
require collateral in respect of financial assets.
At December 31, 2015, there were no significant concentrations of credit risk. The maximum exposure to credit
risk is represented by the carrying amount of each financial asset, including derivatives on the balance sheet.
Interest Rate Risk
Following our May 2014 and June 2014 refinancing’s, the majority of our debt obligations bear interest at a
fixed rate. Consequently, we have no significant direct exposure to interest rate fluctuations. We use short-term
borrowings to fund our business through peak periods of working capital needs. We borrow such loans at floating
interest rate fluctuations. Our exposure to interest rates resulting from such borrowings is not significant. Our short-
term receivables and payables are not exposed to interest rate risk. Our cash at bank earns interest at floating rates
based on market rates.
Foreign Currency Risk
We are exposed to foreign currency risk on our sales, purchases and borrowings that are denominated in a
currency other than the respective functional currencies of our entities. The currencies giving rise to these risks are
primarily the British Pound, Australian Dollar, Polish Zloty and the South African Rand.
The UK and Australian businesses also typically uses contracts to mitigate foreign currency exposure on
trading. At the 2015 year end, there were 36 such contracts outstanding (2014: 11 contracts). The Directors believe
that the foreign exchange exposure in this regard does not present a material risk. The net fair value of these
contracts at 31 December 2015 was an asset of €0.4 million (2014: liability of €0.4 million).
A movement of +/- 10% in the GBP: EUR exchange rate, with all other variables held constant would result in
a €15.5 million (2014: €19.5 million) movement in the group’s results and a €19.4 million (2014: €21.9 million)
movement in the group’s equity. A movement of +/- 10% in the A$: EUR exchange rate, with all other variables
held constant would result in a €2.5 million (2014: €1.1 million) movement in the group’s results and a €3.5 million
(2014: €1.9 million) movement in the group’s equity.
94% of the UK business’s forecast 2016 Euro trading requirement is hedged (2014: 95% of the UK business’s
2015 Euro trading requirement). 97% of the Australian business’s forecast Euro trading requirement up to 30 June
2016 is hedged (2014: 65% up to 30 June 2015), with 56% hedged beyond that date as at 31 December 2015 (2014:
nil% up to 31 December 2015), with an overall hedged position of 73% of the Euro requirement to 31 December
2016.
Capital Management
One of the group’s objectives is to safeguard its ability to continue as a going concern providing returns to
shareholders, through the optimisation of the debt and equity balance, and to maintain a strong credit rating and
headroom. The group manages its capital structure and makes appropriate decisions in light of the current economic
conditions and strategic objectives of the group.
The group’s capital comprises equity and long-term debt. The equity comprises fully paid up ordinary shares
and the long-term debt comprises subordinated shareholder loans, the senior secured notes and finance leases. Intra-
year funding requirements are managed through cash, revolving credit facilities and factoring facilities.
The refinancing in 2014 allowed the group to better match EBITDA and cash flows to its borrowings and debt
service obligations, in particular to provide a natural hedge in respect of potential foreign exchange movements.
The group’s policy is to budget sufficient headroom in order to maintain compliance with the covenant set out
in the revolving credit facility agreement such that any unforeseen circumstances are unlikely to result in a breach
of that covenant. Throughout the year, the group has comfortably complied with this policy.
There has been no change in the objectives, policies or processes in respect of capital management during the
years ended 31 December 2015 and 31 December 2014.
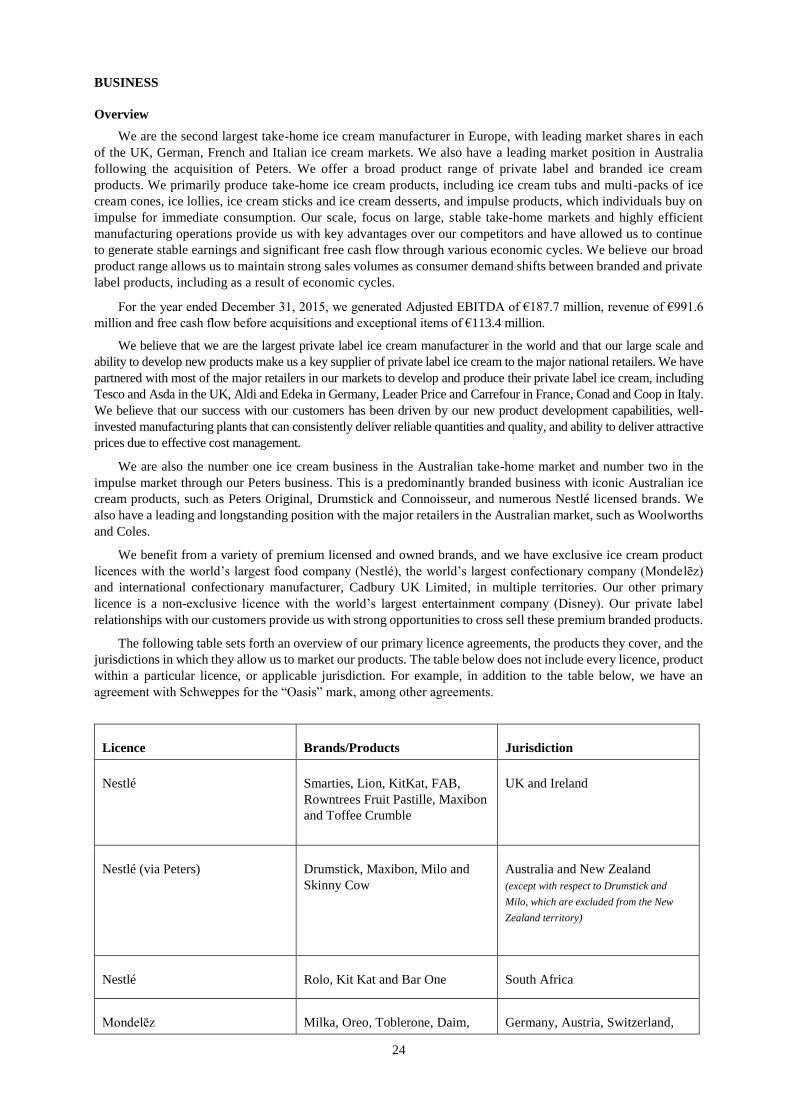
24
BUSINESS
Overview
We are the second largest take-home ice cream manufacturer in Europe, with leading market shares in each
of the UK, German, French and Italian ice cream markets. We also have a leading market position in Australia
following the acquisition of Peters. We offer a broad product range of private label and branded ice cream
products. We primarily produce take-home ice cream products, including ice cream tubs and multi-packs of ice
cream cones, ice lollies, ice cream sticks and ice cream desserts, and impulse products, which individuals buy on
impulse for immediate consumption. Our scale, focus on large, stable take-home markets and highly efficient
manufacturing operations provide us with key advantages over our competitors and have allowed us to continue
to generate stable earnings and significant free cash flow through various economic cycles. We believe our broad
product range allows us to maintain strong sales volumes as consumer demand shifts between branded and private
label products, including as a result of economic cycles.
For the year ended December 31, 2015, we generated Adjusted EBITDA of €187.7 million, revenue of €991.6
million and free cash flow before acquisitions and exceptional items of €113.4 million.
We believe that we are the largest private label ice cream manufacturer in the world and that our large scale and
ability to develop new products make us a key supplier of private label ice cream to the major national retailers. We have
partnered with most of the major retailers in our markets to develop and produce their private label ice cream, including
Tesco and Asda in the UK, Aldi and Edeka in Germany, Leader Price and Carrefour in France, Conad and Coop in Italy.
We believe that our success with our customers has been driven by our new product development capabilities, well-
invested manufacturing plants that can consistently deliver reliable quantities and quality, and ability to deliver attractive
prices due to effective cost management.
We are also the number one ice cream business in the Australian take-home market and number two in the
impulse market through our Peters business. This is a predominantly branded business with iconic Australian ice
cream products, such as Peters Original, Drumstick and Connoisseur, and numerous Nestlé licensed brands. We
also have a leading and longstanding position with the major retailers in the Australian market, such as Woolworths
and Coles.
We benefit from a variety of premium licensed and owned brands, and we have exclusive ice cream product
licences with the world’s largest food company (Nestlé), the world’s largest confectionary company (Mondelēz)
and international confectionary manufacturer, Cadbury UK Limited, in multiple territories. Our other primary
licence is a non-exclusive licence with the world’s largest entertainment company (Disney). Our private label
relationships with our customers provide us with strong opportunities to cross sell these premium branded products.
The following table sets forth an overview of our primary licence agreements, the products they cover, and the
jurisdictions in which they allow us to market our products. The table below does not include every licence, product
within a particular licence, or applicable jurisdiction. For example, in addition to the table below, we have an
agreement with Schweppes for the “Oasis” mark, among other agreements.
Licence Brands/Products Jurisdiction
Nestlé Smarties, Lion, KitKat, FAB,
Rowntrees Fruit Pastille, Maxibon
and Toffee Crumble
UK and Ireland
Nestlé (via Peters) Drumstick, Maxibon, Milo and
Skinny Cow
Australia and New Zealand
(except with respect to Drumstick and
Milo, which are excluded from the New
Zealand territory)
Nestlé Rolo, Kit Kat and Bar One South Africa
Mondelēz Milka, Oreo, Toblerone, Daim, Germany, Austria, Switzerland,
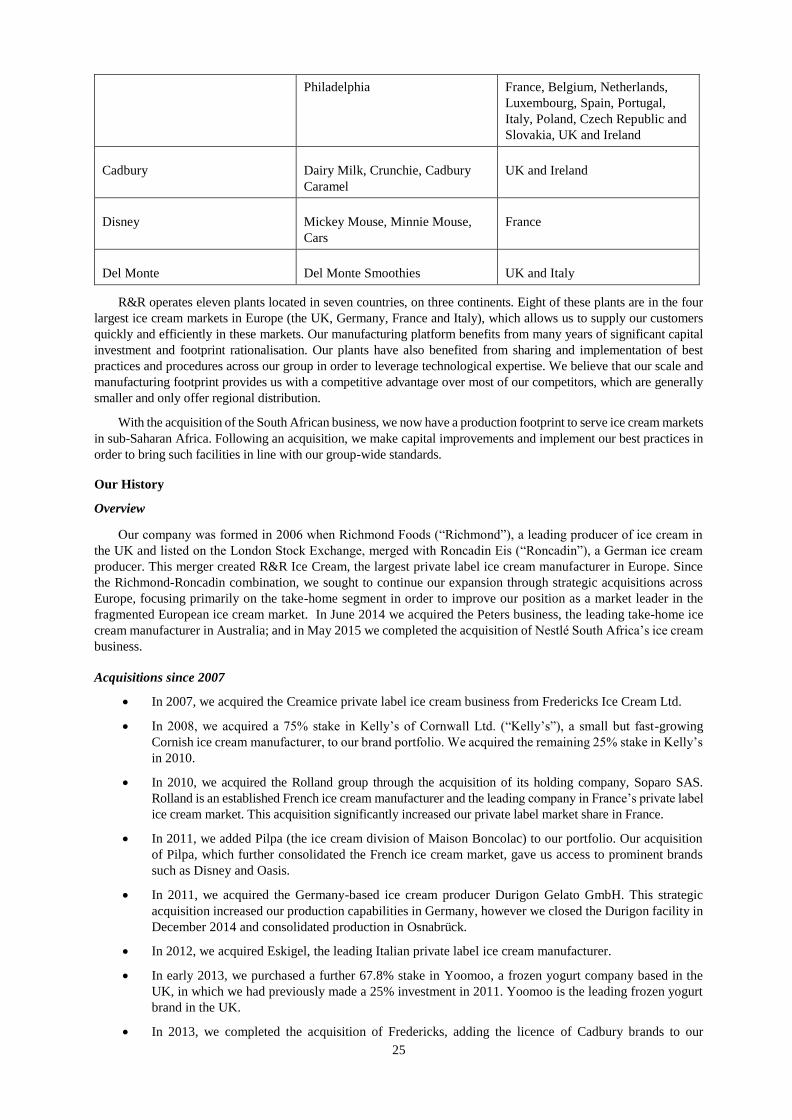
25
Philadelphia France, Belgium, Netherlands,
Luxembourg, Spain, Portugal,
Italy, Poland, Czech Republic and
Slovakia, UK and Ireland
Cadbury Dairy Milk, Crunchie, Cadbury
Caramel
UK and Ireland
Disney Mickey Mouse, Minnie Mouse,
Cars
France
Del Monte Del Monte Smoothies UK and Italy
R&R operates eleven plants located in seven countries, on three continents. Eight of these plants are in the four
largest ice cream markets in Europe (the UK, Germany, France and Italy), which allows us to supply our customers
quickly and efficiently in these markets. Our manufacturing platform benefits from many years of significant capital
investment and footprint rationalisation. Our plants have also benefited from sharing and implementation of best
practices and procedures across our group in order to leverage technological expertise. We believe that our scale and
manufacturing footprint provides us with a competitive advantage over most of our competitors, which are generally
smaller and only offer regional distribution.
With the acquisition of the South African business, we now have a production footprint to serve ice cream markets
in sub-Saharan Africa. Following an acquisition, we make capital improvements and implement our best practices in
order to bring such facilities in line with our group-wide standards.
Our History
Overview
Our company was formed in 2006 when Richmond Foods (“Richmond”), a leading producer of ice cream in
the UK and listed on the London Stock Exchange, merged with Roncadin Eis (“Roncadin”), a German ice cream
producer. This merger created R&R Ice Cream, the largest private label ice cream manufacturer in Europe. Since
the Richmond-Roncadin combination, we sought to continue our expansion through strategic acquisitions across
Europe, focusing primarily on the take-home segment in order to improve our position as a market leader in the
fragmented European ice cream market. In June 2014 we acquired the Peters business, the leading take-home ice
cream manufacturer in Australia; and in May 2015 we completed the acquisition of Nestlé South Africa’s ice cream
business.
Acquisitions since 2007
In 2007, we acquired the Creamice private label ice cream business from Fredericks Ice Cream Ltd.
In 2008, we acquired a 75% stake in Kelly’s of Cornwall Ltd. (“Kelly’s”), a small but fast-growing
Cornish ice cream manufacturer, to our brand portfolio. We acquired the remaining 25% stake in Kelly’s
in 2010.
In 2010, we acquired the Rolland group through the acquisition of its holding company, Soparo SAS.
Rolland is an established French ice cream manufacturer and the leading company in France’s private label
ice cream market. This acquisition significantly increased our private label market share in France.
In 2011, we added Pilpa (the ice cream division of Maison Boncolac) to our portfolio. Our acquisition
of Pilpa, which further consolidated the French ice cream market, gave us access to prominent brands
such as Disney and Oasis.
In 2011, we acquired the Germany-based ice cream producer Durigon Gelato GmbH. This strategic
acquisition increased our production capabilities in Germany, however we closed the Durigon facility in
December 2014 and consolidated production in Osnabrück.
In 2012, we acquired Eskigel, the leading Italian private label ice cream manufacturer.
In early 2013, we purchased a further 67.8% stake in Yoomoo, a frozen yogurt company based in the
UK, in which we had previously made a 25% investment in 2011. Yoomoo is the leading frozen yogurt
brand in the UK.
In 2013, we completed the acquisition of Fredericks, adding the licence of Cadbury brands to our
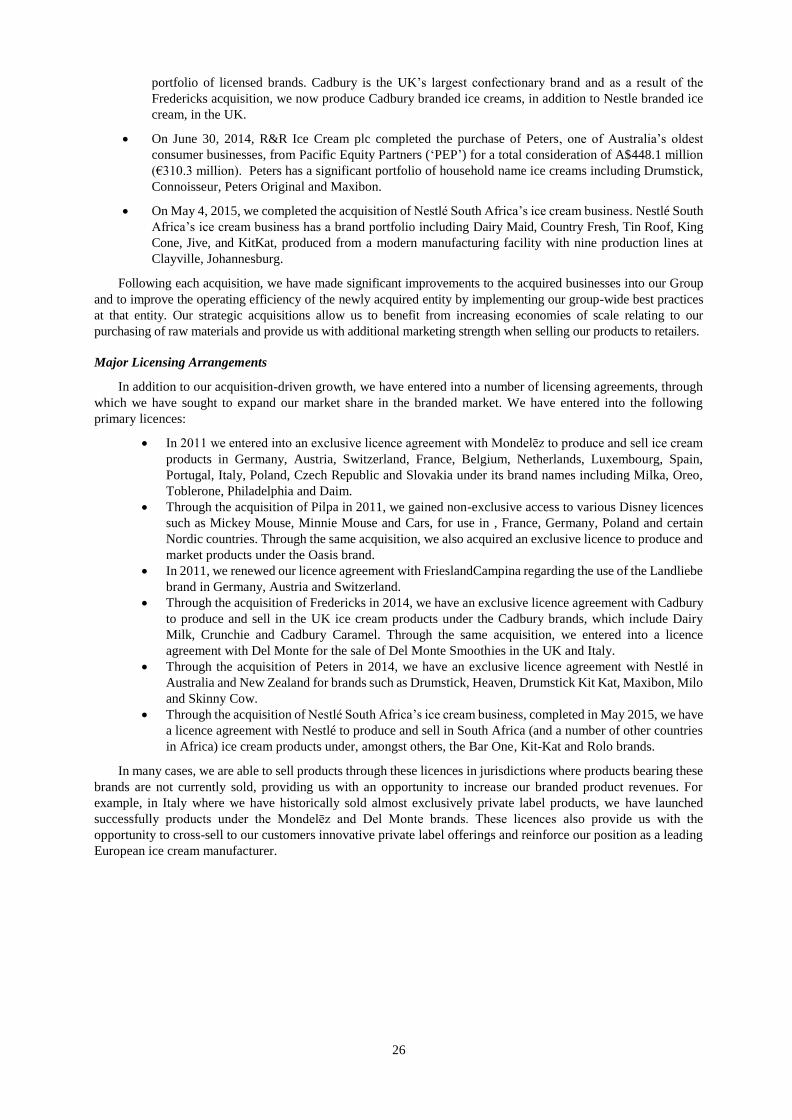
26
portfolio of licensed brands. Cadbury is the UK’s largest confectionary brand and as a result of the
Fredericks acquisition, we now produce Cadbury branded ice creams, in addition to Nestle branded ice
cream, in the UK.
On June 30, 2014, R&R Ice Cream plc completed the purchase of Peters, one of Australia’s oldest
consumer businesses, from Pacific Equity Partners (‘PEP’) for a total consideration of A$448.1 million
(€310.3 million). Peters has a significant portfolio of household name ice creams including Drumstick,
Connoisseur, Peters Original and Maxibon.
On May 4, 2015, we completed the acquisition of Nestlé South Africa’s ice cream business. Nestlé South
Africa’s ice cream business has a brand portfolio including Dairy Maid, Country Fresh, Tin Roof, King
Cone, Jive, and KitKat, produced from a modern manufacturing facility with nine production lines at
Clayville, Johannesburg.
Following each acquisition, we have made significant improvements to the acquired businesses into our Group
and to improve the operating efficiency of the newly acquired entity by implementing our group-wide best practices
at that entity. Our strategic acquisitions allow us to benefit from increasing economies of scale relating to our
purchasing of raw materials and provide us with additional marketing strength when selling our products to retailers.
Major Licensing Arrangements
In addition to our acquisition-driven growth, we have entered into a number of licensing agreements, through
which we have sought to expand our market share in the branded market. We have entered into the following
primary licences:
In 2011 we entered into an exclusive licence agreement with Mondelēz to produce and sell ice cream
products in Germany, Austria, Switzerland, France, Belgium, Netherlands, Luxembourg, Spain,
Portugal, Italy, Poland, Czech Republic and Slovakia under its brand names including Milka, Oreo,
Toblerone, Philadelphia and Daim.
Through the acquisition of Pilpa in 2011, we gained non-exclusive access to various Disney licences
such as Mickey Mouse, Minnie Mouse and Cars, for use in , France, Germany, Poland and certain
Nordic countries. Through the same acquisition, we also acquired an exclusive licence to produce and
market products under the Oasis brand.
In 2011, we renewed our licence agreement with FrieslandCampina regarding the use of the Landliebe
brand in Germany, Austria and Switzerland.
Through the acquisition of Fredericks in 2014, we have an exclusive licence agreement with Cadbury
to produce and sell in the UK ice cream products under the Cadbury brands, which include Dairy
Milk, Crunchie and Cadbury Caramel. Through the same acquisition, we entered into a licence
agreement with Del Monte for the sale of Del Monte Smoothies in the UK and Italy.
Through the acquisition of Peters in 2014, we have an exclusive licence agreement with Nestlé in
Australia and New Zealand for brands such as Drumstick, Heaven, Drumstick Kit Kat, Maxibon, Milo
and Skinny Cow.
Through the acquisition of Nestlé South Africa’s ice cream business, completed in May 2015, we have
a licence agreement with Nestlé to produce and sell in South Africa (and a number of other countries
in Africa) ice cream products under, amongst others, the Bar One, Kit-Kat and Rolo brands.
In many cases, we are able to sell products through these licences in jurisdictions where products bearing these
brands are not currently sold, providing us with an opportunity to increase our branded product revenues. For
example, in Italy where we have historically sold almost exclusively private label products, we have launched
successfully products under the Mondelēz and Del Monte brands. These licences also provide us with the
opportunity to cross-sell to our customers innovative private label offerings and reinforce our position as a leading
European ice cream manufacturer.
27
Our Strengths
Focus on Attractive Markets. We believe that ice cream is one of the most attractive retail food categories for
manufacturers in Europe, Australia and South Africa. Ice cream has strong appeal, and demand for ice cream has
generally experienced stable growth and demonstrated resilience to negative macro-economic conditions. The
countries in which we have leading positions are some of the largest, most stable and attractive ice cream markets
in the world. France, Germany, Italy and the UK had total take home ice cream sales, including discounters, of €0.8
billion, €1.3 billion, €0.9 billion and €1.1 billion, respectively, in 2015, and sales of ice cream in those markets have
steadily grown over recent years, including during recessionary periods. In Australia, the total take home ice cream
market has grown substantially over a number of years, to a value of €0.7 billion in 2015. There are the additional
factors of the “premiumisation” trend, resulting from customers purchasing higher-priced indulgent products, and
to volume growth, which is driven by Australia’s increasing population and stable consumption patterns.
Leading Market Positions. We have leading market positions in the UK, Germany, France and Italy, which
are the four largest take-home ice cream markets in Europe and the four largest markets for private label ice cream
in Europe. We are the one of the largest take-home ice cream manufacturers in Europe. We also are the largest
manufacturer of private label ice cream in each of the UK, France and Italy by volume and value and we estimate
that we accounted for approximately 59%, 53% and 59%, respectively, of total private label sales in those markets
in 2015. In Germany, we are the second largest manufacturer of private label ice cream and estimate that we
accounted for approximately 24% of the private label market in 2015. According to Nielsen, we have the second
largest market share in take-home ice cream in the UK (combining branded and private label markets) and we
represented 29% of this market. Similarly, we believe we are also the second largest manufacturer of take-home ice
cream in France and Italy and the third largest manufacturer of take-home ice cream in Germany. In Australia, we
now have a 33% market share on a similar basis, based on a leading position in the take home market, and also
number two position in the impulse market. We believe that our large size and leading market positions make us a
key supplier of private label ice cream for the major national retailers we serve and allow us to maximise economies
of scale in production and raw material purchasing.
Cost Leadership and Efficient Operating Base. We believe that our ability to produce quality products at a low
cost provides us with a strong competitive advantage. During the past few years, we have invested substantially in our
operations, including acquisitions and improvements to our properties, plant and equipment, with a focus on projects
that we believed would return our investments within three years. These expenditures were made to increase our
production capacity and efficiency, facilitate innovation, reduce ongoing manufacturing costs and improve product
quality. We have also improved our production controls and upgraded the operating processes at each of our facilities,
in particular those acquired by us in recent years. As a result of these measures, we believe that our manufacturing base
is characterised by efficient changeovers, which is a key focus for us, minimal waste and high capacity utilisation. We
have actively managed our asset base by divesting or closing inefficient plants or plants providing excess capacity. Since
2000, we have closed eight facilities in the UK, three in Germany and one in France and have shifted production to
larger more efficient facilities, improving and rationalising our manufacturing footprint. In July 2013, we ceased
production at our Carcassonne facility and increased capacity at our three other French facilities. We subsequently
closed Crossgates in Leeds, UK, in early October 2013 moved that facility’s production to our Leeming Bar site.
Further, we closed our Durigon plant in Schwanewede, Germany at the end of December 2013 and all of that facility’s
production was transferred to our Osnabrück plant. These three closures resulted in modest cost savings and improved
efficiency at our remaining plants in these countries during 2013 and significant cost savings in the year ending
December 31, 2014. In addition, we consolidated production between our Leeming Bar and Skelmersdale sites after
the acquisition of Fredericks in 2013. In order to optimise profitability, we continually assess the sales performance
of all of our product lines and seek to introduce higher margin products at the expense of lower margin products. As a
result of these measures and our manufacturing excellence, we believe we are able to manufacture ice cream more
efficiently than our competitors, which we believe allows us to maintain higher margins than most of our competitors.
Attractive Profit Margins with Strong Cash Flow. Our focus on reducing costs and making disciplined capital
expenditure, combined with our focus on high margin product lines and markets with attractive characteristics, has
allowed us to achieve attractive profit margins and generate strong levels of cash flow in recent periods. In 2014 and
2015, we had cash conversion ratios (defined as Adjusted EBITDA minus capital expenditure, divided by Adjusted
EBITDA, here calculated before parent company or investor management charges) of 83% and 85%, respectively.
Our strong cash flow generation has allowed us to invest in our business to achieve additional cost reductions, acquire
new businesses and develop new products to further strengthen our market positions. As a result of our recent
investments, we now have a well invested capital base, which we believe will reduce our ongoing capital expenditure
requirements at those facilities. We also practice margin discipline by not accepting low margin business from our
customers. We believe that low margins are not sustainable over the long term, and that by only producing products
which meet our desired margins, we will continue to be profitable with the ability to reinvest in our business. In
addition, the Peters business in Australia has substantially higher gross and EBITDA margins than those that prevail
28
in European markets, and within our European business. Therefore, we expect the contribution of the Peters business
to continue to have a substantial and positive effect on the group’s profit margins and cash flows.
Diverse Product Range. We have developed and acquired a broad range of product offerings and brands in
order to address changing consumer preferences and meet our retailer customers’ needs to sell a wide variety of
products. In order to maintain a diversified product portfolio, we rely on what we believe to be first-rate product
development capabilities located in each of the markets in which we operate to continuously develop new products
in response to changing market trends. We believe that our balanced product range is unique because we sell both
branded and private label products. This diversity allows us to maintain strong sales volumes as consumer demand
shifts between branded and private label products, often as a result of economic cycles. As a result of our
acquisitions in recent years, we own a broad range of brands, which include Kelly’s and yoomoo in the UK,
Botterbloom in Germany, Flipi and Pilpa in France, Zielona Budka in Poland, Peters and Connoisseur in Australia,
Dairy Maid and King Cone in South Africa and other recognisable brands. In addition, we have an exclusive licence
for branded products such as Smarties, Aero, Rolo, Toffee Crisp, Lion, KitKat, FAB, Rowntrees Fruit Pastille,
Maxibon and Toffee Crumble (through Nestlé), Milka, Oreo, Toblerone, Philadelphia and Daim (through
Mondelēz), Dairy Milk, Crunchie and Cadbury Caramel (through Cadbury), and Del Monte Smoothies (through
Del Monte). The use of these brands allows us to market a wide variety of products with brands that have instant
customer recognition and leverage the marketing campaigns of the brand owners.
Strong Relationships with a Diverse Customer Base of Leading Retailers. We believe that our scale and
diverse portfolio of attractive products have enabled us to build strong relationships with our customers. We have
product innovation teams located throughout our markets that enable us to serve our customers locally, and we
solidify our relationships with our customers by working with them to develop, commercialise and efficiently
produce innovative new private label products. We seek to expand by cross-selling to our large existing customer
base and by offering new customers a wide variety of products that address their retail needs. Many of our customers
are leaders in their respective national markets, including Asda, Tesco, Carrefour, Conad, Aldi, Woolworths and
Coles, and we have long-standing relationships with each of our leading customers. Since we operate in several
different markets in Europe, we serve a number of different retailers, and as a result our top five customers, by
revenue, accounted for only 25% of our sales in 2015 (2014: 27%), which we believe is relatively low in the food
retail industry, a market that is dominated by a limited number of retailers. No single customer represented more
than 5.6% of our revenues in 2015 (2014: 6.4%). We believe that the leading retailers in our current markets will
ultimately lead the consolidation of retail food markets across Europe, and we will seek to expand our business, in
particular sales of our private label products, to new markets as our customers expand.
Proven Management Team. We have a strong and experienced management team. Our Chief Executive Officer,
Ibrahim Najafi, has been with our company since 1998, and has been Chief Executive Officer since 2013. Our Chief
Financial Officer, Andrew Finneran, has been with our company since 1991. In December 2014, Bob Bigley stepped
down from his role as Head of Group Development, with his responsibilities being assumed by Andrew Finneran
and other members of the executive management team.
Our senior management team has strengthened our relationships with some of the largest and fastest growing
food retailers in Europe, and has improved the efficiency of our operations by implementing production controls
and by targeting high-return capital investments. Our management team has also strengthened our company and
increased our scale through a series of acquisitions of complementary businesses, and has realised significant cost
synergies when integrating these acquisitions and applying our company’s best practices to acquired businesses.
Our Strategy
Our goal is to strengthen our position as a leading global manufacturer of ice cream products and increase our
profitability. Our strategy includes the following elements:
Drive Growth through Product Innovation. We intend to maintain and further strengthen our leading positions
in our markets by continuing to produce high quality products that effectively address our customers’ needs. We plan
to continue to use our product development capabilities, which exist in each of the countries in which we operate and
allow us to cater to local markets in order to deliver products that meet the diverse and changing needs and tastes of
ice cream consumers in those markets. Our development of new products includes evaluations of our portfolio of
existing products to determine whether any can be replaced with higher margin products. We will continue to work
with our retailer customers to develop new private label products, such as private label super-premium products. We
also are increasing our focus on consumer testing, which we believe will enable us to launch better focused and
therefore more successful, products. We also intend to use our existing portfolio of strong brands and our Nestlé,
Mondelēz and Cadbury licences to market new and innovative branded products. We intend to continue to increase
our product range under these licences and expand the geographical distribution of these products across Europe.
Our recent successful product innovations include Cadbury mini-cones, Oreo sandwiches and Milka, Daim and Oreo
29
ice cream sticks, as well as developing a super-premium offer through Cadbury Marvellous Creations. We intend to
capitalise on these brands by launching brand rejuvenation initiatives, leveraging our product development
capabilities and increasing marketing-related investment. We believe that our low-cost manufacturing platform
provides us with a strong base from which to expand our product offerings.
Continue to Reduce Costs and Increase Efficiency. In 2014, we achieved significant cost savings through
reducing overhead and production costs, consolidating our sites in the UK, Germany and France and improving
management information and financial controls. We continued this path in 2015 with further operational efficiencies,
in areas such as direct labour, usage rates, distribution and energy costs. We plan to continue to improve our
productivity and lower costs across our entire business by investing selectively in new production equipment,
implementing process improvements, evaluating our product lines, and in respect of our newly acquired manufacturing
facilities, implementing our Group’s best practices. Additionally, we plan to continue to invest in capital expenditures
that result in improved cost efficiencies in our manufacturing and production operations, which we will evaluate using
our conservative investment criteria whereby, with the exception of health and safety investments, we generally seek
to achieve full return on our capital expenditure in three years or less. We also plan to continue to seek ways to
consolidate our production in order to maximise our use of manufacturing lines and to fully realise other economies
of scale in production, purchasing and distribution.
Pursue Selective Acquisition Opportunities. We plan to continue to evaluate acquisition opportunities to
selectively acquire businesses that may improve our market share and product offerings, reduce costs, or allow us to
enter new geographic markets. We have completed 11 acquisitions since 2007 and continue to evaluate acquisition
opportunities. We will also consider obtaining additional licensing agreements that would allow us to sell well-
established brand name products to improve our market share and product offerings.
Our Products
Branded Product Sales. Our diverse portfolio of branded products and licence arrangements with Mondelēz,
Cadbury, Nestlé and Disney, allow us to produce an array of branded ice cream products. Our brand licences are
summarized elsewhere within this document.
Since 2001, we have held an exclusive, ten-year rolling licence to produce and distribute Nestlé branded ice
cream and confectionary products in both the impulse and take-home markets in the UK and the Republic of Ireland.
The licence gives us access to the FAB and Rowntrees Fruit Pastille ice lolly brands, which hold top three positions,
in the everyday water ice category, and Skinny Cow, a leading healthy ice cream product in the UK. We also have
access to the Smarties, Milky Bar, Rolo, KitKat, Lion Bar, Maxibon, Nobbly Bobbly and Toffee Crumble brands,
each of which creates instant customer recognition and benefits from significant advertising support from Nestlé.
The licence is only cancellable (subject to certain exceptions, such as events of default) by Nestlé upon ten years’
advance notice, which has not been given by Nestlé as of the date of this document.
In October 2011, we entered into an exclusive licence agreement with Mondelēz to produce and sell ice cream
products under its brand names including Milka, Oreo, Toblerone, Philadelphia and Daim. Our extensive
manufacturing and distribution platform allows us to produce and market cross-category offerings of these Mondelēz-
branded products, including sticks, cones, mini cones, single serve pots and sandwiches. We are also regularly
developing new products for this range. We offer Mondelēz branded products in Germany, Austria, Switzerland,
France, Spain, Portugal, Italy, The Netherlands, Belgium, Luxembourg, the UK, Poland, the Czech Republic and
Slovakia. The success of Mondelēz-branded products has encouraged us to extend the range of products, combining
our existing capabilities and innovations into new geographic regions. We periodically assess new markets for our
licensed products and should we determine to expand the range of our products, we seek consent from our contractual
counterparties.
We have an exclusive licence agreement with Cadbury to produce and sell in the UK ice cream products under
the Cadbury brands that include Dairy Milk, Crunchie and Cadbury Caramel. We also operate under licence with
Del Monte for the sale of Del Monte Smoothies in the UK.
We have certain licences associated with Disney, including Mickey and Minnie Mouse, and Cars. The Disney
brands lend themselves well to products that are attractive to children. Through the Pilpa acquisition, we also
obtained an exclusive licence to produce and market products under the Oasis brand.
We have licences associated with Nestlé that were acquired as part of the Peters business in mid-2014. These
cover an exclusive right to manufacture and distribute the Drumstick, Heaven, Kit Kat, Maxibon, Milo, Rolo and
Skinny Cow brands in Australia and New Zealand, except with respect to Drumstick (including Drumstick Kit Kat)
and Milo, which are excluded from the New Zealand territory under the licence.
In each local market in which we operate, we offer a branded family tub ice cream which allows us to adapt
30
recipes according to local consumer tastes. We market several of these brands based on the unique characteristics of
the ice cream sold under that brand. For example, in the UK our platform brand is Kelly’s ice cream. A key marketing
point for Kelly’s is that it is manufactured at our Cornish site in Bodmin, using local milk and clotted cream, all
sourced from within 25 miles of the factory, making it unique in ingredients, taste and geography. The brand has
been supported by an integrated marketing plan including television, magazine and online advertising. We also have
a Kelly’s scooping range for use in ice cream parlours and have a strong presence nationally at many family day-out
locations including zoos, theme parks and beaches.
In 2011, we renewed our licence agreement with Friesland Campina regarding the use of the Landliebe brand
in Germany, Austria and Switzerland. Similar to the Kelly’s brand in the UK, the Landliebe range is made using a
unique dairy recipe that builds on the brand’s dairy heritage in yogurts and is marketed as a premium quality brand.
In France, we use ice cream brands such as Flipi and Pilpa. In Poland we own the ice cream brand Zielona Budka.
In 2012, we launched the yoomoo frozen yogurt brand into the UK supermarket channel and established a
leading position in this sector. We also license the brand to Yoomoo Holdings Limited, a company which is not
part of R&R, which is building a franchise business for yoghurt bars.
In 2015, as part of the acquisition of Nestlé South Africa’s ice cream business, we obtained the licence rights
to products in South Africa and certain southern African countries under the Rolo, Kit Kat and Bar One. We also
acquired brands including Dairy Maid, Country Fresh and King Cone.
For both take-home and impulse ice cream products, many of the brands that we use are licensed and we pay a
licence fee that is typically in the order of 5% of the net amount of the sales generated by the product associated
with a particular licence. Licensing brands gives us the flexibility to identify opportunities with respect to new
and/or growing brands or to move into sectors in which we do not have a presence as well as allowing us to benefit
from the investment in parent brand support associated with power brands in other categories.
Product Research and Development
We conduct continuous research and development activities to develop new products and to improve existing
ones. We conduct extensive consumer research to understand attitudes to and usage of ice cream by consumers using
qualitative techniques such as pre-tasks in the home. We combine this to understand shopper behaviour by conducting
at fixture interviews in grocery stores to provide an in situation understanding of how customers react to the ice cream
category in a number of retail stores. We also invest in market data to understand trends and performance across all of
the markets in which we operate. The insights we identify, together with feedback from retailers, are applied to both
our branded portfolio and our private label portfolio, and are shared with our customers, and these insights also form
the basis for our product development programme.
We have ongoing research and development functions in each of the countries in which we operate so that we can
tailor our projects specifically to the markets they serve. These research and development functions are primarily
concentrated on creating new ice cream products and improving existing recipes. In addition, we have a corporate
team that focuses on sharing best practices, research results and other information among our regional teams.
We believe that our high-quality innovation capabilities allow us to proactively meet both our customers’ and
end-consumer’s needs, and provide us with a competitive advantage and help maintain our strong relationships with
our customers. Taste and budget vary widely among our customers and are constantly changing. This means that there
is demand for a significant number of new or revised products to be introduced annually. New product development
can come from our brands, from our extensive market knowledge and research and development, from consumer tested
research or from a specific customer requirement. We also engage in product testing to effectively gauge consumer
preferences. This allows us to tailor our supply purchases to better meet anticipated demand and avoid waste.
Customers
We serve a broad range of retailer customers, including hypermarkets, supermarkets, grocery stores, convenience
stores, club stores and other retailers. In the UK, our primary customers include Tesco and Asda, and in the rest of
Europe, our primary customers include Aldi and Edeka in Germany, Leader Price and Carrefour in France, Conad and
Coop in Italy. In Australia, our primary customers include Woolworths and Coles. Our ten largest retailer customers,
by revenue, represented 42% of our revenues in 2015 (2014: 42%). In the UK, we generally enter into purchase
agreements that have rolling thirteen-week terms. In Germany, France and Italy, we generally enter into contracts that
have twelve-month terms, normally beginning in April of each year. We generally enter into rolling written agreements
with our retail customers in Poland which are terminable on one to three months’ notice depending on the customer.
In Australia we generally have long standing arrangements within grocery customers, reviewed annually. We seek to
provide our customers with superior service levels, particularly during peak periods, which we believe gives us a
competitive advantage. In South Africa, we normally have twelve month trading term agreements with all formal trade
31
customers (three of which make up the majority of South African revenue), which are renegotiated on an annual basis;
and in the general trade, we have a number of leisure and foodservice customers where a trading term is in place,
ranging from a twelve month period to a thirty six month period. We generally assign a specific member of our sales
team to each of our customers, and that sales person is responsible for negotiating orders and terms with that customer
and ensuring that products are delivered according to those orders. We sell our impulse ice cream products through
food service and wholesale channels, who sell to customers such as small retail and corner shops, tourist attractions
(such as theme parks) and cinemas.
Distribution
Our products are generally distributed using third party distributors. Outsourcing our distribution function
enhances our ability to increase production without requiring large capital expenditure, and has driven increased
profitability. Our products are shipped on refrigerated trucks from our facilities to distribution warehouses. From
there, they are sent to our customers along with other frozen and refrigerated goods products that are shipped by
our distributors to the regional distribution centres of our retailer customers. We believe this allows us to minimise
the time required for us to deliver our products to our customers, who desire timely service in order to keep their
shelves sufficiently stocked with products. In addition, it frees us from making investments in transportation assets,
which generally would not satisfy our capital investment requirements.
Marketing
The goal of our sales and marketing strategy is to continually evolve our offer to meet our consumers’ needs
in ice cream through the development of a broad portfolio of brand and private label products.
We believe that our product research gives us a thorough understanding of our markets which, coupled with our
key differentiators, include strong development resources, customer service and support capabilities, broad geographic
reach and large-scale production resources, help make us an important supplier to our customers. It is critical in our
industry to provide superior service, and therefore we approach sales and marketing with sales teams who have
specialised product and regional market knowledge as well as product development personnel who can coordinate
development activities. Our scale enables us to dedicate certain sales and marketing efforts to particular products,
customers or geographic regions, enabling us to develop expertise that is valued by our customers. Many of our
customer relationships stem from existing relationships of owners or management of companies we have acquired,
and in many cases those owners who stay with us continue to play a key role in those relationships.
Our sales representatives are trained to maintain a general familiarity with all of our products that allow us to
take advantage of cross-selling opportunities and high-margin products. As a result, we believe that our sales
personnel have developed a deep understanding of our product lines and profitability, in addition to the specific
operations and needs of the individual customers that each representative services. We believe that this expertise
enables us to cultivate profitable new business, develop highly-effective partnering initiatives with key customers,
meet or exceed customer needs and expectations as to product quality and innovation, and differentiate our products
from those of our competition.
We support the growth of our brands by running fully integrated marketing campaigns. We start a typical
marketing campaign by conducting research to develop a full understanding of how a particular brand is perceived
by our customers before we look to engage with our customers through a variety of multi-media platforms. All of
our marketing campaigns are highly targeted and have specific objectives in mind, whether it is to drive our
customers to try our products or to engage with our consumers to give them a greater understanding about, and a
connection with, our brands. Initially, we engage with customers at home either through television, magazine or
online advertising or through online communications via social media, our websites, home shopping websites,
banners or pop ups on high traffic websites. This is then followed by targeted marketing with in-store
demonstrations and tastings, point of sale marketing, car park and security gate banner and poster advertising and
in-store promotions.
A large portion of our revenue is derived from licenced brands and private label products. As a result, we
believe that we generally spend less on marketing than is normally required to maintain a portfolio of brands as we
benefit from significant parent brand investment support. We also believe that both our private label capabilities
and close involvement in the development of our customers’ new products help to integrate us with our customers’
operations and position us as a critical supplier. We believe that this significantly helps to drive our whole business
growth strategy.
In addition, our sales and marketing strategy includes an effort to take advantage of the cross-selling
opportunities afforded by our acquisitions of independent businesses. We seek to cross-sell our private label as well
as branded offering to our acquired businesses’ existing customer base while also introducing newly acquired
product lines to our existing customers.
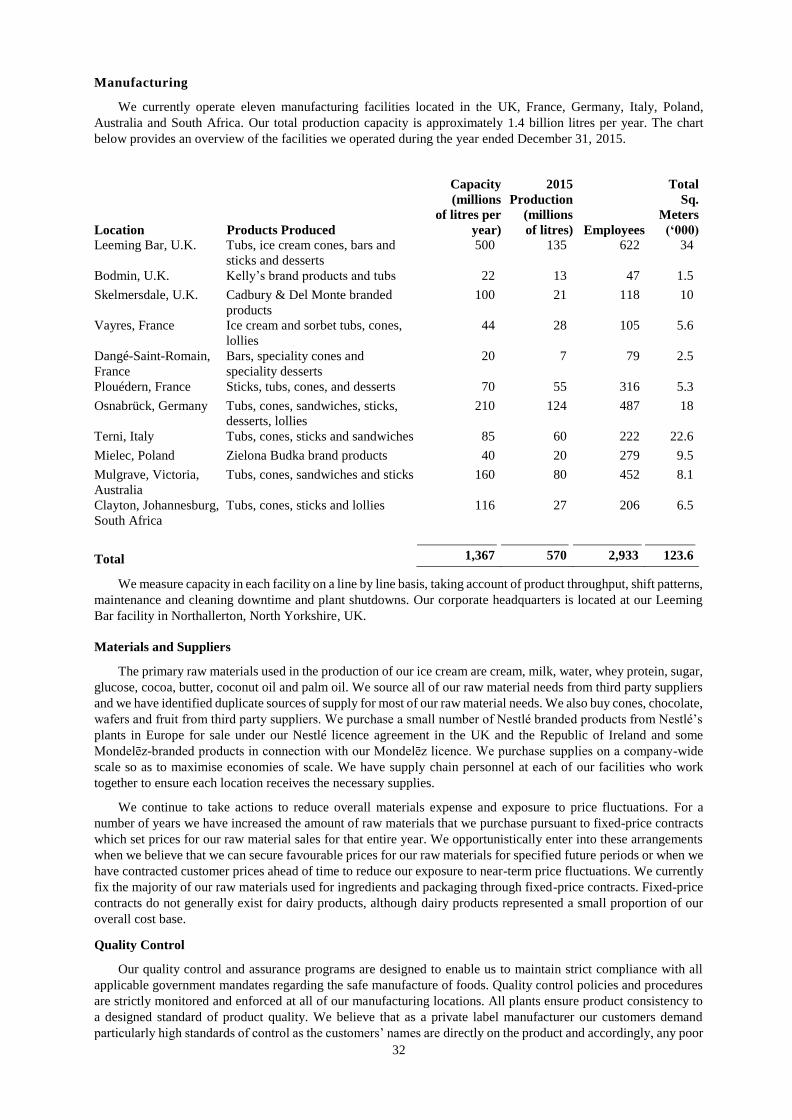
32
Manufacturing
We currently operate eleven manufacturing facilities located in the UK, France, Germany, Italy, Poland,
Australia and South Africa. Our total production capacity is approximately 1.4 billion litres per year. The chart
below provides an overview of the facilities we operated during the year ended December 31, 2015.
Location Products Produced
Capacity
(millions
of litres per
year)
2015
Production
(millions
of litres) Employees
Total
Sq.
Meters
(‘000)
Leeming Bar, U.K. Tubs, ice cream cones, bars and
sticks and desserts
500 135 622 34
Bodmin, U.K. Kelly’s brand products and tubs 22 13 47 1.5
Skelmersdale, U.K. Cadbury & Del Monte branded
products
100 21 118 10
Vayres, France Ice cream and sorbet tubs, cones,
lollies
44 28 105 5.6
Dangé-Saint-Romain,
France
Bars, speciality cones and
speciality desserts
20 7 79 2.5
Plouédern, France Sticks, tubs, cones, and desserts 70 55 316 5.3
Osnabrück, Germany Tubs, cones, sandwiches, sticks,
desserts, lollies
210 124 487 18
Terni, Italy Tubs, cones, sticks and sandwiches 85 60 222 22.6
Mielec, Poland Zielona Budka brand products 40 20 279 9.5
Mulgrave, Victoria,
Australia
Tubs, cones, sandwiches and sticks 160 80 452 8.1
Clayton, Johannesburg,
South Africa
Tubs, cones, sticks and lollies 116 27 206 6.5
Total 1,367 570 2,933 123.6
We measure capacity in each facility on a line by line basis, taking account of product throughput, shift patterns,
maintenance and cleaning downtime and plant shutdowns. Our corporate headquarters is located at our Leeming
Bar facility in Northallerton, North Yorkshire, UK.
Materials and Suppliers
The primary raw materials used in the production of our ice cream are cream, milk, water, whey protein, sugar,
glucose, cocoa, butter, coconut oil and palm oil. We source all of our raw material needs from third party suppliers
and we have identified duplicate sources of supply for most of our raw material needs. We also buy cones, chocolate,
wafers and fruit from third party suppliers. We purchase a small number of Nestlé branded products from Nestlé’s
plants in Europe for sale under our Nestlé licence agreement in the UK and the Republic of Ireland and some
Mondelēz-branded products in connection with our Mondelēz licence. We purchase supplies on a company-wide
scale so as to maximise economies of scale. We have supply chain personnel at each of our facilities who work
together to ensure each location receives the necessary supplies.
We continue to take actions to reduce overall materials expense and exposure to price fluctuations. For a
number of years we have increased the amount of raw materials that we purchase pursuant to fixed-price contracts
which set prices for our raw material sales for that entire year. We opportunistically enter into these arrangements
when we believe that we can secure favourable prices for our raw materials for specified future periods or when we
have contracted customer prices ahead of time to reduce our exposure to near-term price fluctuations. We currently
fix the majority of our raw materials used for ingredients and packaging through fixed-price contracts. Fixed-price
contracts do not generally exist for dairy products, although dairy products represented a small proportion of our
overall cost base.
Quality Control
Our quality control and assurance programs are designed to enable us to maintain strict compliance with all
applicable government mandates regarding the safe manufacture of foods. Quality control policies and procedures
are strictly monitored and enforced at all of our manufacturing locations. All plants ensure product consistency to
a designed standard of product quality. We believe that as a private label manufacturer our customers demand
particularly high standards of control as the customers’ names are directly on the product and accordingly, any poor
33
quality product reflects on the retailer.
Competition
The ice cream industry is highly competitive and ice cream manufacturers include full line dairies, major food-
producing corporations and independent ice cream processors, many of whom are capable of manufacturing and
marketing a variety of ice creams. Our branded products compete on the basis of brand image, quality, breadth of
flavour selection, delivery timeliness and price. Our key branded product competitors throughout Europe include
Unilever and Nestlé, each of which has substantial financial, marketing and other resources and established brand
names. Unilever sells branded ice cream in almost every country in Europe, and in Australia. In addition, we
compete against regional producers in each of the markets in which we operate, including Bulla in Australia. Our
private label products compete primarily on the basis of price, but also on the basis of quality, breadth of flavour
selection and delivery timeliness, and our ability to produce large volumes of product. We compete with various
regional private label manufacturers throughout Europe. There has been no significant, recent change to the nature
or identity of our regional competitors in the respective markets.
Seasonality
The ice cream market is seasonal, with a larger portion of annual sales generally being generated in the summer
months. We have a higher level of sales preceding and during the summer months and lower level of sales in the
first and fourth quarters. Please see “Management’s Discussion and Analysis of Financial Condition and Results of
Operations—Factors Affecting our Business—Seasonality”.
Licensing Agreements
The brands that we license and use in our sales and marketing efforts include, among others, trademarks
associated with Nestlé, Dairy Milk, Milka, Oreo, Toblerone,, Daim, Disney, Oasis, and Landliebe.
The Nestlé Licence
We hold a licence for various trademarks owned by and popularly associated with the Nestlé brand which
allows us to manufacture, distribute and sell ice cream products bearing certain Nestlé trademarks through the
UK and the Republic of Ireland. Our licence agreement with Nestlé became effective on September 11, 2001 and
will continue until terminated by either party. Nestlé may terminate the agreement if we fail to achieve net sales
in the UK and the Republic of Ireland of £20.0 million during any annual period or for certain breaches. The
agreement may be terminated by either party upon ten years’ notice. The agreement may also be terminated by
either party if the other party materially breaches the agreement or the related manufacturing agreement that
provides specifications for products we manufacture (and, if such breach is capable of remedy, such breach is
not cured within 25 or 40 days, as applicable) or enters insolvency-like proceedings. The agreement may also be
terminated if a force majeure renders performance of material obligations under the agreement by either party
not reasonably possible for more than 120 days and the other party gives notice of such termination or upon
insolvency of either party.
The Mondelēz Licence
We hold an exclusive licence for various trademarks owned by and popularly associated with the Mondelēz
brand which allows us to manufacture, distribute and sell ice cream products bearing the Daim, Milka, Oreo and
Toblerone Mondelēz trademarks through Germany, Austria, Switzerland, France, Belgium, The Netherlands,
Luxembourg, Spain, Portugal and Italy. Our licence agreement with Mondelēz became effective on October 1, 2011
and was initially due to expire on December 31, 2016. However, the term of this licence has since been extended to
December 31, 2018 and the parties intend to review further extensions of the license on an annual basis. Mondelēz
may terminate the agreement on six months’ written notice if we fail to achieve at least 50% of the aggregate target
net sales for all products relating to a particular brand in any two of France, Germany and/or Austria for two
consecutive years. Mondelēz may also terminate the agreement in respect of any brand on six months’ written notice
if we fail to achieve at least 50% of the aggregate target net sales for all products relating to that brand for two
consecutive years. We are required to notify Mondelēz of any proposed change of control and, in the event of a
change of control to a competitor of Mondelēz, the parties shall work together in good faith for a period of three
months from the date of the change of control and for one month following the expiration of the initial three month
period either party shall be entitled to terminate the agreement by providing eight months’ written notice. Mondelēz
is also entitled to terminate the agreement immediately if we challenge the ownership or validity of or seek to revoke
any of the trade marks which are the subject of the agreement or if we are responsible for an act or omission which
has caused material prejudice to the name and reputation of Mondelēz or any of the trademarks or brands which are
the subject of the agreement. The agreement may also be terminated by either party if the other party materially
34
breaches the agreement or enters insolvency-like proceedings.
A further three licences with Mondelēz were entered into in respect of Poland, the Czech Republic and Slovakia
from January 1, 2014. Each of these licences terminate on December 31, 2018. The terms of these licences are
substantially the same as the head licence save that Mondelēz may terminate any one licence on six months’ written
notice if we fail to achieve at least 50% of the aggregate target net sales for all products relating to a particular brand
in the named territory for two consecutive years.
The Cadbury Licence
Through the acquisition of Fredericks, we now have an exclusive license agreement with Cadbury to produce and
sell Cadbury brand products in the UK, Cyprus, Malta, the UAE, Turkey, Lebanon, Ghana, Qatar, Spain and Portugal.
This licence includes the right to the use the Dairy Milk, Crunchie, and Cadbury Caramel brands. The licence agreement
became effective on January 1, 2010. The licence was automatically extended for an additional term of five years in
2014, under which either party may terminate the licence at any time after expiry of the additional term by giving at
least 12 months’ prior notice. Therefore, the earliest the Cadbury licence can be terminated following an extension is
December 31, 2019, provided notice is served on December 31, 2018. Further, Cadbury is entitled to terminate at any
time in the event of a change of control whether of R&R Ice Cream UK Limited or of any party which directly or
indirectly has control of R&R Ice Cream Limited or a change in the structure of the management of R&R Ice Cream
UK Limited which could reasonably be expected to affect adversely the ability of R&R Ice Cream UK Limited to
perform its obligations.
The Del Monte Licence
We are also party to a contract packing agreement and supply agreement with Del Monte, which enables us to
manufacture, package and sell a line of smoothies and Fruitini ice lollies bearing the Del Monte trademark in
Europe, Africa and the Middle East. At present, we sell Del Monte products in the UK and Italy. The agreement
became effective on April 1, 2012 and continues under an annual rolling basis until terminated. Either party may
terminate on expiry of the initial period or any anniversary thereof by giving three months prior written notice. Del
Monte may also terminate on written notice on notification of any change or proposed change of control of R&R
Ice Cream UK Limited.
The Nestlé Licence in Australia
Following the acquisition of Peters, we hold a licence, dated August 1, 2012, with Nestlé to produce certain
branded products in Australia and New Zealand, for an initial term of ten years unless renewed or terminated. The
licence provides an exclusive right to manufacture and distribute the Drumstick, Heaven, Drumstick Kit Kat,
Lifesavers, Maxibon, Milo, Rolo and Skinny Cow brands in Australia and New Zealand, except with respect to
Drumstick and Milo, which are excluded from the New Zealand territory under the licence. Provided that we are
not in material breach of the agreement, we have the right to renew the agreement for an additional ten year term
and an additional five year term up to a maximum of twenty-five years from the date of the Nestle license agreement,
provided that we give six months’ advance notice of its election to renew. Either party may terminate the agreement
if the other party becomes insolvent or commits a material breach of the agreement. In addition, Nestlé can terminate
the agreement in certain instances where a change of control event occurs.
Other Licences
We are a party to various other licensing agreements, pursuant to which we license trade marks from other third
parties. Examples of our trade mark licences include, but are not limited to: the “Landliebe” mark licensed from
Friesland Campina GmbH & Co. KG; the “Mickey Mouse”, “Minnie Mouse” and “Cars” marks licensed from
Disney; the “Oasis” mark licensed from Schweppes; the “Vimto” mark licensed from Nichols; and the “Refreshers”,
“Butterkist” from Tangerine.
Regulation
All of our facilities and products ware subject to local, national and international laws and regulations relating
to food, products quality, sanitation, safety and environmental control, including laws relating to air emissions,
remediation of contaminated soil and ground water, waste water, discharge, noise, odour and handling, storage and
disposal of waste. Failure to comply with these requirements may result in fines and penalties and liability for
compliance costs and damages.
From time to time, we receive notices and inquiries from regulatory authorities and others asserting that we are
not in compliance with such laws and regulations. In some instances, litigation ensues. In addition, individuals may
35
initiate litigation against us. Please see “—Legal and Administrative Proceedings”. Many of our facilities are subject
to environmental permits and other regulatory requirements, violations of which may result in civil or criminal
sanction. In some cases, third parties may also have the right to sue to enforce compliance. We believe that we are
currently in compliance with all material governmental laws and regulations affecting our business, including
environmental and health and safety laws and regulations, and maintain all material permits and licences relating
to our operations.
Food Safety Regulations
We are subject to extensive food safety regulations and are subject to governmental food processing controls in
each of the countries in which we operate. Regulation EC/178/2002 provides the framework for a unified approach
to food safety in the European Union and all member states have implemented the requirements into national law.
Among the other major requirements of Regulation EC/178/2002 are Article 17, which imposes on food business
operators a general obligation to ensure that the operations under their control satisfy the relevant food law
requirements and an obligation to verify that such requirements are met, and Article 18, which imposes a mandatory
traceability requirement along the food chain. The traceability requirement applies to all food, animal feed, food-
producing animals and all types of food chain operators including in the farming, processing, transport, storage,
distribution and retail sectors. Information including the name, address of the producer, nature of the products and
date of transaction must be systematically registered by each operators’ traceability system. This information must
be kept for a period of five years and upon request, must be made immediately available to the competent authorities.
We have implemented careful internal recording systems to ensure that we comply with this requirement. In addition
to the general requirements of Regulation EC/178/2002, we are subject to the specific food hygiene legislation,
HACCP (Hazard Analysis and Critical Control Points), which has been implemented in all of our operating divisions
and plants. Further, we are regularly inspected by various national and local regulatory authorities, as well as by our
customers.
In 2014, in particular, there were substantial effects of changing regulations within the EU. Included within
exceptional items for the year ended December 31, 2014, are exceptional origination costs of €2.5 million, relating
to the write-off of packaging and similar costs due to new EU regulations, which prescribed particular and stringent
standards to numerous elements of consumer product packaging. This included items such as packaging font size,
languages, other matters relating to the presentation of nutritional information such as allergens, amongst many other
elements.
Environmental Regulations
We are subject to a number of local, national and international laws and other requirements relating to the
protection of the environment and the safety and health of personnel and the public. These requirements relate to a
broad range of our activities, including:
the discharge of pollutants into the air and water;
the identification, generation, storage, handling, transportation, disposal, record-keeping, labelling,
reporting of, and emergency response in connection with, hazardous materials (including asbestos)
associated with our operations;
noise emissions from our facilities; and
health and safety standards, practices and procedures that apply to the workplace and our operations.
In order to comply with these requirements, we may need to spend money and commit other resources from time to
time to (i) construct or acquire new equipment, (ii) acquire or amend permits to authorise facility operations, (iii) modify,
upgrade or replace existing and proposed equipment and (iv) clean up or decommission waste management facilities. Our
capital and operating budgets include costs and expenses associated with complying with these laws. If we do not comply
with environmental requirements that apply to our operations, regulatory agencies could seek to impose civil,
administrative and/or criminal liabilities, as well as seek to curtail our operations. Under some circumstances, private
parties could also seek to impose civil fines or penalties for violations of environmental laws or recover monetary
damages, including those relating to property damage or personal injury.
The presence of hazardous materials at our facilities may expose us to potential liabilities associated with the
cleanup of contaminated soil and groundwater, and we could be liable for (i) the costs of responding to and
remediating that release and (ii) the restoration of natural resources damaged by any such release, among other
things. We have not incurred, nor do we anticipate incurring, material expenditures made in order to comply with
environmental laws or regulations. We are not aware of any environmental liabilities that we would expect to have
a material adverse effect on our business.
36
Health and Safety Regulations
Our internal safety department and our insurers conduct regular inspections of all of our manufacturing
activities so as to ensure that site and personal safety is managed to the highest level. We have systems in place
designed to monitor, reduce and avoid food safety risks throughout all stages of our production process.
Additionally we provide ongoing employee training regarding food, work and site safety. Safety statistics are
monitored on a daily and weekly basis at site level and reviewed monthly by our management board.
Business Continuity
We have policies and procedures and a robust business continuity process in place so that an immediate and
effective response can be given to incidents that might present an immediate and significant danger or disruption to
the business or our customers, in order to allow us to continue to minimise the impact of any major incidents. Should
there be a crisis, we have a crisis management team that can immediately be put in place to manage the situation.
Additionally, we have a strategic continuity team to manage the recovery as efficiently and as quickly as possible.
Legal and Administrative Proceedings
At any given time, we may be a party to litigation or be subject to non-litigated claims arising out of the normal
operations of our businesses. Other than as discussed below, we do not expect any liability arising from any of these
legal proceedings to have a material impact on our results of operations, liquidity, capital resources or financial
position.
In May 2013, Stefano De Santis filed a request for arbitration with the Chamber of National and International
Arbitration of Milan in respect of various matters arising from the acquisition by Eskigel Holding S.p.A. of 50 per
cent of the entire issued share capital of Eskigel S.r.l. held by Mr De Santis. The Arbitration Panel first met to
discuss the case on March 24, 2014 and the deadline for determining an arbitral award was previously set for
September 29, 2014, but this has now been postponed to October 2018. The claimant has not specified the amount
being claimed, however, we estimate that the claim is in the range of €2.5 million to €5.0 million in accordance
with the fee brackets established by the Chamber. In the meantime, in view of the extended deadline, the Arbitration
panel asked R&R to pay €388,500 to Mr De Santis in April 2015, without imputing any liability whatsoever on the
company. This payment was made and will be deductible from any future settlement.
Intellectual Property
The brands that we own and use in our sales and marketing include, among others, logos associated with Kelly’s,
yoomoo, Flipi and Zielona Budka. Each of our trademarks, service marks and trade names that we do not license from
third parties is registered and/or pending registration in our name, as appropriate for the needs of our relevant business.
Employees
At December 31, 2015, we had 2,933 employees, including seasonal workers in manufacturing, segmented by
the following functions:
Function
United
Kingdom
Germany
France
Italy
Poland
Australia
South
Africa
Total
Manufacturing 687 411 391 196 199 211 96 2,191
Selling Groups 31 11 16 4 50 130 18 260
Customer Service 5 11 22 4 5 14 - 61
Corporate 47 33 28 - 16 64 79 267
Marketing, R&D and
Merchandising 17 21 43 18 9 33 13 154
Total 787 487 500 222 279 452 206 2,933
We add seasonal workers each year to prepare for the seasonal increase in production. During 2015, for
illustration, we had an average of 3,517 employees across our group for the year, versus a year-end position of
2,933 employees. We are able to shorten the work period for our seasonal workers if our product requirements do
not meet our projections and, although we generally are required to make any such determination early in the
summer season, adjustments can be made at short notice.
In the UK, there are no recognised unions on any of our sites. Our sites in the UK are represented through
consultative committees. Sites in Germany, France, Italy and Poland have union representation through works

37
councils. We have never experienced a work stoppage and consider our relations with our employees to be strong.
At all of our sites, the works councils and consultative committees are in compliance with the European
Communication and Consultation requirements. We offer our staff a variety of benefits, which can vary depending
on the country, including contributory pension scheme, private health, company car or car allowance scheme, staff
canteens, salary sacrifice schemes and free of charge products, as well as training and development based on both
personal and business needs.
Our remuneration and benefits policy is designed to reward employees operating in line with good market practice.
Accordingly, our salary system consists of a fixed base salary and a variable bonus component in the form of a cash
payment for all employees based on our overall business performance. We provide pension benefits for our employees
in line with local market practice and requirements. In Germany, our major retirement schemes are set out in shop
agreements which establish defined benefit plans covering the employees of the German subsidiaries.
ANNUAL REPORT31 DECEMBER 2015
RIC-B0237a R&R Annual Report 2015.qxp_Layout 1 02/03/2016 12:21 Page 2
CORPORATE INFORMATION
DIRECTORS: Ibrahim Najafi,Andy Finneran
SECRETARY: Andy Finneran
INDEPENDENT AUDITORS:PricewaterhouseCoopers LLP, Benson House,33 Wellington Street, Leeds LS1 4JP
BANKERS: Barclays Bank Plc, PO Box 190, 2nd Floor, 1 Park Row, Leeds LS1 5WU
SOLICITORS: Allen & Overy LLP, One Bishops Square,London E1 6AD
REGISTERED OFFICE: Richmond House, Plews Way, Leeming Bar Industrial Estate, Northallerton,North Yorkshire DL7 9UL
Registered No. 05777981
RIC-B0237a R&R Annual Report 2015.qxp_Layout 1 02/03/2016 12:21 Page 3
CONTENTS
Strategic report 02
Corporate governance 07
Directors’ report 09
Statement of Directors' responsibilities 10
Independent auditors’ report to themembers of R&R Ice Cream plc 11
Consolidated financial statements
Consolidated income statement 13
Consolidated statement of comprehensive income 14
Consolidated statement of changes in equity 14
Consolidated statement of financial position 15
Consolidated statement of cash flows 15
Accounting policies 16
Notes to the consolidated financial statements 20
Company only accounts
Company only statement of financial position 39
Company only statement of changes in equity 39
Accounting policies 40
Notes to the Company only accounts 40
R&R ICE CREAM PLC | ANNUAL REPORT | 01
RIC-B0237a R&R Annual Report 2015.qxp_Layout 1 02/03/2016 12:21 Page 4
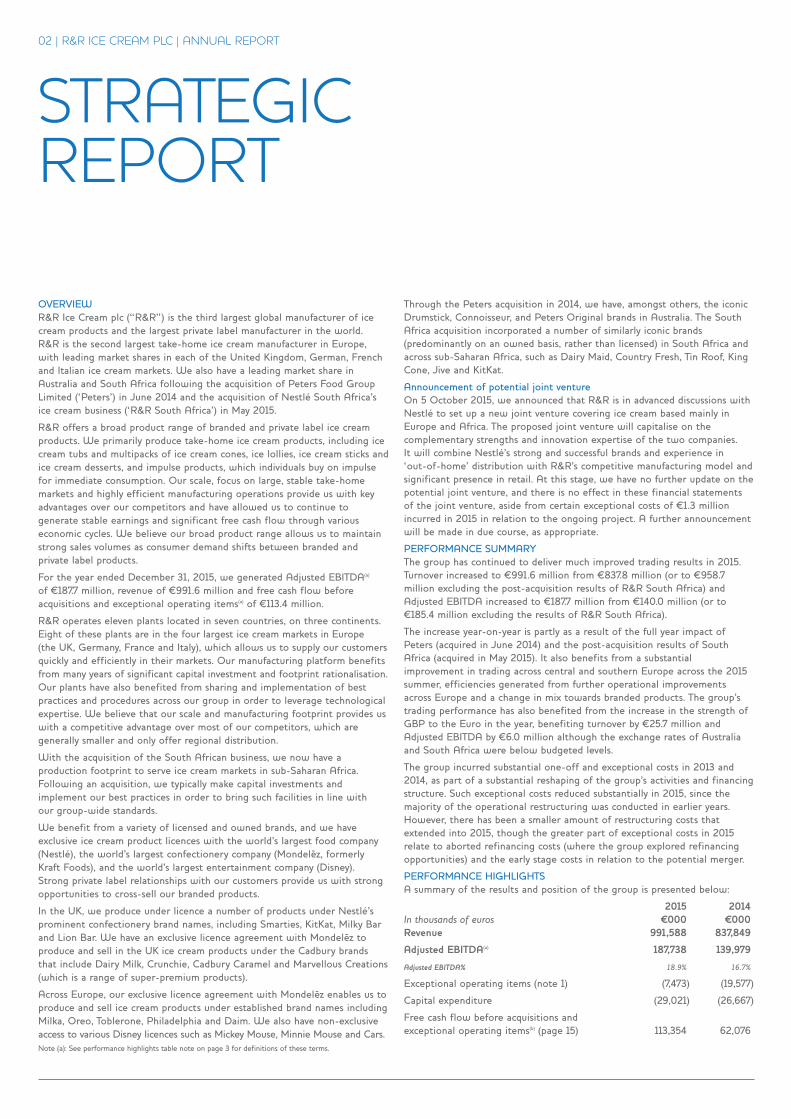
STRATEGICREPORT
02 | R&R ICE CREAM PLC | ANNUAL REPORT
OVERVIEWR&R Ice Cream plc (“R&R”) is the third largest global manufacturer of icecream products and the largest private label manufacturer in the world.R&R is the second largest take-home ice cream manufacturer in Europe,with leading market shares in each of the United Kingdom, German, Frenchand Italian ice cream markets. We also have a leading market share inAustralia and South Africa following the acquisition of Peters Food GroupLimited (‘Peters’) in June 2014 and the acquisition of Nestlé South Africa’sice cream business (‘R&R South Africa’) in May 2015.
R&R offers a broad product range of branded and private label ice creamproducts. We primarily produce take-home ice cream products, including icecream tubs and multipacks of ice cream cones, ice lollies, ice cream sticks andice cream desserts, and impulse products, which individuals buy on impulsefor immediate consumption. Our scale, focus on large, stable take-homemarkets and highly efficient manufacturing operations provide us with keyadvantages over our competitors and have allowed us to continue togenerate stable earnings and significant free cash flow through variouseconomic cycles. We believe our broad product range allows us to maintainstrong sales volumes as consumer demand shifts between branded andprivate label products.
For the year ended December 31, 2015, we generated Adjusted EBITDA(a)
of ¤187.7 million, revenue of ¤991.6 million and free cash flow beforeacquisitions and exceptional operating items(a) of ¤113.4 million.
R&R operates eleven plants located in seven countries, on three continents.Eight of these plants are in the four largest ice cream markets in Europe(the UK, Germany, France and Italy), which allows us to supply our customersquickly and efficiently in their markets. Our manufacturing platform benefitsfrom many years of significant capital investment and footprint rationalisation.Our plants have also benefited from sharing and implementation of bestpractices and procedures across our group in order to leverage technologicalexpertise. We believe that our scale and manufacturing footprint provides uswith a competitive advantage over most of our competitors, which aregenerally smaller and only offer regional distribution.
With the acquisition of the South African business, we now have aproduction footprint to serve ice cream markets in sub-Saharan Africa.Following an acquisition, we typically make capital investments andimplement our best practices in order to bring such facilities in line withour group-wide standards.
We benefit from a variety of licensed and owned brands, and we haveexclusive ice cream product licences with the world’s largest food company(Nestlé), the world’s largest confectionery company (Mondelez, formerlyKraft Foods), and the world’s largest entertainment company (Disney).Strong private label relationships with our customers provide us with strongopportunities to cross-sell our branded products.
In the UK, we produce under licence a number of products under Nestlé’sprominent confectionery brand names, including Smarties, KitKat, Milky Barand Lion Bar. We have an exclusive licence agreement with Mondelez toproduce and sell in the UK ice cream products under the Cadbury brandsthat include Dairy Milk, Crunchie, Cadbury Caramel and Marvellous Creations(which is a range of super-premium products).
Across Europe, our exclusive licence agreement with Mondelez enables us toproduce and sell ice cream products under established brand names includingMilka, Oreo, Toblerone, Philadelphia and Daim. We also have non-exclusiveaccess to various Disney licences such as Mickey Mouse, Minnie Mouse and Cars. Note (a): See performance highlights table note on page 3 for definitions of these terms.
Through the Peters acquisition in 2014, we have, amongst others, the iconicDrumstick, Connoisseur, and Peters Original brands in Australia. The SouthAfrica acquisition incorporated a number of similarly iconic brands(predominantly on an owned basis, rather than licensed) in South Africa andacross sub-Saharan Africa, such as Dairy Maid, Country Fresh, Tin Roof, KingCone, Jive and KitKat.
Announcement of potential joint ventureOn 5 October 2015, we announced that R&R is in advanced discussions withNestlé to set up a new joint venture covering ice cream based mainly inEurope and Africa. The proposed joint venture will capitalise on thecomplementary strengths and innovation expertise of the two companies.It will combine Nestlé’s strong and successful brands and experience in‘out-of-home’ distribution with R&R’s competitive manufacturing model andsignificant presence in retail. At this stage, we have no further update on thepotential joint venture, and there is no effect in these financial statementsof the joint venture, aside from certain exceptional costs of ¤1.3 millionincurred in 2015 in relation to the ongoing project. A further announcementwill be made in due course, as appropriate.
PERFORMANCE SUMMARYThe group has continued to deliver much improved trading results in 2015.Turnover increased to ¤991.6 million from ¤837.8 million (or to ¤958.7million excluding the post-acquisition results of R&R South Africa) andAdjusted EBITDA increased to ¤187.7 million from ¤140.0 million (or to¤185.4 million excluding the results of R&R South Africa).
The increase year-on-year is partly as a result of the full year impact ofPeters (acquired in June 2014) and the post-acquisition results of SouthAfrica (acquired in May 2015). It also benefits from a substantialimprovement in trading across central and southern Europe across the 2015summer, efficiencies generated from further operational improvementsacross Europe and a change in mix towards branded products. The group’strading performance has also benefited from the increase in the strength ofGBP to the Euro in the year, benefiting turnover by ¤25.7 million andAdjusted EBITDA by ¤6.0 million although the exchange rates of Australiaand South Africa were below budgeted levels.
The group incurred substantial one-off and exceptional costs in 2013 and2014, as part of a substantial reshaping of the group’s activities and financingstructure. Such exceptional costs reduced substantially in 2015, since themajority of the operational restructuring was conducted in earlier years.However, there has been a smaller amount of restructuring costs thatextended into 2015, though the greater part of exceptional costs in 2015relate to aborted refinancing costs (where the group explored refinancingopportunities) and the early stage costs in relation to the potential merger.
PERFORMANCE HIGHLIGHTSA summary of the results and position of the group is presented below:
2015 2014In thousands of euros ¤000 ¤000Revenue 991,588 837,849
Adjusted EBITDA(a) 187,738 139,979
Adjusted EBITDA% 18.9% 16.7%
Exceptional operating items (note 1) (7,473) (19,577)
Capital expenditure (29,021) (26,667)
Free cash flow before acquisitions and exceptional operating items(b) (page 15) 113,354 62,076
-
-
-
RIC-B0237a R&R Annual Report 2015.qxp_Layout 1 02/03/2016 12:21 Page 5
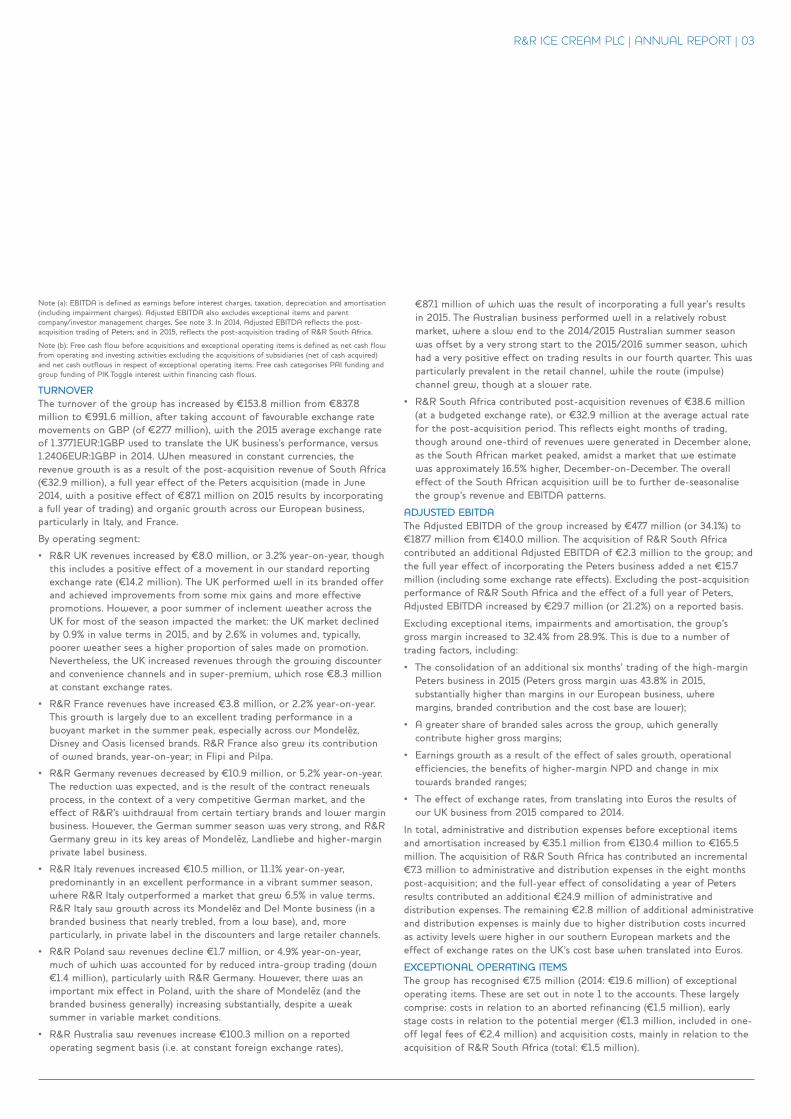
R&R ICE CREAM PLC | ANNUAL REPORT | 03
Note (a): EBITDA is defined as earnings before interest charges, taxation, depreciation and amortisation(including impairment charges). Adjusted EBITDA also excludes exceptional items and parentcompany/investor management charges. See note 3. In 2014, Adjusted EBITDA reflects the post-acquisition trading of Peters; and in 2015, reflects the post-acquisition trading of R&R South Africa.
Note (b): Free cash flow before acquisitions and exceptional operating items is defined as net cash flowfrom operating and investing activities excluding the acquisitions of subsidiaries (net of cash acquired)and net cash outflows in respect of exceptional operating items. Free cash categorises PAI funding andgroup funding of PIK Toggle interest within financing cash flows.
TURNOVERThe turnover of the group has increased by ¤153.8 million from ¤837.8million to ¤991.6 million, after taking account of favourable exchange ratemovements on GBP (of ¤27.7 million), with the 2015 average exchange rateof 1.3771EUR:1GBP used to translate the UK business’s performance, versus1.2406EUR:1GBP in 2014. When measured in constant currencies, therevenue growth is as a result of the post-acquisition revenue of South Africa(¤32.9 million), a full year effect of the Peters acquisition (made in June2014, with a positive effect of ¤87.1 million on 2015 results by incorporatinga full year of trading) and organic growth across our European business,particularly in Italy, and France.
By operating segment:
• R&R UK revenues increased by ¤8.0 million, or 3.2% year-on-year, thoughthis includes a positive effect of a movement in our standard reportingexchange rate (¤14.2 million). The UK performed well in its branded offerand achieved improvements from some mix gains and more effectivepromotions. However, a poor summer of inclement weather across theUK for most of the season impacted the market: the UK market declinedby 0.9% in value terms in 2015, and by 2.6% in volumes and, typically,poorer weather sees a higher proportion of sales made on promotion.Nevertheless, the UK increased revenues through the growing discounterand convenience channels and in super-premium, which rose ¤8.3 millionat constant exchange rates.
• R&R France revenues have increased ¤3.8 million, or 2.2% year-on-year.This growth is largely due to an excellent trading performance in abuoyant market in the summer peak, especially across our Mondelez,Disney and Oasis licensed brands. R&R France also grew its contributionof owned brands, year-on-year; in Flipi and Pilpa.
• R&R Germany revenues decreased by ¤10.9 million, or 5.2% year-on-year.The reduction was expected, and is the result of the contract renewalsprocess, in the context of a very competitive German market, and theeffect of R&R’s withdrawal from certain tertiary brands and lower marginbusiness. However, the German summer season was very strong, and R&RGermany grew in its key areas of Mondelez, Landliebe and higher-marginprivate label business.
• R&R Italy revenues increased ¤10.5 million, or 11.1% year-on-year,predominantly in an excellent performance in a vibrant summer season,where R&R Italy outperformed a market that grew 6.5% in value terms.R&R Italy saw growth across its Mondelez and Del Monte business (in abranded business that nearly trebled, from a low base), and, moreparticularly, in private label in the discounters and large retailer channels.
• R&R Poland saw revenues decline ¤1.7 million, or 4.9% year-on-year,much of which was accounted for by reduced intra-group trading (down¤1.4 million), particularly with R&R Germany. However, there was animportant mix effect in Poland, with the share of Mondelez (and thebranded business generally) increasing substantially, despite a weaksummer in variable market conditions.
• R&R Australia saw revenues increase ¤100.3 million on a reportedoperating segment basis (i.e. at constant foreign exchange rates),
¤87.1 million of which was the result of incorporating a full year’s resultsin 2015. The Australian business performed well in a relatively robustmarket, where a slow end to the 2014/2015 Australian summer seasonwas offset by a very strong start to the 2015/2016 summer season, whichhad a very positive effect on trading results in our fourth quarter. This wasparticularly prevalent in the retail channel, while the route (impulse)channel grew, though at a slower rate.
• R&R South Africa contributed post-acquisition revenues of ¤38.6 million(at a budgeted exchange rate), or ¤32.9 million at the average actual ratefor the post-acquisition period. This reflects eight months of trading,though around one-third of revenues were generated in December alone,as the South African market peaked, amidst a market that we estimatewas approximately 16.5% higher, December-on-December. The overalleffect of the South African acquisition will be to further de-seasonalisethe group’s revenue and EBITDA patterns.
ADJUSTED EBITDAThe Adjusted EBITDA of the group increased by ¤47.7 million (or 34.1%) to¤187.7 million from ¤140.0 million. The acquisition of R&R South Africacontributed an additional Adjusted EBITDA of ¤2.3 million to the group; andthe full year effect of incorporating the Peters business added a net ¤15.7million (including some exchange rate effects). Excluding the post-acquisitionperformance of R&R South Africa and the effect of a full year of Peters,Adjusted EBITDA increased by ¤29.7 million (or 21.2%) on a reported basis.
Excluding exceptional items, impairments and amortisation, the group’sgross margin increased to 32.4% from 28.9%. This is due to a number oftrading factors, including:
• The consolidation of an additional six months’ trading of the high-marginPeters business in 2015 (Peters gross margin was 43.8% in 2015,substantially higher than margins in our European business, wheremargins, branded contribution and the cost base are lower);
• A greater share of branded sales across the group, which generallycontribute higher gross margins;
• Earnings growth as a result of the effect of sales growth, operationalefficiencies, the benefits of higher-margin NPD and change in mixtowards branded ranges;
• The effect of exchange rates, from translating into Euros the results ofour UK business from 2015 compared to 2014.
In total, administrative and distribution expenses before exceptional itemsand amortisation increased by ¤35.1 million from ¤130.4 million to ¤165.5million. The acquisition of R&R South Africa has contributed an incremental¤7.3 million to administrative and distribution expenses in the eight monthspost-acquisition; and the full-year effect of consolidating a year of Petersresults contributed an additional ¤24.9 million of administrative anddistribution expenses. The remaining ¤2.8 million of additional administrativeand distribution expenses is mainly due to higher distribution costs incurredas activity levels were higher in our southern European markets and theeffect of exchange rates on the UK’s cost base when translated into Euros.
EXCEPTIONAL OPERATING ITEMSThe group has recognised ¤7.5 million (2014: ¤19.6 million) of exceptionaloperating items. These are set out in note 1 to the accounts. These largelycomprise: costs in relation to an aborted refinancing (¤1.5 million), earlystage costs in relation to the potential merger (¤1.3 million, included in one-off legal fees of ¤2.4 million) and acquisition costs, mainly in relation to theacquisition of R&R South Africa (total: ¤1.5 million).
-
-
-
-
RIC-B0237a R&R Annual Report 2015.qxp_Layout 1 02/03/2016 12:21 Page 6
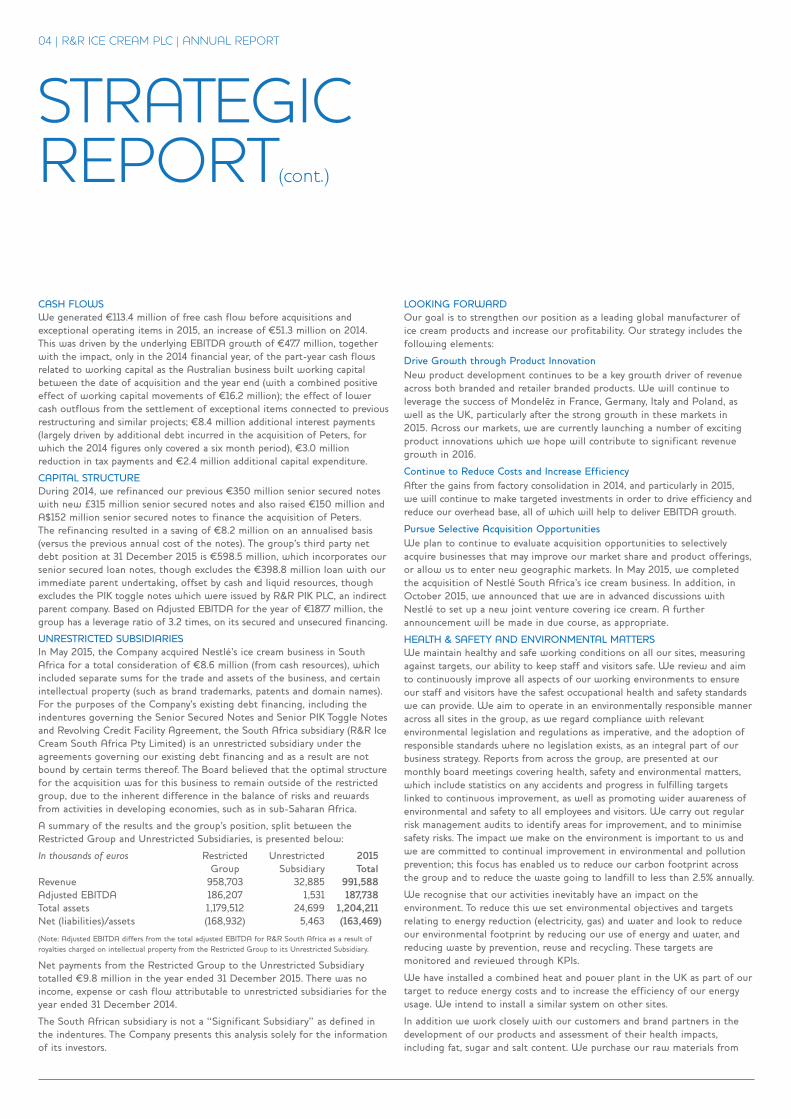
STRATEGICREPORT(cont.)
04 | R&R ICE CREAM PLC | ANNUAL REPORT
CASH FLOWSWe generated ¤113.4 million of free cash flow before acquisitions andexceptional operating items in 2015, an increase of ¤51.3 million on 2014.This was driven by the underlying EBITDA growth of ¤47.7 million, togetherwith the impact, only in the 2014 financial year, of the part-year cash flowsrelated to working capital as the Australian business built working capitalbetween the date of acquisition and the year end (with a combined positiveeffect of working capital movements of ¤16.2 million); the effect of lowercash outflows from the settlement of exceptional items connected to previousrestructuring and similar projects; ¤8.4 million additional interest payments(largely driven by additional debt incurred in the acquisition of Peters, forwhich the 2014 figures only covered a six month period), ¤3.0 millionreduction in tax payments and ¤2.4 million additional capital expenditure.
CAPITAL STRUCTUREDuring 2014, we refinanced our previous ¤350 million senior secured noteswith new £315 million senior secured notes and also raised ¤150 million andA$152 million senior secured notes to finance the acquisition of Peters.The refinancing resulted in a saving of ¤8.2 million on an annualised basis(versus the previous annual cost of the notes). The group’s third party netdebt position at 31 December 2015 is ¤598.5 million, which incorporates oursenior secured loan notes, though excludes the ¤398.8 million loan with ourimmediate parent undertaking, offset by cash and liquid resources, thoughexcludes the PIK toggle notes which were issued by R&R PIK PLC, an indirectparent company. Based on Adjusted EBITDA for the year of ¤187.7 million, thegroup has a leverage ratio of 3.2 times, on its secured and unsecured financing.
UNRESTRICTED SUBSIDIARIESIn May 2015, the Company acquired Nestlé’s ice cream business in SouthAfrica for a total consideration of ¤8.6 million (from cash resources), whichincluded separate sums for the trade and assets of the business, and certainintellectual property (such as brand trademarks, patents and domain names).For the purposes of the Company’s existing debt financing, including theindentures governing the Senior Secured Notes and Senior PIK Toggle Notesand Revolving Credit Facility Agreement, the South Africa subsidiary (R&R IceCream South Africa Pty Limited) is an unrestricted subsidiary under theagreements governing our existing debt financing and as a result are notbound by certain terms thereof. The Board believed that the optimal structurefor the acquisition was for this business to remain outside of the restrictedgroup, due to the inherent difference in the balance of risks and rewardsfrom activities in developing economies, such as in sub-Saharan Africa.
A summary of the results and the group’s position, split between theRestricted Group and Unrestricted Subsidiaries, is presented below:
In thousands of euros Restricted Unrestricted 2015 Group Subsidiary TotalRevenue 958,703 32,885 991,588Adjusted EBITDA 186,207 1,531 187,738Total assets 1,179,512 24,699 1,204,211Net (liabilities)/assets (168,932) 5,463 (163,469)
(Note: Adjusted EBITDA differs from the total adjusted EBITDA for R&R South Africa as a result ofroyalties charged on intellectual property from the Restricted Group to its Unrestricted Subsidiary.
Net payments from the Restricted Group to the Unrestricted Subsidiarytotalled ¤9.8 million in the year ended 31 December 2015. There was noincome, expense or cash flow attributable to unrestricted subsidiaries for theyear ended 31 December 2014.
The South African subsidiary is not a “Significant Subsidiary” as defined inthe indentures. The Company presents this analysis solely for the informationof its investors.
LOOKING FORWARDOur goal is to strengthen our position as a leading global manufacturer ofice cream products and increase our profitability. Our strategy includes thefollowing elements:
Drive Growth through Product InnovationNew product development continues to be a key growth driver of revenueacross both branded and retailer branded products. We will continue toleverage the success of Mondelez in France, Germany, Italy and Poland, aswell as the UK, particularly after the strong growth in these markets in2015. Across our markets, we are currently launching a number of excitingproduct innovations which we hope will contribute to significant revenuegrowth in 2016.
Continue to Reduce Costs and Increase EfficiencyAfter the gains from factory consolidation in 2014, and particularly in 2015,we will continue to make targeted investments in order to drive efficiency andreduce our overhead base, all of which will help to deliver EBITDA growth.
Pursue Selective Acquisition OpportunitiesWe plan to continue to evaluate acquisition opportunities to selectivelyacquire businesses that may improve our market share and product offerings,or allow us to enter new geographic markets. In May 2015, we completedthe acquisition of Nestlé South Africa’s ice cream business. In addition, inOctober 2015, we announced that we are in advanced discussions withNestlé to set up a new joint venture covering ice cream. A furtherannouncement will be made in due course, as appropriate.
HEALTH & SAFETY AND ENVIRONMENTAL MATTERSWe maintain healthy and safe working conditions on all our sites, measuringagainst targets, our ability to keep staff and visitors safe. We review and aimto continuously improve all aspects of our working environments to ensureour staff and visitors have the safest occupational health and safety standardswe can provide. We aim to operate in an environmentally responsible manneracross all sites in the group, as we regard compliance with relevantenvironmental legislation and regulations as imperative, and the adoption ofresponsible standards where no legislation exists, as an integral part of ourbusiness strategy. Reports from across the group, are presented at ourmonthly board meetings covering health, safety and environmental matters,which include statistics on any accidents and progress in fulfilling targetslinked to continuous improvement, as well as promoting wider awareness ofenvironmental and safety to all employees and visitors. We carry out regularrisk management audits to identify areas for improvement, and to minimisesafety risks. The impact we make on the environment is important to us andwe are committed to continual improvement in environmental and pollutionprevention; this focus has enabled us to reduce our carbon footprint acrossthe group and to reduce the waste going to landfill to less than 2.5% annually.
We recognise that our activities inevitably have an impact on theenvironment. To reduce this we set environmental objectives and targetsrelating to energy reduction (electricity, gas) and water and look to reduceour environmental footprint by reducing our use of energy and water, andreducing waste by prevention, reuse and recycling. These targets aremonitored and reviewed through KPIs.
We have installed a combined heat and power plant in the UK as part of ourtarget to reduce energy costs and to increase the efficiency of our energyusage. We intend to install a similar system on other sites.
In addition we work closely with our customers and brand partners in thedevelopment of our products and assessment of their health impacts,including fat, sugar and salt content. We purchase our raw materials from
-
RIC-B0237a R&R Annual Report 2015.qxp_Layout 1 02/03/2016 12:21 Page 7
R&R ICE CREAM PLC | ANNUAL REPORT | 05
sustainable sources and use recycled card and paper where possible. Health,safety and the environment is an area we continue to focus on within thecontext of the market sector we operate in including the development ofhealthier alternatives such as the use of natural juices and frozen yoghurt.
SOCIAL AND COMMUNITY MATTERSWe strive to be a good corporate citizen recognising our responsibility towork in partnership with the communities in which we operate. Each yearwe donate a part of our profits to local charities as well as providingindirect giving in terms of free-of-charge products that charities andcommunities can use to raise funds and we also encourage active employeesupport for their community or chosen charities. As a business we haveselected two main charities that we support, with a strong focus on childrenand young people: Hope and Homes for Children which is an internationalcharity that aims to close orphanages and place children into family homesand The British Bobsleigh Youth programme which supported the youthtraining preparation for the February 2016 Youth Olympics. The business hasprovided our charities with donations totalling over £60,000 during the pastyear alone.
BUSINESS ETHICSWe are committed to conducting our business in an ethically and sociallyresponsible attitude and treating employees, customers, suppliers andshareholders in a fair, open and honest manner. As a business we areregularly audited, by both independent auditors and by our customers;in addition we audit our supply chain to ensure that we are buying frombusinesses who operate in an ethically and socially responsible manner.We encourage staff feedback on any issues they are concerned about,operating an anonymous whistleblowing hotline that gives employees in allbusinesses around the group the chance to report anything they believe isnot meeting our exacting standards.
EMPLOYEESThe group provides channels through which our employees can express viewsand communicate regularly with senior management of the business.We also have a number of employee consultative committees and workscouncils to provide a forum for our employees to air the views of theircolleagues and receive and discuss relevant issues. We conduct annual staffsurveys across the group, in order to ensure that the board and seniormanagers respond to employee feedback this engagement has resulted in avariety of initiatives being implemented which have aided the trust andengagement of employees with the business.
The group is committed to training and development that improvesworkforce capabilities, skills and competencies. We recruit a large number ofyoung people across our business each year, and in many cases support theseyoung people through apprenticeships, work-based training or externalqualifications. We also develop our long-term succession planning by a talentmanagement programme.
KEY PERFORMANCE INDICATORS (‘KPIs’)In addition to the measures discussed in the performance summary andhighlights, there are a number of key performance indicators used across thegroup on a daily, weekly and monthly basis. These monitor performance ofthe operations compared to budget and forecast. The most significant ofthese are set out below:
KPIs monitored on a daily basis are:
• Production volume
• Sales volume and value
• Order intake
KPIs monitored weekly/monthly are the above plus:
• Sales margins
• Profit and cash generation
• Net debt
• Variances to standard cost
• Food safety and quality
• Health and safety
• Service levels
• Inventory levels
• Market share
PRINCIPAL RISKS AND UNCERTAINTIESThe Directors of the group consider the potential impact of business risks atmonthly Board meetings. Actions to mitigate the risks are also discussed.The more significant risks and uncertainties faced by the group are set outbelow:
• Exchange rates. Given that the group reports in Euros, any strengtheningof the Euro relative to Pounds Sterling and/or the Australian dollar wouldadversely affect the contribution from the UK and/or Australia to groupprofitability. (There is also a similar risk, though substantially smaller, inrespect of the Polish Zloty.) Following the acquisition of R&R SouthAfrica, a corresponding risk also impacts the group in respect of the SouthAfrican Rand. With five currencies in the group, there is an element ofcurrency diversification, reducing the risk.
• Price and supply fluctuations. Whilst we look to hedge most of ourrequirements for a term of up to one year, any unhedged raw materials,including dairy which we can potentially only partially hedge, may presentadditional cost.
• Acquisition strategies. Whilst we undertake detailed due diligence aheadof any acquisition, there is the potential that acquisitions may expose us toadditional unforeseen risk.
• Fire or significant damage to a factory. Whilst production can be switchedto other sites across the group, any significant damage to a factory unitwill cause short-term disruption.
• Seasonality. The ice cream market is characterised by fluctuations in sales,although these largely equalise out over the course of a year. Ice creamsales are inextricably linked with the seasons and therefore any climatechanges have the potential to impact on business. The group has partlyde-seasonalised through our southern hemisphere acquisitions to date.
• Competition in the ice cream industry. The group operates in highlycompetitive markets, often competing with substantial multinationalbusinesses, and with large, profitable retail customers and its failure tocompete effectively could result in a material adverse effect on its results.
• Economic conditions. The group derives the majority of its profits fromsales activity in Germany, France, Italy, the UK and Australia. It is thereforesensitive to fluctuations in the economic conditions of these countries.
The Board has strategies to manage these risks and remains confident in thegroup’s ability to mitigate any significant effect.
RIC-B0237a R&R Annual Report 2015.qxp_Layout 1 02/03/2016 12:21 Page 8
06 | R&R ICE CREAM PLC | ANNUAL REPORT
STRATEGICREPORT(cont.)
FINANCIAL RISK MANAGEMENT POLICIES AND OBJECTIVESThe group finances its activities with a combination of loan notes,shareholder loan notes, debt factoring, cash and revolving credit facilities.Other financial assets and liabilities arise directly from the group’s operatingactivities. The main risks associated with the group’s financial assets andliabilities are set out as below:
• The group’s functional currency is the Euro. Its UK operation buys certaingoods and sells almost all goods denominated in Sterling. Similarly, theAustralian operation buys certain goods and sells almost all goodsdenominated in Australian dollars. As a result the value of the group’sSterling and Australian dollar revenues, purchases, financial assets andliabilities and cash flows can be affected significantly by movements in theSterling and Australian dollar exchange rates. To a lesser extent, due tothe smaller size of the Polish and South African businesses, this is alsotrue of the Zloty and South African Rand.
• The group’s loan notes are denominated and serviced in Euros, Sterlingand Australian dollars; whilst the group believes that it has put in place aneffective hedging strategy with regard to those liabilities, there remainsthe risk of mismatch between the underlying cash flows, assets andliabilities of the group’s trading subsidiaries and the group’s loan noteliabilities and debt servicing obligations.
• The shareholder loan notes are denominated in Euros and bear interest atfixed rates. Consequently, there is no foreign exchange risk or interest raterisk on these instruments.
The group aims to mitigate liquidity risk by managing cash generation by itsoperations and applying cash collection targets throughout the group.Investment is carefully controlled, with authorisation limits operating up togroup Board level.
Further details of the group’s risk management policy, including hedgingpolicies, are provided on pages 16 and 33 of the annual report.
By order of the Board
A FinneranSecretary29 February 2016
RIC-B0237a R&R Annual Report 2015.qxp_Layout 1 02/03/2016 12:21 Page 9
R&R ICE CREAM PLC | ANNUAL REPORT | 07
CORPORATEGOVERNANCE
OWNERSHIP AND BOARD OF DIRECTORSThe group is majority-owned by funds held by, or advised by, PAI PartnersSAS (‘PAI’), a private equity firm headquartered in Paris, France.
PAI is one of the oldest and most experienced private equity firms in Europewith its origins dating back to Paribas Affaires Industrielles, the historicalprincipal investment activity of Paribas, the pan-European merchant bank,which merged with BNP in 1999.
PAI has invested in the group via a corporate structure in Luxembourg. Ourultimate parent undertaking is Riviera Topco Sarl which controls 100% of theshares of R&R Ice Cream plc via a number of intermediate parent companies.
Riviera Topco Sarl acquired R&R Ice Cream plc via a UK holding companystructure of which Riviera Topco Limited is the ultimate UK parent.
BOARD OF DIRECTORSThe Board is responsible for the overall operations of the group, includingthe final approval of the strategic plan, annual budget, changes to thegroup’s financing arrangements, acquisitions and disposals, material contractsand significant capital expenditure.
During the year, the Board comprised the following Directors:
Ibrahim Najafi Chief Executive OfficerAndy Finneran Chief Financial Officer and Company SecretaryOversight is provided by the Board of a parent company (Riviera TopcoLimited), which is represented by:Ian Fraser Non-Executive Director of Riviera Topco Limited (Chairman)Colm O’Sullivan PAI representativeFrédéric Stévenin PAI representativeGaëlle d’Engremont PAI representativeChristopher Afors PAI representativeEugenio Minvielle Non-Executive Director of Riviera Topco Limited (resigned 31 December 2015)
Ibrahim Najafi has served as our Chief Executive Officer since July 2013 andwas previously European Chief Executive Officer and Group Chief OperatingOfficer from June 2009 and 2006, respectively. Prior to that, Mr Najafiserved as Richmond’s operations director from 1999 to 2007 and as thefactory manager at Richmond’s Leeming Bar site from 1998 to 1999. Prior tothat, Mr Najafi served in various factory management roles in the chilledfoods sector.
Andy Finneran has served as our Chief Financial Officer and Secretary sinceour inception. Mr Finneran held a similar position at Richmond from 1995 to2005. Prior to that, Mr Finneran served as Treats’ head of accounting andfinance. Mr Finneran qualified as a chartered accountant (ACA) in 1984.
Ian Fraser was appointed Non-Executive Chairman of the Board on 9October 2014. Mr Fraser is a board member at German auto parts retailerand service provider ATU, and Chairman of the Priory Group until February2016. He was a Non-Executive Director and Chairman of the AuditCommittee at Punch Taverns from 2004 to 2012. Mr Fraser was previouslyTrading Director at Safeway, COO of Orange UK, CEO of Enterprise Groupand CEO of the automotive specialist Kwik Fit.
Colm O’Sullivan joined PAI in 2006 and since 2008 he has headed PAI’s UKoffice. Mr O’Sullivan was previously at Deutsche Bank where he spent eightyears in the Financial Sponsors’ group. Prior to this, he spent six years withHambros Bank. He is also currently a non-executive director of VPS and CST.
Frédéric Stévenin joined PAI in 1993 and is responsible for the Food &Consumer Goods and Healthcare sector teams. In 1998, he joined DeutscheBank/Bankers Trust before returning to PAI in June 2011. Prior to this, MrStévenin spent four years with Banque Paribas. He is also a non-executivedirector of Chr. Hansen, Cerba and Marcolin.
Gaëlle d’Engremont joined PAI in 2004 and is a member of the Food &Consumer Goods sector team. Prior to this, Mme. d’Engremont worked forfour years with Casino and two years with Unibail.
Christopher Afors joined PAI in 2008. He has been involved in a number oftransactions including United Biscuits, R&R Ice Cream and VPS. Prior to2008, Mr Afors spent five years with JPMorgan in London working in theM&A and Equity Capital Markets teams.
EXECUTIVE TEAM AND MANAGEMENT BOARDThe Executive team and management board is responsible for the day-to-dayoperations of the group and the development of the group’s businessstrategy and plans for consideration by the Board.
The Executive team and management board comprises the Chief ExecutiveOfficer and Chief Financial Officer, as well the following individuals:
Philip Griffin Chief Marketing Officer
Pietro Monaco Chief Operations Officer
Peter Pickthall Human Resources Director (retired 31 December 2015)
Neil Millan European HR and Group Talent Director
Sam Wrist Integration Director
Michael Fraine Country Head - UK
Fabrice Ducasse Country Head - France
Gotthard Kirchner Country Head - Germany
Antonio Mazzezi Country Head – Italy
Zbigniew Dysko Country Head – Poland
Stephen Audsley Country Head – Australia
Mr Pickthall, who joined the senior management team in 2001, has taken upretirement at the end of the year and his role as HR Director will be takenup by Mr Millan. The Board wishes to place on record its thanks to MrPickthall for his service and commitment to the group over the last 15 years,as the group’s first HR director.
BOARD COMMITTEESThe Audit Committee and Remuneration Committee at a Riviera TopcoLimited level have oversight of the governance of the group.
AUDIT AND RISK COMMITTEEThe Audit and Risk Committee consists of Colm O’Sullivan, Gaëlled’Engremont, Christopher Afors and the Chairman, all of whom are on theBoard of Directors of Riviera Topco Limited. It is chaired by Ian Fraser.
The committee meets at least three times a year, at appropriate times in thereporting and audit cycle. In addition, the committee meets at such othertimes as the Board or the committee Chairman requires, or if requested bythe group’s external auditor. Only committee members have the right toattend meetings but, in practice, other individuals, including members of thegroup board and other members of the senior finance team are invited toattend all or part of meetings as and when appropriate to their area ofexpertise. The external auditor also attends certain meetings.
RIC-B0237a R&R Annual Report 2015.qxp_Layout 1 02/03/2016 12:21 Page 10
08 | R&R ICE CREAM PLC | ANNUAL REPORT
CORPORATEGOVERNANCE (cont.)
The committee’s responsibilities include overseeing the relationship with theexternal auditor. It meets with them regularly, reviews the audit plan anddiscusses audit findings with them. The committee’s responsibilities alsoinclude the evaluation of management’s risk framework and communicatingthe importance of internal control and the management of risk.
The group changed its auditor from KPMG to PricewaterhouseCoopersfollowing a competitive tender overseen by the Audit Committee. KPMGhas been the group’s auditor since 1998 and the Board wishes to thankKPMG for its service during that period.
REMUNERATION COMMITTEEThe Remuneration Committee consists of Colm O’Sullivan, Frédéric Stéveninand Ian Fraser, all of whom are on the Board of Directors of Riviera TopcoLimited. It is chaired by Colm O’Sullivan.
The committee meets at least twice a year and also at such other times asrequired. Only committee members have the right to attend meetings, butother individuals are invited to attend from time to time, when appropriate.
The committee’s responsibilities include determining and agreeing theannual remuneration of the executive directors and approving the design ofthe group’s annual incentive plans.
RIC-B0237a R&R Annual Report 2015.qxp_Layout 1 02/03/2016 12:21 Page 11
R&R ICE CREAM PLC | ANNUAL REPORT | 09
DIRECTORS’REPORT
The Directors present their report and the audited group financialstatements for the year ended 31 December 2015.
FUTURE DEVELOPMENTS Future developments for the group and the risks and uncertainties facing thebusiness can be found in the strategic report.
DIVIDENDS The Directors do not recommend the payment of a dividend (2014: ¤nil).
RESEARCH AND DEVELOPMENT There are ongoing research and development projects at each of the group’slocations, primarily concentrated on new ice cream design and recipes.
EMPLOYEESThe group operates a framework for employee information and consultationin line with the Information and Consultation of Employees Regulations2004. Throughout the year the group issues information on its website. InGermany the group works closely with the Works Council and complies withBetriebsverfassungsgesetz (BetrVG) (works constitution act). Further detailsof our employee involvement schemes are included within the StrategicReport.
The group gives full consideration to applications for employment fromdisabled persons where the candidate displays particular aptitudes andabilities are consistent with adequately meeting the requirements of the job.Opportunities are available to disabled employees for training, careerdevelopment and promotion. We seek to continue the employment of, andarrange appropriate training for, any of the group employees who havebecome disabled during the period in which the group employed them.
DIRECTORS
The Directors who served during the year are as follows:
Ibrahim Najafi
Andy Finneran
As permitted by the Articles of Association, each of the Directors has thebenefit of an indemnity, which is a qualifying third-party indemnity asdefined by Section 234 of the Companies Act 2006. The indemnity was inforce throughout the tenure of each Director during the year, and iscurrently in force. The Company also maintains Directors’ and Officers’liability insurance in respect of itself and its Directors. No indemnity isprovided for the Company’s auditors.
FINANCIAL RISK MANAGEMENT Please see the Strategic Report.
INDEPENDENT AUDITORSIn November 2015, following a competitive tender overseen by the AuditCommittee, the Company changed its auditors from KPMG LLP toPricewaterhouseCoopers LLP. In accordance with Section 487 of theCompanies Act 2006, a resolution to reappoint PricewaterhouseCoopersLLP as auditors will be put to the members at the Annual General Meeting.
DIRECTORS’ STATEMENT AS TO DISCLOSURE OF INFORMATION TOTHE AUDITORSThe Directors who were members of the Board at the time of approving theDirectors’ Report are listed on page 7. Having made enquiries of fellowDirectors and of the company’s auditors, each of these confirms that:
• to the best of each Director’s knowledge and belief, there is noinformation relevant to the preparation of their report of which thecompany’s auditors are unaware; and
• each Director has taken all the steps a Director might reasonably beexpected to have taken to be aware of relevant audit information and toestablish that the company’s auditors are aware of that information.
By order of the Board
A FinneranSecretary29 February 2016
RIC-B0237a R&R Annual Report 2015.qxp_Layout 1 02/03/2016 12:21 Page 12
10 | R&R ICE CREAM PLC | ANNUAL REPORT
STATEMENTOF DIRECTORS'RESPONSIBILITIESSTATEMENT OF DIRECTORS’ RESPONSIBILITIESIN RESPECT OF THE ANNUAL REPORT
The Directors are responsible for preparing the Annual Report and thegroup and parent company financial statements in accordance withapplicable law and regulations.
Company law requires the Directors to prepare group and parent companyfinancial statements for each financial year. Under that law they have electedto prepare the group financial statements in accordance with IFRSs asadopted by the EU and applicable law and have elected to prepare theparent company financial statements in accordance with UK AccountingStandards and applicable law (UK Generally Accepted Accounting Practice),including Financial Reporting Standard 101 “Reduced Disclosure Framework”(FRS101).
Under company law the Directors must not approve the financial statementsunless they are satisfied that they give a true and fair view of the state ofaffairs of the group and parent company and of the group’s profit or loss forthat period.
In preparing each of the group and parent company financial statements, theDirectors are required to:
• select suitable accounting policies and then apply them consistently;
• make judgements and estimates that are reasonable and prudent;
• for the group financial statements, state whether they have been preparedin accordance with IFRSs as adopted by the EU;
• for the parent company financial statements, state whether applicable UKAccounting Standards, including FRS101, have been followed, subject toany material departures disclosed and explained in the financialstatements;
• Notify its shareholders in writing about the use of disclosure exemptions,if any, of FRS101 used in the preparation of the financial statements: and
• prepare the financial statements on the going concern basis unless it isinappropriate to presume that the group and the parent company willcontinue in business.
The Directors are responsible for keeping adequate accounting records thatare sufficient to show and explain the parent company's transactions anddisclose with reasonable accuracy at any time the financial position of theparent company and enable them to ensure that its financial statementscomply with the Companies Act 2006. They have general responsibility fortaking such steps as are reasonably open to them to safeguard the assets ofthe group and to prevent and detect fraud and other irregularities.
The Directors are responsible for the maintenance and integrity of thecorporate and financial information included on the company’s website.Legislation in the UK governing the preparation and dissemination offinancial statements may differ from legislation in other jurisdictions.
By order of the Board
A FinneranSecretary29 February 2016
RIC-B0237a R&R Annual Report 2015.qxp_Layout 1 02/03/2016 12:21 Page 13
R&R ICE CREAM PLC | ANNUAL REPORT | 11
INDEPENDENT AUDITORS’ REPORT TO THE MEMBERSOF R&R ICE CREAM plc
INDEPENDENT AUDITORS’ REPORT
REPORT ON THE FINANCIAL STATEMENTSOur opinionIn our opinion:
• R&R Ice Cream plc’s group financial statements and company financialstatements (the “financial statements”) give a true and fair view of thestate of the group’s and of the company’s affairs as at 31 December 2015and of the group’s profit and cash flows for the year then ended;
• the group financial statements have been properly prepared in accordancewith International Financial Reporting Standards (“IFRSs”) as adopted bythe European Union;
• the company financial statements have been properly prepared inaccordance with United Kingdom Generally Accepted Accounting Practice;and
• the financial statements have been prepared in accordance with therequirements of the Companies Act 2006.
What we have auditedThe financial statements, included within the Annual Report, comprise:
• the consolidated income statement and consolidated statement ofcomprehensive income for the year then ended;
• the consolidated statement of changes in equity for the year then ended;
• the consolidated statement of financial position as at 31 December 2015;
• the consolidated statement of cash flows for the year then ended;
• the company only statement of financial position as at 31 December 2015;
• the statement of changes in equity for the year then ended;
• the accounting policies; and
• the notes to the financial statements, which include other explanatoryinformation.
The financial reporting framework that has been applied in the preparation ofthe group financial statements is applicable law and IFRSs as adopted by theEuropean Union. The financial reporting framework that has been applied inthe preparation of the company financial statements is applicable law andUnited Kingdom Accounting Standards (United Kingdom Generally AcceptedAccounting Practice), including FRS 101 “Reduced Disclosure Framework”.
In applying the financial reporting framework, the Directors have made anumber of subjective judgements, for example in respect of significantaccounting estimates. In making such estimates, they have made assumptionsand considered future events.
OPINION ON OTHER MATTERS PRESCRIBED BY THE COMPANIES ACT 2006In our opinion:
• the information given in the Strategic Report and the Directors’ Reportfor the financial year for which the financial statements are prepared isconsistent with the financial statements.
OTHER MATTERS ON WHICH WE ARE REQUIRED TO REPORT BYEXCEPTIONAdequacy of accounting records and information and explanations receivedUnder the Companies Act 2006 we are required to report to you if, in ouropinion:
• we have not received all the information and explanations we require forour audit; or
• adequate accounting records have not been kept by the company, orreturns adequate for our audit have not been received from branches notvisited by us; or
• the company financial statements are not in agreement with theaccounting records and returns.
We have no exceptions to report arising from this responsibility.
Directors’ remunerationUnder the Companies Act 2006 we are required to report to you if, in ouropinion, certain disclosures of Directors’ remuneration specified by law arenot made. We have no exceptions to report arising from this responsibility.
RESPONSIBILITIES FOR THE FINANCIAL STATEMENTS AND THE AUDITOur responsibilities and those of the DirectorsAs explained more fully in the Directors' Responsibility Statement, theDirectors are responsible for the preparation of the financial statements andfor being satisfied that they give a true and fair view.
Our responsibility is to audit and express an opinion on the financialstatements in accordance with applicable law and International Standards onAuditing (UK and Ireland) (“ISAs (UK & Ireland)”). Those standards require usto comply with the Auditing Practices Board’s Ethical Standards for Auditors.
This report, including the opinions, has been prepared for and only for thecompany’s members as a body in accordance with Chapter 3 of Part 16 ofthe Companies Act 2006 and for no other purpose. We do not, in givingthese opinions, accept or assume responsibility for any other purpose or toany other person to whom this report is shown or into whose hands it maycome save where expressly agreed by our prior consent in writing.
What an audit of financial statements involvesWe conducted our audit in accordance with ISAs (UK & Ireland). An auditinvolves obtaining evidence about the amounts and disclosures in thefinancial statements sufficient to give reasonable assurance that the financialstatements are free from material misstatement, whether caused by fraud orerror. This includes an assessment of:
• whether the accounting policies are appropriate to the group’s and thecompany’s circumstances and have been consistently applied andadequately disclosed;
• the reasonableness of significant accounting estimates made by theDirectors; and
• the overall presentation of the financial statements.
RIC-B0237a R&R Annual Report 2015.qxp_Layout 1 02/03/2016 12:21 Page 14
12 | R&R ICE CREAM PLC | ANNUAL REPORT
INDEPENDENT AUDITORS’ REPORT(cont.)
We primarily focus our work in these areas by assessing the Directors’judgements against available evidence, forming our own judgements, andevaluating the disclosures in the financial statements.
We test and examine information, using sampling and other auditingtechniques, to the extent we consider necessary to provide a reasonablebasis for us to draw conclusions. We obtain audit evidence through testingthe effectiveness of controls, substantive procedures or a combination ofboth.
In addition, we read all the financial and non-financial information in theAnnual Report to identify material inconsistencies with the audited financialstatements and to identify any information that is apparently materiallyincorrect based on, or materially inconsistent with, the knowledge acquiredby us in the course of performing the audit. If we become aware of anyapparent material misstatements or inconsistencies we consider theimplications for our report.
Ian Morrison (Senior Statutory Auditor)for and on behalf of PricewaterhouseCoopers LLPChartered Accountants and Statutory AuditorsLeeds
29 February 2016
RIC-B0237a R&R Annual Report 2015.qxp_Layout 1 02/03/2016 12:21 Page 15
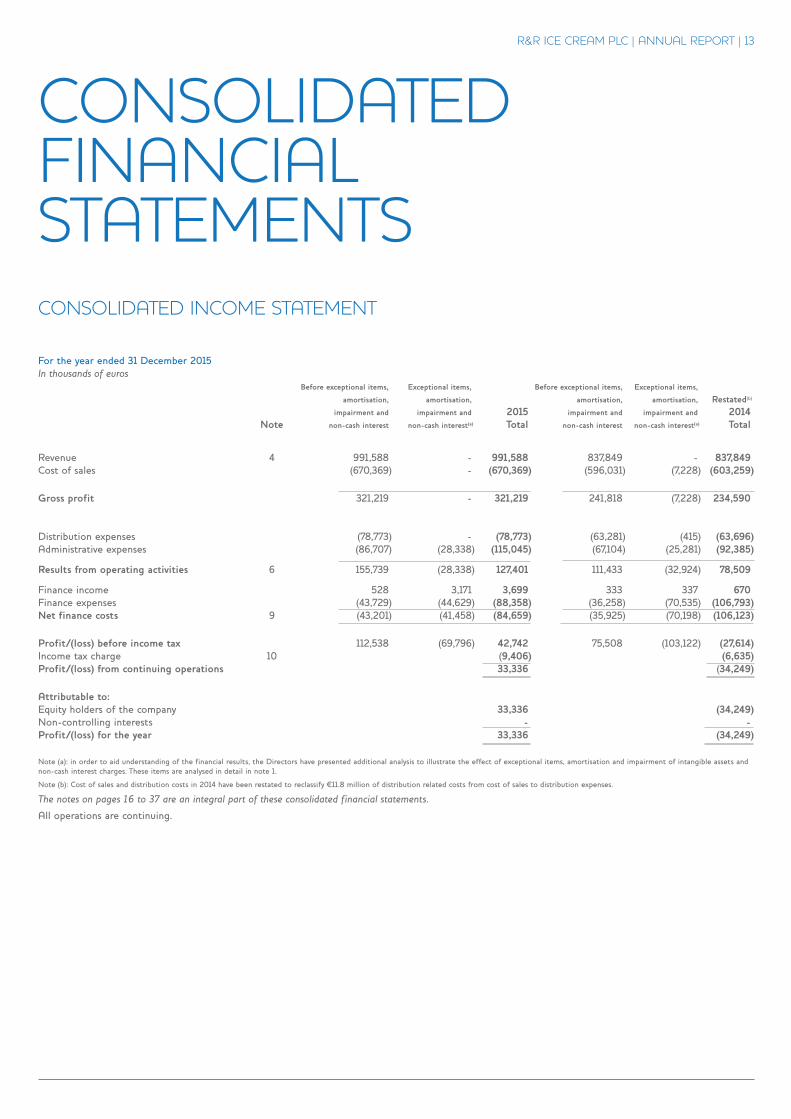
R&R ICE CREAM PLC | ANNUAL REPORT | 13
CONSOLIDATED FINANCIAL STATEMENTSCONSOLIDATED INCOME STATEMENT
For the year ended 31 December 2015In thousands of euros Before exceptional items, Exceptional items, Before exceptional items, Exceptional items, amortisation, amortisation, amortisation, amortisation, Restated(b) impairment and impairment and 2015 impairment and impairment and 2014 Note non-cash interest non-cash interest(a) Total non-cash interest non-cash interest(a) Total
Revenue 4 991,588 - 991,588 837,849 - 837,849Cost of sales (670,369) - (670,369) (596,031) (7,228) (603,259)
Gross profit 321,219 - 321,219 241,818 (7,228) 234,590
Distribution expenses (78,773) - (78,773) (63,281) (415) (63,696)Administrative expenses (86,707) (28,338) (115,045) (67,104) (25,281) (92,385)
Results from operating activities 6 155,739 (28,338) 127,401 111,433 (32,924) 78,509
Finance income 528 3,171 3,699 333 337 670Finance expenses (43,729) (44,629) (88,358) (36,258) (70,535) (106,793)Net finance costs 9 (43,201) (41,458) (84,659) (35,925) (70,198) (106,123)
Profit/(loss) before income tax 112,538 (69,796) 42,742 75,508 (103,122) (27,614)Income tax charge 10 (9,406) (6,635)Profit/(loss) from continuing operations 33,336 (34,249)
Attributable to:Equity holders of the company 33,336 (34,249)Non-controlling interests - -Profit/(loss) for the year 33,336 (34,249)
Note (a): in order to aid understanding of the financial results, the Directors have presented additional analysis to illustrate the effect of exceptional items, amortisation and impairment of intangible assets andnon-cash interest charges. These items are analysed in detail in note 1.
Note (b): Cost of sales and distribution costs in 2014 have been restated to reclassify ¤11.8 million of distribution related costs from cost of sales to distribution expenses.
The notes on pages 16 to 37 are an integral part of these consolidated financial statements.
All operations are continuing.
RIC-B0237a R&R Annual Report 2015.qxp_Layout 1 02/03/2016 12:21 Page 16
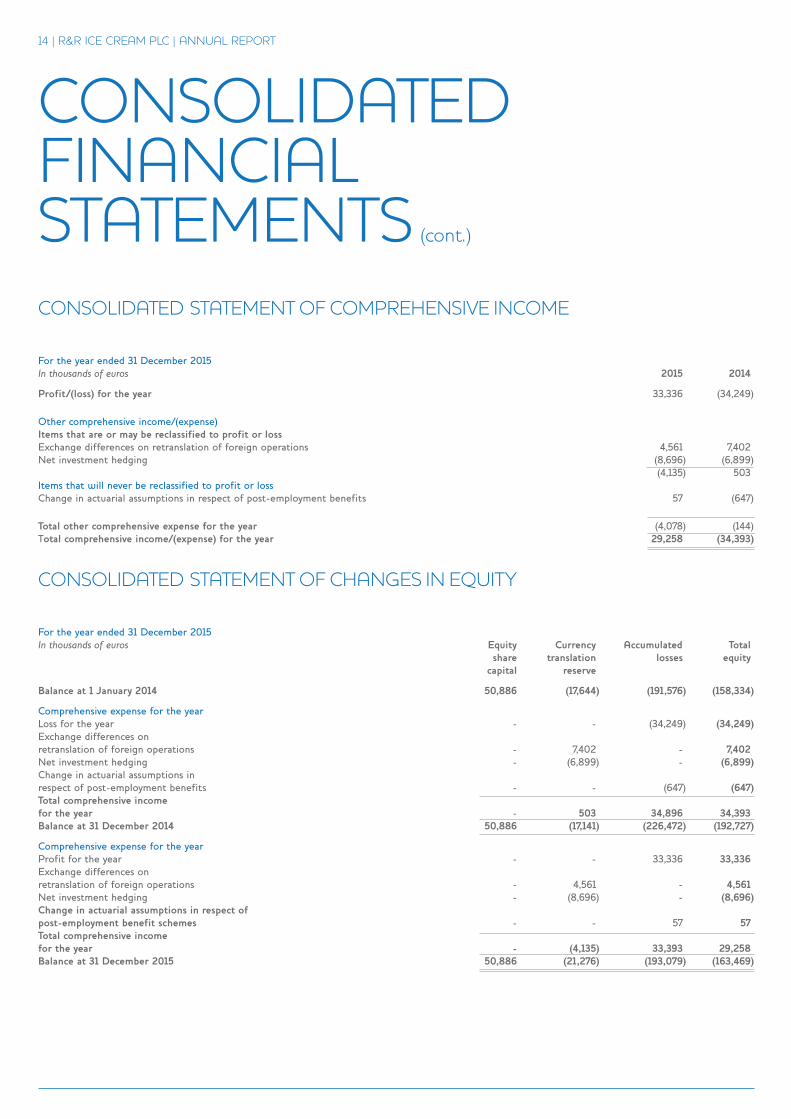
14 | R&R ICE CREAM PLC | ANNUAL REPORT
CONSOLIDATED FINANCIAL STATEMENTS (cont.)
For the year ended 31 December 2015In thousands of euros 2015 2014
Profit/(loss) for the year 33,336 (34,249)
Other comprehensive income/(expense)Items that are or may be reclassified to profit or lossExchange differences on retranslation of foreign operations 4,561 7,402Net investment hedging (8,696) (6,899) (4,135) 503Items that will never be reclassified to profit or lossChange in actuarial assumptions in respect of post-employment benefits 57 (647)
Total other comprehensive expense for the year (4,078) (144)Total comprehensive income/(expense) for the year 29,258 (34,393)
CONSOLIDATED STATEMENT OF COMPREHENSIVE INCOME
For the year ended 31 December 2015In thousands of euros Equity Currency Accumulated Total share translation losses equity capital reserve
Balance at 1 January 2014 50,886 (17,644) (191,576) (158,334)
Comprehensive expense for the year Loss for the year - - (34,249) (34,249)Exchange differences onretranslation of foreign operations - 7,402 - 7,402Net investment hedging - (6,899) - (6,899)Change in actuarial assumptions in respect of post-employment benefits - - (647) (647)Total comprehensive incomefor the year - 503 34,896 34,393Balance at 31 December 2014 50,886 (17,141) (226,472) (192,727)
Comprehensive expense for the year Profit for the year - - 33,336 33,336Exchange differences onretranslation of foreign operations - 4,561 - 4,561Net investment hedging - (8,696) - (8,696)Change in actuarial assumptions in respect ofpost-employment benefit schemes - - 57 57Total comprehensive incomefor the year - (4,135) 33,393 29,258Balance at 31 December 2015 50,886 (21,276) (193,079) (163,469)
CONSOLIDATED STATEMENT OF CHANGES IN EQUITY
RIC-B0237a R&R Annual Report 2015.qxp_Layout 1 02/03/2016 12:21 Page 17
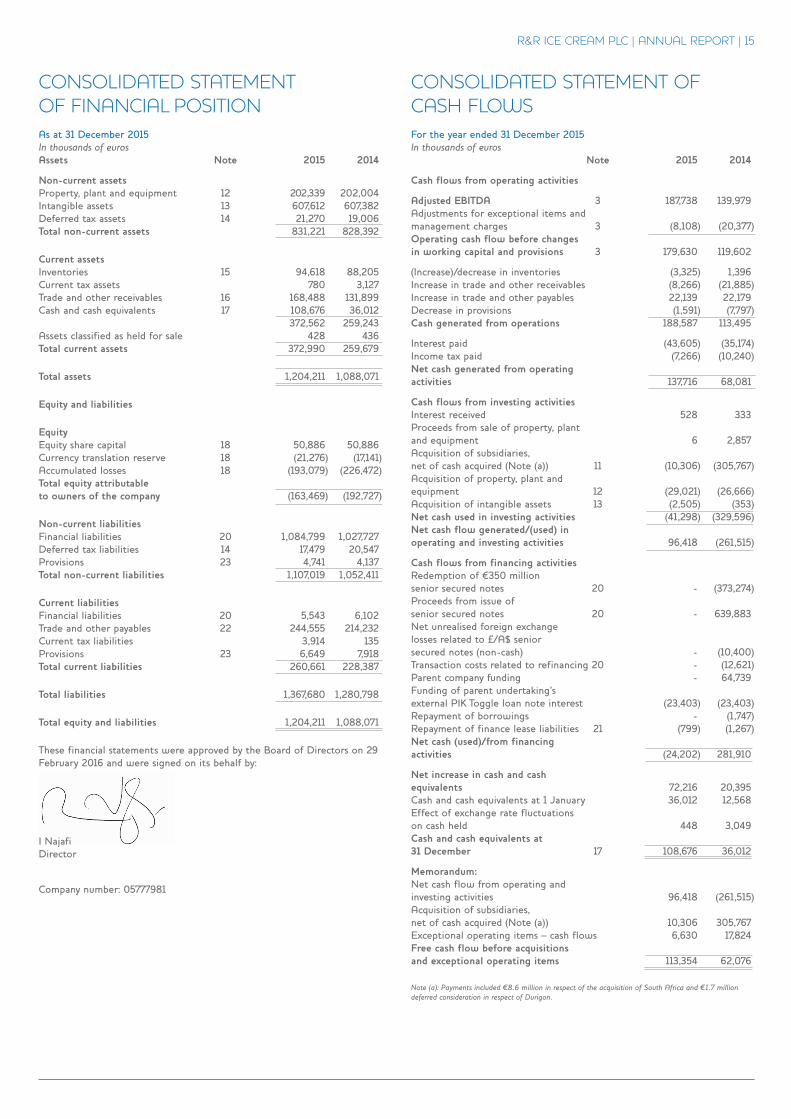
R&R ICE CREAM PLC | ANNUAL REPORT | 15
As at 31 December 2015In thousands of eurosAssets Note 2015 2014
Non-current assets Property, plant and equipment 12 202,339 202,004Intangible assets 13 607,612 607,382Deferred tax assets 14 21,270 19,006Total non-current assets 831,221 828,392
Current assets Inventories 15 94,618 88,205Current tax assets 780 3,127Trade and other receivables 16 168,488 131,899Cash and cash equivalents 17 108,676 36,012 372,562 259,243Assets classified as held for sale 428 436Total current assets 372,990 259,679
Total assets 1,204,211 1,088,071
Equity and liabilities
Equity Equity share capital 18 50,886 50,886Currency translation reserve 18 (21,276) (17,141)Accumulated losses 18 (193,079) (226,472)Total equity attributable to owners of the company (163,469) (192,727)
Non-current liabilities Financial liabilities 20 1,084,799 1,027,727Deferred tax liabilities 14 17,479 20,547Provisions 23 4,741 4,137Total non-current liabilities 1,107,019 1,052,411
Current liabilities Financial liabilities 20 5,543 6,102Trade and other payables 22 244,555 214,232Current tax liabilities 3,914 135Provisions 23 6,649 7,918Total current liabilities 260,661 228,387
Total liabilities 1,367,680 1,280,798
Total equity and liabilities 1,204,211 1,088,071
These financial statements were approved by the Board of Directors on 29February 2016 and were signed on its behalf by:
I NajafiDirector
Company number: 05777981
For the year ended 31 December 2015In thousands of euros Note 2015 2014
Cash flows from operating activities
Adjusted EBITDA 3 187,738 139,979Adjustments for exceptional items andmanagement charges 3 (8,108) (20,377)Operating cash flow before changesin working capital and provisions 3 179,630 119,602
(Increase)/decrease in inventories (3,325) 1,396Increase in trade and other receivables (8,266) (21,885)Increase in trade and other payables 22,139 22,179Decrease in provisions (1,591) (7,797)Cash generated from operations 188,587 113,495
Interest paid (43,605) (35,174)Income tax paid (7,266) (10,240)Net cash generated from operatingactivities 137,716 68,081
Cash flows from investing activities Interest received 528 333Proceeds from sale of property, plantand equipment 6 2,857Acquisition of subsidiaries,net of cash acquired (Note (a)) 11 (10,306) (305,767)Acquisition of property, plant andequipment 12 (29,021) (26,666)Acquisition of intangible assets 13 (2,505) (353)Net cash used in investing activities (41,298) (329,596)Net cash flow generated/(used) inoperating and investing activities 96,418 (261,515)
Cash flows from financing activities Redemption of ¤350 million senior secured notes 20 - (373,274)Proceeds from issue of senior secured notes 20 - 639,883Net unrealised foreign exchange losses related to £/A$ senior secured notes (non-cash) - (10,400)Transaction costs related to refinancing 20 - (12,621)Parent company funding - 64,739Funding of parent undertaking’s external PIK Toggle loan note interest (23,403) (23,403)Repayment of borrowings - (1,747)Repayment of finance lease liabilities 21 (799) (1,267)Net cash (used)/from financingactivities (24,202) 281,910
Net increase in cash and cashequivalents 72,216 20,395Cash and cash equivalents at 1 January 36,012 12,568Effect of exchange rate fluctuationson cash held 448 3,049Cash and cash equivalents at31 December 17 108,676 36,012
Memorandum:Net cash flow from operating and investing activities 96,418 (261,515)Acquisition of subsidiaries,net of cash acquired (Note (a)) 10,306 305,767Exceptional operating items – cash flows 6,630 17,824Free cash flow before acquisitions and exceptional operating items 113,354 62,076
Note (a): Payments included ¤8.6 million in respect of the acquisition of South Africa and ¤1.7 milliondeferred consideration in respect of Durigon.
CONSOLIDATED STATEMENT OF FINANCIAL POSITION
CONSOLIDATED STATEMENT OFCASH FLOWS
RIC-B0237a R&R Annual Report 2015.qxp_Layout 1 02/03/2016 12:21 Page 18
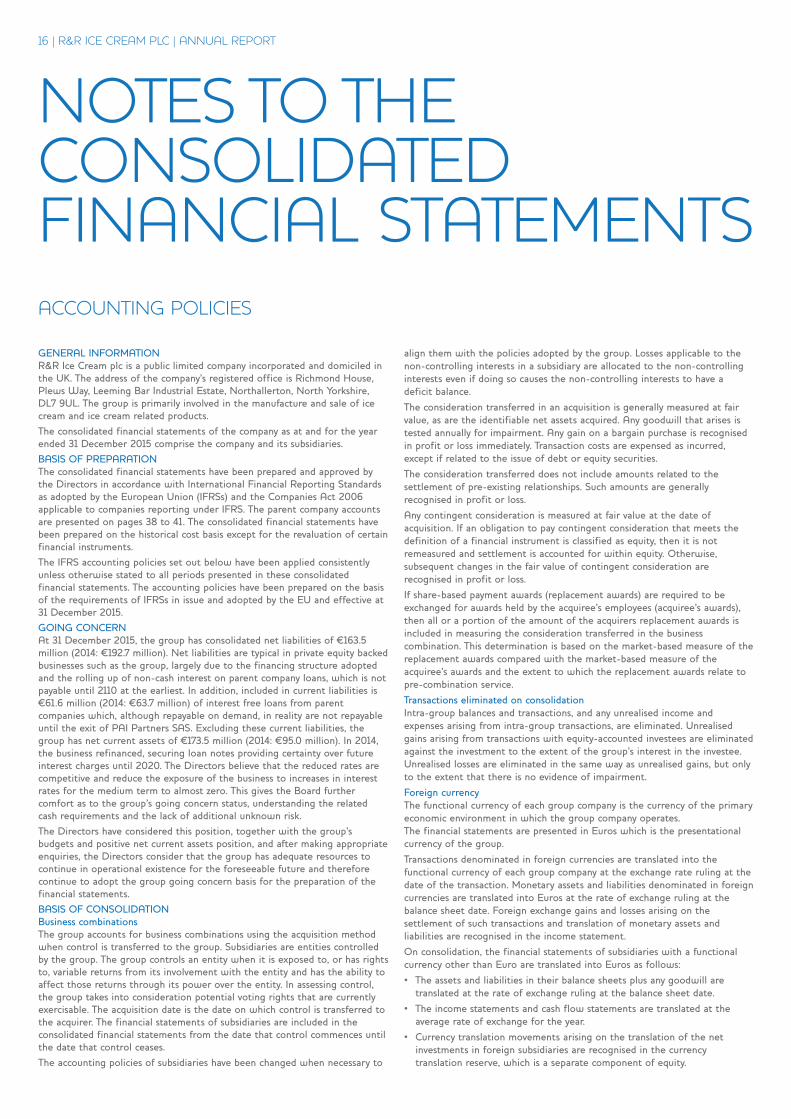
NOTES TO THECONSOLIDATEDFINANCIAL STATEMENTSACCOUNTING POLICIES
GENERAL INFORMATIONR&R Ice Cream plc is a public limited company incorporated and domiciled inthe UK. The address of the company’s registered office is Richmond House,Plews Way, Leeming Bar Industrial Estate, Northallerton, North Yorkshire,DL7 9UL. The group is primarily involved in the manufacture and sale of icecream and ice cream related products.The consolidated financial statements of the company as at and for the yearended 31 December 2015 comprise the company and its subsidiaries.BASIS OF PREPARATIONThe consolidated financial statements have been prepared and approved bythe Directors in accordance with International Financial Reporting Standardsas adopted by the European Union (IFRSs) and the Companies Act 2006applicable to companies reporting under IFRS. The parent company accountsare presented on pages 38 to 41. The consolidated financial statements havebeen prepared on the historical cost basis except for the revaluation of certainfinancial instruments.The IFRS accounting policies set out below have been applied consistentlyunless otherwise stated to all periods presented in these consolidatedfinancial statements. The accounting policies have been prepared on the basisof the requirements of IFRSs in issue and adopted by the EU and effective at31 December 2015.GOING CONCERNAt 31 December 2015, the group has consolidated net liabilities of ¤163.5million (2014: ¤192.7 million). Net liabilities are typical in private equity backedbusinesses such as the group, largely due to the financing structure adoptedand the rolling up of non-cash interest on parent company loans, which is notpayable until 2110 at the earliest. In addition, included in current liabilities is¤61.6 million (2014: ¤63.7 million) of interest free loans from parentcompanies which, although repayable on demand, in reality are not repayableuntil the exit of PAI Partners SAS. Excluding these current liabilities, thegroup has net current assets of ¤173.5 million (2014: ¤95.0 million). In 2014,the business refinanced, securing loan notes providing certainty over futureinterest charges until 2020. The Directors believe that the reduced rates arecompetitive and reduce the exposure of the business to increases in interestrates for the medium term to almost zero. This gives the Board furthercomfort as to the group’s going concern status, understanding the relatedcash requirements and the lack of additional unknown risk.The Directors have considered this position, together with the group’sbudgets and positive net current assets position, and after making appropriateenquiries, the Directors consider that the group has adequate resources tocontinue in operational existence for the foreseeable future and thereforecontinue to adopt the group going concern basis for the preparation of thefinancial statements.BASIS OF CONSOLIDATIONBusiness combinationsThe group accounts for business combinations using the acquisition methodwhen control is transferred to the group. Subsidiaries are entities controlledby the group. The group controls an entity when it is exposed to, or has rightsto, variable returns from its involvement with the entity and has the ability toaffect those returns through its power over the entity. In assessing control,the group takes into consideration potential voting rights that are currentlyexercisable. The acquisition date is the date on which control is transferred tothe acquirer. The financial statements of subsidiaries are included in theconsolidated financial statements from the date that control commences untilthe date that control ceases.The accounting policies of subsidiaries have been changed when necessary to
align them with the policies adopted by the group. Losses applicable to thenon-controlling interests in a subsidiary are allocated to the non-controllinginterests even if doing so causes the non-controlling interests to have adeficit balance.The consideration transferred in an acquisition is generally measured at fairvalue, as are the identifiable net assets acquired. Any goodwill that arises istested annually for impairment. Any gain on a bargain purchase is recognisedin profit or loss immediately. Transaction costs are expensed as incurred,except if related to the issue of debt or equity securities.The consideration transferred does not include amounts related to thesettlement of pre-existing relationships. Such amounts are generallyrecognised in profit or loss.Any contingent consideration is measured at fair value at the date ofacquisition. If an obligation to pay contingent consideration that meets thedefinition of a financial instrument is classified as equity, then it is notremeasured and settlement is accounted for within equity. Otherwise,subsequent changes in the fair value of contingent consideration arerecognised in profit or loss.If share-based payment awards (replacement awards) are required to beexchanged for awards held by the acquiree’s employees (acquiree’s awards),then all or a portion of the amount of the acquirers replacement awards isincluded in measuring the consideration transferred in the businesscombination. This determination is based on the market-based measure of thereplacement awards compared with the market-based measure of theacquiree’s awards and the extent to which the replacement awards relate topre-combination service.Transactions eliminated on consolidationIntra-group balances and transactions, and any unrealised income andexpenses arising from intra-group transactions, are eliminated. Unrealisedgains arising from transactions with equity-accounted investees are eliminatedagainst the investment to the extent of the group’s interest in the investee.Unrealised losses are eliminated in the same way as unrealised gains, but onlyto the extent that there is no evidence of impairment.Foreign currencyThe functional currency of each group company is the currency of the primaryeconomic environment in which the group company operates.The financial statements are presented in Euros which is the presentationalcurrency of the group.Transactions denominated in foreign currencies are translated into thefunctional currency of each group company at the exchange rate ruling at thedate of the transaction. Monetary assets and liabilities denominated in foreigncurrencies are translated into Euros at the rate of exchange ruling at thebalance sheet date. Foreign exchange gains and losses arising on thesettlement of such transactions and translation of monetary assets andliabilities are recognised in the income statement.On consolidation, the financial statements of subsidiaries with a functionalcurrency other than Euro are translated into Euros as follows:• The assets and liabilities in their balance sheets plus any goodwill aretranslated at the rate of exchange ruling at the balance sheet date.
• The income statements and cash flow statements are translated at theaverage rate of exchange for the year.
• Currency translation movements arising on the translation of the netinvestments in foreign subsidiaries are recognised in the currencytranslation reserve, which is a separate component of equity.
16 | R&R ICE CREAM PLC | ANNUAL REPORT
RIC-B0237a R&R Annual Report 2015.qxp_Layout 1 02/03/2016 12:21 Page 19
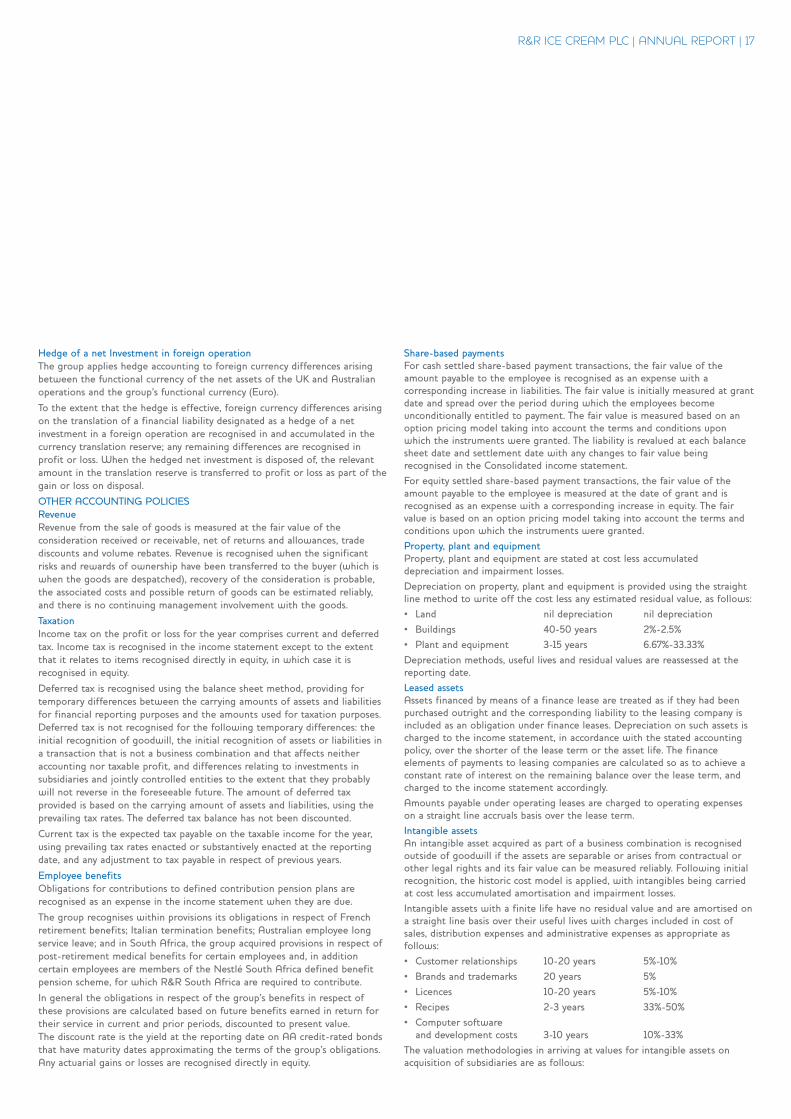
Hedge of a net Investment in foreign operationThe group applies hedge accounting to foreign currency differences arisingbetween the functional currency of the net assets of the UK and Australianoperations and the group’s functional currency (Euro).
To the extent that the hedge is effective, foreign currency differences arisingon the translation of a financial liability designated as a hedge of a netinvestment in a foreign operation are recognised in and accumulated in thecurrency translation reserve; any remaining differences are recognised inprofit or loss. When the hedged net investment is disposed of, the relevantamount in the translation reserve is transferred to profit or loss as part of thegain or loss on disposal.
OTHER ACCOUNTING POLICIESRevenueRevenue from the sale of goods is measured at the fair value of theconsideration received or receivable, net of returns and allowances, tradediscounts and volume rebates. Revenue is recognised when the significantrisks and rewards of ownership have been transferred to the buyer (which iswhen the goods are despatched), recovery of the consideration is probable,the associated costs and possible return of goods can be estimated reliably,and there is no continuing management involvement with the goods.
TaxationIncome tax on the profit or loss for the year comprises current and deferredtax. Income tax is recognised in the income statement except to the extentthat it relates to items recognised directly in equity, in which case it isrecognised in equity.
Deferred tax is recognised using the balance sheet method, providing fortemporary differences between the carrying amounts of assets and liabilitiesfor financial reporting purposes and the amounts used for taxation purposes.Deferred tax is not recognised for the following temporary differences: theinitial recognition of goodwill, the initial recognition of assets or liabilities ina transaction that is not a business combination and that affects neitheraccounting nor taxable profit, and differences relating to investments insubsidiaries and jointly controlled entities to the extent that they probablywill not reverse in the foreseeable future. The amount of deferred taxprovided is based on the carrying amount of assets and liabilities, using theprevailing tax rates. The deferred tax balance has not been discounted.
Current tax is the expected tax payable on the taxable income for the year,using prevailing tax rates enacted or substantively enacted at the reportingdate, and any adjustment to tax payable in respect of previous years.
Employee benefitsObligations for contributions to defined contribution pension plans arerecognised as an expense in the income statement when they are due.
The group recognises within provisions its obligations in respect of Frenchretirement benefits; Italian termination benefits; Australian employee longservice leave; and in South Africa, the group acquired provisions in respect ofpost-retirement medical benefits for certain employees and, in additioncertain employees are members of the Nestlé South Africa defined benefitpension scheme, for which R&R South Africa are required to contribute.
In general the obligations in respect of the group’s benefits in respect ofthese provisions are calculated based on future benefits earned in return fortheir service in current and prior periods, discounted to present value.The discount rate is the yield at the reporting date on AA credit-rated bondsthat have maturity dates approximating the terms of the group’s obligations.Any actuarial gains or losses are recognised directly in equity.
Share-based paymentsFor cash settled share-based payment transactions, the fair value of theamount payable to the employee is recognised as an expense with acorresponding increase in liabilities. The fair value is initially measured at grantdate and spread over the period during which the employees becomeunconditionally entitled to payment. The fair value is measured based on anoption pricing model taking into account the terms and conditions uponwhich the instruments were granted. The liability is revalued at each balancesheet date and settlement date with any changes to fair value beingrecognised in the Consolidated income statement.For equity settled share-based payment transactions, the fair value of theamount payable to the employee is measured at the date of grant and isrecognised as an expense with a corresponding increase in equity. The fairvalue is based on an option pricing model taking into account the terms andconditions upon which the instruments were granted.Property, plant and equipmentProperty, plant and equipment are stated at cost less accumulateddepreciation and impairment losses.Depreciation on property, plant and equipment is provided using the straightline method to write off the cost less any estimated residual value, as follows:• Land nil depreciation nil depreciation• Buildings 40-50 years 2%-2.5%• Plant and equipment 3-15 years 6.67%-33.33%Depreciation methods, useful lives and residual values are reassessed at thereporting date.Leased assets Assets financed by means of a finance lease are treated as if they had beenpurchased outright and the corresponding liability to the leasing company isincluded as an obligation under finance leases. Depreciation on such assets ischarged to the income statement, in accordance with the stated accountingpolicy, over the shorter of the lease term or the asset life. The financeelements of payments to leasing companies are calculated so as to achieve aconstant rate of interest on the remaining balance over the lease term, andcharged to the income statement accordingly.Amounts payable under operating leases are charged to operating expenseson a straight line accruals basis over the lease term.Intangible assetsAn intangible asset acquired as part of a business combination is recognisedoutside of goodwill if the assets are separable or arises from contractual orother legal rights and its fair value can be measured reliably. Following initialrecognition, the historic cost model is applied, with intangibles being carriedat cost less accumulated amortisation and impairment losses.Intangible assets with a finite life have no residual value and are amortised ona straight line basis over their useful lives with charges included in cost ofsales, distribution expenses and administrative expenses as appropriate asfollows:• Customer relationships 10-20 years 5%-10%• Brands and trademarks 20 years 5%• Licences 10-20 years 5%-10%• Recipes 2-3 years 33%-50%• Computer software and development costs 3-10 years 10%-33%The valuation methodologies in arriving at values for intangible assets onacquisition of subsidiaries are as follows:
R&R ICE CREAM PLC | ANNUAL REPORT | 17
RIC-B0237a R&R Annual Report 2015.qxp_Layout 1 02/03/2016 12:21 Page 20
18 | R&R ICE CREAM PLC | ANNUAL REPORT
• Customer relationships - Multi-period excess earnings• Brands and trademarks - Royalty relief • Recipes - Cost to recreateAcquired brands are initially valued using discounted cash flow models.No amortisation on UK, Australian or South African brands is charged as thegroup believes that the value of those brands is maintained indefinitely. Thesebrands are tested annually for impairment. Acquired software licences andsoftware developed in house are capitalised on the basis of the costs incurredto acquire and bring into use the specific software.The carrying value of intangible assets is reviewed for impairment whereverevents or changes in circumstances indicate the carrying value may notbe recoverable.ImpairmentThe carrying amounts of the group’s assets, other than inventories anddeferred tax assets, are reviewed at each balance sheet date to determinewhether there is any indication of impairment. If any such indication exists,the asset’s recoverable amount is estimated.For goodwill, assets that have an indefinite useful life and intangible assetsthat are not yet available for use, the recoverable amount is estimated at eachbalance sheet date. An impairment loss is recognised whenever the carrying amount of an assetor its cash generating unit exceeds its recoverable amount. Impairment lossesare recognised in the Consolidated income statement.Impairment losses recognised in respect of cash-generating units (not relatingto other intangible assets specifically) are allocated first to reduce thecarrying amount of any goodwill allocated to cash-generating units and then,to reduce the carrying amount of the other assets in the unit on a pro ratabasis. A cash-generating unit is the group of assets identified on acquisitionthat generate cash inflows that are largely independent of the cash inflowsfrom other assets or groups of assets.The recoverable amount of assets or cash-generating units is the greater oftheir fair value less costs to sell and value in use. In assessing value in use, theestimated future cash flows are discounted to their present value using a pre-tax discount rate that reflects current market assessments of the time valueof money and the risks specific to the asset. For an asset that does notgenerate largely independent cash inflows, the recoverable amount isdetermined for the cash-generating unit to which the asset belongs.An impairment loss in respect of goodwill is not reversed. In respect of otherassets, an impairment loss is reversed if there has been a change in theestimates used or a change in market factors used to determine therecoverable amount.An impairment loss is reversed only to the extent that the asset’s carryingamount does not exceed the carrying amount that would have beendetermined, net of depreciation or amortisation, if no impairment loss hadbeen recognised.InventoriesInventories are stated at the lower of cost and net realisable value. Work inprogress comprises direct materials, labour costs, site overheads and otherattributable overheads. Trade and other receivablesTrade and other receivables are held at cost less any impairment in realisablevalue.The group sells certain of its trade receivables through factoring and invoicediscounting arrangements. The majority of these arrangements are without
recourse to the seller. Consequently, these transactions meet IAS 39requirements for asset de-recognition, since the risks and rewards have beensubstantially transferred. Cash and cash equivalentsCash and cash equivalents are defined as cash balances in hand and at thebank (including short-term cash deposits). The group routinely utilises short-term revolving credit and overdraft facilities as an integral part of its cashmanagement policy. Offset arrangements across the group have been appliedto arrive at the cash figure.Non-current assets held for sale and discontinued operationsA non-current asset or a group of assets containing a non-current asset(a disposal group) is classified as held for sale if its carrying amount will berecovered principally through sale rather than through continuing use; it isavailable for immediate sale and sale is highly probable within one year.On initial classification as held for sale, non-current assets and disposalgroups are measured at the lower of previous carrying amount and fair valueless costs to sell with any adjustments taken to profit or loss. The sameapplies to gains and losses on subsequent remeasurement althoughgains are not recognised in excess of any cumulative impairment loss.Any impairment loss on a disposal group is first allocated to goodwill, andthen to remaining assets and liabilities on a pro rata basis, except that no lossis allocated to inventories, financial assets, deferred tax assets, employeebenefit assets and investment property, which continue to be measured inaccordance with the group’s accounting policies.Bank and other borrowingsInterest bearing borrowings, bank and other borrowings are carried atamortised cost. Finance charges, including issue costs, are charged to theincome statement using an effective interest rate method.Trade and other payablesTrade payables on normal terms are not interest bearing and are stated attheir nominal value.ProvisionsA provision is recognised in the balance sheet if, as a result of a past event,the group has a present legal or constructive obligation that can be estimatedreliably, and it is probable that an outflow of economic benefits will berequired to settle the obligation. Provisions are determined by discounting theexpected future cash flows at a pre-tax rate that reflects current marketassessments of the time value of money and the risks specific to the liability.Operating segmentsAn operating segment is a component of the group that engages in businessactivities from which it may earn revenues and incur expenses, includingrevenues and expenses that relate to transactions with any of the group’sother components. The operating segments are determined on a geographicalbasis, which reflects the group’s management and internal reportingstructure. Turnover, including intercompany sales and Adjusted EBITDA, arethe measures which are reviewed regularly by the Management Board of thegroup (considered the Chief Operating Decision Maker under IFRS 8) to makedecisions about resources to be allocated to each segment and to segmentperformance, and for which discrete financial information is available.NON-IFRS MEASURESExceptional itemsThe group presents as exceptional items on the face of the income statementthose material items of income or expense which, because of the nature andexpected infrequency of the events giving rise to them, merit separatepresentation. This allows users of the accounts to better understand the
NOTES TO THECONSOLIDATEDFINANCIAL STATEMENTS(cont.)
ACCOUNTING POLICIES (cont.)
RIC-B0237a R&R Annual Report 2015.qxp_Layout 1 02/03/2016 12:21 Page 21
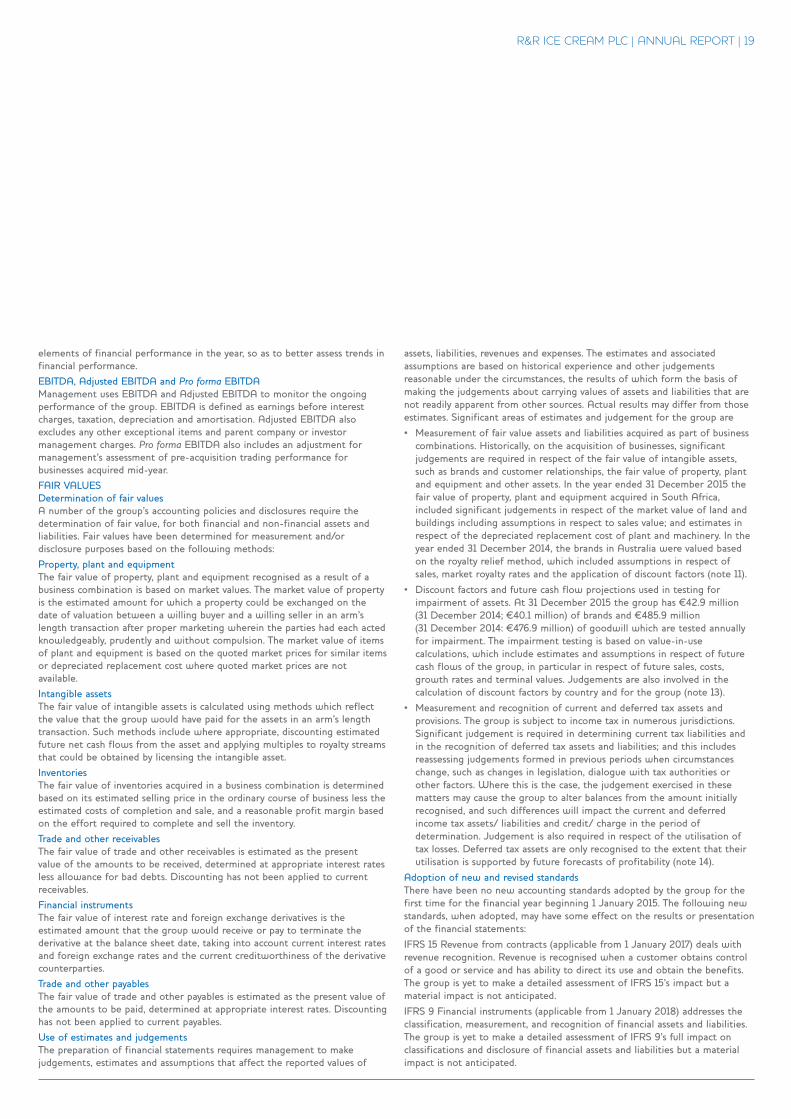
R&R ICE CREAM PLC | ANNUAL REPORT | 19
elements of financial performance in the year, so as to better assess trends infinancial performance. EBITDA, Adjusted EBITDA and Pro forma EBITDAManagement uses EBITDA and Adjusted EBITDA to monitor the ongoingperformance of the group. EBITDA is defined as earnings before interestcharges, taxation, depreciation and amortisation. Adjusted EBITDA alsoexcludes any other exceptional items and parent company or investormanagement charges. Pro forma EBITDA also includes an adjustment formanagement’s assessment of pre-acquisition trading performance forbusinesses acquired mid-year. FAIR VALUESDetermination of fair values A number of the group’s accounting policies and disclosures require thedetermination of fair value, for both financial and non-financial assets andliabilities. Fair values have been determined for measurement and/ordisclosure purposes based on the following methods:Property, plant and equipmentThe fair value of property, plant and equipment recognised as a result of abusiness combination is based on market values. The market value of propertyis the estimated amount for which a property could be exchanged on thedate of valuation between a willing buyer and a willing seller in an arm’slength transaction after proper marketing wherein the parties had each actedknowledgeably, prudently and without compulsion. The market value of itemsof plant and equipment is based on the quoted market prices for similar itemsor depreciated replacement cost where quoted market prices are notavailable.Intangible assetsThe fair value of intangible assets is calculated using methods which reflectthe value that the group would have paid for the assets in an arm’s lengthtransaction. Such methods include where appropriate, discounting estimatedfuture net cash flows from the asset and applying multiples to royalty streamsthat could be obtained by licensing the intangible asset.InventoriesThe fair value of inventories acquired in a business combination is determinedbased on its estimated selling price in the ordinary course of business less theestimated costs of completion and sale, and a reasonable profit margin basedon the effort required to complete and sell the inventory.Trade and other receivablesThe fair value of trade and other receivables is estimated as the presentvalue of the amounts to be received, determined at appropriate interest ratesless allowance for bad debts. Discounting has not been applied to currentreceivables. Financial instrumentsThe fair value of interest rate and foreign exchange derivatives is theestimated amount that the group would receive or pay to terminate thederivative at the balance sheet date, taking into account current interest ratesand foreign exchange rates and the current creditworthiness of the derivativecounterparties.Trade and other payablesThe fair value of trade and other payables is estimated as the present value ofthe amounts to be paid, determined at appropriate interest rates. Discountinghas not been applied to current payables.Use of estimates and judgementsThe preparation of financial statements requires management to makejudgements, estimates and assumptions that affect the reported values of
assets, liabilities, revenues and expenses. The estimates and associatedassumptions are based on historical experience and other judgementsreasonable under the circumstances, the results of which form the basis ofmaking the judgements about carrying values of assets and liabilities that arenot readily apparent from other sources. Actual results may differ from thoseestimates. Significant areas of estimates and judgement for the group are• Measurement of fair value assets and liabilities acquired as part of businesscombinations. Historically, on the acquisition of businesses, significantjudgements are required in respect of the fair value of intangible assets,such as brands and customer relationships, the fair value of property, plantand equipment and other assets. In the year ended 31 December 2015 thefair value of property, plant and equipment acquired in South Africa,included significant judgements in respect of the market value of land andbuildings including assumptions in respect to sales value; and estimates inrespect of the depreciated replacement cost of plant and machinery. In theyear ended 31 December 2014, the brands in Australia were valued basedon the royalty relief method, which included assumptions in respect ofsales, market royalty rates and the application of discount factors (note 11).
• Discount factors and future cash flow projections used in testing forimpairment of assets. At 31 December 2015 the group has ¤42.9 million(31 December 2014; ¤40.1 million) of brands and ¤485.9 million(31 December 2014: ¤476.9 million) of goodwill which are tested annuallyfor impairment. The impairment testing is based on value-in-usecalculations, which include estimates and assumptions in respect of futurecash flows of the group, in particular in respect of future sales, costs,growth rates and terminal values. Judgements are also involved in thecalculation of discount factors by country and for the group (note 13).
• Measurement and recognition of current and deferred tax assets andprovisions. The group is subject to income tax in numerous jurisdictions.Significant judgement is required in determining current tax liabilities andin the recognition of deferred tax assets and liabilities; and this includesreassessing judgements formed in previous periods when circumstanceschange, such as changes in legislation, dialogue with tax authorities orother factors. Where this is the case, the judgement exercised in thesematters may cause the group to alter balances from the amount initiallyrecognised, and such differences will impact the current and deferredincome tax assets/ liabilities and credit/ charge in the period ofdetermination. Judgement is also required in respect of the utilisation oftax losses. Deferred tax assets are only recognised to the extent that theirutilisation is supported by future forecasts of profitability (note 14).
Adoption of new and revised standardsThere have been no new accounting standards adopted by the group for thefirst time for the financial year beginning 1 January 2015. The following newstandards, when adopted, may have some effect on the results or presentationof the financial statements:IFRS 15 Revenue from contracts (applicable from 1 January 2017) deals withrevenue recognition. Revenue is recognised when a customer obtains controlof a good or service and has ability to direct its use and obtain the benefits.The group is yet to make a detailed assessment of IFRS 15’s impact but amaterial impact is not anticipated.IFRS 9 Financial instruments (applicable from 1 January 2018) addresses theclassification, measurement, and recognition of financial assets and liabilities.The group is yet to make a detailed assessment of IFRS 9’s full impact onclassifications and disclosure of financial assets and liabilities but a materialimpact is not anticipated.
RIC-B0237a R&R Annual Report 2015.qxp_Layout 1 02/03/2016 12:21 Page 22
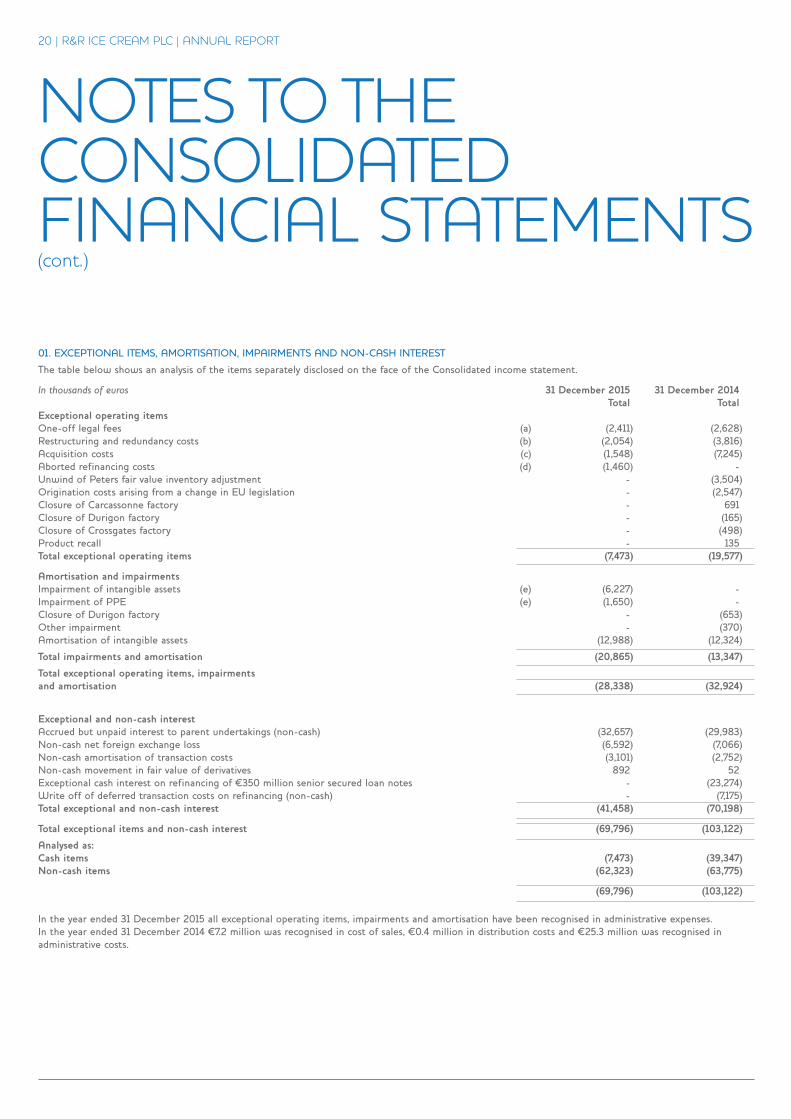
NOTES TO THECONSOLIDATEDFINANCIAL STATEMENTS(cont.)
20 | R&R ICE CREAM PLC | ANNUAL REPORT
01. EXCEPTIONAL ITEMS, AMORTISATION, IMPAIRMENTS AND NON-CASH INTEREST
The table below shows an analysis of the items separately disclosed on the face of the Consolidated income statement.
In thousands of euros 31 December 2015 31 December 2014 Total TotalExceptional operating items One-off legal fees (a) (2,411) (2,628)Restructuring and redundancy costs (b) (2,054) (3,816)Acquisition costs (c) (1,548) (7,245)Aborted refinancing costs (d) (1,460) -Unwind of Peters fair value inventory adjustment - (3,504)Origination costs arising from a change in EU legislation - (2,547)Closure of Carcassonne factory - 691Closure of Durigon factory - (165)Closure of Crossgates factory - (498)Product recall - 135Total exceptional operating items (7,473) (19,577)
Amortisation and impairmentsImpairment of intangible assets (e) (6,227) -Impairment of PPE (e) (1,650) -Closure of Durigon factory - (653)Other impairment - (370)Amortisation of intangible assets (12,988) (12,324)
Total impairments and amortisation (20,865) (13,347)
Total exceptional operating items, impairmentsand amortisation (28,338) (32,924)
Exceptional and non-cash interestAccrued but unpaid interest to parent undertakings (non-cash) (32,657) (29,983)Non-cash net foreign exchange loss (6,592) (7,066)Non-cash amortisation of transaction costs (3,101) (2,752)Non-cash movement in fair value of derivatives 892 52Exceptional cash interest on refinancing of ¤350 million senior secured loan notes - (23,274)Write off of deferred transaction costs on refinancing (non-cash) - (7,175)Total exceptional and non-cash interest (41,458) (70,198)
Total exceptional items and non-cash interest (69,796) (103,122)
Analysed as:Cash items (7,473) (39,347)Non-cash items (62,323) (63,775)
(69,796) (103,122)
In the year ended 31 December 2015 all exceptional operating items, impairments and amortisation have been recognised in administrative expenses.In the year ended 31 December 2014 ¤7.2 million was recognised in cost of sales, ¤0.4 million in distribution costs and ¤25.3 million was recognised inadministrative costs.
RIC-B0237a R&R Annual Report 2015.qxp_Layout 1 02/03/2016 12:21 Page 23
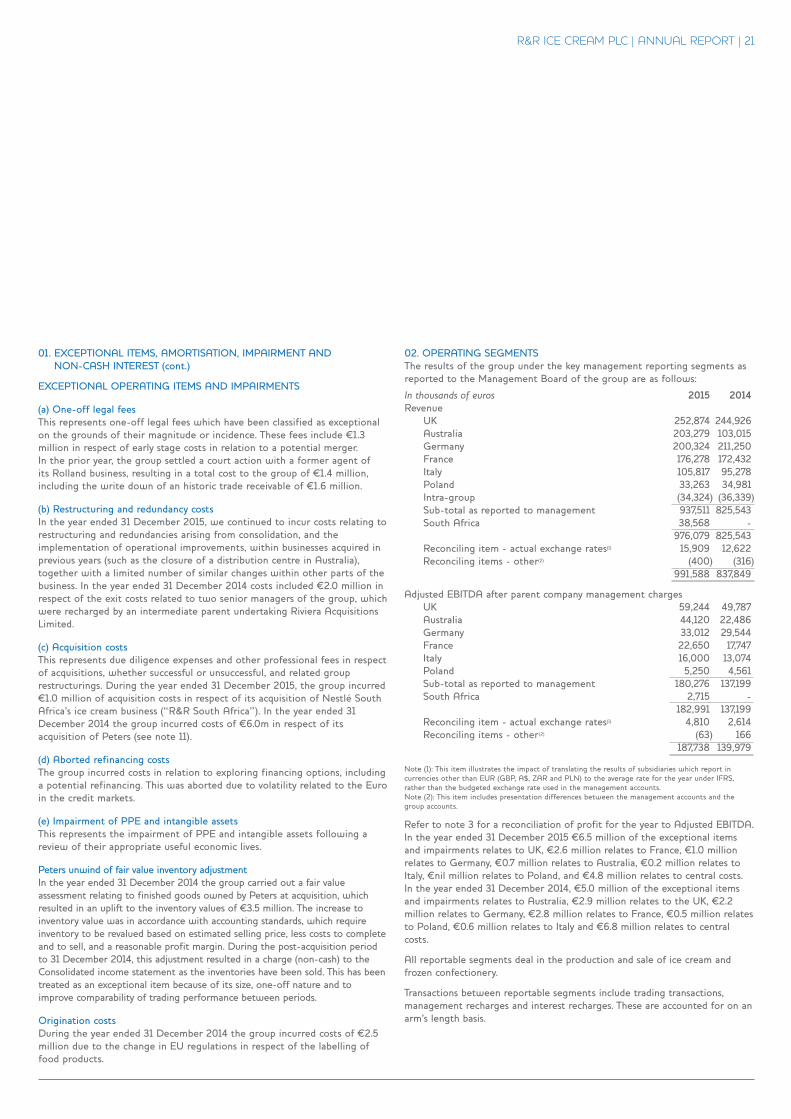
R&R ICE CREAM PLC | ANNUAL REPORT | 21
01. EXCEPTIONAL ITEMS, AMORTISATION, IMPAIRMENT ANDNON-CASH INTEREST (cont.)
EXCEPTIONAL OPERATING ITEMS AND IMPAIRMENTS
(a) One-off legal feesThis represents one-off legal fees which have been classified as exceptionalon the grounds of their magnitude or incidence. These fees include ¤1.3million in respect of early stage costs in relation to a potential merger.In the prior year, the group settled a court action with a former agent ofits Rolland business, resulting in a total cost to the group of ¤1.4 million,including the write down of an historic trade receivable of ¤1.6 million.
(b) Restructuring and redundancy costsIn the year ended 31 December 2015, we continued to incur costs relating torestructuring and redundancies arising from consolidation, and theimplementation of operational improvements, within businesses acquired inprevious years (such as the closure of a distribution centre in Australia),together with a limited number of similar changes within other parts of thebusiness. In the year ended 31 December 2014 costs included ¤2.0 million inrespect of the exit costs related to two senior managers of the group, whichwere recharged by an intermediate parent undertaking Riviera AcquisitionsLimited.
(c) Acquisition costsThis represents due diligence expenses and other professional fees in respectof acquisitions, whether successful or unsuccessful, and related grouprestructurings. During the year ended 31 December 2015, the group incurred¤1.0 million of acquisition costs in respect of its acquisition of Nestlé SouthAfrica’s ice cream business (“R&R South Africa”). In the year ended 31December 2014 the group incurred costs of ¤6.0m in respect of itsacquisition of Peters (see note 11).
(d) Aborted refinancing costsThe group incurred costs in relation to exploring financing options, includinga potential refinancing. This was aborted due to volatility related to the Euroin the credit markets.
(e) Impairment of PPE and intangible assetsThis represents the impairment of PPE and intangible assets following areview of their appropriate useful economic lives.
Peters unwind of fair value inventory adjustmentIn the year ended 31 December 2014 the group carried out a fair valueassessment relating to finished goods owned by Peters at acquisition, whichresulted in an uplift to the inventory values of ¤3.5 million. The increase toinventory value was in accordance with accounting standards, which requireinventory to be revalued based on estimated selling price, less costs to completeand to sell, and a reasonable profit margin. During the post-acquisition periodto 31 December 2014, this adjustment resulted in a charge (non-cash) to theConsolidated income statement as the inventories have been sold. This has beentreated as an exceptional item because of its size, one-off nature and toimprove comparability of trading performance between periods.
Origination costsDuring the year ended 31 December 2014 the group incurred costs of ¤2.5million due to the change in EU regulations in respect of the labelling offood products.
02. OPERATING SEGMENTSThe results of the group under the key management reporting segments asreported to the Management Board of the group are as follows:
In thousands of euros 2015 2014Revenue UK 252,874 244,926 Australia 203,279 103,015 Germany 200,324 211,250 France 176,278 172,432 Italy 105,817 95,278 Poland 33,263 34,981 Intra-group (34,324) (36,339) Sub-total as reported to management 937,511 825,543 South Africa 38,568 - 976,079 825,543 Reconciling item - actual exchange rates(1) 15,909 12,622 Reconciling items - other(2) (400) (316) 991,588 837,849
Adjusted EBITDA after parent company management charges UK 59,244 49,787 Australia 44,120 22,486 Germany 33,012 29,544 France 22,650 17,747 Italy 16,000 13,074 Poland 5,250 4,561 Sub-total as reported to management 180,276 137,199 South Africa 2,715 - 182,991 137,199 Reconciling item - actual exchange rates(1) 4,810 2,614 Reconciling items - other(2) (63) 166 187,738 139,979
Note (1): This item illustrates the impact of translating the results of subsidiaries which report incurrencies other than EUR (GBP, A$, ZAR and PLN) to the average rate for the year under IFRS,rather than the budgeted exchange rate used in the management accounts.Note (2): This item includes presentation differences between the management accounts and thegroup accounts.
Refer to note 3 for a reconciliation of profit for the year to Adjusted EBITDA.In the year ended 31 December 2015 ¤6.5 million of the exceptional itemsand impairments relates to UK, ¤2.6 million relates to France, ¤1.0 millionrelates to Germany, ¤0.7 million relates to Australia, ¤0.2 million relates toItaly, ¤nil million relates to Poland, and ¤4.8 million relates to central costs.In the year ended 31 December 2014, ¤5.0 million of the exceptional itemsand impairments relates to Australia, ¤2.9 million relates to the UK, ¤2.2million relates to Germany, ¤2.8 million relates to France, ¤0.5 million relatesto Poland, ¤0.6 million relates to Italy and ¤6.8 million relates to centralcosts.
All reportable segments deal in the production and sale of ice cream andfrozen confectionery.
Transactions between reportable segments include trading transactions,management recharges and interest recharges. These are accounted for on anarm’s length basis.
RIC-B0237a R&R Annual Report 2015.qxp_Layout 1 02/03/2016 12:21 Page 24
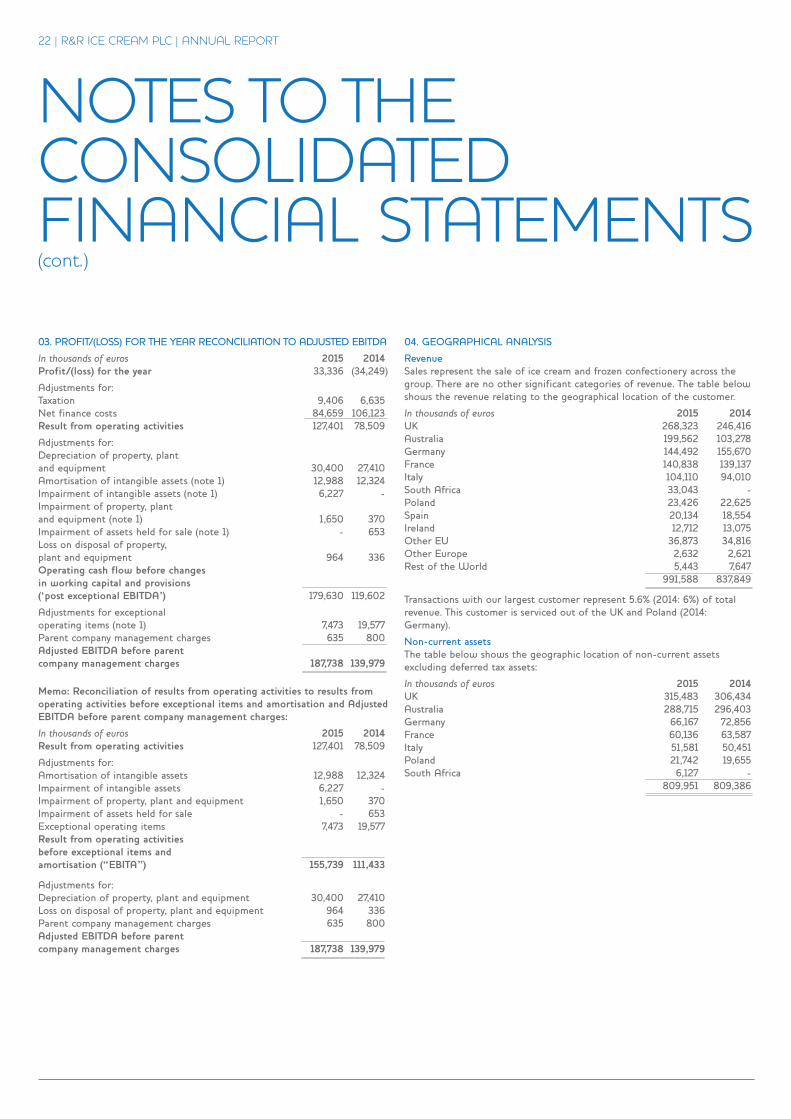
22 | R&R ICE CREAM PLC | ANNUAL REPORT
NOTES TO THECONSOLIDATEDFINANCIAL STATEMENTS(cont.)
03. PROFIT/(LOSS) FOR THE YEAR RECONCILIATION TO ADJUSTED EBITDA
In thousands of euros 2015 2014Profit/(loss) for the year 33,336 (34,249)
Adjustments for:Taxation 9,406 6,635Net finance costs 84,659 106,123Result from operating activities 127,401 78,509
Adjustments for:Depreciation of property, plantand equipment 30,400 27,410Amortisation of intangible assets (note 1) 12,988 12,324Impairment of intangible assets (note 1) 6,227 -Impairment of property, plantand equipment (note 1) 1,650 370Impairment of assets held for sale (note 1) - 653Loss on disposal of property,plant and equipment 964 336Operating cash flow before changesin working capital and provisions(‘post exceptional EBITDA’) 179,630 119,602
Adjustments for exceptionaloperating items (note 1) 7,473 19,577Parent company management charges 635 800Adjusted EBITDA before parent company management charges 187,738 139,979
Memo: Reconciliation of results from operating activities to results fromoperating activities before exceptional items and amortisation and AdjustedEBITDA before parent company management charges:
In thousands of euros 2015 2014Result from operating activities 127,401 78,509
Adjustments for:Amortisation of intangible assets 12,988 12,324Impairment of intangible assets 6,227 -Impairment of property, plant and equipment 1,650 370Impairment of assets held for sale - 653Exceptional operating items 7,473 19,577Result from operating activities before exceptional items and amortisation (“EBITA”) 155,739 111,433
Adjustments for:Depreciation of property, plant and equipment 30,400 27,410Loss on disposal of property, plant and equipment 964 336Parent company management charges 635 800Adjusted EBITDA before parentcompany management charges 187,738 139,979
04. GEOGRAPHICAL ANALYSIS
RevenueSales represent the sale of ice cream and frozen confectionery across thegroup. There are no other significant categories of revenue. The table belowshows the revenue relating to the geographical location of the customer.
In thousands of euros 2015 2014UK 268,323 246,416Australia 199,562 103,278Germany 144,492 155,670France 140,838 139,137Italy 104,110 94,010South Africa 33,043 -Poland 23,426 22,625Spain 20,134 18,554Ireland 12,712 13,075Other EU 36,873 34,816Other Europe 2,632 2,621Rest of the World 5,443 7,647 991,588 837,849
Transactions with our largest customer represent 5.6% (2014: 6%) of totalrevenue. This customer is serviced out of the UK and Poland (2014:Germany).
Non-current assetsThe table below shows the geographic location of non-current assetsexcluding deferred tax assets:
In thousands of euros 2015 2014UK 315,483 306,434Australia 288,715 296,403Germany 66,167 72,856France 60,136 63,587Italy 51,581 50,451Poland 21,742 19,655South Africa 6,127 - 809,951 809,386
RIC-B0237a R&R Annual Report 2015.qxp_Layout 1 02/03/2016 12:21 Page 25
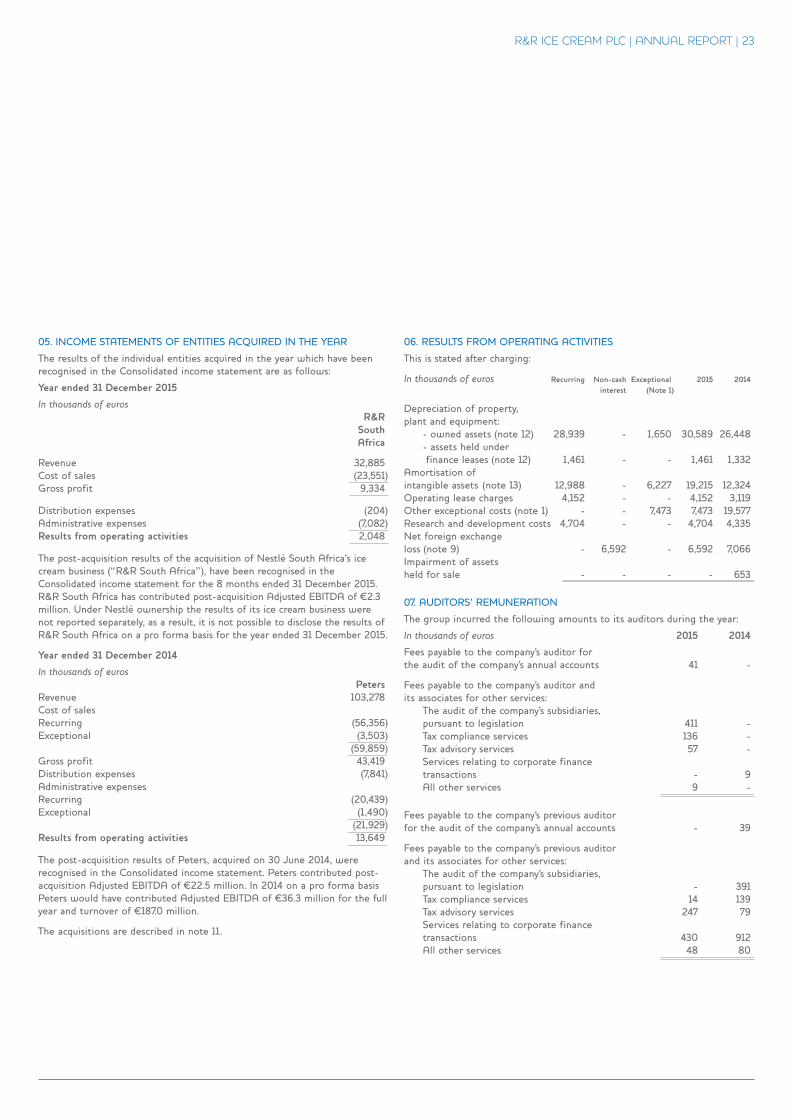
R&R ICE CREAM PLC | ANNUAL REPORT | 23
05. INCOME STATEMENTS OF ENTITIES ACQUIRED IN THE YEAR
The results of the individual entities acquired in the year which have beenrecognised in the Consolidated income statement are as follows:
Year ended 31 December 2015
In thousands of euros R&R South Africa
Revenue 32,885Cost of sales (23,551)Gross profit 9,334
Distribution expenses (204)Administrative expenses (7,082)Results from operating activities 2,048
The post-acquisition results of the acquisition of Nestlé South Africa’s icecream business (“R&R South Africa”), have been recognised in theConsolidated income statement for the 8 months ended 31 December 2015.R&R South Africa has contributed post-acquisition Adjusted EBITDA of ¤2.3million. Under Nestlé ownership the results of its ice cream business werenot reported separately, as a result, it is not possible to disclose the results ofR&R South Africa on a pro forma basis for the year ended 31 December 2015.
Year ended 31 December 2014
In thousands of euros PetersRevenue 103,278Cost of sales Recurring (56,356)Exceptional (3,503) (59,859)Gross profit 43,419Distribution expenses (7,841)Administrative expensesRecurring (20,439)Exceptional (1,490) (21,929)Results from operating activities 13,649
The post-acquisition results of Peters, acquired on 30 June 2014, wererecognised in the Consolidated income statement. Peters contributed post-acquisition Adjusted EBITDA of ¤22.5 million. In 2014 on a pro forma basisPeters would have contributed Adjusted EBITDA of ¤36.3 million for the fullyear and turnover of ¤187.0 million.
The acquisitions are described in note 11.
06. RESULTS FROM OPERATING ACTIVITIES
This is stated after charging:
In thousands of euros Recurring Non-cash Exceptional 2015 2014 interest (Note 1)
Depreciation of property, plant and equipment: - owned assets (note 12) 28,939 - 1,650 30,589 26,448 - assets held under finance leases (note 12) 1,461 - - 1,461 1,332Amortisation ofintangible assets (note 13) 12,988 - 6,227 19,215 12,324Operating lease charges 4,152 - - 4,152 3,119Other exceptional costs (note 1) - - 7,473 7,473 19,577Research and development costs 4,704 - - 4,704 4,335Net foreign exchangeloss (note 9) - 6,592 - 6,592 7,066Impairment of assets held for sale - - - - 653
07. AUDITORS’ REMUNERATION
The group incurred the following amounts to its auditors during the year:
In thousands of euros 2015 2014
Fees payable to the company's auditor forthe audit of the company's annual accounts 41 -
Fees payable to the company's auditor andits associates for other services: The audit of the company's subsidiaries, pursuant to legislation 411 - Tax compliance services 136 - Tax advisory services 57 - Services relating to corporate finance transactions - 9 All other services 9 -
Fees payable to the company's previous auditorfor the audit of the company's annual accounts - 39
Fees payable to the company's previous auditorand its associates for other services: The audit of the company's subsidiaries, pursuant to legislation - 391 Tax compliance services 14 139 Tax advisory services 247 79 Services relating to corporate finance transactions 430 912 All other services 48 80
RIC-B0237a R&R Annual Report 2015.qxp_Layout 1 02/03/2016 12:21 Page 26
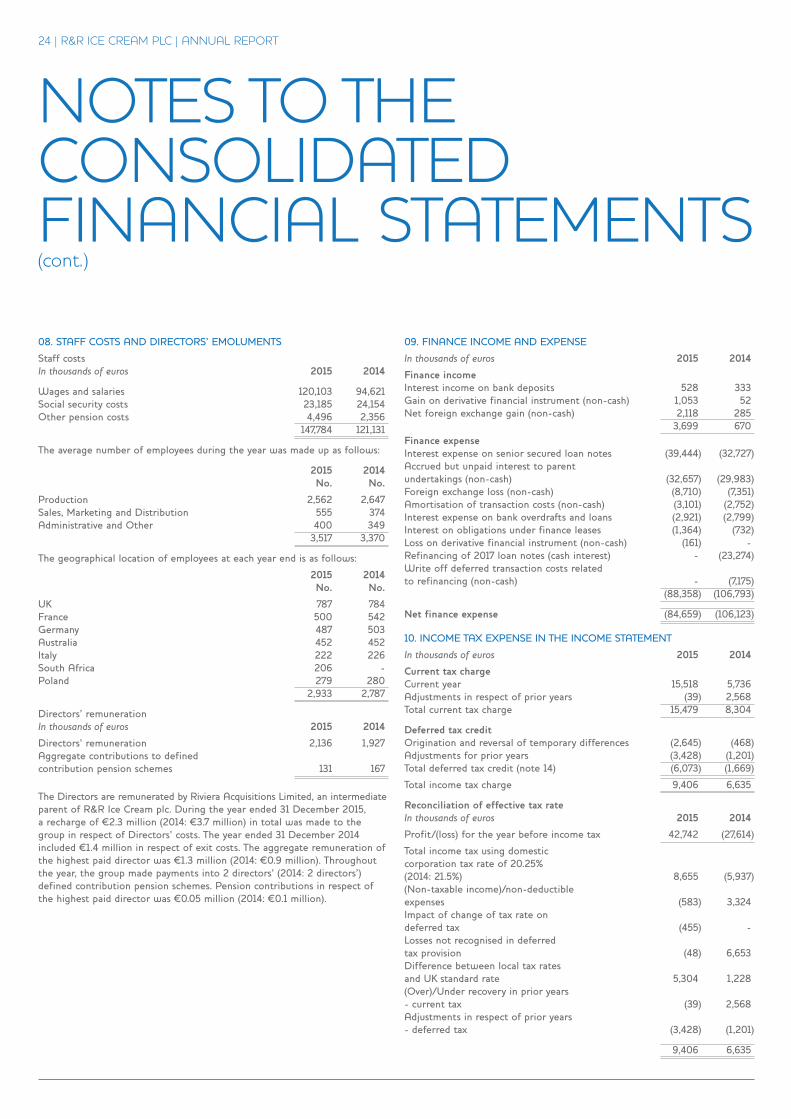
24 | R&R ICE CREAM PLC | ANNUAL REPORT
NOTES TO THECONSOLIDATEDFINANCIAL STATEMENTS(cont.)
08. STAFF COSTS AND DIRECTORS’ EMOLUMENTS
Staff costsIn thousands of euros 2015 2014
Wages and salaries 120,103 94,621Social security costs 23,185 24,154Other pension costs 4,496 2,356 147,784 121,131
The average number of employees during the year was made up as follows:
2015 2014 No. No.
Production 2,562 2,647Sales, Marketing and Distribution 555 374Administrative and Other 400 349 3,517 3,370
The geographical location of employees at each year end is as follows:
2015 2014 No. No.
UK 787 784France 500 542Germany 487 503Australia 452 452Italy 222 226South Africa 206 -Poland 279 280 2,933 2,787
Directors’ remunerationIn thousands of euros 2015 2014
Directors’ remuneration 2,136 1,927Aggregate contributions to defined contribution pension schemes 131 167
The Directors are remunerated by Riviera Acquisitions Limited, an intermediateparent of R&R Ice Cream plc. During the year ended 31 December 2015,a recharge of ¤2.3 million (2014: ¤3.7 million) in total was made to thegroup in respect of Directors’ costs. The year ended 31 December 2014included ¤1.4 million in respect of exit costs. The aggregate remuneration ofthe highest paid director was ¤1.3 million (2014: ¤0.9 million). Throughoutthe year, the group made payments into 2 directors’ (2014: 2 directors’)defined contribution pension schemes. Pension contributions in respect ofthe highest paid director was ¤0.05 million (2014: ¤0.1 million).
09. FINANCE INCOME AND EXPENSE
In thousands of euros 2015 2014
Finance income Interest income on bank deposits 528 333Gain on derivative financial instrument (non-cash) 1,053 52Net foreign exchange gain (non-cash) 2,118 285 3,699 670Finance expense Interest expense on senior secured loan notes (39,444) (32,727)Accrued but unpaid interest to parentundertakings (non-cash) (32,657) (29,983)Foreign exchange loss (non-cash) (8,710) (7,351)Amortisation of transaction costs (non-cash) (3,101) (2,752)Interest expense on bank overdrafts and loans (2,921) (2,799)Interest on obligations under finance leases (1,364) (732)Loss on derivative financial instrument (non-cash) (161) -Refinancing of 2017 loan notes (cash interest) - (23,274)Write off deferred transaction costs related to refinancing (non-cash) - (7,175) (88,358) (106,793)
Net finance expense (84,659) (106,123)
10. INCOME TAX EXPENSE IN THE INCOME STATEMENT
In thousands of euros 2015 2014
Current tax charge Current year 15,518 5,736Adjustments in respect of prior years (39) 2,568Total current tax charge 15,479 8,304
Deferred tax credit Origination and reversal of temporary differences (2,645) (468)Adjustments for prior years (3,428) (1,201)Total deferred tax credit (note 14) (6,073) (1,669)
Total income tax charge 9,406 6,635
Reconciliation of effective tax rateIn thousands of euros 2015 2014
Profit/(loss) for the year before income tax 42,742 (27,614)
Total income tax using domesticcorporation tax rate of 20.25%(2014: 21.5%) 8,655 (5,937)(Non-taxable income)/non-deductibleexpenses (583) 3,324Impact of change of tax rate ondeferred tax (455) -Losses not recognised in deferredtax provision (48) 6,653Difference between local tax ratesand UK standard rate 5,304 1,228(Over)/Under recovery in prior years- current tax (39) 2,568Adjustments in respect of prior years- deferred tax (3,428) (1,201)
9,406 6,635
RIC-B0237a R&R Annual Report 2015.qxp_Layout 1 02/03/2016 12:21 Page 27
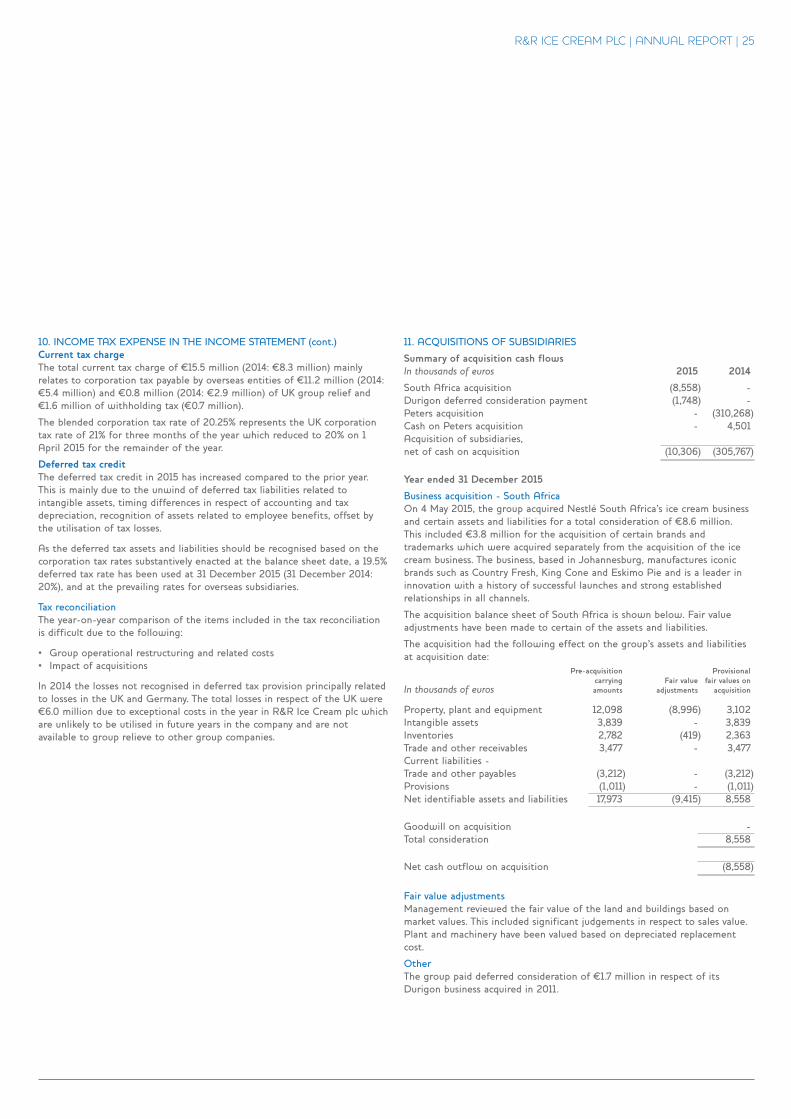
R&R ICE CREAM PLC | ANNUAL REPORT | 25
10. INCOME TAX EXPENSE IN THE INCOME STATEMENT (cont.)Current tax charge The total current tax charge of ¤15.5 million (2014: ¤8.3 million) mainlyrelates to corporation tax payable by overseas entities of ¤11.2 million (2014:¤5.4 million) and ¤0.8 million (2014: ¤2.9 million) of UK group relief and¤1.6 million of withholding tax (¤0.7 million).
The blended corporation tax rate of 20.25% represents the UK corporationtax rate of 21% for three months of the year which reduced to 20% on 1April 2015 for the remainder of the year.
Deferred tax creditThe deferred tax credit in 2015 has increased compared to the prior year.This is mainly due to the unwind of deferred tax liabilities related tointangible assets, timing differences in respect of accounting and taxdepreciation, recognition of assets related to employee benefits, offset bythe utilisation of tax losses.
As the deferred tax assets and liabilities should be recognised based on thecorporation tax rates substantively enacted at the balance sheet date, a 19.5%deferred tax rate has been used at 31 December 2015 (31 December 2014:20%), and at the prevailing rates for overseas subsidiaries.
Tax reconciliationThe year-on-year comparison of the items included in the tax reconciliationis difficult due to the following:
• Group operational restructuring and related costs• Impact of acquisitions
In 2014 the losses not recognised in deferred tax provision principally relatedto losses in the UK and Germany. The total losses in respect of the UK were¤6.0 million due to exceptional costs in the year in R&R Ice Cream plc whichare unlikely to be utilised in future years in the company and are notavailable to group relieve to other group companies.
11. ACQUISITIONS OF SUBSIDIARIES
Summary of acquisition cash flowsIn thousands of euros 2015 2014
South Africa acquisition (8,558) -Durigon deferred consideration payment (1,748) -Peters acquisition - (310,268)Cash on Peters acquisition - 4,501Acquisition of subsidiaries,net of cash on acquisition (10,306) (305,767)
Year ended 31 December 2015
Business acquisition - South AfricaOn 4 May 2015, the group acquired Nestlé South Africa’s ice cream businessand certain assets and liabilities for a total consideration of ¤8.6 million.This included ¤3.8 million for the acquisition of certain brands andtrademarks which were acquired separately from the acquisition of the icecream business. The business, based in Johannesburg, manufactures iconicbrands such as Country Fresh, King Cone and Eskimo Pie and is a leader ininnovation with a history of successful launches and strong establishedrelationships in all channels.
The acquisition balance sheet of South Africa is shown below. Fair valueadjustments have been made to certain of the assets and liabilities.
The acquisition had the following effect on the group’s assets and liabilitiesat acquisition date: Pre-acquisition Provisional carrying Fair value fair values onIn thousands of euros amounts adjustments acquisition
Property, plant and equipment 12,098 (8,996) 3,102Intangible assets 3,839 - 3,839Inventories 2,782 (419) 2,363Trade and other receivables 3,477 - 3,477Current liabilities - Trade and other payables (3,212) - (3,212)Provisions (1,011) - (1,011)Net identifiable assets and liabilities 17,973 (9,415) 8,558
Goodwill on acquisition -Total consideration 8,558
Net cash outflow on acquisition (8,558)
Fair value adjustmentsManagement reviewed the fair value of the land and buildings based onmarket values. This included significant judgements in respect to sales value.Plant and machinery have been valued based on depreciated replacementcost.
OtherThe group paid deferred consideration of ¤1.7 million in respect of itsDurigon business acquired in 2011.
RIC-B0237a R&R Annual Report 2015.qxp_Layout 1 02/03/2016 12:21 Page 28
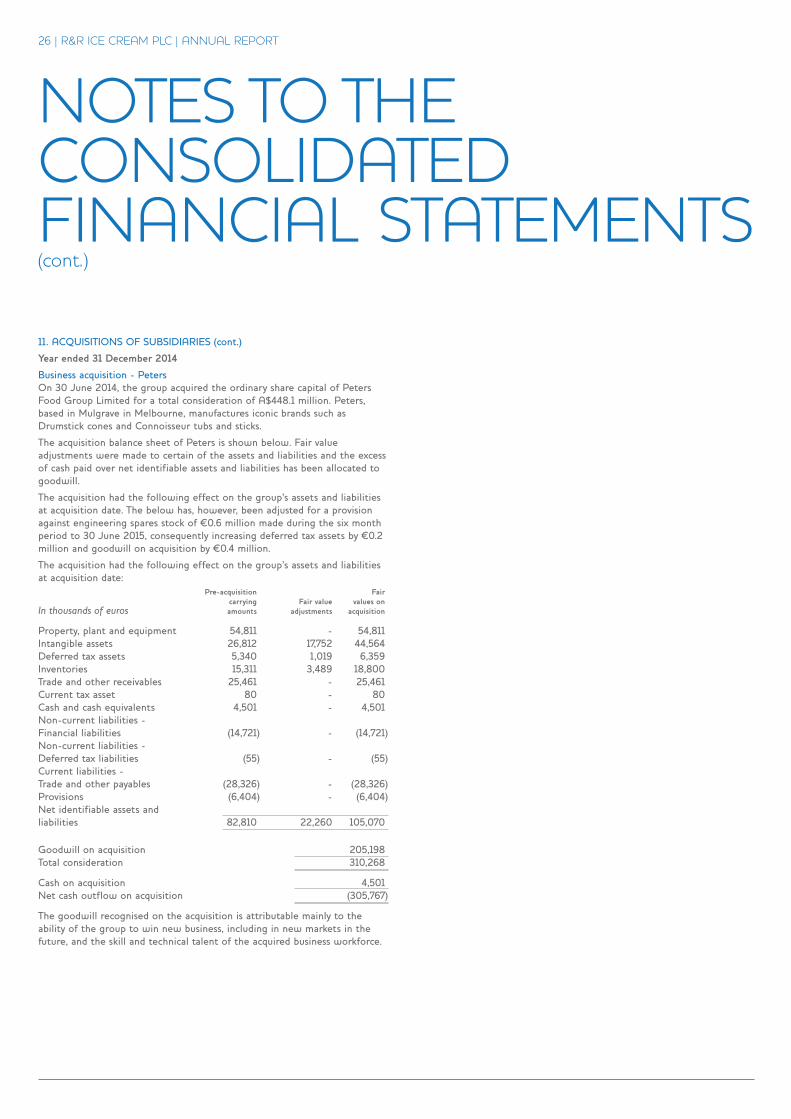
26 | R&R ICE CREAM PLC | ANNUAL REPORT
NOTES TO THECONSOLIDATEDFINANCIAL STATEMENTS(cont.)
11. ACQUISITIONS OF SUBSIDIARIES (cont.)
Year ended 31 December 2014
Business acquisition - PetersOn 30 June 2014, the group acquired the ordinary share capital of PetersFood Group Limited for a total consideration of A$448.1 million. Peters,based in Mulgrave in Melbourne, manufactures iconic brands such asDrumstick cones and Connoisseur tubs and sticks.
The acquisition balance sheet of Peters is shown below. Fair valueadjustments were made to certain of the assets and liabilities and the excessof cash paid over net identifiable assets and liabilities has been allocated togoodwill.
The acquisition had the following effect on the group’s assets and liabilitiesat acquisition date. The below has, however, been adjusted for a provisionagainst engineering spares stock of ¤0.6 million made during the six monthperiod to 30 June 2015, consequently increasing deferred tax assets by ¤0.2million and goodwill on acquisition by ¤0.4 million.
The acquisition had the following effect on the group’s assets and liabilitiesat acquisition date: Pre-acquisition Fair carrying Fair value values onIn thousands of euros amounts adjustments acquisition
Property, plant and equipment 54,811 - 54,811Intangible assets 26,812 17,752 44,564Deferred tax assets 5,340 1,019 6,359Inventories 15,311 3,489 18,800Trade and other receivables 25,461 - 25,461Current tax asset 80 - 80Cash and cash equivalents 4,501 - 4,501Non-current liabilities -Financial liabilities (14,721) - (14,721)Non-current liabilities -Deferred tax liabilities (55) - (55)Current liabilities -Trade and other payables (28,326) - (28,326)Provisions (6,404) - (6,404)Net identifiable assets andliabilities 82,810 22,260 105,070
Goodwill on acquisition 205,198Total consideration 310,268
Cash on acquisition 4,501Net cash outflow on acquisition (305,767)
The goodwill recognised on the acquisition is attributable mainly to theability of the group to win new business, including in new markets in thefuture, and the skill and technical talent of the acquired business workforce.
RIC-B0237a R&R Annual Report 2015.qxp_Layout 1 02/03/2016 12:21 Page 29
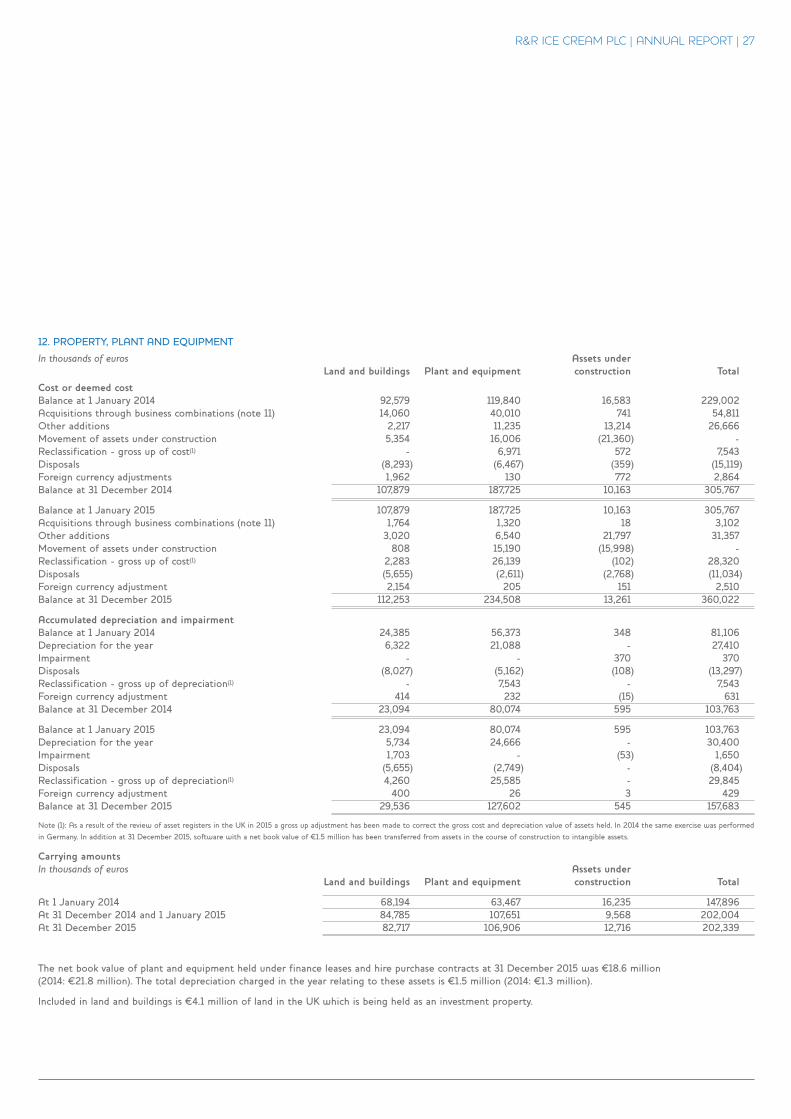
R&R ICE CREAM PLC | ANNUAL REPORT | 27
12. PROPERTY, PLANT AND EQUIPMENT
In thousands of euros Assets under Land and buildings Plant and equipment construction Total
Cost or deemed costBalance at 1 January 2014 92,579 119,840 16,583 229,002Acquisitions through business combinations (note 11) 14,060 40,010 741 54,811Other additions 2,217 11,235 13,214 26,666Movement of assets under construction 5,354 16,006 (21,360) -Reclassification - gross up of cost(1) - 6,971 572 7,543Disposals (8,293) (6,467) (359) (15,119)Foreign currency adjustments 1,962 130 772 2,864Balance at 31 December 2014 107,879 187,725 10,163 305,767
Balance at 1 January 2015 107,879 187,725 10,163 305,767Acquisitions through business combinations (note 11) 1,764 1,320 18 3,102Other additions 3,020 6,540 21,797 31,357Movement of assets under construction 808 15,190 (15,998) -Reclassification - gross up of cost(1) 2,283 26,139 (102) 28,320Disposals (5,655) (2,611) (2,768) (11,034)Foreign currency adjustment 2,154 205 151 2,510Balance at 31 December 2015 112,253 234,508 13,261 360,022
Accumulated depreciation and impairment Balance at 1 January 2014 24,385 56,373 348 81,106Depreciation for the year 6,322 21,088 - 27,410Impairment - - 370 370Disposals (8,027) (5,162) (108) (13,297)Reclassification - gross up of depreciation(1) - 7,543 - 7,543Foreign currency adjustment 414 232 (15) 631Balance at 31 December 2014 23,094 80,074 595 103,763
Balance at 1 January 2015 23,094 80,074 595 103,763Depreciation for the year 5,734 24,666 - 30,400Impairment 1,703 - (53) 1,650Disposals (5,655) (2,749) - (8,404)Reclassification - gross up of depreciation(1) 4,260 25,585 - 29,845Foreign currency adjustment 400 26 3 429Balance at 31 December 2015 29,536 127,602 545 157,683
Note (1): As a result of the review of asset registers in the UK in 2015 a gross up adjustment has been made to correct the gross cost and depreciation value of assets held. In 2014 the same exercise was performedin Germany. In addition at 31 December 2015, software with a net book value of ¤1.5 million has been transferred from assets in the course of construction to intangible assets.
Carrying amountsIn thousands of euros Assets under Land and buildings Plant and equipment construction Total
At 1 January 2014 68,194 63,467 16,235 147,896At 31 December 2014 and 1 January 2015 84,785 107,651 9,568 202,004At 31 December 2015 82,717 106,906 12,716 202,339
The net book value of plant and equipment held under finance leases and hire purchase contracts at 31 December 2015 was ¤18.6 million(2014: ¤21.8 million). The total depreciation charged in the year relating to these assets is ¤1.5 million (2014: ¤1.3 million).
Included in land and buildings is ¤4.1 million of land in the UK which is being held as an investment property.
RIC-B0237a R&R Annual Report 2015.qxp_Layout 1 02/03/2016 12:21 Page 30
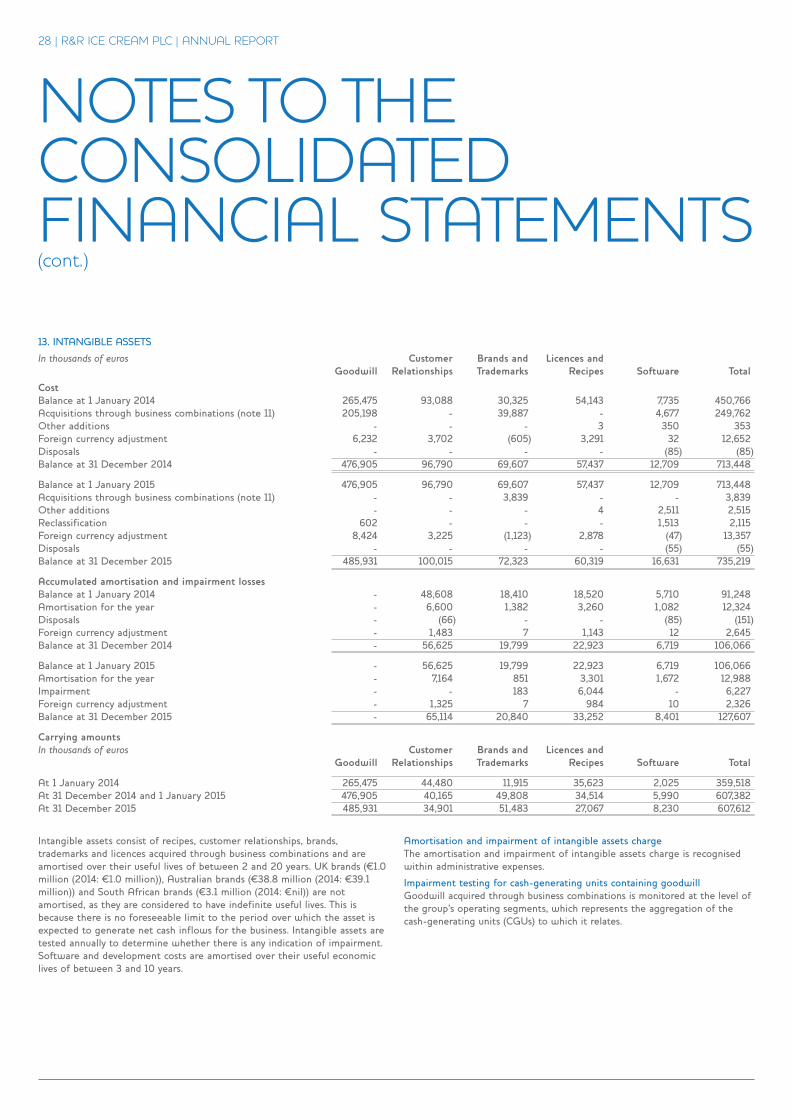
28 | R&R ICE CREAM PLC | ANNUAL REPORT
NOTES TO THECONSOLIDATEDFINANCIAL STATEMENTS(cont.)
13. INTANGIBLE ASSETS
In thousands of euros Customer Brands and Licences and Goodwill Relationships Trademarks Recipes Software Total
Cost Balance at 1 January 2014 265,475 93,088 30,325 54,143 7,735 450,766Acquisitions through business combinations (note 11) 205,198 - 39,887 - 4,677 249,762Other additions - - - 3 350 353Foreign currency adjustment 6,232 3,702 (605) 3,291 32 12,652Disposals - - - - (85) (85)Balance at 31 December 2014 476,905 96,790 69,607 57,437 12,709 713,448
Balance at 1 January 2015 476,905 96,790 69,607 57,437 12,709 713,448Acquisitions through business combinations (note 11) - - 3,839 - - 3,839Other additions - - - 4 2,511 2,515Reclassification 602 - - - 1,513 2,115Foreign currency adjustment 8,424 3,225 (1,123) 2,878 (47) 13,357Disposals - - - - (55) (55)Balance at 31 December 2015 485,931 100,015 72,323 60,319 16,631 735,219
Accumulated amortisation and impairment losses Balance at 1 January 2014 - 48,608 18,410 18,520 5,710 91,248Amortisation for the year - 6,600 1,382 3,260 1,082 12,324Disposals - (66) - - (85) (151)Foreign currency adjustment - 1,483 7 1,143 12 2,645Balance at 31 December 2014 - 56,625 19,799 22,923 6,719 106,066
Balance at 1 January 2015 - 56,625 19,799 22,923 6,719 106,066Amortisation for the year - 7,164 851 3,301 1,672 12,988Impairment - - 183 6,044 - 6,227Foreign currency adjustment - 1,325 7 984 10 2,326Balance at 31 December 2015 - 65,114 20,840 33,252 8,401 127,607
Carrying amounts In thousands of euros Customer Brands and Licences and Goodwill Relationships Trademarks Recipes Software Total
At 1 January 2014 265,475 44,480 11,915 35,623 2,025 359,518At 31 December 2014 and 1 January 2015 476,905 40,165 49,808 34,514 5,990 607,382At 31 December 2015 485,931 34,901 51,483 27,067 8,230 607,612
Intangible assets consist of recipes, customer relationships, brands,trademarks and licences acquired through business combinations and areamortised over their useful lives of between 2 and 20 years. UK brands (¤1.0million (2014: ¤1.0 million)), Australian brands (¤38.8 million (2014: ¤39.1million)) and South African brands (¤3.1 million (2014: ¤nil)) are notamortised, as they are considered to have indefinite useful lives. This isbecause there is no foreseeable limit to the period over which the asset isexpected to generate net cash inflows for the business. Intangible assets aretested annually to determine whether there is any indication of impairment.Software and development costs are amortised over their useful economiclives of between 3 and 10 years.
Amortisation and impairment of intangible assets chargeThe amortisation and impairment of intangible assets charge is recognisedwithin administrative expenses.
Impairment testing for cash-generating units containing goodwillGoodwill acquired through business combinations is monitored at the level ofthe group’s operating segments, which represents the aggregation of thecash-generating units (CGUs) to which it relates.
RIC-B0237a R&R Annual Report 2015.qxp_Layout 1 02/03/2016 12:21 Page 31
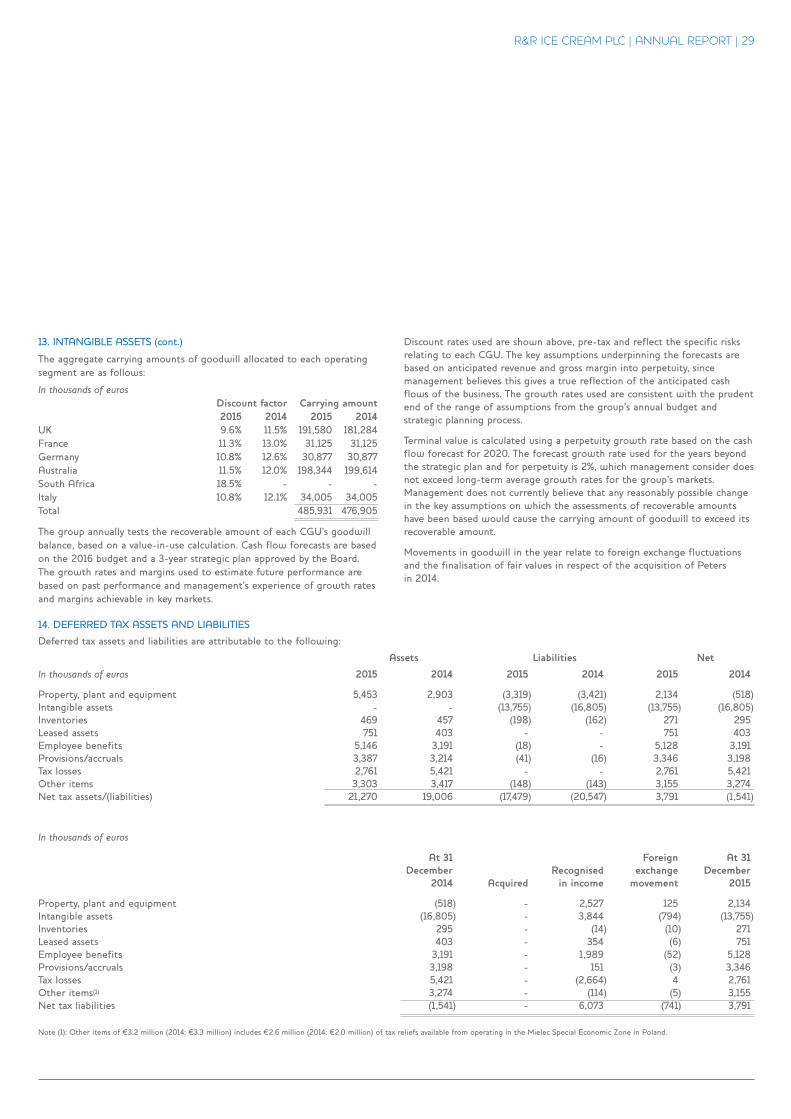
R&R ICE CREAM PLC | ANNUAL REPORT | 29
13. INTANGIBLE ASSETS (cont.)
The aggregate carrying amounts of goodwill allocated to each operatingsegment are as follows:
In thousands of euros Discount factor Carrying amount 2015 2014 2015 2014UK 9.6% 11.5% 191,580 181,284France 11.3% 13.0% 31,125 31,125Germany 10.8% 12.6% 30,877 30,877Australia 11.5% 12.0% 198,344 199,614South Africa 18.5% - - -Italy 10.8% 12.1% 34,005 34,005 Total 485,931 476,905
The group annually tests the recoverable amount of each CGU’s goodwillbalance, based on a value-in-use calculation. Cash flow forecasts are basedon the 2016 budget and a 3-year strategic plan approved by the Board.The growth rates and margins used to estimate future performance arebased on past performance and management’s experience of growth ratesand margins achievable in key markets.
Discount rates used are shown above, pre-tax and reflect the specific risksrelating to each CGU. The key assumptions underpinning the forecasts arebased on anticipated revenue and gross margin into perpetuity, sincemanagement believes this gives a true reflection of the anticipated cashflows of the business. The growth rates used are consistent with the prudentend of the range of assumptions from the group’s annual budget andstrategic planning process.
Terminal value is calculated using a perpetuity growth rate based on the cashflow forecast for 2020. The forecast growth rate used for the years beyondthe strategic plan and for perpetuity is 2%, which management consider doesnot exceed long-term average growth rates for the group’s markets.Management does not currently believe that any reasonably possible changein the key assumptions on which the assessments of recoverable amountshave been based would cause the carrying amount of goodwill to exceed itsrecoverable amount.
Movements in goodwill in the year relate to foreign exchange fluctuationsand the finalisation of fair values in respect of the acquisition of Petersin 2014.
14. DEFERRED TAX ASSETS AND LIABILITIES
Deferred tax assets and liabilities are attributable to the following:
Assets Liabilities Net
In thousands of euros 2015 2014 2015 2014 2015 2014
Property, plant and equipment 5,453 2,903 (3,319) (3,421) 2,134 (518)Intangible assets - - (13,755) (16,805) (13,755) (16,805)Inventories 469 457 (198) (162) 271 295Leased assets 751 403 - - 751 403Employee benefits 5,146 3,191 (18) - 5,128 3,191Provisions/accruals 3,387 3,214 (41) (16) 3,346 3,198Tax losses 2,761 5,421 - - 2,761 5,421Other items 3,303 3,417 (148) (143) 3,155 3,274Net tax assets/(liabilities) 21,270 19,006 (17,479) (20,547) 3,791 (1,541)
In thousands of euros
At 31 Foreign At 31 December Recognised exchange December 2014 Acquired in income movement 2015
Property, plant and equipment (518) - 2,527 125 2,134Intangible assets (16,805) - 3,844 (794) (13,755)Inventories 295 - (14) (10) 271Leased assets 403 - 354 (6) 751Employee benefits 3,191 - 1,989 (52) 5,128Provisions/accruals 3,198 - 151 (3) 3,346Tax losses 5,421 - (2,664) 4 2,761Other items(1) 3,274 - (114) (5) 3,155Net tax liabilities (1,541) - 6,073 (741) 3,791
Note (1): Other items of ¤3.2 million (2014: ¤3.3 million) includes ¤2.6 million (2014: ¤2.0 million) of tax reliefs available from operating in the Mielec Special Economic Zone in Poland.
RIC-B0237a R&R Annual Report 2015.qxp_Layout 1 02/03/2016 12:21 Page 32
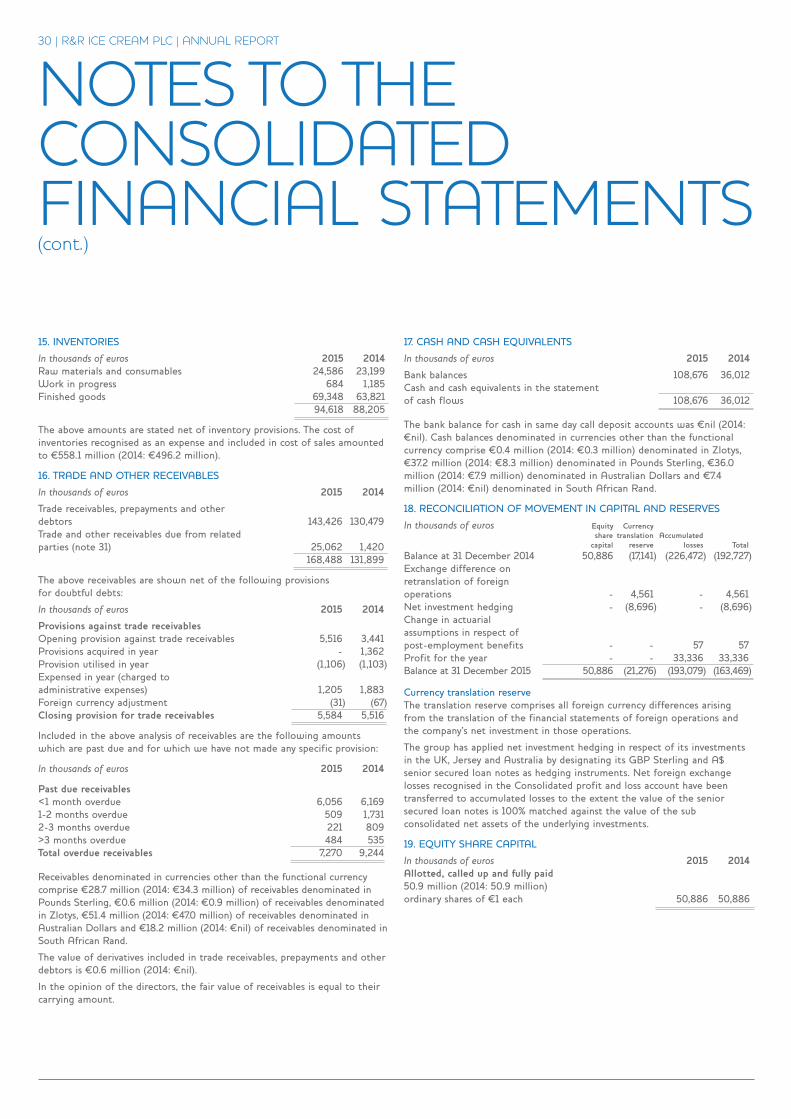
30 | R&R ICE CREAM PLC | ANNUAL REPORT
NOTES TO THECONSOLIDATEDFINANCIAL STATEMENTS(cont.)
15. INVENTORIES
In thousands of euros 2015 2014Raw materials and consumables 24,586 23,199Work in progress 684 1,185Finished goods 69,348 63,821 94,618 88,205
The above amounts are stated net of inventory provisions. The cost ofinventories recognised as an expense and included in cost of sales amountedto ¤558.1 million (2014: ¤496.2 million).
16. TRADE AND OTHER RECEIVABLES
In thousands of euros 2015 2014
Trade receivables, prepayments and otherdebtors 143,426 130,479Trade and other receivables due from relatedparties (note 31) 25,062 1,420 168,488 131,899
The above receivables are shown net of the following provisions for doubtful debts:
In thousands of euros 2015 2014
Provisions against trade receivables Opening provision against trade receivables 5,516 3,441Provisions acquired in year - 1,362Provision utilised in year (1,106) (1,103)Expensed in year (charged toadministrative expenses) 1,205 1,883Foreign currency adjustment (31) (67)Closing provision for trade receivables 5,584 5,516
Included in the above analysis of receivables are the following amountswhich are past due and for which we have not made any specific provision:
In thousands of euros 2015 2014
Past due receivables <1 month overdue 6,056 6,1691-2 months overdue 509 1,7312-3 months overdue 221 809>3 months overdue 484 535Total overdue receivables 7,270 9,244
Receivables denominated in currencies other than the functional currencycomprise ¤28.7 million (2014: ¤34.3 million) of receivables denominated inPounds Sterling, ¤0.6 million (2014: ¤0.9 million) of receivables denominatedin Zlotys, ¤51.4 million (2014: ¤47.0 million) of receivables denominated inAustralian Dollars and ¤18.2 million (2014: ¤nil) of receivables denominated inSouth African Rand.
The value of derivatives included in trade receivables, prepayments and otherdebtors is ¤0.6 million (2014: ¤nil).
In the opinion of the directors, the fair value of receivables is equal to theircarrying amount.
17. CASH AND CASH EQUIVALENTS
In thousands of euros 2015 2014
Bank balances 108,676 36,012Cash and cash equivalents in the statementof cash flows 108,676 36,012
The bank balance for cash in same day call deposit accounts was ¤nil (2014:¤nil). Cash balances denominated in currencies other than the functionalcurrency comprise ¤0.4 million (2014: ¤0.3 million) denominated in Zlotys,¤37.2 million (2014: ¤8.3 million) denominated in Pounds Sterling, ¤36.0million (2014: ¤7.9 million) denominated in Australian Dollars and ¤7.4million (2014: ¤nil) denominated in South African Rand.
18. RECONCILIATION OF MOVEMENT IN CAPITAL AND RESERVES
In thousands of euros Equity Currency share translation Accumulated capital reserve losses Total Balance at 31 December 2014 50,886 (17,141) (226,472) (192,727)Exchange difference onretranslation of foreignoperations - 4,561 - 4,561 Net investment hedging - (8,696) - (8,696)Change in actuarialassumptions in respect ofpost-employment benefits - - 57 57Profit for the year - - 33,336 33,336Balance at 31 December 2015 50,886 (21,276) (193,079) (163,469)
Currency translation reserve The translation reserve comprises all foreign currency differences arisingfrom the translation of the financial statements of foreign operations andthe company’s net investment in those operations.
The group has applied net investment hedging in respect of its investmentsin the UK, Jersey and Australia by designating its GBP Sterling and A$senior secured loan notes as hedging instruments. Net foreign exchangelosses recognised in the Consolidated profit and loss account have beentransferred to accumulated losses to the extent the value of the seniorsecured loan notes is 100% matched against the value of the subconsolidated net assets of the underlying investments.
19. EQUITY SHARE CAPITAL
In thousands of euros 2015 2014Allotted, called up and fully paid50.9 million (2014: 50.9 million)ordinary shares of ¤1 each 50,886 50,886
RIC-B0237a R&R Annual Report 2015.qxp_Layout 1 02/03/2016 12:21 Page 33
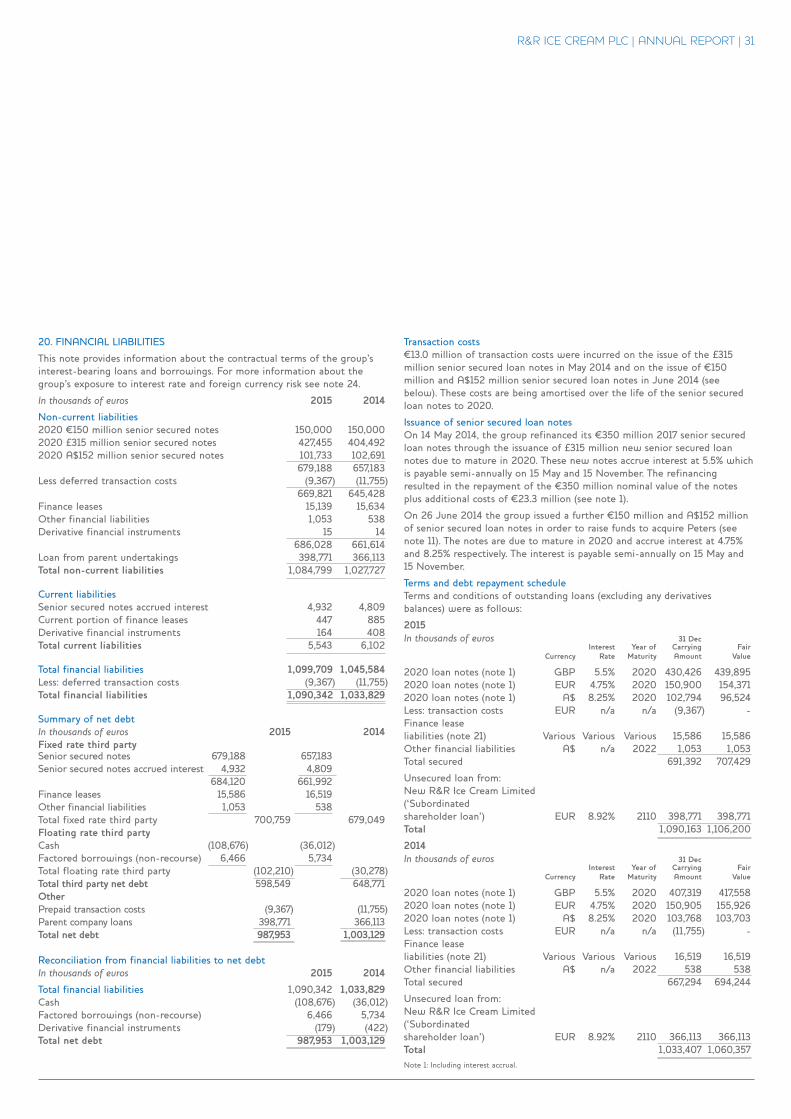
R&R ICE CREAM PLC | ANNUAL REPORT | 31
20. FINANCIAL LIABILITIES
This note provides information about the contractual terms of the group’sinterest-bearing loans and borrowings. For more information about thegroup’s exposure to interest rate and foreign currency risk see note 24.
In thousands of euros 2015 2014
Non-current liabilities 2020 ¤150 million senior secured notes 150,000 150,0002020 £315 million senior secured notes 427,455 404,4922020 A$152 million senior secured notes 101,733 102,691 679,188 657,183Less deferred transaction costs (9,367) (11,755) 669,821 645,428Finance leases 15,139 15,634Other financial liabilities 1,053 538Derivative financial instruments 15 14 686,028 661,614Loan from parent undertakings 398,771 366,113Total non-current liabilities 1,084,799 1,027,727
Current liabilities Senior secured notes accrued interest 4,932 4,809Current portion of finance leases 447 885Derivative financial instruments 164 408Total current liabilities 5,543 6,102
Total financial liabilities 1,099,709 1,045,584Less: deferred transaction costs (9,367) (11,755)Total financial liabilities 1,090,342 1,033,829
Summary of net debtIn thousands of euros 2015 2014Fixed rate third partySenior secured notes 679,188 657,183Senior secured notes accrued interest 4,932 4,809 684,120 661,992Finance leases 15,586 16,519Other financial liabilities 1,053 538Total fixed rate third party 700,759 679,049Floating rate third partyCash (108,676) (36,012)Factored borrowings (non-recourse) 6,466 5,734Total floating rate third party (102,210) (30,278)Total third party net debt 598,549 648,771OtherPrepaid transaction costs (9,367) (11,755)Parent company loans 398,771 366,113Total net debt 987,953 1,003,129
Reconciliation from financial liabilities to net debtIn thousands of euros 2015 2014
Total financial liabilities 1,090,342 1,033,829Cash (108,676) (36,012)Factored borrowings (non-recourse) 6,466 5,734Derivative financial instruments (179) (422)Total net debt 987,953 1,003,129
Transaction costs¤13.0 million of transaction costs were incurred on the issue of the £315million senior secured loan notes in May 2014 and on the issue of ¤150million and A$152 million senior secured loan notes in June 2014 (seebelow). These costs are being amortised over the life of the senior securedloan notes to 2020.
Issuance of senior secured loan notesOn 14 May 2014, the group refinanced its ¤350 million 2017 senior securedloan notes through the issuance of £315 million new senior secured loannotes due to mature in 2020. These new notes accrue interest at 5.5% whichis payable semi-annually on 15 May and 15 November. The refinancingresulted in the repayment of the ¤350 million nominal value of the notesplus additional costs of ¤23.3 million (see note 1).
On 26 June 2014 the group issued a further ¤150 million and A$152 millionof senior secured loan notes in order to raise funds to acquire Peters (seenote 11). The notes are due to mature in 2020 and accrue interest at 4.75%and 8.25% respectively. The interest is payable semi-annually on 15 May and15 November.
Terms and debt repayment scheduleTerms and conditions of outstanding loans (excluding any derivativesbalances) were as follows:
2015In thousands of euros 31 Dec Interest Year of Carrying Fair Currency Rate Maturity Amount Value
2020 loan notes (note 1) GBP 5.5% 2020 430,426 439,8952020 loan notes (note 1) EUR 4.75% 2020 150,900 154,3712020 loan notes (note 1) A$ 8.25% 2020 102,794 96,524Less: transaction costs EUR n/a n/a (9,367) -Finance lease liabilities (note 21) Various Various Various 15,586 15,586Other financial liabilities A$ n/a 2022 1,053 1,053Total secured 691,392 707,429
Unsecured loan from: New R&R Ice Cream Limited (‘Subordinated shareholder loan’) EUR 8.92% 2110 398,771 398,771Total 1,090,163 1,106,200
2014In thousands of euros 31 Dec Interest Year of Carrying Fair Currency Rate Maturity Amount Value
2020 loan notes (note 1) GBP 5.5% 2020 407,319 417,5582020 loan notes (note 1) EUR 4.75% 2020 150,905 155,9262020 loan notes (note 1) A$ 8.25% 2020 103,768 103,703Less: transaction costs EUR n/a n/a (11,755) -Finance lease liabilities (note 21) Various Various Various 16,519 16,519Other financial liabilities A$ n/a 2022 538 538Total secured 667,294 694,244
Unsecured loan from: New R&R Ice Cream Limited (‘Subordinated shareholder loan’) EUR 8.92% 2110 366,113 366,113Total 1,033,407 1,060,357Note 1: Including interest accrual.
RIC-B0237a R&R Annual Report 2015.qxp_Layout 1 02/03/2016 12:21 Page 34
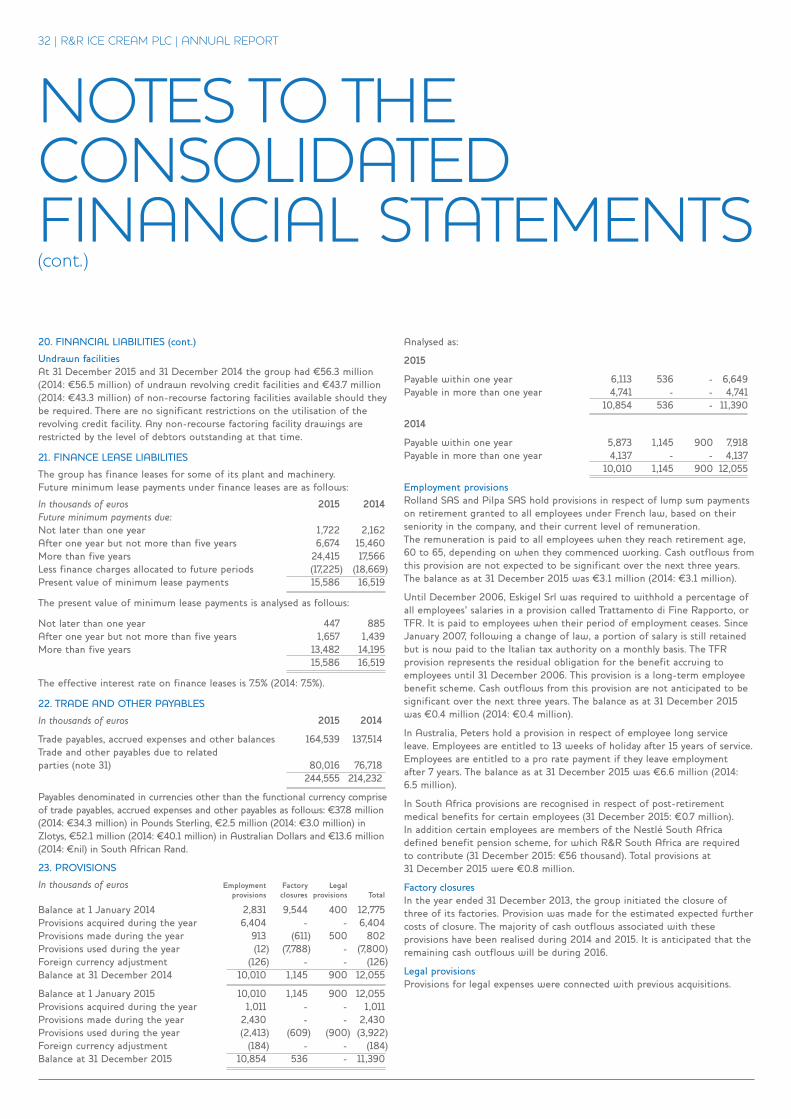
NOTES TO THECONSOLIDATEDFINANCIAL STATEMENTS(cont.)
32 | R&R ICE CREAM PLC | ANNUAL REPORT
20. FINANCIAL LIABILITIES (cont.)
Undrawn facilitiesAt 31 December 2015 and 31 December 2014 the group had ¤56.3 million(2014: ¤56.5 million) of undrawn revolving credit facilities and ¤43.7 million(2014: ¤43.3 million) of non-recourse factoring facilities available should theybe required. There are no significant restrictions on the utilisation of therevolving credit facility. Any non-recourse factoring facility drawings arerestricted by the level of debtors outstanding at that time.
21. FINANCE LEASE LIABILITIES
The group has finance leases for some of its plant and machinery.Future minimum lease payments under finance leases are as follows:
In thousands of euros 2015 2014Future minimum payments due: Not later than one year 1,722 2,162After one year but not more than five years 6,674 15,460More than five years 24,415 17,566Less finance charges allocated to future periods (17,225) (18,669)Present value of minimum lease payments 15,586 16,519
The present value of minimum lease payments is analysed as follows:
Not later than one year 447 885After one year but not more than five years 1,657 1,439More than five years 13,482 14,195 15,586 16,519
The effective interest rate on finance leases is 7.5% (2014: 7.5%).
22. TRADE AND OTHER PAYABLES
In thousands of euros 2015 2014
Trade payables, accrued expenses and other balances 164,539 137,514Trade and other payables due to relatedparties (note 31) 80,016 76,718 244,555 214,232
Payables denominated in currencies other than the functional currency compriseof trade payables, accrued expenses and other payables as follows: ¤37.8 million(2014: ¤34.3 million) in Pounds Sterling, ¤2.5 million (2014: ¤3.0 million) inZlotys, ¤52.1 million (2014: ¤40.1 million) in Australian Dollars and ¤13.6 million(2014: ¤nil) in South African Rand.
23. PROVISIONS
In thousands of euros Employment Factory Legal provisions closures provisions Total
Balance at 1 January 2014 2,831 9,544 400 12,775Provisions acquired during the year 6,404 - - 6,404Provisions made during the year 913 (611) 500 802Provisions used during the year (12) (7,788) - (7,800)Foreign currency adjustment (126) - - (126)Balance at 31 December 2014 10,010 1,145 900 12,055
Balance at 1 January 2015 10,010 1,145 900 12,055Provisions acquired during the year 1,011 - - 1,011Provisions made during the year 2,430 - - 2,430Provisions used during the year (2,413) (609) (900) (3,922)Foreign currency adjustment (184) - - (184)Balance at 31 December 2015 10,854 536 - 11,390
Analysed as:
2015
Payable within one year 6,113 536 - 6,649Payable in more than one year 4,741 - - 4,741 10,854 536 - 11,390
2014
Payable within one year 5,873 1,145 900 7,918Payable in more than one year 4,137 - - 4,137 10,010 1,145 900 12,055
Employment provisions Rolland SAS and Pilpa SAS hold provisions in respect of lump sum paymentson retirement granted to all employees under French law, based on theirseniority in the company, and their current level of remuneration.The remuneration is paid to all employees when they reach retirement age,60 to 65, depending on when they commenced working. Cash outflows fromthis provision are not expected to be significant over the next three years.The balance as at 31 December 2015 was ¤3.1 million (2014: ¤3.1 million).
Until December 2006, Eskigel Srl was required to withhold a percentage ofall employees’ salaries in a provision called Trattamento di Fine Rapporto, orTFR. It is paid to employees when their period of employment ceases. SinceJanuary 2007, following a change of law, a portion of salary is still retainedbut is now paid to the Italian tax authority on a monthly basis. The TFRprovision represents the residual obligation for the benefit accruing toemployees until 31 December 2006. This provision is a long-term employeebenefit scheme. Cash outflows from this provision are not anticipated to besignificant over the next three years. The balance as at 31 December 2015was ¤0.4 million (2014: ¤0.4 million).
In Australia, Peters hold a provision in respect of employee long serviceleave. Employees are entitled to 13 weeks of holiday after 15 years of service.Employees are entitled to a pro rate payment if they leave employmentafter 7 years. The balance as at 31 December 2015 was ¤6.6 million (2014:6.5 million).
In South Africa provisions are recognised in respect of post-retirementmedical benefits for certain employees (31 December 2015: ¤0.7 million).In addition certain employees are members of the Nestlé South Africadefined benefit pension scheme, for which R&R South Africa are requiredto contribute (31 December 2015: ¤56 thousand). Total provisions at31 December 2015 were ¤0.8 million.
Factory closuresIn the year ended 31 December 2013, the group initiated the closure ofthree of its factories. Provision was made for the estimated expected furthercosts of closure. The majority of cash outflows associated with theseprovisions have been realised during 2014 and 2015. It is anticipated that theremaining cash outflows will be during 2016.
Legal provisionsProvisions for legal expenses were connected with previous acquisitions.
RIC-B0237a R&R Annual Report 2015.qxp_Layout 1 02/03/2016 12:22 Page 35
R&R ICE CREAM PLC | ANNUAL REPORT | 33
24. FINANCIAL INSTRUMENTS The group’s financial assets comprise cash at bank, trade receivables and otherreceivables. The group’s financial liabilities comprise bank and otherborrowings, financial lease obligations and other payables.
Exposure to credit, interest rate and currency risks arises in the normal courseof the group’s business. Derivatives are used to manage exposure tofluctuations in exchange rates.
Credit riskManagement has a credit policy in place and the exposure to credit risk ismonitored on an ongoing basis. Credit evaluations are performed on allcustomers requiring credit over a certain amount. The group does not requirecollateral in respect of financial assets.
At the reporting date there were no significant concentrations of credit risk.The maximum exposure to credit risk is represented by the carrying amountof each financial asset, including derivatives in the balance sheet.
Interest rate riskThe majority of the group’s debt is fixed coupon which means that there is nosignificant exposure to interest rates. Short-term borrowings are used to fundthe business through its peak working capital requirement. Such loans areborrowed at floating interest rates. The exposure on such borrowings is notconsidered significant. Short-term receivables and payables are not exposed tointerest rate risk.
Cash at bank earns interest at floating rates based on market rates.
Foreign currency riskThe group is exposed to foreign currency risk on sales, purchases andborrowings that are denominated in a currency other than the respectivefunctional currencies of group entities. The currencies giving rise to theserisks are primarily Pounds Sterling (GBP), Australian Dollars (A$), Polish Zlotyand South African Rand (ZAR).
At 31 December 2015 and 31 December 2014 the key risk is the group’sborrowings in foreign currency, being the GBP £315.0 million and A$ 152.0million senior secured loan notes. These notes are held in the balance sheetof R&R Ice Cream plc which has a EUR reporting and functional currency.The group’s strategy is that these foreign currency borrowings better matchthe generation of cash flow in the group. In respect of the GBP denominatedloan notes it is expected that they will be largely serviced by the cashgeneration of the group’s UK trading business. Likewise the A$ denominatedloan notes are expected to be serviced by the cash generation of the group’sAustralian business.
The UK and Australian businesses also typically use contracts to mitigateforeign currency exposure on trading. At the 2015 year end, there were 36such contracts outstanding (2014: eleven). The Directors believe that theforeign exchange exposure in this regard does not present a material risk.The net fair value of these contracts at 31 December 2015 was an asset of¤0.4 million (2014: liability of ¤0.4 million).
A movement of +/- 10% in the GBP: EUR exchange rate, with all othervariables held constant would result in a ¤15.5 million (2014: ¤19.5 million)movement in the group’s results and a ¤19.4 million (2014: ¤21.9 million)movement in the group’s equity. A movement of +/- 10% in the A$: EURexchange rate, with all other variables held constant would result in a ¤2.5million (2014: 1.1 million) movement in the group’s results and a ¤3.5 million(2014: ¤1.9 million) movement in the group’s equity.
94% of the UK business’s forecast 2016 Euro trading requirement is hedged(2014: 95% of the UK business’s 2015 Euro trading requirement). 97% of theAustralian business’s forecast Euro trading requirement up to 30 June 2016 ishedged (2014: 65% up to 30 June 2015), with 56% hedged beyond that dateas at 31 December 2015 (2014: nil% up to 31 December 2015), with an overallhedged position of 73% of the Euro requirement to 31 December 2016.
Capital managementOne of the group’s objectives is to safeguard its ability to continue as a goingconcern providing returns to shareholders, through the optimisation of thedebt and equity balance, and to maintain a strong credit rating and headroom.The group manages its capital structure and makes appropriate decisions inlight of the current economic conditions and strategic objectives of the group.
The group’s capital comprises equity and long-term debt. The equity comprisesfully paid up ordinary shares and the long-term debt comprises subordinatedshareholder loans, the senior secured notes and finance leases. Intra-yearfunding requirements are managed through cash, revolving credit facilities andfactoring facilities.
The refinancing in 2014 allowed the group to better match EBITDA and cashflows to its borrowings and debt service obligations, in particular to provide anatural hedge in respect of potential foreign exchange movements.
The group’s policy is to budget sufficient headroom in order to maintaincompliance with the covenant set out in the revolving credit facilityagreement such that any unforeseen circumstances are unlikely to result in abreach of that covenant. Throughout the year, the group has comfortablycomplied with this policy.
There has been no change in the objectives, policies or processes in respect ofcapital management during the years ended 31 December 2015 and 31December 2014.
RIC-B0237a R&R Annual Report 2015.qxp_Layout 1 02/03/2016 12:22 Page 36
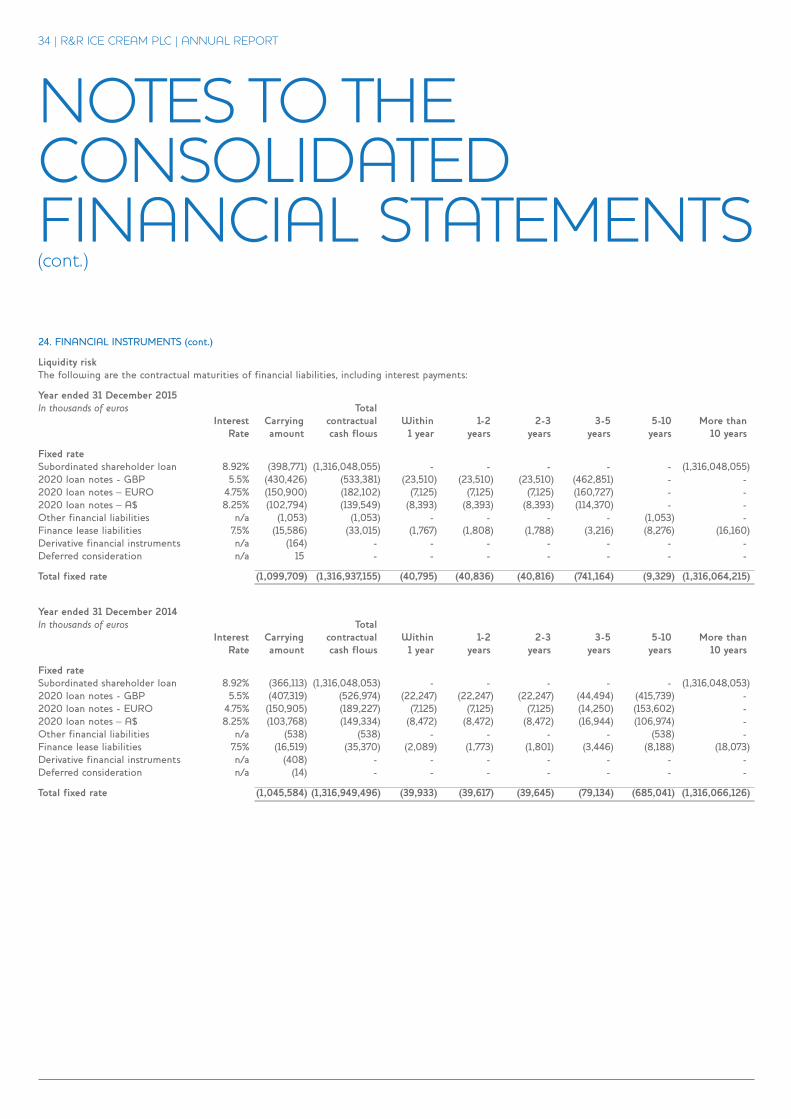
NOTES TO THECONSOLIDATEDFINANCIAL STATEMENTS(cont.)
34 | R&R ICE CREAM PLC | ANNUAL REPORT
24. FINANCIAL INSTRUMENTS (cont.)
Liquidity riskThe following are the contractual maturities of financial liabilities, including interest payments:
Year ended 31 December 2015In thousands of euros Total Interest Carrying contractual Within 1-2 2-3 3-5 5-10 More than Rate amount cash flows 1 year years years years years 10 years
Fixed rate Subordinated shareholder loan 8.92% (398,771) (1,316,048,055) - - - - - (1,316,048,055)2020 loan notes - GBP 5.5% (430,426) (533,381) (23,510) (23,510) (23,510) (462,851) - -2020 loan notes – EURO 4.75% (150,900) (182,102) (7,125) (7,125) (7,125) (160,727) - -2020 loan notes – A$ 8.25% (102,794) (139,549) (8,393) (8,393) (8,393) (114,370) - -Other financial liabilities n/a (1,053) (1,053) - - - - (1,053) -Finance lease liabilities 7.5% (15,586) (33,015) (1,767) (1,808) (1,788) (3,216) (8,276) (16,160)Derivative financial instruments n/a (164) - - - - - - -Deferred consideration n/a 15 - - - - - - -
Total fixed rate (1,099,709) (1,316,937,155) (40,795) (40,836) (40,816) (741,164) (9,329) (1,316,064,215)
Year ended 31 December 2014In thousands of euros Total Interest Carrying contractual Within 1-2 2-3 3-5 5-10 More than Rate amount cash flows 1 year years years years years 10 years
Fixed rate Subordinated shareholder loan 8.92% (366,113) (1,316,048,053) - - - - - (1,316,048,053)2020 loan notes - GBP 5.5% (407,319) (526,974) (22,247) (22,247) (22,247) (44,494) (415,739) -2020 loan notes - EURO 4.75% (150,905) (189,227) (7,125) (7,125) (7,125) (14,250) (153,602) -2020 loan notes – A$ 8.25% (103,768) (149,334) (8,472) (8,472) (8,472) (16,944) (106,974) -Other financial liabilities n/a (538) (538) - - - - (538) -Finance lease liabilities 7.5% (16,519) (35,370) (2,089) (1,773) (1,801) (3,446) (8,188) (18,073)Derivative financial instruments n/a (408) - - - - - - -Deferred consideration n/a (14) - - - - - - -
Total fixed rate (1,045,584) (1,316,949,496) (39,933) (39,617) (39,645) (79,134) (685,041) (1,316,066,126)
RIC-B0237a R&R Annual Report 2015.qxp_Layout 1 02/03/2016 12:22 Page 37
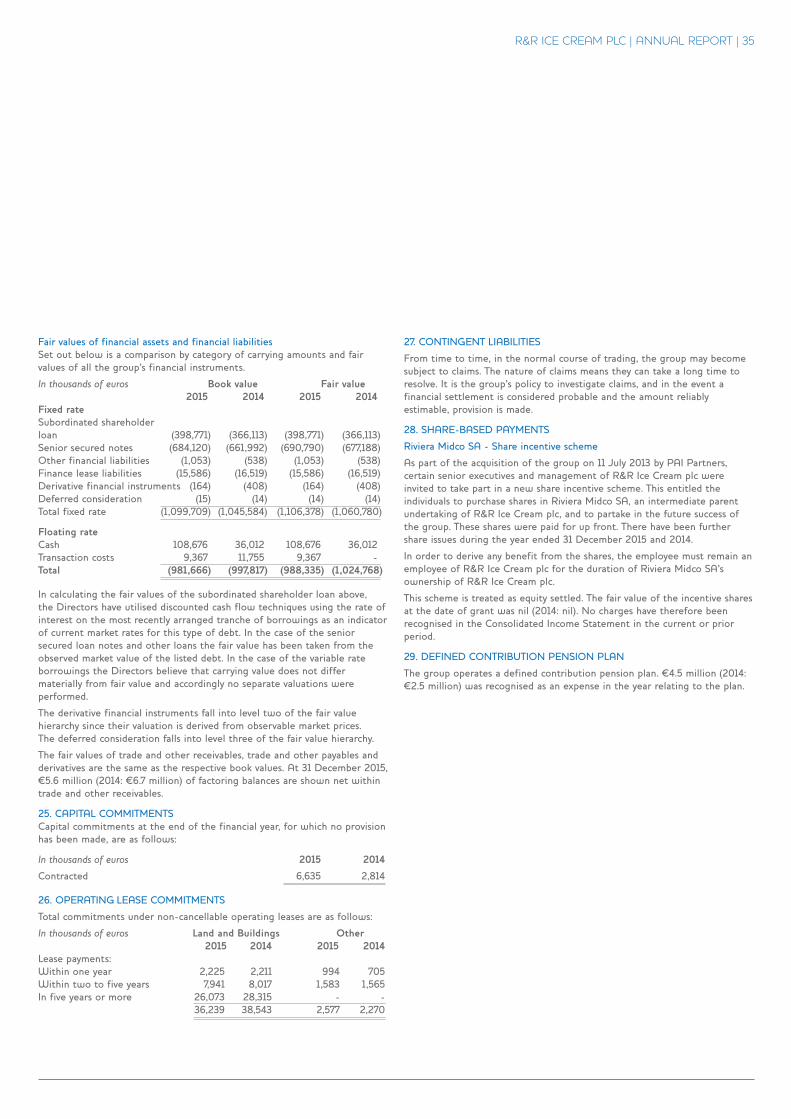
R&R ICE CREAM PLC | ANNUAL REPORT | 35
Fair values of financial assets and financial liabilitiesSet out below is a comparison by category of carrying amounts and fairvalues of all the group’s financial instruments.
In thousands of euros Book value Fair value 2015 2014 2015 2014Fixed rate Subordinated shareholder loan (398,771) (366,113) (398,771) (366,113)Senior secured notes (684,120) (661,992) (690,790) (677,188)Other financial liabilities (1,053) (538) (1,053) (538)Finance lease liabilities (15,586) (16,519) (15,586) (16,519)Derivative financial instruments (164) (408) (164) (408)Deferred consideration (15) (14) (14) (14)Total fixed rate (1,099,709) (1,045,584) (1,106,378) (1,060,780)
Floating rate Cash 108,676 36,012 108,676 36,012Transaction costs 9,367 11,755 9,367 -Total (981,666) (997,817) (988,335) (1,024,768)
In calculating the fair values of the subordinated shareholder loan above,the Directors have utilised discounted cash flow techniques using the rate ofinterest on the most recently arranged tranche of borrowings as an indicatorof current market rates for this type of debt. In the case of the seniorsecured loan notes and other loans the fair value has been taken from theobserved market value of the listed debt. In the case of the variable rateborrowings the Directors believe that carrying value does not differmaterially from fair value and accordingly no separate valuations wereperformed.
The derivative financial instruments fall into level two of the fair valuehierarchy since their valuation is derived from observable market prices.The deferred consideration falls into level three of the fair value hierarchy.
The fair values of trade and other receivables, trade and other payables andderivatives are the same as the respective book values. At 31 December 2015,¤5.6 million (2014: ¤6.7 million) of factoring balances are shown net withintrade and other receivables.
25. CAPITAL COMMITMENTSCapital commitments at the end of the financial year, for which no provisionhas been made, are as follows:
In thousands of euros 2015 2014
Contracted 6,635 2,814
26. OPERATING LEASE COMMITMENTS
Total commitments under non-cancellable operating leases are as follows:
In thousands of euros Land and Buildings Other 2015 2014 2015 2014Lease payments: Within one year 2,225 2,211 994 705Within two to five years 7,941 8,017 1,583 1,565In five years or more 26,073 28,315 - - 36,239 38,543 2,577 2,270
27. CONTINGENT LIABILITIES
From time to time, in the normal course of trading, the group may becomesubject to claims. The nature of claims means they can take a long time toresolve. It is the group’s policy to investigate claims, and in the event afinancial settlement is considered probable and the amount reliablyestimable, provision is made.
28. SHARE-BASED PAYMENTS
Riviera Midco SA - Share incentive scheme
As part of the acquisition of the group on 11 July 2013 by PAI Partners,certain senior executives and management of R&R Ice Cream plc wereinvited to take part in a new share incentive scheme. This entitled theindividuals to purchase shares in Riviera Midco SA, an intermediate parentundertaking of R&R Ice Cream plc, and to partake in the future success ofthe group. These shares were paid for up front. There have been furthershare issues during the year ended 31 December 2015 and 2014.
In order to derive any benefit from the shares, the employee must remain anemployee of R&R Ice Cream plc for the duration of Riviera Midco SA’sownership of R&R Ice Cream plc.
This scheme is treated as equity settled. The fair value of the incentive sharesat the date of grant was nil (2014: nil). No charges have therefore beenrecognised in the Consolidated Income Statement in the current or priorperiod.
29. DEFINED CONTRIBUTION PENSION PLAN
The group operates a defined contribution pension plan. ¤4.5 million (2014:¤2.5 million) was recognised as an expense in the year relating to the plan.
RIC-B0237a R&R Annual Report 2015.qxp_Layout 1 02/03/2016 12:22 Page 38
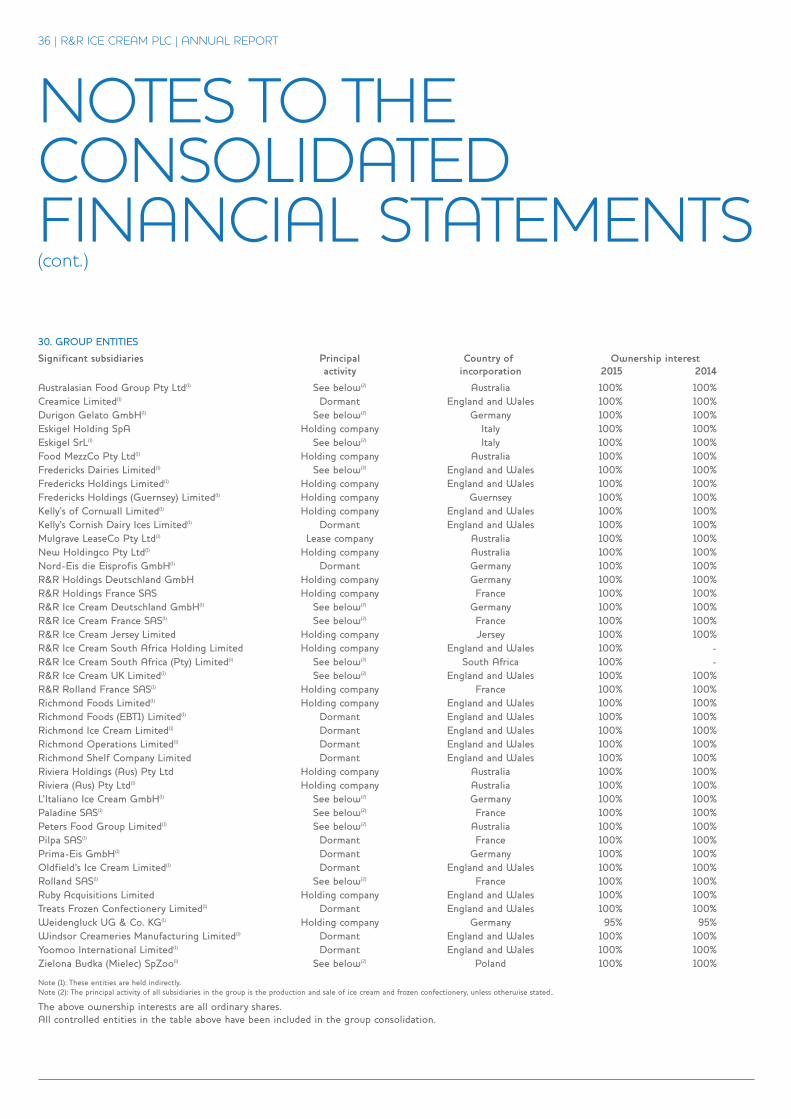
NOTES TO THECONSOLIDATEDFINANCIAL STATEMENTS(cont.)
36 | R&R ICE CREAM PLC | ANNUAL REPORT
30. GROUP ENTITIES
Significant subsidiaries Principal Country of Ownership interest activity incorporation 2015 2014
Australasian Food Group Pty Ltd(1) See below(2) Australia 100% 100%Creamice Limited(1) Dormant England and Wales 100% 100%Durigon Gelato GmbH(1) See below(2) Germany 100% 100%Eskigel Holding SpA Holding company Italy 100% 100%Eskigel SrL(1) See below(2) Italy 100% 100%Food MezzCo Pty Ltd(1) Holding company Australia 100% 100%Fredericks Dairies Limited(1) See below(2) England and Wales 100% 100%Fredericks Holdings Limited(1) Holding company England and Wales 100% 100%Fredericks Holdings (Guernsey) Limited(1) Holding company Guernsey 100% 100%Kelly’s of Cornwall Limited(1) Holding company England and Wales 100% 100%Kelly’s Cornish Dairy Ices Limited(1) Dormant England and Wales 100% 100%Mulgrave LeaseCo Pty Ltd(1) Lease company Australia 100% 100%New Holdingco Pty Ltd(1) Holding company Australia 100% 100%Nord-Eis die Eisprofis GmbH(1) Dormant Germany 100% 100%R&R Holdings Deutschland GmbH Holding company Germany 100% 100%R&R Holdings France SAS Holding company France 100% 100%R&R Ice Cream Deutschland GmbH(1) See below(2) Germany 100% 100%R&R Ice Cream France SAS(1) See below(2) France 100% 100%R&R Ice Cream Jersey Limited Holding company Jersey 100% 100%R&R Ice Cream South Africa Holding Limited Holding company England and Wales 100% -R&R Ice Cream South Africa (Pty) Limited(1) See below(2) South Africa 100% -R&R Ice Cream UK Limited(1) See below(2) England and Wales 100% 100%R&R Rolland France SAS(1) Holding company France 100% 100%Richmond Foods Limited(1) Holding company England and Wales 100% 100%Richmond Foods (EBT1) Limited(1) Dormant England and Wales 100% 100%Richmond Ice Cream Limited(1) Dormant England and Wales 100% 100%Richmond Operations Limited(1) Dormant England and Wales 100% 100%Richmond Shelf Company Limited Dormant England and Wales 100% 100%Riviera Holdings (Aus) Pty Ltd Holding company Australia 100% 100%Riviera (Aus) Pty Ltd(1) Holding company Australia 100% 100%L’Italiano Ice Cream GmbH(1) See below(2) Germany 100% 100%Paladine SAS(1) See below(2) France 100% 100%Peters Food Group Limited(1) See below(2) Australia 100% 100%Pilpa SAS(1) Dormant France 100% 100%Prima-Eis GmbH(1) Dormant Germany 100% 100%Oldfield’s Ice Cream Limited(1) Dormant England and Wales 100% 100%Rolland SAS(1) See below(2) France 100% 100%Ruby Acquisitions Limited Holding company England and Wales 100% 100%Treats Frozen Confectionery Limited(1) Dormant England and Wales 100% 100%Weidengluck UG & Co. KG(1) Holding company Germany 95% 95%Windsor Creameries Manufacturing Limited(1) Dormant England and Wales 100% 100%Yoomoo International Limited(1) Dormant England and Wales 100% 100%Zielona Budka (Mielec) SpZoo(1) See below(2) Poland 100% 100%
Note (1): These entities are held indirectly.Note (2): The principal activity of all subsidiaries in the group is the production and sale of ice cream and frozen confectionery, unless otherwise stated..
The above ownership interests are all ordinary shares.All controlled entities in the table above have been included in the group consolidation.
RIC-B0237a R&R Annual Report 2015.qxp_Layout 1 02/03/2016 12:22 Page 39
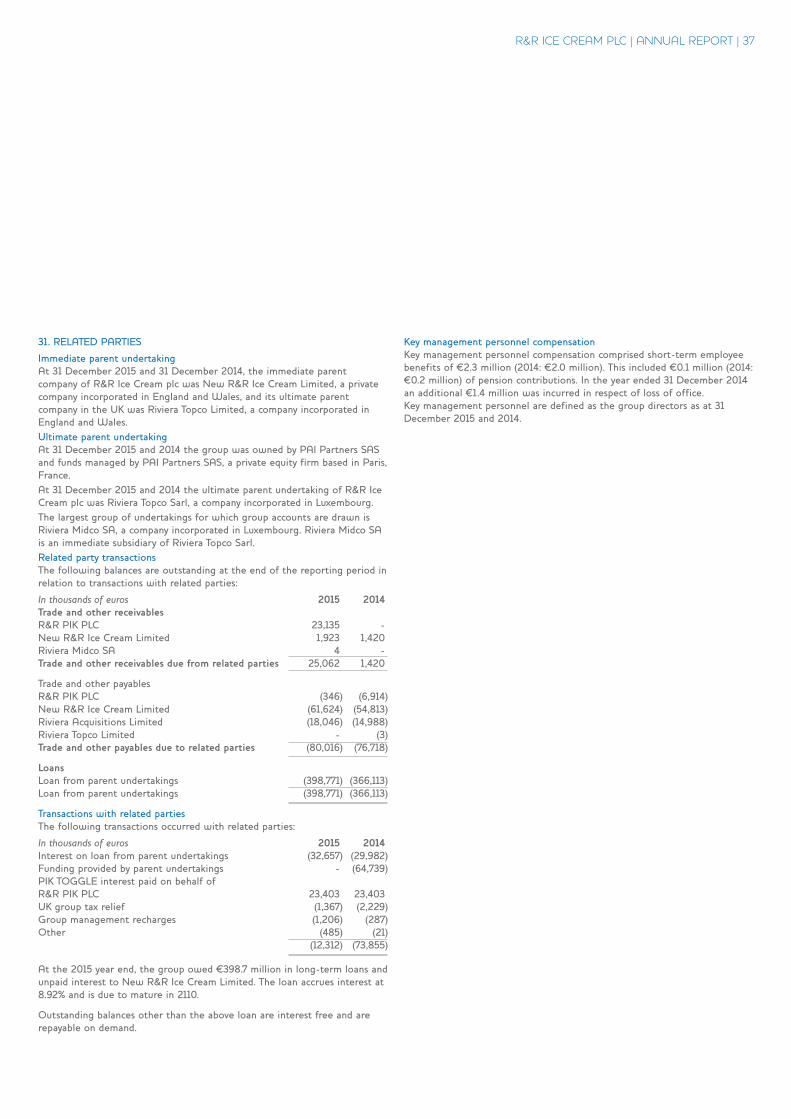
31. RELATED PARTIES
Immediate parent undertaking At 31 December 2015 and 31 December 2014, the immediate parentcompany of R&R Ice Cream plc was New R&R Ice Cream Limited, a privatecompany incorporated in England and Wales, and its ultimate parentcompany in the UK was Riviera Topco Limited, a company incorporated inEngland and Wales. Ultimate parent undertaking At 31 December 2015 and 2014 the group was owned by PAI Partners SASand funds managed by PAI Partners SAS, a private equity firm based in Paris,France.At 31 December 2015 and 2014 the ultimate parent undertaking of R&R IceCream plc was Riviera Topco Sarl, a company incorporated in Luxembourg.The largest group of undertakings for which group accounts are drawn isRiviera Midco SA, a company incorporated in Luxembourg. Riviera Midco SAis an immediate subsidiary of Riviera Topco Sarl.Related party transactionsThe following balances are outstanding at the end of the reporting period inrelation to transactions with related parties:
In thousands of euros 2015 2014Trade and other receivables R&R PIK PLC 23,135 -New R&R Ice Cream Limited 1,923 1,420Riviera Midco SA 4 -Trade and other receivables due from related parties 25,062 1,420
Trade and other payablesR&R PIK PLC (346) (6,914)New R&R Ice Cream Limited (61,624) (54,813)Riviera Acquisitions Limited (18,046) (14,988)Riviera Topco Limited - (3)Trade and other payables due to related parties (80,016) (76,718)
Loans Loan from parent undertakings (398,771) (366,113)Loan from parent undertakings (398,771) (366,113)
Transactions with related partiesThe following transactions occurred with related parties:
In thousands of euros 2015 2014Interest on loan from parent undertakings (32,657) (29,982)Funding provided by parent undertakings - (64,739)PIK TOGGLE interest paid on behalf ofR&R PIK PLC 23,403 23,403UK group tax relief (1,367) (2,229)Group management recharges (1,206) (287)Other (485) (21) (12,312) (73,855)
At the 2015 year end, the group owed ¤398.7 million in long-term loans andunpaid interest to New R&R Ice Cream Limited. The loan accrues interest at8.92% and is due to mature in 2110.
Outstanding balances other than the above loan are interest free and arerepayable on demand.
Key management personnel compensation Key management personnel compensation comprised short-term employeebenefits of ¤2.3 million (2014: ¤2.0 million). This included ¤0.1 million (2014:¤0.2 million) of pension contributions. In the year ended 31 December 2014an additional ¤1.4 million was incurred in respect of loss of office.Key management personnel are defined as the group directors as at 31December 2015 and 2014.
R&R ICE CREAM PLC | ANNUAL REPORT | 37
RIC-B0237a R&R Annual Report 2015.qxp_Layout 1 02/03/2016 12:22 Page 40

COMPANY ONLY ACCOUNTS31 DECEMBER 2015
RIC-B0237a R&R Annual Report 2015.qxp_Layout 1 02/03/2016 12:22 Page 41
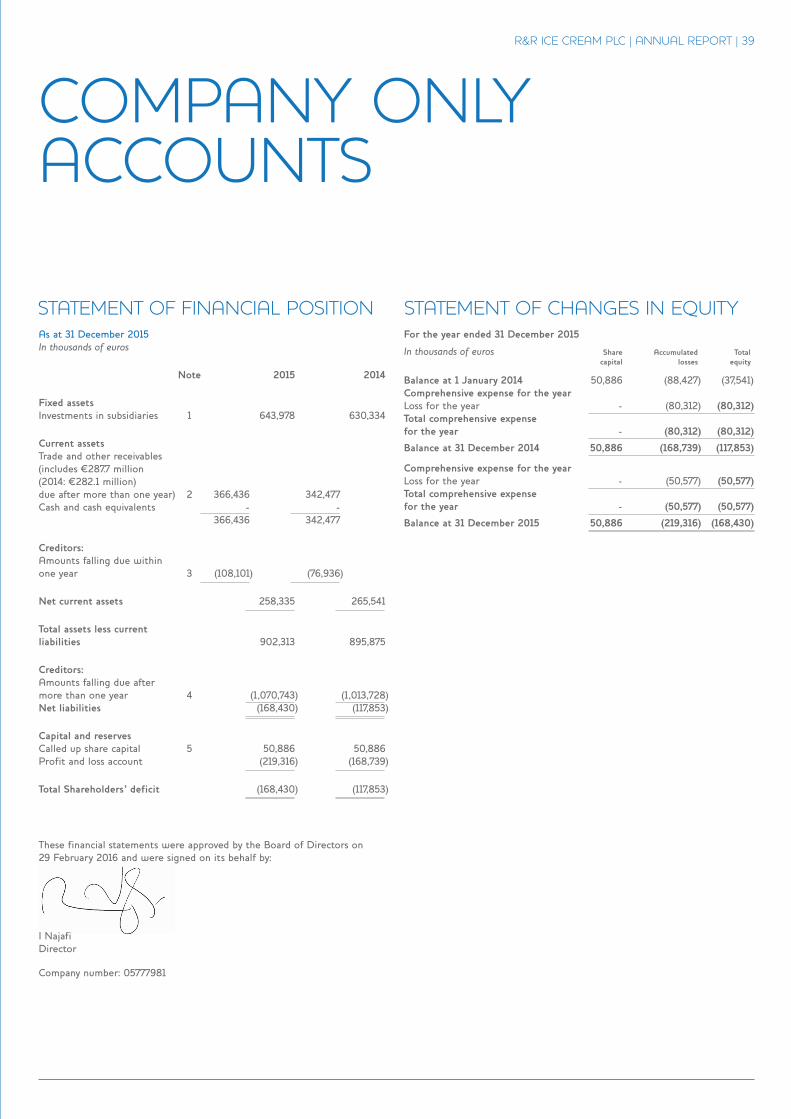
As at 31 December 2015In thousands of euros
Note 2015 2014
Fixed assets Investments in subsidiaries 1 643,978 630,334
Current assets Trade and other receivables(includes ¤287.7 million(2014: ¤282.1 million)due after more than one year) 2 366,436 342,477Cash and cash equivalents - - 366,436 342,477
Creditors:Amounts falling due withinone year 3 (108,101) (76,936)
Net current assets 258,335 265,541
Total assets less currentliabilities 902,313 895,875
Creditors:Amounts falling due after more than one year 4 (1,070,743) (1,013,728)Net liabilities (168,430) (117,853)
Capital and reservesCalled up share capital 5 50,886 50,886Profit and loss account (219,316) (168,739)
Total Shareholders’ deficit (168,430) (117,853)
These financial statements were approved by the Board of Directors on 29 February 2016 and were signed on its behalf by:
I NajafiDirector
Company number: 05777981
STATEMENT OF FINANCIAL POSITIONFor the year ended 31 December 2015
In thousands of euros Share Accumulated Total capital losses equity
Balance at 1 January 2014 50,886 (88,427) (37,541)Comprehensive expense for the yearLoss for the year - (80,312) (80,312)Total comprehensive expensefor the year - (80,312) (80,312)
Balance at 31 December 2014 50,886 (168,739) (117,853)
Comprehensive expense for the yearLoss for the year - (50,577) (50,577)Total comprehensive expensefor the year - (50,577) (50,577)
Balance at 31 December 2015 50,886 (219,316) (168,430)
STATEMENT OF CHANGES IN EQUITY
COMPANY ONLYACCOUNTS
R&R ICE CREAM PLC | ANNUAL REPORT | 39
RIC-B0237a R&R Annual Report 2015.qxp_Layout 1 02/03/2016 12:22 Page 42
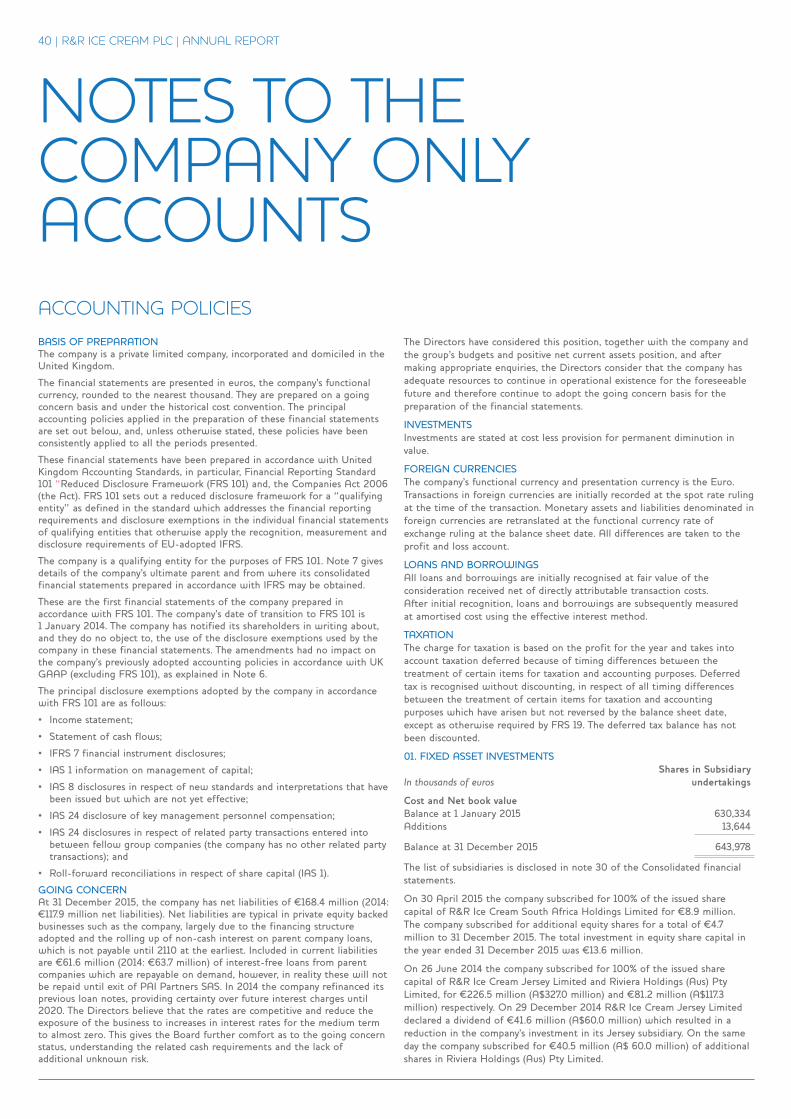
40 | R&R ICE CREAM PLC | ANNUAL REPORT
NOTES TO THECOMPANY ONLYACCOUNTS
BASIS OF PREPARATIONThe company is a private limited company, incorporated and domiciled in theUnited Kingdom.
The financial statements are presented in euros, the company’s functionalcurrency, rounded to the nearest thousand. They are prepared on a goingconcern basis and under the historical cost convention. The principalaccounting policies applied in the preparation of these financial statementsare set out below, and, unless otherwise stated, these policies have beenconsistently applied to all the periods presented.
These financial statements have been prepared in accordance with UnitedKingdom Accounting Standards, in particular, Financial Reporting Standard101 “Reduced Disclosure Framework (FRS 101) and, the Companies Act 2006(the Act). FRS 101 sets out a reduced disclosure framework for a “qualifyingentity” as defined in the standard which addresses the financial reportingrequirements and disclosure exemptions in the individual financial statementsof qualifying entities that otherwise apply the recognition, measurement anddisclosure requirements of EU-adopted IFRS.
The company is a qualifying entity for the purposes of FRS 101. Note 7 givesdetails of the company’s ultimate parent and from where its consolidatedfinancial statements prepared in accordance with IFRS may be obtained.
These are the first financial statements of the company prepared inaccordance with FRS 101. The company’s date of transition to FRS 101 is1 January 2014. The company has notified its shareholders in writing about,and they do no object to, the use of the disclosure exemptions used by thecompany in these financial statements. The amendments had no impact onthe company’s previously adopted accounting policies in accordance with UKGAAP (excluding FRS 101), as explained in Note 6.
The principal disclosure exemptions adopted by the company in accordancewith FRS 101 are as follows:
• Income statement;
• Statement of cash flows;
• IFRS 7 financial instrument disclosures;
• IAS 1 information on management of capital;
• IAS 8 disclosures in respect of new standards and interpretations that havebeen issued but which are not yet effective;
• IAS 24 disclosure of key management personnel compensation;
• IAS 24 disclosures in respect of related party transactions entered intobetween fellow group companies (the company has no other related partytransactions); and
• Roll-forward reconciliations in respect of share capital (IAS 1).
GOING CONCERNAt 31 December 2015, the company has net liabilities of ¤168.4 million (2014:¤117.9 million net liabilities). Net liabilities are typical in private equity backedbusinesses such as the company, largely due to the financing structureadopted and the rolling up of non-cash interest on parent company loans,which is not payable until 2110 at the earliest. Included in current liabilitiesare ¤61.6 million (2014: ¤63.7 million) of interest-free loans from parentcompanies which are repayable on demand, however, in reality these will notbe repaid until exit of PAI Partners SAS. In 2014 the company refinanced itsprevious loan notes, providing certainty over future interest charges until2020. The Directors believe that the rates are competitive and reduce theexposure of the business to increases in interest rates for the medium termto almost zero. This gives the Board further comfort as to the going concernstatus, understanding the related cash requirements and the lack ofadditional unknown risk.
The Directors have considered this position, together with the company andthe group’s budgets and positive net current assets position, and aftermaking appropriate enquiries, the Directors consider that the company hasadequate resources to continue in operational existence for the foreseeablefuture and therefore continue to adopt the going concern basis for thepreparation of the financial statements.
INVESTMENTSInvestments are stated at cost less provision for permanent diminution invalue.
FOREIGN CURRENCIESThe company’s functional currency and presentation currency is the Euro.Transactions in foreign currencies are initially recorded at the spot rate rulingat the time of the transaction. Monetary assets and liabilities denominated inforeign currencies are retranslated at the functional currency rate ofexchange ruling at the balance sheet date. All differences are taken to theprofit and loss account.
LOANS AND BORROWINGSAll loans and borrowings are initially recognised at fair value of theconsideration received net of directly attributable transaction costs.After initial recognition, loans and borrowings are subsequently measuredat amortised cost using the effective interest method.
TAXATIONThe charge for taxation is based on the profit for the year and takes intoaccount taxation deferred because of timing differences between thetreatment of certain items for taxation and accounting purposes. Deferredtax is recognised without discounting, in respect of all timing differencesbetween the treatment of certain items for taxation and accountingpurposes which have arisen but not reversed by the balance sheet date,except as otherwise required by FRS 19. The deferred tax balance has notbeen discounted.
01. FIXED ASSET INVESTMENTS Shares in SubsidiaryIn thousands of euros undertakings
Cost and Net book valueBalance at 1 January 2015 630,334Additions 13,644
Balance at 31 December 2015 643,978
The list of subsidiaries is disclosed in note 30 of the Consolidated financialstatements.
On 30 April 2015 the company subscribed for 100% of the issued sharecapital of R&R Ice Cream South Africa Holdings Limited for ¤8.9 million.The company subscribed for additional equity shares for a total of ¤4.7million to 31 December 2015. The total investment in equity share capital inthe year ended 31 December 2015 was ¤13.6 million.
On 26 June 2014 the company subscribed for 100% of the issued sharecapital of R&R Ice Cream Jersey Limited and Riviera Holdings (Aus) PtyLimited, for ¤226.5 million (A$327.0 million) and ¤81.2 million (A$117.3million) respectively. On 29 December 2014 R&R Ice Cream Jersey Limiteddeclared a dividend of ¤41.6 million (A$60.0 million) which resulted in areduction in the company’s investment in its Jersey subsidiary. On the sameday the company subscribed for ¤40.5 million (A$ 60.0 million) of additionalshares in Riviera Holdings (Aus) Pty Limited.
ACCOUNTING POLICIES
RIC-B0237a R&R Annual Report 2015.qxp_Layout 1 02/03/2016 12:22 Page 43
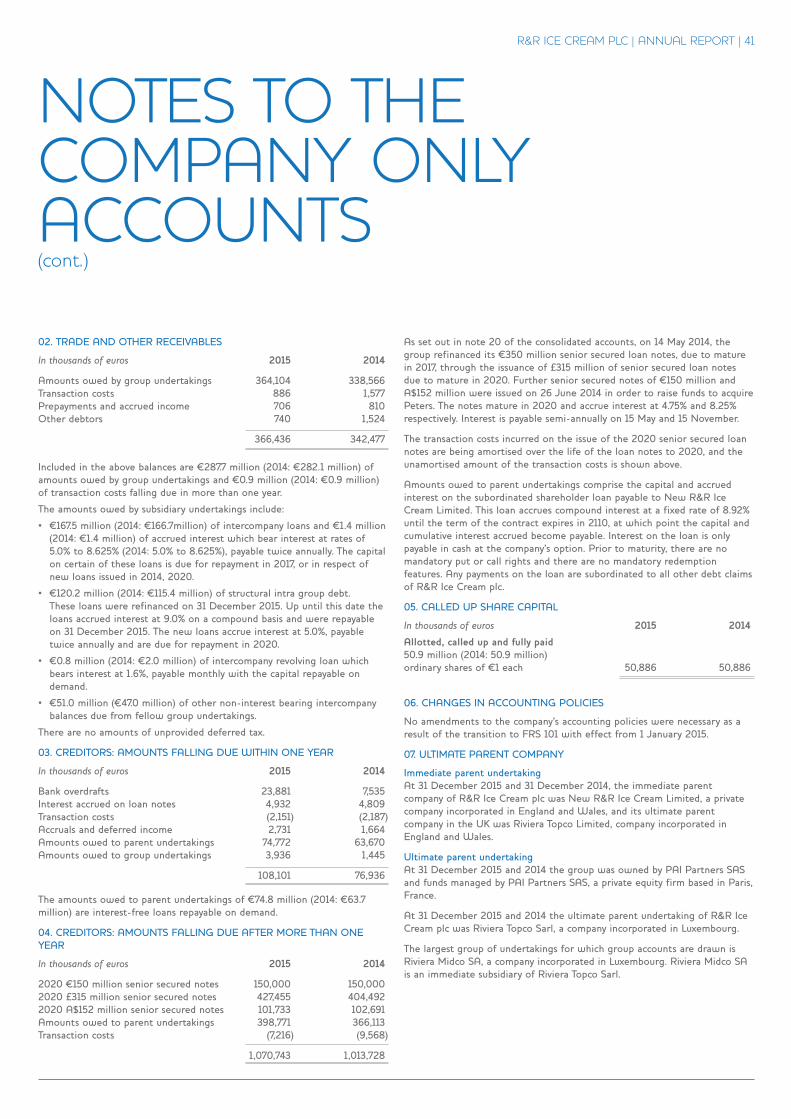
NOTES TO THECOMPANY ONLYACCOUNTS(cont.)
02. TRADE AND OTHER RECEIVABLES
In thousands of euros 2015 2014
Amounts owed by group undertakings 364,104 338,566Transaction costs 886 1,577Prepayments and accrued income 706 810Other debtors 740 1,524
366,436 342,477
Included in the above balances are ¤287.7 million (2014: ¤282.1 million) ofamounts owed by group undertakings and ¤0.9 million (2014: ¤0.9 million)of transaction costs falling due in more than one year.
The amounts owed by subsidiary undertakings include:
• ¤167.5 million (2014: ¤166.7million) of intercompany loans and ¤1.4 million(2014: ¤1.4 million) of accrued interest which bear interest at rates of5.0% to 8.625% (2014: 5.0% to 8.625%), payable twice annually. The capitalon certain of these loans is due for repayment in 2017, or in respect ofnew loans issued in 2014, 2020.
• ¤120.2 million (2014: ¤115.4 million) of structural intra group debt.These loans were refinanced on 31 December 2015. Up until this date theloans accrued interest at 9.0% on a compound basis and were repayableon 31 December 2015. The new loans accrue interest at 5.0%, payabletwice annually and are due for repayment in 2020.
• ¤0.8 million (2014: ¤2.0 million) of intercompany revolving loan whichbears interest at 1.6%, payable monthly with the capital repayable ondemand.
• ¤51.0 million (¤47.0 million) of other non-interest bearing intercompanybalances due from fellow group undertakings.
There are no amounts of unprovided deferred tax.
03. CREDITORS: AMOUNTS FALLING DUE WITHIN ONE YEAR
In thousands of euros 2015 2014
Bank overdrafts 23,881 7,535Interest accrued on loan notes 4,932 4,809Transaction costs (2,151) (2,187)Accruals and deferred income 2,731 1,664Amounts owed to parent undertakings 74,772 63,670Amounts owed to group undertakings 3,936 1,445
108,101 76,936
The amounts owed to parent undertakings of ¤74.8 million (2014: ¤63.7million) are interest-free loans repayable on demand.
04. CREDITORS: AMOUNTS FALLING DUE AFTER MORE THAN ONEYEAR
In thousands of euros 2015 2014
2020 ¤150 million senior secured notes 150,000 150,0002020 £315 million senior secured notes 427,455 404,4922020 A$152 million senior secured notes 101,733 102,691Amounts owed to parent undertakings 398,771 366,113Transaction costs (7,216) (9,568)
1,070,743 1,013,728
As set out in note 20 of the consolidated accounts, on 14 May 2014, thegroup refinanced its ¤350 million senior secured loan notes, due to maturein 2017, through the issuance of £315 million of senior secured loan notesdue to mature in 2020. Further senior secured notes of ¤150 million andA$152 million were issued on 26 June 2014 in order to raise funds to acquirePeters. The notes mature in 2020 and accrue interest at 4.75% and 8.25%respectively. Interest is payable semi-annually on 15 May and 15 November.
The transaction costs incurred on the issue of the 2020 senior secured loannotes are being amortised over the life of the loan notes to 2020, and theunamortised amount of the transaction costs is shown above.
Amounts owed to parent undertakings comprise the capital and accruedinterest on the subordinated shareholder loan payable to New R&R IceCream Limited. This loan accrues compound interest at a fixed rate of 8.92%until the term of the contract expires in 2110, at which point the capital andcumulative interest accrued become payable. Interest on the loan is onlypayable in cash at the company’s option. Prior to maturity, there are nomandatory put or call rights and there are no mandatory redemptionfeatures. Any payments on the loan are subordinated to all other debt claimsof R&R Ice Cream plc.
05. CALLED UP SHARE CAPITAL
In thousands of euros 2015 2014
Allotted, called up and fully paid 50.9 million (2014: 50.9 million) ordinary shares of ¤1 each 50,886 50,886
06. CHANGES IN ACCOUNTING POLICIES
No amendments to the company’s accounting policies were necessary as aresult of the transition to FRS 101 with effect from 1 January 2015.
07. ULTIMATE PARENT COMPANY
Immediate parent undertaking At 31 December 2015 and 31 December 2014, the immediate parentcompany of R&R Ice Cream plc was New R&R Ice Cream Limited, a privatecompany incorporated in England and Wales, and its ultimate parentcompany in the UK was Riviera Topco Limited, company incorporated inEngland and Wales.
Ultimate parent undertakingAt 31 December 2015 and 2014 the group was owned by PAI Partners SASand funds managed by PAI Partners SAS, a private equity firm based in Paris,France.
At 31 December 2015 and 2014 the ultimate parent undertaking of R&R IceCream plc was Riviera Topco Sarl, a company incorporated in Luxembourg.
The largest group of undertakings for which group accounts are drawn isRiviera Midco SA, a company incorporated in Luxembourg. Riviera Midco SAis an immediate subsidiary of Riviera Topco Sarl.
R&R ICE CREAM PLC | ANNUAL REPORT | 41
RIC-B0237a R&R Annual Report 2015.qxp_Layout 1 02/03/2016 12:22 Page 44
UKLeeming BarR&R Ice Cream UK Ltd, Richmond House,Plews Way,Leeming Bar Industrial Estate, Northallerton, North Yorkshire DL7 9UL
Tel: +44 1677 423 397 Fax: +44 1677 428 102
CornwallKelly’s of Cornwall Ltd,Lucknow Road, Walker Lines Estate, Bodmin, Cornwall PL31 1EZ
Tel: +44 1208 77277Fax: +44 1208 78269
SkelmersdaleFredericks Dairies Limited,Unit 2,Prospect Place,Skelmersdale,LancashireWN8 9QD
Tel: +44 1695 713 900Fax: +44 1695 713 901
GERMANYOsnabrückR&R Ice Cream DeutschlandGmbH, Eduard-Pestel Str.15, D-49080 Osnabrück,Germany
Tel: +49 541 9999 - 0 Fax: +49 541 9999 - 200
FRANCEVayresR&R Ice Cream France SAS,Le Labour - B.P. 13, 33870 Vayres, France
Tel: +33 557 55 39 00 Fax: +33 557 55 39 29
PlouédernRolland SAS, Kergamet, 29800 Plouédern, France
Tel: +33 298 20 92 92 Fax: +33 298 20 92 80
Dangé-Saint-RomainPaladine SAS, La Taille du Moulin à vent, 86220 Dangé-Saint-Romain, France
Tel: +33 549 86 38 27Fax: +33 549 86 45 49
ITALYTerniEskigel SrL,Via Augusto Vanzetti,Terni, ItalyTel: +39 0744 612111Fax: +39 0744 304771
POLANDMielecZielona Budka (Mielec) Spzoo,ul. Wojska Polskiego 3, 39-300 Mielec, Poland
Tel: +48 17 788 5501 Fax: +48 17 788 5507
AUSTRALIAMulgravePeters Food Group Ltd,254-294 Wellington Road,Mulgrave, VIC 3170
Tel: +613 9565 7777Fax: +613 9561 6538
SOUTH AFRICAClayvilleR&R South Africa Pty Limited,14 Spanner Road, Clayville,Olifantsfontein 1666
Tel: +27 11 238 8300
RIC-B0237a R&R Annual Report 2015.qxp_Layout 1 02/03/2016 12:21 Page 1