Embed Size (px)
Citation preview

Bond Liquidity and Investment
Laura Casares Fielda, Anahit Mkrtchyanb, Yuan Wangc * aSmeal College of Business, Pennsylvania State University, University Park, PA 16802, USA
bD’Amore-McKim School of Business, Northeastern University, Boston, MA 02115, USA cJohn Molson School of Business, Concordia University, Montreal, QC H3G 1M8, Canada
December 1, 2014
Abstract This paper examines the effect of bond liquidity on investment decisions. We find that firms with higher bond liquidity are more likely to make acquisitions and have higher capital expenditures. We exploit an exogenous shock to bond liquidity – introduction of TRACE, and show that increases in bond liquidity around TRACE implementation expands firms' investment. Our results support the hypothesis that bond liquidity relaxes firms' financial constraints and has a real effect on the firms’ investment decisions. Furthermore, we find that bond liquidity leads to higher firm valuations, through lower discount rate and higher operating profitability. Keywords: Mergers and Acquisitions, Liquidity JEL Classification Numbers: G34, G32 * E-mail addresses: [email protected] (Field); [email protected] (Mkrtchyan); [email protected] (Wang)
Bond Liquidity and Investment
December 1, 2014
Abstract This paper examines the effect of bond liquidity on investment decisions. We find that firms with higher bond liquidity are more likely to make acquisitions and have higher capital expenditures. We exploit an exogenous shock to bond liquidity – introduction of TRACE, and show that increases in bond liquidity around TRACE implementation expands firms' investment. Our results support the hypothesis that bond liquidity relaxes firms' financial constraints and has a real effect on the firms’ investment decisions. Furthermore, we find that bond liquidity leads to higher firm valuations, through lower discount rate and higher operating profitability. Keywords: Mergers and Acquisitions, Liquidity JEL Classification Numbers: G34, G32
1
1. Introduction
Whereas credit risk is an important component of the cost of debt, recent research has
shown the significance of debt liquidity, i.e. the frictions in bonds’ trading environment, as
another determinant of the cost of debt. For any given level of credit risk, more illiquid securities
have lower price or higher cost, as investors demand compensation for expected trading
difficulty. 1 For example, Bao, Pan and Wang (2011) find that illiquidity is by far the most
important factor in explaining the changes in the U.S. aggregate yield spreads of investment
grade bonds. Furthermore, they show that for the bonds with the same rating category, one
standard deviation increase in illiquidity leads to an increase in yield spreads as large as 65 bps.
In addition to its' direct effect on cost of debt, liquidity deterioration in the secondary market also
impacts firms’ credit risk by reducing debt value in renegotiation during financial distress or by
increasing rollover losses from issuing new bonds (He and Xiong (2012), Ericsson and Renault
(2006)).
The idea that supply frictions can impact a firm’s investment patterns has been the
subject of a number of recent papers (e.g., Lemmon and Roberts (2010), Morellec (2010)). In
this paper, we examine whether bond liquidity has an impact on a firm’s investment decisions.
Our focus is on acquisitions, which represent the most visible and large investments firms
undertake. A growing body of M&A research has provided evidence of the important role debt
plays in acquisitions.2 For instance, Harford and Uysal (2013) find that firms’ access to debt
markets increases the likelihood of undertaking acquisitions by comparing firms with and
1 Amihud and Mendelson (1986, 1988), Chen, Lesmond, and Wei (2007), and Dick-Nielsen, Feldhütter and Lando (2012). 2 See also Bharadwaj and Shivdasani (2003); Faccio and Masulis (2005), Harford, Klasa and Walcott (2009) and Uysal (2011)).
2
without credit rating. Karampatsasa, Petmezasa, and Travlos (2014) find that firms with higher
ratings (i.e. lower credit risk) are more likely to use cash financing in a takeover.
Bidders with higher bond liquidity face relatively better opportunities to borrow due to
lower cost and higher demand for their bonds. Lower cost of debt allows firms to borrow more
and therefore expand their investment. We hypothesize that firms with higher bond liquidity will
be more likely to undertake acquisitions, as liquidity reduces cost of debt and potential
acquisitions are discounted at a lower rate. Consistent with this idea, we find that firms with
higher bond liquidity make more acquisitions after controlling for the credit risk. For example,
one standard deviation increase in bond liquidity leads to 8.1% increase in the likelihood of
acquisitions, compared to 1.95% increase for one standard deviation increase in stock liquidity.
This result is robust to the use of different measures of liquidity and alternative model
specifications. We similarly find that bond liquidity is positively associated with increased
capital investment, another proxy for an expanded firm investment.
We then proceed to address the endogeneity of the relationship between bond liquidity
and firm acquisitiveness. A potential concern of our analysis is that firms might issue debt in
anticipation of an acquisition (e.g. Edwards, Harris, Piwowar (2007)). Since recently issued
bonds tend to be more liquid, the relationship between bond liquidity and acquisition likelihood
can be affected by a reverse causality. We address this possibility by dropping firms that have
issued debt in a year prior to acquisition and by using a lagged liquidity measure. The
relationship between bond liquidity and probability of making an acquisition remains positive
and significant. Alternatively, the relationship between bond liquidity and a firm’s acquisition
activity might be spurious and driven by omitted factors. To address this issue we rely on a two-
stage regression model, using an industry median liquidity measure as our instrument, and we

3
obtain very similar results. Lastly, we examine the effect of an exogenous shock to liquidity
(TRACE introduction) to isolate the impact of bond liquidity on the likelihood of making an
acquisition. Exploiting the variation generated by the staggered introduction of TRACE, we
continue to find that higher bond liquidity leads to an expanded investment.
Next, we examine the channel through which bond liquidity affects firms' investments.
We hypothesize that through relaxing financial constraints that firms face, bond liquidity leads to
a greater investment, as investors are willing to provide financing to firms with more liquid
bonds at a lower cost. We study whether the effect of bond liquidity differs for firms with
varying degree of financial constraints. If firms do not need much additional financing, either
because they hold enough cash or because they have easier access to equity markets, then bond
liquidity will not have a big impact. Conversely, firms that are more financially constrained will
benefit more from the liquidity premium, as it makes it easier for them to obtain external
financing. Consistent with this notion, we find that the positive effect of liquidly is stronger for
firms that are more financially constrained, i.e., younger firms and firms with a lower debt rating.
If bond liquidity relaxes financial constraints and increases firms' resources, it can help
firms undertake positive NPV investments which otherwise would be foregone and, therefore,
increase firm valuations. In fact, we find that higher bond liquidity is associated with higher
market valuations. To understand better the effect of bond liquidity on market-to-book ratios, we
decompose market-to-book ratio into: price-to-earnings, equity-to-assets, and earnings-to-assets
ratios, similar to Fang et al. (2009). We find that higher bond liquidity is associated with a higher
price-to-earnings ratio, providing support for the liquidity premium, i.e. the effect of lower
discount rate. Furthermore, we find that firms with higher bond liquidity have higher operating
profitability, suggesting that improvement in bond liquidity allows firms to make good

4
investments which otherwise wouldn’t be undertaken. We perform a number of robustness tests
to ensure that the relationship between bond liquidity and market valuations is not endogenous.
First, we perform firm fixed analysis, which helps control for time-invariant firm characteristics.
Next, we perform two-stage least squares estimation. Last, we use the introduction of TRACE as
an exogenous shock to liquidity and continue to find the positive effect of bond liquidity on firm
value.
This article contributes to an emerging body of empirical literature that examines the
links between corporate finance and the market microstructure of a firm’s bonds. Prior literature
provides ample evidence on the relation between stock liquidity and corporate policies (e.g.
dividends pay-out, debt policy, innovation, governance, CEO pay, acquisitions). Debt is a
principal source of external financing for U.S. firms, however, there is little evidence on the
impact of bond liquidity on corporate events. We contribute to this literature by providing insight
into how frictions in bonds’ trading environment affect a firm’s acquisition activity and firm
valuations.
Our paper similarly adds to the studies linking leverage and access to debt to a firm’s
ability to make acquisitions (Harford and Uysal (2014), Almazan, de Motta, Titman, and Uysal
(2010), Uysal (2011)). We show that bond liquidity is an important determinant of a firm’s
investment even after controlling for leverage and credit ratings.
This paper is also related to the work by Fang et al. (2009) who show a positive effect of
stock liquidity on firm value. We complement their findings by showing that bond liquidity has a
significant impact on market valuations, after controlling for stock liquidity. Fang et al. (2009)
find that higher market-to-book ratios of firms with higher stock liquidity cannot be explained by
a lower discount rate. In contrast, we document that in case of bond liquidity: liquidity has an
5
impact on firm value, not only through increased profitability, but also through the discount rate
effect, which can be explained by the fact that liquidity premium is much larger in bonds than in
stocks.
The remainder of this paper is organized as follows: Section 2 provides descriptive
statistics of the sample and describes our measure of bond liquidity. Section 3 presents empirical
evidence on the relationship between bond’s liquidity, firms’ investment activity and market
valuations. Section 4 concludes.
2. Sample Selection, Variable Measurement and Descriptive Statistics
2.1. Sample
We obtain price and trading data for corporate bonds from Financial Industry Regulatory
Agency’s (FINRA’s) Transaction Reporting and Compliance Engine (TRACE) and ratings and
bond-specific characteristic information from the Fixed Investment Securities Database (FISD).
In January 2001, the Securities and Exchange Commission approved rules requiring the
FINRA (previously National Association of Security Dealers) to report all over-the-counter
corporate bond transactions through TRACE. On July 1, 2002, TRACE began to report bond
transactions, requiring that transaction information be disseminated for investment grade
securities with an initial issue size of $1 billion or greater. TRACE was expanded in stages and
was fully implemented by January 2006, covering essentially all publicly traded bonds. There
appear to be a number of problematic trades during the early period of the database.
Consequently, we eliminate canceled, corrected, and commission trades from the data. Bond
transactions under $100,000 are deleted to avoid the effects of retail investors. We also remove
bonds with time to maturity less than one year because of high pricing errors.
6
The FISD reports detailed information about corporate, U.S. Agency, U.S. Treasury, and
supranational debt securities, including information about issue- and issuer-specific information
such as coupon rate, maturity, issue amount, provisions, and credit ratings for all US corporate
bonds maturing in 1989 or later. We merge the two databases to create a panel of bond
transactions and characteristics.
In order to obtain a firm-level bond liquidity measure in the secondary market, we first
calculate the daily bond-level liquidity using high-frequency transaction data. Next, we calculate
monthly liquidity as the median of the daily bond-level liquidity measures. Lastly, we average
the monthly measures over a fiscal year to construct annualized bond-level liquidity metric. We
aggregate bond-level metrics to the firm-level bond liquidity measure by calculating the offering-
amount weighted average of annual bond-level liquidity. We winsorize the liquidity metric at
1%, so that values above the 99% percentile are set to the 99% percentile and values below the
1% percentile are set to the 1% percentile.
We merge annual firm-level bond data with Center for Research in Security Prices
(CRSP) database and Compustat Industrial Annual Files to obtain stock prices and accounting
information. We obtain 6,664 firm-year observations between 2002 and 2011 for 1,227 firms. To
examine the relationship between bond liquidity and the likelihood of undertaking an acquisition,
for each firm in the sample, we obtain all of its completed domestic acquisitions listed in
Thomson One’s Mergers and Acquisitions database. The sample includes acquisitions of private,
public and subsidiary targets and excludes buybacks, recapitalizations and exchange offers.
Consistent with prior studies, we require that the acquirer obtains at least 51% of the target
shares and that acquisitions represent at least 1% of the acquirer’s market value, measured at the
7
fiscal year end before the announcement. 3 Our sample of acquisitions consists of 954
acquisitions completed by 517 firms.
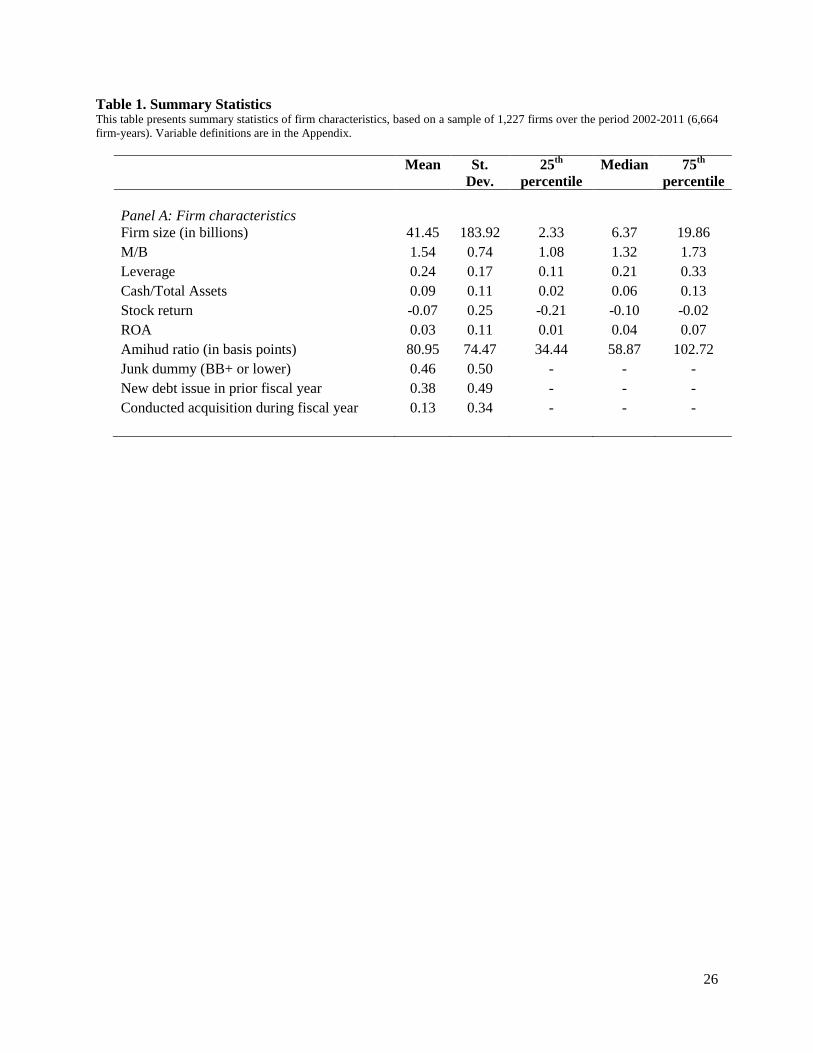
Table 1 reports the descriptive statistics of firms in the sample. Sample firms are quite
large, for example, the median book value of total assets is $6.37 billion. The median firm has a
market-to-book ratio of 1.3, and leverage of 21%. Forty-six percent of our firms have S&P
rating of BB+ or below. The unconditional likelihood of making an acquisition is 13.3%.
2.2. Measuring Liquidity
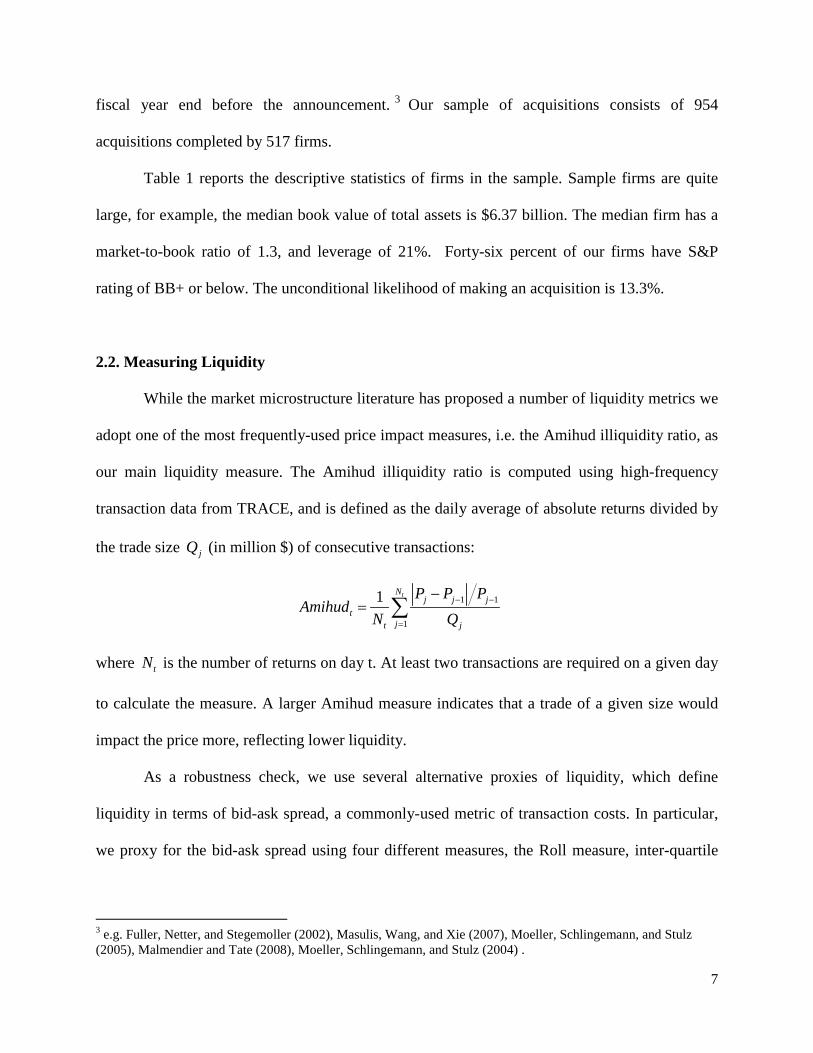
While the market microstructure literature has proposed a number of liquidity metrics we
adopt one of the most frequently-used price impact measures, i.e. the Amihud illiquidity ratio, as
our main liquidity measure. The Amihud illiquidity ratio is computed using high-frequency
transaction data from TRACE, and is defined as the daily average of absolute returns divided by
the trade size jQ (in million $) of consecutive transactions:
1 1
1
1 tNj j j
tjt j
P P PAmihud
N Q− −
=
−= ∑
where tN is the number of returns on day t. At least two transactions are required on a given day
to calculate the measure. A larger Amihud measure indicates that a trade of a given size would
impact the price more, reflecting lower liquidity.
As a robustness check, we use several alternative proxies of liquidity, which define
liquidity in terms of bid-ask spread, a commonly-used metric of transaction costs. In particular,
we proxy for the bid-ask spread using four different measures, the Roll measure, inter-quartile
3 e.g. Fuller, Netter, and Stegemoller (2002), Masulis, Wang, and Xie (2007), Moeller, Schlingemann, and Stulz (2005), Malmendier and Tate (2008), Moeller, Schlingemann, and Stulz (2004) .
8
range (IQR), Range, and imputed roundtrip trades. Similar to the Amihud measure, larger values
of these metrics imply lower liquidity. Appendix A describes the measures in more detail.
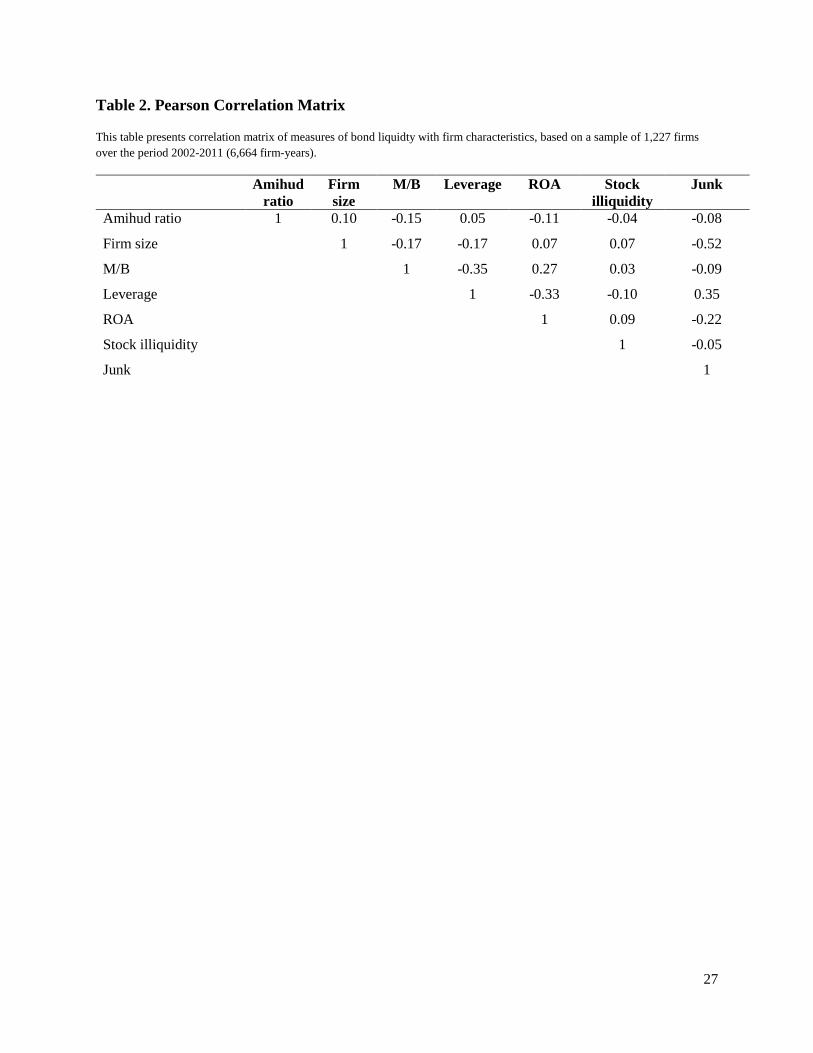
The Pearson correlation matrix in Table 2 shows that Amihud illiquidity ratio is
positively correlated with firm size and leverage, suggesting that larger and more levered firms
have less liquid bonds. Firms with higher market-to-book ratios, higher ROA, and non-
investment grade bonds have bonds with greater liquidity. Whereas all of the correlations are
statistically significant, none of them is particularly high.
3. Results
3.1. Probability of Making Acquisitions
Prior studies indicate that share issues typically account for less than 5% of total new
external finance (e.g. Fazzari et al. 1988a, 1988b, 1988c). Not surprisingly, most acquisitions
involve cash either as a sole component of consideration or in combination with stock. In our
sample, only seven percent of the acquisitions are financed by stock only. A growing body of
studies has provided evidence that cash-financed acquisitions are to a great extent funded by debt
(see, e.g., Bharadwaj and Shivdasani (2003); Faccio and Masulis (2005), Harford, Klasa and
Walcott (2009) and Uysal (2011)). Since debt is the primary marginal source of external funds,
the capital structure decision has been proved to be of great importance in the corporate
financing decision of merger and acquisition (M&As). While prior literature has studied the
impact of leverage and access to credit market on acquisitions, in this paper we study how
another aspect of corporate debt, i.e. liquidity of the firm’s bonds affect a firm’s takeover
decisions.
9
Prior literature has documented a significant effect of liquidity on asset prices and shows
that part of the yield spread differences across bonds is due to illiquidity (e.g., survey by
Amihud, Mendelson, and Pedersen (2005)). Because trading in the US corporate bond market
involves much higher transaction costs compared to the stock market the liquidity premium in
the bond market is significant (Amihud and Mendelson (1986)). For example, Bao et al. (2011)
find that illiquidity is by far the most important factor in explaining the changes in the U.S.
aggregate yield spreads of investment grade bonds, with an R-squared ranging from 47% to 60%.
Bao et al. (2011) further show that for two bonds in the same rating category, a one standard
deviation difference in their bond illiquidity leads to a difference in their yield spreads as large as
65 bps. In addition to a direct effect on bond spreads bond liquidity can also affect a firm’s credit
risk. Ericsson and Renault (2006) find positive correlation between the illiquidity and default
components of yield spreads, and show that the illiquidity of the market for distressed debt
increases a firm’s credit risk by reducing debt value in renegotiation during financial distress. He
and Xiong (2012) show that illiquidity increases the rollover losses from issuing new bonds and
leads to an increase in the cost of debt.
Whereas prior literature has documented the importance of bond liquidity in explaining
yield spreads, in this paper we examine whether bond liquidity is significant enough to influence
a firm’s investment decisions. Bond liquidity lowers the expected return investors require to hold
debt securities therefore it decreases the cost of capital by lowering the cost of debt. When the
cost of capital is low, the value of the potential synergies is high, as the discount rate used to
evaluate potential bids is lower. Furthermore, higher liquidity of a firm’s bonds might allow
firms to issue funds at a short notice and according to their investment needs. Because debt is an
important source of funding in acquisitions, bond liquidity might have a significant impact on the
10
decision to acquire. Therefore, we argue that lower cost of debt, due to higher bond liquidity,
allows firms to borrow more and expand their investment.
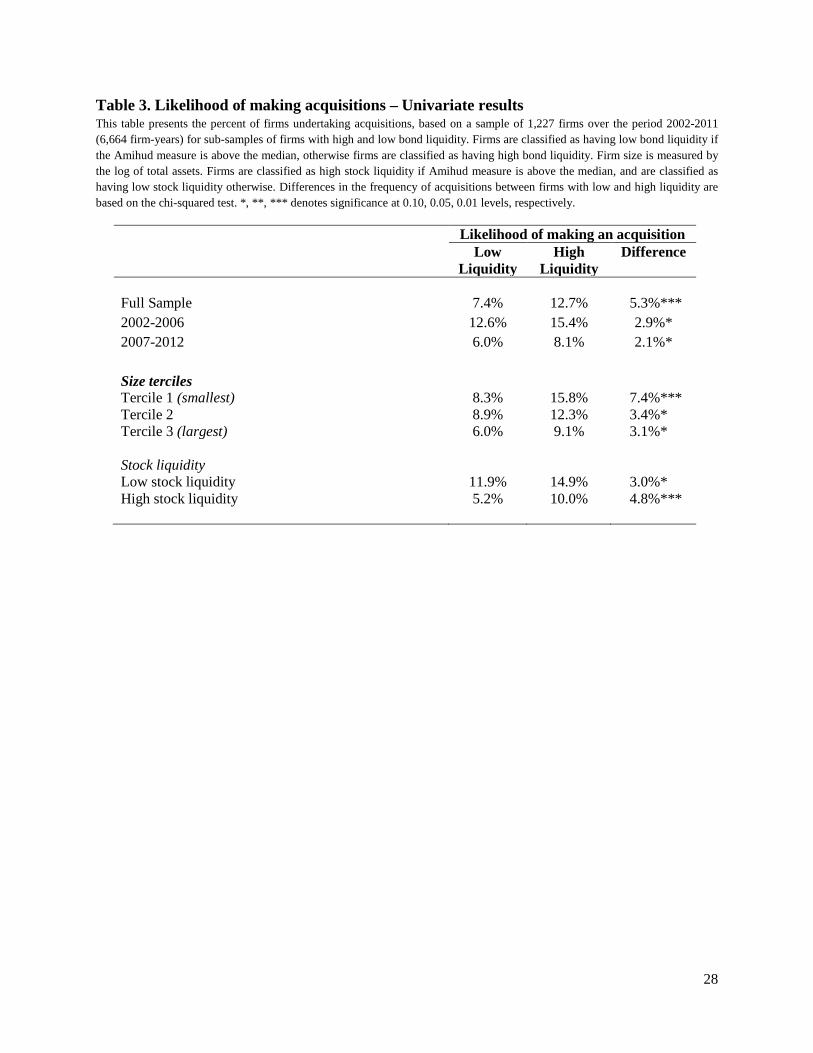
Table 3 presents univariate analysis of the relationship between bond liquidity and
probability of acquisition. We classify firms into firms with high and low bond liquidity, based
on the Amihud ratio. Firms are classified as having low liquidity if the Amihud ratio is above the
median, otherwise firms are classified as having high liquidity. As can be seen from Table 2 the
unconditional probability of making an acquisition is 12.7% for firms with high liquidity and it is
only 7.4% for firms with low liquidity. The difference of 5.3%, which is significant at 1%,
represents 37.7% relative to the mean unconditional probability of being an acquirer (13.3%).
During the earlier part of the sample TRACE only captures firms with the largest, highest
rated bonds. Hence, the early and later time periods of our study include different types of firms,
thus we separate our sample period into two periods, one that captures the introduction of
TRACE from 2002 to 2006 and the later, post-TRACE period from 2007 to 2011. We continue
to find that firms with higher bond liquidity make more acquisitions during both sub-periods.
Next, we examine whether this result is driven by such firm characteristics as firm size or
stock liquidity. We split our sample into size terciles and find that firms with higher bond
liquidity continue to have higher acquisition frequencies relative to lower liquidity firms in all
sub-samples. The effect of liquidity is the largest among the smallest firms, which suggests that
bond liquidity is more important for firms that might be financially more constrained, a notion
that we explore further in Section 3.4. Table 3 further shows bond liquidity is associated with
higher acquisition frequencies for firms with high and low stock liquidity.
To alleviate a concern that the effect of bond liquidity on the likelihood of making an
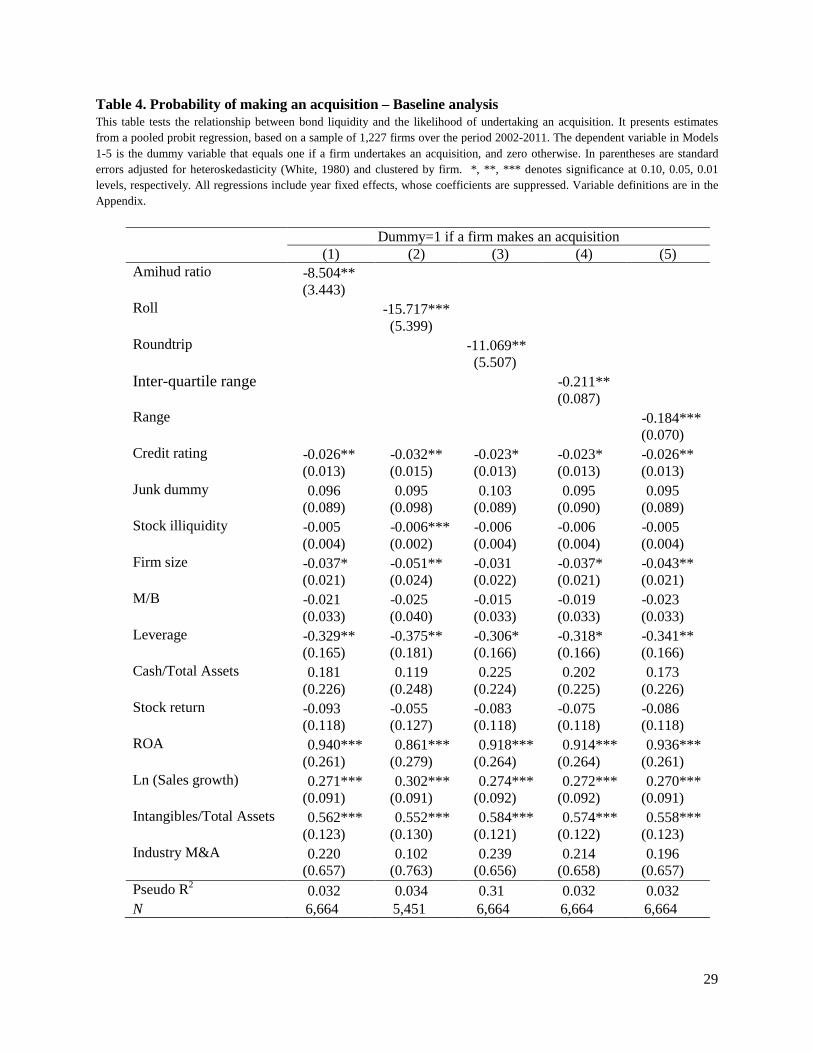
acquisition is driven by firm characteristics, we turn to multivariate analysis. Table 4 presents the

11
results of the probit regression, in which the dependent variable is a dummy variable that equals
one if a firm undertakes at least one acquisition in a given year. We control for several factors
that may potentially affect the likelihood of making an acquisition, by including firm size,
market-to-book ratio, leverage, cash, return on assets ratio, abnormal stock return, sales growth,
intangible assets, scaled by sales, and stock illiquidity, measured by Amihud ratio. Furthermore,
we include a measure of recent mergers and acquisition activity (Industry M&A) and control for
credit rating (based on S&P credit rating), using a conversion process in which AAA-rated bonds
are assigned a value of 1 and C-rated bonds receive a value of 21. To control for the non-
linearity in credit rating we include a non-investment grade dummy which equals one for firms
with a credit rating BB+ or lower.4 We also control for calendar year fixed effects to account for
macroeconomic changes during the sample period and we cluster standard errors at a firm level.5
Consistent with prior literature, we find that better performing firms, as measured by
return on assets, are more likely to undertake acquisitions, whereas excess leverage impairs a
firm’s ability to undertake acquisitions (Asquith, Bruner, and Mullins (1983), Roll (1986),
Harford (1999), Almazan et al. (2010)). Turning to our variable of interest, we find that the
coefficient on the Amihud iliquidity ratio is negative and statistically significant at 1% level. As
higher value of liquidity measures indicates lower bond liquidity, the negative coefficient implies
that firms with higher bond liquidity are more likely to make acquisitions, consistent with our
hypothesis that bond liquidity is positively associated with increase in investment. The effect on
the acquisition likelihood is also economically meaningful. One standard deviation increase in
bond liquidity leads to a 8.1% increase in the likelihood of acquisitions, which is comparable to a
9.0% increase for a one standard deviation increase in credit rating. At the same time, one
4 Our results are robust, if use credit rating dummies instead. 5 As a robustness, we re-estimate p-values based on clustering by firm and time (year), following Petersen (2009). The results remain very similar.

12
standard deviation increase in stock liquidity leads to only a 1.9% increase in the likelihood of an
acquisition. A greater effect of bond liquidity and credit risk relative to stock liquidity is not
surprising, given the relative importance of debt in acquisitions.
To ensure that our finding is not impacted by the way we measure bond liquidity, in
Models 2-5 of Table 4, we employ four alternative measures of bond liquidity and continue to
find a strong positive relationship between bond liquidity and a firm’s decision to undertake an
acquisition. For brevity purposes our later tables only report the results based on the Amihud
ratio, however, our results are robust to the alternative liquidity measures. The results in Table 4
show that bond liquidity has an economically significant effect on a firm’s investments even
after controlling for firm size, leverage and credit ratings.
For robustness, we use alternative model specifications. Specifically, we estimate a
Poisson model with the annual acquisition count as the dependent variable, and a Tobit
regression, in which the dependent variable is the total size of all targets acquired in a year,
scaled by the firm’s market value of equity. The results are robust to these alternative model
specifications (untabulated). Additionally, we conduct probit analyses for the sub-samples of size
to alleviate the concern that our findings are driven by firm size. Similar to the univariate results,
we continue to find the positive effect of bond liquidity on the probability of making acquisitions
across all sub-samples (untabulated).
In the next section we examine the relationship between bond liquidity and the likelihood
of making acquisitions more carefully to alleviate potential endogeneity concerns.
13
3.2. Endogeneity concerns
3.2.1. Reverse causality
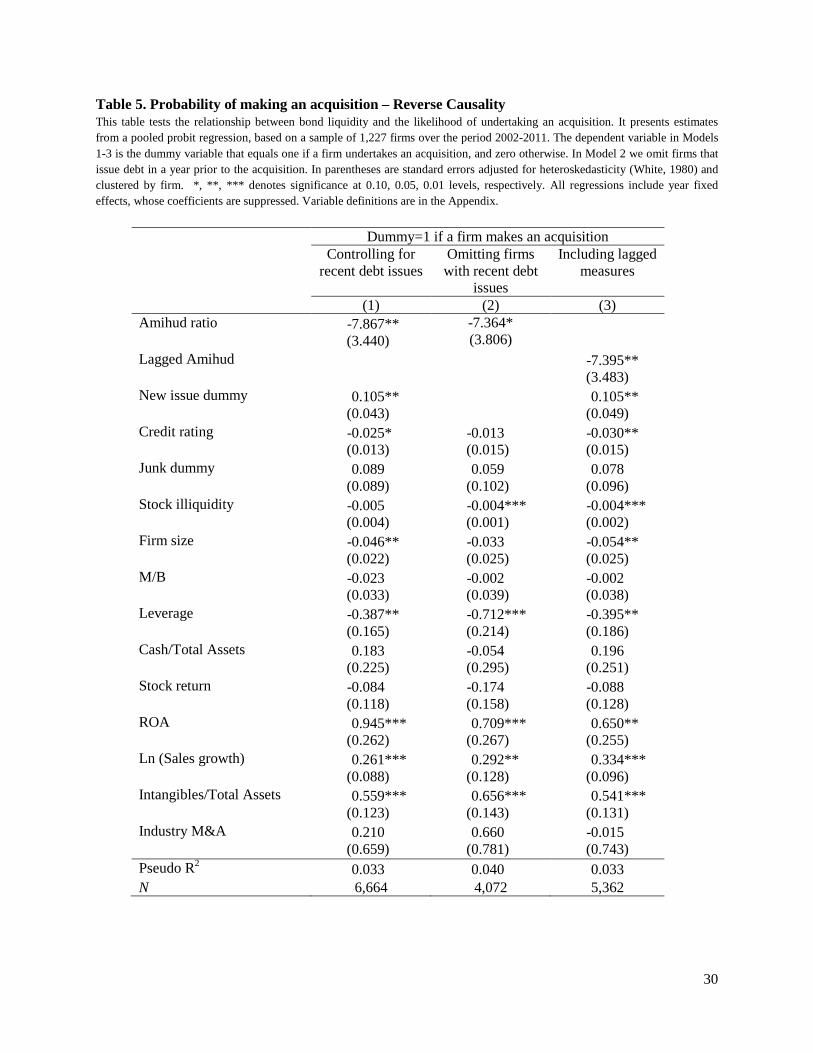
It is possible that firms planning to undertake acquisitions might raise debt shortly prior
to undertaking an acquisition. In fact, 42% of firms undertaking acquisitions issue debt in a year
prior to an acquisition, compared to 37% of firms not making acquisitions. As recently issued
bonds tend to be more liquid (e.g. Edwards, Harris, Piwowar (2007)), the relationship between
bond liquidity and acquisition likelihood can be affected by reverse causality. It is worth nothing,
that even though some firms increase bond liquidity by issuing new bonds prior to an acquisition,
it still implies that bond liquidity influences firm’s acquisition decisions. Yet, to address the
possibility that firms issue debt in the year prior to an acquisition we introduce a dummy
variable, which equals one if a firm issued debt in the fiscal year preceding the acquisition. As
can be seen from Model 1 of Table 5, consistent with the idea that firms foreseeing acquisition
possibilities might raise debt beforehand, the coefficient on the new issue dummy is positive and
significant at 1% level. However, our measure of liquidity remains significant even after
controlling for recently issued debt. Alternatively, we limit our analysis to firms which did not
issue debt in the year prior to an acquisition. Our results are robust to this exclusion, as shown in
Model 2. Additionally, we use lagged liquidity measure in Model 3 of Table 5, and similarly
observe a significant and negative coefficient on the Amihud ratio.
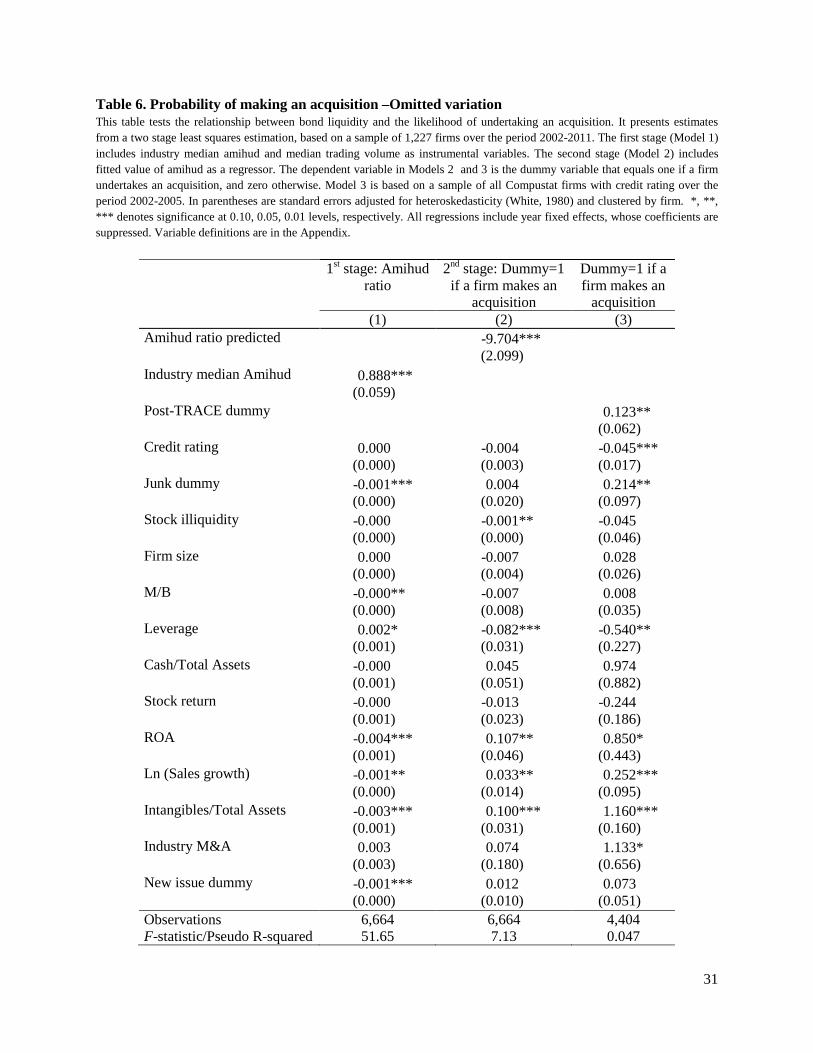
3.2.1. Omitted variation
A more serious concern with the results presented earlier, is that there are firm
characteristics not accounted for in the regression analysis that simultaneously determine a firm’s
acquisition decision and bond liquidity. To address this possibility, we employ a two-stage

14
regression model, which relies on instrumental variables. Following recent literature (Adams et
al (2011), Lin et al. (2011), Lin et al. (2011)) we use industry median liquidity measure as our
instrumental variable. As long as the endogeneity problem is specific to firms, but not to
industries, industry median bond liquidity will be correlated with a firm’s bond liquidity, but not
with an individual firm’s decision to undertake an acquisition. To alleviate the concern that some
industry-level factors might affect an entire industry’s decision to make an acquisition our
regressions include recent industry M&A activity. Table 6 presents the two-stage regression
results. In the first stage, we regress our instrumental variable, along with the control variables
described earlier, on a firm’s Amihud ratio. Consistent with the intuition, the coefficient on
industry median liquidity measure is positive and significant at 1% level. In the second stage we
include a fitted value from the first stage as an explanatory variable. The coefficient on the
predicted liquidity measure is significant, confirming that firms with higher liquidity tend to
make more acquisitions.
Another way to identify the effect of liquidity on the likelihood of making acquisitions is
to use the change in liquidity caused by the exogenous shock of TRACE introduction. Prior
research has shown that bond liquidity improved in response to TRACE, as the introduction of
TRACE improved transparency and reduced transaction costs (e.g. Bessembinder, Maxwell, and
Venkataraman (2006); Edwards, Harris, and Piwowar (2007); Goldstein, Hotchkiss, and Sirri
(2007)). As described in Section 2.1. Securities and Exchange Commission has implemented
TRACE reporting system over the interval between 2002 and 2005. Therefore, to further address
the concern that there could be an omitted variable that is correlated with bond liquidity and
decision to make an acquisition, we use the change in liquidity around the introduction of
TRACE and we make use of the phase-in feature of TRACE introduction. In particular, for this
15
analysis we employ a sample of all COMPUSTAT firms with credit ratings over the period from
2002 to 2005 and exploit the variation generated by staggered introduction of TRACE. We
estimate a model, in spirit of Bertrand and Mullainathan (1999a, 1999b, 2003), as follows:
Acquisition Dummyit=αt+γXit+δPOST-TRACE+εit
where i indexes firm, t indexes years from 2002 to 2005, αt are year fixed effects which
account for any market-wide fluctuations, and Xit represents control variables. The variable of
interest is the POST-TRACE dummy that equals one if a firm’s bonds are covered by TRACE
during year t, and captures the impact of increase in liquidity in the years following TRACE
introduction. As Model 3 in Table 6 shows, the coefficient on POST-TRACE dummy is positive
and significant at the 5% level, suggesting that improvement in bond liquidity leads to higher
probability of making acquisitions.
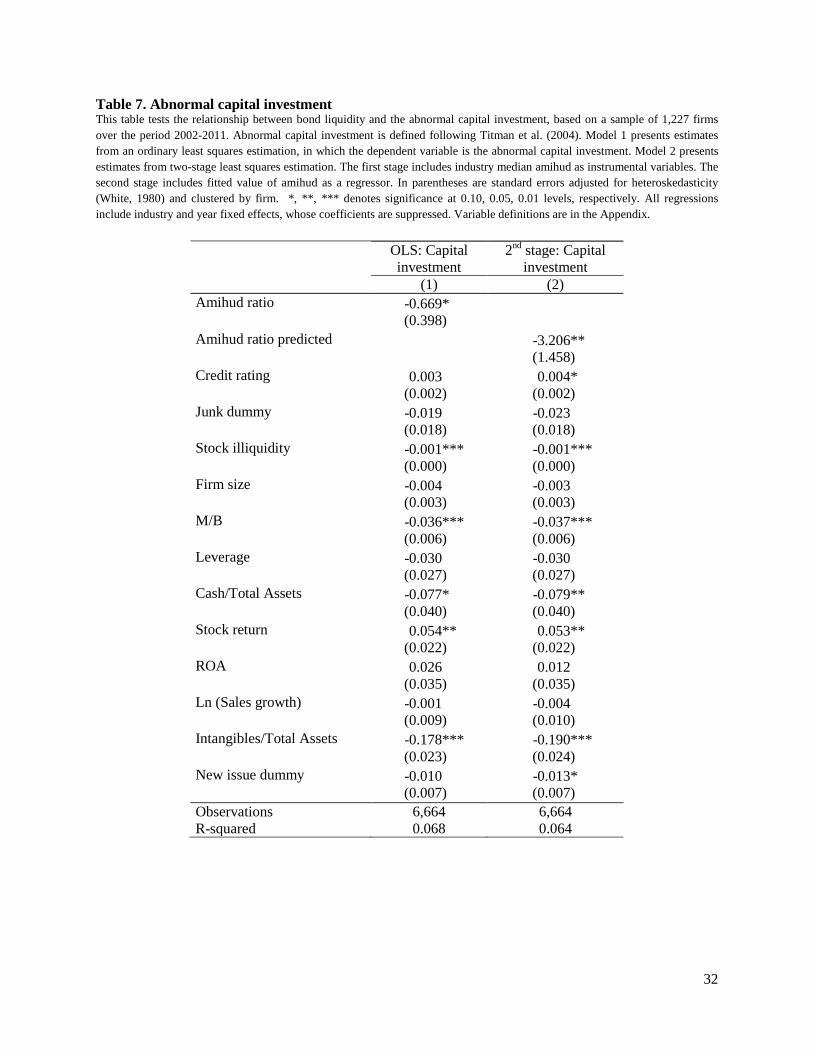
3.3. Capital Expenditure
As an alternative proxy for the expanded investment, we next focus on the increase in the
firm’s capital expenditures, as capital expenditures reflect managerial efforts to exploit current
investment opportunities. Following Titman, Wei, and Xie (2004), we compute the abnormal
capital investment (CIt) in year t-1 as follows:
𝐶𝐶𝑡−1 =𝐶𝐶𝑡−1
(𝐶𝐶𝑡−2 + 𝐶𝐶𝑡−3 + 𝐶𝐶𝑡−4)/3− 1
Where CEt-1 is a firm’s capital expenditure scales by its total assets in yeat t-1.
We then investigate whether bond liquidity affects firm's abnormal capital investments in
the following year. In Model 1 of Table 7, we estimate an ordinary least squares regression, in
which the dependent variable is the measure of abnormal capital investment. Consistent with our
hypothesis that bond liquidity expands plausible investment set we find that the coefficient on

16
the Amihud ratio is negatively significant, suggesting a positive association between a firm’s
bond liquidity and capital investment. Model 2 reports the estimated from the second stage of
the two-stage least squares estimation, in which the Amihud ratio is replaced by its’ predicted
value. Similar to our prior analysis we rely on the industry Amihud ratio as our instrument.
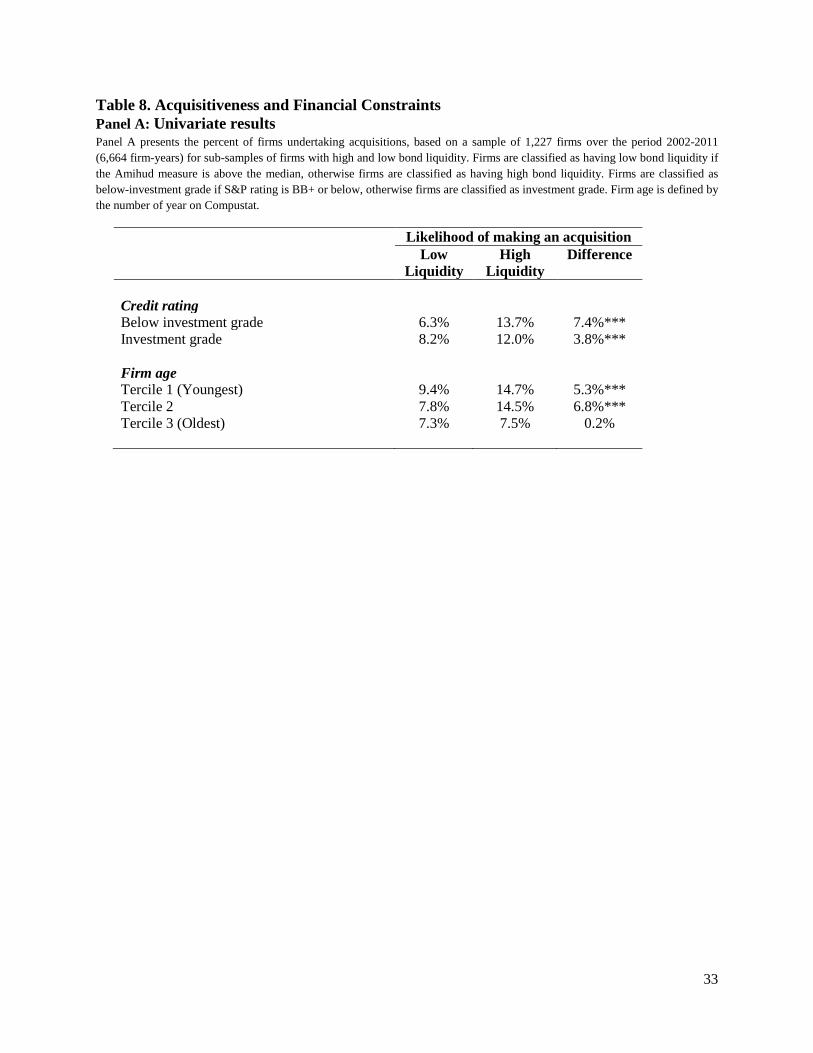
3.4. Bond liquidity and financial constraints
Fazzari et al. (1988) argue that information asymmetry affects firm investment because it
creates financial constraints in the credit markets. A recent survey by Campello, Graham, and
Harvey (2010) reveal that the inability to borrow externally causes firms to bypass attractive
investment opportunities or to postpone investment. If the difference in acquisition activities is
partly attributable to differences in access to financial market, then we would expect that firms
with the least access to financial markets to benefit more from higher bond liquidity. To examine
whether bond liquidity relaxes financial constraints we explore whether bond liquidity has
different impact on acquisition decisions for firms with different levels of financial constraints.
We conjecture that the effect of bond liquidity would be magnified for firms with higher
financial constraints, which we proxy by firm age and credit ratings.
Credit ratings reflect a firm’s access to public bond markets and measure ex ante
information asymmetry and a firm’s financial constraints. The higher the level of credit ratings
the lower the information asymmetry and the adverse selection problem faced by firms
(Faulkender and Petersen (2006), Odders-White and Ready (2006); Easley and O'Hara (1987),
Almeida, Campello, and Weisbach (2004); Frank and Goyal (2009), Rauh and Sufi (2010)).
Since higher credit ratings indicate lower information asymmetry, if we find that low-rated
firms’ merger activity is the most sensitive to bond liquidity it would be consistent with the

17
notion that increased bond liquidity has a bigger impact on firms that are more financially
constrained. Panel A of Table 8 shows that the effect of bond liquidity on acquisition probability
is greater for firms with below-investment-grade ratings, indicating that higher liquidity enables
firms with below investment grade to borrow more or at lower rate to finance acquisitions.
Similarly, it can be argued that younger firms have limited access to debt markets and
thus can benefit substantially by an improvement in bond liquidity, whereas older and more
established firms might have limited upside potential. Panel A of Table 8 shows that bond
liquidity is positively related to a firm’s decision to undertake an acquisition for all, but the most
established firms.
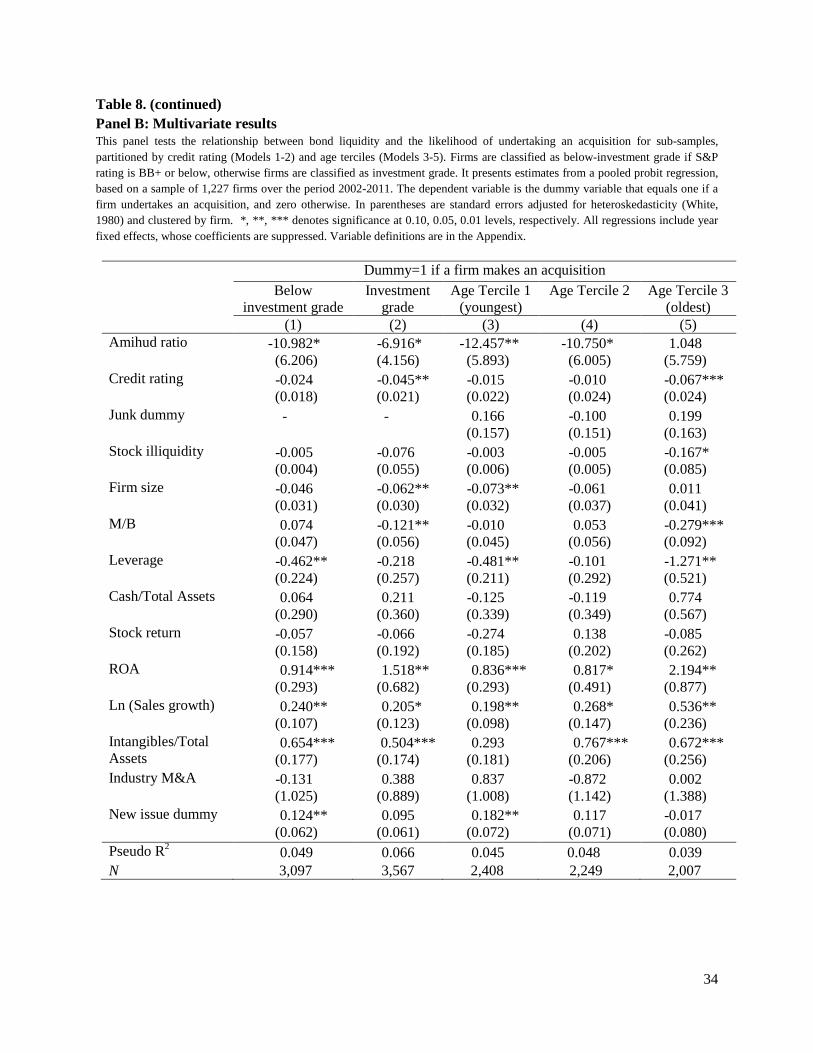
Panel B of Table 8 re-estimates the relationship between bond liquidity and the likelihood
of undertaking an acquisition separately for age terciles and for sub-samples of firms with
investment and non-investment ratings in the multivariate setting. As Panel B shows the effect of
bond liquidity is important for all but the oldest firms. Similarly, the effect of bond liquidity is
larger for firms with below investment grade rating, suggesting that the constrained firms are
affected more by bond liquidity.
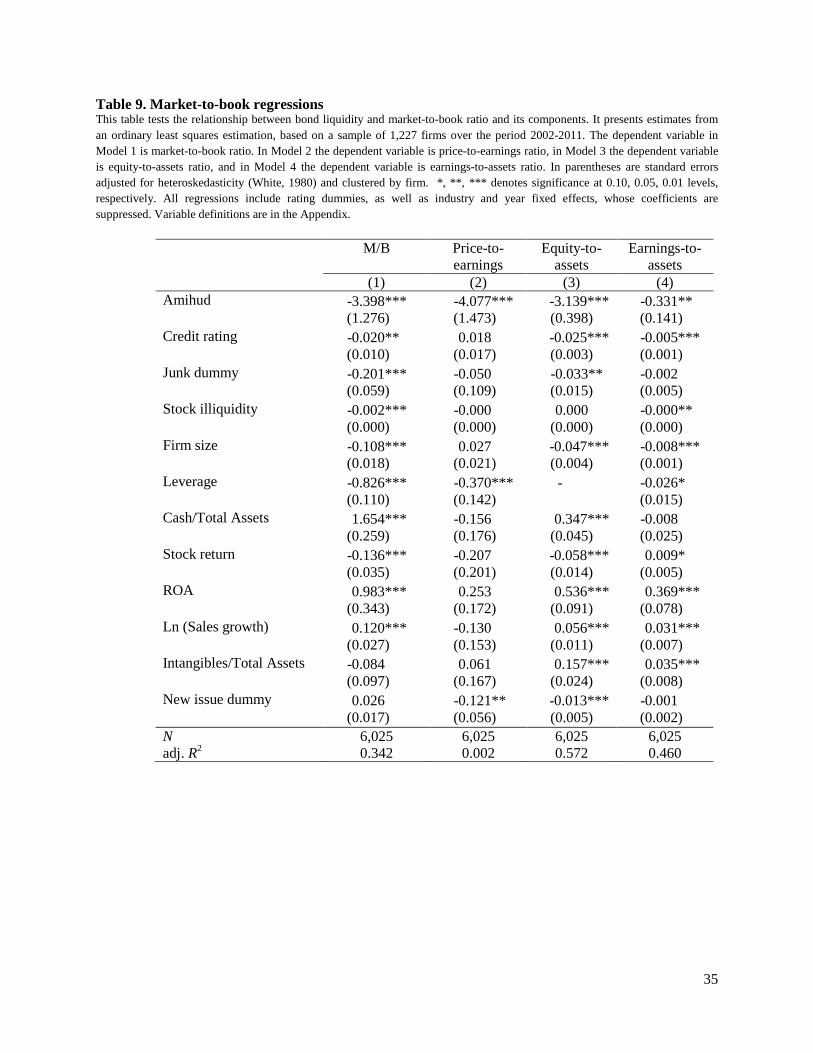
3.5. Bond liquidity and firm value
If higher bond liquidity relaxes financial constraints and allows firms to undertake
positive NPV investments, which otherwise would be foregone, it will be positively reflected in
the firm valuations. By enlarging a firm’s investment set, bond liquidity allows a firm to expand
its’ capacity and increase profits by undertaking new value-increasing projects. Furthermore, if
the marginal investor values liquidity, firms with higher liquidity will trade at a premium, as
lower cost of capital means higher valuations for any given cash flows that the company

18
generates (Holmstrom and Tirole, 2001; Amihud and Mendelson, 1988). Thus, we conjecture
that higher bond liquidity, which leads to lower cost of debt and lower required rate of return,
will be associated with higher market-to-book ratios. Model 1 in Table 9 presents the results of
an ordinary least squares regression, in which the dependent variable is market-to-book ratio. We
find that firms with higher bond liquidity are associated with higher market valuations.
To gain further insight into how bond liquidity affects market-to-book ratio, we
decompose it into three components: price-to-earnings, equity-to-assets, and earnings-to-assets,
similar to Fang et al. (2009). In Model 2 of Table 9, the market-to-book ratio is replaced with
price-to-earnings ratio. If higher firm values for firms with more liquid bonds are based on the
liquidity premium, then firms with higher bond liquidity will have higher price-to-earnings
ratios. Consistent with this notion, we find that the coefficient on the Amihud ratio is negative
and significant, indicating that higher liquidity reduces the discount rate. In Model 3 of Table 9,
we replace the dependent variable with Equity-to-assets, which measures the fraction of equity in
the capital structure, and we find that firms with more liquid bonds tend to have a lower
leverage, which is consistent with the negative correlation between bond liquidity and leverage
presented in Table 2. The dependent variable in Model 4 in Table 9 is earnings-to-assets, which
reflect operating profitability. The results show that firms with more liquid bonds tend to be
more profitable, which is consistent with the idea that bond liquidity relaxes a firm’s financial
constraints and allows it to undertake positive NPV projects.
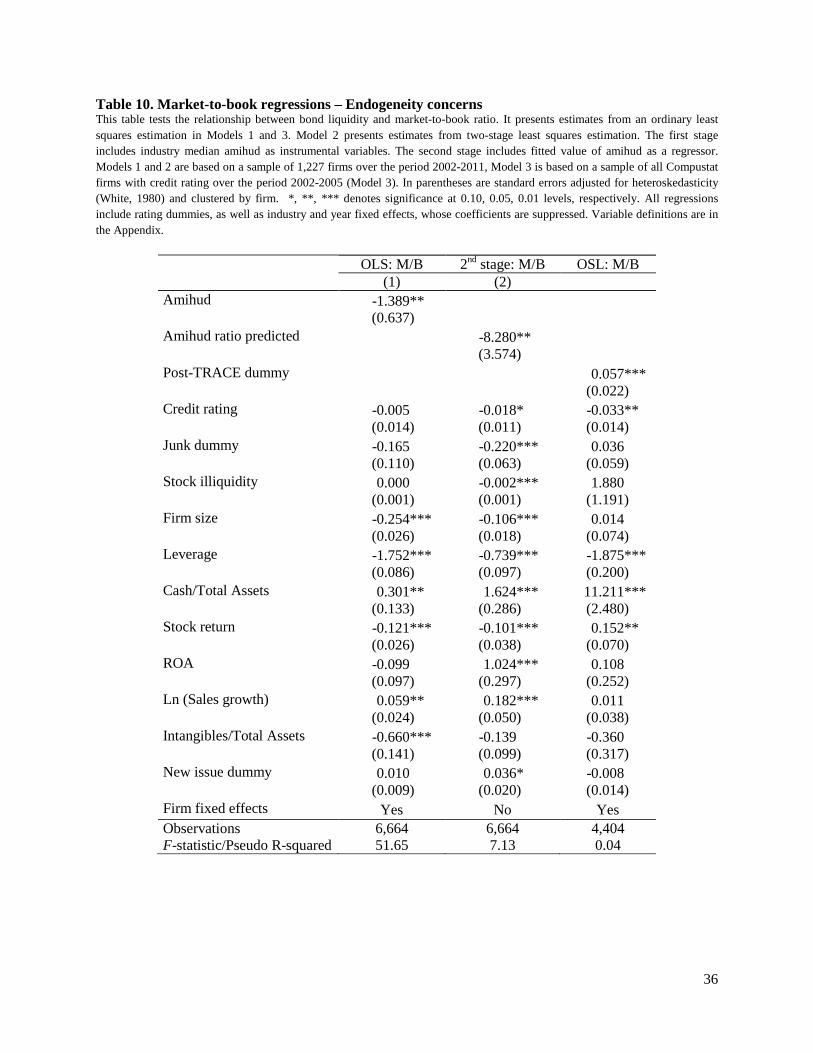
A potential concern with this analysis is that unobservable characteristics correlated with
both bond liquidity and firm performance may make coefficient estimates biased. For example,
firms with high quality managers may tend to be employed by companies with more liquid
bonds. At the same time, high quality managers would also lead to higher market valuations.

19
Thus, bond liquidity will be positively correlated with firm value due to the omitted variables.
One way to account for the unobserved variation at the firm level which is constant over time is
to perform fixed effects analysis. Thus in Model 1 of Table 10 we include firm fixed effects. The
estimates show that firms with higher bond liquidity continue to be positively associated with
higher market valuations. In Model 2 of Table 10, we present estimates from a two-stage least
squares estimation, in which we use industry-median bond liquidity as our instrument and
continue to find a positive effect of bond liquidity on market valuation. Last, we rely on the
introduction of TRACE as an exogenous shock to bond liquidity. Similar to our earlier analysis,
we employ a sample of all COMPUSTAT firms with credit ratings over the period from 2002 to
2005. Additionally we include firm fixed effects in our specification that allows for more precise
controls for any unobserved cross-sectional heterogeneity across firms. Specifically we estimate
a model, as follows:
M/Bit=αt+βi+γXit+δPOST-TRACE+εit
where i indexes firm, t indexes years from 2002 to 2005, αt and βi are year and firm fixed
effects, Xit represents control variables. As Model 3 in Table 10 shows, the coefficient on POST-
TRACE dummy is positive and significant at the 1% level, suggesting that improvement in bond
liquidity leads to higher valuations.
6. Conclusion
This paper studies the impact of bond liquidity on firms' investment. We argue that
higher bond liquidity leads to an expanded investment. We test this hypothesis by focusing in
acquisitions, as they represent the largest investments firms undertake. Our results show that
firms with higher bond liquidity are more likely to make acquisitions and the result is stronger

20
for financially constrained firms, i.e. smaller firms and firms with lower credit ratings.
Furthermore, we find that bond liquidity is associated with higher market valuations, indicating
that higher bond liquidity relaxes firms’ financial constraints and allows them to invest in
positive NPV projects which otherwise would be foregone. Collectively, these findings suggest
that frictions in financial markets have real effects on investment decisions.

21
References
Adams, M., Lin, C., Zou, H., 2011. Chief executive officer incentives, monitoring, and corporate risk management: evidence from insurance use. Journal of Risk and Insurance 78, 551–582. Almazan, A., De Motta, A., Titman, S., Uysal, V., 2010. Financial structure, acquisition opportunities, and firm locations. Journal of Finance 65, 529–563. Almeida, H., Campello, M., Weisbach, M.S., 2004. The cash flow sensitivity of cash. Journal of Finance 59, 1777-1804. Amihud, Y., Mendelson, H., 1986. Asset pricing and the bid-ask spread. Journal of Financial Economics 17, 223–249. Amihud, Y., Mendelson, H., 1988. Liquidity and asset prices: Financial Management Implications. Financial Management 17, 5-15. Amihud, Y., Mendelson, H., Pedersen, L.H., 2005. Liquidity and asset prices. Foundations and Trends in Finance 1, 269–364. Asquith, P., Bruner, R. F., Mullins Jr. D. W., 1983. The gains to bidding firms from merger. Journal of Financial Economics 11, 121-139. Bao, J., Pan, J., Wang, J. , 2011. The illiquidity of corporate bonds. Journal of Finance 66, 911-946. Bertrand, M., Mullainathan, S., 1999a. Is there discretion in wage setting? A test using takeover legislation. Rand Journal of Economics 30, 535-554. Bertrand, M., Mullainathan, S., 1999b. Corporate governance and executive pay: Evidence from takeover legislation. Unpublished working paper. Bertrand, M., Mullainathan, S., 2003. Enjoying the quiet life? Corporate governance and managerial preferences. Journal of Political Economy 111, 1043-1075. Bessembinder, H., Kahle, K. M., Maxwell, W. F., Xu, D., 2009. Measuring abnormal bond performance. Review of Financial Studies 22, 4219–4258. Bharadwaj, A., Shivdasani, A., 2003. Valuation effects of bank financing in acquisitions. Journal of Financial Economics 67, 113-148. Campello, M., Graham, J., Harvey, C., 2010. The real effects of financial constraints: evidence from a financial crisis. Journal of Financial Economics 97, 470-487. Chen, L., Lesmond, D. A., Wei, J., 2007. Corporate yield spreads and bond liquidity. Journal of Finance 62, 119–149. Dick-Nielsen, J., Feldhütter, P., Lando, D., 2012. Corporate bond liquidity before and after the onset of the subprime crisis. Journal of Financial Economics 103, 471–492. Downing, C., Underwood, S., Xing, Y., 2005. Is liquidity risk priced in the corporate bond market? Working Paper, Rice University.

22
Easley, D., O'Hara, M., 1987. Price, trade size, and information in securities markets. Journal of Financial Economics 19, 69-90. Edwards, A. K., Harris, L. E., Piwowar, M., 2007. Corporate bond market transaction costs and transparency. Journal of Finance 62, 1421–1448. Ericsson, J., Renault, O., 2006. Liquidity and credit risk. Journal of Finance 61, 2219–2250. Faccio, M., Masulis, R. W., 2005. The choice of payment method in European mergers and acquisitions. Journal of Finance 60, 1345–1388. Fama, E. F., French, K. R., 1997. Industry costs of capital. Journal of Financial Economics 43, 153-193.
Fang, V. W, Noe, T. H., Tice, S., 2009. Stock market liquidity and firm value. Journal of Financial Economics 94, 150-169. Faulkender, M., Petersen, M. A., 2006. Does the source of capital affect capital structure. Review of Financial Studies 19, 45-79. Fazzari, S., Hubbard, R. G., Petersen, B., 1988a. Finance constraints and corporate investment, Brookings Papers on Economic Activity 1, 141-195. Fazzari, S., Hubbard, R. G., Petersen, B., 1988b. Investment, financing policy, and tax policy. American Economic Review 78 200-205. Fazzari, S., Hubbard, R. G., Petersen, B., Blinder, A., Poterba, J., 1988c. Financing constraints and corporate investment, Brookings Papers on Economic Activity 1, 141-206. Frank, M. Z., Goyal, V. K., 2009. Capital structure decisions: which factors are reliably important? Financial Management 38, 1-37. Fuller, K., Netter, J., Stegemoller, M., 2002. What do returns to acquiring firms tell us? Evidence from firms that make many acquisitions. Journal of Finance 57, 1763–1794. Goldstein, M.A., Hotchkiss, E.S., Sirri, E.R, 2007. Transparency and Liquidity: A controlled experiment on corporate bonds. Review of Financial Studies 20, 235-273. Harford, J., 1999. Corporate cash reserves and acquisitions. Journal of Finance 54, 1969-1997. Harford, J., Klasa, S., Walcott, N., 2009. Do firms have leverage targets? Evidence from acquisitions. Journal of Financial Economics 93, 1-14. Harford, J., Uysal V., 2013. Bond market access and investment. Journal of Financial Economics Forthcoming. He, Z., Xiong, W., 2012. Dynamic Debt Runs. Review of Financial Studies 25, 1799-1843. Helwege, J., Huang, J., Wang, Y., 2013. Liquidity effects in corporate bond spreads. Journal of Banking and Finance, Forthcoming.

23
Holmstrom, B., Tirole J., 2001. LAPM: A liquidity-based asset pricing model. Journal of Finance 56, 1837-1867. Karampatsas, N., D. Petmezas and N. Travlos, 2014. Credit Ratings and the Choice of Payment Method in Mergers and Acquisitions. Journal of Corporate Finance 25, 474-493. Lemmon, M., Roberts, M. R., 2010. The response of corporate financing and investment to changes in the supply of credit. Journal of Financial and Quantitative Analysis 45, 555–87. Lin, C., Officer, M. S., Zou, H., 2011. Directors’ and officers’ liability insurance and acquisition outcomes. Journal of Financial Economics 102, 507–525. Lin, C., Ma, Y., Malatesta, P., Xuan, Y., 2011. Ownership structure and the cost of corporate borrowing. Journal of Financial Economics 100, 1–23. Loughran, T., and Ritter, J. R., 2004. Why has IPO underpricing changed over time? Financial Management 33, 5-37. Malmendier, U., Tate, G., 2008. Who makes acquisitions? CEO overconfidence and the market’s reaction. Journal of Financial Economics 89, 20-43. Masulis, R. W., Wang, C., Xie, F., 2007. Corporate governance and acquirer returns. Journal of Finance 62, 1851-1889. Moeller, S. B., Schlingemann, F. P., Stulz, R. M., 2004. Firm size and the gains from acquisitions. Journal of Financial Economics 73, 201-228. Moeller, S. B., Schlingemann, F. P., Stulz, R. M., 2005. Wealth destruction on a massive scale? A study of acquiring-firm returns in the recent merger wave. Journal of Finance 60, 757-782. Morellec, E. 2010. Credit supply and corporate policies. Working Paper. Odders-White, E.R., Ready, M.J., 2006, Credit ratings and stock liquidity. Review of Financial Studies 19, 119-157. Petersen, M. A., 2009. Estimating standard errors in finance panel data sets: Comparing approaches. Review of Financial Studies 22, 435–480. Roll, R., 1984. A Simple Implicit Measure of the Effective Bid-Ask Spread in an Efficient Market. Journal of Finance 39, 1127–1139. Rauh, J. D., Sufi, A., 2010. Capital structure and debt structure. Review of Financial Studies 23, 4242-4280. Roll, R., 1986. The hubris hypothesis of corporate takeovers. Journal of Business 59, 197-216. Titman, S., Wei, J. K. C., Xie, F., 2004. Capital investments and stock returns. Journal of Financial and Quantitative Analysis 39, 677-700. Uysal, V., 2011. Deviation from the target capital structure and acquisition choices. Journal of Financial Economics 102, 602-620.

24
Appendix: Variable Definition
Panel A: Alternative liquidity measures Roll Roll metric, proposed by Roll (1984) measures covariance between
consecutive returns and is defined as follows: 𝑅𝑅𝑅𝑅𝑡 = 2�−𝑐𝑅𝑐(Ri , R𝑖−1 )
Roundtrip Imputed roundtrip trades, proposed by Feldhutter (2012), directly estimates transaction costs by identifying imputed roundtrip trades and is defined as:
𝑅𝑅𝑅𝑅𝑅𝑅𝑅𝑅𝑅 =Pmax − Pmin
Pmax
Inter-quartile range (IQR) Inter-quartile range (IQR) is defined as the difference between the 75th percentile and 25th percentile of prices for one day normalized by the average price on that day (Helwege, Huang, and Wang (2013)), i.e.,
,75 ,25
100i th i th
i t tt i
t
p pIQRp−
= ×
Range Range, the volatility impact measure used by Downing, Underwood and Xing (2005), is defined as follows:
𝑅𝑅𝑅𝑅𝑅𝑡i =[ 𝑚𝑅𝑚𝑗(𝑅i
𝑗,𝑡)−𝑚𝑅𝑅𝑗(𝑅i𝑗,𝑡)]/𝑅i
𝑡 𝑚 100
𝑄𝑡i
Panel B: Bond ratings Credit rating Based on S&P credit rating, using a conversion process in which AAA-
rated bonds are assigned a value of 1 and C-rated bonds receive a value of 21.
Below-investment grade dummy
Dummy variables that equals one if S&P rating is BB+ or below, and zero otherwise.
Panel C: Dependent variables Acquisition dummy Dummy variable that equals one if a firms makes at least one acquisition
during the fiscal year. Capital Investment Following Titman, Wei, and Xie (2004), we compute the abnormal capital
investment (CIt) in year t-1 as follows:
𝐶𝐶𝑡−1 =𝐶𝐶𝑡−1
(𝐶𝐶𝑡−2 + 𝐶𝐶𝑡−3 + 𝐶𝐶𝑡−4)/3− 1
M/B Market value of assets divided over book value of assets. Price-to-earnings Market value of equity over operating income after depreciation. Equity-to-assets Market value of equity over market value of assets. Earnings-to-assets Operating income after depreciation over book value of assets. Market value of assets Market value of equity plus book value of assets minus book value of
equity minus balance sheet deferred taxes.

25
Panel D: Control variables Firm Size Log of book value of total assets. Leverage Book value of debt divided over market value of total assets. Cash/Total Assets Cash holdings, scaled by book value of total assets. Stock return Compounded daily excess (over the CRSP value-weighted index) returns
over prior fiscal year. ROA Net income, scaled by book value of total assets. Depreciation/Sales Depreciation, scaled by sales. Sales growth Change in sales. R&D/sales Research and development expense, scaled by sales. Intangible assets/total assets
Intangible assets, scaled by book value of total assets.
Industry M&A activity The value of all corporate control transactions for $1 million or more reported by ThomsonOne for each prior year and Fama-French 48 industry (Fama and French (1997)) divided by the total book value of assets of all Compustat firms in the same Fama-French industry and year.
26
Table 1. Summary Statistics This table presents summary statistics of firm characteristics, based on a sample of 1,227 firms over the period 2002-2011 (6,664 firm-years). Variable definitions are in the Appendix.
Mean St. Dev.
25th percentile
Median 75th percentile
Panel A: Firm characteristics
Firm size (in billions) 41.45 183.92 2.33 6.37 19.86
M/B 1.54 0.74 1.08 1.32 1.73 Leverage 0.24 0.17 0.11 0.21 0.33 Cash/Total Assets 0.09 0.11 0.02 0.06 0.13 Stock return -0.07 0.25 -0.21 -0.10 -0.02 ROA 0.03 0.11 0.01 0.04 0.07 Amihud ratio (in basis points) 80.95 74.47 34.44 58.87 102.72 Junk dummy (BB+ or lower) 0.46 0.50 - - - New debt issue in prior fiscal year 0.38 0.49 - - - Conducted acquisition during fiscal year 0.13 0.34 - - -
27
Table 2. Pearson Correlation Matrix
This table presents correlation matrix of measures of bond liquidty with firm characteristics, based on a sample of 1,227 firms over the period 2002-2011 (6,664 firm-years).
Amihud ratio
Firm size
M/B Leverage ROA Stock illiquidity
Junk
Amihud ratio 1 0.10 -0.15 0.05 -0.11 -0.04 -0.08
Firm size 1 -0.17 -0.17 0.07 0.07 -0.52
M/B 1 -0.35 0.27 0.03 -0.09
Leverage 1 -0.33 -0.10 0.35
ROA 1 0.09 -0.22
Stock illiquidity 1 -0.05
Junk 1
28
Table 3. Likelihood of making acquisitions – Univariate results This table presents the percent of firms undertaking acquisitions, based on a sample of 1,227 firms over the period 2002-2011 (6,664 firm-years) for sub-samples of firms with high and low bond liquidity. Firms are classified as having low bond liquidity if the Amihud measure is above the median, otherwise firms are classified as having high bond liquidity. Firm size is measured by the log of total assets. Firms are classified as high stock liquidity if Amihud measure is above the median, and are classified as having low stock liquidity otherwise. Differences in the frequency of acquisitions between firms with low and high liquidity are based on the chi-squared test. *, **, *** denotes significance at 0.10, 0.05, 0.01 levels, respectively.
Likelihood of making an acquisition
Low
Liquidity High
Liquidity Difference
Full Sample 7.4% 12.7% 5.3%*** 2002-2006 12.6% 15.4% 2.9%* 2007-2012 6.0% 8.1% 2.1%* Size terciles Tercile 1 (smallest) 8.3% 15.8% 7.4%*** Tercile 2 8.9% 12.3% 3.4%* Tercile 3 (largest) 6.0% 9.1% 3.1%* Stock liquidity Low stock liquidity 11.9% 14.9% 3.0%* High stock liquidity 5.2% 10.0% 4.8%***
29
Table 4. Probability of making an acquisition – Baseline analysis This table tests the relationship between bond liquidity and the likelihood of undertaking an acquisition. It presents estimates from a pooled probit regression, based on a sample of 1,227 firms over the period 2002-2011. The dependent variable in Models 1-5 is the dummy variable that equals one if a firm undertakes an acquisition, and zero otherwise. In parentheses are standard errors adjusted for heteroskedasticity (White, 1980) and clustered by firm. *, **, *** denotes significance at 0.10, 0.05, 0.01 levels, respectively. All regressions include year fixed effects, whose coefficients are suppressed. Variable definitions are in the Appendix.
Dummy=1 if a firm makes an acquisition (1) (2) (3) (4) (5) Amihud ratio -8.504**
(3.443)
Roll
-15.717*** (5.399)
Roundtrip
-11.069** (5.507)
Inter-quartile range
-0.211** (0.087)
Range
-0.184*** (0.070)
Credit rating -0.026** (0.013)
-0.032** (0.015)
-0.023* (0.013)
-0.023* (0.013)
-0.026** (0.013)
Junk dummy 0.096 (0.089)
0.095 (0.098)
0.103 (0.089)
0.095 (0.090)
0.095 (0.089)
Stock illiquidity -0.005 (0.004)
-0.006*** (0.002)
-0.006 (0.004)
-0.006 (0.004)
-0.005 (0.004)
Firm size -0.037* (0.021)
-0.051** (0.024)
-0.031 (0.022)
-0.037* (0.021)
-0.043** (0.021)
M/B -0.021 (0.033)
-0.025 (0.040)
-0.015 (0.033)
-0.019 (0.033)
-0.023 (0.033)
Leverage -0.329** (0.165)
-0.375** (0.181)
-0.306* (0.166)
-0.318* (0.166)
-0.341** (0.166)
Cash/Total Assets 0.181 (0.226)
0.119 (0.248)
0.225 (0.224)
0.202 (0.225)
0.173 (0.226)
Stock return -0.093 (0.118)
-0.055 (0.127)
-0.083 (0.118)
-0.075 (0.118)
-0.086 (0.118)
ROA 0.940*** (0.261)
0.861*** (0.279)
0.918*** (0.264)
0.914*** (0.264)
0.936*** (0.261)
Ln (Sales growth) 0.271*** (0.091)
0.302*** (0.091)
0.274*** (0.092)
0.272*** (0.092)
0.270*** (0.091)
Intangibles/Total Assets 0.562*** (0.123)
0.552*** (0.130)
0.584*** (0.121)
0.574*** (0.122)
0.558*** (0.123)
Industry M&A 0.220 (0.657)
0.102 (0.763)
0.239 (0.656)
0.214 (0.658)
0.196 (0.657)
Pseudo R2 0.032 0.034 0.31 0.032 0.032 N 6,664 5,451 6,664 6,664 6,664
30
Table 5. Probability of making an acquisition – Reverse Causality This table tests the relationship between bond liquidity and the likelihood of undertaking an acquisition. It presents estimates from a pooled probit regression, based on a sample of 1,227 firms over the period 2002-2011. The dependent variable in Models 1-3 is the dummy variable that equals one if a firm undertakes an acquisition, and zero otherwise. In Model 2 we omit firms that issue debt in a year prior to the acquisition. In parentheses are standard errors adjusted for heteroskedasticity (White, 1980) and clustered by firm. *, **, *** denotes significance at 0.10, 0.05, 0.01 levels, respectively. All regressions include year fixed effects, whose coefficients are suppressed. Variable definitions are in the Appendix.
Dummy=1 if a firm makes an acquisition Controlling for
recent debt issues Omitting firms with recent debt
issues
Including lagged measures
(1) (2) (3) Amihud ratio -7.867**
(3.440) -7.364* (3.806)
Lagged Amihud
-7.395** (3.483)
New issue dummy 0.105** (0.043)
0.105** (0.049)
Credit rating -0.025* (0.013)
-0.013 (0.015)
-0.030** (0.015)
Junk dummy 0.089 (0.089)
0.059 (0.102)
0.078 (0.096)
Stock illiquidity -0.005 (0.004)
-0.004*** (0.001)
-0.004*** (0.002)
Firm size -0.046** (0.022)
-0.033 (0.025)
-0.054** (0.025)
M/B -0.023 (0.033)
-0.002 (0.039)
-0.002 (0.038)
Leverage -0.387** (0.165)
-0.712*** (0.214)
-0.395** (0.186)
Cash/Total Assets 0.183 (0.225)
-0.054 (0.295)
0.196 (0.251)
Stock return -0.084 (0.118)
-0.174 (0.158)
-0.088 (0.128)
ROA 0.945*** (0.262)
0.709*** (0.267)
0.650** (0.255)
Ln (Sales growth) 0.261*** (0.088)
0.292** (0.128)
0.334*** (0.096)
Intangibles/Total Assets 0.559*** (0.123)
0.656*** (0.143)
0.541*** (0.131)
Industry M&A 0.210 (0.659)
0.660 (0.781)
-0.015 (0.743)
Pseudo R2 0.033 0.040 0.033 N 6,664 4,072 5,362
31
Table 6. Probability of making an acquisition –Omitted variation This table tests the relationship between bond liquidity and the likelihood of undertaking an acquisition. It presents estimates from a two stage least squares estimation, based on a sample of 1,227 firms over the period 2002-2011. The first stage (Model 1) includes industry median amihud and median trading volume as instrumental variables. The second stage (Model 2) includes fitted value of amihud as a regressor. The dependent variable in Models 2 and 3 is the dummy variable that equals one if a firm undertakes an acquisition, and zero otherwise. Model 3 is based on a sample of all Compustat firms with credit rating over the period 2002-2005. In parentheses are standard errors adjusted for heteroskedasticity (White, 1980) and clustered by firm. *, **, *** denotes significance at 0.10, 0.05, 0.01 levels, respectively. All regressions include year fixed effects, whose coefficients are suppressed. Variable definitions are in the Appendix.
1st stage: Amihud ratio
2nd stage: Dummy=1 if a firm makes an
acquisition
Dummy=1 if a firm makes an
acquisition (1) (2) (3) Amihud ratio predicted
-9.704*** (2.099)
Industry median Amihud 0.888*** (0.059)
Post-TRACE dummy 0.123** (0.062)
Credit rating 0.000 (0.000)
-0.004 (0.003)
-0.045*** (0.017)
Junk dummy -0.001*** (0.000)
0.004 (0.020)
0.214** (0.097)
Stock illiquidity -0.000 (0.000)
-0.001** (0.000)
-0.045 (0.046)
Firm size 0.000 (0.000)
-0.007 (0.004)
0.028 (0.026)
M/B -0.000** (0.000)
-0.007 (0.008)
0.008 (0.035)
Leverage 0.002* (0.001)
-0.082*** (0.031)
-0.540** (0.227)
Cash/Total Assets -0.000 (0.001)
0.045 (0.051)
0.974 (0.882)
Stock return -0.000 (0.001)
-0.013 (0.023)
-0.244 (0.186)
ROA -0.004*** (0.001)
0.107** (0.046)
0.850* (0.443)
Ln (Sales growth) -0.001** (0.000)
0.033** (0.014)
0.252*** (0.095)
Intangibles/Total Assets -0.003*** (0.001)
0.100*** (0.031)
1.160*** (0.160)
Industry M&A 0.003 (0.003)
0.074 (0.180)
1.133* (0.656)
New issue dummy -0.001*** (0.000)
0.012 (0.010)
0.073 (0.051)
Observations 6,664 6,664 4,404 F-statistic/Pseudo R-squared 51.65 7.13 0.047
32
Table 7. Abnormal capital investment This table tests the relationship between bond liquidity and the abnormal capital investment, based on a sample of 1,227 firms over the period 2002-2011. Abnormal capital investment is defined following Titman et al. (2004). Model 1 presents estimates from an ordinary least squares estimation, in which the dependent variable is the abnormal capital investment. Model 2 presents estimates from two-stage least squares estimation. The first stage includes industry median amihud as instrumental variables. The second stage includes fitted value of amihud as a regressor. In parentheses are standard errors adjusted for heteroskedasticity (White, 1980) and clustered by firm. *, **, *** denotes significance at 0.10, 0.05, 0.01 levels, respectively. All regressions include industry and year fixed effects, whose coefficients are suppressed. Variable definitions are in the Appendix.
OLS: Capital investment
2nd stage: Capital investment
(1) (2) Amihud ratio -0.669*
(0.398)
Amihud ratio predicted
-3.206** (1.458)
Credit rating 0.003 (0.002)
0.004* (0.002)
Junk dummy -0.019 (0.018)
-0.023 (0.018)
Stock illiquidity -0.001*** (0.000)
-0.001*** (0.000)
Firm size -0.004 (0.003)
-0.003 (0.003)
M/B -0.036*** (0.006)
-0.037*** (0.006)
Leverage -0.030 (0.027)
-0.030 (0.027)
Cash/Total Assets -0.077* (0.040)
-0.079** (0.040)
Stock return 0.054** (0.022)
0.053** (0.022)
ROA 0.026 (0.035)
0.012 (0.035)
Ln (Sales growth) -0.001 (0.009)
-0.004 (0.010)
Intangibles/Total Assets -0.178*** (0.023)
-0.190*** (0.024)
New issue dummy -0.010 (0.007)
-0.013* (0.007)
Observations 6,664 6,664 R-squared 0.068 0.064
33
Table 8. Acquisitiveness and Financial Constraints Panel A: Univariate results Panel A presents the percent of firms undertaking acquisitions, based on a sample of 1,227 firms over the period 2002-2011 (6,664 firm-years) for sub-samples of firms with high and low bond liquidity. Firms are classified as having low bond liquidity if the Amihud measure is above the median, otherwise firms are classified as having high bond liquidity. Firms are classified as below-investment grade if S&P rating is BB+ or below, otherwise firms are classified as investment grade. Firm age is defined by the number of year on Compustat.
Likelihood of making an acquisition
Low Liquidity
High Liquidity
Difference
Credit rating
Below investment grade 6.3% 13.7% 7.4%*** Investment grade 8.2% 12.0% 3.8%*** Firm age Tercile 1 (Youngest) 9.4% 14.7% 5.3%*** Tercile 2 7.8% 14.5% 6.8%*** Tercile 3 (Oldest) 7.3% 7.5% 0.2%
34
Table 8. (continued) Panel B: Multivariate results This panel tests the relationship between bond liquidity and the likelihood of undertaking an acquisition for sub-samples, partitioned by credit rating (Models 1-2) and age terciles (Models 3-5). Firms are classified as below-investment grade if S&P rating is BB+ or below, otherwise firms are classified as investment grade. It presents estimates from a pooled probit regression, based on a sample of 1,227 firms over the period 2002-2011. The dependent variable is the dummy variable that equals one if a firm undertakes an acquisition, and zero otherwise. In parentheses are standard errors adjusted for heteroskedasticity (White, 1980) and clustered by firm. *, **, *** denotes significance at 0.10, 0.05, 0.01 levels, respectively. All regressions include year fixed effects, whose coefficients are suppressed. Variable definitions are in the Appendix.
Dummy=1 if a firm makes an acquisition Below
investment grade Investment
grade Age Tercile 1
(youngest) Age Tercile 2 Age Tercile 3
(oldest) (1) (2) (3) (4) (5) Amihud ratio -10.982*
(6.206) -6.916* (4.156)
-12.457** (5.893)
-10.750* (6.005)
1.048 (5.759)
Credit rating -0.024 (0.018)
-0.045** (0.021)
-0.015 (0.022)
-0.010 (0.024)
-0.067*** (0.024)
Junk dummy - - 0.166 (0.157)
-0.100 (0.151)
0.199 (0.163)
Stock illiquidity -0.005 (0.004)
-0.076 (0.055)
-0.003 (0.006)
-0.005 (0.005)
-0.167* (0.085)
Firm size -0.046 (0.031)
-0.062** (0.030)
-0.073** (0.032)
-0.061 (0.037)
0.011 (0.041)
M/B 0.074 (0.047)
-0.121** (0.056)
-0.010 (0.045)
0.053 (0.056)
-0.279*** (0.092)
Leverage -0.462** (0.224)
-0.218 (0.257)
-0.481** (0.211)
-0.101 (0.292)
-1.271** (0.521)
Cash/Total Assets 0.064 (0.290)
0.211 (0.360)
-0.125 (0.339)
-0.119 (0.349)
0.774 (0.567)
Stock return -0.057 (0.158)
-0.066 (0.192)
-0.274 (0.185)
0.138 (0.202)
-0.085 (0.262)
ROA 0.914*** (0.293)
1.518** (0.682)
0.836*** (0.293)
0.817* (0.491)
2.194** (0.877)
Ln (Sales growth) 0.240** (0.107)
0.205* (0.123)
0.198** (0.098)
0.268* (0.147)
0.536** (0.236)
Intangibles/Total Assets
0.654*** (0.177)
0.504*** (0.174)
0.293 (0.181)
0.767*** (0.206)
0.672*** (0.256)
Industry M&A -0.131 (1.025)
0.388 (0.889)
0.837 (1.008)
-0.872 (1.142)
0.002 (1.388)
New issue dummy 0.124** (0.062)
0.095 (0.061)
0.182** (0.072)
0.117 (0.071)
-0.017 (0.080)
Pseudo R2 0.049 0.066 0.045 0.048 0.039 N 3,097 3,567 2,408 2,249 2,007
35
Table 9. Market-to-book regressions This table tests the relationship between bond liquidity and market-to-book ratio and its components. It presents estimates from an ordinary least squares estimation, based on a sample of 1,227 firms over the period 2002-2011. The dependent variable in Model 1 is market-to-book ratio. In Model 2 the dependent variable is price-to-earnings ratio, in Model 3 the dependent variable is equity-to-assets ratio, and in Model 4 the dependent variable is earnings-to-assets ratio. In parentheses are standard errors adjusted for heteroskedasticity (White, 1980) and clustered by firm. *, **, *** denotes significance at 0.10, 0.05, 0.01 levels, respectively. All regressions include rating dummies, as well as industry and year fixed effects, whose coefficients are suppressed. Variable definitions are in the Appendix.
M/B Price-to-earnings
Equity-to-assets
Earnings-to-assets
(1) (2) (3) (4) Amihud -3.398***
(1.276) -4.077*** (1.473)
-3.139*** (0.398)
-0.331** (0.141)
Credit rating -0.020** (0.010)
0.018 (0.017)
-0.025*** (0.003)
-0.005*** (0.001)
Junk dummy -0.201*** (0.059)
-0.050 (0.109)
-0.033** (0.015)
-0.002 (0.005)
Stock illiquidity -0.002*** (0.000)
-0.000 (0.000)
0.000 (0.000)
-0.000** (0.000)
Firm size -0.108*** (0.018)
0.027 (0.021)
-0.047*** (0.004)
-0.008*** (0.001)
Leverage -0.826*** (0.110)
-0.370*** (0.142)
-
-0.026* (0.015)
Cash/Total Assets 1.654*** (0.259)
-0.156 (0.176)
0.347*** (0.045)
-0.008 (0.025)
Stock return -0.136*** (0.035)
-0.207 (0.201)
-0.058*** (0.014)
0.009* (0.005)
ROA 0.983*** (0.343)
0.253 (0.172)
0.536*** (0.091)
0.369*** (0.078)
Ln (Sales growth) 0.120*** (0.027)
-0.130 (0.153)
0.056*** (0.011)
0.031*** (0.007)
Intangibles/Total Assets -0.084 (0.097)
0.061 (0.167)
0.157*** (0.024)
0.035*** (0.008)
New issue dummy 0.026 (0.017)
-0.121** (0.056)
-0.013*** (0.005)
-0.001 (0.002)
N 6,025 6,025 6,025 6,025 adj. R2 0.342 0.002 0.572 0.460
36
Table 10. Market-to-book regressions – Endogeneity concerns This table tests the relationship between bond liquidity and market-to-book ratio. It presents estimates from an ordinary least squares estimation in Models 1 and 3. Model 2 presents estimates from two-stage least squares estimation. The first stage includes industry median amihud as instrumental variables. The second stage includes fitted value of amihud as a regressor. Models 1 and 2 are based on a sample of 1,227 firms over the period 2002-2011, Model 3 is based on a sample of all Compustat firms with credit rating over the period 2002-2005 (Model 3). In parentheses are standard errors adjusted for heteroskedasticity (White, 1980) and clustered by firm. *, **, *** denotes significance at 0.10, 0.05, 0.01 levels, respectively. All regressions include rating dummies, as well as industry and year fixed effects, whose coefficients are suppressed. Variable definitions are in the Appendix.
OLS: M/B 2nd stage: M/B OSL: M/B (1) (2) Amihud -1.389**
(0.637)
Amihud ratio predicted
-8.280** (3.574)
Post-TRACE dummy 0.057*** (0.022)
Credit rating -0.005 (0.014)
-0.018* (0.011)
-0.033** (0.014)
Junk dummy -0.165 (0.110)
-0.220*** (0.063)
0.036 (0.059)
Stock illiquidity 0.000 (0.001)
-0.002*** (0.001)
1.880 (1.191)
Firm size -0.254*** (0.026)
-0.106*** (0.018)
0.014 (0.074)
Leverage -1.752*** (0.086)
-0.739*** (0.097)
-1.875*** (0.200)
Cash/Total Assets 0.301** (0.133)
1.624*** (0.286)
11.211*** (2.480)
Stock return -0.121*** (0.026)
-0.101*** (0.038)
0.152** (0.070)
ROA -0.099 (0.097)
1.024*** (0.297)
0.108 (0.252)
Ln (Sales growth) 0.059** (0.024)
0.182*** (0.050)
0.011 (0.038)
Intangibles/Total Assets -0.660*** (0.141)
-0.139 (0.099)
-0.360 (0.317)
New issue dummy 0.010 (0.009)
0.036* (0.020)
-0.008 (0.014)
Firm fixed effects Yes No Yes Observations 6,664 6,664 4,404 F-statistic/Pseudo R-squared 51.65 7.13 0.04