Embed Size (px)
DESCRIPTION
About graphs and charts
Citation preview
Techniques
July/August 2004 THE TECHNICAL ANALYST 17
While most investors and traderswho use technical analysis have ahost of momentum oscillators andeven a few volume indicators theyconsult with in their daily analysis,few use the tools available tomeasure volatility. I believe volatil-ity is one of the most under-usedand least understood marketattributes, yet one of the most reli-able and effective tools we have atour disposal.
There have been numerous studies ofvolatility and the markets. These stud-
ies reach two important conclusions. One isthat volatility is mean reverting. The resultof mean reversion is that volatility cyclesfrom periods of high volatility to periods oflow volatility. A second characteristic ofvolatility is that it is auto-correlated. Auto-correlation refers to the fact that if volatili-ty rises today it is probable that it will risetomorrow. It's these two characteristics ofvolatility that result in a degree of pre-dictability that can benefit the analyst andinvestor.
For most US equity investors their expo-sure to measuring volatility in the markets islimited to the Volatility Index (VIX) for theS&P 500 and (VIXN) for the Nasdaq 100.These implied measures of volatility arederived from the option premiums for theunderlying index. However, the VIX andthe VIXN are limited in that the impliedvolatility they measure is restricted to theindices themselves and not individualissues. Because it could be perilous toassume that the volatility reading of anindex can be substituted for any one of itscomponents, market technicians havedeveloped numerous tools to measure the
volatility of an individual stock. Examplesinclude the Relative Volatility Index by D.Dorsey, Chaiken's Volatility by MarcChaiken and Bollinger Bands developed byJohn Bollinger.
With the tools we now have at our disposalthere is no reason an analyst can't create avolatility index for any stock or any index.In this article I am going to show a simplemethod for how we can create a volatilityindex for any individual stock usingBollinger Bands and discuss how we canuse volatility to improve our investmenttiming and analysis.
Bollinger Bands as a measure of volatility
To start, we should first explore the rela-tionship between implied volatility and his-torical volatility. (Historical volatility for thisdiscussion is defined as the standard devia-tion of the logarithmic price change ofclosing prices over a trailing ten week peri-
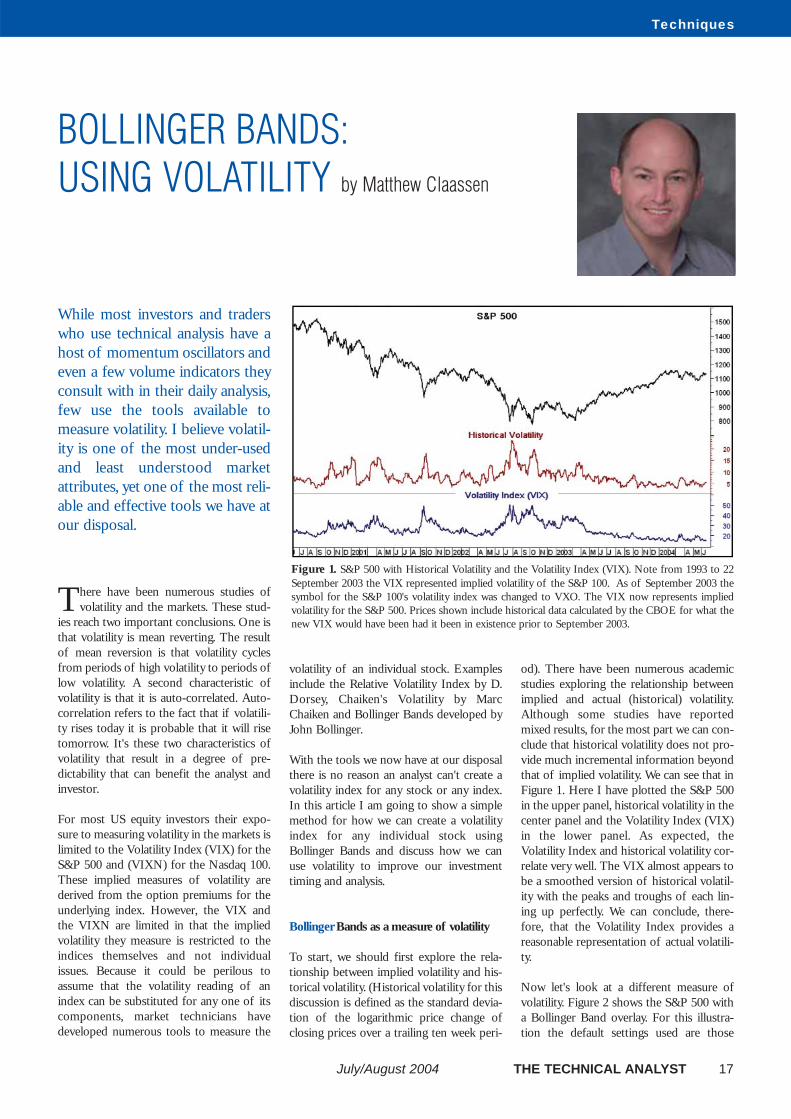
od). There have been numerous academicstudies exploring the relationship betweenimplied and actual (historical) volatility.Although some studies have reportedmixed results, for the most part we can con-clude that historical volatility does not pro-vide much incremental information beyondthat of implied volatility. We can see that inFigure 1. Here I have plotted the S&P 500in the upper panel, historical volatility in thecenter panel and the Volatility Index (VIX)in the lower panel. As expected, theVolatility Index and historical volatility cor-relate very well. The VIX almost appears tobe a smoothed version of historical volatil-ity with the peaks and troughs of each lin-ing up perfectly. We can conclude, there-fore, that the Volatility Index provides areasonable representation of actual volatili-ty.
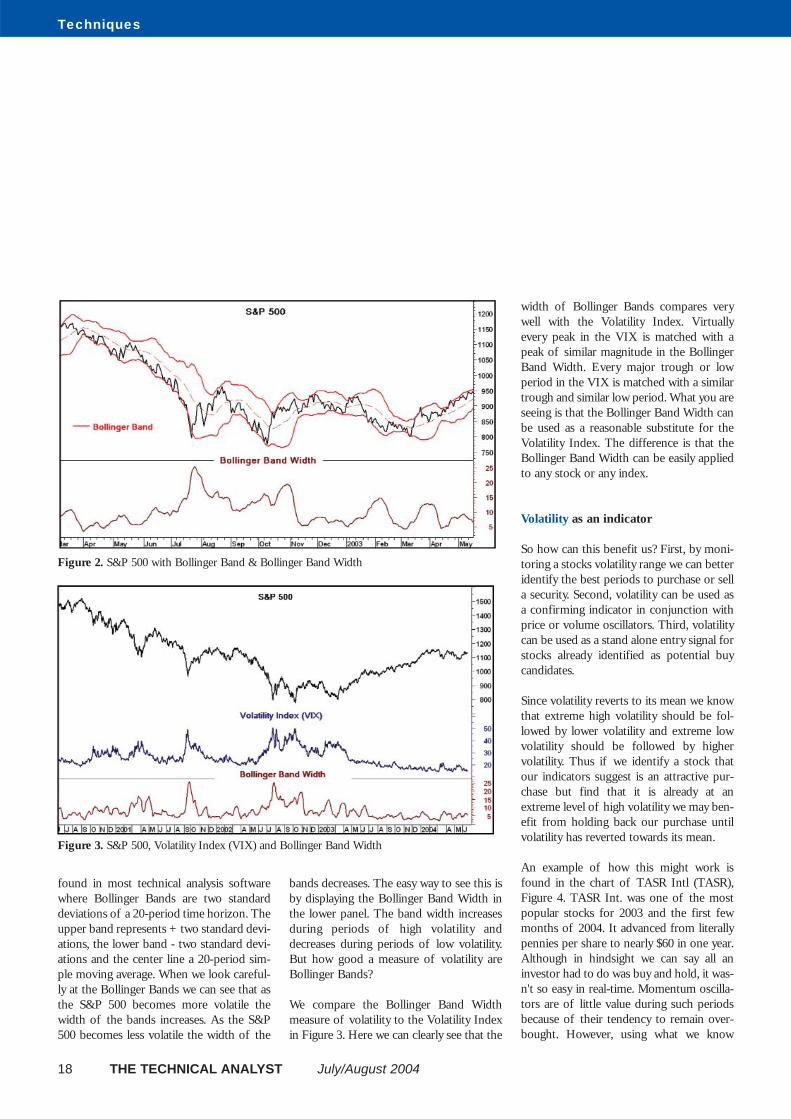
Now let's look at a different measure ofvolatility. Figure 2 shows the S&P 500 witha Bollinger Band overlay. For this illustra-tion the default settings used are those
BOLLINGER BANDS: USING VOLATILITY by Matthew Claassen
Figure 1. S&P 500 with Historical Volatility and the Volatility Index (VIX). Note from 1993 to 22September 2003 the VIX represented implied volatility of the S&P 100. As of September 2003 thesymbol for the S&P 100's volatility index was changed to VXO. The VIX now represents impliedvolatility for the S&P 500. Prices shown include historical data calculated by the CBOE for what thenew VIX would have been had it been in existence prior to September 2003.
18 THE TECHNICAL ANALYST July/August 2004
Techniques
found in most technical analysis softwarewhere Bollinger Bands are two standarddeviations of a 20-period time horizon. Theupper band represents + two standard devi-ations, the lower band - two standard devi-ations and the center line a 20-period sim-ple moving average. When we look careful-ly at the Bollinger Bands we can see that asthe S&P 500 becomes more volatile thewidth of the bands increases. As the S&P500 becomes less volatile the width of the
bands decreases. The easy way to see this isby displaying the Bollinger Band Width inthe lower panel. The band width increasesduring periods of high volatility anddecreases during periods of low volatility.But how good a measure of volatility areBollinger Bands?
We compare the Bollinger Band Widthmeasure of volatility to the Volatility Indexin Figure 3. Here we can clearly see that the
width of Bollinger Bands compares verywell with the Volatility Index. Virtuallyevery peak in the VIX is matched with apeak of similar magnitude in the BollingerBand Width. Every major trough or lowperiod in the VIX is matched with a similartrough and similar low period. What you areseeing is that the Bollinger Band Width canbe used as a reasonable substitute for theVolatility Index. The difference is that theBollinger Band Width can be easily appliedto any stock or any index.
Volatility as an indicator
So how can this benefit us? First, by moni-toring a stocks volatility range we can betteridentify the best periods to purchase or sella security. Second, volatility can be used asa confirming indicator in conjunction withprice or volume oscillators. Third, volatilitycan be used as a stand alone entry signal forstocks already identified as potential buycandidates.
Since volatility reverts to its mean we knowthat extreme high volatility should be fol-lowed by lower volatility and extreme lowvolatility should be followed by highervolatility. Thus if we identify a stock thatour indicators suggest is an attractive pur-chase but find that it is already at anextreme level of high volatility we may ben-efit from holding back our purchase untilvolatility has reverted towards its mean.
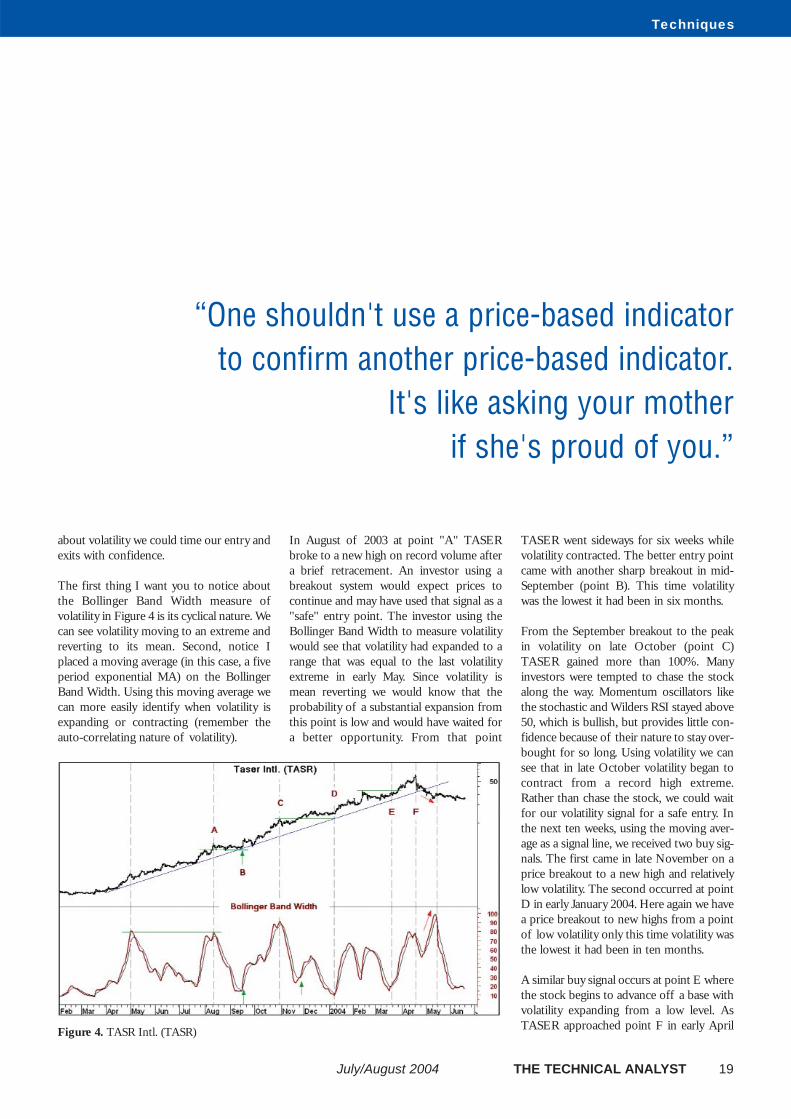
An example of how this might work isfound in the chart of TASR Intl (TASR),Figure 4. TASR Int. was one of the mostpopular stocks for 2003 and the first fewmonths of 2004. It advanced from literallypennies per share to nearly $60 in one year.Although in hindsight we can say all aninvestor had to do was buy and hold, it was-n't so easy in real-time. Momentum oscilla-tors are of little value during such periodsbecause of their tendency to remain over-bought. However, using what we know
Figure 3. S&P 500, Volatility Index (VIX) and Bollinger Band Width
Figure 2. S&P 500 with Bollinger Band & Bollinger Band Width
Techniques
July/August 2004 THE TECHNICAL ANALYST 19
about volatility we could time our entry andexits with confidence.
The first thing I want you to notice aboutthe Bollinger Band Width measure ofvolatility in Figure 4 is its cyclical nature. Wecan see volatility moving to an extreme andreverting to its mean. Second, notice Iplaced a moving average (in this case, a fiveperiod exponential MA) on the BollingerBand Width. Using this moving average wecan more easily identify when volatility isexpanding or contracting (remember theauto-correlating nature of volatility).
In August of 2003 at point "A" TASERbroke to a new high on record volume aftera brief retracement. An investor using abreakout system would expect prices tocontinue and may have used that signal as a"safe" entry point. The investor using theBollinger Band Width to measure volatilitywould see that volatility had expanded to arange that was equal to the last volatilityextreme in early May. Since volatility ismean reverting we would know that theprobability of a substantial expansion fromthis point is low and would have waited fora better opportunity. From that point
TASER went sideways for six weeks whilevolatility contracted. The better entry pointcame with another sharp breakout in mid-September (point B). This time volatilitywas the lowest it had been in six months.
From the September breakout to the peakin volatility on late October (point C)TASER gained more than 100%. Manyinvestors were tempted to chase the stockalong the way. Momentum oscillators likethe stochastic and Wilders RSI stayed above50, which is bullish, but provides little con-fidence because of their nature to stay over-bought for so long. Using volatility we cansee that in late October volatility began tocontract from a record high extreme.Rather than chase the stock, we could waitfor our volatility signal for a safe entry. Inthe next ten weeks, using the moving aver-age as a signal line, we received two buy sig-nals. The first came in late November on aprice breakout to a new high and relativelylow volatility. The second occurred at pointD in early January 2004. Here again we havea price breakout to new highs from a pointof low volatility only this time volatility wasthe lowest it had been in ten months.
A similar buy signal occurs at point E wherethe stock begins to advance off a base withvolatility expanding from a low level. AsTASER approached point F in early AprilFigure 4. TASR Intl. (TASR)
“One shouldn't use a price-based indicator to confirm another price-based indicator.
It's like asking your mother if she's proud of you.”
Techniques
2004, we know that volatility has expandedto its highest point in six months and isoverbought. At point F, volatility is begin-ning to contract from this high level andshortly after TASER tested its trend-line.It's after point F that I believe volatility pro-vides us with the most intriguing signal.From its April 2004 peak, volatility at firstcontracts along with TASER's price. Thenin mid-April volatility expands as the priceof TASER continues to decline. Up to thispoint volatility expanded when the stockwas advancing and contracted duringcounter trend moves. This is the first timesince TASER began its up-trend thatvolatility expanded while the stock's pricedeclined. This brings us to another impor-tant characteristic of volatility; volatility isnot directional. In other words volatility canexpand or contract while the underlyingsecurity is moving in either direction.
To the analyst, the expansion of volatilitywhile the stock price of TASER declined inlate April 2004 should tell us that the stockhas undergone an important change ofcharacter. That this change is occurringshortly after an important trend-line break
supports the conclusion that the up-trendfrom April 2003 to April 2004 is being cor-rected.
A supporting role
One shouldn't use a price-based indicatorto confirm another price-based indicator.It's like asking your mother if she's proudof you. Of course we know what theanswer will be. Instead I prefer to combineindicators based on price, volume andvolatility. This way our indicators are eachbased on different aspects of the market.When they all confirm I know the probabil-ity is they are sending me the correct mes-sage.
I had suggested earlier that volatility can beused as a confirming indicator in support ofmomentum oscillators. The Bollinger BandWidth is an ideal tool to combine with priceand volume indicators to help analyse aninvestment.
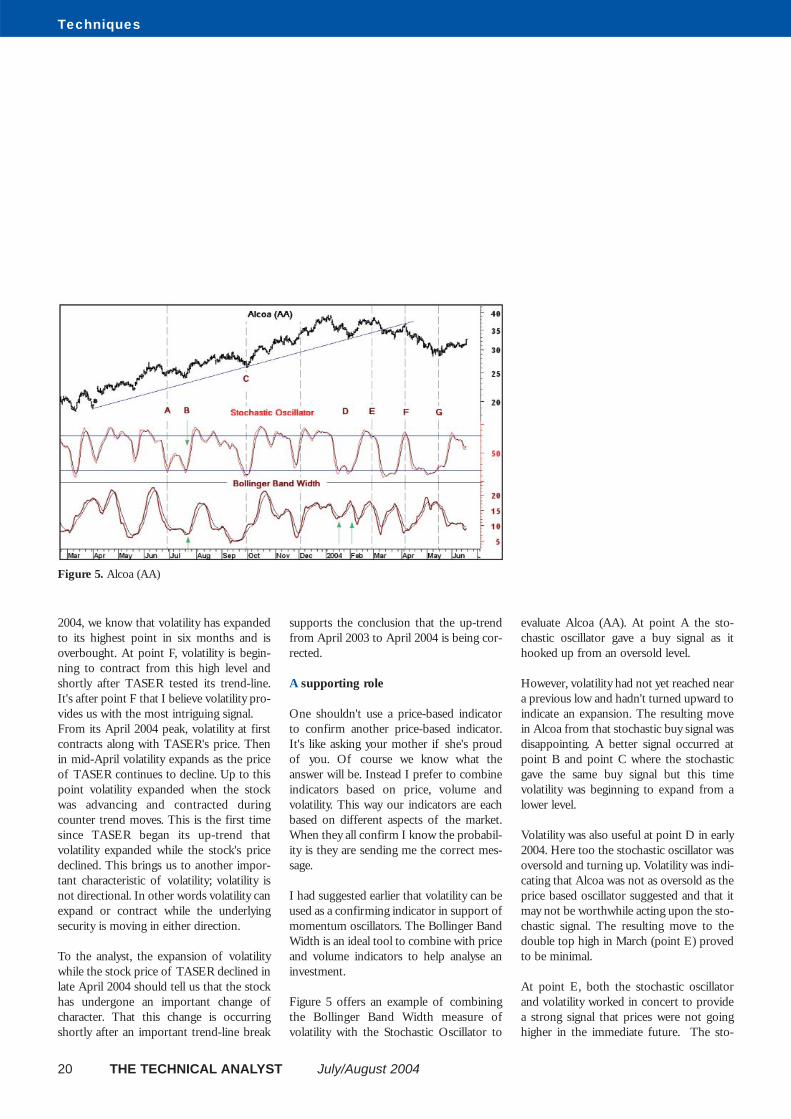
Figure 5 offers an example of combiningthe Bollinger Band Width measure ofvolatility with the Stochastic Oscillator to
evaluate Alcoa (AA). At point A the sto-chastic oscillator gave a buy signal as ithooked up from an oversold level.
However, volatility had not yet reached neara previous low and hadn't turned upward toindicate an expansion. The resulting movein Alcoa from that stochastic buy signal wasdisappointing. A better signal occurred atpoint B and point C where the stochasticgave the same buy signal but this timevolatility was beginning to expand from alower level.
Volatility was also useful at point D in early2004. Here too the stochastic oscillator wasoversold and turning up. Volatility was indi-cating that Alcoa was not as oversold as theprice based oscillator suggested and that itmay not be worthwhile acting upon the sto-chastic signal. The resulting move to thedouble top high in March (point E) provedto be minimal.
At point E, both the stochastic oscillatorand volatility worked in concert to providea strong signal that prices were not goinghigher in the immediate future. The sto-
20 THE TECHNICAL ANALYST July/August 2004
Figure 5. Alcoa (AA)
Techniques
July/August 2004 THE TECHNICAL ANALYST 21
chastic oscillator gave a sell signal from itsoverbought range while volatility turneddown from a high point that had held forfour months.When Alcoa appeared to be testing itstrend-line resistance at point F the stochas-tic oscillator indicated that Alcoa was over-bought. At the same time volatility had con-tracted telling us that an expansion involatility was likely and that the ensuingprice trend could be strong. The price wentdown to point G where again both indica-tors worked in concert, this time to markthe low in price.
Rather than simply mimic the price oscilla-tor, the Bollinger Band Width adds value byshowing us a characteristic of the marketthat the price oscillator is simply not pro-grammed to do.
The Bollinger Squeeze
The Squeeze is one way of using theBollinger Band Width as a stand alone tool.It got its name from the look of theBollinger Bands during a period of pro-tracted low volatility. As volatility contracts
the bands narrow to a where they appear tosqueeze together. The expectation is thatthis period of extreme low volatility shouldbe followed by a period of extreme highvolatility. More often than not, the ensuingexpansion of volatility that is born from aBollinger Squeeze includes an explosivemove in the underlying stock.
The Bollinger Band Width allows us to useone of the simpler definitions of TheSqueeze as defined in John Bollinger's book"Bollinger on Bollinger Bands". A squeezeoccurs when the Bollinger Band Width isthe lowest value (narrowest) it has been insix months.
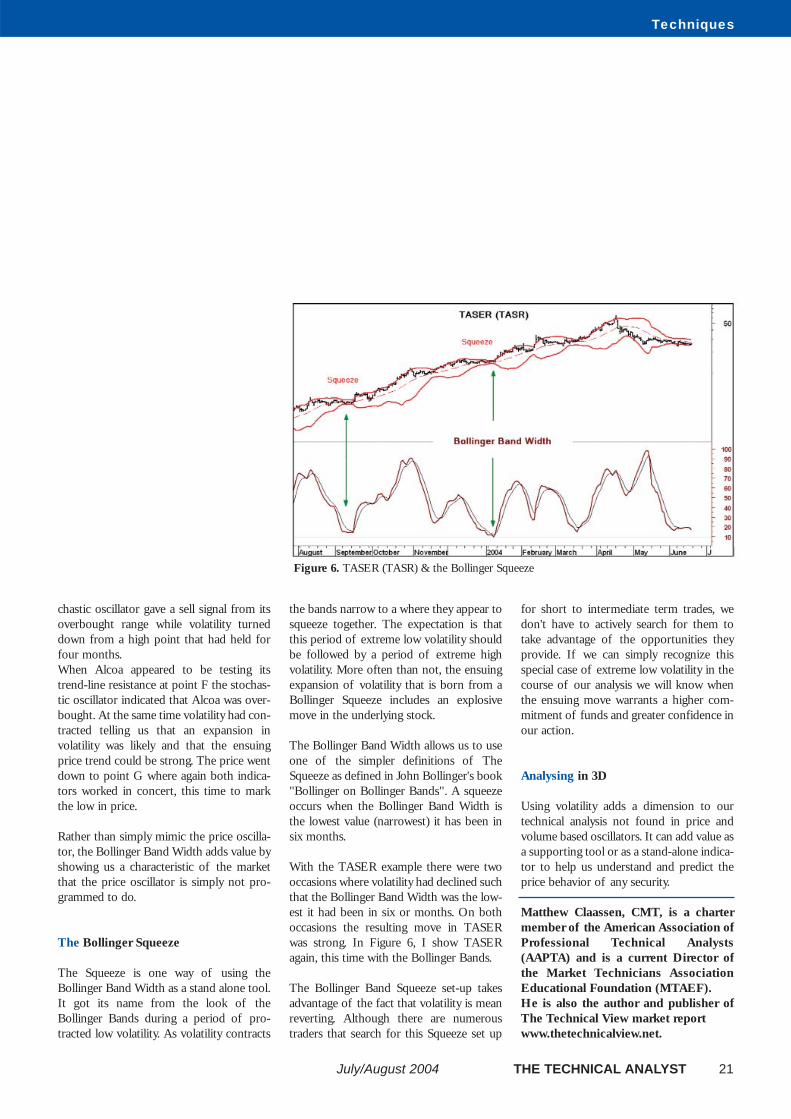
With the TASER example there were twooccasions where volatility had declined suchthat the Bollinger Band Width was the low-est it had been in six or months. On bothoccasions the resulting move in TASERwas strong. In Figure 6, I show TASERagain, this time with the Bollinger Bands.
The Bollinger Band Squeeze set-up takesadvantage of the fact that volatility is meanreverting. Although there are numeroustraders that search for this Squeeze set up
for short to intermediate term trades, wedon't have to actively search for them totake advantage of the opportunities theyprovide. If we can simply recognize thisspecial case of extreme low volatility in thecourse of our analysis we will know whenthe ensuing move warrants a higher com-mitment of funds and greater confidence inour action.
Analysing in 3D
Using volatility adds a dimension to ourtechnical analysis not found in price andvolume based oscillators. It can add value asa supporting tool or as a stand-alone indica-tor to help us understand and predict theprice behavior of any security.
Matthew Claassen, CMT, is a chartermember of the American Association ofProfessional Technical Analysts(AAPTA) and is a current Director ofthe Market Technicians AssociationEducational Foundation (MTAEF).He is also the author and publisher ofThe Technical View market reportwww.thetechnicalview.net.
Figure 6. TASER (TASR) & the Bollinger Squeeze


![Bollinger 9a1 mini_grammar[1]](https://img.pdfslide.us/doc/110x75/54c4829d4a7959d17c8b45ff/bollinger-9a1-minigrammar1.jpg)


![Bollinger Bands [ChartSchool]](https://img.pdfslide.us/doc/110x75/577c77fe1a28abe0548e462e/bollinger-bands-chartschool.jpg)