Embed Size (px)
Citation preview

Journal of Research of the National Bureau of Standards Vol. 45, No. 6, December 1950 Research Paper 2158
Boiling Points of Aqueous Solutions of Dextrose Within the Pressure Range of 200 to 1,500 Millimeters
By John 1. Torgesen, l Vincent E. Bower, and Edgar R. Smith
By using twin ebulliometers of t h e Swietoslawski type, with water as t he reference standard, data were obtained on t he vapor-pressure-tem perature relation ship for aqueous solutions of dextrose. The pressures ranged from 200 to 1,500 millimeters and t he concentrations of t he solutions from 10 to 60 percent of dextrose by weight . The vapor-pressuretemperature relationship is expressed by equations of th e form
in which p is t h e vapor pressure in standard m illimeter s of m ercury exer ted by a solut ion of a given concent ration at t he temperature, t, in degrees Celsiu s. A, E, and C are constants. The boiling-point elevations of aqueou s dextrose solutions at a given pressure are expressed by equations of t h e form
in which t:..t represents t he boiling-point elevation in degrees Celsius at a given pressure, C
is t he concentration in weight percentage of dextrose, and a, {3, 'Y, and il are constants.
I. Introduction
The boiling points and boiling-point elevations of aqueous solutions of dextrose within the pressure range of 200 to 1,500 mm and the concentration range of 10 to 60 percent of dextrose by weight are r eported in this paper. This work is part of a program sponsored by the Corn Industries R esearch Foundation to obtain physical data for materials of importance in the manufacture of various corn products.
The method used was a comparative dynamic one for m easuring successively, with the same thermometer, the boiling point of a given solution and that of water in twin ebulliometers connected to a manostat. A series of corresponding boiling points of the solutions and of water at various pressures was thus obtained. The values of f., the boiling point of a solution of dextrose, and tw, the corresponding boiling point of water at the various pressures were related by equations of the form
(1)
in which the constants a, b, and c for each concentration of dextrose were evaluated by the method of least squares. The values of fw and the corresponding pressures taken as reference standards were selected from the compilation of Osborne, Stimson and Ginnings [1] 2 and have previously been tabulated in convenient form [2].
No equation was found to relate the boiling points of the solutions to their concentrations, at a given pressure, with the precision of the experimental data. For this reason the boiling points of solutions
1 Researcb Associate at tbe ational Bureau of Standards, representing tbe Corn Industries Researcb Foundation.
, Figures in brackets indicate the literature references at the end of this paper.
of even values of concentration were obtained graphically by plotting I:!,.t , the boiling point elevation given by the difference between fs and f w, with respect to the concentration (or I:!,.fjconcentration versus concentration) . From the resultant series of curves, one for each of the standard reference pressures, the values of I:!,.t for even concentrations of dextrose were obtained, and the boiling points of the solutions were evaluated by adding the corresponding boiling point of water . These boiling points of the solutions were tabulated with their corresponding pressures and the constants A, B , and C in the Antoine equation [3]
(2)
were evaluated to obtain the relationship between vapor pressure and temperature for each of the several even concentrations. (The synlbol "log" is used in this paper to denote the logarithm to the base 10.) Equation 2 is explicit in temperature when written in t he form f = B j(A - log p) - C. Also
dp peA- log p)2 dt B log e . (3)
The best equation that was found to represen t the relationship bet'ween the measured boiling point elevations and the concentrations is of the form [4J
(4)
in which the constants Ct., {3, ,}" and li were evaluated by the method of least squares. But a comparison of the computed with the observed values of the boiling point elevation at a given pressure shows deviations that are several times larger than the precision of the original data.
458

'"'
I
L
II. Appara tus and Materials
Except for minor changes, the apparatus was the arne as described in a previous paper [2]. Two
simple barometric ebulliometers, of the type developed by Swietoslawski [5], were sealed to a manostat. In the ca e of the solution ebulliometer, a flask containing water 'was interposed to inhibit the loss of water vapor from the solution to the manostat. Pressures below atmospheric were obtained with a mechanical pump, and those above were obtained by the addition of nitrogen from a cylinder.
The solutions of dextrose were prepared from NBS Standard Sample dextrose previously dried in a vacuum oven at 60 0 to 70 0 0 for 6 hours and weighed into known weights of water. All concentrations, expressed in weight percentage on a vacuum basis, are corrected for the vapor and liquid hold-up that prevailed in the ebulliometer during the boiling procedure. Orystalline a-dextrose undergoes mutarotation in aqueous solution to form an equilibrium mixture of a- and {3-dextrose [6]. The rate of the conversion is dependent on the temperature and pH of the solution, and the equilibrium amounts of a- and ,8-dextrose present depend on the temperature and concentration of the solution. Hence the solutions studied cont,ained a mixture of a- and ,8-dextrose. However, since both forms possess identical molecular weights, no effect on the boiling point or the vapor pressure of a solution is to be expected as a result of different ratios of t he two isomeric forms at different temperatures and concentrations.
The solution ebulliometer was charged with a Imown weight and volume of solution, the water ebulliometer with the proper volume of distilled water and the filling tubes sealed off. Boiling temperatures were measured at as near the same boiling rate as could convenienLly be achieved, t he rate being controlled to return approximately 20 drops of condensate per minute to the boiler as observed in the drop-counter placed in the return tube. This boiling rate approximates the midpoint of the flat constant-temperature portion of the curve obtained by plotting boiling temperat lU"e with respect to boiling rate [5] and was determined by initial experiments. The comparative measurements of temperature were made with a platinum resistance thermometer (coiled filament type) and a Mueller thermometer bridge by the method described in another paper from this laboratory [7]. The temperatures were measured to 0.001 deg 0, with an average reproducibility of 0.002 to 0.003 deg 0 and an estimated accuracy of 0.005 deg 0 on the International T emperature Scale. It was not necessary to hold the bridge at constant temperature, as the temperature corrections to the r esistances were practically identical for the temperatures of the reference and measured substances in these comparative measurements.
The ratios of Lhe boiling points of the solutions to those of water at normal atmospheric pressure taken at the beginning Bnd end of a series of measurements did not differ by more than 0.008 percent in
the extreme case of the most concen trated solution. The average difference for the several concentrations studied was 0.003 percent. Refractive index mea urements on the original and boiled solutions \vere practically identical. It is believed that no significant change in concentration occurred during the boiling procedure, although the solutions of higher concentration assumed a slight yellowish tint, particularly after Coiling at the higher pressures. Specific rotations were not measured.
III. Experimental Results
The correction for the water vapor and liquid hold-up in the ebulliometer, to be applied to the concentrations of the solutions as originally prepare~, was det.ermined .experimentally by using solutlOns of sodIUm chlonde. For this purpose, a stopcock was sealed temporarily at the bottom of the solu tion ebulliometer for rapid withdrawal of samples 'while boiling. Solutions of sodium chloride of different known concentrations were placed in the solution ebulliometer and boiled in the usual fashion at ?-.orI?al atmospheric pressure. When boiling equillbnum had become established, as evidenced by steady boiling temperatures, a 25-ml sample was quickly withdrawn into a flask that was sLUTounded by ice water to minimize the loss of water vapor.
TABLE 1. Determination of ebulliometer hold-up
Original Boiling C harge concentra- BOiling conccntra- Hold-up tiol1 o[ rate Lion of
TaCl NaCl
g Percent Drops/min Percent g 65. 086 11. 760 12 11. 873 0. 62 65.110 11.760 20 11. 891 . 71 65. 135 11. 760 30 11.898 . 75 70. 008 22. 195 12 22.391 . 61 69. 963 22. 195 20 22.413 . 68 70.087 22.195 30 22. 440 . 76
The samples were analyzed for sodium chloride by evaporation to dryness in platinum dishes on a steam bath, followed by heating to incipient fu ion and weighing the sodium-chloride residue. The difference in concentration between the original and the boiling solution, together with the knowledge of the amount of original charge in the ebulliometer, provided data for the calculation of the hold-up of liquid and vapor while boiling was taking place at normal atmospheric pressure. It was assumed that the liquid hold-up remains essentially constant at all pressures involved. The vapor hold-up, which depends on the pressure and temperature, could be closely estimated from the knowledge of the free volume of the ebulliometer. Since this method of determining the hold-up may be of interest, the results are given in table 1. From these results, the amount of liquid and vapor hold-up at 20 drops a minute, which was the boiling rate employed in this work, was taken as 0.68 g, of which 0.61 g is attributed to liquid hold-up on the walls of the apparatu , and 0.07 g is a calculated value for the
459

TABLE 2. Corresponding boiling points of dextrose solutions and water
10.34- 21.26- 32.50- 40.31-percent Water percen t Water percent Water percent
solution solution solution solution
°C °C °C °C °C °C °C 100. 054 99.724 100.567 99.788 101. 286 99.869 101. 686 l00. 0f'3 99. 732 100.563 99. 783 101. 293 99.876 101. 685 94. 182 93. 863 94 . 267 93. 514 95.533 94. 163 95. 258 94 .200 93.881 94 . 273 93.520 87.802 86.490 87.725 86. 414 86. 109 86.927 86.207 81. 624 80. 358 80.303
86. 433 86. 128 86.940 86. 220 92.864 91. 513 93. 033 75. 946 75.652 76. 675 75. 992 101. 389 99.965 101. 483 75. 977 75. 684 76.704 76. 021 101. 653 100. 229 101. 701
100.261 99. 929 64.876 64 . 232 101. 653 100.233 101. 698 100. 2M 99.928 64 . 940 64 . 292 106. 877 105. 417 106. 970
105. 559 105. 218 78. 142 77. 455 111. 307 109. 798 111. 431 105. 562 105. 220 87.3&1 86. 638 11 5.220 113.683 115.416 109.860 109.507 94. 550 93.793 118.782 1I7.212 119.115 109. 8f'2 109.511 100. 616 99.832 122.419 120. 805 122. 526 113. 867 !l3. 508 100. 791 100.007 101. 522 100.098 116. 730
113.873 113.512 105. 994 105.186 110.091 117. 356 !l6.988 110. 293 109. 463 101. 731 117. 364 116. 994 114.495 113.649 120.838 120. 461 117.897 117.030 120. 844 120. 462 121. 007 120.118
118. 216 117.843 118. 224 ]]7.850 11 7.891 117. 023 114 .205 113.843 114. 405 113. 556 114.214 113.851 110. 298 J09.469 !l0. 450 110. 095 105. 852 105.044
110. 458 110.104 100.689 99. 907 106. 190 105.844 106.200 105.855 100.266 99.934 100. 230 99.896
100. 235 99.902 94.021 93.699 94 . 034 93.712 86.212 85.905 86.228 85. 922
76.098 75. 799 76.124 75.825 62. 585 62.297 62. 641 62.344 77. 031 76. 732
86.288 85.982
I 94. 084 93. 763
100. 080 99. 747
vapor hold-up at 750-mm pressure and the boiling temperatme. At 200- and 1,500-mm pressure the calculated vapor hold-up is 0.02 and 0.12 g, respectively, giving a total hold-up at these extreme pressures of 0.53 and 0.71 g, respectively, assuming that the liquid hold-up remains constant over this pressure range.
The comparative boiling points of dextrose solutions of several concentrations and water, in the order as actually measured, are given in table 2. The concentrations listed are those prevailing during the boiling procedure at 750-mm pressure. The change in concentration accompanying the change in vapor hold-up with variation of the pressure is small but can b e significant, particularly for the more concentrated solutions. For example, a 10-percent solution changes in concentration by - 0.01 percent at 200 mm and by + 0.01 percent of dextrose at 1,500 mm. A 50-percent solution changes by - 0.04 and + 0.04 percent at these extreme pressures .
By means of eq 1 the boiling points of the dextrose solutions were expressed as functions of the boiling points of water over the pressure range involved. The constants a, b, and c for each of the solutions are given in table 3. The average and maximum devia-
50.54- 59.69- 63.23-Water percent Water percent Water percent Water
solution solution solution
°C °C °C ' C °C °C °C 99.686 103.237 100.063 104.806 100.059 105.386 99. 867 99. 684 103.246 100. 072 104.813 100.066 101. 163 95. 745 93. 330 99. 271 96. 170 98.302 93.711 96.579 91. 272 85.879 103.323 100. 140 90.880 86.462 91. 387 86.222 78. 523 99. 134 96.044 80.696 76. 489 84.844 79. S09
91. 122 94.684 91. 673 69.077 65.092 76.686 71. 771 99.472 89.448 86. 522 90. 914 86. 488 105. 293 99. 742 99.686 82.844 SO. 011 104. 634 99.882 110.639 104.931 99.688 75. 432 72.705 111. 295 106.362 115.148 109.315
104. 898 103. 161 99.985 117.229 112. 147 119.269 113.303
109.306 103. 162 99. 990 122.262 117. 038 122. 863 116. 788 1I3. 248 108. 270 105. 011 125. 670 120. 369 126. 482 120.304 116.895 112.778 109. 442 116.143 111.123 105.324 99.795 120. 264 116.880 113. 457 104.542 99.828 114. 542 120.461 116.972
107. 987 123.864 120.324 99.722 103. 191 100. 031
I
tions of thc experimental points from those calculated by eq 1 with the appropriate constants are given in the last two columns. The average deviations increase from ± 0.002 deg C in the case of the more dilute solutions to ± 0.013 deg C for the most concentrated solu tion. An explanation for the increasing experimental deviations at higher concentrations of dextrose is that the boiling equilibrium in the latter cases is established with less certainty. The pumping action in the ebulliometers is probably less efficient because of the increased viscosity of the solutions and, also, the concentration of the solution in the boiler may vary due to incomplete mixing of ·the condensate with the highly concen trated solution.
The boiling temperatures of the solutions at the standard reference pressures were calculated by means of eq 1 with the constants from table 3. The difference b etween the boiling temperatures of solution and water at a given pressure represents the boiling-point elevation, D.t , at that pressure. For each reference pressure, D.t was plotted with respect to the concentration on a scale that permitted the plotting and reading of temperatures to ± 0.005 deg C and of concentrations to ± 0.01 p ercent of dextrose.
460
J
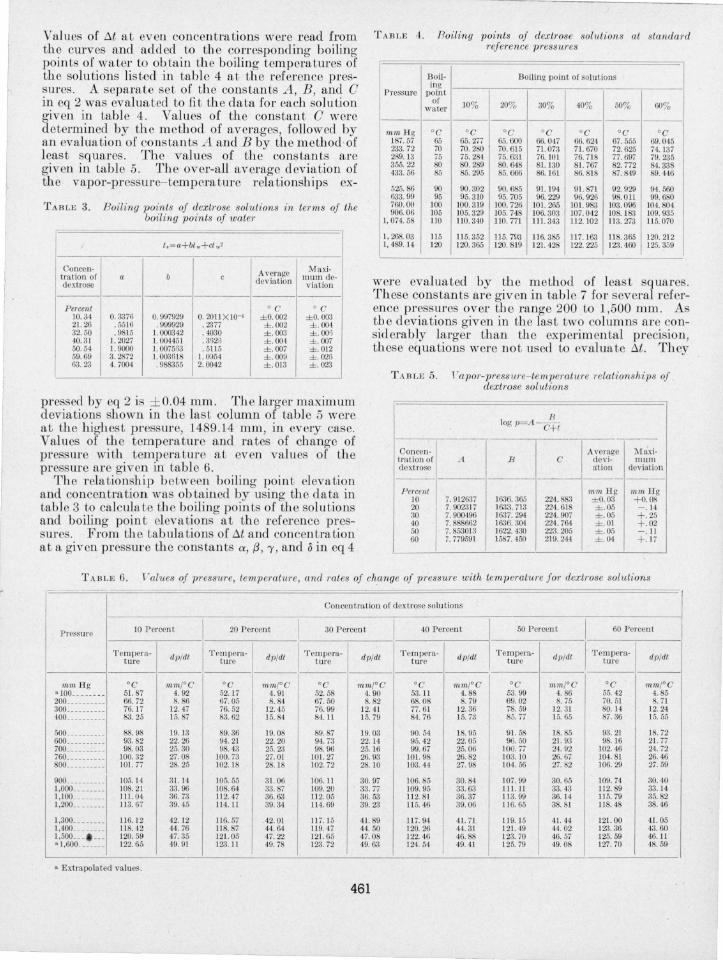
Values of tJ.l at even concentrations were read from th e curves and added to the corresponding boil ing points of water to ob tain the boiling temperatures of th e solutions listed in table 4 at the reference pres-ures. A separate set of the constants A, B, and 0
in eq 2 was evalua ted to fit the data for each solution O'iven in table 4. Values of the constant 0 were determined by the m ethod of averages, followed by an evaluation of constants A and B by the m ethod of least squares. Th e values of the constants are given in table 5. The over-all average d eviation of the vapor-pressure- temperature relationships ex-
TABLE 3. Boiling points of dextrose solutions in terms of the boiling points of water
t.=a+btw+ctw'
Conccn ~ Average J\[axi-tration of a b c mum de-dextrose deviation viation
-------Percent ° c ° c
10. J4 0.3376 0.997929 0. 201 1 X 10-' ± 0. 002 ±0. 003 21. 26 .55 16 . 999929 . 2377 ±. 002 ± . 004 32.50 .9 15 I. 000342 . 4030 ±. 003 ±. 00'i 40.3 1 1. 2027 1. 004451 . 3526 ±. 004 ±. 007 50.54 J. 9000 1.007563 .5 1] 5 ± . 007 ±. 012 59. 69 3.2872 ] . 003618 I. 0)54 ±. 009 ± . 026 63. 23 4. 7004 . 988355 2. 0042 ± . 013 ±. 023
pressed by eq 2 is ± 0.04 mm. The larger maximum deviations shown in th e la t column of table 5 were at th e high est pressure, 1489.14 mm, in every case. Values of the temperature and rates of ch ange of pressure with temperature at even values of th e pressure arc given in table 6.
The relationship b etween boiling point elevation and concentration was obtained by using th e data in table 3 to calcula te th e boiling points of the solu tions and boiling point elevations at th e reference pressures. From the tabulations of tJ.t and concen tration at a given pressure th e constan ts lX, {3 , 'Y , and 0 in eq 4
TABLE 4. Roiling points of dextl'ose solutions at standaTd reference press'W'es
Boil- Boiling pOint of solutions ing
Pressure point of 10% 20% 30% 40% 50% 60% wator
------------------------mmHg °c °c °C °C "C °U °C
187.57 65 65.277 65.600 66. 047 66. 624 67.555 69. 0'15 233.72 70 70. 280 70.615 7J. 073 71. 670 72.625 74 . 137 239. 13 75 75. 284 75.631 76. lOt 76.718 77. 697 79.235 355. 22 80 80.289 80. &18 81.130 81. 767 82.772 84. 338 433.56 85 85.295 85.666 86. 161 86.818 87. 8'19 89.446
525. 86 90 90.302 90.685 91.194 91.871 92.929 94.560 633.99 95 95.310 95. 705 96.229 96.926 98.011 99. 680 760.00 100 100.319 100. 726 101. 265 101. 983 103.096 104. 804 906.06 105 105.329 105. 748 106. 303 107.042 108. 183 109. 935
1, 074.58 110 110.340 110. 771 Ill. 343 112. 102 11 3.273 115.070
1. 268. 03 11 5 115.352 115.793 116.385 117. 163 !l8.365 120. 212 1,489.14 120 120.365 120. 819 121. 428 122. 225 123.460 125.359
were evaluated by the m ethod of least quares. These constants are given in table 7 for several reference pressures over th e range 200 to 1,500 mm. As th e deviation given in th e la t two colLuTIns al'e considerably larger than the exp erimental preei ion , the e equa tions were not u ed to evaluate tJ.t . They
T ABLE 5. !'apol'-pressU1'e- tempe1'Gture relationships of dextrose solutions
-
lOgp=A-~ +t
--------Concen- I A vcrage I Maxi-lra tionof A B C <levi- mum dextrose ation deviation
------Percent mm IIg mrn IIg
10 7. 912637 1636.365 224 .883 ± 0. 03 + 0. 08 20 7. 9023 17 J633.713 224 . 6J8 ± . 05 -. 14 30 7.900'196 1637.294 224.907 ±. 05 + . 25 40 7.888662 1636.3Q.1 22'1. 764 ±.Ol +.02 50 7. 8530 1 ~ 1622. 430 223.205 ± .05 -. 11 60 7.779591 1587. 450 219.24'1 ±. 04 + . li
TABLE 6. T'alues of pressure, tempe1'GtU1'e, and rates of change oJ pressure with tempe1'Gtw'e for dextrose solutions
Concentration of dext rose solu tions
Pressure 10 Percent 20 Percent I 30 Percent I
40 Perccnt 50 Percent I 60 Percent
T empcra - dp/dt 'rcmpera- d1)/dt I Tempera- d l1/dt rrcmpera- dp/dt Ternpcra- dp/dt I
'rempera- dp/dt tme Lure tllre ture Lure Lure
mmHg °C 1n71l,rC °C mmrC °C mm/oC °C mm/oC °c mm/oC °c ,,,,nr C 0100 ____ __ __ 5J. 87 4.92 52. 17 4.91 52.58 4.90 53. 11 4. 88 53.99 4.86 55.42 4.85 200 __________ 66. 72 8.86 67. 05 8.84 67.50 8.82 68.08 8.79 69. 02 8. 75 70.51 8.71 300 _____ __ ___ 76.17 12. 47 76.52 12.45 76.99 12. 4J 77. 61 12.36 78. 59 12.31 80.14 12.24 400 ____ ___ ___ 83.25 15.87 83.62 15.84 84.11 15. 79 84 . 76 J5.73 85.77 15.65 87.36 15. 55
500 __________ 88.98 19. J3 89.36 19. 08 89.87 19.03 90.54 18.95 91. 58 18.85 93. 21 J8. 72 600 __________ 93.82 22. 26 94.21 22.20 94.73 22. 14 95.42 22.05 96. 50 21. 93 98.16 21. 77 70L ________ 98.03 25.30 98. 43 25.23 98. 96 25.16 99. 67 25. 06 lOO.77 24.92 102. 46 24.72 760 __________ 100.32 27.08 100. i3 27.01 IOJ. 27 26.93 IOJ. 98 26. 2 103. 10 26.67 104. 81 26.46 80L ________ 101. 77 28. 25 102. J8 2 . 18 102. 72 28. 10 103. 44 27. 98 10'J.66 27.82 106. 29 27. 59
900 _________ _ 105.14 31. 14 J05.55 31. 06 106. U 30.97 t06.85 30.84 107. 99 30.65 109.74 30.40 1,000 ________ 108.21 33. 96 108. 64 33.87 J09. 20 33.77 109.95 33.63 111. Jl 33. 43 U2.89 33.14 1,100 ________ lIl. 04 36. 73 11 2. 47 36.63 Jl2.05 36.53 U 2.8J 36. 37 113. 99 36.14 U 5. 79 35.82 1,200 _____ ___ Jl3.67 39.45 114.11 39.34 114.69 39.23 11 5. 46 39.06 JJ6.65 38.81 U8.48 38. 46
1,300 ________ U6.1 2 'J2. J2 lt6.57 '12.01 117. 15 41. 89 II 7.94 41. il U9. 15 41. 44 121. 00 41.05 1,400 _______ _ 118.42 44.76 Jl8. 87 44.64 U9. 47 44.50 120.26 44.31 J 21. 49 44.02 J23.36 43. 60 1,500 ___ 120.59 '17.35 121. 05 47. 22 ]21. 65 47.08 122.46 46.88 123.70 46.57 125.59 46. 11 01,600. ______ 122.65 49. 9J 123. 11 49. 78 123. 72 49. 63 124. 54 49. 41 125. 79 49.08 127.70 48. 59
& Extrapolated valu es.
461

TABLE 7. Boiling-point elevation of dextrose solutions
log at=a+ IIC+"C2+cl C3
Pressure a fJ cl Average maximum
" deviation deviation
mmHg °C °C 233.72 -0.989843 5. 113375XIQ-' - 7. 377463X1O- 1 5.526503XIQ-' ±0.D17 +0.032 355.22 -.982743 5. 191070 -7.435453 5. 463234 ±.O23 + . 045 525. 86 - . 967871 5. 239106 -7. 477459 5. 427242 ±.O28 +.055 760.00 - . 944029 5.235447 -7. 427223 5.345987 ± . O3l +.061
1, 074.58 -.918243 5. 251193 -7.490898 5.396036 ±.O33 +.067 1,489. 14 -.885843 5.225459 I -7.476027 5. 404016 ±.O33 +.067
are useful, however, in calculating the boiling point elevations of dextrose solutions to within 0.05° to 0.1° C.
Molal boiling point elevations of aqueous solutions of dextrose have been measured by Juettner [8], but only at normal atmospheric pressure. A com-
TABLE 8. Molal boiling-point elevation of dextrose solutions (760 mm Hg)
Molal ity Jucttncr [8] 'l' his paper ---- -----·1----1
° Clmole ° Clmole I 0.53 0.520 2 . 53 . 525 3 .53 .53l
4 .. 537 5 . 544 6 .552
7 . 561 8 . 570 9 .580
Iournal of Research of the National Bureau of Standards
I
parison of his values with those of this investigation is given in table 8. Apparently, there are no other published measurements of the vapor pressures of aqueous solutions of dextrose in the range reported in this paper.
IV. References
[1] N . S. Osborne, H. F. Stimson, and D. C. Ginnings, J. Research N BS 23,261 (1939) RP1229.
[2] E. R. Smith, J. Research NBS 24, 229 (1940) RP1280. [3] G. W. Thomson, Chern. Rev. 38, 1 (1946). [4] F. J. Bates and Associates, Polarimetry, saccharimetry,
and the sugars, KBS Circular C440, p. 365 (1942). [5] W. Swietoslawski, Ebulliometry (Reinhold Publishing
Corp., New York, N. Y., 1945) . [6] H. S. I sbell and W. W. Pigman, J . Research NBS 18,
178 (1937) RP969. [7] E. R. Smith and H. Matheson, J . R esearch 1'<BS 20,
641 (1938) RP1097. [8] F. Juettner, Z. physik. Chern. 38, 76 (1901); Int. Crit •
Tables III , 327 (1928) •
WASHINGTON, July 17, 1950.
Vol. 45, No.6, December 1950 Research Paper 2159
Wavelengths for Calibration of Prism Spectrometers By Earle K. Plyer and C. Wilbur Peters 1
Several absorption bands of polystyrene, 1,2,4-trichiorobenzene, and other compounds have been measured in the infrared region from 1.5 to 24 p, Oll grating sp ectrometers. These bands hav e been determined "'ith sufficient accuracy fo r use in calibration of prism instruments. A table is included that gives the cell thicknesses used in the measurements. The emission lines of mercury for the region from 0.5 to 2.4 p, are included. In order that the tab le may be of most valu e, a number of bands that have been determined by previous observ ers h ave also been included.
Many infrared ahsorption bands have been carefully measured, and their reported wavelengths [1] 2
are useful for calibrating spectrometers. Techniques of calibration utilizing vibrational bands with resolved rotational structures, including those of ammonia, carbon dioxide, and water vapor, have been described by Oetjen, Kao, and Randall [2]. When one undertakes to calibrate an infrared spectrometcr he soon finds tha t additional reference lines or bands would be extrcmely helpful and that the information available has some serious disadvantages. In certain regions there are an insufficient number of
1 University of Micbigan. I Figures in brackets indicate tbe literature references at tbe end of tbis paper.
standards. In some cases where a band has a rotational fine structure that is not resolved by a prism, it is not possible to locate any individual band with sufficient precision to justify its use for calibration. Furthermore, some absorbing materials require impractically long absorption cells. To avoid these disadvantages and increase the number of calihration points, additional lines and bands in the region from the visible to 24 fJ- have been measured by using sources or absorbers convenient for the calibration of prism instruments. These include: (1) polystyrene films and trichlol'obenzene, which pro~e standards between 15 and 24 fJ- ; (2) AH-4 mercury lamp in the region visible to 24 fJ-; (3) toluene at 21.5 f.L;
462