Embed Size (px)
Citation preview
Body Fluid Dynamics: Back to the Future
Gautam Bhave* and Eric G. Neilson*†
*Division of Nephrology and Hypertension, Department of Medicine, Vanderbilt University School of Medicine,Nashville, Tennessee; and †Departments of Medicine and Cell and Molecular Biology, Feinberg School of Medicine,Northwestern University, Chicago, Illinois
ABSTRACTPioneering investigations conducted over a half century ago on tonicity, transcapillary fluid ex-change, and the distribution of water and solute serve as a foundation for understanding thephysiology of body fluid spaces. With passage of time, however, some of these concepts have losttheir connectivity to more contemporary information. Here we examine the physical forces deter-mining the compartmentalization of body fluid and its movement across capillary and cell membranebarriers, drawing particular attention to the interstitium operating as a dynamic interface for waterand solute distribution rather than as a static reservoir. Newer work now supports an evolving modelof body fluid dynamics that integrates exchangeable Na� stores and transcapillary dynamics withadvances in interstitial matrix biology.
J Am Soc Nephrol 22: 2166 –2181, 2011. doi: 10.1681/ASN.2011080865
Transcapillary movement of water and solutebetween cells and extracellular compartmentsinterfaces with powerful physical forces residingin the interstitial matrix. A modern view ofbody fluid spaces hinges on reconnecting histor-ical principles with this new and emerging dy-namic.
Compartmentalization of Body WaterThe content of total body water (TBW) is a phys-iologic function of tissue composition leading toqualitatively predictable alterations with age,gender, and body weight. Most tissues such asskin, muscle, visceral organs, and brain consist of70 to 80% water by weight, whereas adipose tis-sue and bone are only 10 to 20% water. TBWreflects a weighted average of tissue water contentwith relatively lower values in subjects withgreater adiposity or lower muscle mass. Relativeto weight, women and elderly individuals gener-ally have less body water because of higher con-tent of body fat or preferential loss of musclemass with age, respectively. TBW increases withobesity but decreases relative to body weight withthe gain of relatively drier adipose tissue.1,2
Nephrologists routinely estimate TBW to
gauge electrolyte and fluid deficits with hypovo-lemia or hypertonicity, assess dialytic adequacyusing TBW as a surrogate for the volume of dis-tribution of urea, guide drug dosing, and ratio-nalize dialytic clearance of toxins. TBW is classi-cally estimated as 60% of body weight in men and50% of body weight in women deducting 5%for elderly patients.3 Given physiologic variationin body tissue composition, early investigatorsrecognized that absolute weight-based rules ofestimation apply only to a select populationof healthy individuals4 and subsequently derivedregression equations better predict TBW ina broader range of subjects. Anthropomorphicequations including age, gender, ethnicity,weight, and height are now available to im-
Published online ahead of print. Publication date available atwww.jasn.org.
Correspondence: Dr. Gautam (Jay) Bhave, Division of Nephrol-ogy and Hypertension, Department of Medicine, S3223 MedicalCenter North, Vanderbilt University School of Medicine, Nash-ville, TN 37232-2372. Phone: 615-322-4794; Fax: 615-343-7156;E-mail: [email protected]
Copyright © 2011 by the American Society of Nephrology
BRIEF REVIEW www.jasn.org
2166 ISSN : 1046-6673/2212-2166 J Am Soc Nephrol 22: 2166–2181, 2011
prove the accuracy of estimation (see supplemental mate-rial).5–7
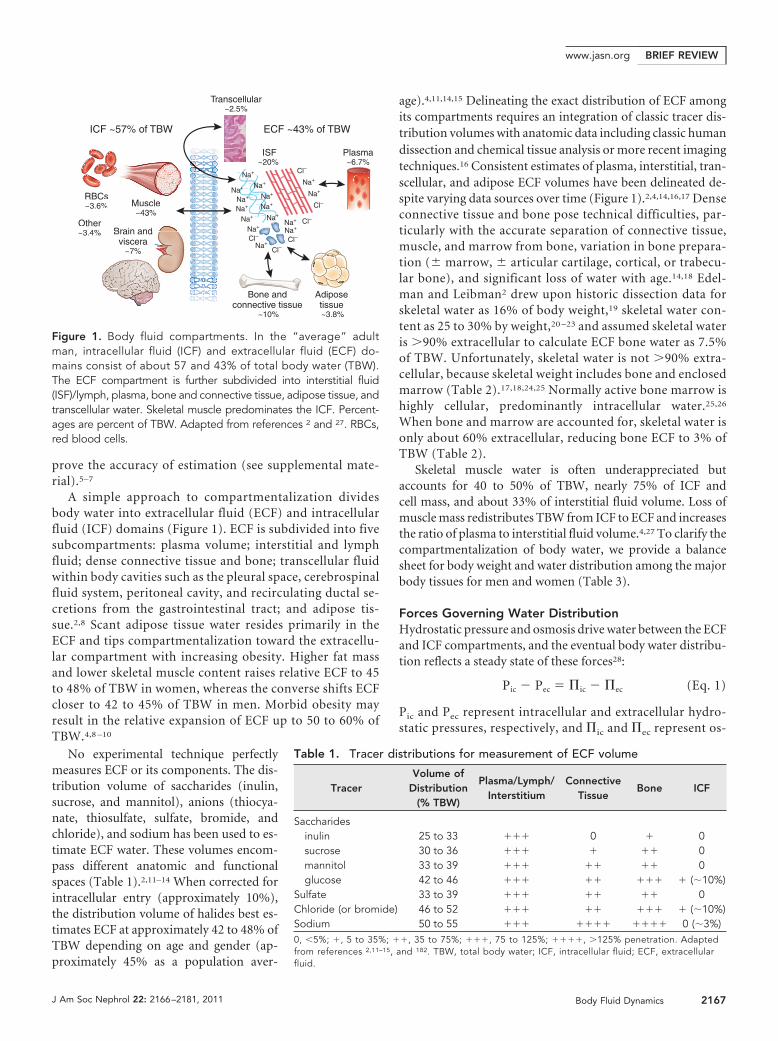
A simple approach to compartmentalization dividesbody water into extracellular fluid (ECF) and intracellularfluid (ICF) domains (Figure 1). ECF is subdivided into fivesubcompartments: plasma volume; interstitial and lymphfluid; dense connective tissue and bone; transcellular fluidwithin body cavities such as the pleural space, cerebrospinalfluid system, peritoneal cavity, and recirculating ductal se-cretions from the gastrointestinal tract; and adipose tis-sue.2,8 Scant adipose tissue water resides primarily in theECF and tips compartmentalization toward the extracellu-lar compartment with increasing obesity. Higher fat massand lower skeletal muscle content raises relative ECF to 45to 48% of TBW in women, whereas the converse shifts ECFcloser to 42 to 45% of TBW in men. Morbid obesity mayresult in the relative expansion of ECF up to 50 to 60% ofTBW.4,8 –10
No experimental technique perfectlymeasures ECF or its components. The dis-tribution volume of saccharides (inulin,sucrose, and mannitol), anions (thiocya-nate, thiosulfate, sulfate, bromide, andchloride), and sodium has been used to es-timate ECF water. These volumes encom-pass different anatomic and functionalspaces (Table 1).2,11–14 When corrected forintracellular entry (approximately 10%),the distribution volume of halides best es-timates ECF at approximately 42 to 48% ofTBW depending on age and gender (ap-proximately 45% as a population aver-
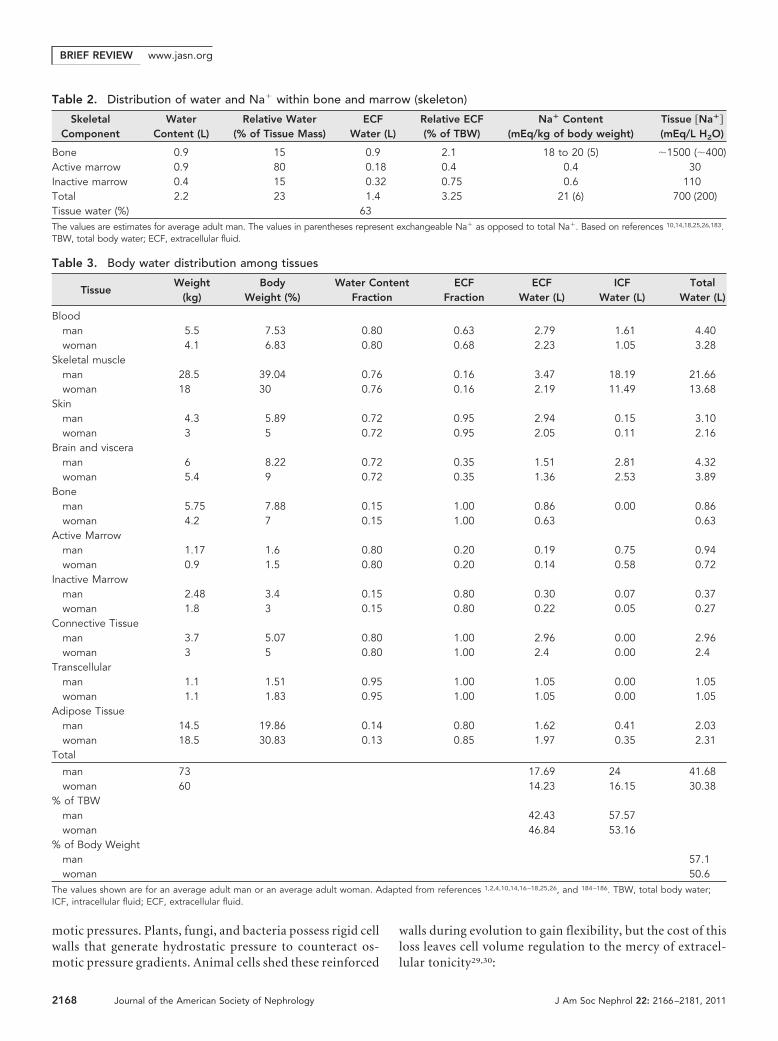
age).4,11,14,15 Delineating the exact distribution of ECF amongits compartments requires an integration of classic tracer dis-tribution volumes with anatomic data including classic humandissection and chemical tissue analysis or more recent imagingtechniques.16 Consistent estimates of plasma, interstitial, tran-scellular, and adipose ECF volumes have been delineated de-spite varying data sources over time (Figure 1).2,4,14,16,17 Denseconnective tissue and bone pose technical difficulties, par-ticularly with the accurate separation of connective tissue,muscle, and marrow from bone, variation in bone prepara-tion (� marrow, � articular cartilage, cortical, or trabecu-lar bone), and significant loss of water with age.14,18 Edel-man and Leibman2 drew upon historic dissection data forskeletal water as 16% of body weight,19 skeletal water con-tent as 25 to 30% by weight,20 –23 and assumed skeletal wateris �90% extracellular to calculate ECF bone water as 7.5%of TBW. Unfortunately, skeletal water is not �90% extra-cellular, because skeletal weight includes bone and enclosedmarrow (Table 2).17,18,24,25 Normally active bone marrow ishighly cellular, predominantly intracellular water.25,26
When bone and marrow are accounted for, skeletal water isonly about 60% extracellular, reducing bone ECF to 3% ofTBW (Table 2).
Skeletal muscle water is often underappreciated butaccounts for 40 to 50% of TBW, nearly 75% of ICF andcell mass, and about 33% of interstitial fluid volume. Loss ofmuscle mass redistributes TBW from ICF to ECF and increasesthe ratio of plasma to interstitial fluid volume.4,27 To clarify thecompartmentalization of body water, we provide a balancesheet for body weight and water distribution among the majorbody tissues for men and women (Table 3).
Forces Governing Water DistributionHydrostatic pressure and osmosis drive water between the ECFand ICF compartments, and the eventual body water distribu-tion reflects a steady state of these forces28:
Pic � Pec � �ic � �ec (Eq. 1)
Pic and Pec represent intracellular and extracellular hydro-static pressures, respectively, and �ic and �ec represent os-
ICF ~57% of TBW ECF ~43% of TBW
RBCs~3.6% Muscle
~43%
Bone andconnective tissue
~10%
Adiposetissue ~3.8%
Brain andviscera
~7%
Other~3.4%
ISF~20%
Plasma~6.7%
Transcellular~2.5%
ICF ~57% of TBW
RBCs~3.6% Muscle
~43%
Brain andOther
3 4%
– Na+
– Na+
– Na+
– Na+
– Na+ Cl–
Na+
Na+
Cl–
Na+ –Na+ –
Na+ –
Na+ –
Na+
Na+
Na+Na+
Cl–
Cl–
Cl–Cl–
Figure 1. Body fluid compartments. In the “average” adultman, intracellular fluid (ICF) and extracellular fluid (ECF) do-mains consist of about 57 and 43% of total body water (TBW).The ECF compartment is further subdivided into interstitial fluid(ISF)/lymph, plasma, bone and connective tissue, adipose tissue, andtranscellular water. Skeletal muscle predominates the ICF. Percent-ages are percent of TBW. Adapted from references 2 and 27. RBCs,red blood cells.
Table 1. Tracer distributions for measurement of ECF volume
TracerVolume of
Distribution(% TBW)
Plasma/Lymph/Interstitium
ConnectiveTissue
Bone ICF
Saccharidesinulin 25 to 33 ��� 0 � 0sucrose 30 to 36 ��� � �� 0mannitol 33 to 39 ��� �� �� 0glucose 42 to 46 ��� �� ��� � (�10%)
Sulfate 33 to 39 ��� �� �� 0Chloride (or bromide) 46 to 52 ��� �� ��� � (�10%)Sodium 50 to 55 ��� ���� ���� 0 (�3%)0, �5%; �, 5 to 35%; ��, 35 to 75%; ���, 75 to 125%; ����, �125% penetration. Adaptedfrom references 2,11–15, and 182. TBW, total body water; ICF, intracellular fluid; ECF, extracellularfluid.
BRIEF REVIEWwww.jasn.org
J Am Soc Nephrol 22: 2166–2181, 2011 Body Fluid Dynamics 2167
motic pressures. Plants, fungi, and bacteria possess rigid cellwalls that generate hydrostatic pressure to counteract os-motic pressure gradients. Animal cells shed these reinforced
walls during evolution to gain flexibility, but the cost of thisloss leaves cell volume regulation to the mercy of extracel-lular tonicity29,30:
Table 2. Distribution of water and Na� within bone and marrow (skeleton)
SkeletalComponent
WaterContent (L)
Relative Water(% of Tissue Mass)
ECFWater (L)
Relative ECF(% of TBW)
Na� Content(mEq/kg of body weight)
Tissue Na�
(mEq/L H2O)
Bone 0.9 15 0.9 2.1 18 to 20 (5) �1500 (�400)Active marrow 0.9 80 0.18 0.4 0.4 30Inactive marrow 0.4 15 0.32 0.75 0.6 110Total 2.2 23 1.4 3.25 21 (6) 700 (200)Tissue water (%) 63The values are estimates for average adult man. The values in parentheses represent exchangeable Na� as opposed to total Na�. Based on references 10,14,18,25,26,183.TBW, total body water; ECF, extracellular fluid.
Table 3. Body water distribution among tissues
TissueWeight
(kg)Body
Weight (%)Water Content
FractionECF
FractionECF
Water (L)ICF
Water (L)Total
Water (L)
Bloodman 5.5 7.53 0.80 0.63 2.79 1.61 4.40woman 4.1 6.83 0.80 0.68 2.23 1.05 3.28
Skeletal muscleman 28.5 39.04 0.76 0.16 3.47 18.19 21.66woman 18 30 0.76 0.16 2.19 11.49 13.68
Skinman 4.3 5.89 0.72 0.95 2.94 0.15 3.10woman 3 5 0.72 0.95 2.05 0.11 2.16
Brain and visceraman 6 8.22 0.72 0.35 1.51 2.81 4.32woman 5.4 9 0.72 0.35 1.36 2.53 3.89
Boneman 5.75 7.88 0.15 1.00 0.86 0.00 0.86woman 4.2 7 0.15 1.00 0.63 0.63
Active Marrowman 1.17 1.6 0.80 0.20 0.19 0.75 0.94woman 0.9 1.5 0.80 0.20 0.14 0.58 0.72
Inactive Marrowman 2.48 3.4 0.15 0.80 0.30 0.07 0.37woman 1.8 3 0.15 0.80 0.22 0.05 0.27
Connective Tissueman 3.7 5.07 0.80 1.00 2.96 0.00 2.96woman 3 5 0.80 1.00 2.4 0.00 2.4
Transcellularman 1.1 1.51 0.95 1.00 1.05 0.00 1.05woman 1.1 1.83 0.95 1.00 1.05 0.00 1.05
Adipose Tissueman 14.5 19.86 0.14 0.80 1.62 0.41 2.03woman 18.5 30.83 0.13 0.85 1.97 0.35 2.31
Total
man 73 17.69 24 41.68woman 60 14.23 16.15 30.38
% of TBWman 42.43 57.57woman 46.84 53.16
% of Body Weightman 57.1woman 50.6
The values shown are for an average adult man or an average adult woman. Adapted from references 1,2,4,10,14,16–18,25,26, and 184–186. TBW, total body water;ICF, intracellular fluid; ECF, extracellular fluid.
BRIEF REVIEW www.jasn.org
2168 Journal of the American Society of Nephrology J Am Soc Nephrol 22: 2166–2181, 2011
Pic � Pec � 0 (Eq. 2)
�ic � �ec (Eq. 3)
� (37°C; mmHg) � 19.34 � � � z � [c] (Eq. 4)
Osmolality (mOsm/kg) � � � z � [c] (Eq. 5)
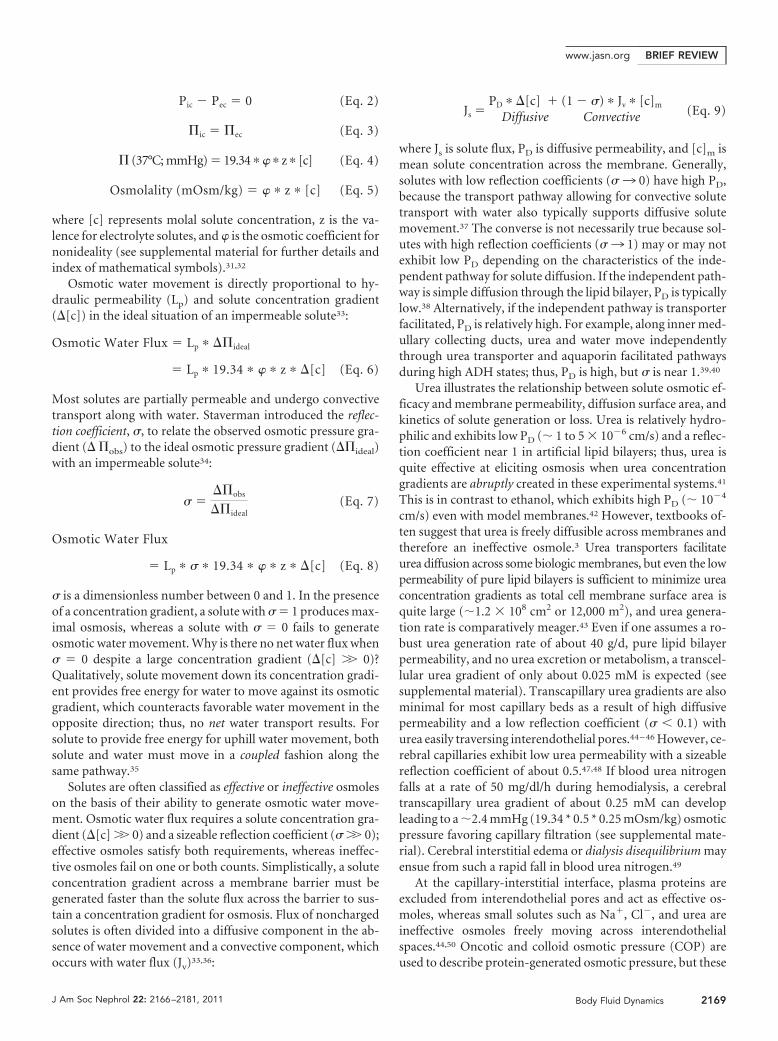
where [c] represents molal solute concentration, z is the va-lence for electrolyte solutes, and � is the osmotic coefficient fornonideality (see supplemental material for further details andindex of mathematical symbols).31,32
Osmotic water movement is directly proportional to hy-draulic permeability (Lp) and solute concentration gradient(�[c]) in the ideal situation of an impermeable solute33:
Osmotic Water Flux � Lp � ��ideal
� Lp � 19.34 � � � z � �[c] (Eq. 6)
Most solutes are partially permeable and undergo convectivetransport along with water. Staverman introduced the reflec-tion coefficient, �, to relate the observed osmotic pressure gra-dient (� �obs) to the ideal osmotic pressure gradient (��ideal)with an impermeable solute34:
� ���obs
��ideal(Eq. 7)
Osmotic Water Flux
� Lp � � � 19.34 � � � z � �[c] (Eq. 8)
� is a dimensionless number between 0 and 1. In the presenceof a concentration gradient, a solute with � � 1 produces max-imal osmosis, whereas a solute with � � 0 fails to generateosmotic water movement. Why is there no net water flux when� � 0 despite a large concentration gradient (�[c] �� 0)?Qualitatively, solute movement down its concentration gradi-ent provides free energy for water to move against its osmoticgradient, which counteracts favorable water movement in theopposite direction; thus, no net water transport results. Forsolute to provide free energy for uphill water movement, bothsolute and water must move in a coupled fashion along thesame pathway.35
Solutes are often classified as effective or ineffective osmoleson the basis of their ability to generate osmotic water move-ment. Osmotic water flux requires a solute concentration gra-dient (�[c] �� 0) and a sizeable reflection coefficient (� �� 0);effective osmoles satisfy both requirements, whereas ineffec-tive osmoles fail on one or both counts. Simplistically, a soluteconcentration gradient across a membrane barrier must begenerated faster than the solute flux across the barrier to sus-tain a concentration gradient for osmosis. Flux of nonchargedsolutes is often divided into a diffusive component in the ab-sence of water movement and a convective component, whichoccurs with water flux (Jv)33,36:
Js �PD � �[c] �
Diffusive(1 � �) � Jv � [c]m
Convective (Eq. 9)
where Js is solute flux, PD is diffusive permeability, and [c]m ismean solute concentration across the membrane. Generally,solutes with low reflection coefficients (�3 0) have high PD,because the transport pathway allowing for convective solutetransport with water also typically supports diffusive solutemovement.37 The converse is not necessarily true because sol-utes with high reflection coefficients (�3 1) may or may notexhibit low PD depending on the characteristics of the inde-pendent pathway for solute diffusion. If the independent path-way is simple diffusion through the lipid bilayer, PD is typicallylow.38 Alternatively, if the independent pathway is transporterfacilitated, PD is relatively high. For example, along inner med-ullary collecting ducts, urea and water move independentlythrough urea transporter and aquaporin facilitated pathwaysduring high ADH states; thus, PD is high, but � is near 1.39,40
Urea illustrates the relationship between solute osmotic ef-ficacy and membrane permeability, diffusion surface area, andkinetics of solute generation or loss. Urea is relatively hydro-philic and exhibits low PD (� 1 to 5 � 10�6 cm/s) and a reflec-tion coefficient near 1 in artificial lipid bilayers; thus, urea isquite effective at eliciting osmosis when urea concentrationgradients are abruptly created in these experimental systems.41
This is in contrast to ethanol, which exhibits high PD (� 10�4
cm/s) even with model membranes.42 However, textbooks of-ten suggest that urea is freely diffusible across membranes andtherefore an ineffective osmole.3 Urea transporters facilitateurea diffusion across some biologic membranes, but even the lowpermeability of pure lipid bilayers is sufficient to minimize ureaconcentration gradients as total cell membrane surface area isquite large (�1.2 � 108 cm2 or 12,000 m2), and urea genera-tion rate is comparatively meager.43 Even if one assumes a ro-bust urea generation rate of about 40 g/d, pure lipid bilayerpermeability, and no urea excretion or metabolism, a transcel-lular urea gradient of only about 0.025 mM is expected (seesupplemental material). Transcapillary urea gradients are alsominimal for most capillary beds as a result of high diffusivepermeability and a low reflection coefficient (� � 0.1) withurea easily traversing interendothelial pores.44 – 46 However, ce-rebral capillaries exhibit low urea permeability with a sizeablereflection coefficient of about 0.5.47,48 If blood urea nitrogenfalls at a rate of 50 mg/dl/h during hemodialysis, a cerebraltranscapillary urea gradient of about 0.25 mM can developleading to a �2.4 mmHg (19.34 * 0.5 * 0.25 mOsm/kg) osmoticpressure favoring capillary filtration (see supplemental mate-rial). Cerebral interstitial edema or dialysis disequilibrium mayensue from such a rapid fall in blood urea nitrogen.49
At the capillary-interstitial interface, plasma proteins areexcluded from interendothelial pores and act as effective os-moles, whereas small solutes such as Na�, Cl�, and urea areineffective osmoles freely moving across interendothelialspaces.44,50 Oncotic and colloid osmotic pressure (COP) areused to describe protein-generated osmotic pressure, but these
BRIEF REVIEWwww.jasn.org
J Am Soc Nephrol 22: 2166–2181, 2011 Body Fluid Dynamics 2169

terms unfortunately suggest a distinct mechanism. Oncoticpressure or COP are simply osmotic pressures with proteincolloids as effective osmoles and smaller solutes as ineffectiveosmoles. We will use COP only as shorthand to specify mea-surement technique rather than biologic phenomena. Oncom-eters consisting of membranes impervious to protein but per-meable to small solutes only measure COP as opposed toosmolality measurements on the basis of freezing point or va-por pressure, which measure osmotic pressure related to alldissolved molecules including small solutes and proteins.51
Charged proteins generate COP not only as dissolved mole-cules but also through electrostatic attraction of oppositelycharged small counter-ions known as a Donnan effect.52 Pro-tein charge depends on isoelectric point (pI); if pH is greaterthan pI, the protein is negatively charged and vice versa.Plasma albumin with a pI � �5 is quite negatively charged atphysiologic pH and attracts Na� and other cations. Thus, al-bumin COP (approximately 16 to 18 mmHg) relates to itsrelatively high plasma concentration and low molecular weight(4 g/dl � 0.58 mmol/kg � 11.2 mmHg; effective molecularweight [MW] � 69 kD) and electrostatically associated cations(17 mmHg � 11.2 mmHg � 5.8 mmHg; �33% of albuminCOP).45
Plasma COP is often equated with albumin COP. Althoughalbumin is the largest single contributor to plasma COP ac-counting for about 66% to 75% of the normal COP (albuminCOP � 16 to 18 mmHg, normal plasma COP � 25 mmHg),the remaining nonalbumin plasma proteins or globulinsshould not be ignored particularly in hypoalbuminemicstates.45 The osmotic efficiency or the osmotic pressure perg/dL of protein can be grossly examined using an average mo-lecular weight (MWav; see supplemental material):
� [% protein (g/dL)] � 193.4 MWav (Eq. 10)
Proteins with higher MWav are less osmotically efficient foreach g/dl of protein and vice versa. Plasma albumin exhibits aMWav of �69 kD, whereas plasma globulins are less efficientwith a MWav of �150 kD (see supplemental material).45,53–55
Additionally, globulin fractions exhibit different MWav: �1 �45 kD, �2 � 115 kD, � � 125 kD, and � � 145 kD.56,57
Analbuminemia or congenital absence of albumin is a rarehuman disorder (approximately 40 to 50 reported cases world-wide) recapitulated in Nagase mutant rats, which surprisinglyexhibit only mild edema and low normal BP.58 – 60 Plasma COPis partially maintained (approximately 50 to 60% normal) bymaintaining total protein concentration in the 5 to 6 g/dlrange. Equally important, the relative contributions of � and �fractions, particularly �1, increase relative to � globulin, in-creasing the osmotic efficiency of globulins with a fall in MWav
from �150 kD to �113 kD (see supplemental material).45,58,59
Analbuminemic rats preserve plasma COP even more effi-ciently with near normal levels using a reduction in globulinMWav from approximately 150 to �97 kD (see supplementalmaterial).61
Inflammatory hypoalbuminemia behaves similarly as �1
and �2 fractions—the acute phase proteins— dramatically rise,but differs compared to analbuminemia because the � fractionis unchanged, and the � fraction often increases with chronic-ity.62 Thus, globulin osmotic efficiency improves but slightlyless compared with analbuminemia with a fall in globulinMWav from �150 kD to �120 kD (see supplemental material).The larger osmotic contribution of plasma globulins facilitatesa robust defense of plasma COP in inflammatory states andexplains the superior correlation of plasma total protein con-centration with plasma COP compared with serum albumin incritically ill, hypoalbuminemic patients.63,64
Cell Volume Homeostasis and Body Na� and K�
DistributionTonicity is shorthand for the action of effective osmolalityacross a barrier and in this context traditionally refers to thevolume behavior of cells in a solution. Osmolality, on the otherhand, measures both effective and ineffective osmoles in a ki-logram of body fluid.65– 67 For instance, ethanol elevatesplasma osmolality but does not affect tonicity by rapidly per-meating lipid bilayers. Thus, estimates of tonicity are physio-logically relevant, whereas osmolality is an imperfect surrogatefor tonicity and requires appropriate discounting of ineffectiveosmoles.65– 67
The relative abundance of effective osmoles in intracellularand extracellular compartments dictates body water distribu-tion between ICF and ECF. All cells contain largely fixed orpoorly permeable anions such as metabolites (ATP, phospho-creatine, and sulfate), nucleotides, and proteins.29 K� acts asthe primary counter-ion and serves optimal ribosomal proteinsynthesis requiring high intracellular K� concentrations.68 Thefixed intracellular anions and K� counter-ions create a Don-nan effect-related osmotic gradient favoring persistent waterentry. To counteract this osmotic gradient, Na�-K�-ATPasesactively extrude Na� ions producing a double-Donnan effect.69
Cl� passively moves with Na� to maintain electroneutralityleading to osmotic equilibrium (Figure 2).29,70 In essence, thecells expend ATP to convert permeable Na� and K� ions intoimpermeable, effective osmoles sequestered in the ECF andICF, respectively. Similarly, Cl� concentrates in the ECF,whereas fixed anions predominate in the ICF.29,71 Waterpassively distributes into the ECF or ICF compartments inproportion to the effective Na� and K� content to reacheffective osmotic equilibrium (tonicity) and establish cellvolume.
Almost 98% of total body Na� is distributed among theECF subcompartments (Table 4). Total body Na� is oftendivided into exchangeable (Na�
ex) and nonexchangeabledomains on the basis of the extent of radioisotope Na�
equilibration with the body pool. About 20 to 30% of totalbody Na� is nonexchangeable, residing in anhydrous bonematrix.21,72–74 Total body K� diametrically mirrors Na�
with about 95% located intracellularly (Table 4). UnlikeNa�, however, over 90% of body K� is exchangeable.75 To-
BRIEF REVIEW www.jasn.org
2170 Journal of the American Society of Nephrology J Am Soc Nephrol 22: 2166–2181, 2011
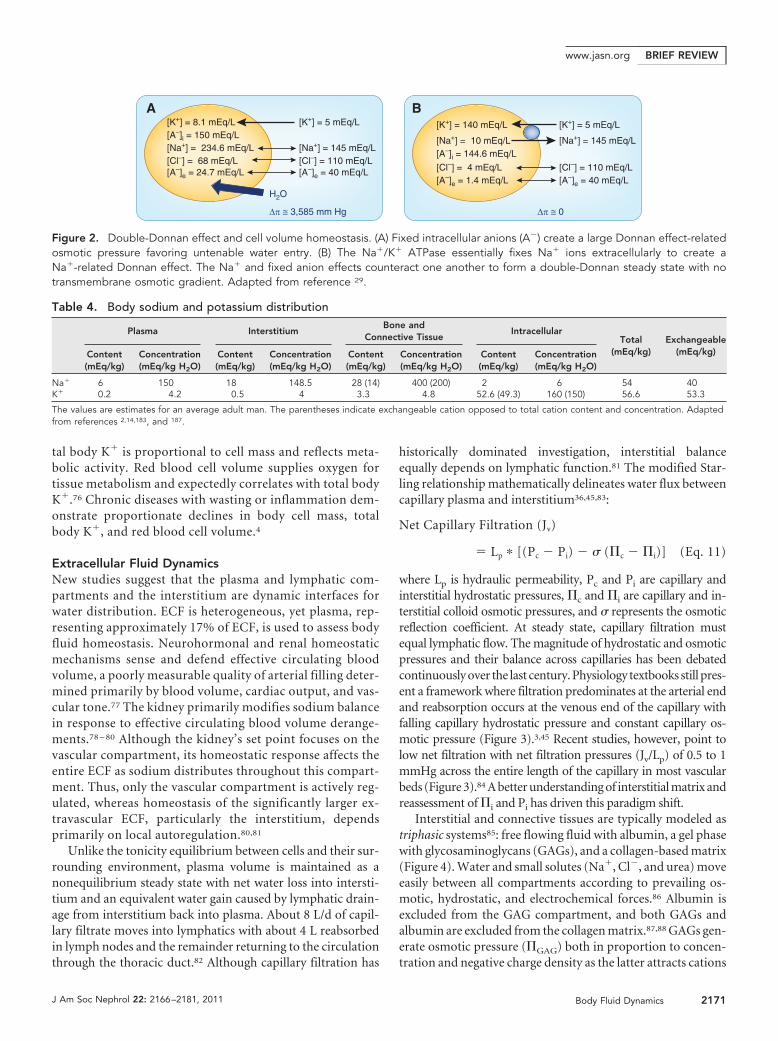
tal body K� is proportional to cell mass and reflects meta-bolic activity. Red blood cell volume supplies oxygen fortissue metabolism and expectedly correlates with total bodyK�.76 Chronic diseases with wasting or inflammation dem-onstrate proportionate declines in body cell mass, totalbody K�, and red blood cell volume.4
Extracellular Fluid DynamicsNew studies suggest that the plasma and lymphatic com-partments and the interstitium are dynamic interfaces forwater distribution. ECF is heterogeneous, yet plasma, rep-resenting approximately 17% of ECF, is used to assess bodyfluid homeostasis. Neurohormonal and renal homeostaticmechanisms sense and defend effective circulating bloodvolume, a poorly measurable quality of arterial filling deter-mined primarily by blood volume, cardiac output, and vas-cular tone.77 The kidney primarily modifies sodium balancein response to effective circulating blood volume derange-ments.78 – 80 Although the kidney’s set point focuses on thevascular compartment, its homeostatic response affects theentire ECF as sodium distributes throughout this compart-ment. Thus, only the vascular compartment is actively reg-ulated, whereas homeostasis of the significantly larger ex-travascular ECF, particularly the interstitium, dependsprimarily on local autoregulation.80,81
Unlike the tonicity equilibrium between cells and their sur-rounding environment, plasma volume is maintained as anonequilibrium steady state with net water loss into intersti-tium and an equivalent water gain caused by lymphatic drain-age from interstitium back into plasma. About 8 L/d of capil-lary filtrate moves into lymphatics with about 4 L reabsorbedin lymph nodes and the remainder returning to the circulationthrough the thoracic duct.82 Although capillary filtration has
historically dominated investigation, interstitial balanceequally depends on lymphatic function.81 The modified Star-ling relationship mathematically delineates water flux betweencapillary plasma and interstitium36,45,83:
Net Capillary Filtration (Jv)
� Lp � [(Pc � Pi) � � (�c � �i)] (Eq. 11)
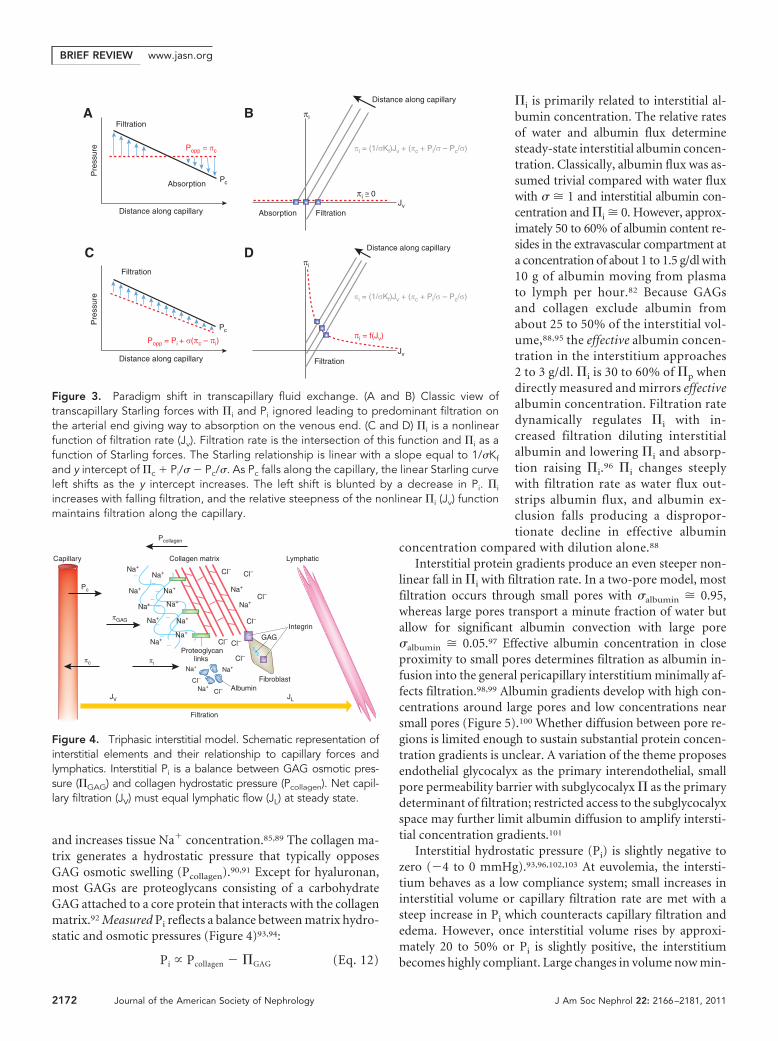
where Lp is hydraulic permeability, Pc and Pi are capillary andinterstitial hydrostatic pressures, �c and �i are capillary and in-terstitial colloid osmotic pressures, and � represents the osmoticreflection coefficient. At steady state, capillary filtration mustequal lymphatic flow. The magnitude of hydrostatic and osmoticpressures and their balance across capillaries has been debatedcontinuously over the last century. Physiology textbooks still pres-ent a framework where filtration predominates at the arterial endand reabsorption occurs at the venous end of the capillary withfalling capillary hydrostatic pressure and constant capillary os-motic pressure (Figure 3).3,45 Recent studies, however, point tolow net filtration with net filtration pressures (Jv/Lp) of 0.5 to 1mmHg across the entire length of the capillary in most vascularbeds (Figure 3).84 A better understanding of interstitial matrix andreassessment of �i and Pi has driven this paradigm shift.
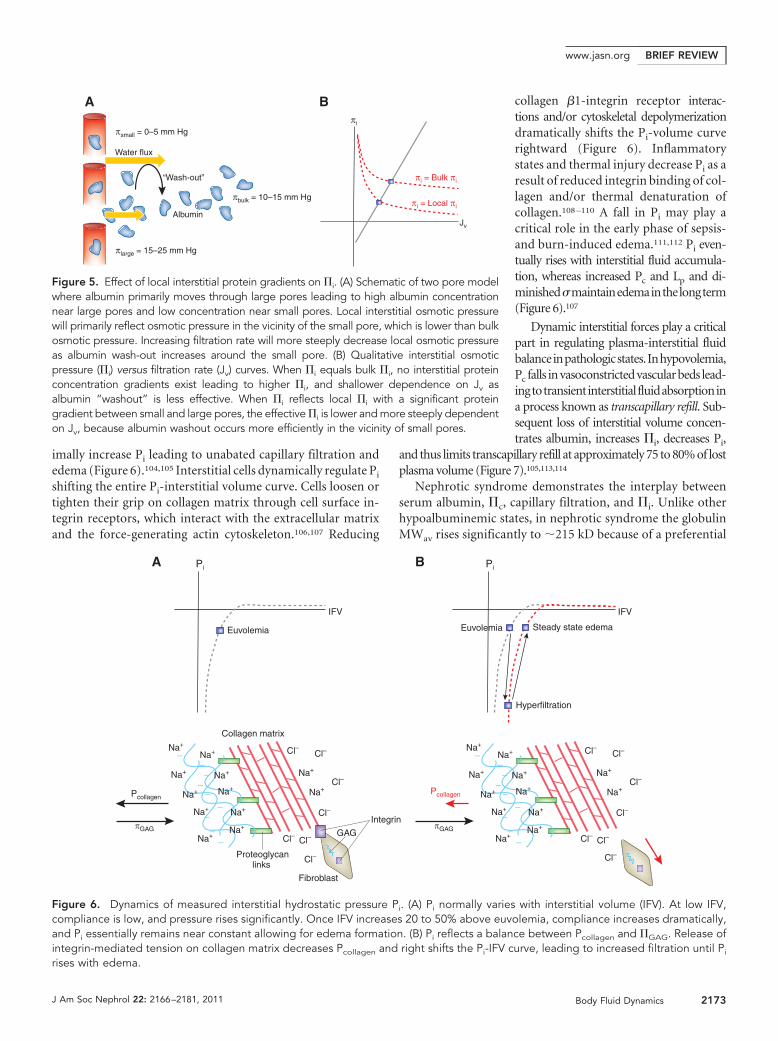
Interstitial and connective tissues are typically modeled astriphasic systems85: free flowing fluid with albumin, a gel phasewith glycosaminoglycans (GAGs), and a collagen-based matrix(Figure 4). Water and small solutes (Na�, Cl�, and urea) moveeasily between all compartments according to prevailing os-motic, hydrostatic, and electrochemical forces.86 Albumin isexcluded from the GAG compartment, and both GAGs andalbumin are excluded from the collagen matrix.87,88 GAGs gen-erate osmotic pressure (�GAG) both in proportion to concen-tration and negative charge density as the latter attracts cations
[A–]i = 144.6 mEq/L [Na+] = 10 mEq/L [Na+] = 145 mEq/L
[Cl–] = 4 mEq/L [A–]e = 1.4 mEq/L
[Cl–] = 110 mEq/L [A–]e = 40 mEq/L
[K+] = 140 mEq/L [K+] = 5 mEq/L
∆π ≅ 0
H2O
A B
[A–]i = 150 mEq/L [Na+] = 234.6 mEq/L [Cl–] = 68 mEq/L [A–]e = 24.7 mEq/L
[Na+] = 145 mEq/L [Cl–] = 110 mEq/L [A–]e = 40 mEq/L
[K+] = 8.1 mEq/L [K+] = 5 mEq/L
∆π ≅ 3,585 mm Hg
Figure 2. Double-Donnan effect and cell volume homeostasis. (A) Fixed intracellular anions (A�) create a large Donnan effect-relatedosmotic pressure favoring untenable water entry. (B) The Na�/K� ATPase essentially fixes Na� ions extracellularly to create aNa�-related Donnan effect. The Na� and fixed anion effects counteract one another to form a double-Donnan steady state with notransmembrane osmotic gradient. Adapted from reference 29.
Table 4. Body sodium and potassium distribution
Plasma InterstitiumBone and
Connective TissueIntracellular
Total(mEq/kg)
Exchangeable(mEq/kg)Content
(mEq/kg)Concentration(mEq/kg H2O)
Content(mEq/kg)
Concentration(mEq/kg H2O)
Content(mEq/kg)
Concentration(mEq/kg H2O)
Content(mEq/kg)
Concentration(mEq/kg H2O)
Na� 6 150 18 148.5 28 (14) 400 (200) 2 6 54 40K� 0.2 4.2 0.5 4 3.3 4.8 52.6 (49.3) 160 (150) 56.6 53.3
The values are estimates for an average adult man. The parentheses indicate exchangeable cation opposed to total cation content and concentration. Adaptedfrom references 2,14,183, and 187.
BRIEF REVIEWwww.jasn.org
J Am Soc Nephrol 22: 2166–2181, 2011 Body Fluid Dynamics 2171
and increases tissue Na� concentration.85,89 The collagen ma-trix generates a hydrostatic pressure that typically opposesGAG osmotic swelling (Pcollagen).90,91 Except for hyaluronan,most GAGs are proteoglycans consisting of a carbohydrateGAG attached to a core protein that interacts with the collagenmatrix.92 Measured Pi reflects a balance between matrix hydro-static and osmotic pressures (Figure 4)93,94:
Pi � Pcollagen � �GAG (Eq. 12)
�i is primarily related to interstitial al-bumin concentration. The relative ratesof water and albumin flux determinesteady-state interstitial albumin concen-tration. Classically, albumin flux was as-sumed trivial compared with water fluxwith � � 1 and interstitial albumin con-centration and �i � 0. However, approx-imately 50 to 60% of albumin content re-sides in the extravascular compartment ata concentration of about 1 to 1.5 g/dl with10 g of albumin moving from plasmato lymph per hour.82 Because GAGsand collagen exclude albumin fromabout 25 to 50% of the interstitial vol-ume,88,95 the effective albumin concen-tration in the interstitium approaches2 to 3 g/dl. �i is 30 to 60% of �p whendirectly measured and mirrors effectivealbumin concentration. Filtration ratedynamically regulates �i with in-creased filtration diluting interstitialalbumin and lowering �i and absorp-tion raising �i.96 �i changes steeplywith filtration rate as water flux out-strips albumin flux, and albumin ex-clusion falls producing a dispropor-tionate decline in effective albumin
concentration compared with dilution alone.88
Interstitial protein gradients produce an even steeper non-linear fall in �i with filtration rate. In a two-pore model, mostfiltration occurs through small pores with �albumin � 0.95,whereas large pores transport a minute fraction of water butallow for significant albumin convection with large pore�albumin � 0.05.97 Effective albumin concentration in closeproximity to small pores determines filtration as albumin in-fusion into the general pericapillary interstitium minimally af-fects filtration.98,99 Albumin gradients develop with high con-centrations around large pores and low concentrations nearsmall pores (Figure 5).100 Whether diffusion between pore re-gions is limited enough to sustain substantial protein concen-tration gradients is unclear. A variation of the theme proposesendothelial glycocalyx as the primary interendothelial, smallpore permeability barrier with subglycocalyx � as the primarydeterminant of filtration; restricted access to the subglycocalyxspace may further limit albumin diffusion to amplify intersti-tial concentration gradients.101
Interstitial hydrostatic pressure (Pi) is slightly negative tozero (�4 to 0 mmHg).93,96,102,103 At euvolemia, the intersti-tium behaves as a low compliance system; small increases ininterstitial volume or capillary filtration rate are met with asteep increase in Pi which counteracts capillary filtration andedema. However, once interstitial volume rises by approxi-mately 20 to 50% or Pi is slightly positive, the interstitiumbecomes highly compliant. Large changes in volume now min-
Jv
πi
Filtration
Jv
πi
Distance along capillary
Popp = πc
Filtration
Absorption
Distance along capillary
Filtration Absorption
A B
D
πi ≅ 0
Pc
Pc
Distance along capillary
πi = f(Jv)
πi = (1/σKf)Jv + (πc + Pi/σ – Pc/σ)
πi = (1/σKf)Jv + (πc + Pi/σ – Pc/σ)
Distance along capillary
Pre
ssur
e
Filtration
C
Popp = Pi + σ(πc – πi)
Pre
ssur
e
Figure 3. Paradigm shift in transcapillary fluid exchange. (A and B) Classic view oftranscapillary Starling forces with �i and Pi ignored leading to predominant filtration onthe arterial end giving way to absorption on the venous end. (C and D) �i is a nonlinearfunction of filtration rate (Jv). Filtration rate is the intersection of this function and �i as afunction of Starling forces. The Starling relationship is linear with a slope equal to 1/�Kf
and y intercept of �c � Pi/� � Pc/�. As Pc falls along the capillary, the linear Starling curveleft shifts as the y intercept increases. The left shift is blunted by a decrease in Pi. �i
increases with falling filtration, and the relative steepness of the nonlinear �i (Jv) functionmaintains filtration along the capillary.
Filtration
Lymphatic
Pc
Pcollagen
Capillary
JV
πi
Na+
Na+ Na+
Cl–
Cl–
GAG
Collagen matrix
Integrin
Proteoglycanlinks
AlbuminFibroblast
Na+
Na+
Na+
Na+
Na+Na+
Na+
Na+ Na+
Na+
Cl–
Cl–
Cl– Cl–
Cl–
Cl–
Cl–Na+
Na+–––
––
––
––
πc
πGAG
JL
Figure 4. Triphasic interstitial model. Schematic representation ofinterstitial elements and their relationship to capillary forces andlymphatics. Interstitial Pi is a balance between GAG osmotic pres-sure (�GAG) and collagen hydrostatic pressure (Pcollagen). Net capil-lary filtration (JV) must equal lymphatic flow (JL) at steady state.
BRIEF REVIEW www.jasn.org
2172 Journal of the American Society of Nephrology J Am Soc Nephrol 22: 2166–2181, 2011
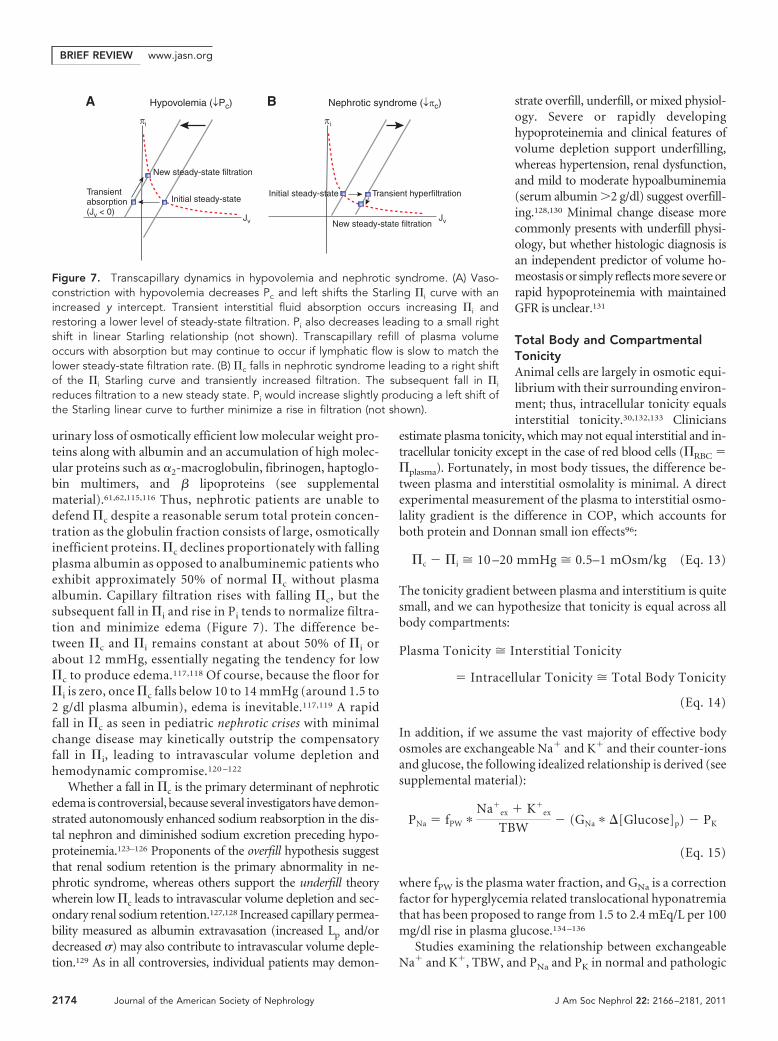
imally increase Pi leading to unabated capillary filtration andedema (Figure 6).104,105 Interstitial cells dynamically regulate Pi
shifting the entire Pi-interstitial volume curve. Cells loosen ortighten their grip on collagen matrix through cell surface in-tegrin receptors, which interact with the extracellular matrixand the force-generating actin cytoskeleton.106,107 Reducing
collagen �1-integrin receptor interac-tions and/or cytoskeletal depolymerizationdramatically shifts the Pi-volume curverightward (Figure 6). Inflammatorystates and thermal injury decrease Pi as aresult of reduced integrin binding of col-lagen and/or thermal denaturation ofcollagen.108 –110 A fall in Pi may play acritical role in the early phase of sepsis-and burn-induced edema.111,112 Pi even-tually rises with interstitial fluid accumula-tion, whereas increased Pc and Lp and di-minished�maintainedemainthelongterm(Figure 6).107
Dynamic interstitial forces play a criticalpart in regulating plasma-interstitial fluidbalanceinpathologicstates.Inhypovolemia,Pc falls invasoconstrictedvascularbeds lead-ingtotransientinterstitialfluidabsorptionina process known as transcapillary refill. Sub-sequent loss of interstitial volume concen-trates albumin, increases �i, decreases Pi,
and thus limits transcapillary refill at approximately 75 to 80% of lostplasma volume (Figure 7).105,113,114
Nephrotic syndrome demonstrates the interplay betweenserum albumin, �c, capillary filtration, and �i. Unlike otherhypoalbuminemic states, in nephrotic syndrome the globulinMWav rises significantly to �215 kD because of a preferential
IFV
Euvolemia
IFV
Pcollagen
GAG
Collagen matrix
Integrin
Proteoglycanlinks
A B
Fibroblast
Euvolemia
Hyperfiltration
Steady state edema
Na+
Na+
Na+
Na+
Na+Na+
Na+
Na+ Na+
Na+
Cl–
Cl–
Cl– Cl–
Na+
Na+–––
––
––
––
Pi Pi
πGAG
Pcollagen
πGAG
Na+
Na+
Na+
Na+
Na+Na+
Na+
Na+ Na+
Na+
Cl–
Cl–
Cl– Cl–
Cl–Cl–
Cl–Cl–
Cl–Cl–Na+
Na+–––
––
––
––
Figure 6. Dynamics of measured interstitial hydrostatic pressure Pi. (A) Pi normally varies with interstitial volume (IFV). At low IFV,compliance is low, and pressure rises significantly. Once IFV increases 20 to 50% above euvolemia, compliance increases dramatically,and Pi essentially remains near constant allowing for edema formation. (B) Pi reflects a balance between Pcollagen and �GAG. Release ofintegrin-mediated tension on collagen matrix decreases Pcollagen and right shifts the Pi-IFV curve, leading to increased filtration until Pi
rises with edema.
Water flux
Jv
πi
πi = Bulk πi
πi = Local πi
πsmall = 0–5 mm Hg
Albumin
“Wash-out”
πbulk = 10–15 mm Hg
πlarge = 15–25 mm Hg
A B
Figure 5. Effect of local interstitial protein gradients on �i. (A) Schematic of two pore modelwhere albumin primarily moves through large pores leading to high albumin concentrationnear large pores and low concentration near small pores. Local interstitial osmotic pressurewill primarily reflect osmotic pressure in the vicinity of the small pore, which is lower than bulkosmotic pressure. Increasing filtration rate will more steeply decrease local osmotic pressureas albumin wash-out increases around the small pore. (B) Qualitative interstitial osmoticpressure (�i) versus filtration rate (Jv) curves. When �i equals bulk �i, no interstitial proteinconcentration gradients exist leading to higher �i, and shallower dependence on Jv asalbumin “washout” is less effective. When �i reflects local �i with a significant proteingradient between small and large pores, the effective �i is lower and more steeply dependenton Jv, because albumin washout occurs more efficiently in the vicinity of small pores.
BRIEF REVIEWwww.jasn.org
J Am Soc Nephrol 22: 2166–2181, 2011 Body Fluid Dynamics 2173
urinary loss of osmotically efficient low molecular weight pro-teins along with albumin and an accumulation of high molec-ular proteins such as �2-macroglobulin, fibrinogen, haptoglo-bin multimers, and � lipoproteins (see supplementalmaterial).61,62,115,116 Thus, nephrotic patients are unable todefend �c despite a reasonable serum total protein concen-tration as the globulin fraction consists of large, osmoticallyinefficient proteins. �c declines proportionately with fallingplasma albumin as opposed to analbuminemic patients whoexhibit approximately 50% of normal �c without plasmaalbumin. Capillary filtration rises with falling �c, but thesubsequent fall in �i and rise in Pi tends to normalize filtra-tion and minimize edema (Figure 7). The difference be-tween �c and �i remains constant at about 50% of �i orabout 12 mmHg, essentially negating the tendency for low�c to produce edema.117,118 Of course, because the floor for�i is zero, once �c falls below 10 to 14 mmHg (around 1.5 to2 g/dl plasma albumin), edema is inevitable.117,119 A rapidfall in �c as seen in pediatric nephrotic crises with minimalchange disease may kinetically outstrip the compensatoryfall in �i, leading to intravascular volume depletion andhemodynamic compromise.120 –122
Whether a fall in �c is the primary determinant of nephroticedema is controversial, because several investigators have demon-strated autonomously enhanced sodium reabsorption in the dis-tal nephron and diminished sodium excretion preceding hypo-proteinemia.123–126 Proponents of the overfill hypothesis suggestthat renal sodium retention is the primary abnormality in ne-phrotic syndrome, whereas others support the underfill theorywherein low �c leads to intravascular volume depletion and sec-ondary renal sodium retention.127,128 Increased capillary permea-bility measured as albumin extravasation (increased Lp and/ordecreased �) may also contribute to intravascular volume deple-tion.129 As in all controversies, individual patients may demon-
strate overfill, underfill, or mixed physiol-ogy. Severe or rapidly developinghypoproteinemia and clinical features ofvolume depletion support underfilling,whereas hypertension, renal dysfunction,and mild to moderate hypoalbuminemia(serum albumin �2 g/dl) suggest overfill-ing.128,130 Minimal change disease morecommonly presents with underfill physi-ology, but whether histologic diagnosis isan independent predictor of volume ho-meostasis or simply reflects more severe orrapid hypoproteinemia with maintainedGFR is unclear.131
Total Body and CompartmentalTonicityAnimal cells are largely in osmotic equi-librium with their surrounding environ-ment; thus, intracellular tonicity equalsinterstitial tonicity.30,132,133 Clinicians
estimate plasma tonicity, which may not equal interstitial and in-tracellular tonicity except in the case of red blood cells (�RBC ��plasma). Fortunately, in most body tissues, the difference be-tween plasma and interstitial osmolality is minimal. A directexperimental measurement of the plasma to interstitial osmo-lality gradient is the difference in COP, which accounts forboth protein and Donnan small ion effects96:
�c � �i � 10 –20 mmHg � 0.5–1 mOsm/kg (Eq. 13)
The tonicity gradient between plasma and interstitium is quitesmall, and we can hypothesize that tonicity is equal across allbody compartments:
Plasma Tonicity � Interstitial Tonicity
� Intracellular Tonicity � Total Body Tonicity
(Eq. 14)
In addition, if we assume the vast majority of effective bodyosmoles are exchangeable Na� and K� and their counter-ionsand glucose, the following idealized relationship is derived (seesupplemental material):
PNa � fPW �Na�
ex � K�ex
TBW� (GNa � �[Glucose]p) � PK
(Eq. 15)
where fPW is the plasma water fraction, and GNa is a correctionfactor for hyperglycemia related translocational hyponatremiathat has been proposed to range from 1.5 to 2.4 mEq/L per 100mg/dl rise in plasma glucose.134 –136
Studies examining the relationship between exchangeableNa� and K�, TBW, and PNa and PK in normal and pathologic
Jv Jv
Hypovolemia (↓Pc)
Initial steady-state Transientabsorption(Jv < 0)
New steady-state filtration
Transient hyperfiltration
New steady-state filtration
Initial steady-state
A B Nephrotic syndrome (↓πc)
πi πi
Figure 7. Transcapillary dynamics in hypovolemia and nephrotic syndrome. (A) Vaso-constriction with hypovolemia decreases Pc and left shifts the Starling �i curve with anincreased y intercept. Transient interstitial fluid absorption occurs increasing �i andrestoring a lower level of steady-state filtration. Pi also decreases leading to a small rightshift in linear Starling relationship (not shown). Transcapillary refill of plasma volumeoccurs with absorption but may continue to occur if lymphatic flow is slow to match thelower steady-state filtration rate. (B) �c falls in nephrotic syndrome leading to a right shiftof the �i Starling curve and transiently increased filtration. The subsequent fall in �i
reduces filtration to a new steady state. Pi would increase slightly producing a left shift ofthe Starling linear curve to further minimize a rise in filtration (not shown).
BRIEF REVIEW www.jasn.org
2174 Journal of the American Society of Nephrology J Am Soc Nephrol 22: 2166–2181, 2011
states have found that PNa may be delineated as follows (seesupplemental material):
PNa � 1.03 � fPW
Na�ex � K�
ex � 250
TBW
� (GNa � �[Glucose]p) � PK (Eq. 16)
Because total exchangeable cation (Na�ex � K�
ex) is on theorder of 90 mEq/kg, the ideal relationship is a good approxi-mation because 250 mEq pales in comparison and 1.03 is alsoquite close to 1. The 250 mEq deviation from ideality relates toa small osmotic gradient between plasma and total body osmo-lality, non-Na� and K� osmoles besides glucose, and ex-changeable excess Na� and K� (see supplemental material).The nonideal quantity of 250 mEq in the derived PNa relation-ship applies only to well represented pathologic states withinpatient cohort data (congestive heart failure, cirrhosis, and lowNa� diet). Whether this quantity is similar in other diseasestates such as syndrome of inappropriate anti-diuretic hor-mone (SIADH), volume depletion, and high Na� diet is un-known and potentially limits the accuracy of the idealized PNa
approximation in these situations.137
Broadly speaking, excess Na� and K� refer to any compart-ment where exchangeable Na� and K� concentration exceeds
plasma water [Na� � K�]. Often, excessNa� and K� is used interchangeablywith osmotically inactive, although thetwo are not mechanistically synono-mous. Some inaccurately suggest that acompartment with osmotically activeNa� and K� in excess of plasma shouldaccrue water until equilibrium withplasma is reached and excess cation iseliminated; thus, the persistence of aconcentration gradient can only occur ifexcess cation is osmotically inactive. Butexcess cation may be osmotically activewhile maintaining a concentration gra-dient in two ways: a counteracting hy-drostatic pressure balances the osmoticgradient, allowing compartment osmo-lality to differ from plasma osmolality orexcess Na� and K� is counterbalancedby loss of non-Na� and K� osmolytesmaintaining plasma and total body to-nicity. Of course, a portion of excessNa� and K� may truly be osmoticallyinactive (� � 0). Bone and a small frac-tion of intracellular cation probably rep-resent the osmotically inactive pool.Some may argue that the distinction be-tween excess and osmotically inactivecation is pure semantics, but a growingliterature on cartilage suggests other-wise. Cartilage is hypertonic, yet inexo-
rable cartilage swelling is prevented by a counteracting colla-gen-based hydrostatic pressure.91,138
Significant attention has historically focused on the dynam-ics of Na� balance given its prominent role in hypertensionand edematous states. When positive Na� balance occurs, Na�
is handled in several ways: Na� accumulates in the extracellu-lar space with water such that plasma tonicity and Na� con-centration remain constant; Na� is retained in excess of waterwith a resulting increase in plasma Na� concentration andtonicity along with a parallel rise in total body tonicity; or Na�
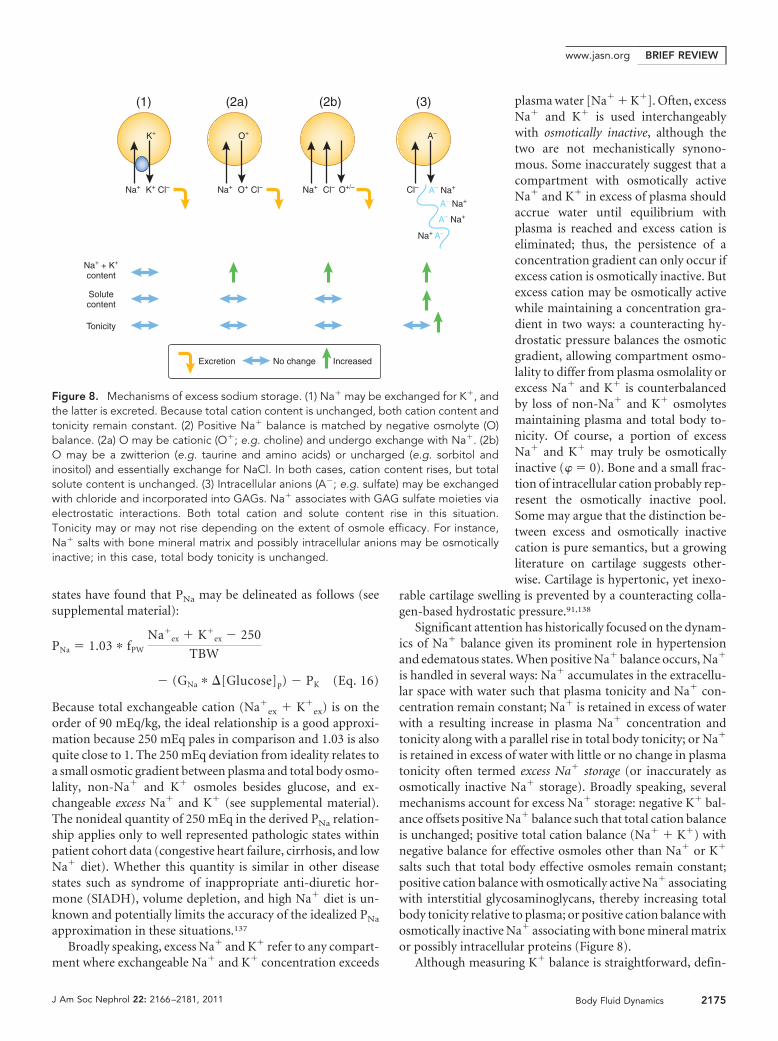
is retained in excess of water with little or no change in plasmatonicity often termed excess Na� storage (or inaccurately asosmotically inactive Na� storage). Broadly speaking, severalmechanisms account for excess Na� storage: negative K� bal-ance offsets positive Na� balance such that total cation balanceis unchanged; positive total cation balance (Na� � K�) withnegative balance for effective osmoles other than Na� or K�
salts such that total body effective osmoles remain constant;positive cation balance with osmotically active Na� associatingwith interstitial glycosaminoglycans, thereby increasing totalbody tonicity relative to plasma; or positive cation balance withosmotically inactive Na� associating with bone mineral matrixor possibly intracellular proteins (Figure 8).
Although measuring K� balance is straightforward, defin-
Na+
K+
Na+ + K+
content
O+ Cl– Cl–
A–
A– Na+
A– Na+
A– Na+
Na+ A–
Excretion No change Increased
Tonicity
(1) (2a) (2b) (3)
Solutecontent
K+ Cl– Na+
O+
Na+ Cl– O+/–
Figure 8. Mechanisms of excess sodium storage. (1) Na� may be exchanged for K�, andthe latter is excreted. Because total cation content is unchanged, both cation content andtonicity remain constant. (2) Positive Na� balance is matched by negative osmolyte (O)balance. (2a) O may be cationic (O�; e.g. choline) and undergo exchange with Na�. (2b)O may be a zwitterion (e.g. taurine and amino acids) or uncharged (e.g. sorbitol andinositol) and essentially exchange for NaCl. In both cases, cation content rises, but totalsolute content is unchanged. (3) Intracellular anions (A�; e.g. sulfate) may be exchangedwith chloride and incorporated into GAGs. Na� associates with GAG sulfate moieties viaelectrostatic interactions. Both total cation and solute content rise in this situation.Tonicity may or may not rise depending on the extent of osmole efficacy. For instance,Na� salts with bone mineral matrix and possibly intracellular anions may be osmoticallyinactive; in this case, total body tonicity is unchanged.
BRIEF REVIEWwww.jasn.org
J Am Soc Nephrol 22: 2166–2181, 2011 Body Fluid Dynamics 2175
ing other mechanisms for excess Na� storage is difficult. Overthe last half century, investigators have debated whether themovement of Na� ions into or out of a storage compartment isnecessary to account for positive sodium balance with highsodium diet and edematous states and negative sodium bal-ance in volume depletion or hypotonicity. Many studies ne-glect K� balance, which can often offset a positive Na� bal-ance.139 –143 Even after accounting for K � balance, most shortterm metabolic balance studies (3 to 5 days) and long term (1to 3 months) radioisotopic studies generally find reasonablecorrelation between cation and water balance and plasma to-nicity,144 –149 whereas intermediate balance studies (7 to 14days) often suggest Na� storage.150 –152 Whether these differ-ences reflect biologic phenomena or technical differences re-mains unclear.150,153–155
Excess Na� storage occurs with high sodium diet (�300mEq/d). Some excess Na� exchanges with intracellular K� pri-marily from skeletal and vascular smooth muscle; thus, totalcation balance in this case is unchanged.147,156 Excess Na� stor-age in skin exceeds negative K� balance and has recently gar-nered attention, although the hypothesis dates back over 30years in the Russian literature.150,157,158 Animal studies demon-strate increased Na� concentration in skin (20 to 40 mEq/Ltissue water), which translates to about 1 to 2 mEq/kg excessNa� storage, assuming that skin water is at most 5% of bodyweight.27,156,159 Excess Na� may accumulate intracellularly inexchange for non-K� osmolytes or alternatively associate withinterstitial glycosaminoglycans (Figure 8). Radiotracer Na�
dynamics in isolated skin from animals on high sodium dietssuggest an increase in the rapidly exchanging extracellular Na�
pool rather than the more slowly exchanging intracellular Na�
pool. Within the rapidly exchanging pool, a compartment out-side the inulin space accounts for the majority of the increasedNa� content, suggesting a sterically inaccessible site such asinterstitial glycosaminoglycans.157 Indeed, negatively charged,sulfated glycosaminoglycan content rises in skin with dietaryNa� loading.159 –161 Na� loading transiently increases intersti-tial flow and possibly Na� concentration, which are knownstimulators of interstitial cell matrix production, particularlysulfated GAGs.162–165
Na� associated with negatively charged purified glycosami-noglycans in cartilage exhibits an osmotic coefficient similar tonormal saline; thus, skin GAG-associated Na� is most likelyosmotically active.86,166 Assuming that 20 to 40 mEq/L Na� isstored in association with skin interstitial GAGs, �GAG wouldrise about 100 to 200 mmHg or approximately 5 to 10mOsm/kg to achieve the required negative charge density (seesupplemental material). Typical transcapillary Starling forcespale in comparison with 100 to 200 mmHg. Dermal swellingpressures can reach up to 100 to 150 mmHg in situations wherePcollagen is reduced, suggesting that �GAG is normally quitehigh but counteracted by Pcollagen.111,167 Thus, �GAG can risesignificantly but requires similar increases in Pcollagen to pre-vent high filtration rates and interstitial edema caused by low Pi
(Pi � Pcollagen � �GAG). Hydrostatic pressure (Pcollagen) coun-
terbalances osmotic pressure (�GAG) to eliminate water move-ment and maintain a small tonicity gradient between dermalinterstitium and plasma. Dermal fibroblasts like their chon-drocyte counterparts probably accommodate interstitial hy-pertonicity with osmolyte accumulation to maintain cell vol-ume.168,169
When the mechanism of excess Na� storage across tissues isbroadly surveyed, a hypothetical framework comes into view.Relatively cellular tissues such as muscle exchange Na� for K�
or other intracellular osmolytes as their high cell mass relativeto interstitial space provide a large osmole depot for transcel-lular exchange. Conversely, relatively acellular connective tis-sues have minimal intracellular osmoles at their disposal andalternatively depend on osmotically active storage with inter-stitial glycosaminoglycans or osmotically inactive storage withmineral matrix.
The Na� counter-anion may also modify Na� storage.When subjects consume large amounts of Na� either as Cl� orbicarbonate (or equivalents such as citrate or ascorbate) salts,hypertension and plasma volume expansion ensues only withNaCl intake despite equivalent positive sodium balance andweight gain with sodium bicarbonate. Furthermore, NaCl con-sumption results in hypercalciuria, whereas sodium bicarbon-ate does not change urinary calcium excretion.170 –173 Takentogether, water distribution tends to be extravascular and doesnot affect calcium homeostasis when the Na� counter-anion isbicarbonate. Na� with a base equivalent may possess a largerpool of intracellular and bone storage mechanisms. Intracellu-lar proteins can simply titrate bicarbonate with protons withthe resulting protein anionic side chain acting as a counter-ionfor excess Na� in a potentially osmotically inactive form. ForNaCl to store Na� in association with intracellular proteins,Na� would have to displace protein side chain H� or exchangewith predominantly protein bound Ca2�. The former is un-likely because cells function poorly with intracellular acidosis,whereas the latter necessitates Ca2� excretion. The low solu-bility of calcium bicarbonate probably precludes intracellularNa�/Ca2� exchange with sodium bicarbonate but promotesbone surface crystal integration of sodium bicarbonate in toto.Conversely, NaCl requires Na�/Ca2� exchange at the bone ma-trix interface again leading to hypercalciuria.174–176 Thus, negativeCa2� balance potentially limits Na� storage in the setting ofhigh NaCl intake, but not with bicarbonate salts. Althoughpurely speculative, these hypotheses provide fertile groundfor future investigation.
Alterations in intracellular, skin, and bone Na� storage maycritically regulate blood volume homeostasis and participate inthe pathogenesis of salt-sensitive hypertension. These storagemechanisms may buffer the blood volume against transient orsustained sodium loads. Animals and patients with reducedNa� storage capacity are prone to blood volume expansionand hypertension.158,177,178 Alternatively, these storage mecha-nisms activate deleterious neurohormonal and/or inflamma-tory signaling pathways.159 Although this work points to anexciting paradigm shift in blood volume regulation, whether
BRIEF REVIEW www.jasn.org
2176 Journal of the American Society of Nephrology J Am Soc Nephrol 22: 2166–2181, 2011
these mechanisms contribute to pathology broadly or in a nar-row subset of patients remains unknown. Because UnitedStates dietary Na� intake is 150 to 200 mEq/d � 100 mEq/d (2SD)179–181 and storage mechanisms regulating Na� homeostasis re-quire dietary intakes exceeding 300 mEq/d,140,150 only about 5% ofessential hypertension in American patients may involve alterationsin Na� storage.
ConclusionsUnderstanding body fluid dynamics is critical to the practice ofmedicine. Phenomenal work accomplished during the lastcentury has lulled us into relying on aging textbook dogma orbelieving there is little left to discover. However, re-examina-tion of foundational literature suggests some teachings strayfrom original data. The division of TBW into ICF and ECF isfrequently taught as an arbitrary distribution rather than aproduct of cell volume homeostasis and the relative partition-ing of body fat, protein, Na�, and K�. New investigations alsosuggest novel paradigms involving the dynamic nature of theinterstitium that critically regulate ECF homeostasis. Althoughdiet and the kidneys arbitrate blood volume homeostasis in thelong run, the interstitium plays a larger role in short termblood and interstitial volume adjustments. Short term Na�
storage and interstitial volume homeostasis may be relevant totransient or nonequilibrium phenomena such as BP dipping,flash pulmonary edema, rapid blood loss, burns, and sepsis, toname a few. Future investigation will hopefully unify the mo-lecular and structural biology of interstitial cell-matrix inter-actions with classic Starling physiology to identify new thera-peutic targets for hemodynamic derangements.
ACKNOWLEDGMENTSThe authors thank Raymond Harris, Sanjeev Shah, Peter Aronson, and Ro-
land Blantz for comments on earlier versions of this manuscript and Sergei
Chetyrkin for translation of the references in Russian.
DISCLOSURESNone.
REFERENCES
1. Fanestil DD: Compartmentation of body water. In: Clinical Disordersof Fluid and Electrolyte Metabolism. Fifth Ed., edited by Narins, RG,New York, McGraw-Hill, 1994, pp. 3–20
2. Edelman IS, Leibman J: Anatomy of body water and electrolytes.Am J Med 27: 256–277, 1959
3. Rose BD, Post TW: Clinical Physiology of Acid-Base and ElectrolyteDisorders, New York, McGraw-Hill, 2001
4. Moore FD, Olesen KH, McMurrey JD, Parker HV, Ball MR, BoydenCM: The Body Cell Mass and Its Supporting Environment, Philadel-phia, W.B. Saunders, 1963
5. Chumlea WC, Guo SS, Zeller CM, Reo NV, Baumgartner RN, GarryPJ, Wang J, Pierson RN Jr, Heymsfield SB, Siervogel RM: Total body
water reference values and prediction equations for adults. KidneyInt 59: 2250–2258, 2001
6. Ellis KJ: Reference man and woman more fully characterized: Varia-tions on the basis of body size, age, sex, and race. Biol Trace ElemRes 26–27: 385–400, 1990
7. Watson PE, Watson ID, Batt RD: Total body water volumes for adultmales and females estimated from simple anthropometric measure-ments. Am J Clin Nutr 33: 27–39, 1980
8. Waki M, Kral JG, Mazariegos M, Wang J, Pierson RN Jr, HeymsfieldSB: Relative expansion of extracellular fluid in obese vs. nonobesewomen. Am J Physiol 261: E199–E203, 1991
9. Silva AM, Heymsfield SB, Gallagher D, Albu J, Pi-Sunyer XF, PiersonRN Jr, Wang J, Heshka S, Sardinha LB, Wang Z: Evaluation ofbetween-methods agreement of extracellular water measurements inadults and children. Am J Clin Nutr 88: 315–323, 2008
10. Wang J, Pierson RN Jr: Disparate hydration of adipose and leantissue require a new model for body water distribution in man. J Nutr106: 1687–1693, 1976
11. Gamble JL Jr, Robertson JS, Hannigan CA, Foster CG, Farr LE:Chloride, bromide, sodium, and sucrose spaces in man. J Clin Invest32: 483–489, 1953
12. Nichols G Jr, Nichols N, Weil WB, Wallace WM: The direct measure-ment of the extracellular phase of tissues. J Clin Invest 32: 1299–1308, 1953
13. Swan RC, Madisso H, Pitts RF: Measurement of extracellular fluidvolume in nephrectomized dogs. J Clin Invest 33: 1447–1456, 1954
14. Forbes, GB: Human body composition: Growth, aging, nutrition, andactivity, New York, Springer-Verlag, 1987
15. Cheek DB: Extracellular volume: its structure and measurement andthe influence of age and disease. J Pediatr 58: 103–125, 1961
16. Basic anatomical and physiological data for use in radiological pro-tection: reference values: A report of age- and gender-related dif-ferences in the anatomical and physiological characteristics of refer-ence individuals. ICRP Publication 89. Ann ICRP 32: 5–265, 2002
17. International Commission on Radiological Protection. Task Group onReference Man: Report of the Task Group on Reference Man: Areport, New York, Pergamon Press, 1975
18. Basic anatomical and physiological data for use in radiological pro-tection: The skeleton. A report of a Task Group of Committee 2 ofthe International Commission on Radiological Protection. Ann ICRP25: 1–80, 1995
19. Bischoff, E: Einige Gewichts and Trockenbestimmungen der Organedes mensch lichen Korpers. Zeitsch fu rationelle Medizin 3: 75, 1863
20. Cooper AR, Forbes RM, Mitchell HH: Further studies on the grosscomposition and mineral elements of the adult human body. J BiolChem 223: 969–975, 1956
21. Edelman IS, James AH, Baden H, Moore FD: Electrolyte compositionof bone and the penetration of radiosodium and deuterium oxideinto dog and human bone. J Clin Invest 33: 122–131, 1954
22. Forbes GB, Lewis AM: Total sodium, potassium and chloride in adultman. J Clin Invest 35: 596–600, 1956
23. Forbes RM, Cooper AR, Mitchell HH: The composition of the adulthuman body as determined by chemical analysis. J Biol Chem 203:359–366, 1953
24. Clarys JP, Martin AD, Drinkwater DT: Gross tissue weights in thehuman body by cadaver dissection. Hum Biol 56: 459–473, 1984
25. Robinson, RA: Chemical Analysis and Electron Microscopy of Bone.In: Bone as a Tissue, edited by Rodahl K, Nicholson, JT, Brown, EM,Philadelphia, McGraw-Hill, 1960, pp. 186–251
26. Michelsen K: Determination in inulin, albumin and erythrocyte spacesin the bone marrow of rabbits. Acta Physiol Scand 77: 28–35, 1969
27. Aukland K, Nicolaysen G: Interstitial fluid volume: Local regulatorymechanisms. Physiol Rev 61: 556–643, 1981
28. Strange K: Cellular volume homeostasis. Adv Physiol Educ 28: 155–159, 2004
29. Stein WD: Cell volume homeostasis: Ionic and nonionic mechanisms.
BRIEF REVIEWwww.jasn.org
J Am Soc Nephrol 22: 2166–2181, 2011 Body Fluid Dynamics 2177
The sodium pump in the emergence of animal cells. Int Rev Cytol215: 231–258, 2002
30. Willis JS: The balancing act of the naked cell: A brief history ofmembrane regulation of animal cell volume before 1978. Adv ExpMed Biol 559: 1–9, 2004
31. Blandamer MJ, Engberts JB, Gleeson PT, Reis JC: Activity of water inaqueous systems: A frequently neglected property. Chem Soc Rev34: 440–458, 2005
32. Elliott JA, Prickett RC, Elmoazzen HY, Porter KR, McGann LE: Amultisolute osmotic virial equation for solutions of interest in biology.J Phys Chem B 111: 1775–1785, 2007
33. Essig A, Caplan SR: The use of linear nonequilibrium thermodynam-ics in the study of renal physiology. Am J Physiol 236: F211–F219,1979
34. Staverman AJ: The theory of measurement of osmotic pressure.Recueil des Travaux Chimiques des Pays-Bas 70: 344–352, 1951
35. Essig A, Caplan SR: Water movement: Does thermodynamic inter-pretation distort reality? Am J Physiol 256: C694–C698, 1989
36. Kedem O, Katchalsky A: Thermodynamic analysis of the permeabilityof biological membranes to non-electrolytes. Biochim Biophys Acta27: 229–246, 1958
37. Kedem O, Katchalsky A: A physical interpretation of the phenome-nological coefficients of membrane permeability. J Gen Physiol 45:143–179, 1961
38. Meyer MM, Verkman AS: Human platelet osmotic water and non-electrolyte transport. Am J Physiol 251: C549–C557, 1986
39. Chou CL, Sands JM, Nonoguchi H, Knepper MA: Urea gradient-associated fluid absorption with sigma urea � 1 in rat terminalcollecting duct. Am J Physiol 258: F1173–F1180, 1990
40. Sands JM, Knepper MA: Urea permeability of mammalian innermedullary collecting duct system and papillary surface epithelium.J Clin Invest 79: 138–147, 1987
41. Cass A, Finkelstein A: Water permeability of thin lipid membranes.J Gen Physiol 50: 1765–1784, 1967
42. Ly HV, Longo ML: The influence of short-chain alcohols on interfacialtension, mechanical properties, area/molecule, and permeability offluid lipid bilayers. Biophys J 87: 1013–1033, 2004
43. Sands JM: Urea transport: It’s not just “freely diffusible” anymore.News Physiol Sci 14: 46–47, 1999
44. Curry FE, Michel CC, Mason JC: Osmotic reflection coefficients ofcapillary walls to low molecular weight hydrophilic solutes measuredin single perfused capillaries of the frog mesentery. J Physiol 261:319–336, 1976
45. Landis EM, Pappenheimer, JR: Exchange of substances through thecapillary walls. In: Handbook of Physiology: Section 2: Circulation,Volume 2, edited by Hamilton WF, Dow P, Washington DC, Ameri-can Physiological Society, Williams & Wilkins, 1963
46. Vargas F, Johnson JA: Permeability of rabbit heart capillaries tononelectrolytes. Am J Physiol 213: 87–93, 1967
47. Crone C: The permeability of brain capillaries to non-electrolytes.Acta Physiol Scand 64: 407–417, 1965
48. Fenstermacher JD, Johnson JA: Filtration and reflection coefficientsof the rabbit blood-brain barrier. Am J Physiol 211: 341–346, 1966
49. Silver SM, Sterns RH, Halperin ML: Brain swelling after dialysis: Oldurea or new osmoles? Am J Kidney Dis 28: 1–13, 1996
50. Wolf MB, Watson PD: Measurement of osmotic reflection coefficientfor small molecules in cat hindlimbs. Am J Physiol 256: H282–H290,1989
51. Sweeney TE, Beuchat CA: Limitations of methods of osmometry:Measuring the osmolality of biological fluids. Am J Physiol 264:R469–R480, 1993
52. Overbeek JT: The Donnan equilibrium. Prog Biophys Biophys Chem6: 57–84, 1956
53. Adair GS, Robinson ME: The analysis of the osmotic pressures of theserum proteins, and the molecular weights of albumins and globu-lins. Biochem J 24: 1864–1889, 1930
54. Nitta S, Ohnuki T, Ohkuda K, Nakada T, Staub NC: The correctedprotein equation to estimate plasma colloid osmotic pressure and itsdevelopment on a nomogram. Tohoku J Exp Med 135: 43–49, 1981
55. Scatchard G, Batchelder AC, Brown A: Chemical, clinical, and immu-nological studies on the products of human plasma fractionation: VI.The osmotic pressure of plasma and of serum albumin. J Clin Invest23: 458–464, 1944
56. Ahlqvist J: Equation for osmotic pressure of serum protein (fractions).J Appl Physiol 96: 762–764, 2004
57. Ott H: [Calculation of the colloidal osmotic serum pressure from theprotein spectrum, and the average molecular weight of serum pro-tein fractions]. Klin Wochenschr 34: 1079–1083, 1956
58. Kallee E: Bennhold’s analbuminemia: A follow-up study of the firsttwo cases (1953–1992). J Lab Clin Med 127: 470–480, 1996
59. Koot BG, Houwen R, Pot DJ, Nauta J: Congenital analbuminaemia:Biochemical and clinical implications. A case report and literaturereview. Eur J Pediatr 163: 664–670, 2004
60. Nagase S, Shimamune K, Shumiya S: Albumin-deficient rat mutant.Science 205: 590–591, 1979
61. Kaysen GA: Plasma composition in the nephrotic syndrome. Am JNephrol 13: 347–359, 1993
62. Vavricka SR, Burri E, Beglinger C, Degen L, Manz M: Serum proteinelectrophoresis: An underused but very useful test. Digestion 79:203–210, 2009
63. Barclay SA, Bennett D: The direct measurement of plasma colloidosmotic pressure is superior to colloid osmotic pressure derived fromalbumin or total protein. Intensive Care Med 13: 114–118, 1987
64. Friedman AN, Fadem SZ: Reassessment of albumin as a nutritionalmarker in kidney disease. J Am Soc Nephrol 21: 223–230, 2010
65. Gennari FJ: Current concepts: Serum osmolality. Uses and limita-tions. N Engl J Med 310: 102–105, 1984
66. Mange K, Matsuura D, Cizman B, Soto H, Ziyadeh FN, Goldfarb S,Neilson EG: Language guiding therapy: The case of dehydrationversus volume depletion. Ann Intern Med 127: 848–853, 1997
67. Oster JR, Singer I: Hyponatremia, hyposmolality, and hypotonicity:Tables and fables. Arch Intern Med 159: 333–336, 1999
68. Orlov SN, Hamet P: Intracellular monovalent ions as second messen-gers. J Membr Biol 210: 161–172, 2006
69. Leaf A: On the mechanism of fluid exchange of tissues in vitro.Biochem J 62: 241–248, 1956
70. Kurbel S: Are extracellular osmolality and sodium concentration de-termined by Donnan effects of intracellular protein charges and ofpumped sodium? J Theor Biol 252: 769–772, 2008
71. Macknight AD, Leaf A: Regulation of cellular volume. Physiol Rev 57:510–573, 1977
72. Boddy K, Brown JJ, Davies DL, Elliott A, Harvey I, Haywood JK,Holloway I, Lever AF, Robertson JI, Williams ED: Concurrent estima-tion of total body and exchangeable body sodium in hypertension.Clin Sci Mol Med 54: 187–191, 1978
73. Chamberlain MJ, Fremlin JH, Peters DK, Philip H: Total body sodiumby whole body neutron activation in the living subject: Further evi-dence for non-exchangeable sodium pool. BMJ 2: 583–585, 1968
74. Edelman IS, James AH, Brooks L, Moore FD: Body sodium andpotassium: IV. The normal total exchangeable sodium: Its measure-ment and magnitude. Metabolism 3: 530–538, 1954
75. Corsa L Jr, Olney JM Jr, Steenburg RW, Ball MR, Moore FD: Themeasurement of exchangeable potassium in man by isotope dilution.J Clin Invest 29: 1280–1295, 1950
76. Muldowney FP, Crooks J, Bluhm MM: The relationship of total ex-changeable potassium and chloride to lean body mass, red cell massand creatinine excretion in man. J Clin Invest 36: 1375–1381, 1957
77. Schrier RW: Decreased effective blood volume in edematous disor-ders: What does this mean? J Am Soc Nephrol 18: 2028–2031, 2007
78. Gauer OH, Henry JP, Behn C: The regulation of extracellular fluidvolume. Annu Rev Physiol 32: 547–595, 1970
BRIEF REVIEW www.jasn.org
2178 Journal of the American Society of Nephrology J Am Soc Nephrol 22: 2166–2181, 2011
79. Hollenberg NK: Set point for sodium homeostasis: Surfeit, deficit,and their implications. Kidney Int 17: 423–429, 1980
80. Manning RD Jr, Guyton AC: Control of blood volume. Rev PhysiolBiochem Pharmacol 93: 70–114, 1982
81. Aukland K, Reed RK: Interstitial-lymphatic mechanisms in the controlof extracellular fluid volume. Physiol Rev 73: 1–78, 1993
82. Renkin EM: Some consequences of capillary permeability to macro-molecules: Starling’s hypothesis reconsidered. Am J Physiol 250:H706–H710, 1986
83. Starling, EH: On the absorption of fluids from the connective tissuespaces. J Physiol 19: 312–326, 1896
84. Levick JR, Michel CC: Microvascular fluid exchange and the revisedStarling principle. Cardiovasc Res 87: 198–210, 2010
85. Lai WM, Hou JS, Mow VC: A triphasic theory for the swelling anddeformation behaviors of articular cartilage. J Biomech Eng 113:245–258, 1991
86. Maroudas A: Distribution and diffusion of solutes in articular carti-lage. Biophys J 10: 365–379, 1970
87. Aukland K, Wiig H, Tenstad O, Renkin EM: Interstitial exclusion ofmacromolecules studied by graded centrifugation of rat tail tendon.Am J Physiol 273: H2794–H2803, 1997
88. Reed RK, Lepsoe S, Wiig H: Interstitial exclusion of albumin in ratdermis and subcutis in over- and dehydration. Am J Physiol 257:H1819–H1827, 1989
89. Maroudas A, Bannon C: Measurement of swelling pressure in carti-lage and comparison with the osmotic pressure of constituent pro-teoglycans. Biorheology 18: 619–632, 1981
90. Meyer FA: Macromolecular basis of globular protein exclusion and ofswelling pressure in loose connective tissue (umbilical cord). BiochimBiophys Acta 755: 388–399, 1983
91. Maroudas AI: Balance between swelling pressure and collagen ten-sion in normal and degenerate cartilage. Nature 260: 808–809, 1976
92. Iozzo RV: Matrix proteoglycans: From molecular design to cellularfunction. Annu Rev Biochem 67: 609–652, 1998
93. Brace RA, Guyton AC: Interstitial fluid pressure: Capsule, free fluid,gel fluid, and gel absorption pressure in subcutaneous tissue. Micro-vasc Res 18: 217–228, 1979
94. Brace RA: Progress toward resolving the controversy of positive vs.negative interstitial fluid pressure. Circ Res 49: 281–297, 1981
95. Gyenge CC, Tenstad O, Wiig H: In vivo determination of steric andelectrostatic exclusion of albumin in rat skin and skeletal muscle.J Physiol 552: 907–916, 2003
96. Levick JR: Capillary filtration-absorption balance reconsidered inlight of dynamic extravascular factors. Exp Physiol 76: 825–857, 1991
97. Rippe B, Haraldsson B: Transport of macromolecules across micro-vascular walls: The two-pore theory. Physiol Rev 74: 163–219, 1994
98. Adamson RH, Lenz JF, Zhang X, Adamson GN, Weinbaum S, CurryFE: Oncotic pressures opposing filtration across non-fenestrated ratmicrovessels. J Physiol 557: 889–907, 2004
99. Hu X, Adamson RH, Liu B, Curry FE, Weinbaum S: Starling forces thatoppose filtration after tissue oncotic pressure is increased. Am JPhysiol Heart Circ Physiol 279: H1724–H1736, 2000
100. Drake RE, Dhother S, Teague RA, Gabel JC: Protein osmotic pressuregradients and microvascular reflection coefficients. Am J Physiol 273:H997–H1002, 1997
101. Weinbaum S, Tarbell JM, Damiano ER: The structure and function ofthe endothelial glycocalyx layer. Annu Rev Biomed Eng 9: 121–167,2007
102. Guyton AC: A concept of negative interstitial pressure based onpressures in implanted perforated capsules. Circ Res 12: 399–414,1963
103. Guyton AC, Granger HJ, Taylor AE: Interstitial fluid pressure. PhysiolRev 51: 527–563, 1971
104. Guyton AC: Interstitial fluid presure: II. Pressure-volume curves ofinterstitial space. Circ Res 16: 452–460, 1965
105. Wiig H, Reed RK: Compliance of the interstitial space in rats: II.Studies on skin. Acta Physiol Scand 113: 307–315, 1981
106. Pozzi A, Zent R: Integrins: Sensors of extracellular matrix and mod-ulators of cell function. Nephron Exp Nephrol 94: e77–84, 2003
107. Reed RK, Rubin K: Transcapillary exchange: Role and importance ofthe interstitial fluid pressure and the extracellular matrix. CardiovascRes 87: 211–217, 2010
108. Berg A, Rubin K, Reed RK: Cytochalasin D induces edema formationand lowering of interstitial fluid pressure in rat dermis. Am J PhysiolHeart Circ Physiol 281: H7–H13, 2001
109. Lund T, Onarheim H, Wiig H, Reed RK: Mechanisms behind in-creased dermal imbibition pressure in acute burn edema. Am JPhysiol 256: H940–H948, 1989
110. Reed RK, Rubin K, Wiig H, Rodt SA: Blockade of beta 1-integrins inskin causes edema through lowering of interstitial fluid pressure. CircRes 71: 978–983, 1992
111. Lund T, Wiig H, Reed RK: Acute postburn edema: Role of stronglynegative interstitial fluid pressure. Am J Physiol 255: H1069–H1074,1988
112. Reed RK, Rodt SA: Increased negativity of interstitial fluid pressureduring the onset stage of inflammatory edema in rat skin. Am JPhysiol 260: H1985–H1991, 1991
113. Heir S, Wiig H: Subcutaneous interstitial fluid colloid osmotic pres-sure in dehydrated rats. Acta Physiol Scand 133: 365–371, 1988
114. Moore FD: The effects of hemorrhage on body composition. N EnglJ Med 273: 567–577, 1965
115. Alper CA: Plasma protein measurements as a diagnostic aid. N EnglJ Med 291: 287–290, 1974
116. Armstrong SH Jr, Kark RM, Schoenberger JA, Shatkin J, Sights R:Colloid osmotic pressures of serum proteins in nephrosis and cirrho-sis: Relations to electrophoretic distributions and average molecularweights. J Clin Invest 33: 297–310, 1954
117. Fadnes HO, Pape JF, Sundsfjord JA: A study on oedema mechanismin nephrotic syndrome. Scand J Clin Lab Invest 46: 533–538, 1986
118. Koomans HA, Geers AB, Dorhout Mees EJ, Kortlandt W: Loweredtissue-fluid oncotic pressure protects the blood volume in the ne-phrotic syndrome. Nephron 42: 317–322, 1986
119. Canaan-Kuhl S, Venkatraman ES, Ernst SI, Olshen RA, Myers BD:Relationships among protein and albumin concentrations and on-cotic pressure in nephrotic plasma. Am J Physiol 264: F1052–F1059,1993
120. Theuns-Valks SD, van Wijk JA, van Heerde M, Dolman KM, Boken-kamp A: Abdominal pain and vomiting in a boy with nephroticsyndrome. Clin Pediatr 50: 470–473, 2011
121. Van de Walle JG, Donckerwolcke RA, Greidanus TB, Joles JA,Koomans HA: Renal sodium handling in children with nephroticrelapse: Relation to hypovolaemic symptoms. Nephrol Dial Trans-plant 11: 2202–2208, 1996
122. Wang SJ, Tsau YK, Lu FL, Chen CH: Hypovolemia and hypovolemicshock in children with nephrotic syndrome. Acta Paediatr Taiwan 41:179–183, 2000
123. Bernard DB, Alexander EA, Couser WG, Levinsky NG: Renal sodiumretention during volume expansion in experimental nephrotic syn-drome. Kidney Int 14: 478–485, 1978
124. Ichikawa I, Rennke HG, Hoyer JR, Badr KF, Schor N, Troy JL, LecheneCP, Brenner BM: Role for intrarenal mechanisms in the impaired saltexcretion of experimental nephrotic syndrome. J Clin Invest 71:91–103, 1983
125. Svenningsen P, Bistrup C, Friis UG, Bertog M, Haerteis S, Krueger B,Stubbe J, Jensen ON, Thiesson HC, Uhrenholt TR, Jespersen B,Jensen BL, Korbmacher C, Skott O: Plasmin in nephrotic urine acti-vates the epithelial sodium channel. J Am Soc Nephrol 20: 299–310,2009
126. Vande Walle JG, Donckerwolcke RA, van Isselt JW, Derkx FH, JolesJA, Koomans HA: Volume regulation in children with early relapse of
BRIEF REVIEWwww.jasn.org
J Am Soc Nephrol 22: 2166–2181, 2011 Body Fluid Dynamics 2179
minimal-change nephrosis with or without hypovolaemic symptoms.Lancet 346: 148–152, 1995
127. Palmer BF, Alpern RJ: Pathogenesis of edema formation in thenephrotic syndrome. Kidney Int Suppl 59: S21–S27, 1997
128. Schrier RW, Fassett RG: A critique of the overfill hypothesis of sodiumand water retention in the nephrotic syndrome. Kidney Int 53: 1111–1117, 1998
129. Rostoker G, Behar A, Lagrue G: Vascular hyperpermeability in ne-phrotic edema. Nephron 85: 194–200, 2000
130. Koomans, HA: Pathophysiology of oedema in idiopathic nephroticsyndrome. Nephrol Dial Transplant 18[Suppl 6]: vi30–vi32, 2003
131. Vande Walle JG, Donckerwolcke RA, Koomans HA: Pathophysiologyof edema formation in children with nephrotic syndrome not due tominimal change disease. J Am Soc Nephrol 10: 323–331, 1999
132. Appelboom JW, Brodsky WA, Tuttle WS, Diamond I: The freezingpoint depression of mammalian tissues after sudden heating in boil-ing distilled water. J Gen Physiol 41: 1153–1169, 1958
133. Maffly RH, Leaf A: The potential of water in mammalian tissues. J GenPhysiol 42: 1257–1275, 1959
134. Hillier TA, Abbott RD, Barrett EJ: Hyponatremia: Evaluating thecorrection factor for hyperglycemia. Am J Med 106: 399–403, 1999
135. Moran SM, Jamison RL: The variable hyponatremic response tohyperglycemia. West J Med 142: 49–53, 1985
136. Tzamaloukas AH, Ing TS, Siamopoulos KC, Rohrscheib M, Elisaf MS,Raj DS, Murata GH: Body fluid abnormalities in severe hyperglycemiain patients on chronic dialysis: Theoretical analysis. J Diabetes Com-plications 21: 374–380, 2007
137. Nguyen MK, Kurtz I: Is the osmotically inactive sodium storage poolfixed or variable? J Appl Physiol 102: 445–447, 2007
138. Basser PJ, Schneiderman R, Bank RA, Wachtel E, Maroudas A: Me-chanical properties of the collagen network in human articular carti-lage as measured by osmotic stress technique. Arch Biochem Bio-phys 351: 207–219, 1998
139. Farber SJ, Soberman RJ: Total body water and total exchangeablesodium in edematous states due to cardiac, renal or hepatic disease.J Clin Invest 35: 779–791, 1956
140. Heer M, Baisch F, Kropp J, Gerzer R, Drummer C: High dietarysodium chloride consumption may not induce body fluid retention inhumans. Am J Physiol Renal Physiol 278: F585–F595, 2000
141. Kaye M: An investigation into the cause of hyponatremia in thesyndrome of inappropriate secretion of antidiuretic hormone. Am JMed 41: 910–926, 1966
142. Palacios C, Wigertz K, Martin BR, Jackman L, Pratt JH, Peacock M,McCabe G, Weaver CM: Sodium retention in black and white femaleadolescents in response to salt intake. J Clin Endocrinol Metab 89:1858–1863, 2004
143. Schwartz WB, Bennett W, Curelop S, Bartter FC: A syndrome of renalsodium loss and hyponatremia probably resulting from inappropriatesecretion of antidiuretic hormone. Am J Med 23: 529–542, 1957
144. Clift GV, Schletter FE, Moses AM, Streeten DH: Syndrome of inap-propriate vasopressin secretion: Studies on the mechanism of thehyponatremia in a patient. Arch Intern Med 118: 453–460, 1966
145. Deming Q, Gerbode F: Observations on sodium balance in patientsundergoing mitral valvotomy. Surg Forum 4: 18–22, 1953
146. Roos JC, Koomans HA, Dorhout Mees EJ, Delawi IM: Renal sodiumhandling in normal humans subjected to low, normal, and extremelyhigh sodium supplies. Am J Physiol 249: F941–F947, 1985
147. Seeliger E, Ladwig M, Reinhardt HW: Are large amounts of sodiumstored in an osmotically inactive form during sodium retention?Balance studies in freely moving dogs. Am J Physiol Regul IntegrComp Physiol 290: R1429–R1435, 2006
148. Wilson GM, Edelman IS, Brooks L, Myrden JA, Harken DE, MooreFD: Metabolic changes associated with mitral valvuloplasty. Circula-tion 9: 199–219, 1954
149. Wynn V: The osmotic behaviour of the body cells in man: Significance
of changes of plasma-electrolyte levels in body-fluid disorders. Lan-cet 273: 1212–1218, 1957
150. Heer M, Frings-Meuthen P, Titze J, Boschmann M, Frisch S, BaeckerN, Beck L: Increasing sodium intake from a previous low or highintake affects water. Br J Nutr 101: 1286–1294, 2009
151. Luft FC, Rankin LI, Bloch R, Weyman AE, Willis LR, Murray RH, GrimCE, Weinberger MH: Cardiovascular and humoral responses to ex-tremes of sodium intake in normal black and white men. Circulation60: 697–706, 1979
152. Nolph KD, Schrier RW: Sodium, potassium and water metabolism inthe syndrome of inappropriate antidiuretic hormone secretion. Am JMed 49: 534–545, 1970
153. Holbrook JT, Patterson KY, Bodner JE, Douglas LW, Veillon C, KelsayJL, Mertz W, Smith JC Jr: Sodium and potassium intake and balancein adults consuming self-selected diets. Am J Clin Nutr 40: 786–793,1984
154. Kopple, JD: Uses and limitations of the balance technique. JPEN JParenter Enteral Nutr 11: 79S–85S, 1987
155. Wilson GM, Olney JM, Brooks L, Myrden JA, Ball MR, Moore FD:Body sodium and potassium: II. A comparison of metabolic balanceand isotope dilution methods of study. Metabolism 3: 324–333,1954
156. Titze J, Bauer K, Schafflhuber M, Dietsch P, Lang R, Schwind KH, LuftFC, Eckardt KU, Hilgers KF: Internal sodium balance in DOCA-saltrats: A body composition study. Am J Physiol Renal Physiol 289:F793–F802, 2005
157. Zolotova VF, Priadeina TE, Archibasova VK, Shterental IS: [Distribu-tion of sodium in the tissues in experimental salt hypertension].Kardiologiia 15: 32–36, 1975
158. Titze J, Krause H, Hecht H, Dietsch P, Rittweger J, Lang R, Kirsch KA,Hilgers KF: Reduced osmotically inactive Na storage capacity andhypertension in the Dahl model. Am J Physiol Renal Physiol 283:F134–F141, 2002
159. Machnik A, Neuhofer W, Jantsch J, Dahlmann A, Tammela T, Ma-chura K, Park JK, Beck FX, Muller DN, Derer W, Goss J, Ziomber A,Dietsch P, Wagner H, van Rooijen N, Kurtz A, Hilgers KF, Alitalo K,Eckardt KU, Luft FC, Kerjaschki D, Titze J: Macrophages regulatesalt-dependent volume and blood pressure by a vascular endothelialgrowth factor-C-dependent buffering mechanism. Nat Med 15: 545–552, 2009
160. Ivanova LN, Archibasova VK, Shterental I: [Sodium-depositing func-tion of the skin in white rats]. Fiziol Zh SSSR Im I M Sechenova 64:358–363, 1978
161. Titze J, Shakibaei M, Schafflhuber M, Schulze-Tanzil G, Porst M,Schwind KH, Dietsch P, Hilgers KF: Glycosaminoglycan polymeriza-tion may enable osmotically inactive Na� storage in the skin. Am JPhysiol Heart Circ Physiol 287: H203–H208, 2004
162. Boardman KC, Swartz MA: Interstitial flow as a guide for lymphan-giogenesis. Circ Res 92: 801–808, 2003
163. Browning JA, Saunders K, Urban JP, Wilkins RJ: The influence andinteractions of hydrostatic and osmotic pressures on the intracellularmilieu of chondrocytes. Biorheology 41: 299–308, 2004
164. Rutkowski JM, Swartz MA: A driving force for change: Interstitial flowas a morphoregulator. Trends Cell Biol 17: 44–50, 2007
165. Urban JP, Bayliss MT: Regulation of proteoglycan synthesis rate incartilage in vitro: Influence of extracellular ionic composition.Biochim Biophys Acta 992: 59–65, 1989
166. Maroudas A, Evans H: A study of ionic equilibria in cartilage. Con-nective Tissue Research 1: 69–77, 1972
167. McGee MP, Morykwas M, Levi-Polyachenko N, Argenta L: Swellingand pressure-volume relationships in the dermis measured by osmot-ic-stress technique. Am J Physiol Regul Integr Comp Physiol 296:R1907–R1913, 2009
168. Urban JP: The chondrocyte: A cell under pressure. Br J Rheumatol33: 901–908, 1994
BRIEF REVIEW www.jasn.org
2180 Journal of the American Society of Nephrology J Am Soc Nephrol 22: 2166–2181, 2011
169. Hopewell B, Urban JP: Adaptation of articular chondrocytes tochanges in osmolality. Biorheology 40: 73–77, 2003
170. Kurtz TW, Al-Bander HA, Morris RC Jr: “Salt-sensitive” essentialhypertension in men: Is the sodium ion alone important? N EnglJ Med 317: 1043–1048, 1987
171. Kurtz TW, Morris RC Jr: Dietary chloride as a determinant of “sodi-um-dependent” hypertension. Science 222: 1139–1141, 1983
172. Luft FC, Zemel MB, Sowers JA, Fineberg NS, Weinberger MH: So-dium bicarbonate and sodium chloride: Effects on blood pressureand electrolyte homeostasis in normal and hypertensive man. J Hy-pertens 8: 663–670, 1990
173. Ziomber A, Machnik A, Dahlmann A, Dietsch P, Beck FX, Wagner H,Hilgers KF, Luft FC, Eckardt KU, Titze J: Sodium-, potassium-, chlo-ride-, and bicarbonate-related effects on blood pressure and elec-trolyte homeostasis in deoxycorticosterone acetate-treated rats.Am J Physiol Renal Physiol 295: F1752–F1763, 2008
174. Green J, Kleeman CR: Role of bone in regulation of systemic acid-base balance. Kidney Int 39: 9–26, 1991
175. Neuman WF, Mulryan BJ: Synthetic hydroxyapatite crystals: 3. Thecarbonate system. Calcif Tissue Res 1: 94–104, 1967
176. Nichols N, Nichols G Jr: Effect of large loads of sodium on bone andsoft tissue composition. Proc Soc Exp Biol Med 96: 835–839, 1957
177. Ivanova LN, Melidi NN, Merjeyevskaya VM, Sterental LS, ZolotovaVF: The response to water-salt loading: Sodium metabolism inspontaneously hypertensive rats. Biomed Biochim Acta 46: 993–997, 1987
178. Merzhievskaia VM, Shterental I: [Kinetics of tissue sodium metabo-lism and the vascular reactivity to vasopressor agents in healthy
persons with different degree of risk of developing arterial hyperten-sion]. Kardiologiia 28: 30–33, 1988
179. Bernstein AM, Willett WC: Trends in 24-h urinary sodium excretion inthe United States, 1957–2003: A systematic review. Am J Clin Nutr92: 1172–1180, 2010
180. Brown IJ, Tzoulaki I, Candeias V, Elliott P: Salt intakes around the world:Implications for public health. Int J Epidemiol 38: 791–813, 2009
181. McCarron DA, Geerling JC, Kazaks AG, Stern JS: Can dietary sodiumintake be modified by public policy? Clin J Am Soc Nephrol 4:1878–1882, 2009
182. Ferrannini E, Smith JD, Cobelli C, Toffolo G, Pilo A, DeFronzo RA:Effect of insulin on the distribution and disposition of glucose in man.J Clin Invest 76: 357–364, 1985
183. Forbes GB: Studies on sodium in bone. J Pediatr 56: 180–190, 1960184. Manery JF: Water and electrolyte metabolism. Physiol Rev 34: 334–
417, 1954185. Levitt DG: The pharmacokinetics of the interstitial space in humans.
BMC Clin Pharmacol 3: 3, 2003186. Gong JK, Arnold JS, Cohn SH: Composition of trabecular and corti-
cal bone. Anat Rec 149: 325–331, 1964187. Gilanyi M, Ikrenyi C, Fekete J, Ikrenyi K, Kovach AG: Ion concentra-
tions in subcutaneous interstitial fluid: Measured versus expectedvalues. Am J Physiol 255: F513–F519, 1988
Supplemental information for this article is available online at http://www.jasn.org/.
BRIEF REVIEWwww.jasn.org
J Am Soc Nephrol 22: 2166–2181, 2011 Body Fluid Dynamics 2181