Embed Size (px)
Citation preview
-1-
BOARD INDEPENDENCE AND LONG-TERM FIRM PERFORMANCE
Sanjai Bhagat and Bernard Black1
February 2000
(earlier drafts were titled: Do Independent Directors Matter?)
Abstract
The boards of directors of American public companies are dominated by independentdirectors. Moreover, many commentators and institutional investors believe thatindependent directors should be even more numerically dominant on public companyboards than they are today. We conduct the first large sample, long-horizon study ofwhether board independence (proxied by proportion of independent directors minusproportion of inside directors) correlates with the long-term performance of large Americanfirms. We find evidence that firms suffering from low profitability respond by increasing theindependence of their board of directors, but no evidence that this strategy works that firmswith more independent boards achieve improved profitability. Our results do not supportthe conventional wisdom that greater board independence improves firm performance.
Comments welcome. Please address correspondence to either author:
Professor Sanjai Bhagat Professor Bernard BlackGraduate School of Business Stanford Law SchoolUniv. of Colorado - Boulder Stanford CA 94305Boulder CO 80309-0419tel: (303) 492-7821 tel: (650) 725-9845
1 Professor of Finance, Graduate School of Business, University of Colorado at Boulder, and Professor of Law,Stanford Law School. Research support was provided by the Q Group and the Institutional Investor Project at ColumbiaLaw School. We thank Institutional Shareholder Services for making its director database available to us. We also thankGeorge Benston, James Brickley, Gerald Davis, John Donohue, Jeff Gordon, Milton Handler, David Ikenberry, EhudKamar, Stacey Kole, April Klein, Sherry Jarrell, Stacey Kole, Bevis Longstreth, Anil Shivdasani, Randall Thomas, DavidYermack, Marc Zenner, anonymous referees, participants in workshops at the Atlanta Finance Forum, American FinanceAssociation, Columbia Law School, Georgetown Law School, NYU Center for Law and Business, Rice University,University of Rochester (Simon School of Business), and Stanford Law School, for comments and Renee Johnson, RobertKing, Ann Le, Karen Lutz, Michelle Ontiveros, Michael Reyes, Mark Rysman, Sapna Sanagavarapu, Yan Yang, and HelenYu for research assistance.
-2-
fax: (303) 492-5962 fax: (650) [email protected] [email protected]
Most large American public companies have boards with a majority of independent directors;
almost all have a majority of outside directors. This pattern reflects the common view that the board's
principal task is to monitor management, and only independent directors can be vigorous monitors. In
contrast, an insider-dominated board is seen as a device for management entrenchment (e.g., Eisenberg,
1976; Millstein, 1993; American Law Institute, 1994). The proposition that large-company boards should
consist mostly of independent directors has become conventional wisdom. For example, guidelines adopted
by the Council of Institutional Investors (1998) call for at least 2/3 of a company's directors to be
independent; guidelines adopted by the California Public Employees Retirement System (1998) and by the
National Association of Corporate Directors (1996) call for boards to have a "substantial majority" of
independent directors. This conventional wisdom has only an occasional dissenting voice (e.g., Longstreth,
1994; Tobin, 1994).
Does greater board independence produce better corporate performance, as conventional wisdom
predicts? Conversely, does board composition respond to firm performance? The quantitative research
on these questions has been inconclusive.
We report here evidence from the first large-scale, long-time-horizon study of the relationship
between board independence and the long-term performance of large firms. We study measures of financial
performance and growth from 1985-1995 for 934 of the largest United States firms, using data on these
firms' boards of directors in early 1991 and data for a random subsample of 205 firms from early 1988.
We follow the common practice of dividing directors into inside directors (persons who are currently
officers of the company), affiliated directors (relatives of officers; persons who are likely to have business
-3-
relationships with the company, such as investment bankers and lawyers; or persons who were officers in
the recent past) and independent directors (outside directors without such affiliations) (see the definitions
provided by Institutional Shareholder Services, 1998, p. 3.11; Council of Institutional Investors, 1991).2
We indicate the proportions of independent and inside directors as findep and finside, respectively.
Prior studies have generally used findep as the board composition variable of interest. This effectively treats
inside and affiliated directors as equally (non)independent, when in fact, affiliated directors may often be
substantially independent. We instead measure board independence as INDEP = findep - finside. This
effectively treats independent, affiliated, and inside directors as having independence weights of +1, 0, and
-1, respectively.
Our principal result: low-profitability firms respond by increasing board independence. But this
strategy doesn't work. Firms with more independent boards don’t achieve improved profitability. This
suggests that the conventional wisdom stressing the importance of board independence lacks empirical
support, and could detract from other, perhaps more effective strategies for addressing poor firm
performance.
These results persist: (i) after controlling for board size, firm size, industry effects, CEO stock
ownership, stock ownership by outside directors, and number and size of outside 5% blockholders; (ii) in
both an ordinary least squares and a simultaneous equations framework; (iii) when we run Koenker-Bassett
(1978) robust regressions, which give less weight to outlying observations; and (iv) for regressions using
2 Our categories of "independent director," "affiliated director," and "inside director" correspond fairly closely to the"outside director," "grey director," and "inside director" categories used by Baysinger and Butler (1985), MacAvoy,
-4-
dummy variables for different ranges of INDEP as independent variables.
Cantor, Dana & Peck (1983), and Weisbach (1988).
This paper is organized as follows. The next section reviews briefly the literature on the relationship
between board composition and firm performance. Section 2 describes our research design and sample
characteristics. Section 3 discusses the correlation and direction of apparent causation among firm
profitability, board independence, and CEO share ownership. Section 4 explores the relationship between
firm growth rates and board independence. Section 5 develops possible explanations for our results.
-5-
1. Prior research on board composition
1.1 Does board composition affect firm performance?
Bhagat & Black (1999) recently surveyed the literature on how board composition affects firm
performance or vice versa, so the survey here is brief. Prior studies of the effect of board composition on
firm performance generally adopt one of two approaches. The first approach involves studying how board
composition affects the board's behavior on discrete tasks, such as replacing the CEO, awarding golden
parachutes, or making or defending against a takeover bid. This approach can involve tractable data, which
makes it easier for researchers to find statistically significant results. But it doesn't tell us how board
composition affects overall firm performance. For example, there is evidence that firms with majority-
independent boards perform better on particular tasks, such as replacing the CEO (Weisbach, 1988) and
making takeover bids (Byrd & Hickman, 1992). But these firms could perform worse on other tasks that
cannot readily be studied using this approach (such as appointing a new CEO or choosing a new strategic
direction for the firm), leading to no net advantage in overall performance.
This paper adopts the second approach of examining directly the correlation between board
composition and firm performance. This approach allows us to examine the "bottom line" of firm
performance (unlike the first approach), but involves much less tractable data. Firm performance must be
measured over a long period, which means that performance measures are noisy and perhaps misspecified;
see Kothari and Warner (1997) and Barber and Lyon (1996, 1997).
Prior research does not establish a clear correlation between board independence and firm
performance. Early work by Vance (1964) reports a positive correlation between proportion of inside

-6-
directors and a number of performance measures. Baysinger and Butler (1985), Hermalin and Weisbach
(1991), and MacAvoy, Cantor, Dana and Peck (1983) all report no significant same-year correlation
between board composition and various measures of corporate performance. Baysinger and Butler report
that the proportion of independent directors in 1970 correlates with 1980 industry-adjusted return on
equity. However, their 10-year lag period is very long for any effects of board composition on performance
to persist.
Three recent studies offer hints that firms with a high percentage of independent directors may
perform worse. Yermack (1996) reports a significant negative correlation between proportion of
independent directors and contemporaneous Tobin's q, but no significant correlation for several other
performance variables (sales/assets; operating income/assets; operating income/sales); Agrawal and
Knoeber (1996) report a negative correlation between proportion of outside directors and Tobin's q. Klein
(1998) reports a significant negative correlation between a measure of change in market value of equity and
proportion of independent directors, but insignificant results for return on assets and raw stock market
returns.
Event studies. Rosenstein and Wyatt (1990) find that stock prices increase by about 0.2%, on
average, when companies appoint additional outside directors. This increase, while statistically significant,
is economically small and could reflect signalling effects. Appointing an additional independent director
could signal that a company plans to address its business problems, even if board composition doesn't affect
the company's ability to address these problems. Rosenstein and Wyatt (1997) find that stock prices
neither increase or decrease on average when an insider is added to the board.
-7-
Composition of board committees. Klein (1998) finds that inside director representation on a
board's investment committee correlates with improved firm performance. She finds little evidence that
"monitoring" committees that are usually dominated by independent directors -- the audit, compensation,
and nominating committees -- affect performance, regardless of how they are staffed.
1.2 Does firm performance affect board composition?
Several researchers have examined whether board composition is endogenously related to firm
performance, with inconsistent results. Hermalin and Weisbach (1988) and Weisbach (1988, p. 454)
report that the proportion of independent directors on large firm boards increase slightly when a company
has performed poorly: firms in the bottom performance decile in year X increase their proportion of
independent directors by around 1% in year X+1, relative to other firms, during 1972-1983. In contrast,
Klein (1998) finds no tendency for firms in the bottom quintile for 1991 stock price returns to add more
independent directors in 1992 and 1993 than firms in the top quintile. Denis and Sarin (1999) report that
firms that substantially increase their proportion of independent directors had above-average stock price
returns in the previous year. They also report that average board composition for a group of firms changes
slowly over time and that board composition tends to regress to the mean, with firms with a high (low)
proportion of independent directors reducing (increasing) this percentage over time.
2. Research design and sample characteristics
2.1 Data collection procedure
-8-
This study seeks to directly measure the correlation between board independence and firm
performance, while (i) correcting weaknesses (especially limited sample size, short measurement period,
and limited control variables) in prior studies that may have led to failure to find significant results; and (ii)
using a simultaneous equations approach to attempt to determine if board composition affects firm
performance, firm performance affects board composition, or both. We use data on board composition
in early 1991 from a database compiled by Institutional Shareholder Services of 957 large U.S. public
corporations, including virtually all of the largest American firms. ISS classifies each director, at each firm,
as inside, independent, or affiliated. We exclude from this database 23 firms without stock price data
available on the CRSP tapes, to produce a "1991 sample" of 934 firms. We also use proxy statements
obtained from LEXIS/NEXIS to collect data on board composition in early 1988 for a randomly chosen
subsample of 205 firms.
We supplement this board data with data from Compustat on the sample firms' accounting
performance between 1985 and 1995 (available for 928 firms for at least some variables and some years);
data from CRSP on the sample firms' stock price performance during this period; and data on share
ownership obtained from proxy statements (available for 780 firms). We collect the following information
on holdings of voting shares (to the nearest 0.1%):3
3 Any share ownership study faces difficulty handling stock options and firms with two or more classes of votingstock. Our decision rules were as follows: SEC rules require ownership disclosure for options that are exercisablecurrently or within 60 days. We include these options in computing share ownership. When two classes of voting stockhave identical or nearly identical economic interests but different voting rights (typically two classes of common stock),we compute share ownership as percentage of total outstanding shares of both classes. This percentage economicinterest will generally differ from the shareholder's percentage voting interest. If two classes have different economicinterests (most commonly when a firm has voting convertible preferred stock), we use voting power as a proxy foreconomic interest, and compute ownership interest based on the percentage of total votes for shares of both classes. Where a firm has nonstandard titles, or separates the titles of CEO and Chairman, it can be difficult to determine who isthe real chief executive officer. If a firm has a "CEO" and a "Chairman of the Board" who are different people, we treat
-9-
the named "CEO" as the chief executive officer if the named "chairman" is an outsider with another primary job, and treatthe named "Chairman" as the chief executive officer if he appears to be an executive of the company without anotherprimary job. It can frustrating and sometimes impossible to determine from proxy statements a family group’s total shareownership when the family’s shares are held by multiple trusts with overlapping trustees. We treated such family groupsas a single shareholder, doing our best to compute total ownership. We treated the family group as an outsideshareholder if no person with that family name was a company officer.
-10-
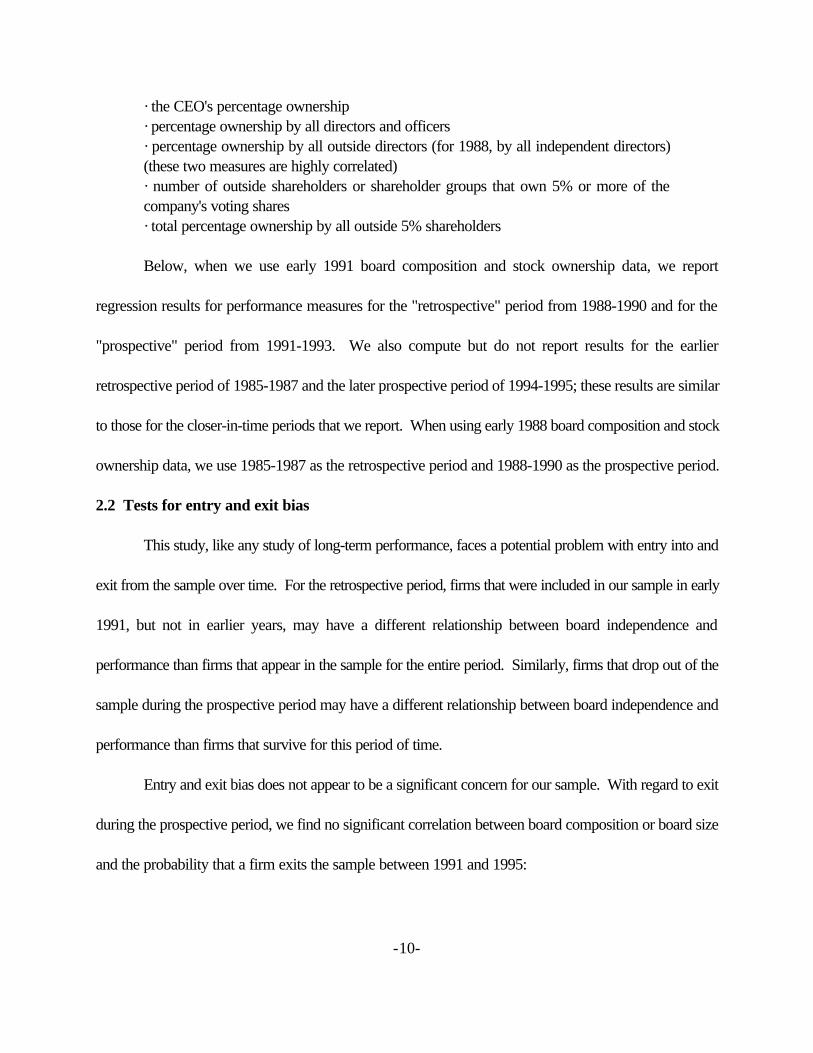
· the CEO's percentage ownership· percentage ownership by all directors and officers· percentage ownership by all outside directors (for 1988, by all independent directors)(these two measures are highly correlated)· number of outside shareholders or shareholder groups that own 5% or more of thecompany's voting shares· total percentage ownership by all outside 5% shareholders
Below, when we use early 1991 board composition and stock ownership data, we report
regression results for performance measures for the "retrospective" period from 1988-1990 and for the
"prospective" period from 1991-1993. We also compute but do not report results for the earlier
retrospective period of 1985-1987 and the later prospective period of 1994-1995; these results are similar
to those for the closer-in-time periods that we report. When using early 1988 board composition and stock
ownership data, we use 1985-1987 as the retrospective period and 1988-1990 as the prospective period.
2.2 Tests for entry and exit bias
This study, like any study of long-term performance, faces a potential problem with entry into and
exit from the sample over time. For the retrospective period, firms that were included in our sample in early
1991, but not in earlier years, may have a different relationship between board independence and
performance than firms that appear in the sample for the entire period. Similarly, firms that drop out of the
sample during the prospective period may have a different relationship between board independence and
performance than firms that survive for this period of time.
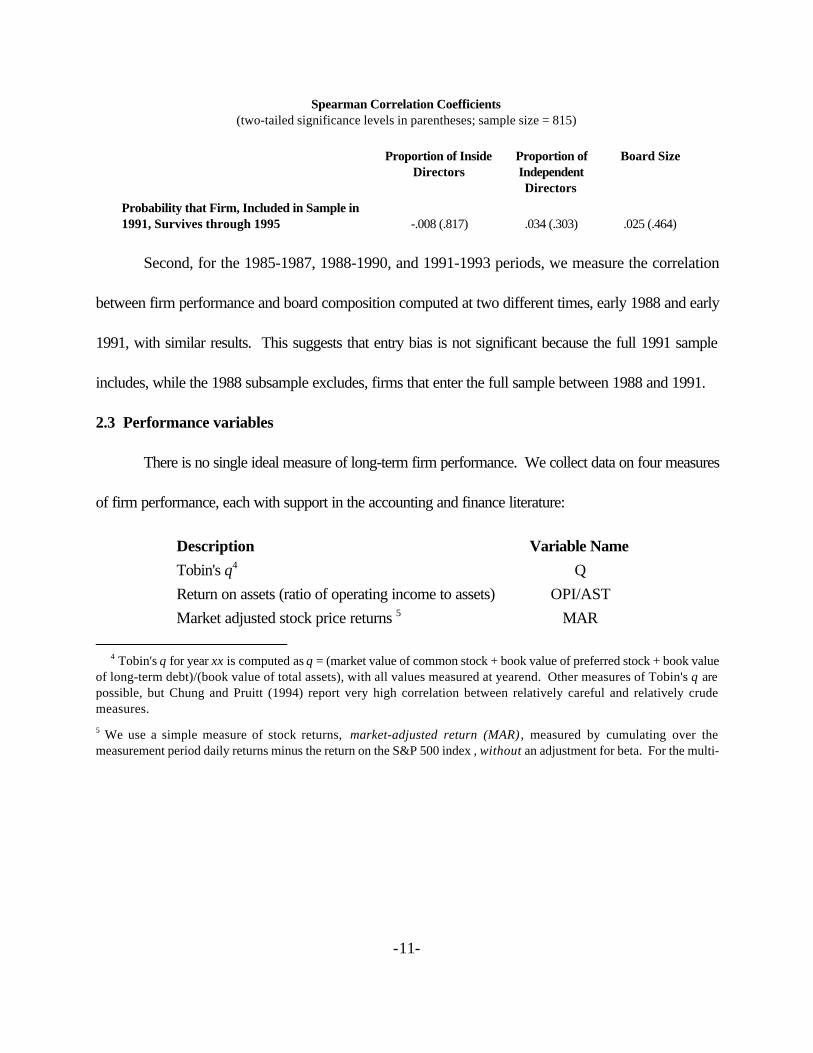
Entry and exit bias does not appear to be a significant concern for our sample. With regard to exit
during the prospective period, we find no significant correlation between board composition or board size
and the probability that a firm exits the sample between 1991 and 1995:
-11-
Spearman Correlation Coefficients(two-tailed significance levels in parentheses; sample size = 815)
Proportion of InsideDirectors
Proportion ofIndependentDirectors
Board Size
Probability that Firm, Included in Sample in1991, Survives through 1995 -.008 (.817) .034 (.303) .025 (.464)
Second, for the 1985-1987, 1988-1990, and 1991-1993 periods, we measure the correlation
between firm performance and board composition computed at two different times, early 1988 and early
1991, with similar results. This suggests that entry bias is not significant because the full 1991 sample
includes, while the 1988 subsample excludes, firms that enter the full sample between 1988 and 1991.
2.3 Performance variables
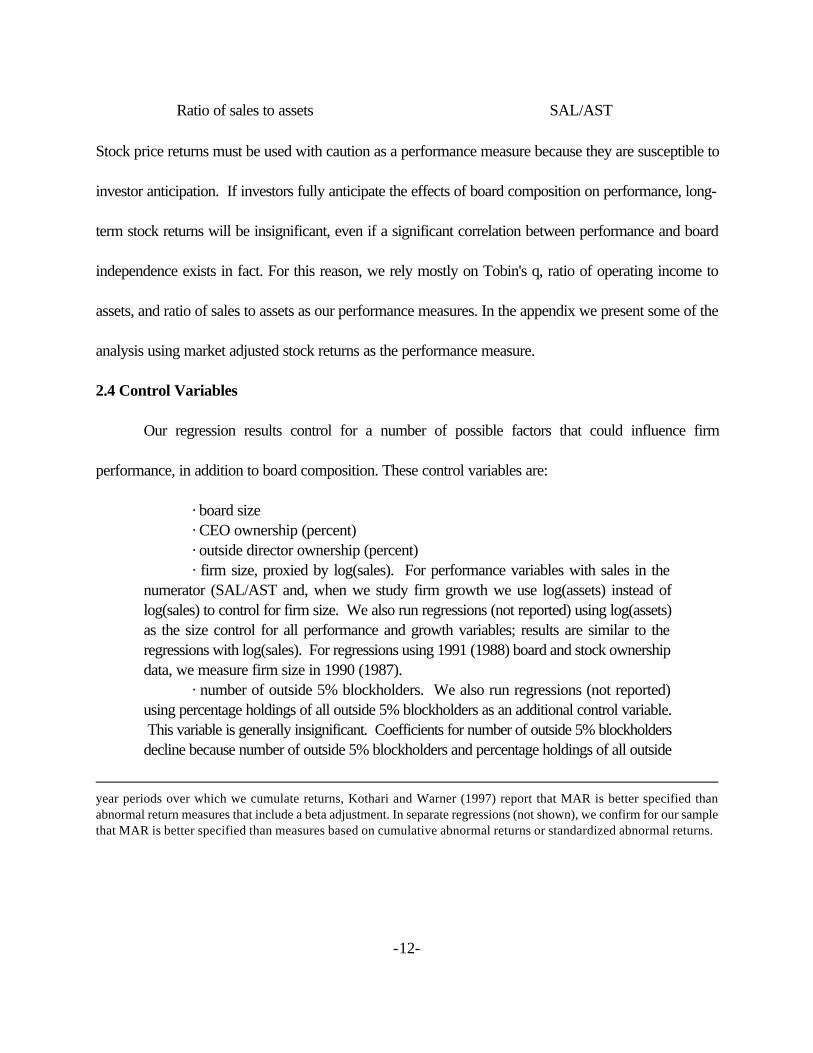
There is no single ideal measure of long-term firm performance. We collect data on four measures
of firm performance, each with support in the accounting and finance literature:
Description Variable NameTobin's q4 QReturn on assets (ratio of operating income to assets) OPI/ASTMarket adjusted stock price returns 5 MAR
4 Tobin's q for year xx is computed as q = (market value of common stock + book value of preferred stock + book valueof long-term debt)/(book value of total assets), with all values measured at yearend. Other measures of Tobin's q arepossible, but Chung and Pruitt (1994) report very high correlation between relatively careful and relatively crudemeasures.
5 We use a simple measure of stock returns, market-adjusted return (MAR) , measured by cumulating over themeasurement period daily returns minus the return on the S&P 500 index , without an adjustment for beta. For the multi-
-12-
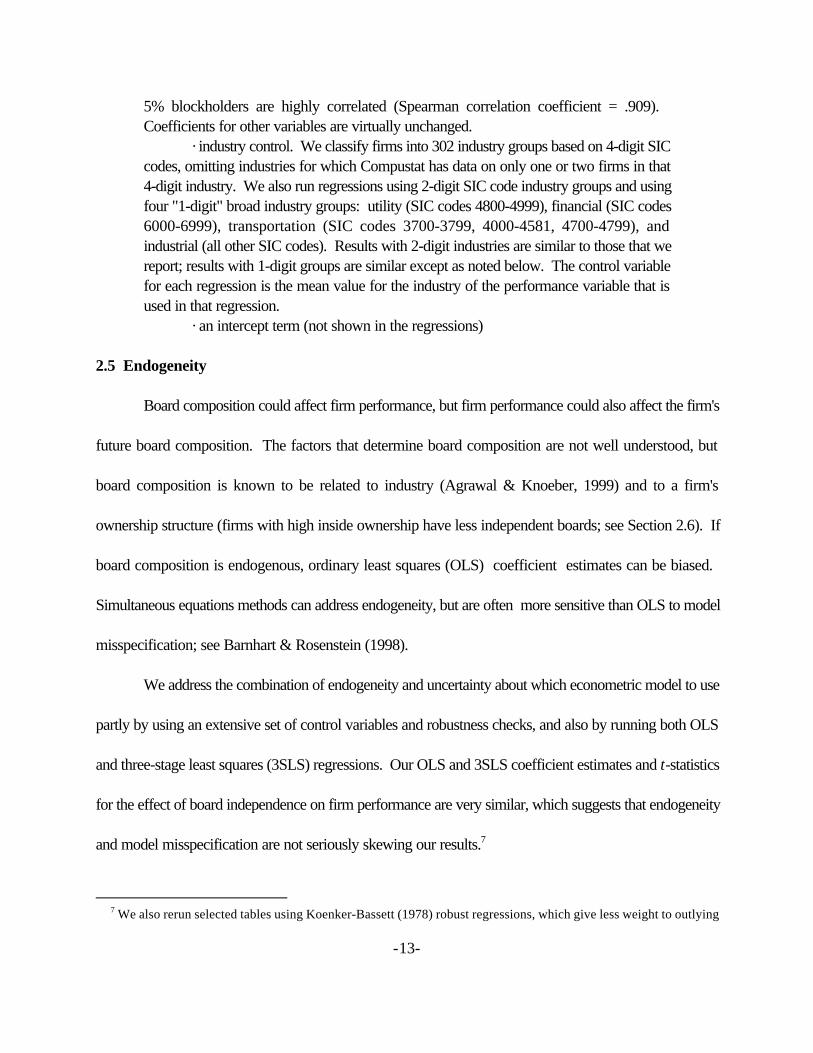
Ratio of sales to assets SAL/AST
year periods over which we cumulate returns, Kothari and Warner (1997) report that MAR is better specified thanabnormal return measures that include a beta adjustment. In separate regressions (not shown), we confirm for our samplethat MAR is better specified than measures based on cumulative abnormal returns or standardized abnormal returns.
Stock price returns must be used with caution as a performance measure because they are susceptible to
investor anticipation. If investors fully anticipate the effects of board composition on performance, long-
term stock returns will be insignificant, even if a significant correlation between performance and board
independence exists in fact. For this reason, we rely mostly on Tobin's q, ratio of operating income to
assets, and ratio of sales to assets as our performance measures. In the appendix we present some of the
analysis using market adjusted stock returns as the performance measure.
2.4 Control Variables
Our regression results control for a number of possible factors that could influence firm
performance, in addition to board composition. These control variables are:
· board size· CEO ownership (percent)· outside director ownership (percent)· firm size, proxied by log(sales). For performance variables with sales in the
numerator (SAL/AST and, when we study firm growth we use log(assets) instead oflog(sales) to control for firm size. We also run regressions (not reported) using log(assets)as the size control for all performance and growth variables; results are similar to theregressions with log(sales). For regressions using 1991 (1988) board and stock ownershipdata, we measure firm size in 1990 (1987).
· number of outside 5% blockholders. We also run regressions (not reported)using percentage holdings of all outside 5% blockholders as an additional control variable. This variable is generally insignificant. Coefficients for number of outside 5% blockholdersdecline because number of outside 5% blockholders and percentage holdings of all outside
-13-
5% blockholders are highly correlated (Spearman correlation coefficient = .909). Coefficients for other variables are virtually unchanged.
· industry control. We classify firms into 302 industry groups based on 4-digit SICcodes, omitting industries for which Compustat has data on only one or two firms in that4-digit industry. We also run regressions using 2-digit SIC code industry groups and usingfour "1-digit" broad industry groups: utility (SIC codes 4800-4999), financial (SIC codes6000-6999), transportation (SIC codes 3700-3799, 4000-4581, 4700-4799), andindustrial (all other SIC codes). Results with 2-digit industries are similar to those that wereport; results with 1-digit groups are similar except as noted below. The control variablefor each regression is the mean value for the industry of the performance variable that isused in that regression.
· an intercept term (not shown in the regressions)
2.5 Endogeneity
Board composition could affect firm performance, but firm performance could also affect the firm's
future board composition. The factors that determine board composition are not well understood, but
board composition is known to be related to industry (Agrawal & Knoeber, 1999) and to a firm's
ownership structure (firms with high inside ownership have less independent boards; see Section 2.6). If
board composition is endogenous, ordinary least squares (OLS) coefficient estimates can be biased.
Simultaneous equations methods can address endogeneity, but are often more sensitive than OLS to model
misspecification; see Barnhart & Rosenstein (1998).
We address the combination of endogeneity and uncertainty about which econometric model to use
partly by using an extensive set of control variables and robustness checks, and also by running both OLS
and three-stage least squares (3SLS) regressions. Our OLS and 3SLS coefficient estimates and t-statistics
for the effect of board independence on firm performance are very similar, which suggests that endogeneity
and model misspecification are not seriously skewing our results.7
7 We also rerun selected tables using Koenker-Bassett (1978) robust regressions, which give less weight to outlying
-14-
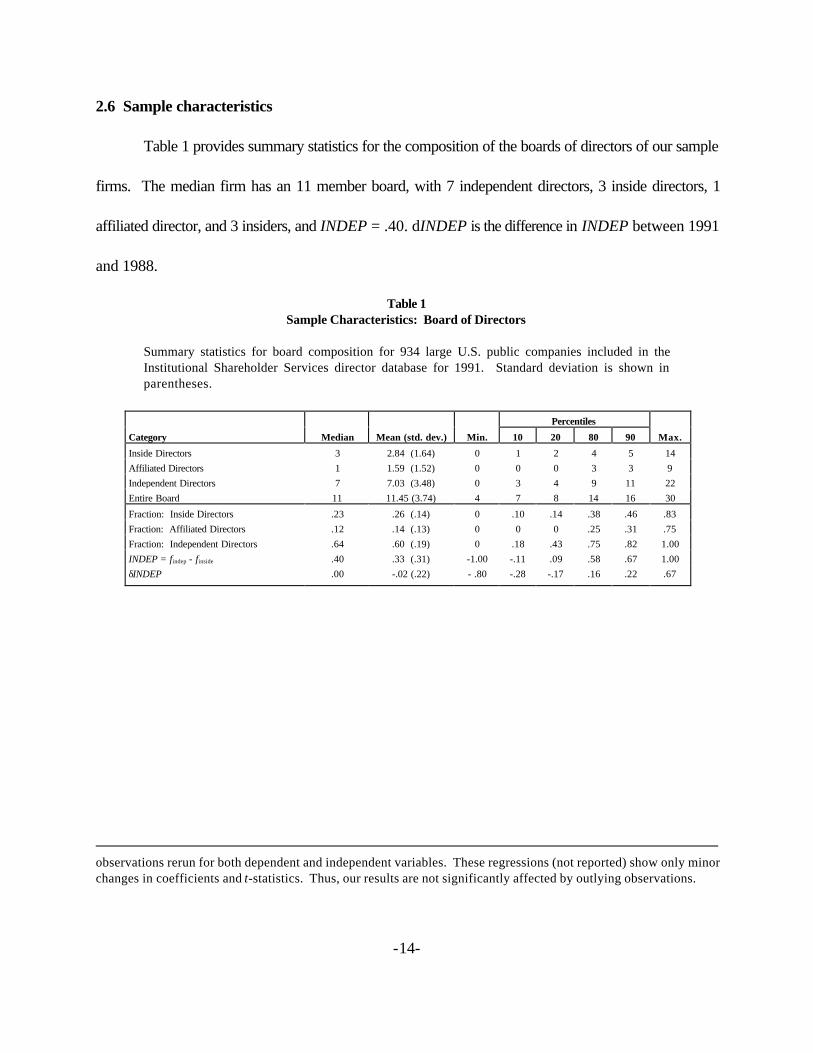
2.6 Sample characteristics
Table 1 provides summary statistics for the composition of the boards of directors of our sample
firms. The median firm has an 11 member board, with 7 independent directors, 3 inside directors, 1
affiliated director, and 3 insiders, and INDEP = .40. dINDEP is the difference in INDEP between 1991
and 1988.
observations rerun for both dependent and independent variables. These regressions (not reported) show only minorchanges in coefficients and t-statistics. Thus, our results are not significantly affected by outlying observations.
Table 1Sample Characteristics: Board of Directors
Summary statistics for board composition for 934 large U.S. public companies included in theInstitutional Shareholder Services director database for 1991. Standard deviation is shown inparentheses.
Percentiles
Category Median Mean (std. dev.) Min. 10 20 80 90 Max.
Inside Directors 3 2.84 (1.64) 0 1 2 4 5 14Affiliated Directors 1 1.59 (1.52) 0 0 0 3 3 9Independent Directors 7 7.03 (3.48) 0 3 4 9 11 22Entire Board 11 11.45 (3.74) 4 7 8 14 16 30
Fraction: Inside Directors .23 .26 (.14) 0 .10 .14 .38 .46 .83Fraction: Affiliated Directors .12 .14 (.13) 0 0 0 .25 .31 .75Fraction: Independent Directors .64 .60 (.19) 0 .18 .43 .75 .82 1.00INDEP = findep - finside .40 .33 (.31) -1.00 -.11 .09 .58 .67 1.00δINDEP .00 -.02 (.22) - .80 -.28 -.17 .16 .22 .67
-15-
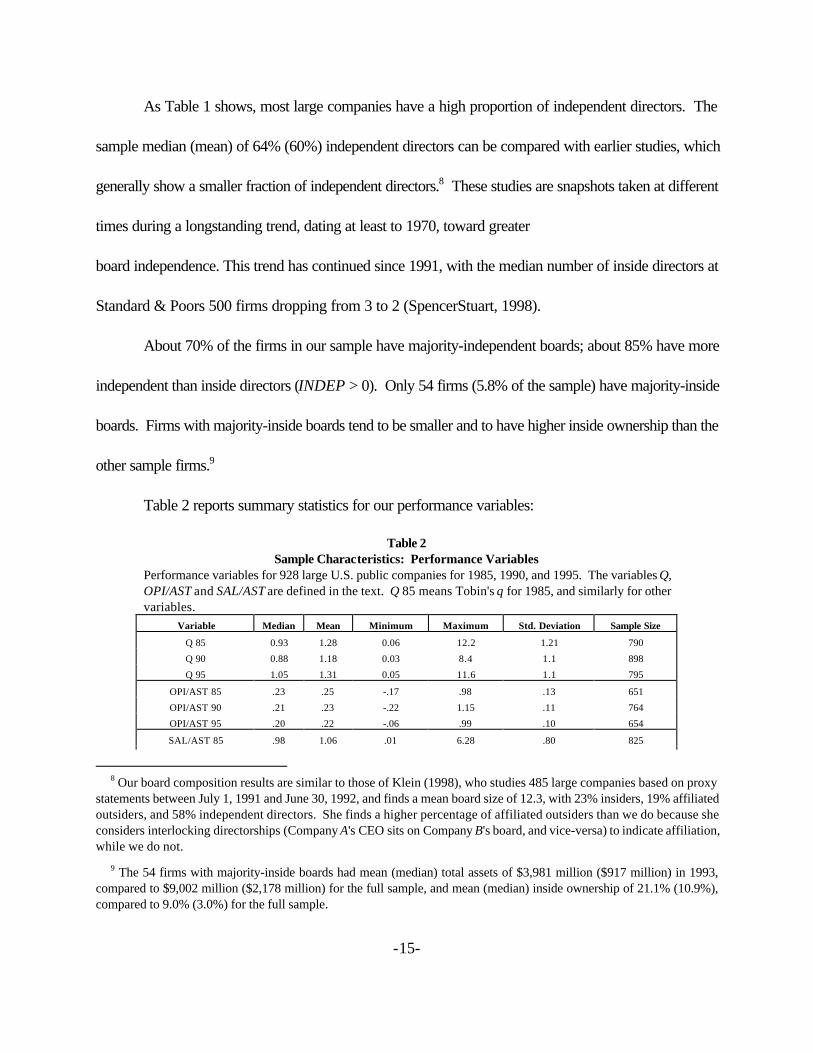
As Table 1 shows, most large companies have a high proportion of independent directors. The
sample median (mean) of 64% (60%) independent directors can be compared with earlier studies, which
generally show a smaller fraction of independent directors.8 These studies are snapshots taken at different
times during a longstanding trend, dating at least to 1970, toward greater
board independence. This trend has continued since 1991, with the median number of inside directors at
Standard & Poors 500 firms dropping from 3 to 2 (SpencerStuart, 1998).
About 70% of the firms in our sample have majority-independent boards; about 85% have more
independent than inside directors (INDEP > 0). Only 54 firms (5.8% of the sample) have majority-inside
boards. Firms with majority-inside boards tend to be smaller and to have higher inside ownership than the
other sample firms.9
Table 2 reports summary statistics for our performance variables:
Table 2Sample Characteristics: Performance Variables
Performance variables for 928 large U.S. public companies for 1985, 1990, and 1995. The variables Q,OPI/AST and SAL/AST are defined in the text. Q 85 means Tobin's q for 1985, and similarly for othervariables.
Variable Median Mean Minimum Maximum Std. Deviation Sample Size
Q 85 0.93 1.28 0.06 12.2 1.21 790
Q 90 0.88 1.18 0.03 8.4 1.1 898
Q 95 1.05 1.31 0.05 11.6 1.1 795
OPI/AST 85 .23 .25 -.17 .98 .13 651
OPI/AST 90 .21 .23 -.22 1.15 .11 764
OPI/AST 95 .20 .22 -.06 .99 .10 654
SAL/AST 85 .98 1.06 .01 6.28 .80 825
8 Our board composition results are similar to those of Klein (1998), who studies 485 large companies based on proxystatements between July 1, 1991 and June 30, 1992, and finds a mean board size of 12.3, with 23% insiders, 19% affiliatedoutsiders, and 58% independent directors. She finds a higher percentage of affiliated outsiders than we do because sheconsiders interlocking directorships (Company A's CEO sits on Company B's board, and vice-versa) to indicate affiliation,while we do not.
9 The 54 firms with majority-inside boards had mean (median) total assets of $3,981 million ($917 million) in 1993,compared to $9,002 million ($2,178 million) for the full sample, and mean (median) inside ownership of 21.1% (10.9%),compared to 9.0% (3.0%) for the full sample.
-16-
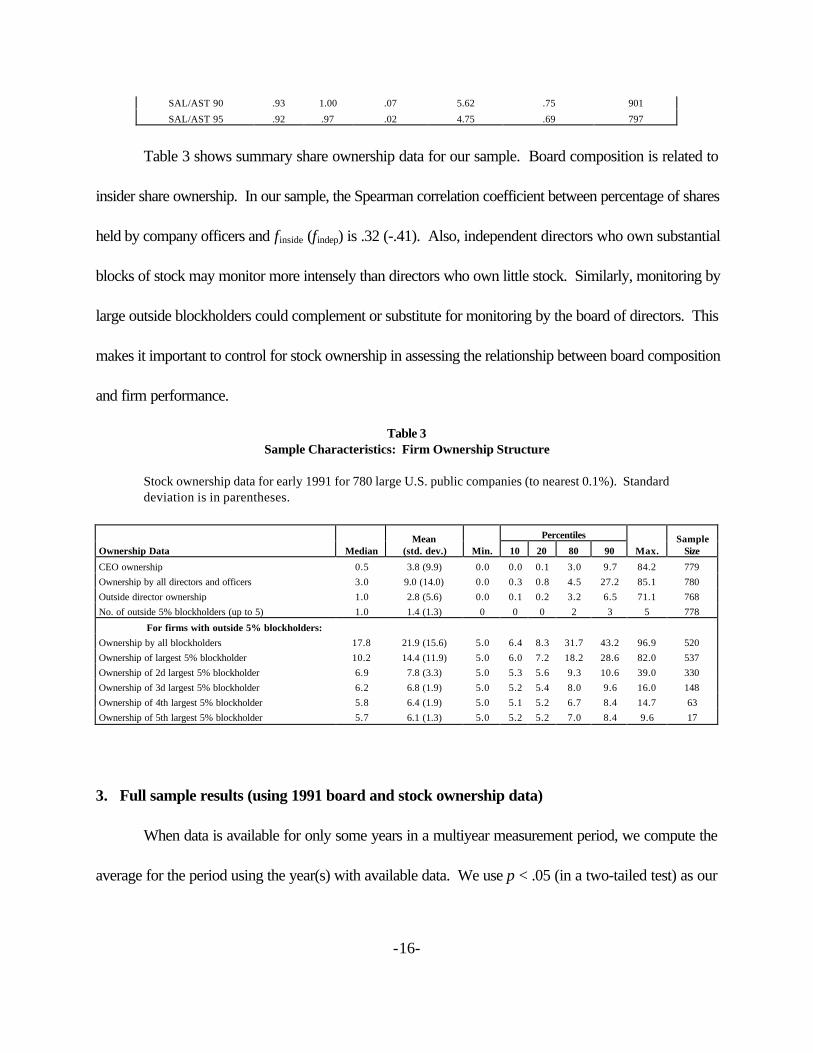
SAL/AST 90 .93 1.00 .07 5.62 .75 901
SAL/AST 95 .92 .97 .02 4.75 .69 797
Table 3 shows summary share ownership data for our sample. Board composition is related to
insider share ownership. In our sample, the Spearman correlation coefficient between percentage of shares
held by company officers and finside (findep) is .32 (-.41). Also, independent directors who own substantial
blocks of stock may monitor more intensely than directors who own little stock. Similarly, monitoring by
large outside blockholders could complement or substitute for monitoring by the board of directors. This
makes it important to control for stock ownership in assessing the relationship between board composition
and firm performance.
Table 3Sample Characteristics: Firm Ownership Structure
Stock ownership data for early 1991 for 780 large U.S. public companies (to nearest 0.1%). Standarddeviation is in parentheses.
Percentiles
Ownership Data MedianMean
(std. dev.) Min. 10 20 80 90 Max.Sample
Size
CEO ownership 0.5 3.8 (9.9) 0.0 0.0 0.1 3.0 9.7 84.2 779Ownership by all directors and officers 3.0 9.0 (14.0) 0.0 0.3 0.8 4.5 27.2 85.1 780Outside director ownership 1.0 2.8 (5.6) 0.0 0.1 0.2 3.2 6.5 71.1 768No. of outside 5% blockholders (up to 5) 1.0 1.4 (1.3) 0 0 0 2 3 5 778
For firms with outside 5% blockholders:Ownership by all blockholders 17.8 21.9 (15.6) 5.0 6.4 8.3 31.7 43.2 96.9 520Ownership of largest 5% blockholder 10.2 14.4 (11.9) 5.0 6.0 7.2 18.2 28.6 82.0 537Ownership of 2d largest 5% blockholder 6.9 7.8 (3.3) 5.0 5.3 5.6 9.3 10.6 39.0 330Ownership of 3d largest 5% blockholder 6.2 6.8 (1.9) 5.0 5.2 5.4 8.0 9.6 16.0 148Ownership of 4th largest 5% blockholder 5.8 6.4 (1.9) 5.0 5.1 5.2 6.7 8.4 14.7 63Ownership of 5th largest 5% blockholder 5.7 6.1 (1.3) 5.0 5.2 5.2 7.0 8.4 9.6 17
3. Full sample results (using 1991 board and stock ownership data)
When data is available for only some years in a multiyear measurement period, we compute the
average for the period using the year(s) with available data. We use p < .05 (in a two-tailed test) as our
-17-
threshold for statistical significance; results with .05 < p < .10 are considered "marginally significant."
Significant results are shown in boldface.
3.1 OLS results for board independence and firm performance
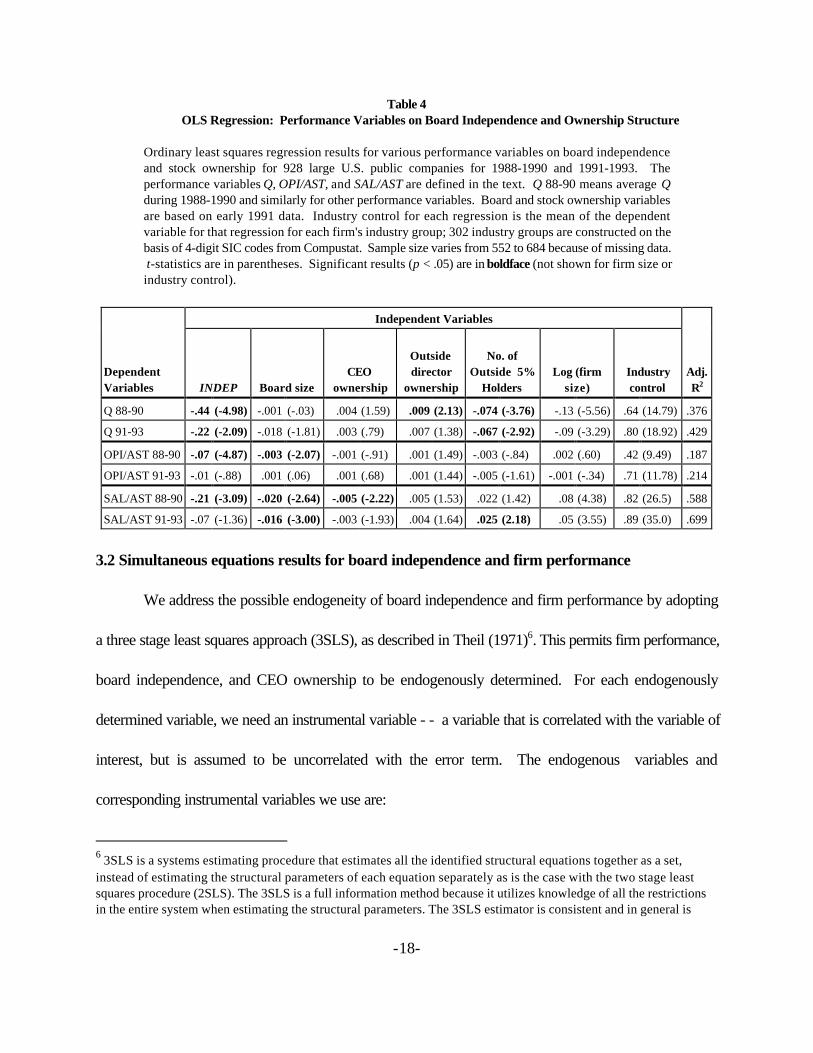
Table 4 presents our basic OLS results for the full 1991 sample. During the retrospective period,
board independence, proxied by INDEP, correlates significantly and negatively with all four performance
measures. During the prospective period, the correlation remains negative for all variables, but is significant
only for Q. These results are consistent with poor performance prompting firms to adopt more independent
boards, but suggests that firms do not achieve superior performance (and may possibly achieve even worse
performance) as a result of this change in board composition.10
10 We perform a variety of checks for robustness, in addition to those described below in the text:
1. Results are similar with 2-digit industry controls. With 1-digit industry controls, OPI/SAL 91-93becomes significantly negative and OPI/AST 91-93 is negative and marginally significant.2. We obtain similar results with a number of other performance variables, including sales peremployee, operating margin (operating income/sales), and cash-flow based measures (cash flow/assetsinstead of operating income/assets). The coefficients on INDEP are negative and significant ormarginally significant for 1988-1990, and generally negative but only sometimes significant for 1991-1993.3. We obtain similar results in regressions where we replace INDEP with finside and findep (in direct or logform) as independent variables, except that the negative coefficient on INDEP is typically split betweena negative coefficient on findep and a positive coefficient on finside. This is consistent with our judgmentthat INDEP is a superior measure of board independence than findep alone.4. We obtain similar results with Koenker-Bassett (1978) robust regressions, which give less weightto outliers.
-18-
Table 4OLS Regression: Performance Variables on Board Independence and Ownership Structure
Ordinary least squares regression results for various performance variables on board independenceand stock ownership for 928 large U.S. public companies for 1988-1990 and 1991-1993. Theperformance variables Q, OPI/AST, and SAL/AST are defined in the text. Q 88-90 means average Qduring 1988-1990 and similarly for other performance variables. Board and stock ownership variablesare based on early 1991 data. Industry control for each regression is the mean of the dependentvariable for that regression for each firm's industry group; 302 industry groups are constructed on thebasis of 4-digit SIC codes from Compustat. Sample size varies from 552 to 684 because of missing data. t-statistics are in parentheses. Significant results (p < .05) are in boldface (not shown for firm size orindustry control).
Independent Variables
DependentVariables INDEP Board size
CEOownership
Outsidedirector
ownership
No. ofOutside 5%
HoldersLog (firm
size)Industrycontrol
Adj.R2
Q 88-90 -.44 (-4.98) -.001 (-.03) .004 (1.59) .009 (2.13) -.074 (-3.76) -.13 (-5.56) .64 (14.79) .376
Q 91-93 -.22 (-2.09) -.018 (-1.81) .003 (.79) .007 (1.38) -.067 (-2.92) -.09 (-3.29) .80 (18.92) .429
OPI/AST 88-90 -.07 (-4.87) -.003 (-2.07) -.001 (-.91) .001 (1.49) -.003 (-.84) .002 (.60) .42 (9.49) .187
OPI/AST 91-93 -.01 (-.88) .001 (.06) .001 (.68) .001 (1.44) -.005 (-1.61) -.001 (-.34) .71 (11.78) .214
SAL/AST 88-90 -.21 (-3.09) -.020 (-2.64) -.005 (-2.22) .005 (1.53) .022 (1.42) .08 (4.38) .82 (26.5) .588
SAL/AST 91-93 -.07 (-1.36) -.016 (-3.00) -.003 (-1.93) .004 (1.64) .025 (2.18) .05 (3.55) .89 (35.0) .699
3.2 Simultaneous equations results for board independence and firm performance
We address the possible endogeneity of board independence and firm performance by adopting
a three stage least squares approach (3SLS), as described in Theil (1971)6. This permits firm performance,
board independence, and CEO ownership to be endogenously determined. For each endogenously
determined variable, we need an instrumental variable - - a variable that is correlated with the variable of
interest, but is assumed to be uncorrelated with the error term. The endogenous variables and
corresponding instrumental variables we use are:
6 3SLS is a systems estimating procedure that estimates all the identified structural equations together as a set,instead of estimating the structural parameters of each equation separately as is the case with the two stage leastsquares procedure (2SLS). The 3SLS is a full information method because it utilizes knowledge of all the restrictionsin the entire system when estimating the structural parameters. The 3SLS estimator is consistent and in general is
-19-
· firm performance measure: normalized earnings per share (earnings per share dividedby share price at the beginning of the measurement period)· board independence: findep
·CEO ownership: share ownership by all directors and officers
We estimate the following system of equations:
· Equation 5.1: firm performance = f1 (INDEP, CEO ownership, board size, outsidedirector ownership, no. of outside 5% holders, log(firm size), industry performance control)· Equation 5.2: INDEP = f2 (firm performance, CEO ownership, outside directorownership, no of outside 5% holders, log(firm size))· Equation 5.3: CEO Ownership = f3 (firm performance, outside director ownership,log(firm size))
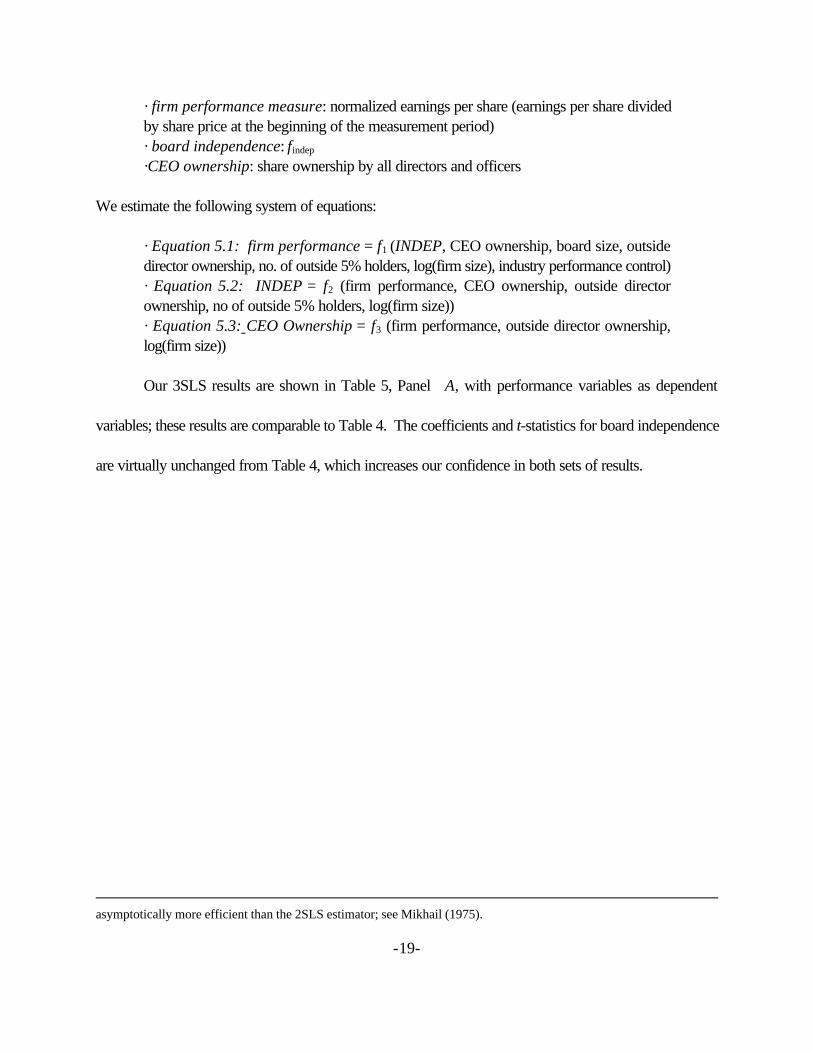
Our 3SLS results are shown in Table 5, Panel A, with performance variables as dependent
variables; these results are comparable to Table 4. The coefficients and t-statistics for board independence
are virtually unchanged from Table 4, which increases our confidence in both sets of results.
asymptotically more efficient than the 2SLS estimator; see Mikhail (1975).
-20-
Table 5: Simultaneous Equations (3SLS) Instrumental Variables EstimatesSimultaneous equations (three stage least squares) regression results for various performancevariables on board independence and stock ownership for 928 large U.S. public companies for 1988-1990 and 1991-1993. The instrumental variables, system of equations, and performance variables Q,OPI/AST, and SAL/AST are defined in the text. Q 88-90 means average Q during 1988-1990 andsimilarly for other performance variables. Board and stock ownership variables are based on early 1991data. Industry control for each regression in Panel A is the mean of the dependent variable for thatregression for each firm's industry group; 302 industry groups are constructed on the basis of 4-digitSIC codes from Compustat. Sample size varies from 552 to 684 because of missing data. t-statisticsare in parentheses. Significant results (p < .05) are in boldface (not shown for firm size or industrycontrol).
Panel A: Equation 5.1 (Firm Performance as Dependent Variable)Independent VariablesDependent
Variable:FirmPerformance INDEP Board Size
CEOOwnership
OutsideDirector
OwnershipNo. of Outside
5% Holders Log (firm size)IndustryControl
Adj.R2
Q 88-90 -.49 (-4.86) -.001 (-.06) .005 (1.46) .009 (2.05) -.07 (-3.51) -.12 (-5.29) .65 (14.8) .3777
Q 91-93 -.28 (-2.29) -.02 (-1.72) .002 (.54) .007 (1.36) -.06 (-2.85) -.08 (-3.28) .80 (18.8) .4289
OPI/AST 88-90 -.08 (-5.23) -.003 (-1.90) -.001 (-.59) .001 (1.32) -.002 (-.86) .002 (.53) .45 (9.61) .1978
OPI/AST 91-93 -.01 (-.74) .001 (.12) .001 (.77) .001 (1.46) -.005 (-1.57) -.001 (-.29) .71 (11.8) .2165
SAL/AST 88-90 -.21 (-2.66) -.02 (-2.29) -.001 (-.34) .005 (1.44) .02 (1.56) .08 (4.48) .81 (26.1) .5806
SAL/AST 91-93 -.09 (-1.46) -.01 (-2.77) -.001 (-.52) .004 (1.57) .03 (2.36) .05 (3.72) .89 (34.7) .6975
Panel B: Equation 5.2 (Board Independence as Dependent Variable)Independent Variables
DependentVariable
Firm PerformanceMeasure
FirmPerformance
CEOOwnership
Outside DirectorOwnership
No. of Outside5% Holders Log (firm size)
Adj.R2
Q 88-90 -.21 (-6.81) -.01 (-6.80) -.0001 (-.03) .009 (.90) -.004 (-.40) .203
Q 91-93 -.11 (-5.57) -.01 (-7.91) -.001 (-.49) .016 (1.80) .001 (.10) .179
OPI/AST 88-90 -2.42 (-8.70) -.01 (-5.31) .002 (.69) .015 (1.30) .02 (1.48) .198
OPI/AST 91-93 -.90 (-3.38) -.01 (-6.88) -.001 (-.42) .02 (1.97) .02 (2.40) .149
SAL/AST 88-90 -.13 (-6.23) -.01 (-7.99) -.001 (-.16) .04 (4.64) .04 (4.39) .198
INDEP SAL/AST 91-93 -.12 (-6.64) -.01 (-8.41) -.001 (-.17) .04 (4.54) .03 (3.77) .193
Panel C: Equation 5.3 (CEO Ownership)Independent Variables
Dependent VariableFirm Performance
Measure Firm PerformanceOutside Director
Ownership Log (firm size) Adj. R2
Q 88-90 4.13 (4.34) .04 (.63) -.73 (-2.13) .062
Q 91-93 2.44 (3.95) .03 (.46) -.95 (-3.21) .056
OPI/AST 88-90 28.3 (3.62) -.05 (-.62) -1.40 (-4.43) .056
OPI/AST 91-93 31.9 (3.83) -.08 (-.99) -1.33 (-4.30) .057
SAL/AST 88-90 1.41 (1.99) .04 (.61) -1.50 (-5.09) .0419
CEO Ownership SAL/AST 91-93 1.16 (1.93) .03 (.51) -1.39 (-5.15) .0394
Panel B confirms the suggestion from the 1988-1990 data in Table 4 and in Panel A of a likely causal
-21-
connection running from poor firm performance to a firm decision to increase board independence. The
coefficients on all three performance variables for 1988-1990 are negative and strongly significant.
In Table 5, Panel A we include regressions using performance variables for 1998-1990, and in Panel
B, we include regressions using performance variables for 1991-1993 - for parallelism with Table 4, but
omit these regressions in subsequent tables because they have no obvious causal interpretation in a
simultaneous equations framework.
3.3 Is board composition affected by growth or growth opportunities?
We check the robustness of the results in Tables 4 and 5 in various ways. First, we test for a
possibility that the correlation between firm or industry growth rate or growth prospects and both firm
profitability and board composition may be driving our results. To do so, we add the following additional
control variables to equation 5.2:
· GrSAL 88-90 = fractional firm sales growth from 1987 to 1990 (as a measure of current firm growth)· fractional industry sales growth from 1987 to 1990 (as a measure of the current growthopportunities available in the industry, even if not seized by this particular firm)· GrSAL 91-93 = fractional firm sales growth from 1990 to 1993 (as a measure of thefuture growth opportunities available to the firm, because realized future firm growth is aproxy for current growth opportunities).· fractional industry sales growth from 1990 to 1993 (as a measure of the future growthopportunities available in the industry, even if not seized by this particular firm)
Thus, our system of equations is:
· Equations 6.1 and 6.3: same as equations 5.1 and 5.3· Equation 6.2: INDEP = f2 (firm performance, CEO ownership, outside directorownership, no. of outside 5% holders, log(firm size), GrSAL 88-90, industry sales growthfrom 1987 to 1990, GrSAL 91-93, industry sales growth from 1990 to 1993)
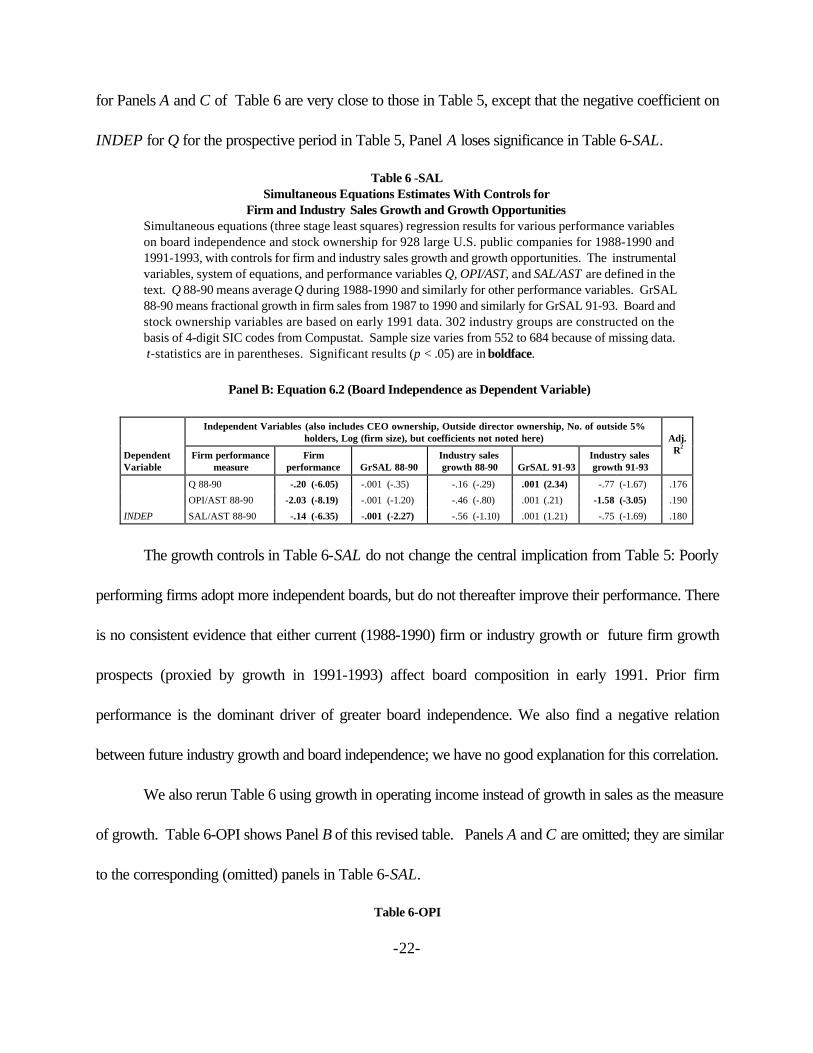
Our results are shown in Table 6-SAL. We show results only for Panel B (Equation 6.2). The coefficients
-22-
for Panels A and C of Table 6 are very close to those in Table 5, except that the negative coefficient on
INDEP for Q for the prospective period in Table 5, Panel A loses significance in Table 6-SAL.
Table 6 -SALSimultaneous Equations Estimates With Controls for
Firm and Industry Sales Growth and Growth OpportunitiesSimultaneous equations (three stage least squares) regression results for various performance variableson board independence and stock ownership for 928 large U.S. public companies for 1988-1990 and1991-1993, with controls for firm and industry sales growth and growth opportunities. The instrumentalvariables, system of equations, and performance variables Q, OPI/AST, and SAL/AST are defined in thetext. Q 88-90 means average Q during 1988-1990 and similarly for other performance variables. GrSAL88-90 means fractional growth in firm sales from 1987 to 1990 and similarly for GrSAL 91-93. Board andstock ownership variables are based on early 1991 data. 302 industry groups are constructed on thebasis of 4-digit SIC codes from Compustat. Sample size varies from 552 to 684 because of missing data. t-statistics are in parentheses. Significant results (p < .05) are in boldface.
Panel B: Equation 6.2 (Board Independence as Dependent Variable)
Independent Variables (also includes CEO ownership, Outside director ownership, No. of outside 5%holders, Log (firm size), but coefficients not noted here)
DependentVariable
Firm performancemeasure
Firmperformance GrSAL 88-90
Industry salesgrowth 88-90 GrSAL 91-93
Industry salesgrowth 91-93
Adj.R2
Q 88-90 -.20 (-6.05) -.001 (-.35) -.16 (-.29) .001 (2.34) -.77 (-1.67) .176
OPI/AST 88-90 -2.03 (-8.19) -.001 (-1.20) -.46 (-.80) .001 (.21) -1.58 (-3.05) .190
INDEP SAL/AST 88-90 -.14 (-6.35) -.001 (-2.27) -.56 (-1.10) .001 (1.21) -.75 (-1.69) .180
The growth controls in Table 6-SAL do not change the central implication from Table 5: Poorly
performing firms adopt more independent boards, but do not thereafter improve their performance. There
is no consistent evidence that either current (1988-1990) firm or industry growth or future firm growth
prospects (proxied by growth in 1991-1993) affect board composition in early 1991. Prior firm
performance is the dominant driver of greater board independence. We also find a negative relation
between future industry growth and board independence; we have no good explanation for this correlation.
We also rerun Table 6 using growth in operating income instead of growth in sales as the measure
of growth. Table 6-OPI shows Panel B of this revised table. Panels A and C are omitted; they are similar
to the corresponding (omitted) panels in Table 6-SAL.
Table 6-OPI

-23-
Simultaneous Equations Estimates With Controls forFirm and Industry Operating Income Growth and Growth Opportunities
Simultaneous equations (three stage least squares) regression results for various performancevariables on board independence and stock ownership for 928 large U.S. public companies for 1988-1990 and 1991-1993, with controls for firm and industry operating income growth and growthopportunities. The instrumental variables, system of equations, and performance variables Q,OPI/AST, and SAL/AST are defined in the text. Q 88-90 means average Q during 1988-1990 and similarlyfor other performance variables. GrOPI 88-90 means fractional growth in firm operating income from1987 to 1990 and similarly for GrOPI 91-93. Board and stock ownership variables are based on early1991 data. 302 industry groups are constructed on the basis of 4-digit SIC codes from Compustat. Sample size varies from 552 to 684 because of missing data. t-statistics are in parentheses. Significantresults (p < .05) are in boldface.
Panel B: Board Independence as Dependent Variable
Independent Variables (also includes CEO ownership, Outside director ownership, No. of outside 5% holders,Log (firm size), but coefficients not noted here)
DependentVariable
Firm performancemeasure
Firmperformance GrOPI 88-90
Industry oper.Income growth 88-
90 GrOPI 91-93
Industry oper.Income growth 91-
93
Adj.R2
Q 88-90 -.22 (-5.68) .001 (-.78) -.55 (-.78) -.67 (-.19) -.20 (-2.03) .154
OPI/AST 88-90 -2.03 (-8.19) -.001 (-.80) -.46 (-.80) .0001 (.21) -.16 (-3.01) .190
INDEP SAL/AST 88-90 -.17 (-5.59) -.0001 -.58) -.39 (-.58) .0002 (.74) -.17 (-1.84) .162
Once again, the growth controls do not affect the negative correlation between firm performance
in 1988-1990 and board independence in early 1991. There is some evidence in Table 6-OPI of a
negative correlation between industry growth prospects (proxied by industry growth in 1991-1993) and
board independence. The coefficient on industry operating income growth in 1991-1993 is significantly
negative for Q and OPI/AST, and marginally significant for SAL/AST. As before, we have no good
explanation for this correlation.
3.4 Robustness check using 1988 board and share ownership data
As a further check on our results, we collect board composition and share ownership data in early
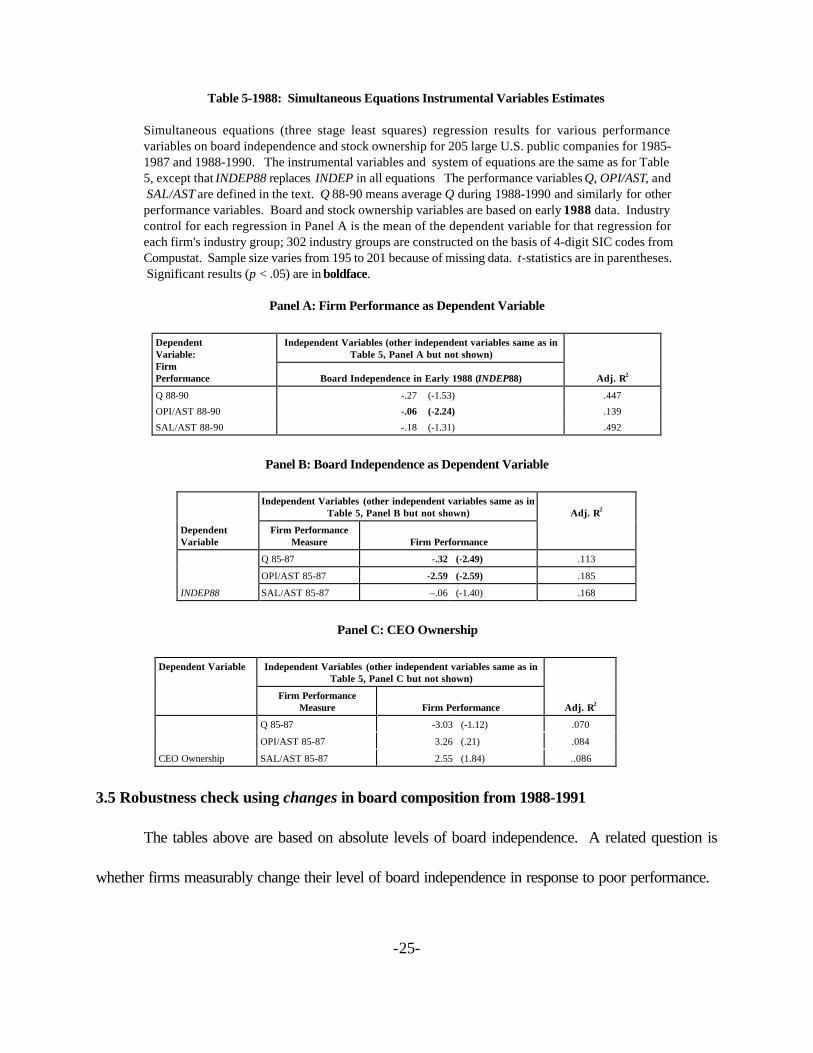
1988 for a randomly chosen subsample of 205 firms. Simultaneous equations results are shown in Table
-24-
5-1988 below.11 In Panel B, recent past performance (during 1985-1987) correlates significantly and
negatively with board independence in early 1988 for Q and OPI/AST, and negatively but not significantly
for SAL/AST. Moreover, for the full sample, 1985-1987 performance correlates significantly and negatively
with 1991 board independence for all three performance variables (regression results are not shown). We
see this as corroboration of the evidence reported above that poorly performing firms increase board
independence.
As we did with 1991 board data, we get hints that greater board independence not only doesn’t
improve performance, it may lead to worse performance. The coefficients on board independence with all
three prospective performance specifications are negative in Panel A, and the coefficient with the OPI/AST
specification is statistically significant.
11 OLS regressions with firm performance as the dependent variable produce coefficient estimates similar to Panel Aof Table 5-1988.
-25-
Table 5-1988: Simultaneous Equations Instrumental Variables Estimates
Simultaneous equations (three stage least squares) regression results for various performancevariables on board independence and stock ownership for 205 large U.S. public companies for 1985-1987 and 1988-1990. The instrumental variables and system of equations are the same as for Table5, except that INDEP88 replaces INDEP in all equations The performance variables Q, OPI/AST, and SAL/AST are defined in the text. Q 88-90 means average Q during 1988-1990 and similarly for otherperformance variables. Board and stock ownership variables are based on early 1988 data. Industrycontrol for each regression in Panel A is the mean of the dependent variable for that regression foreach firm's industry group; 302 industry groups are constructed on the basis of 4-digit SIC codes fromCompustat. Sample size varies from 195 to 201 because of missing data. t-statistics are in parentheses. Significant results (p < .05) are in boldface.
Panel A: Firm Performance as Dependent Variable
Independent Variables (other independent variables same as inTable 5, Panel A but not shown)
DependentVariable:FirmPerformance Board Independence in Early 1988 (INDEP88) Adj. R2
Q 88-90 -.27 (-1.53) .447
OPI/AST 88-90 -.06 (-2.24) .139
SAL/AST 88-90 -.18 (-1.31) .492
Panel B: Board Independence as Dependent Variable
Independent Variables (other independent variables same as inTable 5, Panel B but not shown)
DependentVariable
Firm PerformanceMeasure Firm Performance
Adj. R2
Q 85-87 -.32 (-2.49) .113
OPI/AST 85-87 -2.59 (-2.59) .185
INDEP88 SAL/AST 85-87 –.06 (-1.40) .168
Panel C: CEO Ownership
Independent Variables (other independent variables same as inTable 5, Panel C but not shown)
Dependent Variable
Firm PerformanceMeasure Firm Performance Adj. R2
Q 85-87 -3.03 (-1.12) .070
OPI/AST 85-87 3.26 (.21) .084
CEO Ownership SAL/AST 85-87 2.55 (1.84) ..086
3.5 Robustness check using changes in board composition from 1988-1991
The tables above are based on absolute levels of board independence. A related question is
whether firms measurably change their level of board independence in response to poor performance.

-26-
Here the evidence is more equivocal. We address this question first in an ordinary least squares framework,
and then in a simultaneous equations framework.
Using the subsample of 205 firms for which we have board composition data for both 1988 and
1991, we construct a measure of change in board independence from 1988 to 1991: dINDEP = INDEP
- INDEP88. In Table 7, dINDEP is the dependent variable, and different measures of recent past (1985-
1987) and contemporaneous (1988-1990) performance and growth are the principal independent variables.
If recent past or contemporaneous poor performance (slow growth) is a strong driver of board
independence, the coefficients in Table 7 should be negative.
Table 7Regression: Change in Board Independence on Performance and Growth
Change in board independence for 205 large U.S. public companies between early 1988 and early 1991. The performance and growth variables are defined in the text. Board composition data is from early1988 and early 1991. Industry control for each regression is the mean of that variable for each firm'sindustry group; 302 industry groups are constructed on the basis of 4-digit SIC codes from Compustat. Sample size varies from 195 to 201 because of missing data. t-statistics are shown in parentheses. Significant results (p < .05) are in boldface.
Independent Variables (industry control and log(1987 sales) are included in the regressions but are notshown)
Dependent Variable
Performance orGrowth Variable
Recent Past Performance orGrowth (Same Variable over
1985-1987)
Contemporaneous Performanceor Growth (Same Variable over
1988-1990)
Board Size
Adj. R2
Performance Variables
Q -.02 (-.70) -.01 (-.20) -.001 (-.24) -.021
OPI/AST .10 (.31) -.18 (-.52) .004 (.54) -.032
SAL/AST -.09 (-1.14) .17 (1.93) .002 (.40) .005
Growth Variables
GrAST -.001 (-.24) -.001 (-.12) .002 (.28) -.028
GrSAL -.001 (-.33) -.001 (-1.00) .004 (.73) -.022
GrOPI -.001 (-.23) .001 (.31) .003 (.53) -.031? INDEP = INDEP -INDEP 88 GrEMP -.001 (-.17) -.001 (-.01) .004 (.51) -.032
There is no evidence in Table 7 of a correlation between change in board composition and recent
past or contemporaneous performance or growth. The signs on the coefficients vary and most t-statistics
are small. This nonresult is consistent with the mixed results found by other researchers, reviewed earlier.
-27-
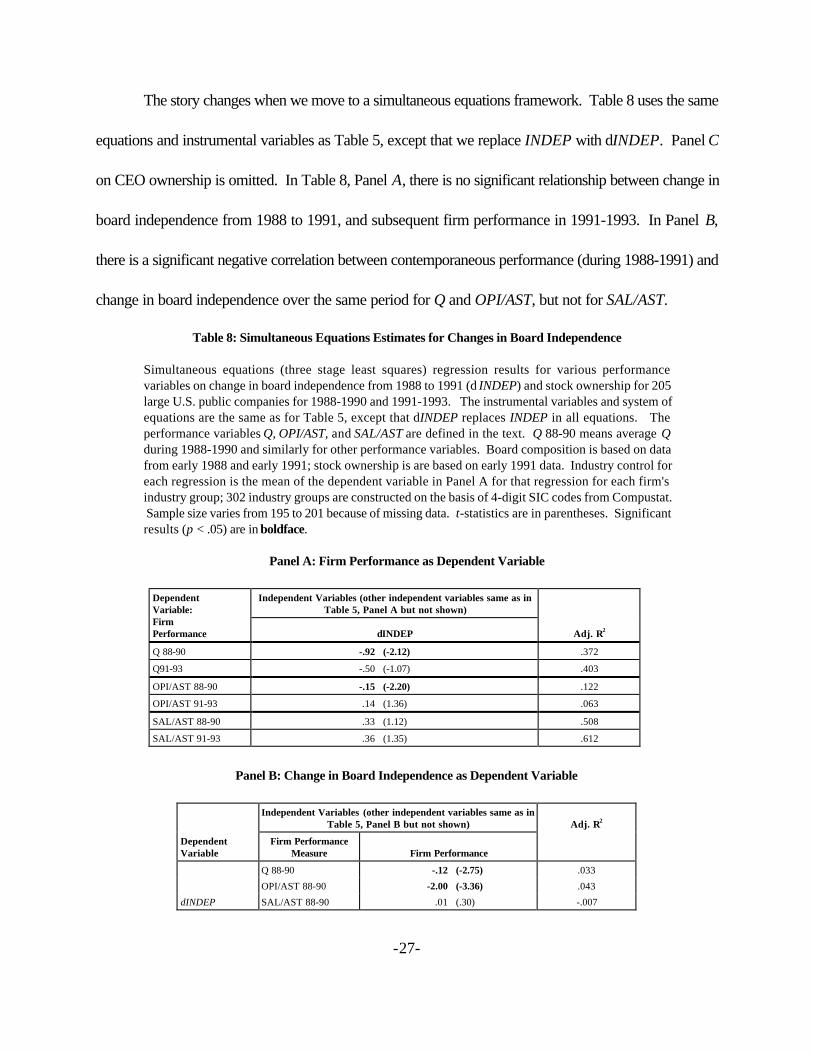
The story changes when we move to a simultaneous equations framework. Table 8 uses the same
equations and instrumental variables as Table 5, except that we replace INDEP with dINDEP. Panel C
on CEO ownership is omitted. In Table 8, Panel A, there is no significant relationship between change in
board independence from 1988 to 1991, and subsequent firm performance in 1991-1993. In Panel B,
there is a significant negative correlation between contemporaneous performance (during 1988-1991) and
change in board independence over the same period for Q and OPI/AST, but not for SAL/AST.
Table 8: Simultaneous Equations Estimates for Changes in Board Independence
Simultaneous equations (three stage least squares) regression results for various performancevariables on change in board independence from 1988 to 1991 (d INDEP) and stock ownership for 205large U.S. public companies for 1988-1990 and 1991-1993. The instrumental variables and system ofequations are the same as for Table 5, except that dINDEP replaces INDEP in all equations. Theperformance variables Q, OPI/AST, and SAL/AST are defined in the text. Q 88-90 means average Qduring 1988-1990 and similarly for other performance variables. Board composition is based on datafrom early 1988 and early 1991; stock ownership is are based on early 1991 data. Industry control foreach regression is the mean of the dependent variable in Panel A for that regression for each firm'sindustry group; 302 industry groups are constructed on the basis of 4-digit SIC codes from Compustat. Sample size varies from 195 to 201 because of missing data. t-statistics are in parentheses. Significantresults (p < .05) are in boldface.
Panel A: Firm Performance as Dependent Variable
Independent Variables (other independent variables same as inTable 5, Panel A but not shown)
DependentVariable:FirmPerformance δINDEP Adj. R2
Q 88-90 -.92 (-2.12) .372
Q91-93 -.50 (-1.07) .403
OPI/AST 88-90 -.15 (-2.20) .122
OPI/AST 91-93 .14 (1.36) .063
SAL/AST 88-90 .33 (1.12) .508
SAL/AST 91-93 .36 (1.35) .612
Panel B: Change in Board Independence as Dependent Variable
Independent Variables (other independent variables same as inTable 5, Panel B but not shown)
DependentVariable
Firm PerformanceMeasure Firm Performance
Adj. R2
Q 88-90 -.12 (-2.75) .033
OPI/AST 88-90 -2.00 (-3.36) .043
dINDEP SAL/AST 88-90 .01 (.30) -.007
-28-
Table 8, Panel B provides support for the evidence from earlier tables that poor firm performance
predicts higher future board independence. A puzzle, given the strong t-statistics in Table 5, Panel B, is why
the negative correlation between 1988-1990 performance and 1988-1991 changes in board independence
is not stronger. Perhaps the strategy of increasing board independence emerges over time in response to
persistent poor performance. If so, the strategy will be reflected more clearly in absolute levels of board
independence than in changes in board independence over a limited time period.
3.6 Robustness check: Nonlinear relationship between board independence and firm performance
The OLS and 3SLS regressions above provide evidence that poor firm performance leads firms
to increase their board independence. There is no evidence that this strategy improves future performance,
and hints that there might be a negative relationship between board independence and future firm
independence. To see if those hints can be sharpened, we explore in this section a possible nonlinear
relationship between board independence and future firm performance. For example, it could be valuable
for firms to have a significant number of inside directors -- say 30% -- to achieve the benefits of these
directors' firm-specific knowledge, but there after unimportant or even detrimental to further increase the
proportion of inside directors. Similarly, it could be valuable to have more independent than inside
directors, or to have a majority of independent directors (see theoretical work by Noe and Rebello, 1996
and empirical work by Byrd and Hickman, 1992), or a 60% supermajority of independent directors (see
empirical work by Weisbach, 1988 and Cotter, Shivdasani and Zenner, 1997).
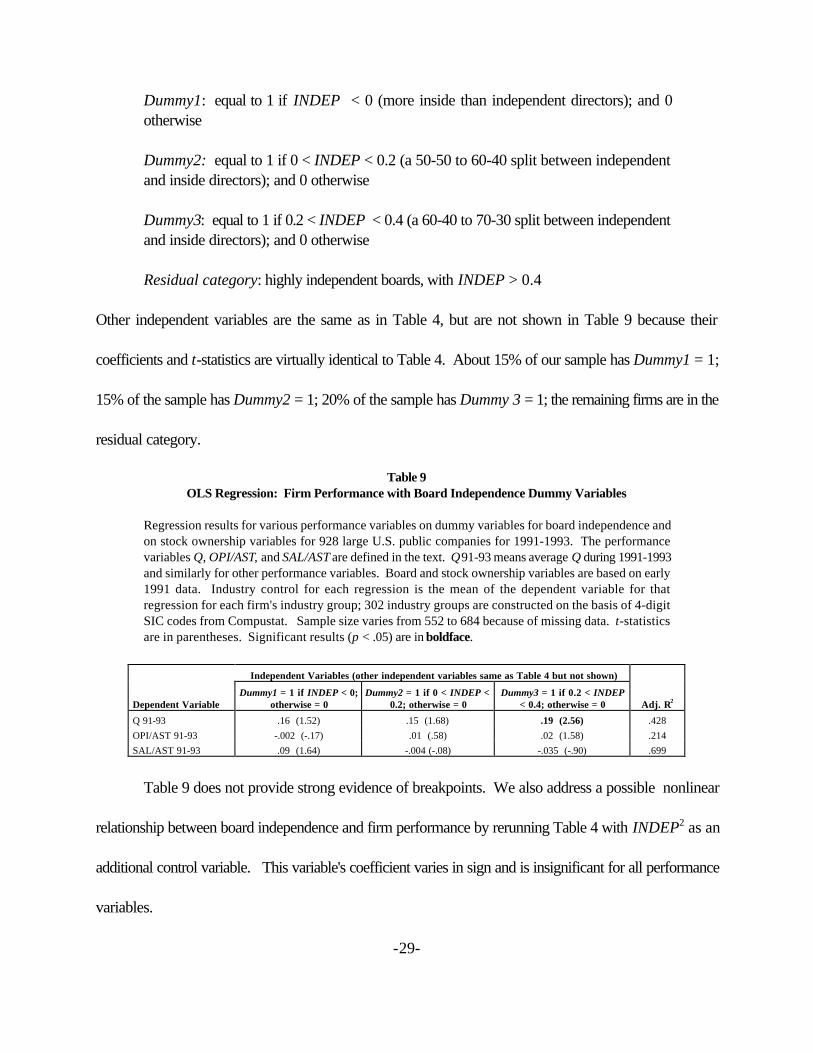
We test these hypotheses in Table 9 using dummy variables to divide boards into four
independence ranges defined as follows:
-29-
Dummy1: equal to 1 if INDEP < 0 (more inside than independent directors); and 0otherwise
Dummy2: equal to 1 if 0 < INDEP < 0.2 (a 50-50 to 60-40 split between independentand inside directors); and 0 otherwise
Dummy3: equal to 1 if 0.2 < INDEP < 0.4 (a 60-40 to 70-30 split between independentand inside directors); and 0 otherwise
Residual category: highly independent boards, with INDEP > 0.4
Other independent variables are the same as in Table 4, but are not shown in Table 9 because their
coefficients and t-statistics are virtually identical to Table 4. About 15% of our sample has Dummy1 = 1;
15% of the sample has Dummy2 = 1; 20% of the sample has Dummy 3 = 1; the remaining firms are in the
residual category.
Table 9OLS Regression: Firm Performance with Board Independence Dummy Variables
Regression results for various performance variables on dummy variables for board independence andon stock ownership variables for 928 large U.S. public companies for 1991-1993. The performancevariables Q, OPI/AST, and SAL/AST are defined in the text. Q 91-93 means average Q during 1991-1993and similarly for other performance variables. Board and stock ownership variables are based on early1991 data. Industry control for each regression is the mean of the dependent variable for thatregression for each firm's industry group; 302 industry groups are constructed on the basis of 4-digitSIC codes from Compustat. Sample size varies from 552 to 684 because of missing data. t-statisticsare in parentheses. Significant results (p < .05) are in boldface.
Independent Variables (other independent variables same as Table 4 but not shown)
Dependent VariableDummy1 = 1 if INDEP < 0;
otherwise = 0Dummy2 = 1 if 0 < INDEP <
0.2; otherwise = 0Dummy3 = 1 if 0.2 < INDEP
< 0.4; otherwise = 0 Adj. R2
Q 91-93 .16 (1.52) .15 (1.68) .19 (2.56) .428OPI/AST 91-93 -.002 (-.17) .01 (.58) .02 (1.58) .214SAL/AST 91-93 .09 (1.64) -.004 (-.08) -.035 (-.90) .699
Table 9 does not provide strong evidence of breakpoints. We also address a possible nonlinear
relationship between board independence and firm performance by rerunning Table 4 with INDEP2 as an
additional control variable. This variable's coefficient varies in sign and is insignificant for all performance
variables.
-30-
3.7 Results for board size
Yermack (1996) reports a significant negative correlation between board size and Q, SAL/AST,
OPI/AST, and OPI/SAL for large U.S. public firms. Eisenberg, Sundgren and Wells (1998) report a
negative correlation between performance and firm size for small and midsize Finnish firms. In contrast,
we find much weaker evidence of a correlation between board size and firm performance in Tables 4 and
5, and also in regressions (not shown) using OPI/SAL as a performance variable, which we run for
comparability with Yermack. For example, in Table 5, board size takes a significant negative coefficient
for 1991-1993 only for SAL/AST. For the other variables relied on by Yermack, the coefficients on board
size are insignificant and, for OPI/AST, of opposite sign to that reported by Yermack.
These results, together with similar results for board size in our 1988 subsample, where board size
is again significant and negative only for SAL/AST, cast doubt on the reliability of the findings by Yermack
and by Eisenberg, Sundgren and Wells.
3.8 Results for share ownership
Board monitoring is one possible way to induce good firm performance. A potential substitute is
to provide good incentives to management, most commonly through stock ownership. Table 5, Panel C
provides evidence of a positive correlation between past performance and CEO ownership. This suggests
that CEOs get rewarded for performing well (in the spirit of Kole, 1996). However, the suggestion that
good performance predicts higher CEO share ownership is not confirmed in Table 5-1988, where we use
1985-1987 performance and 1988 board and share ownership data. Consistent with Kole (1996) and
Himmelberg, Hubbard and Palia (1999), there is no evidence from Table 5, Panel A, that higher CEO share
ownership translates into improved future performance.
-31-
There are hints in the OLS regressions in Table 4 and the 3SLS regressions in Table 5 that stock
ownership by outside directors correlates with improved performance. Coefficients on outside director
ownership are positive for all performance variables for 1991-1993, and are marginally
significant for SAL/AST in Table 4. We return to this issue in Section 5.2.
There is no evidence in the OLS regressions in Table 4 or the 3SLS regressions in Table 5 that
monitoring by outside 5% blockholders has a consistent effect on firm performance. The coefficients on
number of outside 5% blockholders vary in sign, are significantly negative for Q, but are significantly positive
for SAL/AST.
4. Correlation between board independence and firm growth
We investigate in this section the relationship between board independence and firm growth.
The growth measures we use are:
Variable Definition
GrAST xx yy percentage growth in assets from year xx - 1 to year yy; for exampleGrAST 85-87 is percentage growth in assets from 1984 (treated as thebaseline year) to 1987
GrSAL xx yy percentage growth in sales from year xx -1 to year yy
GrOPI xx yy percentage growth in operating income from year xx -1 to year yy (wediscard observations with negative initial OPI)
Since firm growth may both determine and be determined by board independence, we move
directly to a simultaneous equations (3SLS) structure. We estimate the following system of equations:
-32-
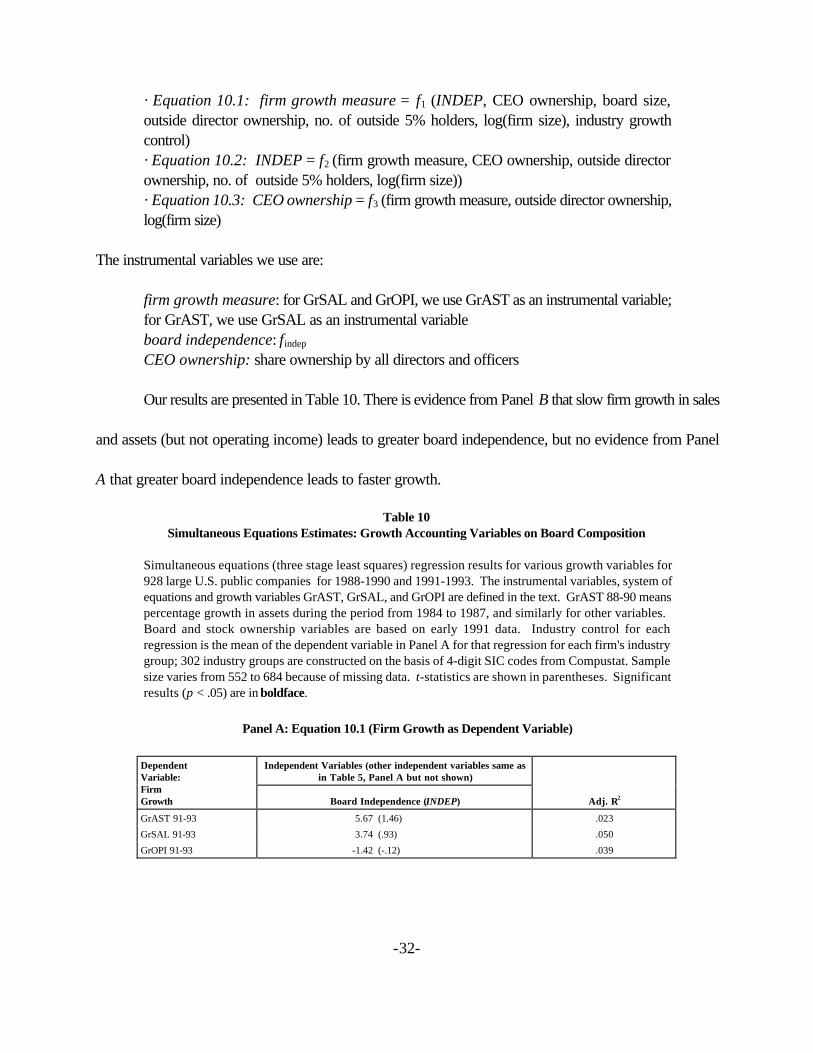
· Equation 10.1: firm growth measure = f1 (INDEP, CEO ownership, board size,outside director ownership, no. of outside 5% holders, log(firm size), industry growthcontrol)· Equation 10.2: INDEP = f2 (firm growth measure, CEO ownership, outside directorownership, no. of outside 5% holders, log(firm size))· Equation 10.3: CEO ownership = f3 (firm growth measure, outside director ownership,log(firm size)
The instrumental variables we use are:
firm growth measure: for GrSAL and GrOPI, we use GrAST as an instrumental variable;for GrAST, we use GrSAL as an instrumental variableboard independence: findep
CEO ownership: share ownership by all directors and officers
Our results are presented in Table 10. There is evidence from Panel B that slow firm growth in sales
and assets (but not operating income) leads to greater board independence, but no evidence from Panel
A that greater board independence leads to faster growth.
Table 10Simultaneous Equations Estimates: Growth Accounting Variables on Board Composition
Simultaneous equations (three stage least squares) regression results for various growth variables for928 large U.S. public companies for 1988-1990 and 1991-1993. The instrumental variables, system ofequations and growth variables GrAST, GrSAL, and GrOPI are defined in the text. GrAST 88-90 meanspercentage growth in assets during the period from 1984 to 1987, and similarly for other variables. Board and stock ownership variables are based on early 1991 data. Industry control for eachregression is the mean of the dependent variable in Panel A for that regression for each firm's industrygroup; 302 industry groups are constructed on the basis of 4-digit SIC codes from Compustat. Samplesize varies from 552 to 684 because of missing data. t-statistics are shown in parentheses. Significantresults (p < .05) are in boldface.
Panel A: Equation 10.1 (Firm Growth as Dependent Variable)
Independent Variables (other independent variables same asin Table 5, Panel A but not shown)
DependentVariable:FirmGrowth Board Independence (INDEP) Adj. R2
GrAST 91-93 5.67 (1.46) .023
GrSAL 91-93 3.74 (.93) .050
GrOPI 91-93 -1.42 (-.12) .039

-33-
Panel B: Equation 10.2 (Board Independence as Dependent Variable)
Independent Variables (other independent variables same as inTable 5, Panel B but not shown)Dependent
Variable Growth Measure Firm Growth
Adj. R2
GrAST 88-90 -.002 (-5.03) .152
GrSAL 88-90 -.002 (-4.29) .142
INDEP GrOPI 88-90 .0001 (1.14) .114
5. Conclusion
We find a reasonably strong correlation between poor performance and subsequent increase in
board independence. The change in board independence seems to be driven by poor performance rather
than by firm and industry growth opportunities. However, there is no evidence that greater board
independence leads to improved firm performance; if anything, there are hints in the other direction. The
conventional wisdom that supports a very high degree of board independence and may explain why poorly
performing firms increase board independence, appears to rest on a shaky empirical foundation.
In this concluding section, we explore some possible reasons why increased board independence
may not pay off in improved firm performance.
5.1 The case for inside directors
One reason why increasing board independence apparently doesn't pay off in improved
performance is that having a reasonable number of inside directors could add value. Baysinger and Butler
(1985) suggest that an optimal board contains a mix of inside, independent, and perhaps also affiliated
directors, who bring different skills and knowledge to the board. Including insiders on the board may make
it easier for other directors to evaluate them as potential future CEOs (Vancil, 1987; Weisbach, 1988).
Insiders also may be better at strategic planning decisions, consistent with Klein's (1998) evidence that
-34-
inside director representation on investment committees of the board correlates with improved firm
performance. This "mixed board" explanation is consistent with Klein's (1999) evidence that affiliated
directors are more likely to be found on the boards of firms that need the affiliated director's expertise,
although Klein finds no significant correlation between proportion of affiliated directors and firm
performance.
To be sure, senior managers could be invited to board meetings even if they are not board
members. But there is no guarantee that they will be invited. Moreover, the interaction between senior
managers (other than the CEO) and other directors may be different if the managers have seats on the
board, are expected to attend every meeting, must vote, and are expected to participate in board
discussions, than if they attend at the CEO's pleasure, speak only if invited to, and could be not invited to
future meetings if the CEO so decides.
A further reason why inside directors may be valuable involves the tradeoff between independence
and other essentials to good decisions. Inside directors are conflicted but well informed. Independent
directors are not conflicted, but are relatively ignorant about the company. Perhaps independent directors
will be quicker to act if something goes wrong, but more likely, in their ignorance, to do the wrong thing,
especially if their deliberations are not leavened by the information available to fellow inside directors.
There is also a tradeoff between independence and incentives. Most independent directors own
trivial amounts of their company's shares, and hence have limited incentives to monitor carefully. Inside
directors lack independence, but have their human capital and often most of their financial capital,
committed to their company. Hall and Liebman (1998) provide evidence of the sensitivity of managers'
financial wealth to firm performance. The hypothesis that director incentives affect firm performance is
-35-
consistent with the evidence in Bhagat, Carey and Elson (1999) and the limited evidence we report in
section 5.2 that independent directors perform better when they hold substantial amounts of a company's
stock.
A priori, it is not obvious that independence (without knowledge or incentives) leads to better
director performance than knowledge and strong incentives (without independence). Maybe the optimal
board has some knowledgeable, incentivized inside directors, and some independent directors --who might
thereby become better informed, and could also be better incentivized than many independent directors are
today.
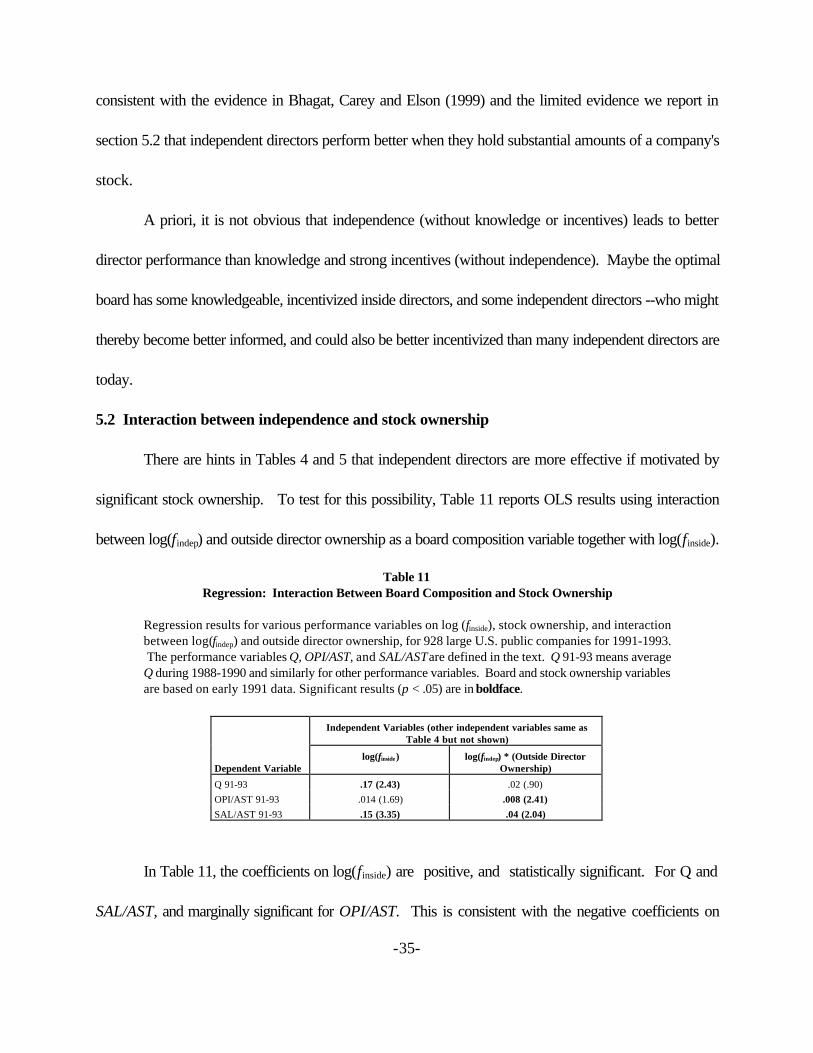
5.2 Interaction between independence and stock ownership
There are hints in Tables 4 and 5 that independent directors are more effective if motivated by
significant stock ownership. To test for this possibility, Table 11 reports OLS results using interaction
between log(findep) and outside director ownership as a board composition variable together with log(finside).
Table 11Regression: Interaction Between Board Composition and Stock Ownership
Regression results for various performance variables on log (finside), stock ownership, and interactionbetween log(findep) and outside director ownership, for 928 large U.S. public companies for 1991-1993. The performance variables Q, OPI/AST, and SAL/AST are defined in the text. Q 91-93 means averageQ during 1988-1990 and similarly for other performance variables. Board and stock ownership variablesare based on early 1991 data. Significant results (p < .05) are in boldface.
Independent Variables (other independent variables same asTable 4 but not shown)
Dependent Variablelog(finside) log(findep) * (Outside Director
Ownership)
Q 91-93 .17 (2.43) .02 (.90)OPI/AST 91-93 .014 (1.69) .008 (2.41)SAL/AST 91-93 .15 (3.35) .04 (2.04)
In Table 11, the coefficients on log(finside) are positive, and statistically significant. For Q and
SAL/AST, and marginally significant for OPI/AST. This is consistent with the negative coefficients on
-36-
INDEP for the regression with these performance variables in Table 4. The interaction variable
findep*outside director ownership is positive for all three performance variables and is significant for
OPI/AST and SAL/AST. Thus, Table 11 offers some support for the hypothesis that independent directors
who hold significant stock positions may add value, while other independent directors do not. This is
consistent with Bhagat, Carey and Elson (1999), who report that directors with substantial stock ownership
are quicker to replace the CEO.
5.3 The arguments for independent directors
How might a case be made for a modified version of the conventional wisdom that favors highly
independent boards? One possibility, explored in the previous section, is that independent directors need
to be better incentivized. A second is that today's "independent" directors aren't independent enough.
Perhaps, as Gilson and Kraakman (1991, p. 865) argue, "corporate boards need directors who are not
merely independent [of management], but who are accountable [to shareholders] as well." But if so,
institutional investors may need to put their own representatives on boards of directors, a step that few are
interested in and which is hard for them to take under current U.S. legal rules (Black, 1990; Roe, 1994).
A third possibility is that some directors who are classified as independent are not truly independent
of management, because they are beholden to the company or its current CEO in ways too subtle to be
captured in customary definitions of "independence." For example, some nominally independent directors
may serve as paid advisors or consultants to a company, or may be employed by a university or foundation
that receives financial support from the company. Unfortunately, the data needed to capture these
relationships are not available.
Perhaps, too, some directors have personal relationships with the CEO that affect their
-37-
independence. This possibility is consistent with evidence that directors who were appointed during the
current' CEO's tenure are more generous in determining the CEO's compensation (Holthausen and Larcker,
1993; Yermack, 1997). One way to begin to untangle these subtle relationships would be for the SEC to
require additional disclosure of financial or personal ties between directors (or the organizations they work
for) and the company or its CEO.
Fourth, perhaps some types of independent directors are valuable, while others are not. Maybe
CEOs of companies in other industries (who are, by number, the majority of independent directors) are
too busy with their own business, know too little about a different business, and are overly generous in
compensating another CEO. Maybe "visibility" directors -- well-known persons
with limited business experience, often holding multiple directorships and adding gender or racial diversity
to a board, are not effective on average. But this explanation suggests that to push for greater board
independence may be fruitless or even counterproductive, unless independent directors have particular
attributes, which are currently unknown.
A fifth possibility, implicit in Klein's (1998) research on board committee structures, is that
independent directors can add value, but only if they are embedded in an appropriate committee structure.
This would let independent directors perform the monitoring function that, commentators argue they are
best suited for while letting inside and affiliated directors perform the advising function to which they may
bring more firm-specific expertise. However, most large firms already have such committee structures and
Klein finds little evidence that the principal outsider-dominated "monitoring" committees -- audit,
compensation, and nominating committees -- affect performance, regardless of how they are staffed.
5.4 Policy implications
-38-
What would the implications be, if our data are right -- if greater board independence does not
improve, and may reduce, firm performance? Steps like insisting that independent directors own more
shares, or that they be more completely independent, are worth trying. Pending those steps, our data don’t
support a wholesale return to the 1960s, when boards were entirely passive. They do suggest that
companies should be free to experiment with modest departures from the current norm of a “supermajority
independent” board with only one or two inside directors. A board with, say, 6 independent directors, 4
inside directors, and one affiliated director, instead of 9 independent directors and 2 inside directors, might
bring some subtle benefits, and conveys no obvious harm. The independent directors will still numerically
dominate the board, and can take appropriate action in a crisis.
-39-
References
Agrawal, Anup and Charles R. Knoeber, 1996. Firm performance and mechanisms to control agency problemsbetween managers and shareholders. Journal of Financial and Quantitative Analysis 31, 377-397.
Agrawal, Anup and Charles R. Knoeber, 1999. Outside directors, politics, and firm performance. Workingpaper, available in Social Science Research Network Electronic Library,<http://papers.ssrn.com/papers.taf?abstract_id=125348>.
American Law Institute, 1994. Principles of corporate governance. Philadelphia, PA.
Barber, Brad M., and John D. Lyon, 1996, Detecting abnormal operating performance: The empirical power andspecification of test statistics, Journal of Financial Economics 41, 359-399.
Barber, Brad M., and John D. Lyon, 1997, Detecting long-run abnormal stock returns: The empirical power andspecification of test statistics, Journal of Financial Economics 43, 341-372.
Barnhart, Scott W. and Stuart Rosenstein, 1998, Board composition, managerial ownership and firm performance:An empirical analysis, Financial Review 33, 1-16.
Baysinger, Barry and Henry Butler, 1985. Corporate governance and the board of directors: Performance effectsof changes in board composition. Journal of Law, Economics and Organization 1, 101-124.
Bhagat, Sanjai and Bernard Black, 1999. The uncertain relationship between board composition and firmperformance, Business Lawyer 54, 921-963.
Bhagat, Sanjai, Dennis C. Carey and Charles M. Elson, 1999. Director ownership, corporate performance, andmanagement turnover, Business Lawyer 54, 885-920.
Black, Bernard, 1990. Shareholder passivity reexamined. Michigan Law Review 89, 520-608.
Byrd, John W. and Kent A. Hickman, 1992. Do outside directors monitor managers?: Evidence from tender offerbids. Journal of Financial Economics 32, 195-222.
California Public Employees Retirement System, 1998. Corporate governance core principles and guidelines. Sacramento, CA, available at <http://www.calpers-governance.org/principles/domestic/us/page01.asp>
Cotter, James F., Anil Shivdasani and Marc Zenner, 1997. Do independent directors enhance target shareholderwealth during tender offers? Journal of Financial Economics 43, 195-218.
Council of Institutional Investors, 1991. Definition of independent director. Reprinted in Corporate ControlAlert, Feb. 1991, at 11.
Council of Institutional Investors, 1998. Shareholder bill of rights. Washington D.C.
Denis, David J. and Atulya Sarin, 1999. Ownership and board structures in publicly traded corporations. Journalof Financial Economics 52, 187-223.

-40-
Eisenberg, Melvin A., 1976. The structure of the corporation: A legal analysis. Little Brown and Company. Boston, MA.
Gilson, Ronald J. and Reinier Kraakman, 1991. Reinventing the outside director: An agenda for institutionalinvestors. Stanford Law Review 43, 863-906.
Hall, Brian J. and Jeffrey B. Liebman, 1998. Are CEOs really paid like bureaucrats? Quarterly Journal ofEconomics 113, 653-691.
Hermalin, Benjamin E. and Michael S. Weisbach, 1988. The determinants of board composition. Rand Journalof Economics 19, 589-606.
Hermalin, Benjamin E. and Michael S. Weisbach, 1991. The effect of board composition and direct incentiveson firm performance. Financial Management 21(4), 101-112.
Himmelberg, Charles P., R. Glenn Hubbard and Darius Palia, 1999. Understanding the determinants of managerialownership and the link between ownership and performance. Journal of Financial Economics 53, 353-384.
Holthausen, Robert W. and David F. Larcker, 1993. Boards of directors, ownership structure, and CEOcompensation. Working paper, University of Pennsylvania (Wharton School).
Institutional Shareholder Services, 1998. The ISS proxy voting manual. Washington, DC.
Klein, April, 1998. Firm performance and board committee structure. Journal of Law and Economics 41, 275-303.
Klein, April, 1999. An empirical analysis of the relation between board of directors' composition, firmperformance, and the degree of CEO domination over the board of directors. Working paper, New YorkUniversity, Stern School of Business.
Koenker, Roger W. and Gilbert W. Bassett, 1978. Regression quantiles. Econometrica 46, 33-50.
Kole, Stacey, 1996, Managerial ownership and firm performance: Incentives or rewards? Advances in FinancialEconomics 2, 119-149.
Kothari, S. P. & Jerold Warner, 1997, Measuring long-horizon security price performance. Journal of FinancialEconomics 43, 301-339.
Longstreth, Bevis, 1994. Corporate governance: There's danger in new orthodoxies. Corporate GovernanceAdvisor, July/Aug. 18-21.
MacAvoy, Paul W., S. Cantor, J. Dana and S. Peck, 1983. ALI proposals for increased control of thecorporation by the board of directors: An economic analysis. In Statement of the Business Roundtable on theAmerican Law Institute's Proposed "Principles of Corporate Governance and Structure: Restatement andRecommendations, exhibit C-1.
Mikhail, W.M., 1975. A comparative Monte Carlo study of the properties of econometric estimators. Journal ofthe American Statistical Association 70, 94-104.
-41-
Millstein, Ira, 1993. The evolution of the certifying board. Business Lawyer 48, 1485-1497.
National Association of Corporate Directors, 1996, Report of the NACD blue ribbon commission on directorprofessionalism.
Noe, Thomas H. and Michael J. Rebello, 1996. The design of corporate boards: Composition, compensation,factions and turnover. Georgia State Univ. College of Business Administration working paper 96-01.
Roe, Mark J., 1994. Strong managers, weak owners: The political roots of American corporate finance. Princeton University Press, Princeton, NJ.
Rosenstein, Stuart and Jeffrey G. Wyatt, 1990. Outside directors, board independence, and shareholder wealth. Journal of Financial Economics 26, 175-191.
Rosenstein, Stuart and Jeffrey G. Wyatt, 1997. Inside directors, board effectiveness, and shareholder wealth. Journal of Financial Economics 44, 229-250.
SpencerStuart, 1998. 1997 Board Index: Board Trends and Practices at S&P 500 Corporations.
Theil, Henri, 1971. Principles of Econometrics. Wiley, New York, NY.
Vance, Stanley C., 1964. Board of directors: Structure and performance. Harvard Business School Press, Boston,MA.
Vancil, Richard F., 1987. Passing the baton: Managing the process of CEO selection. Harvard Business SchoolPress, Boston, MA.
Weisbach, Michael S., 1988. Outside directors and CEO turnover. Journal of Financial Economics 20, 431-460.
Yermack, David, 1996. Higher market valuation of companies with a small board of directors. Journal ofFinancial Economics 40, 185-212.
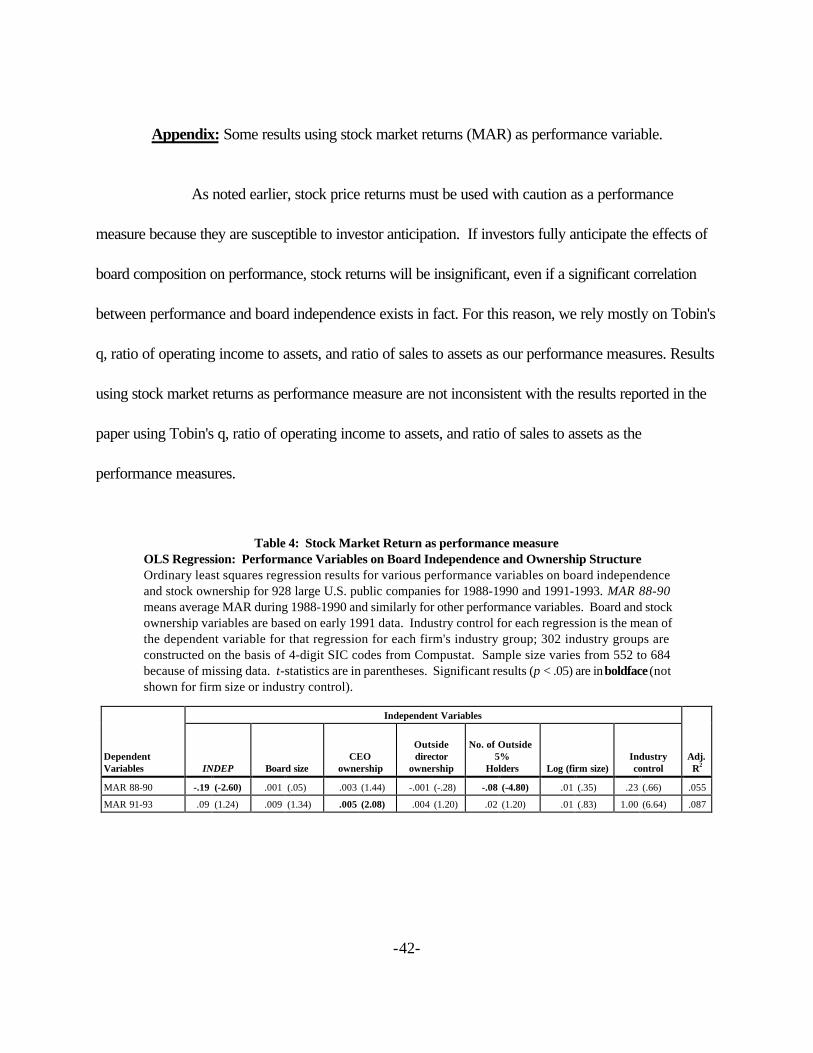
-42-
Appendix: Some results using stock market returns (MAR) as performance variable.
As noted earlier, stock price returns must be used with caution as a performance
measure because they are susceptible to investor anticipation. If investors fully anticipate the effects of
board composition on performance, stock returns will be insignificant, even if a significant correlation
between performance and board independence exists in fact. For this reason, we rely mostly on Tobin's
q, ratio of operating income to assets, and ratio of sales to assets as our performance measures. Results
using stock market returns as performance measure are not inconsistent with the results reported in the
paper using Tobin's q, ratio of operating income to assets, and ratio of sales to assets as the
performance measures.
Table 4: Stock Market Return as performance measureOLS Regression: Performance Variables on Board Independence and Ownership StructureOrdinary least squares regression results for various performance variables on board independenceand stock ownership for 928 large U.S. public companies for 1988-1990 and 1991-1993. MAR 88-90means average MAR during 1988-1990 and similarly for other performance variables. Board and stockownership variables are based on early 1991 data. Industry control for each regression is the mean ofthe dependent variable for that regression for each firm's industry group; 302 industry groups areconstructed on the basis of 4-digit SIC codes from Compustat. Sample size varies from 552 to 684because of missing data. t-statistics are in parentheses. Significant results (p < .05) are in boldface (notshown for firm size or industry control).
Independent Variables
DependentVariables INDEP Board size
CEOownership
Outsidedirector
ownership
No. of Outside 5%
Holders Log (firm size)Industrycontrol
Adj.R2
MAR 88-90 -.19 (-2.60) .001 (.05) .003 (1.44) -.001 (-.28) -.08 (-4.80) .01 (.35) .23 (.66) .055
MAR 91-93 .09 (1.24) .009 (1.34) .005 (2.08) .004 (1.20) .02 (1.20) .01 (.83) 1.00 (6.64) .087
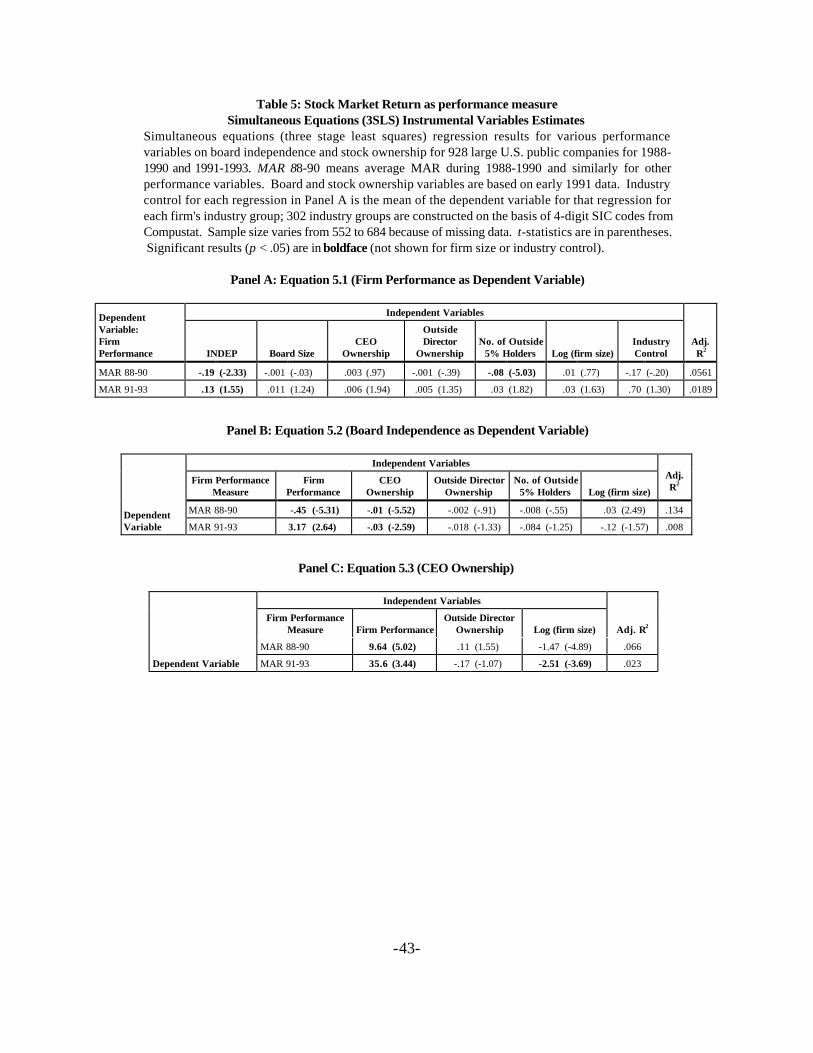
-43-
Table 5: Stock Market Return as performance measureSimultaneous Equations (3SLS) Instrumental Variables Estimates
Simultaneous equations (three stage least squares) regression results for various performancevariables on board independence and stock ownership for 928 large U.S. public companies for 1988-1990 and 1991-1993. MAR 88-90 means average MAR during 1988-1990 and similarly for otherperformance variables. Board and stock ownership variables are based on early 1991 data. Industrycontrol for each regression in Panel A is the mean of the dependent variable for that regression foreach firm's industry group; 302 industry groups are constructed on the basis of 4-digit SIC codes fromCompustat. Sample size varies from 552 to 684 because of missing data. t-statistics are in parentheses. Significant results (p < .05) are in boldface (not shown for firm size or industry control).
Panel A: Equation 5.1 (Firm Performance as Dependent Variable)
Independent VariablesDependentVariable:FirmPerformance INDEP Board Size
CEOOwnership
OutsideDirector
OwnershipNo. of Outside
5% Holders Log (firm size)IndustryControl
Adj.R2
MAR 88-90 -.19 (-2.33) -.001 (-.03) .003 (.97) -.001 (-.39) -.08 (-5.03) .01 (.77) -.17 (-.20) .0561
MAR 91-93 .13 (1.55) .011 (1.24) .006 (1.94) .005 (1.35) .03 (1.82) .03 (1.63) .70 (1.30) .0189
Panel B: Equation 5.2 (Board Independence as Dependent Variable)
Independent Variables
Firm PerformanceMeasure
FirmPerformance
CEOOwnership
Outside DirectorOwnership
No. of Outside5% Holders Log (firm size)
Adj.R2
MAR 88-90 -.45 (-5.31) -.01 (-5.52) -.002 (-.91) -.008 (-.55) .03 (2.49) .134DependentVariable MAR 91-93 3.17 (2.64) -.03 (-2.59) -.018 (-1.33) -.084 (-1.25) -.12 (-1.57) .008
Panel C: Equation 5.3 (CEO Ownership)
Independent Variables
Firm PerformanceMeasure Firm Performance
Outside DirectorOwnership Log (firm size) Adj. R2
MAR 88-90 9.64 (5.02) .11 (1.55) -1.47 (-4.89) .066
Dependent Variable MAR 91-93 35.6 (3.44) -.17 (-1.07) -2.51 (-3.69) .023

-44-