Embed Size (px)
Citation preview
1
PRESS RELEASE
BOARD APPROVES RESULTS AS AT MARCH 31, 2016
Net profit of EUR 93 million, supported by the decrease in loan loss provisions
Pre-provision profit at EUR 541 million, driven by net interest income (+1.3% Q/Q), net fees and commissions (+1.2% Q/Q) and operating costs (-2.5% Q/Q)
Further improvement in asset quality: loan loss provisions of EUR 346 million, down 40% compared to the fourth quarter of 2015 and at the lowest level in the past four years
Decrease in net non-performing loans (-0.4% Q/Q) and increase of coverage to 49% (+59 bps)
Direct funding at EUR 120 billion (+0.2% Q/Q) with an increase in repos offsetting the decrease of other forms of funding
Unencumbered counterbalancing capacity recovery continues: EUR 18.5 billion at 31 March 2016 and further improving in the period following
Solid Capital Position, with Transitional Common Equity Tier 1 at 11.7%
Siena, 5 May 2016 – The Board of Directors of Banca Monte dei Paschi di Siena S.p.A. reviewed
and approved the results as at 31 March 2016.
Main consolidated Income Statement results (comparison to 4Q15):
Net interest income at EUR 548 million up 1.3% Q/Q thanks to reduced funding costs – a result
of commercial actions and of a change in volume mix with a drop of costly commercial funding
and an increase in repurchase agreements with institutional counterparties at more favorable
rates – which has more than offset the decrease in interest-bearing assets yield, mainly related
to the decline in market interest rates.
Net fees and commissions at EUR 457 million, up 1.2% Q/Q, supported by the growth in
commissions from lending (about +13% Q/Q).
Other revenues1 at EUR 185 million (EUR +43 million Q/Q), which include the positive effects
of the optimization of the AFS portfolio, the contribution from assets/liabilities at fair value and
the trading activity carried out by MPS Capital Services.
1 Net result from trading-valuation-repurchase of financial assets/liabilities, dividends, similar income and gains (losses)
on investments, net profit (loss) from hedging.

2
Operating costs equal to EUR 645 million, down 2.5% Q/Q. Personnel expenses amount to
EUR 418 million, up by 5.4% from the fourth quarter of 2015, which had benefited from positive
non-recurring items (year-end adjustments). Other administrative expenses, at about EUR 177
million (-14% Q/Q), are affected by seasonality.
Loan loss provisions at EUR 346 million, (the lowest level in the past four years), down 40.1%
Q/Q, thanks to the stabilization of inflows from performing and to the increase of outflows to
performing. Cost of credit in the first quarter 2016 stands at 122 bps vs. 179 bps at year end.
Average non-performing exposure coverage at 49% (+59 bps compared to December 2015).
Non operating items negative by EUR 69 million, which include an annual contribution of EUR
71 million to the Single Resolution Fund (SRF).
Net profit of the first quarter 2016 at EUR 93 million.
Main consolidated Balance Sheet results (comparison to December 2015):
Loans to customers at EUR 114 billion, up EUR 2.2 billion vs. 31 December 2015 (+2.0%),
reversing the negative trend that characterized recent years, with signs of growth both in
commercial and institutional segments.
Direct funding at EUR 120 billion, +0.2% vs. December 2015, supported by the increase in
repos that offset the decrease of other forms of funding. Commercial funding, which decreased
earlier this year, has started increasing again in March and April.
Indirect funding at EUR 105 billion, down 1.2% vs. December 2015, impacted by a negative
market effect that was above the net positive inflows, both in wealth management and in assets
under custody.
Unencumbered counterbalancing capacity of c. EUR 18.5 billion at the end of March 2016
(10.6% of total assets) and further improving in the period following.
Gross non-performing exposures at EUR 47 billion, up by EUR 377 million in the first quarter of
2016 (EUR 414 million in the fourth quarter of 2015), at the lowest level in the past two years
(excluding the impact of the disposal of non-performing loans). The stock of net non-performing
exposures has declined compared to December 2015. This trend was positively affected by the
changes recorded in inflows/outflows from performing to non performing, by the increase in
recoveries of bad loans and further optimization actions related to the stock of non-performing
exposures (closures/write-offs and recovery of unlikely to pay).
Transitional Common Equity Tier 1 at 11.7% (12% in December 2015), affected by the
increase of the percentage of phasing-in and by the rise in Risk-Weighted Assets, mainly due
to the increase in loans.

3
Group profit and loss results for the first quarter 2016
In the first quarter of 2016, the Group’s Total Revenues stand at c. EUR 1,186 million, down EUR
188 million (-13.7%) compared to the same period last year, mainly due to net interest income
(EUR -59 million) and to a net loss from trading (EUR -116 million), which in 2015 was positively
affected by the Alexandria restatement (EUR +106 million).
Net interest income is approximately EUR 548 million, down 9.6% vs. the first quarter 2015, as a
result of the negative trend of interest-bearing assets (decreased average volumes and related
yields), which was partially offset by lower negative interest expense resulting from the
reimbursement of New Financial Instruments (NFIs) and by the reduced cost of funding. Compared
to the last quarter of 2015, the aggregate is up by 1.3%, thanks to a decrease in the cost of funding
(the result of commercial actions and of a shift in volumes towards less costly repos with
institutional counterparties, prompted by a decline in commercial funding). This more than offset
the lower yields on interest-bearing assets, affected by average volumes and interest rates – the
latter largely attributable to Euribor repricing.
Net fees and commissions, totalling approximately EUR 457 million, up 3.1% Y/Y, affected by
savings on the cost of State guarantee on “Monti Bonds” (EUR 10 million on bonds of about EUR
6.5 billion which matured between February and March 2015). The quarter also saw a decline in
placement fees, mainly due to financial market dynamics, offset by the growth of proceeds from
lending. The comparison with the fourth quarter of 2015 shows an uptick of +1.2%.
Dividends, similar income and profit (loss) on investments, totalling approximately EUR 19
million (against EUR 24.3 million in the first quarter 2015), substantially coincide with the
contribution of AXA-MPS, consolidated at net equity.
Net profit/loss from trading/valuation/repurchase of financial assets/liabilities in the first
quarter 2016 is approximately EUR 166 million, down compared to the same period last year
(circa EUR -116 million) due to a decline in trading activity, attributable to the effect of the
Alexandria restatement (EUR +111 million at 31 March 2015), to the drop in disposal/repurchase
proceeds (EUR -101 million mainly on securities classified as AFS), and to the increase in net
profit from assets/liabilities at fair value (c. EUR +100 million).
Net income from hedging essentially nil in the quarter (positive for approximately EUR 16 million
in the first quarter of 2015).
Other operating expenses/income are negative by approximately EUR -5 million vs. EUR 1.4
million in the first quarter of 2015.
In the first quarter of 2016 Operating expenses are approximately EUR 645 million, down 1.3%
vs. the first quarter 2015 and down 2.5% vs. the fourth quarter of 2015.
Personnel expenses are about EUR 418 million, down 0.4% Y/Y thanks to headcount reductions
that helped offset an increase in spending due to the Union agreement of December 24, 2015.
Other administrative expenses amount to c. EUR 177 million, lower compared to the same
period last year (-4.5%) mainly thanks to cutbacks in spending which affected, in particular, real
4
estate/security management (-14% Q/Q: however not a particularly significant trend, considering
the impact of seasonal effects).
Net value adjustments to tangible and intangible assets are c. EUR 50 million, up 3.8%
compared to the same period last year owing to greater amortization of intangible assets (-15.4%
Q/Q).
Taking these factors into account, the Group’s Pre-Provision Profit is approximately EUR 541
million (EUR 720 million in the first quarter 2015, EUR 456 million in the fourth quarter 2015).
In the first quarter of 2016 the Group reported Net impairment losses on loans of c. EUR 346
million, down compared to the same period of the last year (-26.1%) especially in relation to the
slowdown of bad loan flows (the change in the stock of gross bad loans, which occurred in the first
quarter of 2016 was lower by 70% Y/Y). The annual trend is down even when excluding the Credit
File Review impact on figures in the first quarter of 2015.
The ratio of loan loss provisions in 2016 over total customer loans reflects a cost of risk of 122
bps, compared to 179 bps at the end of 2015.
Net impairment losses (reversals) on financial assets show a negative balance of EUR -3.3
million due to losses on AFS positions (c. EUR -11 million) essentially offset by releases of credit
commitments (about EUR +7.5 million).
As a consequence, the Group’s net operating result is about EUR 191 million, down 27.9%
compared to the first quarter of 2015. Excluding the effect of the Alexandria restatement, the trend
is positive and the progress is thanks to improved credit dynamics.
Net profit for the period is also affected by:
- Net provisions for risks and charges of EUR -5 million, mainly focused on provisions for
litigations, down compared to the first quarter of 2015;
- Gains (losses) on investments, c. EUR 7.5 million (almost nil in the first quarter of 2015)
essentially due to capital gains from the sale of Fabrica Immobiliare SGR. The fourth
quarter of 2015, c. EUR -7.1 million, included the reduction of equity of some subsidiaries
(in particular Marinella and Terme di Chianciano);
- Risks and charges related to SRF, DGS (Deposit Guarantee Scheme) and similar
schemes, came to c. EUR -71 million including the entire annual contribution of the
Group to the SRF.
- Gains (losses) on disposal of investments, balance essentially nil.
Due to the events mentioned above, in the first quarter of 2016 the Group’s Profit (loss) from
continuing operations before tax amounts to approximately EUR 122 million. The decline of
48.2% Y/Y, corresponding to approximately EUR -114 million, is due to higher revenues in 2015
attributable to the effect of the Alexandria restatement (EUR +106 million).
Taxes on profit (loss) for the period from continuing operations amount to approximately EUR
-21 million compared to EUR -79 million for the first quarter of 2015, which included an
extraordinary charge of about EUR 22 million, resulting from the unfavourable outcome of an

5
appeal lodged by Banca Monte dei Paschi di Siena to the Agenzia dell’Entrate (The Italian
Revenue Agency) under art. 11, Law 27/07/2000 nr. 212, for which a reply was notified on April 21,
2015.
Considering the net effects of PPA (c. EUR -8 million) and including net profit to non-controlling
interests (EUR 0.5 million), the Group's net result relative to the first quarter of 2016 amounts
to EUR 93 million, against a profit of about EUR 144 million reported in the first quarter of 2015 (of
which about EUR 71 million relative to the Alexandria restatement).
Group balance sheet aggregates for the first quarter 2016
As at 31 March 2016 total funding volumes for the Group amount to approximately EUR 224
billion (-0.5% Q/Q), with stable direct funding (+0.2% Q/Q) and a decrease of around EUR 1
billion euro in indirect funding (-1.2%), entirely due to the negative market effect.
Direct funding, totalling approximately EUR 120 billion (+0.2% vs. 31 December 2015), is
enhanced by the increase in repos, which offsets the decrease in all the other forms of funding.
Commercial funding outflows, registered primarily in January 2016, were due to reactions to the
financial market turmoil (especially in the banking sector). This trend is particularly significant for
corporate customers, more sensitive to “bail-in” effects, and was concentrated during January
2016, but then gradually stabilized. The use of repos with market counterparties was possible
thanks to the unencumbered counterbalancing capacity that, as at 31 December 2015, amounted
to EUR 24 billion; moreover, during the first quarter of 2016, additional available assets
(securitization, Abaco, etc.) have been generated and the counterbalancing capacity, amounting to
EUR 18.5 billion as at 31 March 2016 is well above the contingency level and further improving in
the period following.
The Group’s market share2 of direct funding is 4.45% (January 2016).
The Group’s indirect funding, approximately EUR 105 billion, is down 1.2% Q/Q, affected by the
negative market effect, which is greater than the positive net inflows recorded both in wealth
management and in assets under custody. Wealth management, approximately EUR 55 billion, is
down by about EUR -0.3 billion vs. December 2015, especially Funds (EUR -0.4 billion) impacted
by stock prices, while both bancassurance and discretionary accounts show a positive trend
(respectively +1.3% and +0.3%).
As at 31 March 2016 Group customer loans amount to approximately EUR 114 billion, up EUR
+2.2 billion compared to 31 December 2015 (+2.0%) reversing the negative trend that had
characterized recent years.
The quarterly trend is due in part to non-commercial components (approximately EUR +1.4 billion
mainly of repos), in addition to an expansion of the commercial component.
The downward trend in net impaired loans continues (EUR -85 million; -0.4% Q/Q).
The Group’s market share3 stands at 6.92% (January 2016) up 7 bps compared to the end of
2015.
2 Deposits and repurchase agreements (excluding repurchase agreements with central counterparties) with customers
resident in Italy, and bonds net of repurchases placed with Italian customers as first borrower. 3 Resident loans to ordinary customers, including bad loans and net of repurchase agreements with central
counterparties.

6
In the first quarter of 2016, the aggregate is supported by new medium-long term lending by over
EUR 2 billion, increased from the same period of last year (about +7%) and includes both
households and companies.
As at 31 March 2016 the Group’s net non-performing loans exposure is approximately EUR 24
billion, down by EUR 85 million Q/Q. In the first quarter 2016, net bad loans increase by +4.6%,
while unlikely to pay loans and past-due and overdue exposures decrease respectively by -2.8%
and -9.3%.
Group’s gross non performing exposures as at 31 March 2016 equal EUR 47 billion, a
quarterly increase of circa EUR 377 million, down 70% compared to the first quarter of 2015 and
dropping to one of the lowest levels in the last two years (impacts of the disposal of non-performing
exposures excluded). This trend has been positively affected by the changes recorded in
inflows/outflows from performing to default, by the increase in recoveries on bad loans and further
optimization actions on the stock of non-performing exposures. Efforts to reduce the level of non-
performing exposures through specific disposals continue.
As at 31 March 2016 coverage of non-performing exposures is 49.0%, up by 59 bps compared to
December 2015. Bad loans coverage is 63.3%, down from 31 December 2015 (-17 bps). With
regard to unlikely to pay loans coverage at quarter end amounts to 29.1% (-9 bps vs. 31 December
2015) whilst coverage for past due exposures increases to 27.2% from 26.1% at the end of
December 2015 (+109 bps).
At end of March 2016, the Group’s financial assets amount to approximately EUR 40 billion, up
EUR 4.8 billion from December 2015, of which EUR 4.5 billion relative to trading activity and EUR
0.3 billion relative to AFS assets. The increase in trading activity is mainly due to MPS Capital
Services and is essentially evenly distributed between the debt securities portfolio (Italian govies,
for which the company acts as primary dealer) and market repos. With regard to the increase of
the AFS, the trend is primarily related to Banca Monte dei Paschi di Siena and is due to the
portfolio optimization actions that significantly affected the fourth quarter of 2015.
The Group’s net interbank position at quarter end stands at approximately EUR 10.7 billion in
funding, with an increase of EUR 1.4 billion vs. 31 December 2015 (an improvement from the end
of the first quarter 2015, EUR -4 billion).
The liquidity position as at 31 March 2016 shows an unencumbered counterbalancing capacity of
approximately EUR 18.5 billion, down by about EUR -5 billion compared to the end of December
2015, affected by the dynamics of direct funding previously described, but increasing by over EUR
1 billion Y/Y.
The Group’s shareholders’ equity and non-controlling interests as at 31 March 2016 amount
to approximately EUR 9.7 billion, an improvement of about EUR 78 million from year end (thanks
to the profit of the period) with an increase in reserves resulting from the 2015 profit allocation. The
growth compared to 31 March 2015 (EUR +3.5 billion) is down to the capital increase effected by
Banca Monte dei Paschi di Siena in June 2015.

7
Compared to 31 December 2015, CET1 slightly decreases (EUR -62 million), mainly as a
consequence of the increase in the percentage of phased-in deductions (from 40% in 2015 to 60%
in 2016).
The positive impact of the net profit generated during the quarter, which for the part due to the
change in fair value of own liabilities has no effect on equity, is offset by the Basel 3 deductions.
Tier1 decreases by about EUR 113 million, not only for the reduction of CET1, but mainly due to
the grandfathering applied to Additional Tier 1 instruments that reduced contribution to the
regulatory capital.
Tier2 (decreased by about EUR 193 million) is primarily impacted by the regulatory amortization of
subordinated bonds provided for by Basel 3.
Total Capital decreases by EUR 306 million compared to 31 December 2015.
Risk-weighted assets are up by approximately EUR 1,285 million compared to 31 December 2015,
mainly due to the growth of the standard credit risk portfolio, driven by an increase in the loan
portfolio, and of market risk.
In light of the above, capital ratios on a transitional basis at 31 March 2016 are therefore slightly
down compared to December 2015, but remain well above the minimum threshold required by the
Supervisory Authority under SREP.
*****
On May 3, 2016 Decree n. 59/2016 was published in the Official Gazette and came into force on
the day following its publication.
This Decree includes, inter alia, provisions for deferred tax assets (DTAs) under which companies
will be able to continue to apply the current rules on conversion of deferred tax assets into tax
credits, provided they exercise a specific irrevocable option within 30 days from the publication of
the Decree and pay an annual fee for each year from 2015 until, if certain yearly conditions still
apply, 2029. As clarified by the Government’s press release of April 29, these provisions are
expected to overcome the exceptions raised by the European Commission of the possibility that
the current legal framework relating to deferred tax assets might constitute State Aid.
More specifically, each annual fee is determined by applying the 1.5% rate to a "basis" obtained by
adding the difference between the convertible DTAs recorded in the annual report for that financial
year and the corresponding DTAs recorded in the 2007 annual report to the total amount of DTAs
converted into tax credit since 2008 (until the year in question), and subtracting taxes paid for the
aforementioned tax years, as provided for by the Decree.
The Bank estimates that the fee for 2015 for the Group will be about EUR 80 million, before taxes
(according to the Decree, the fee is fiscally deductible for IRES and IRAP purposes). This estimate
is based on the current best interpretation of the information inferred from the Decree and,
therefore, is subject to modification following the publication of specific instructions by the Italian
Tax Agency, as is the foreseen accounting treatment.
8
*****
Please note that, following the recent changes to the Consolidated Law on Finance (TUF) in force
since March and pending any regulatory measures taken by CONSOB, the publication of data and
information at March 31, 2016 is carried out on a voluntary basis and is not to be construed as a
commitment by the Group and/or the Bank to produce and/or to publish quarterly data, information
or interim management reports in the future.
*****
Pursuant to paragraph 2, article 154-bis of the Consolidated Finance Act, the Financial Reporting Officer, Mr. Arturo Betunio, declares that the accounting information contained in this press release corresponds to the document results, books and accounting records.
°°°°°°°°°°°°°°
This press release will be available at www.mps.it
For further information:
External Relations Investor Relations
Tel. 0577.296634 Tel: 0577.299350

9
Reclassified accounts
Income statement and balance sheet reclassification principles
With a view to ensure an adequate disclosure regarding the criteria of representation of the
economic and financial impact related to the Alexandria transaction, the figures published in the
previous interim financial statement as at 31 March 2015 were restated in line with the approach
already adopted in the Annual Report 2015. More details will be available in section "Adjustment of
prior year amounts and changes in estimates in accordance with IAS 8 (Accounting Policies,
Changes in accounting Estimates and Errors)" in the Notes to the consolidated financial
statements 2015.
This correction had an impact on the following reclassified items:
Income Statement:
- Net interest income;
- Net income from trading-valuation-repurchase of financial assets/liabilities;
- Net income from hedging activities;
- Income tax from continuing operations;
- Profit (loss) for the period
Balance Sheet:
- Marketable securities;
- Other assets;
- Due to customers and securities in issue;
- Other liabilities;
- Shareholders' equity (valuation reserves, reserves, profit (loss))
In view of the above, below is a description of the reclassifications effected as at 31 March 2016:
Income Statement
a) The item of the reclassified income statement “Net profit (loss) from trading-valuation-
repurchase of financial assets/liabilities" includes Item 80 "Net profit (loss) from trading",
Item 100 "Gains (losses) on disposal/repurchase of loans, financial assets available for sale or
held to maturity and financial liabilities" and Item 110 "Net profit (loss) on financial assets and
liabilities designated at fair value". This item incorporates dividends earned on securities held in
the Group's securities portfolio (approximately EUR 0.6 million)
b) The item of the reclassified income statement “Dividends, similar income and gains (losses)
on investments” incorporates item 70 “Dividends and similar income” and a portion of item 240
“Gains (losses) on investments” (approximately EUR 19 million, corresponding to the share of
profit and loss for the period contributed by investments in the associate AXA, consolidated at
equity). Dividends earned on securities held in the securities portfolio, as outlined under the
item above, have also been eliminated from the aggregate.
c) The item of the income statement “Other operating income (expense)” excludes stamp duty
and client expense recoveries, which have been reclassified to the item “Other administrative
expenses”.

10
d) The item of the reclassified income statement "Other administrative expenses" included
stamp duty and client expense recoveries (EUR 96 million) accounted in the balance sheet
under item 220 "Other operating expenses / income". The item was also reduced by the
charges arising from EU directives DGSD for deposit guarantee and BRRD for the resolution of
banking crises (about EUR 71 million), reclassified under "Risks and charges related to SRF,
DGS and similar schemes ".
e) The item of the reclassified income statement "Net impairment losses on financial assets
and other operations" includes the balance sheet items 130b "Financial assets available for
sale", 130c "Financial assets held to maturity" and 130d "Other financial transactions"
f) The item of the income statement "Risks and charges related to the SRF, DGS and similar
schemes" includes the charges (about EUR 71 million) which were separated from "Other
administrative expenses", pursuant to the transposition of the EU directives DGSD for deposit
guarantee and BRRD for the resolution of banking crises
g) The item "Profit (loss) from equity investments" does not include the components reclassified
in the item "Dividends and similar income and gains (losses) on investments."
h) The effects of Purchase Price Allocation (PPA) were reclassified to the specific item after
separating them from the financial items concerned (in particular "net interest income" of
approximately EUR 4.9 million and depreciation/amortization of approximately EUR 6.9
million, net of a theoretical tax burden of approximately EUR -4 million which is included in the
related item).
Balance sheet
i) The item “Tradable Financial assets” on the assets side of the reclassified balance-sheet
includes item 20 "Financial assets held for trading", item 30 "Financial assets designated at fair
value" and item 40 "Financial assets available for sale".
j) The item "Other assets” on the assets side of the reclassified balance-sheet incorporates item
80 "Hedging derivatives", item 90 "Change in value of macro-hedged financial assets", item 140
"Tax assets", item 150 "Non-current assets and groups of assets held for sale and discontinued
operations" and item 160 "Other assets";
k) The item "Due to customers and debt securities issued” on the liabilities side of the
reclassified balance-sheet includes item 20 "Deposits from customers", item 30 "Debt securities
issued" and item 50 "Financial liabilities designated at fair value";
l) The item “Other liabilities” on the liabilities side of the reclassified balance sheet incorporates
item 60 “Hedging derivatives”, item 70 “Change in value of macro-hedged financial liabilities",
item 80 “Tax liabilities”, item 90 “Liabilities associated with non-current assets held for sale and
discontinued operations” and item 100 “Other liabilities”.
11
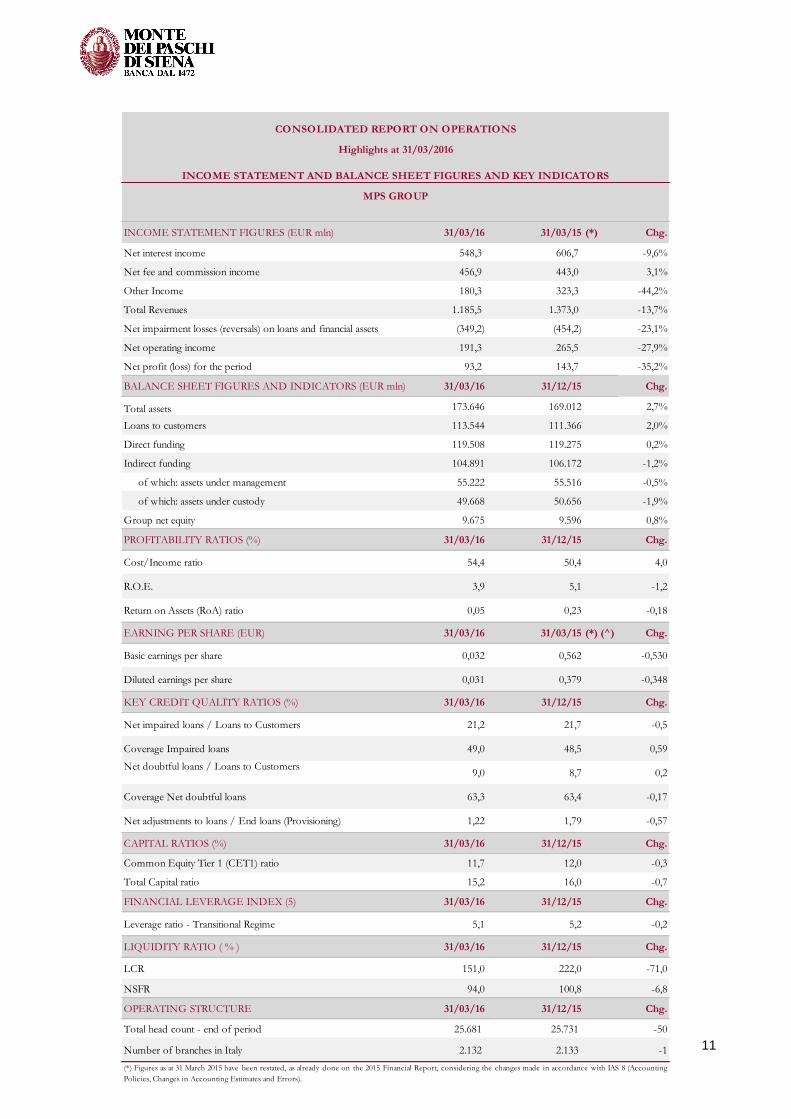
INCOME STATEMENT FIGURES (EUR mln) 31/03/16 31/03/15 (*) Chg.
Net interest income 548,3 606,7 -9,6%
Net fee and commission income 456,9 443,0 3,1%
Other Income 180,3 323,3 -44,2%
Total Revenues 1.185,5 1.373,0 -13,7%
Net impairment losses (reversals) on loans and financial assets (349,2) (454,2) -23,1%
Net operating income 191,3 265,5 -27,9%
Net profit (loss) for the period 93,2 143,7 -35,2%
BALANCE SHEET FIGURES AND INDICATORS (EUR mln) 31/03/16 31/12/15 Chg.
Total assets 173.646 169.012 2,7%
Loans to customers 113.544 111.366 2,0%
Direct funding 119.508 119.275 0,2%
Indirect funding 104.891 106.172 -1,2%
of which: assets under management 55.222 55.516 -0,5%
of which: assets under custody 49.668 50.656 -1,9%
Group net equity 9.675 9.596 0,8%
PROFITABILITY RATIOS (%) 31/03/16 31/12/15 Chg.
Cost/Income ratio 54,4 50,4 4,0
R.O.E. 3,9 5,1 -1,2
Return on Assets (RoA) ratio 0,05 0,23 -0,18
EARNING PER SHARE (EUR) 31/03/16 31/03/15 (*) (^) Chg.
Basic earnings per share 0,032 0,562 -0,530
Diluted earnings per share 0,031 0,379 -0,348
KEY CREDIT QUALITY RATIOS (%) 31/03/16 31/12/15 Chg.
Net impaired loans / Loans to Customers 21,2 21,7 -0,5
Coverage Impaired loans 49,0 48,5 0,59
Net doubtful loans / Loans to Customers9,0 8,7 0,2
Coverage Net doubtful loans 63,3 63,4 -0,17
Net adjustments to loans / End loans (Provisioning) 1,22 1,79 -0,57
CAPITAL RATIOS (%) 31/03/16 31/12/15 Chg.
Common Equity Tier 1 (CET1) ratio 11,7 12,0 -0,3
Total Capital ratio 15,2 16,0 -0,7
FINANCIAL LEVERAGE INDEX (5) 31/03/16 31/12/15 Chg.
Leverage ratio - Transitional Regime 5,1 5,2 -0,2
LIQUIDITY RATIO ( % ) 31/03/16 31/12/15 Chg.
LCR 151,0 222,0 -71,0
NSFR 94,0 100,8 -6,8
OPERATING STRUCTURE 31/03/16 31/12/15 Chg.
Total head count - end of period 25.681 25.731 -50
Number of branches in Italy 2.132 2.133 -1
(*) Figures as at 31 March 2015 have been restated, as already done on the 2015 Financial Report, considering the changes made in accordance with IAS 8 (Accounting
Policies, Changes in Accounting Estimates and Errors).
CONSOLIDATED REPORT ON OPERATIONS
MPS GROUP
INCOME STATEMENT AND BALANCE SHEET FIGURES AND KEY INDICATORS
Highlights at 31/03/2016

12
Reclassified Income Statement (Euro mln)
31/03/16 31/03/15
Montepaschi Group (*) Abs. %
Net interest income 548,3 606,7 (58,5) -9,6%
Net fee and commission income 456,9 443,0 13,9 3,1%
Income from banking activities 1.005,2 1.049,7 (44,5) -4,2%
Dividends, similar income and gains (losses) on investments 19,3 24,3 (5,0) -20,5%
Net profit (loss) from trading 165,7 281,7 (115,9) -41,2%
Net profit (loss) from hedging 0,1 15,9 (15,8) -99,1%
Other operating income (expenses) (4,9) 1,4 (6,3) n.s.
Total Revenues 1.185,5 1.373,0 (187,5) -13,7%
Administrative expenses: (594,7) (604,9) 10,2 -1,7%
a) personnel expenses (417,6) (419,4) 1,7 -0,4%
b) other administrative expenses (177,1) (185,5) 8,4 -4,5%
Net losses/reversal on impairment on property, plant and equipment / Net adjustments to (recoveries on) intangible assets(50,2) (48,4) (1,8) 3,8%
Operating expenses (645,0) (653,3) 8,3 -1,3%
Pre Provision Profit 540,5 719,7 (179,2) -24,9%
Net impairment losses (reversals) on: (349,2) (454,2) 105,0 -23,1%
a) loans (345,9) (468,2) 122,3 -26,1%
b) financial assets (3,3) 14,0 (17,3) -123,8%
Net operating income 191,3 265,5 (74,2) -27,9%
Net provisions for risks and charges (5,3) (29,8) 24,5 -82,0%
Gains (losses) on investments 7,5 0,2 7,2 n.s.
Restructuring costs / One-off costs - (0,2) 0,2 n.s.
Risks and charges related to the SRF, DGS and similar schemes (71,1) - (71,1) n.s.
Gains (losses) on disposal of investments (0,0) 0,4 (0,4) -107,9%
Profit (loss) before tax from continuing operations 122,3 236,1 (113,8) -48,2%
Tax expense (recovery) on income from continuing operations (20,7) (79,1) 58,4 -73,8%
Profit (loss) after tax from continuing operations 101,6 157,0 (55,4) -35,3%
Net profit (loss) for the period including non-controlling interests 101,6 157,0 (55,4) -35,3%
Net loss (profit) attributable to non-controlling interests (0,5) (0,5) 0,0 -2,9%
Profit (loss) for the period before PPA , impairment on goodwill and
intangibles101,1 156,5 (55,4) -35,4%
PPA (Purchase Price Allocation) (7,9) (12,8) 4,8 -37,9%
Net profit (loss) for the period 93,2 143,7 (50,6) -35,2%
Change
(*) Figures as at 31 March 2015 have been restated, as already done on the 2015 Financial Report, considering the changes made in accordance with IAS 8
(Accounting Policies, Changes in Accounting Estimates and Errors).

13
Montepaschi Group 1Q 4Q 3Q 2Q 1Q
Net interest income 548,3 541,1 556,8 554,0 606,7
Net fee and commission income 456,9 451,6 431,2 484,2 443,0
Income from banking activities 1.005,2 992,6 988,0 1.038,2 1.049,7
Dividends, similar income and gains (losses) on investments 19,3 4,8 28,7 42,0 24,3
Net profit (loss) from trading 165,7 133,6 459,0 163,5 281,7
Net profit (loss) from hedging 0,1 4,3 (6,3) 0,2 15,9
Other operating income (expenses) (4,9) (17,8) 0,4 11,3 1,4
Total Revenues 1.185,5 1.117,6 1.469,7 1.255,2 1.373,0
Administrative expenses: (594,7) (602,2) (601,8) (603,7) (604,9)
a) personnel expenses (417,6) (396,2) (422,7) (414,4) (419,4)
b) other administrative expenses (177,1) (205,9) (179,1) (189,2) (185,5)
Net losses/reversal on impairment on property, plant and equipment /
Net adjustments to (recoveries on) intangible assets(50,2) (59,4) (54,4) (53,7) (48,4)
Operating expenses (645,0) (661,6) (656,3) (657,4) (653,3)
Pre Provision Profit 540,5 456,0 813,4 597,8 719,7
Net impairment losses (reversals) on: (349,2) (575,4) (435,3) (528,1) (454,2)
a) loans (345,9) (577,2) (429,8) (515,8) (468,2)
b) financial assets (3,3) 1,8 (5,5) (12,3) 14,0
Net operating income 191,3 (119,4) 378,1 69,7 265,5
Net provisions for risks and charges (5,3) (58,7) 43,2 (18,8) (29,8)
Gains (losses) on investments 7,5 (7,1) 1,5 124,9 0,2
Restructuring costs / One-off costs - (14,6) (2,2) (0,3) (0,2)
Risks and charges related to the SRF, DGS and similar schemes (71,1) (140,9) (54,6) - -
Gains (losses) on disposal of investments (0,0) 1,0 0,9 0,6 0,4
Profit (loss) before tax from continuing operations 122,3 (339,8) 366,9 176,1 236,1
Tax expense (recovery) on income from continuing operations (20,7) 152,0 (102,5) 18,1 (79,1)
Profit (loss) after tax from continuing operations 101,6 (187,7) 264,4 194,2 157,0
Net profit (loss) for the period including non-controlling interests 101,6 (187,7) 264,4 194,2 157,0
Net loss (profit) attributable to non-controlling interests (0,5) (0,5) (0,5) (0,3) (0,5)
Profit (loss) for the period before PPA , impairment on goodwill and
intangibles101,1 (188,2) 263,9 193,9 156,5
PPA (Purchase Price Allocation) (7,9) (8,4) (8,2) (8,7) (12,8)
Net profit (loss) for the period 93,2 (196,6) 255,7 185,2 143,7
Quarterly trend in reclassified incomen statement (Euro mln)
2016 2015
(*) Figures as at 31 March 2015 have been restated, as already done on the 2015 Financial Report, considering the changes made in accordance with IAS 8 (Accounting
Policies, Changes in Accounting Estimates and Errors).

14
Reclassified balance sheet (EUR mln)
31/03/16 31/12/15
ASSETS abs. %
Cash and cash equivalents 913 1.189 (275) -23,2%
Receivables :
a) Loans to customers 113.544 111.366 2.178 2,0%
b) Loans to banks 6.856 8.242 (1.386) -16,8%
Financial assets held for trading 40.000 35.209 4.791 13,6%
Financial assets held to maturity - - -
Equity investments 934 908 26 2,9%
Property, plant and equipment / Intangible assets 3.112 3.142 (29) -0,9%
of which:
a) goodwill 8 8 -
Other assets 8.285 8.956 (671) -7,5%
Total assets 173.646 169.012 4.634 2,7%
31/03/16 31/12/15
LIABILITIES abs. %
Payables
a) Deposits from customers and securities issued 119.508 119.275 233 0,2%
b) Deposits from banks 17.525 17.493 32 0,2%
Financial liabilities held for trading 20.051 15.922 4.129 25,9%
Provisions for specific use
a) Provisions for staff severance indemnities 248 246 2 0,6%
b) Pensions and other post retirement benefit obligations 51 49 2 4,1%
c) Other provisions 1.050 1.068 (18) -1,6%
Other liabilities 5.512 5.337 175 3,3%
Group net equity 9.675 9.596 79 0,8%
a) Valuation reserves (37) (22) (15) 67,4%
c) Equity instruments carried at equity - - -
d) Reserves 611 222 388 n.s.
e) Share premium 6 6 (0)
f) Share capital 9.002 9.002 -
g) Treasury shares (-) - - -
h) Net profit (loss) for the year 93 388 (295) -76,0%
Non-controlling interests 26 26 (1) -2,1%
Total Liabilities and Shareholders' Equity 173.646 169.012 4.634 2,7%
(*) Figures as at 31 March 2015 have been restated, as already done on the 2015 Financial Report, considering the changes made in accordance with IAS
8 (Accounting Policies, Changes in Accounting Estimates and Errors).
Chg
Chg

15
Reclassified Balance Sheet - Quarterly Trend (EUR mln)
31/03/16 31/12/15 30/09/15 30/06/15 31/03/15
ASSETS (*) (*) (*)
Cash and cash equivalents 913 1.189 812 822 682
Receivables :
a) Loans to customers 113.544 111.366 112.513 117.436 123.139
b) Loans to banks 6.856 8.242 6.432 8.327 7.856
Financial assets held for trading 40.000 35.209 36.297 32.990 37.633
Financial assets held to maturity - - - - -
Equity investments 934 908 960 908 947
Property, plant and equipment / Intangible assets 3.112 3.142 3.090 3.122 3.139
of which:
a) goodwill 8 8 8 8 8
Other assets 8.285 8.956 10.022 10.596 10.453
Total assets 173.646 169.012 170.126 174.201 183.850
31/03/16 31/12/15 30/09/15 30/06/15 31/03/15
LIABILITIES (*) (*) (*)
Payables
a) Deposits from customers and securities issued 119.508 119.275 122.717 122.891 128.161
b) Deposits from banks 17.525 17.493 17.805 18.831 22.519
Financial liabilities held for trading 20.051 15.922 11.476 14.534 18.268
Provisions for specific use
a) Provisions for staff severance indemnities 248 246 245 246 268
b) Pensions and other post retirement benefit obligations 51 49 51 50 52
c) Other provisions 1.050 1.068 1.087 1.106 1.104
Other liabilities 5.512 5.337 6.990 7.285 7.291
Group net equity 9.675 9.596 9.730 9.234 6.162
a) Valuation reserves (37) (22) (85) (324) (14)
c) Equity instruments carried at equity - - - - 3
d) Reserves 611 222 222 466 (6.458)
e) Share premium 6 6 6 4 2
f) Share capital 9.002 9.002 9.002 8.759 12.484
g) Treasury shares (-) - - - - 0
h) Net profit (loss) for the year 93 388 585 329 144
Non-controlling interests 26 26 26 24 24
Total Liabilities and Shareholders' Equity 173.646 169.012 170.126 174.201 183.850
(*) Figures as at 31 March 2015 have been restated, as already done on the 2015 Financial Report, considering the changes made in
accordance with IAS 8 (Accounting Policies, Changes in Accounting Estimates and Errors).

16
Pro-forma statements for the accounting treatment of “Alexandria” deal as long term repo,
in continuity with previous reports
Pro-forma consolidated balance sheet
Amounts in thousands of Euros
Assets 31 03 2016 31 12 2015
Pro -fo rma
ad jus tments fo r
class ificat ion
"Alexand ria
t ransact ion" as
LTR
31 12 2015
p ro -fo rma
10 Cash and cash equivalents 913 .374 1.188 .761 - 1.188 .761
20 Financial assets held fo r t rad ing 22 .502 .186 18 .017.359 - 18 .017.359
40 Financial assets availab le fo r sale 17.497.732 17.191.196 - 17.191.196
60 Loans to banks 6 .856 .130 8 .242 .056 - 8 .242 .056
70 Loans to cus tomers 113 .544 .317 111.366 .383 - 111.366 .383
80 Hedg ing derivat ives 586 .692 556 .425 - 556 .425
90 Change in value o f macro -hedged financial
assets (+/-) 165.192 139 .582 - 139 .582
100 Equity inves tments 934 .321 908 .365 - 908 .365
120 Property, p lant and equipment 2 .729 .422 2 .741.723 - 2 .741.723
130 Intang ib le assets 383 .044 400 .103 - 400 .103
o f which: goodwill 7.900 7.900 - 7.900
140 Tax assets 5.119 .580 5.542 .518 76 .162 5.618 .680
150 Non-current assets and g roups o f assets
held fo r sale and d iscontinued operat ions 23 .293 29 .267 - 29 .267
160 Other assets 2 .390 .244 2 .688 .239 - 2 .688 .239
To tal Assets 173 .645.527 169 .011.977 76 .162 169 .088 .139

17
Amounts in thousands of Euros
Liab ilit ies and Shareho lders 'Equity 31 03 2016 31 12 2015
Pro -fo rma
ad jus tments fo r
class ificat ion
"Alexand ria
t ransact ion" as
LTR
31 12 2015
p ro -fo rma
10 Depos its from banks 17.524 .685 17.493 .110 - 17.493 .110
20 Depos its from cus tomers 89 .529 .331 87.806 .329 - 87.806 .329
30 Deb t securit ies is sued 28 .316 .706 29 .394 .436 - 29 .394 .436
40 Financial assets held fo r t rad ing 20 .051.030 15.921.727 - 15.921.727
50 Financial assets des ignated at fair
value 1.661.881 2 .073 .915 - 2 .073 .915
60 Hedg ing derivat ives 1.232 .177 1.205.267 - 1.205.267
80 Tax liab ilit ies 122 .398 91.456 (43 .079 ) 48 .377
90
Liab ilit ies associated with non-current
assets held fo r sale and d iscontinued
operat ions
- - - -
100 Other liab ilit ies 4 .157.301 4 .039 .948 - 4 .039 .948
110 Provis ion fo r emp loyee severance pay 247.681 246 .170 - 246 .170
120 Provis ions fo r risks and charges 1.101.396 1.116 .913 - 1.116 .913
140 Valuat ion reserves (36 .519 ) (21.817) - (21.817)
160 Equity ins truments - - - -
170 Reserves 610 .511 222 .086 619 .234 841.320
180 Share p remium 6 .325 6 .325 - 6 .325
190 Share Cap ital 9 .001.757 9 .001.757 - 9 .001.757
210 Non-contro lling interes ts (+/-) 25.710 26 .259 - 26 .259
220 Pro fit (lo ss ) (+/-) 93 .157 388 .096 (499 .993 ) (111.897)
To tal liab ilit ies and Shareho lders '
Equity 173 .645.527 169 .011.977 76 .162 169 .088 .139

18
Pro-forma consolidated income statement
Amounts in thousands of Euros
Items 31 03 2016 31 03 2015
Pro -fo rma
ad jus tments fo r
class ificat ion
"Alexand ria
t ransact ion" as
LTR
31 03 2015
p ro -fo rma
10 Interes t income and s imilar revenues 902 .453 1.085.640 36 .931 1.122 .571
20 Interes t expense and s imilar charges (359 .127) (491.094 ) (31.799 ) (522 .893 )
30 Net interes t income 543 .326 594 .546 5.132 599 .678
40 Fee and commiss ion income 534 .434 533 .459 533 .459
50 Fee and commiss ion expense (77.530 ) (90 .485) (90 .485)
60 Net fee and commiss ion income 456 .904 442 .974 - 442 .974
70 Dividends and s imilar income 638 3 .410 3 .410
80 Net p ro fit (lo ss ) from trad ing 61.516 173 .369 (109 .941) 63 .428
90 Net p ro fit (lo ss ) from hedg ing 144 15.915 (1.066 ) 14 .849
100 Gains / lo sses on d isposal/repurchase 20 .871 122 .236 122 .236
110 Net p ro fit (lo ss ) from financial assets and
liab ilit ies des ignated at fair value 82 .761 (17.280 ) (17.280 )
120 Net interes t and o ther banking income 1.166 .160 1.335.170 (105.875) 1.229 .295
130 Net impairment lo sses (reversals ) (349 .233 ) (454 .242 ) (454 .242 )
140 Net income from banking act ivit ies 816 .927 880 .928 (105.875) 775.053
180 Admimis trat ive expenses (761.013 ) (695.618 ) (695.618 )
190 Net p rovis ions fo r risks and charges (5.350 ) (29 .803 ) (29 .803 )
200 Net ad jus tments to (recoveries on)
p roperty, p lant and equipment (26 .307) (29 .884 ) (29 .884 )
210 Net ad jus tments to (recoveries on)
intang ib le assets (30 .832 ) (25.387) (25.387)
220 Other operat ing expenses / income 90 .281 91.860 91.860
230 Operat ing expenses (733 .221) (688 .832 ) - (688 .832 )
240 Gains (lo sses) on inves tments 26 .758 24 .513 24 .513
260 Impairment on goodwill - - -
270 Gains (lo sses) on d isposal o f inves tments (30 ) 384 384
280 Pro fit (lo ss ) befo re tax from continuing
operat ions 110 .434 216 .993 (105.875) 111.118
290 Tax expense (recovey) on income from
continuing operat ions (16 .816 ) (72 .793 ) 34 .780 (38 .013 )
300 Pro fit (lo ss ) after tax from continuing
operat ions 93 .618 144 .200 (71.095) 73 .105
310
Pro fit (lo ss ) after tax from g roups o f
assets held fo r sale and d iscontinued
operat ions
- - -
320 Pro fit (lo ss ) 93 .618 144 .200 (71.095) 73 .105
330 Pro fit (lo ss ) fo r the period at tributab le to
non-contro lling interes ts 461 475 475
340 Parent company's net p ro fit (lo ss ) 93 .157 143 .725 (71.095) 72 .630

19
Pro-forma consolidated statement of comprehensive income
Amounts in thousands of Euros
Voci 31 03 2016 31 03 2015
Pro -fo rma
ad jus tments fo r
class ificat ion
"Alexand ria
t ransact ion" as
LTR
31 03 2015
p ro -fo rma
10 Pro fit (lo ss ) 93 .618 144 .200 (71.095) 73 .105
Other comprehens ive income after tax no t
recycled to p ro fit and lo ss (662 ) (15) - (15)
4 0 Actuarial gains (lo sses) on defined benefit
p lans (672 ) (8 ) (8 )
6 0 Share o f valuat ion reserves o f equity-
accounted inves tments 10 (7) (7)
Other comprehens ive income after tax
recycled to p ro fit and lo ss (14 .035) 248 .200 184 .321 432 .521
8 0 Exchange d ifferences (3 .796 ) 7.727 7.727
9 0 Cash flow hedges 12 .588 2 .383 2 .383
100 Financial assets availab le fo r sale (31.081) 211.677 184 .321 395.998
110 Non-current assets held fo r sale - 154 154
120 Share o f valuat ion reserves o f equity-
accounted inves tments 8 .254 26 .259 26 .259
130 To tal o ther comprehens ive income after
tax (14 .697) 248 .185 184 .321 432 .506
140 To tal comprehens ive income (item10+130) 78 .921 392 .385 113 .226 505.611
150 Conso lidated comprehens ive income
at tributab le to non-contro lling interes ts 466 475 475
160 Conso lidated comprehens ive income
at tributab le to Parent Company 78 .455 391.910 113 .226 505.136