Embed Size (px)
Citation preview
TSX: YRI | NYSE: AUY
BMO Capital Markets: Global Metals & Mining ConferenceFebruary 22-25, 2015
TRUE VALUE PROPOSTION
2
Cautionary Note Regarding Forward-looking StatementsCAUTIONARY NOTE REGARDING FORWARD-LOOKING STATEMENTS: This presentation contains “forward-looking statements” within the meaning of the United States Private Securities Litigation Reform Act of 1995 and applicable Canadian securities legislation. Except for statements of historical fact relating to the Company, information contained herein constitutes forward-looking statements, including any information as to the Company’s strategy, plans or future financial or operating performance. Forward-looking statements are characterized by words such as “plan,” “expect”, “budget”, “target”, “project”, “intend,” “believe”, “anticipate”, “estimate” and other similar words, or statements that certain events or conditions “may” or “will” occur. Forward-looking statements are based on the opinions, assumptions and estimates of management considered reasonable at the date the statements are made, and are inherently subject to a variety of risks and uncertainties and other known and unknown factors that could cause actual events or results to differ materially from those projected in the forward-looking statements. These factors include the Company’s expectations in connection with the expected production and exploration, development and expansion plans at the Company’s projects discussed herein being met, the impact of proposed optimizations at the Company’s projects, the impact of the proposed new mining law in Brazil and the impact of general business and economic conditions, global liquidity and credit availability on the timing of cash flows and the values of assets and liabilities based on projected future conditions, fluctuating metal prices (such as gold, copper, silver and zinc), currency exchange rates (such as the Brazilian Real, the Chilean Peso, the Argentine Peso, and the Mexican Peso versus the United States Dollar), possible variations in ore grade or recovery rates, changes in the Company’s hedging program, changes in accounting policies, changes in mineral resources and mineral reserves, risk related to non-core mine dispositions, risks related to acquisitions, changes in project parameters as plans continue to be refined, changes in project development, construction, production and commissioning time frames, risk related to joint venture operations, the possibility of project cost overruns or unanticipated costs and expenses, higher prices for fuel, steel, power, labour and other consumables contributing to higher costs and general risks of the mining industry, failure of plant, equipment or processes to operate as anticipated, unexpected changes in mine life, final pricing for concentrate sales, unanticipated results of future studies, seasonality and unanticipated weather changes, costs and timing of the development of new deposits, success of exploration activities, permitting time lines, government regulation and the risk of government expropriation or nationalization of mining operations, environmental risks, unanticipated reclamation expenses, title disputes or claims, limitations on insurance coverage and timing and possible outcome of pending litigation and labour disputes, as well as those risk factors discussed or referred to in the Company’s current and annual Management’s Discussion and Analysis and the Annual Information Form for the year ended December 31st, 2013 filed with the securities regulatory authorities in all provinces of Canada and available at www.sedar.com, and the Company’s Annual Report on Form 40-F for the year ended December 31st, 2013 filed with the United States Securities and Exchange Commission. Although the Company has attempted to identify important factors that could cause actual actions, events or results to differ materially from those described in forward-looking statements, there may be other factors that cause actions, events or results not to be anticipated, estimated or intended. There can be no assurance that forward-looking statements will prove to be accurate, as actual results and future events could differ materially from those anticipated in such statements. The Company undertakes no obligation to update forward-looking statements if circumstances or management’s estimates, assumptions or opinions should change, except as required by applicable law. The reader is cautioned not to place undue reliance on forward-looking statements. The forward-looking information contained herein is presented for the purpose of assisting investors in understanding the Company’s expected financial and operational performance and results as at and for the periods ended on the dates presented in the Company’s plans and objectives and may not be appropriate for other purposes.
Please note that “GEO” means gold equivalent ounces throughout this presentation.
Silver production is treated as a gold equivalent converted at a ratio of 50:1.
All amounts are expressed in United States dollars unless otherwise indicated.
3
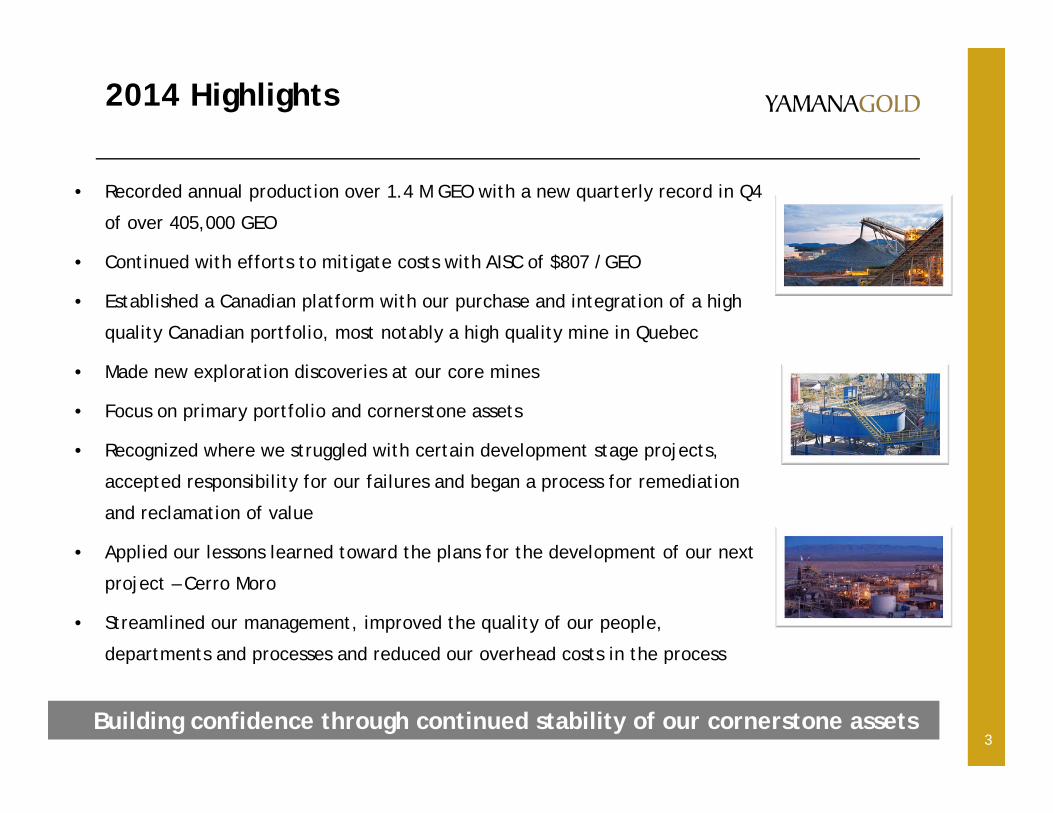
2014 Highlights
Building confidence through continued stability of our cornerstone assets
• Recorded annual production over 1.4 M GEO with a new quarterly record in Q4
of over 405,000 GEO
• Continued with efforts to mitigate costs with AISC of $807 /GEO
• Established a Canadian platform with our purchase and integration of a high
quality Canadian portfolio, most notably a high quality mine in Quebec
• Made new exploration discoveries at our core mines
• Focus on primary portfolio and cornerstone assets
• Recognized where we struggled with certain development stage projects,
accepted responsibility for our failures and began a process for remediation
and reclamation of value
• Applied our lessons learned toward the plans for the development of our next
project – Cerro Moro
• Streamlined our management, improved the quality of our people,
departments and processes and reduced our overhead costs in the process
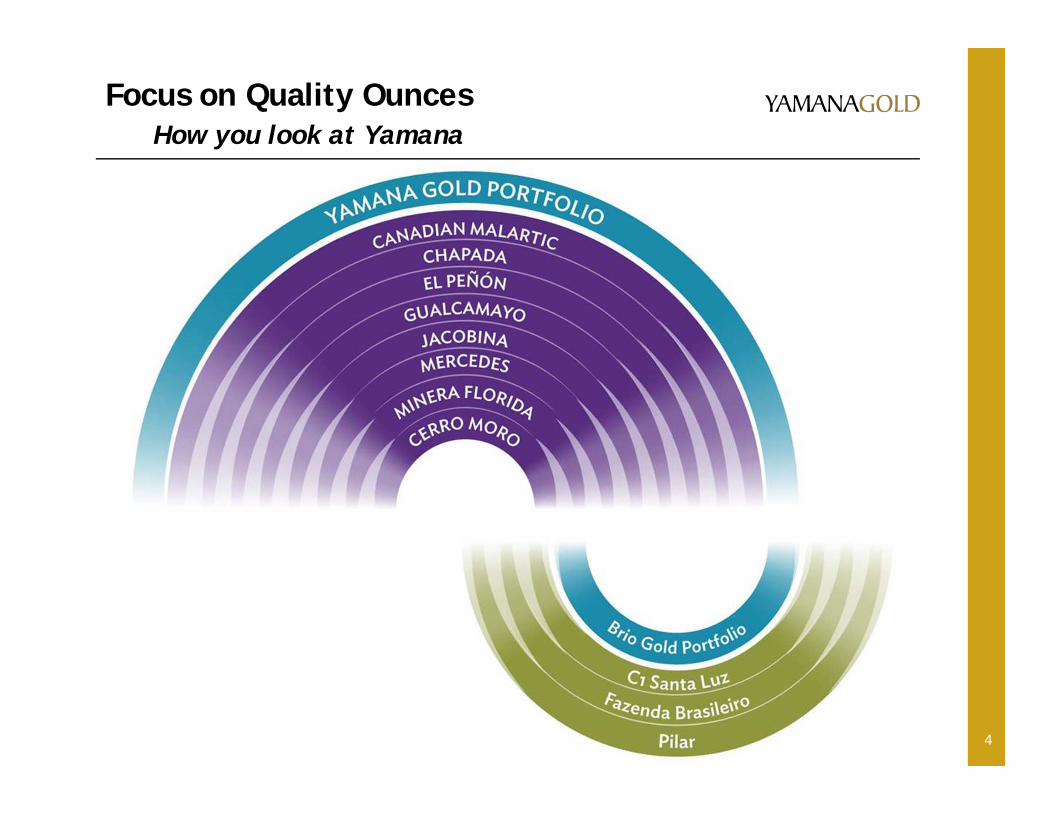
Focus on Quality OuncesHow you look at Yamana
4
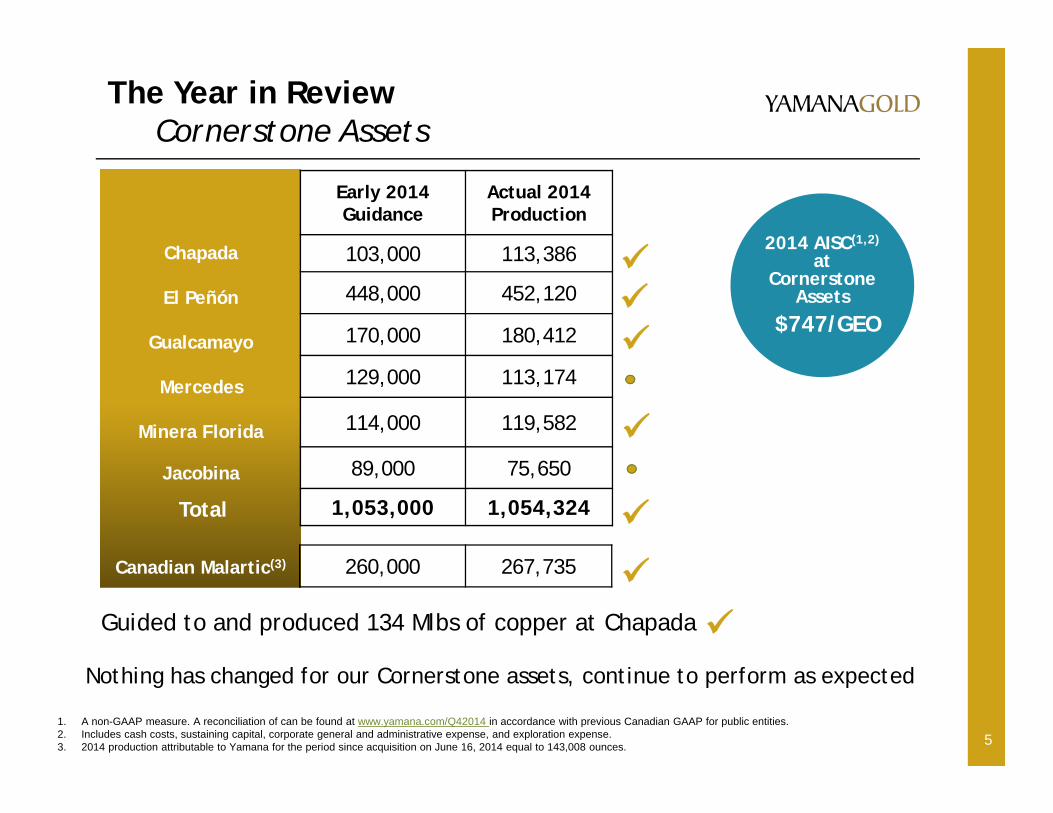
The Year in ReviewCornerstone Assets
5
Chapada
El Peñón
Gualcamayo
Mercedes
Minera Florida
Jacobina
Canadian Malartic(3)
Early 2014 Guidance
Actual 2014Production
103,000 113,386
448,000 452,120
170,000 180,412
129,000 113,174
114,000 119,582
89,000 75,650
1,053,000 1,054,324
1. A non-GAAP measure. A reconciliation of can be found at www.yamana.com/Q42014 in accordance with previous Canadian GAAP for public entities.2. Includes cash costs, sustaining capital, corporate general and administrative expense, and exploration expense.3. 2014 production attributable to Yamana for the period since acquisition on June 16, 2014 equal to 143,008 ounces.
Nothing has changed for our Cornerstone assets, continue to perform as expected
2014 AISC(1,2)
at Cornerstone
Assets$747/GEO
Total
260,000 267,735
Guided to and produced 134 Mlbs of copper at Chapada
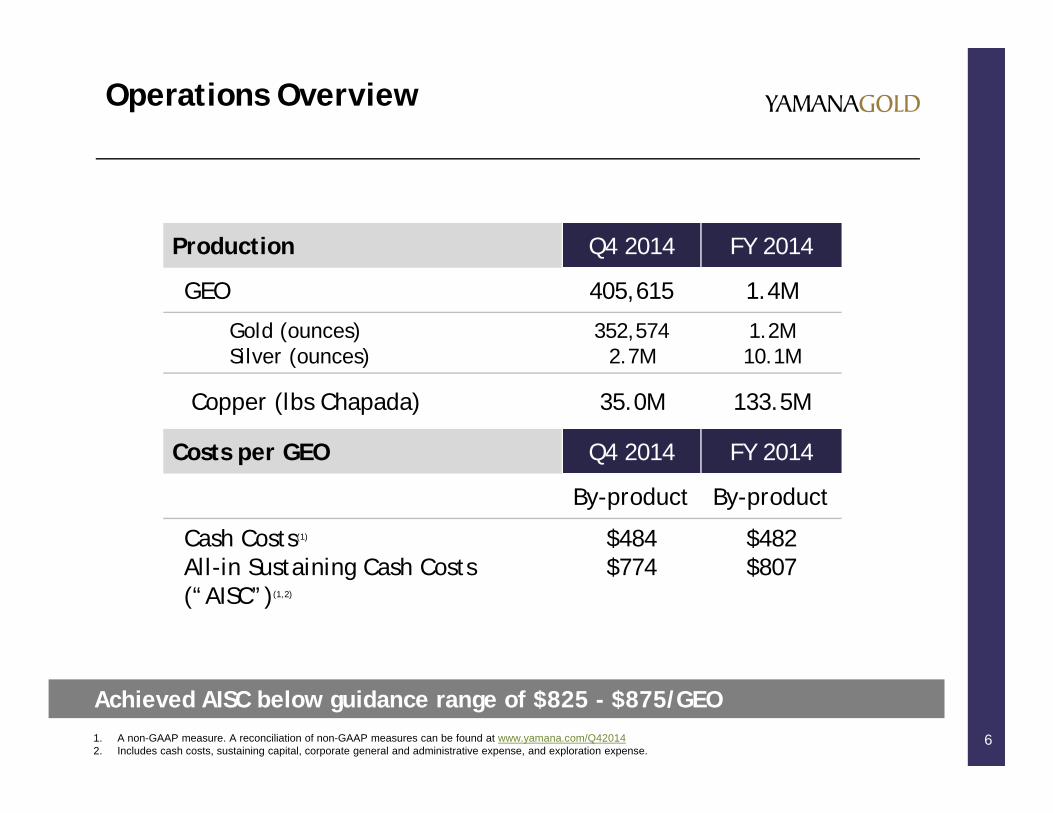
Operations Overview
61. A non-GAAP measure. A reconciliation of non-GAAP measures can be found at www.yamana.com/Q420142. Includes cash costs, sustaining capital, corporate general and administrative expense, and exploration expense.
Production Q4 2014 FY 2014
GEO 405,615 1.4M
Gold (ounces)Silver (ounces)
352,5742.7M
1.2M10.1M
Copper (lbs Chapada) 35.0M 133.5M
Costs per GEO Q4 2014 FY 2014
By-product By-product
Cash Costs(1)
All-in Sustaining Cash Costs (“AISC”)(1,2)
$484$774
$482$807
Achieved AISC below guidance range of $825 - $875/GEO
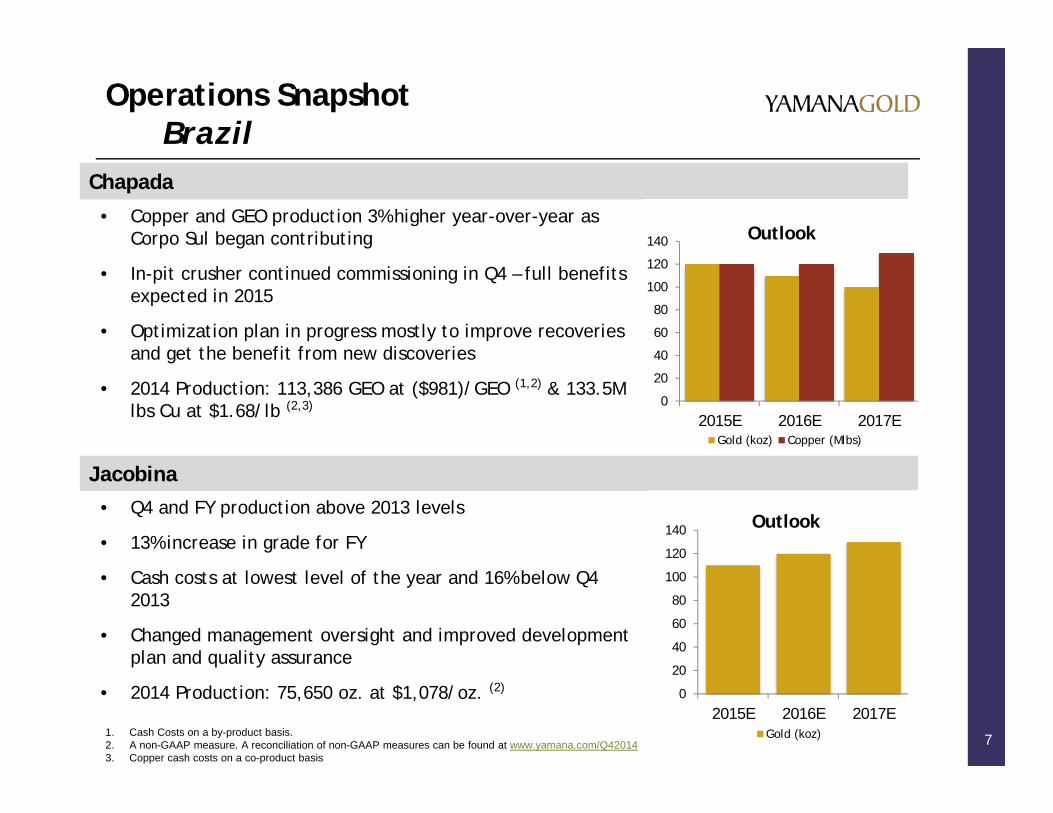
Operations SnapshotBrazil
7
Chapada
• Copper and GEO production 3% higher year-over-year as Corpo Sul began contributing
• In-pit crusher continued commissioning in Q4 – full benefits expected in 2015
• Optimization plan in progress mostly to improve recoveries and get the benefit from new discoveries
• 2014 Production: 113,386 GEO at ($981)/GEO (1,2) & 133.5M lbs Cu at $1.68/lb (2,3)
1. Cash Costs on a by-product basis. 2. A non-GAAP measure. A reconciliation of non-GAAP measures can be found at www.yamana.com/Q420143. Copper cash costs on a co-product basis
Jacobina• Q4 and FY production above 2013 levels
• 13% increase in grade for FY
• Cash costs at lowest level of the year and 16% below Q4 2013
• Changed management oversight and improved development plan and quality assurance
• 2014 Production: 75,650 oz. at $1,078/oz. (2)
0
20
40
60
80
100
120
140
2015E 2016E 2017E
Outlook
Gold (koz) Copper (Mlbs)
0
20
40
60
80
100
120
140
2015E 2016E 2017E
Outlook
Gold (koz)
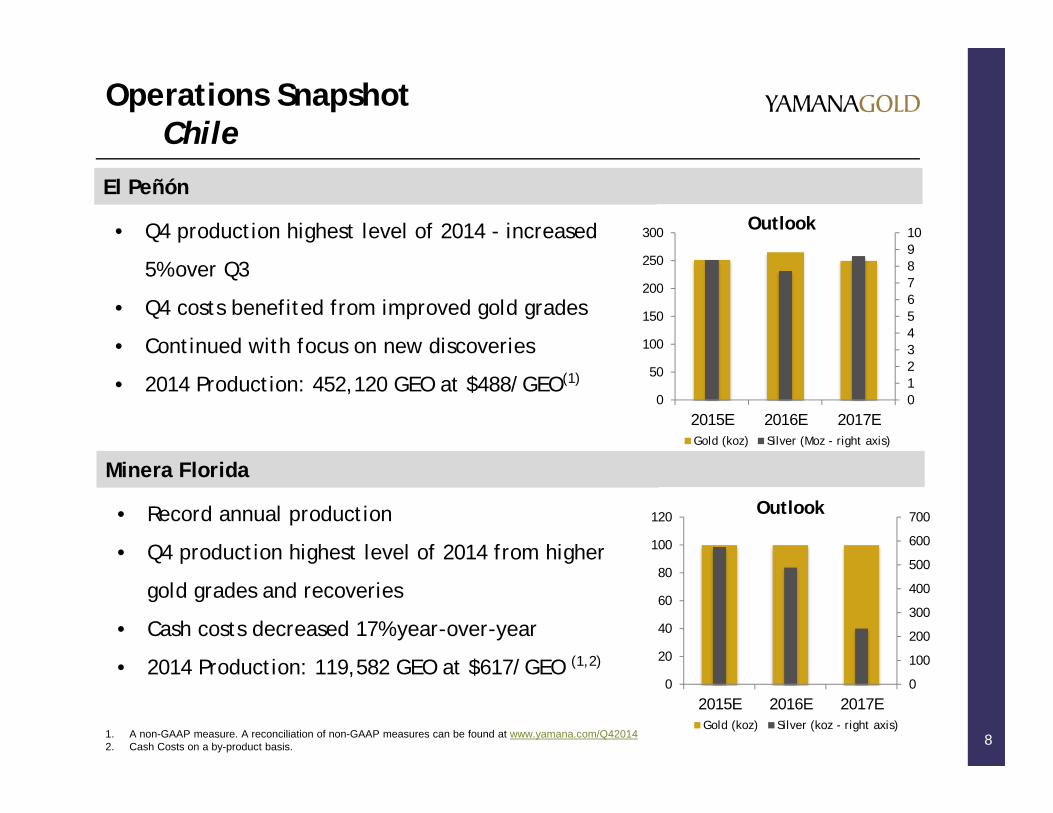
Operations SnapshotChile
8
El Peñón
• Q4 production highest level of 2014 - increased
5% over Q3
• Q4 costs benefited from improved gold grades
• Continued with focus on new discoveries
• 2014 Production: 452,120 GEO at $488/GEO(1)
1. A non-GAAP measure. A reconciliation of non-GAAP measures can be found at www.yamana.com/Q420142. Cash Costs on a by-product basis.
Minera Florida
• Record annual production
• Q4 production highest level of 2014 from higher
gold grades and recoveries
• Cash costs decreased 17% year-over-year
• 2014 Production: 119,582 GEO at $617/GEO (1,2)
012345678910
0
50
100
150
200
250
300
2015E 2016E 2017E
Outlook
Gold (koz) Silver (Moz - right axis)
0
100
200
300
400
500
600
700
0
20
40
60
80
100
120
2015E 2016E 2017E
Outlook
Gold (koz) Silver (koz - right axis)
Operations SnapshotArgentina
9
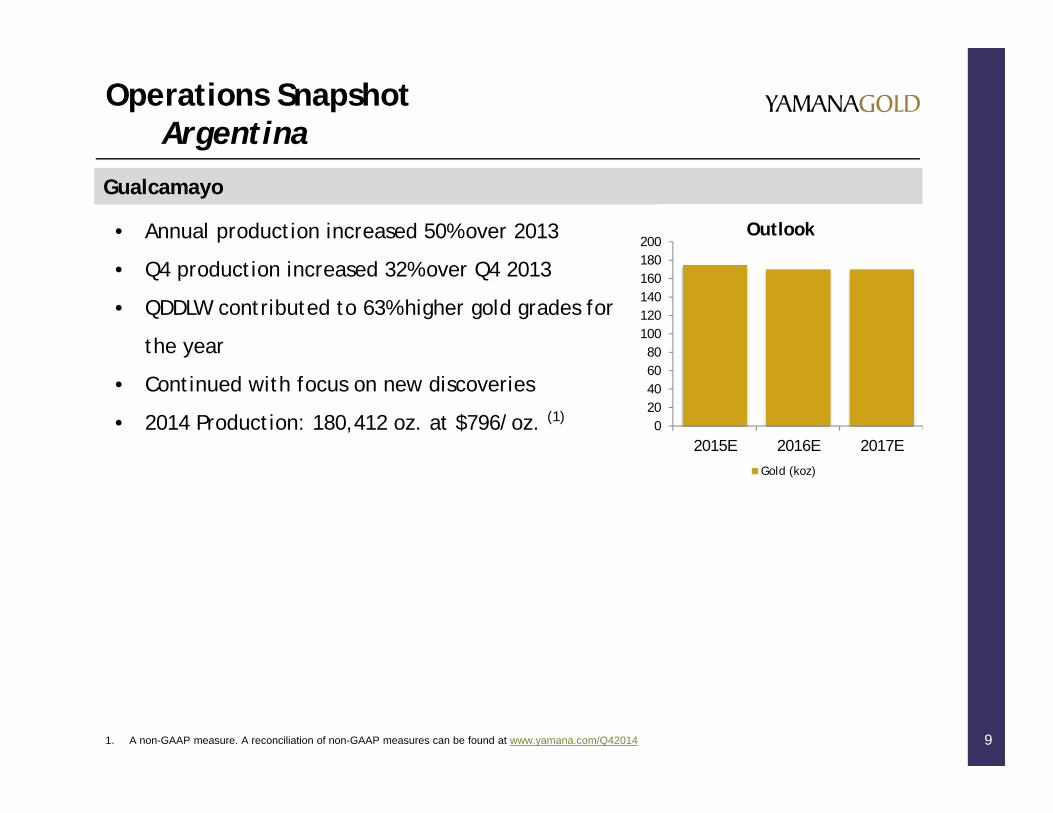
Gualcamayo
• Annual production increased 50% over 2013
• Q4 production increased 32% over Q4 2013
• QDDLW contributed to 63% higher gold grades for
the year
• Continued with focus on new discoveries
• 2014 Production: 180,412 oz. at $796/oz. (1)
1. A non-GAAP measure. A reconciliation of non-GAAP measures can be found at www.yamana.com/Q42014
020406080
100120140160180200
2015E 2016E 2017E
Outlook
Gold (koz)
Operations SnapshotCanada and Mexico
10
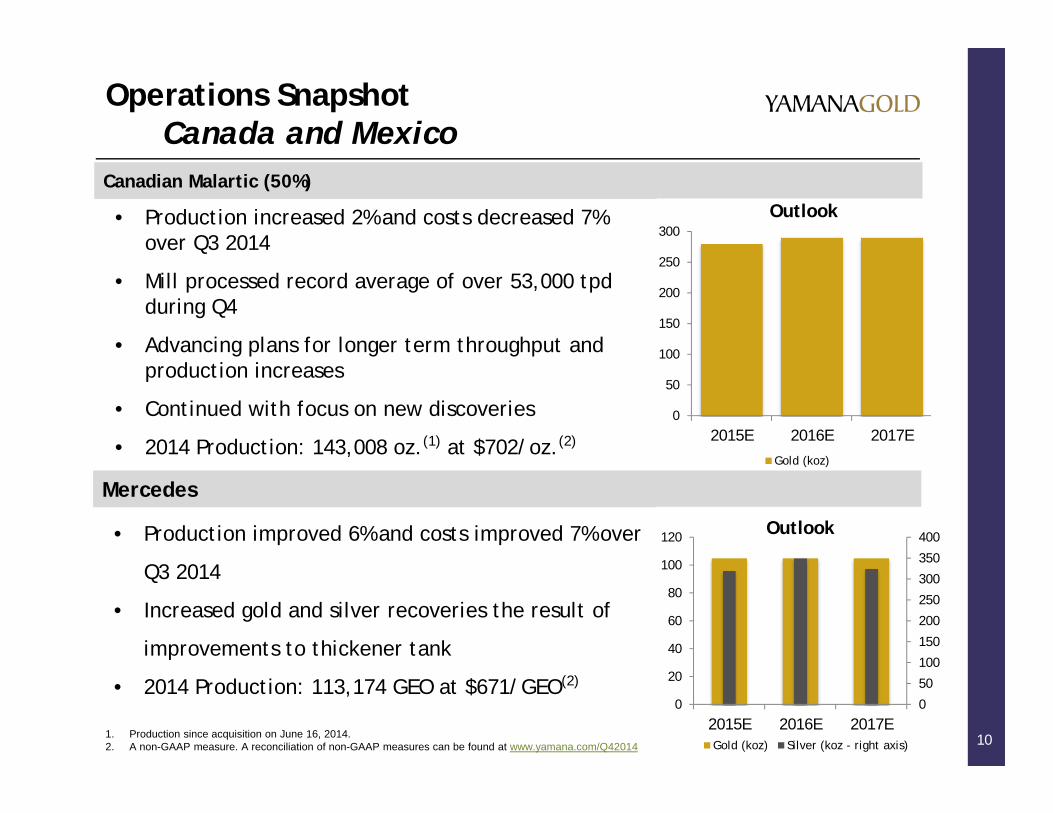
Canadian Malartic (50%)
• Production increased 2% and costs decreased 7% over Q3 2014
• Mill processed record average of over 53,000 tpdduring Q4
• Advancing plans for longer term throughput and production increases
• Continued with focus on new discoveries
• 2014 Production: 143,008 oz.(1) at $702/oz.(2)
1. Production since acquisition on June 16, 2014.2. A non-GAAP measure. A reconciliation of non-GAAP measures can be found at www.yamana.com/Q42014
Mercedes
• Production improved 6% and costs improved 7% over
Q3 2014
• Increased gold and silver recoveries the result of
improvements to thickener tank
• 2014 Production: 113,174 GEO at $671/GEO(2)
0
50
100
150
200
250
300
2015E 2016E 2017E
Outlook
Gold (koz)
0
50
100
150
200
250
300
350
400
0
20
40
60
80
100
120
2015E 2016E 2017E
Outlook
Gold (koz) Silver (koz - right axis)
Operations SnapshotBrio Gold
11
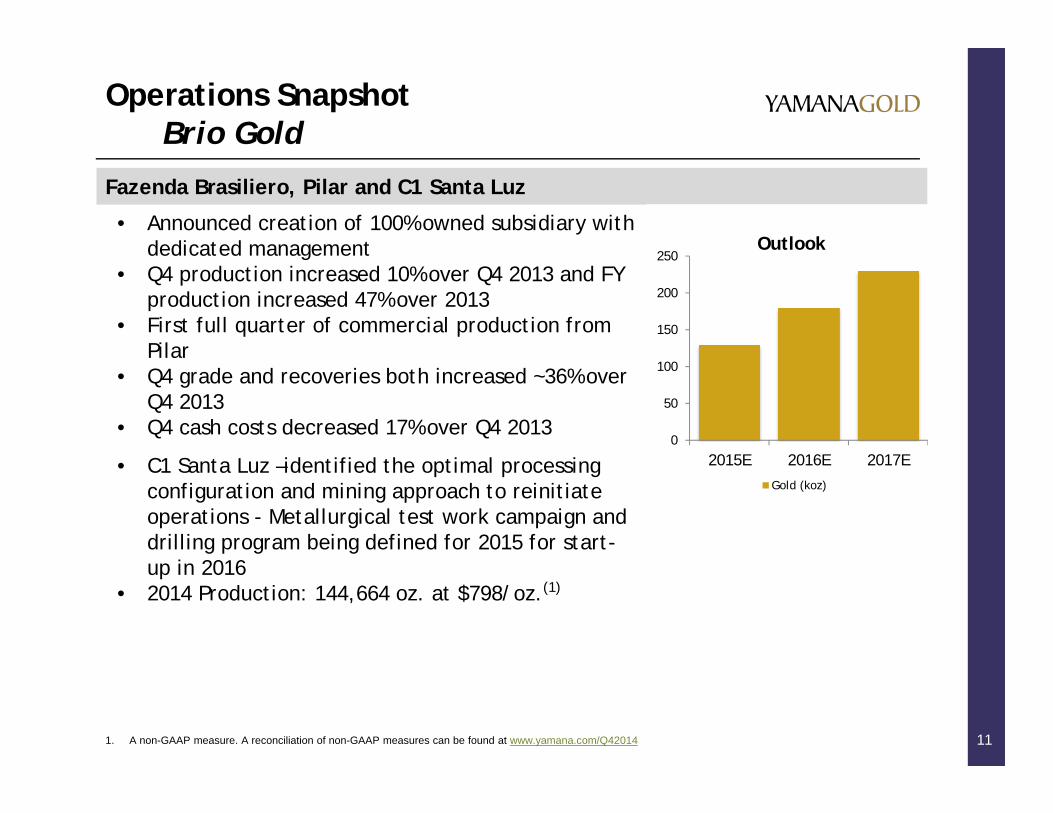
Fazenda Brasiliero, Pilar and C1 Santa Luz
• Announced creation of 100% owned subsidiary with dedicated management
• Q4 production increased 10% over Q4 2013 and FY production increased 47% over 2013
• First full quarter of commercial production from Pilar
• Q4 grade and recoveries both increased ~36% over Q4 2013
• Q4 cash costs decreased 17% over Q4 2013
• C1 Santa Luz –identified the optimal processing configuration and mining approach to reinitiate operations - Metallurgical test work campaign and drilling program being defined for 2015 for start-up in 2016
• 2014 Production: 144,664 oz. at $798/oz.(1)
1. A non-GAAP measure. A reconciliation of non-GAAP measures can be found at www.yamana.com/Q42014
0
50
100
150
200
250
2015E 2016E 2017E
Outlook
Gold (koz)
Cerro MoroConstruction decision to go forward
12
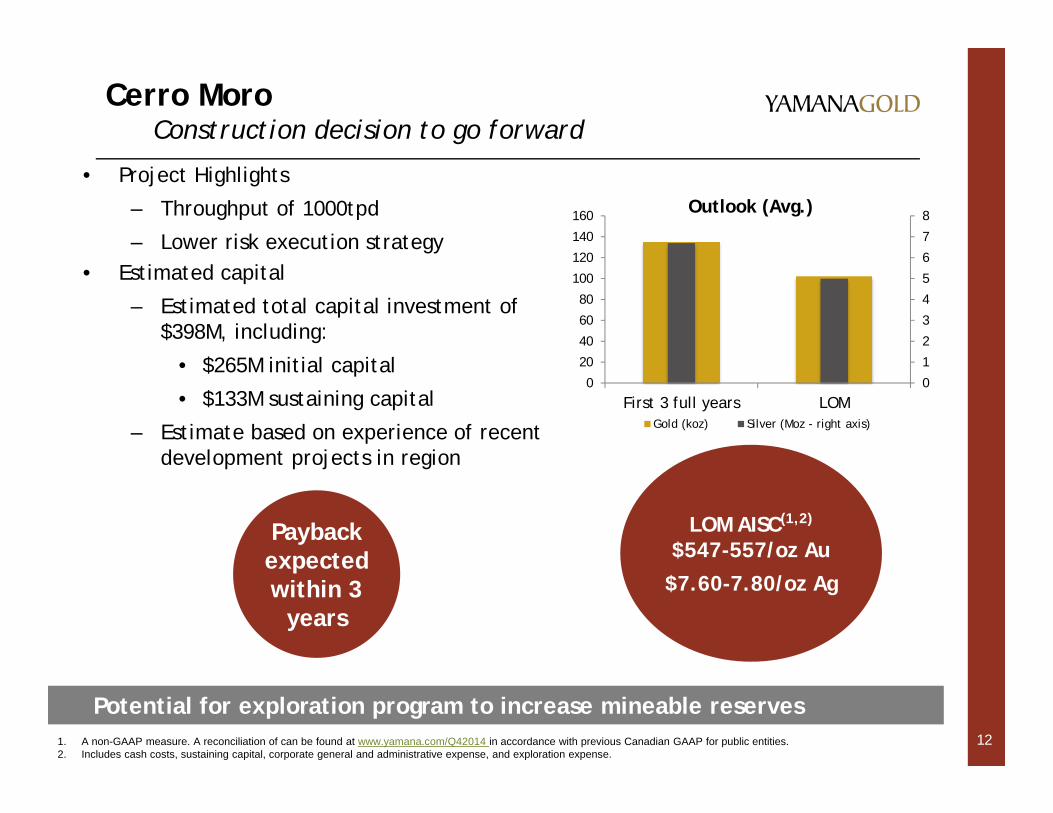
• Project Highlights
– Throughput of 1000tpd
– Lower risk execution strategy• Estimated capital
– Estimated total capital investment of $398M, including:
• $265M initial capital
• $133M sustaining capital
– Estimate based on experience of recent development projects in region
Payback expected within 3
years
1. A non-GAAP measure. A reconciliation of can be found at www.yamana.com/Q42014 in accordance with previous Canadian GAAP for public entities.2. Includes cash costs, sustaining capital, corporate general and administrative expense, and exploration expense.
Potential for exploration program to increase mineable reserves
0
1
2
3
4
5
6
7
8
0
20
40
60
80
100
120
140
160
First 3 full years LOM
Outlook (Avg.)
Gold (koz) Silver (Moz - right axis)
LOM AISC(1,2)
$547-557/oz Au
$7.60-7.80/oz Ag
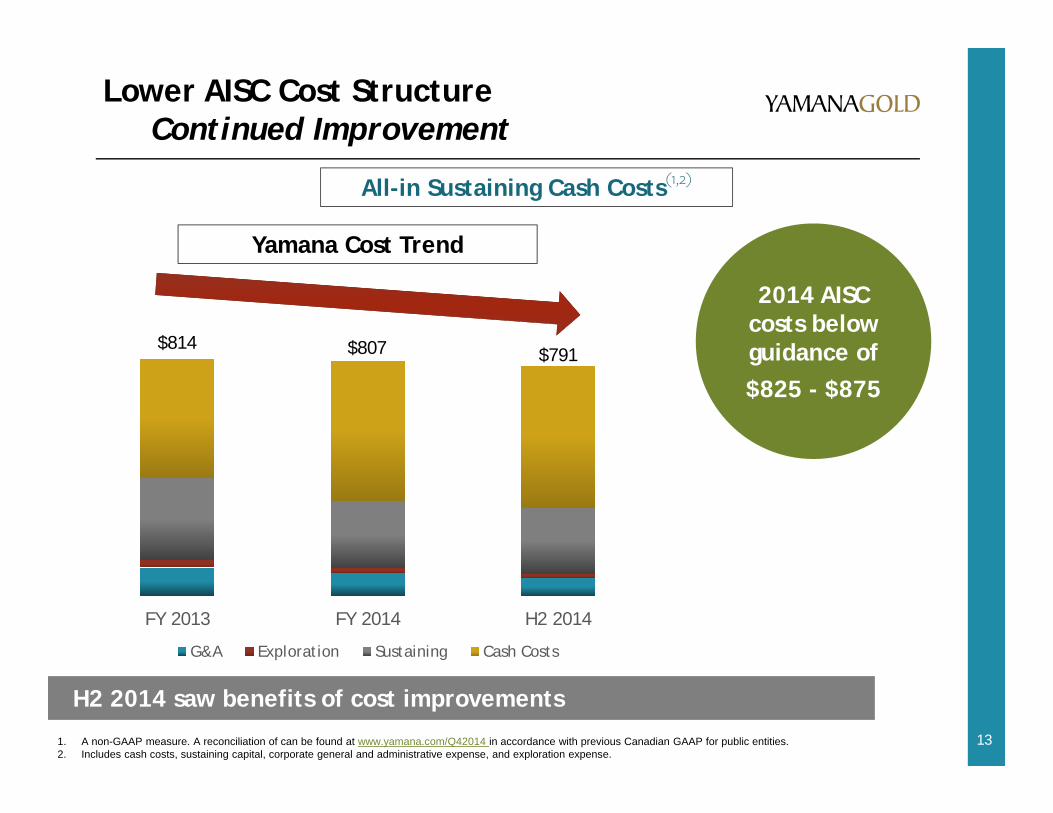
13
Lower AISC Cost Structure Continued Improvement
$814 $807 $791
FY 2013 FY 2014 H2 2014
G&A Exploration Sustaining Cash Costs
1. A non-GAAP measure. A reconciliation of can be found at www.yamana.com/Q42014 in accordance with previous Canadian GAAP for public entities.2. Includes cash costs, sustaining capital, corporate general and administrative expense, and exploration expense.
H2 2014 saw benefits of cost improvements
All-in Sustaining Cash Costs(1,2)
Yamana Cost Trend
2014 AISC costs below guidance of$825 - $875
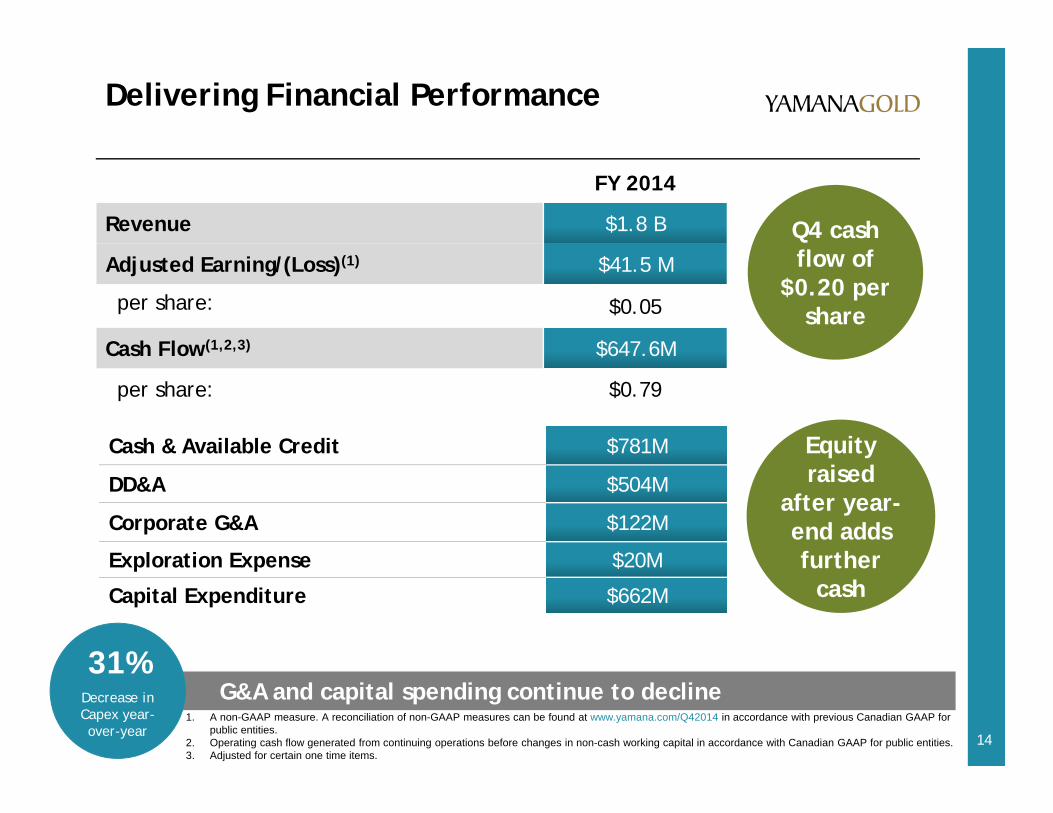
Delivering Financial Performance
1. A non-GAAP measure. A reconciliation of non-GAAP measures can be found at www.yamana.com/Q42014 in accordance with previous Canadian GAAP for public entities.
2. Operating cash flow generated from continuing operations before changes in non-cash working capital in accordance with Canadian GAAP for public entities. 3. Adjusted for certain one time items.
FY 2014
Revenue $1.8 B
Adjusted Earning/(Loss)(1) $41.5 M
per share: $0.05
Cash Flow(1,2,3) $647.6M
per share: $0.79
14
Cash & Available Credit $781M
DD&A $504M
Corporate G&A $122M
Exploration Expense $20M
Capital Expenditure $662M
G&A and capital spending continue to decline31%
Decrease in Capex year-over-year
Q4 cash flow of
$0.20 per share
Equity raised
after year-end adds further
cash
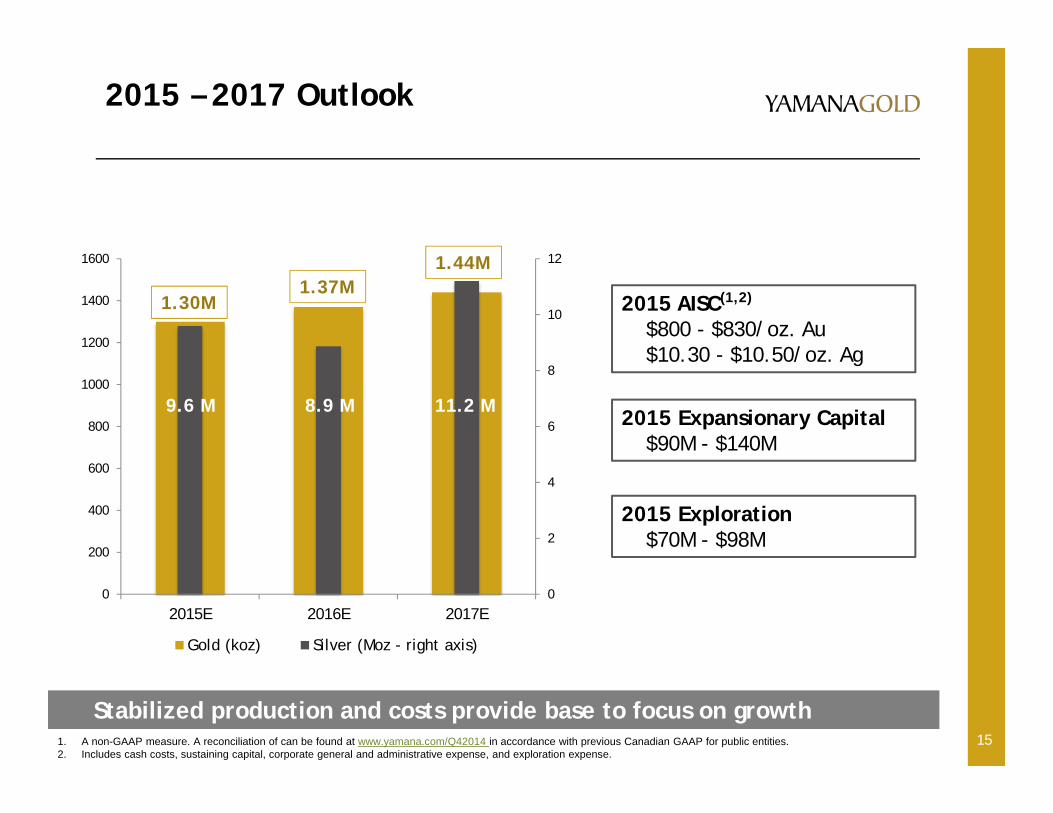
2015 – 2017 Outlook
15
0
2
4
6
8
10
12
0
200
400
600
800
1000
1200
1400
1600
2015E 2016E 2017E
Gold (koz) Silver (Moz - right axis)
1.30M1.37M
1.44M
9.6 M 8.9 M 11.2 M
2015 AISC(1,2)
$800 - $830/oz. Au$10.30 - $10.50/oz. Ag
2015 Expansionary Capital$90M - $140M
2015 Exploration$70M - $98M
1. A non-GAAP measure. A reconciliation of can be found at www.yamana.com/Q42014 in accordance with previous Canadian GAAP for public entities.2. Includes cash costs, sustaining capital, corporate general and administrative expense, and exploration expense.
Stabilized production and costs provide base to focus on growth
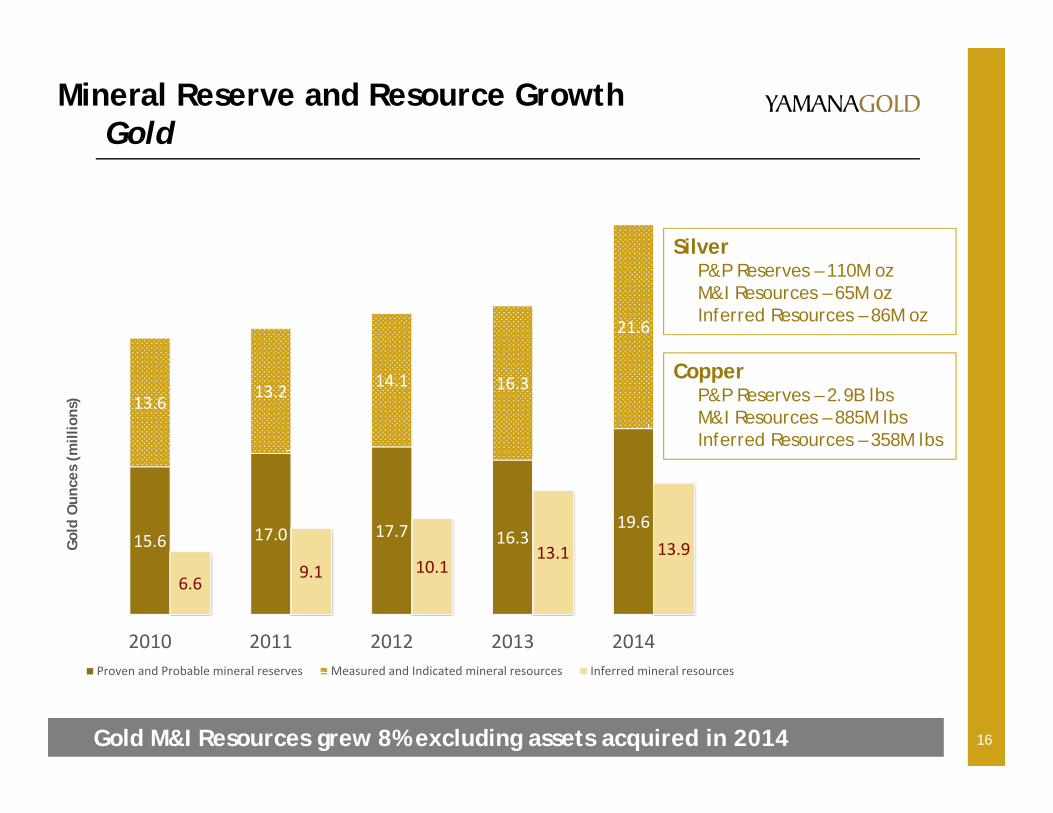
16
Mineral Reserve and Resource GrowthGold
15.6 17.0 17.7 16.319.6
13.6 13.2 14.1 16.3
21.6
6.69.1 10.1
13.1 13.9
2010 2011 2012 2013 2014
Gol
d O
unce
s (m
illio
ns)
Proven and Probable mineral reserves Measured and Indicated mineral resources Inferred mineral resources
Gold M&I Resources grew 8% excluding assets acquired in 2014
SilverP&P Reserves – 110M ozM&I Resources – 65M ozInferred Resources – 86M oz
CopperP&P Reserves – 2.9B lbsM&I Resources – 885M lbsInferred Resources – 358M lbs
17
TSX:YRI NYSE:ATSX:YRINYSE:AUY
TSX:YRINYSE:AUY TSXNYSE:AUY
TSX:YRINYSE:AUY
TSX:YRINYSE:AUY NYSE:AUY
TSX:YRINYSE:AUY
TSX:YRINYSE:AUY:YRI NYSE:AUY
:YRI
NYSE:AUY TSX