Embed Size (px)
Citation preview
Delivering superior value
BMO Metals and Mining conference
March 2016
DisclaimerCertain statements included in this presentation, as well as oral statements that may be made by Sibanye Gold, or by officers, directors or employees acting on their behalf related to the subject matter hereof, constitute or are based on forward-looking statements. Forward-looking statements are preceded by, followed by or include the words “may”, “will”, “should”, “expect”, “envisage”, “intend”, “plan”, “project”, “estimate”, “anticipate”, “believe”, “hope”, “can”, “is designed to” or similar phrases. These forward looking statements involve a number of known and unknown risks, uncertainties and other factors, many of which are difficult to predict and generally beyond the control of Sibanye Gold, that could cause Sibanye Gold‘s actual results and outcomes to be materially different from historical results or from any future results expressed or implied by such forward-looking statements. Such risks, uncertainties and other factors include, among others, Sibanye Gold’s operations, Sibanye Gold’s ability to implement its strategy and any changes thereto, Sibanye Gold’s future financial position and plans, strategies, objectives, capital expenditures, projected costs and anticipated cost savings and financing plans, as well as projected level of gold price and other risks. Sibanye Gold undertakes no obligation to update publicly or release any revisions to these forward-looking statements to reflect events or circumstances after the date of this presentation or to reflect any change in Sibanye Gold’s expectations with regard thereto.
In accordance with the requirements imposed by the JSE, Sibanye Gold reports its reserves using the terms and definitions of the SAMREC Code (2007 edition). There are differences between the SAMREC Code and the Security and Exchange Commission’s Industry Guide 7. Mineral or ore reserves, as defined under the SAMREC Code, are divided into categories of proved and probable reserves and are expressed in terms of tonnes to be processed at mill feed head grades, allowing for estimated mining dilution, recovery and other factors.
The lead Competent Person designated in terms of SAMREC, who take responsibility for the consolidation and reporting of Sibanye Gold’s Mineral Resources and Mineral Reserves and of the overall regulatory compliance of these figures is Mr. Gerhard Janse van Vuuren, who gave his consent for the disclosure of the C2015 Mineral Resource and Mineral Reserve Statement. Mr Janse van Vuuren [BTech (MRM), GDE (Mining Eng.), MBA and MSCoC] is registered with Plato (PMS No 243) and has 27 years’ experience relative to the type and style of mineral deposit under consideration. He is the current Vice President: Mine Planning and Mineral Resource Management and is a full time employee of Sibanye Gold. Mr. van Vuuren consents to the inclusion of all information in this release relating to mineral resources and mineral reserves in the form in which it appears.
The respective business unit based Mineral Resource Managers, relevant project managers and the respective Mineral Resource Management discipline heads have been designated as the Competent Persons in terms of SAMREC and take responsibility for the reporting of Mineral Resources and Mineral Reserves for their respective area(s) of responsibility. Additional information regarding these personnel, as well as the teams involved with the compilation of the Mineral Resource and Mineral Reserve declaration is incorporated in the Mineral Resources and Mineral Reserves Supplement that will be published in conjunction with the 2014 Sibanye Gold Integrated Report.
2

Shares in IssueADRs in issue
916 140 552244 432 718
Market Cap R52 billion (US$3.3 billion)
Listings • JSE Limited share code: SGL • New York Stock Exchange ADR
programme share code: SBGL
Debt* R2.0 billion (US$123 million) of R4.5 billion term and revolving facility
Corporate overview
Corporate overviewMajor Sibanye Gold shareholders *
Gold One Limited 20.24%
Public Investment Corporation 10.02%
Allan Gray Investment Council 8.29%
Contact details
Libanon Business Park
1 Hospital Road (off Cedar Avenue)
Libanon, Westonaria, 1779
South Africa
Neal Froneman
CEO
Tel: +27 11 278 9600
e-mail: [email protected]
James Wellsted
Investor Relations
Tel: +27 11 278 9656
e-mail: [email protected]
* Source: J.P.Morgan Cazenove, January 2016* At 25 February 2016, excludes Burnstone debt
20%
32%
35%
6%
3% 4%
China
South Africa
USA
United Kingdom
Germany
Others
* Source: J.P.Morgan Cazenove, January 2016
Shareholder geographic distribution*
A substantial company with a strong balance sheet 3
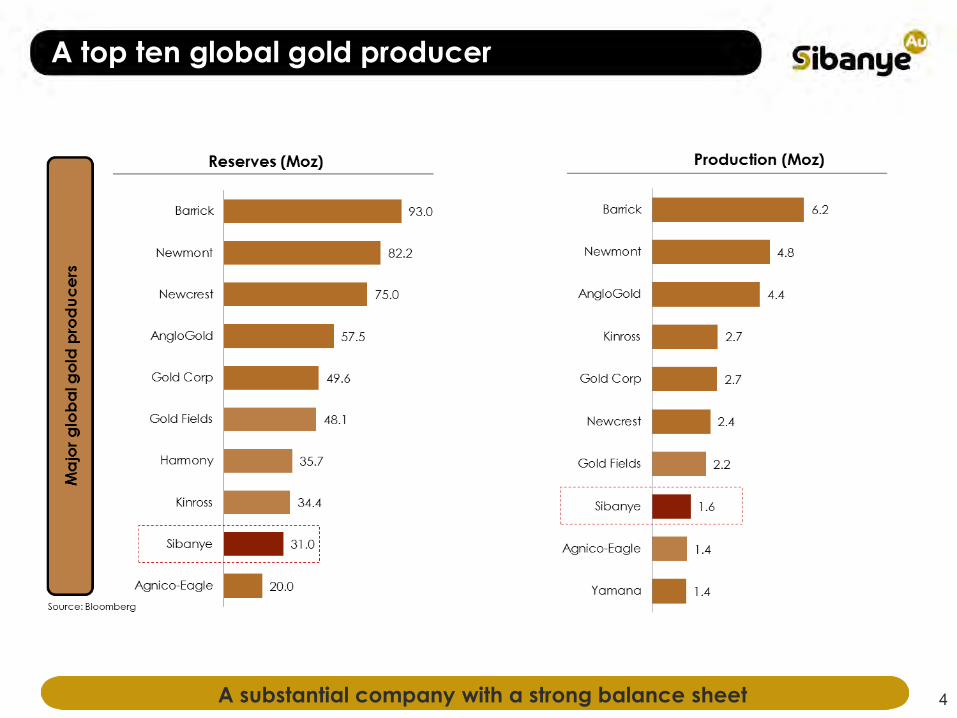
A top ten global gold producer
4A substantial company with a strong balance sheet
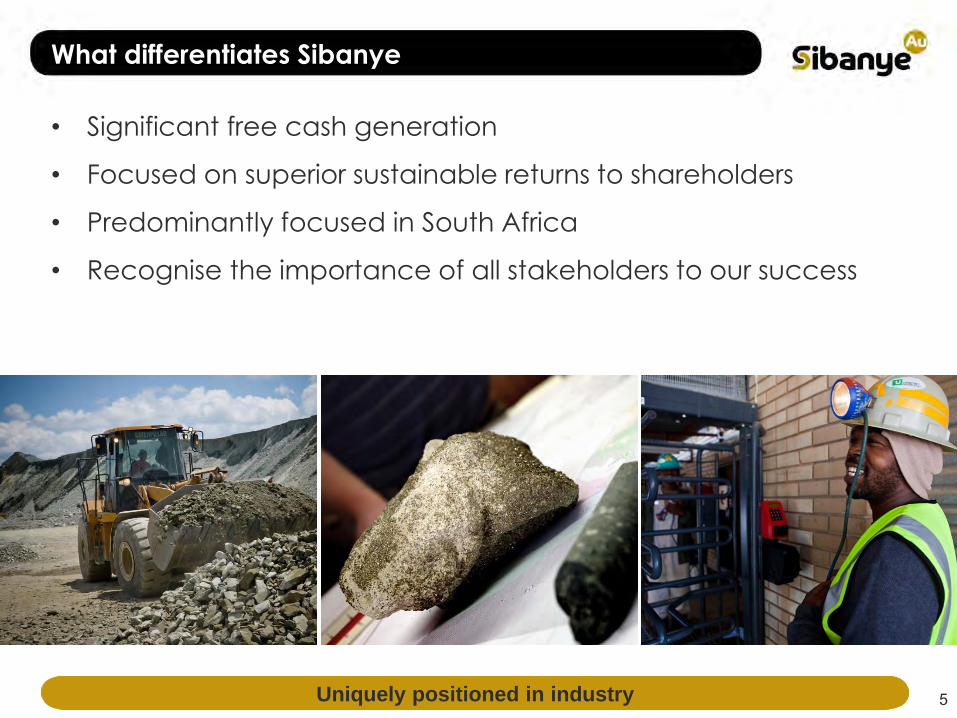
What differentiates Sibanye
• Significant free cash generation
• Focused on superior sustainable returns to shareholders
• Predominantly focused in South Africa
• Recognise the importance of all stakeholders to our success
Uniquely positioned in industry 5
Our Vision
SUPERIOR VALUE CREATION
FOR ALL OUR STAKEHOLDERS
Through mining our mult i commodity
resources predominantly in
South Afr ica
Value driven 6
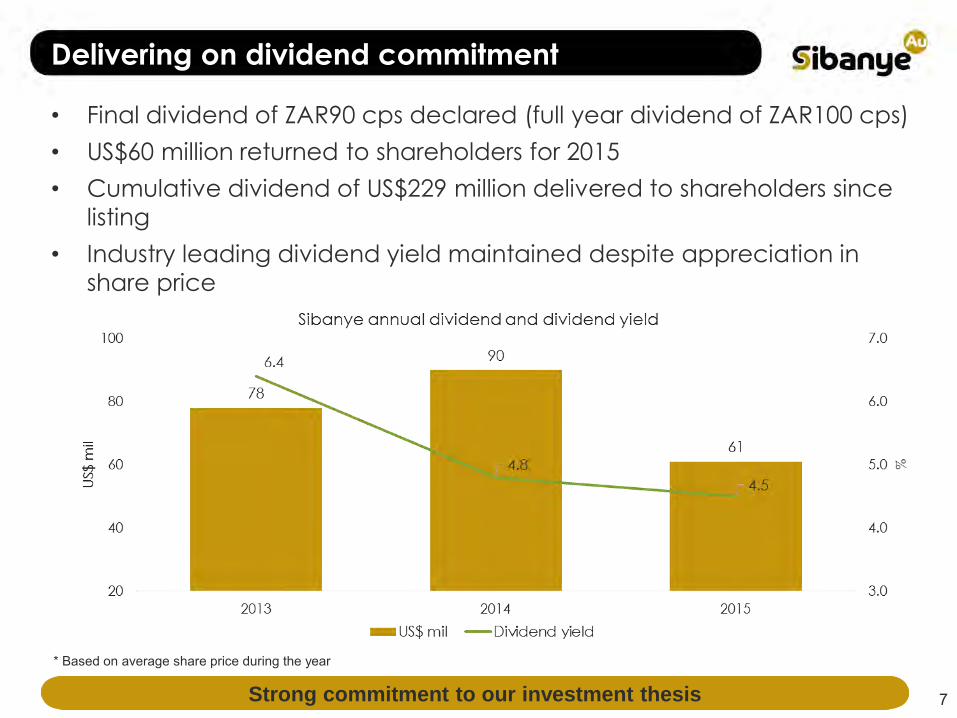
Delivering on dividend commitment
• Final dividend of ZAR90 cps declared (full year dividend of ZAR100 cps)
• US$60 million returned to shareholders for 2015
• Cumulative dividend of US$229 million delivered to shareholders since
listing
• Industry leading dividend yield maintained despite appreciation in
share price
Strong commitment to our investment thesis
* Based on average share price during the year
7
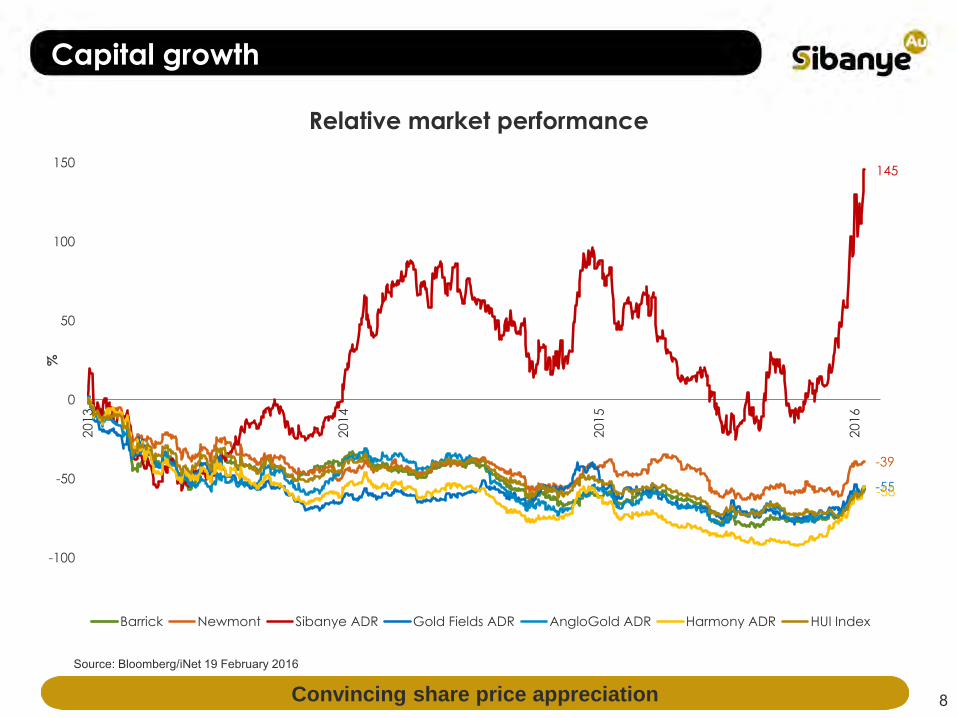
Capital growth
Convincing share price appreciation 8
Source: Bloomberg/iNet 19 February 2016
-39
145
-55-58
-100
-50
0
50
100
150
201
3
201
4
201
5
201
6
%
Relative market performance
Barrick Newmont Sibanye ADR Gold Fields ADR AngloGold ADR Harmony ADR HUI Index
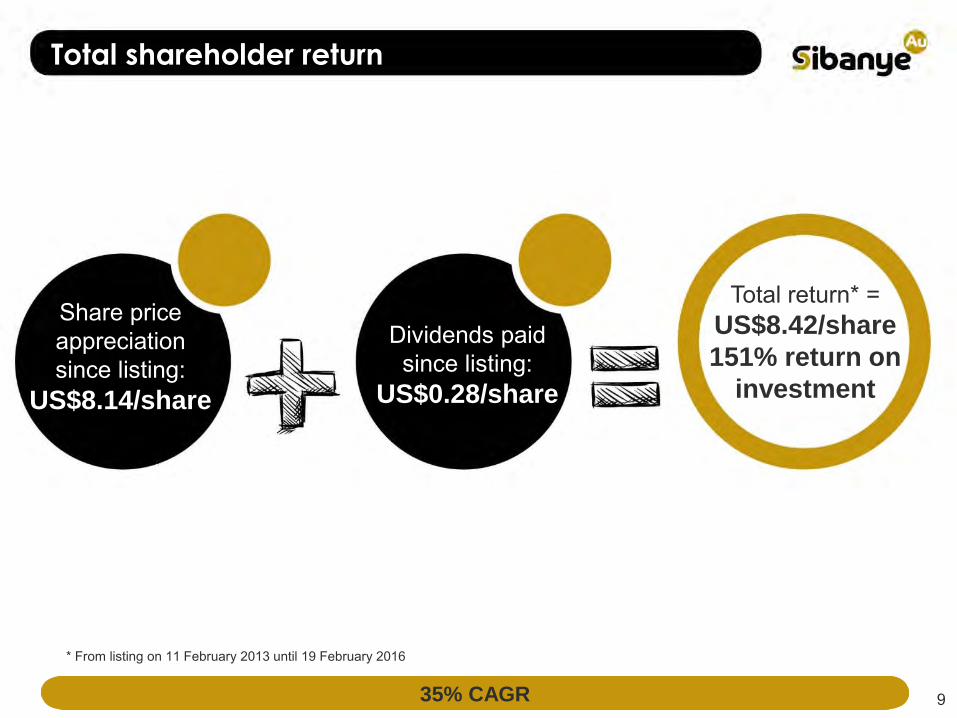
Total shareholder return
35% CAGR
Share price appreciation since listing:
US$8.14/share
Dividends paid since listing:
US$0.28/share
Total return* = US$8.42/share
151% return on
investment
9
* From listing on 11 February 2013 until 19 February 2016
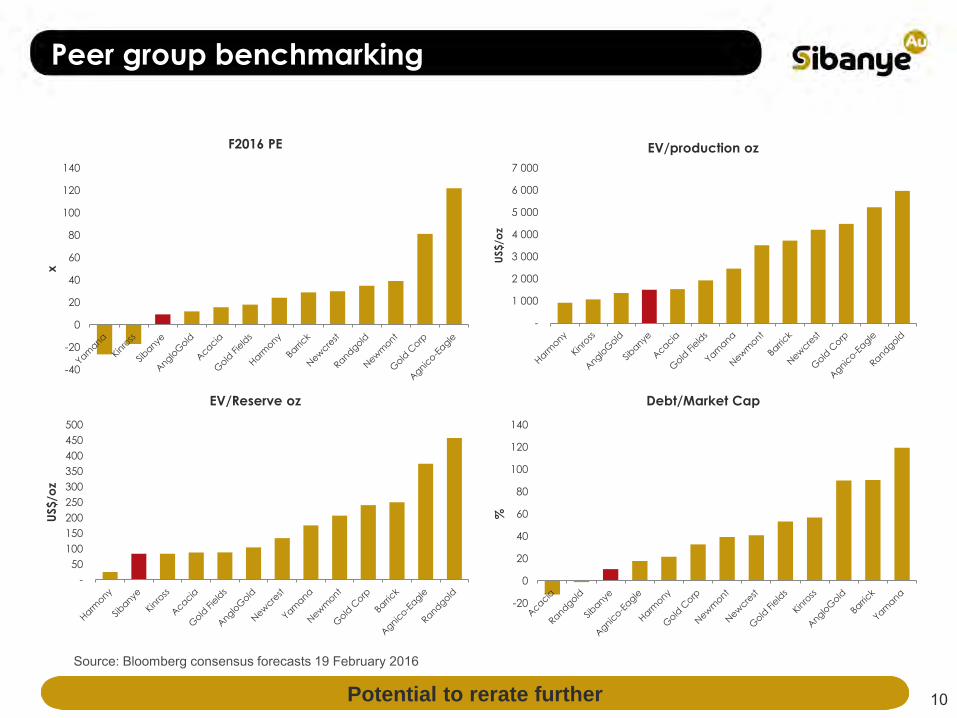
Peer group benchmarking
Potential to rerate further
-40
-20
0
20
40
60
80
100
120
140
x
F2016 PE
-
50
100
150
200
250
300
350
400
450
500
US$/o
z
EV/Reserve oz
-20
0
20
40
60
80
100
120
140
%
Debt/Market Cap
-
1 000
2 000
3 000
4 000
5 000
6 000
7 000
US$
/oz
EV/production oz
Source: Bloomberg consensus forecasts 19 February 2016
10
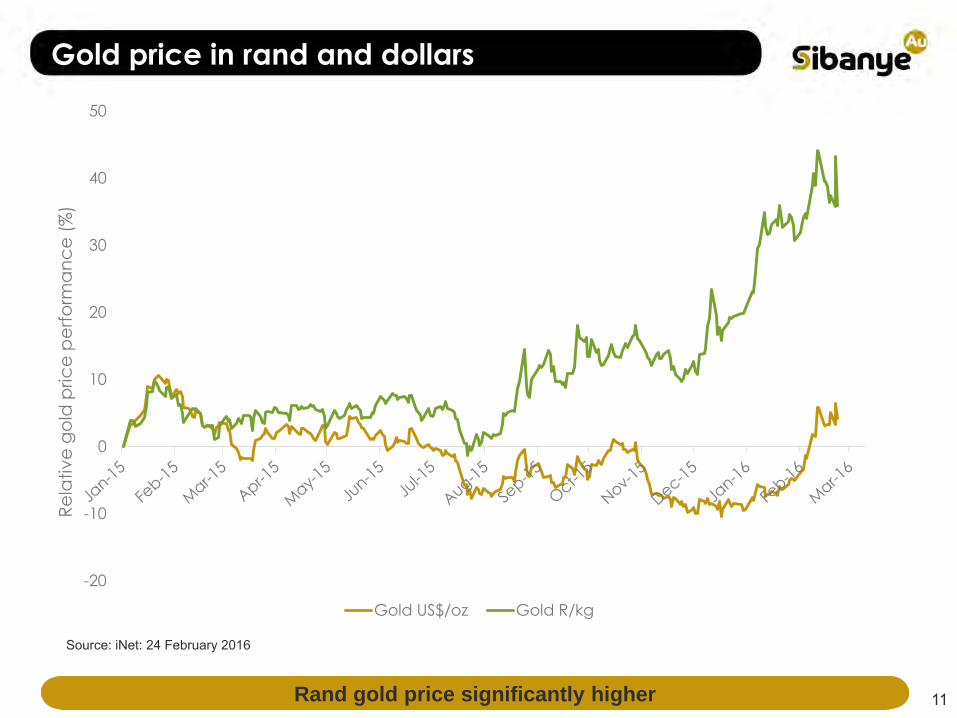
Gold price in rand and dollars
Rand gold price significantly higher
Source: iNet: 24 February 2016
11
-20
-10
0
10
20
30
40
50
Re
lati
ve
go
ld p
ric
e p
erf
orm
an
ce
(%
)
Gold US$/oz Gold R/kg
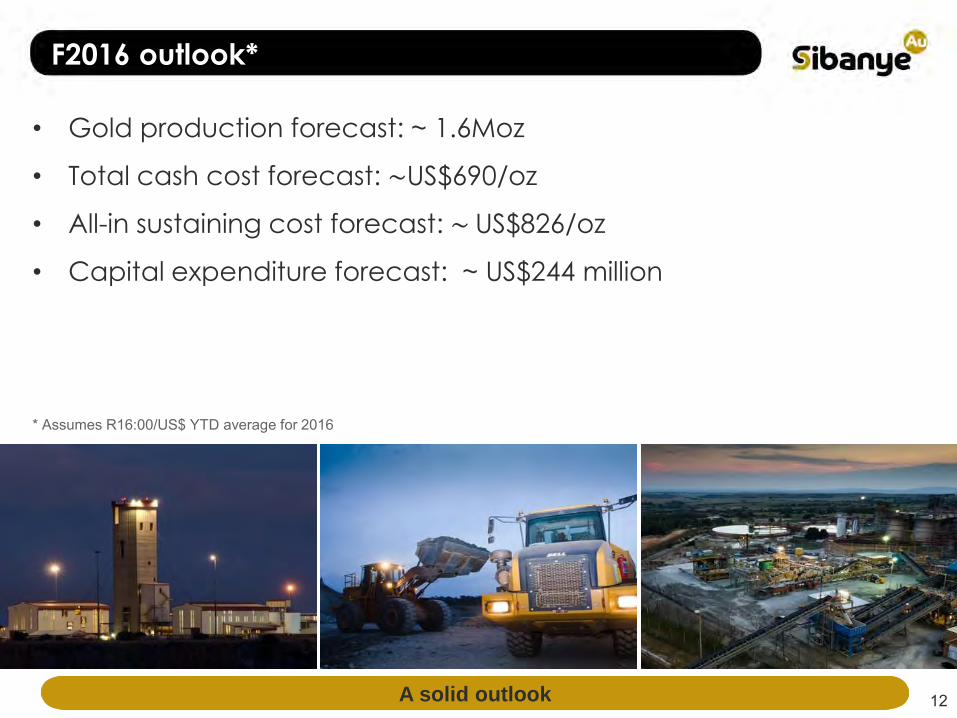
F2016 outlook*
A solid outlook
• Gold production forecast: ~ 1.6Moz
• Total cash cost forecast: ~US$690/oz
• All-in sustaining cost forecast: ~ US$826/oz
• Capital expenditure forecast: ~ US$244 million
12
* Assumes R16:00/US$ YTD average for 2016
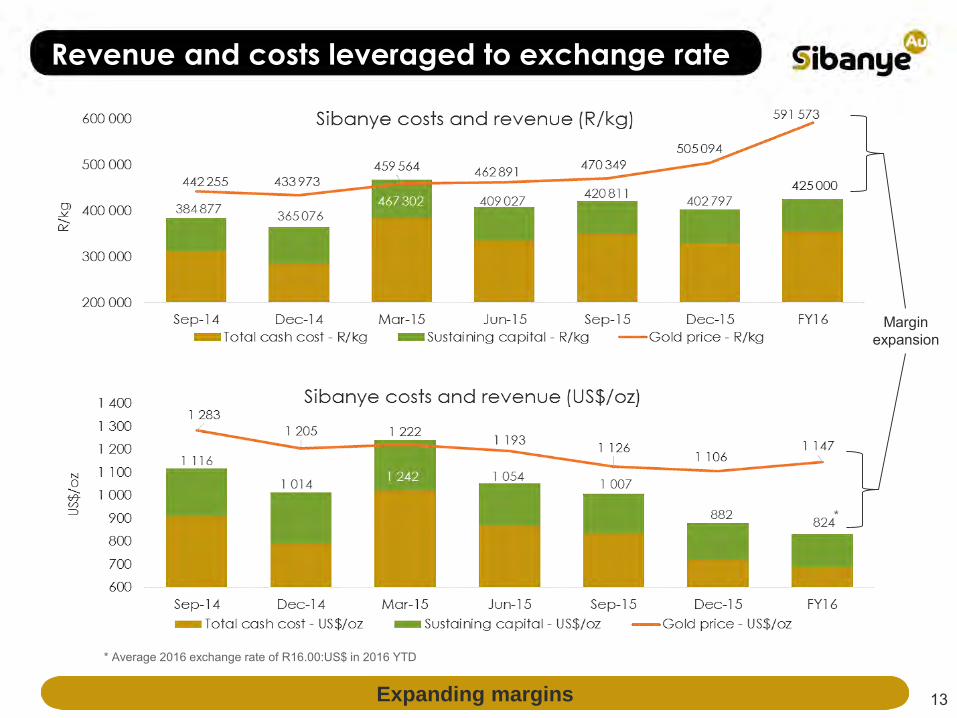
Revenue and costs leveraged to exchange rate
Expanding margins 13
* Average 2016 exchange rate of R16.00:US$ in 2016 YTD
1 242
*
Margin expansion
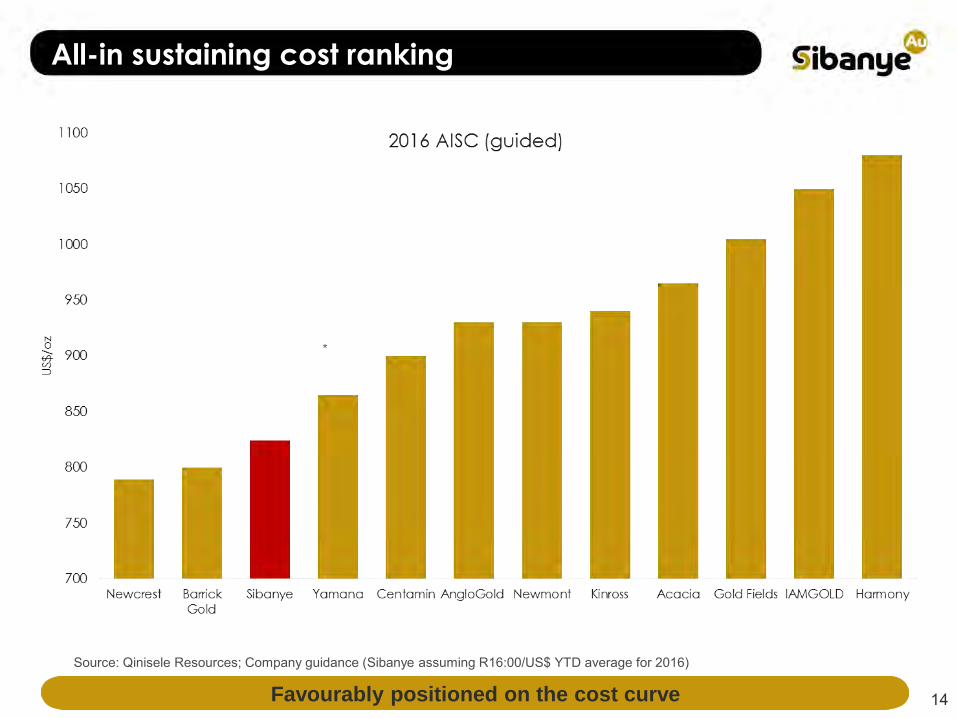
All-in sustaining cost ranking
Favourably positioned on the cost curve 14
*
Source: Qinisele Resources; Company guidance (Sibanye assuming R16:00/US$ YTD average for 2016)
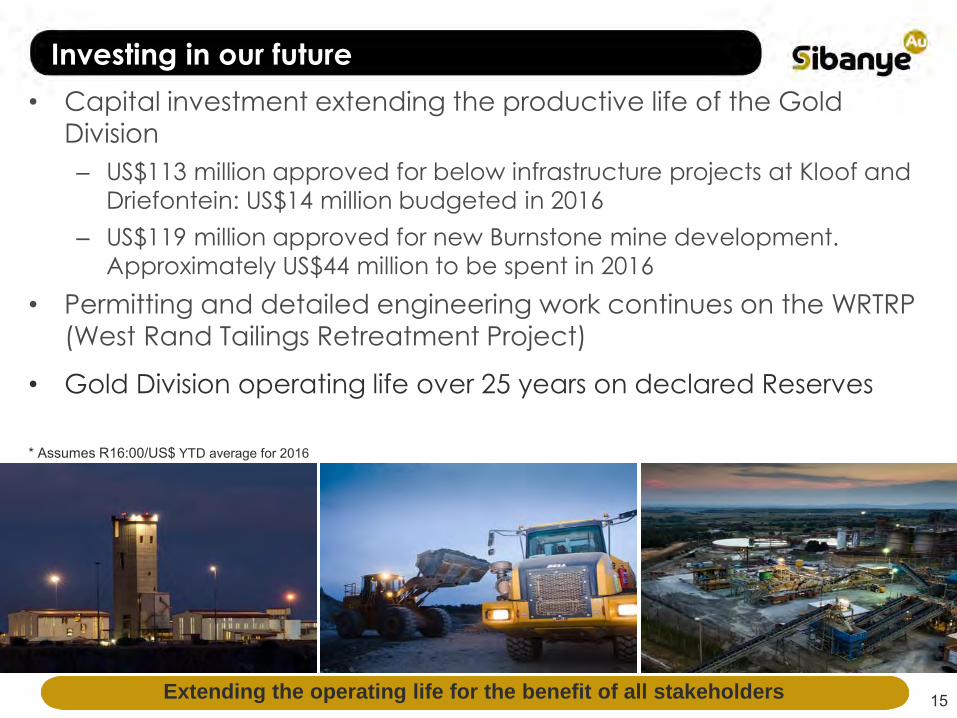
Investing in our future
• Capital investment extending the productive life of the Gold
Division
– US$113 million approved for below infrastructure projects at Kloof and
Driefontein: US$14 million budgeted in 2016
– US$119 million approved for new Burnstone mine development.
Approximately US$44 million to be spent in 2016
• Permitting and detailed engineering work continues on the WRTRP
(West Rand Tailings Retreatment Project)
• Gold Division operating life over 25 years on declared Reserves
Extending the operating life for the benefit of all stakeholders 15
* Assumes R16:00/US$ YTD average for 2016
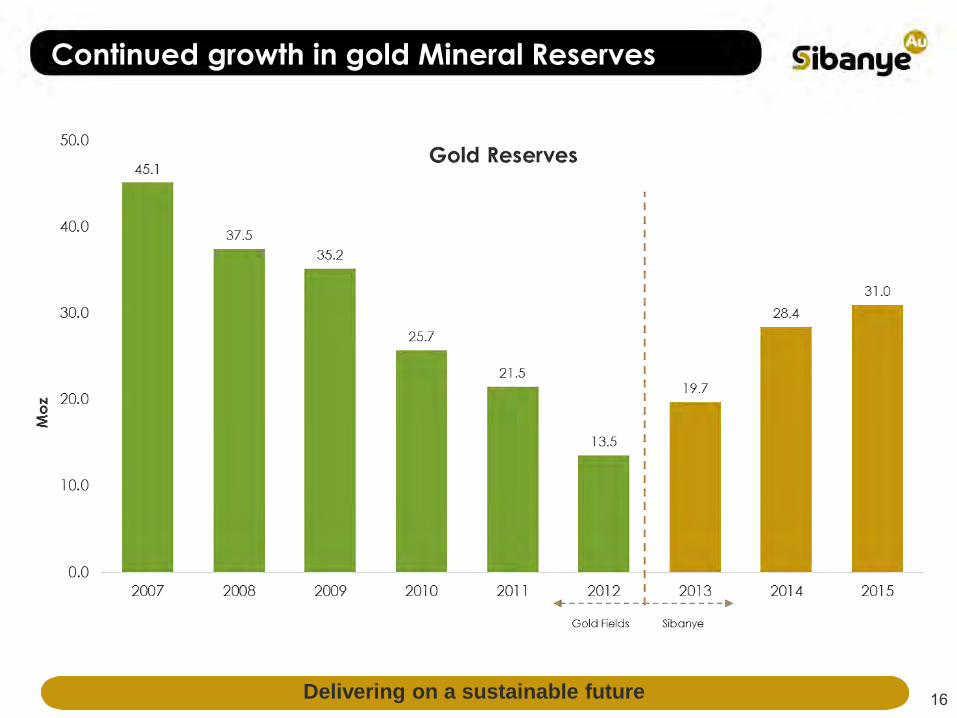
Continued growth in gold Mineral Reserves
Delivering on a sustainable future 16

A sustainable Gold Division
Extending the operating life
*Project profile is conceptual and subject to change on completion of detailed studiesBased on Reserves declared as at 31 December 2015Assumptions: Gold price: 430,000 R/kg, Uranium 40 - 70 US$/lb and 15:00 ZAR:1US$ (real 2015 terms)
Harvest
plan
17
Harvest plan
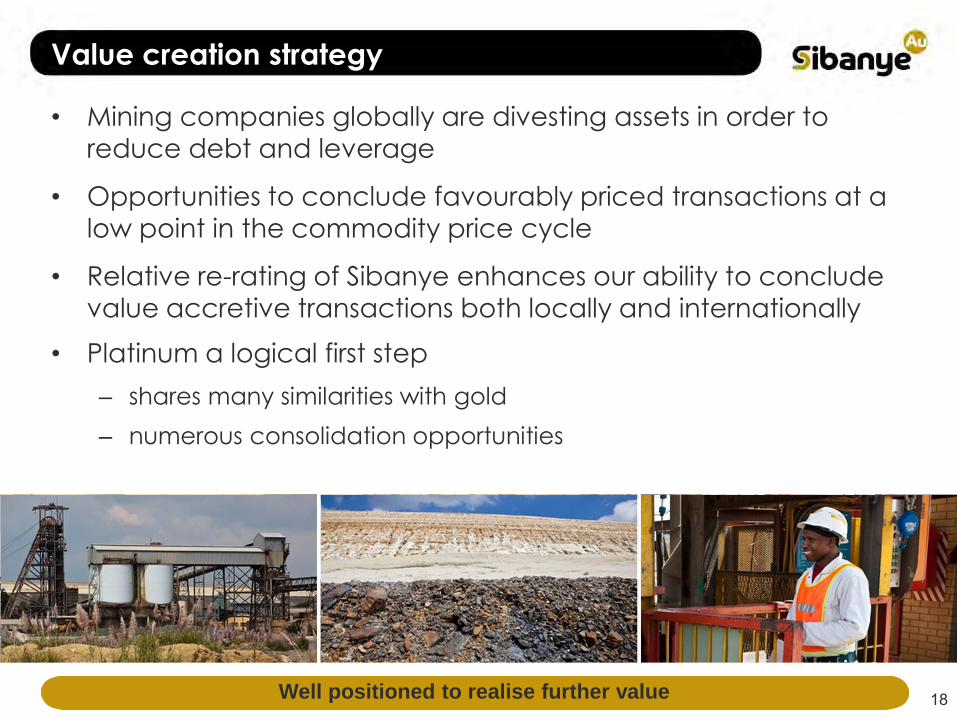
Value creation strategy
Well positioned to realise further value
• Mining companies globally are divesting assets in order to
reduce debt and leverage
• Opportunities to conclude favourably priced transactions at a
low point in the commodity price cycle
• Relative re-rating of Sibanye enhances our ability to conclude
value accretive transactions both locally and internationally
• Platinum a logical first step
– shares many similarities with gold
– numerous consolidation opportunities
18
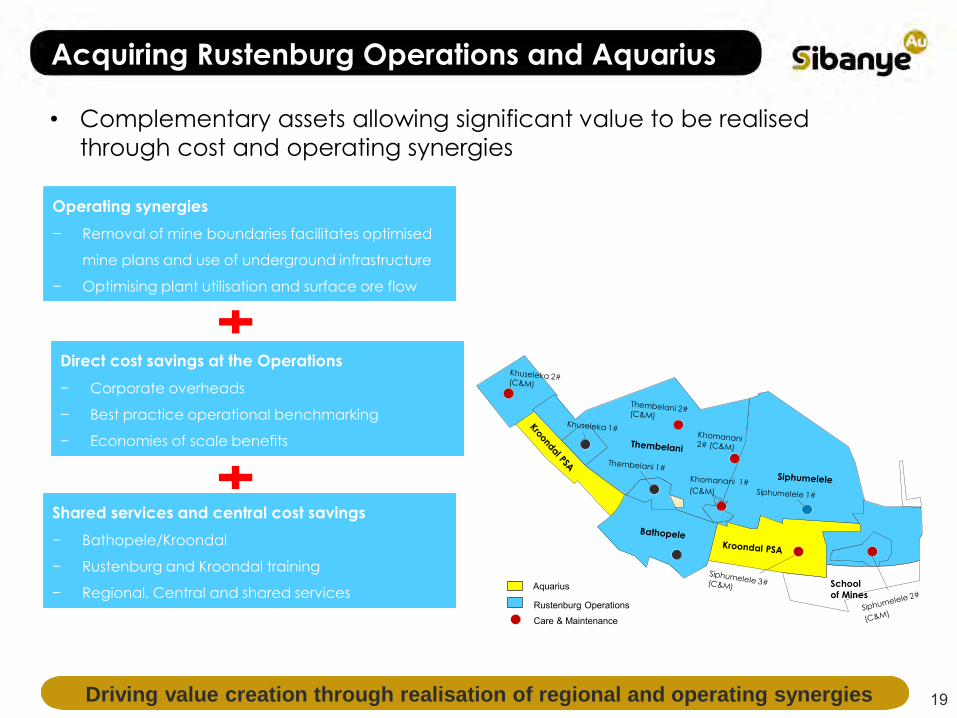
Acquiring Rustenburg Operations and Aquarius
Operating synergies
− Removal of mine boundaries facilitates optimised
mine plans and use of underground infrastructure
− Optimising plant utilisation and surface ore flow
Turk #
(undeveloped)
School
of MinesAquarius
Rustenburg Operations
Care & Maintenance
Shared services and central cost savings
− Bathopele/Kroondal
− Rustenburg and Kroondal training
− Regional, Central and shared services
Direct cost savings at the Operations
− Corporate overheads
− Best practice operational benchmarking
− Economies of scale benefits
Driving value creation through realisation of regional and operating synergies
• Complementary assets allowing significant value to be realised
through cost and operating synergies
19

Becoming a top five PGM producer
10.7
15.1
15.2
42.9
50.1
128.2
194.7
RBPlats
Northam
Sibanye
Lonmin
Impala
Norilsk Nickel
AMPLATS- ex
Rustenburg Mines³
48.2
135.9
179.1
195.0
342.9
395.2
814.4
RBPlats
Sibanye
Lonmin
Northam
Norilsk Nickel
Impala
AMPLATS- ex
Rustenburg Mines³
0.3
0.4
1.1
1.3
2.3
3.4
3.4
RBPlats
Northam
Sibanye
Lonmin
Impala
Norilsk Nickel
AMPLATS- ex
Rustenburg Mines
Ma
jor
glo
ba
l P
GM
pro
du
ce
rs
4E Reserves1,2 (moz) 4E Resources1,2 (moz) 2015E 4E Production1,4 (moz)
(of which 0.7moz is
platinum)
Source: Companies’ disclosures, Broker reports
Notes:
1. Platinum, palladium, rhodium and gold (together referred to as 3E+Au or 4E). Sibanye related data includes Rustenburg Operations and Aquarius
2. Reserves and resources are latest reported by the companies and are on an attributable basis; resources include reserves
3. Prior to conclusion of the latest PSA agreement with Aquarius
4. Based on broker consensus
5. Aquarius reserves and resources include 50% of the Kroondal PSA extension; Total Resources also include managed resources from projects and Blue Ridge
(Rustenburg
+ Aquarius5)
(Rustenburg
+ Aquarius5)
(Rustenburg
+ Aquarius)
20A substantial company with a strong balance sheet

Revised Sibanye organisational architecture
Structure follows strategy
Gold and Uranium Division Platinum Division Coal and Energy Division
21

Focused leadership structure
Group strategy
Governance and oversight
Divisional operations management
Operational delivery
22
Platinum Operations Management
Gold and Uranium Operations Management
SIbanye Board
Sibanye Executive Committee
CEO
Gold and Uranium Division Executive
Platinum Division Executive
Division CEO Division CEO
Operations VPs Operations VPsSibanye GroupServices
Role clarity and organisational effectiveness
Conclusion
• Sibanye is committed to creating superior value for ALL
stakeholders
• Gold division is generating substantial cash flow
• Platinum acquisitions will realise significant value in the medium
term
• Robust financial position and strong balance sheet at an
opportune point in the commodity cycle
• Industry leading dividend yield investment theisis remains the
conerstone building block
A secure and prosperous future 23
QUESTIONS
24