Embed Size (px)
Citation preview
For peer review only
Impact of Ethnicity on Progress of Glycaemic Control: a Study of 131,935 Newly Diagnosed Patients with Type 2
Diabetes
Journal: BMJ Open
Manuscript ID: bmjopen-2015-007599
Article Type: Research
Date Submitted by the Author: 07-Jan-2015
Complete List of Authors: Rawshani, Araz; Institute of Medicine, Department of Molecular and Clinical Medicine Svensson, Ann-Marie; Centre of Registers in Region Västra Götaland,
Rosengren, Annika; University of Gothenburg, Department of Medicine Zethelius, Bjorn.; Uppsala University, Public Health/Geriatrics Eliasson, Björn; University of Gothenburg, Department of Medicine Gudbjörnsdottir, Soffia; University of Gothenburg, Department of Medicine
<b>Primary Subject Heading</b>:
Diabetes and endocrinology
Secondary Subject Heading: Health policy, Epidemiology, Global health
Keywords:
DIABETES & ENDOCRINOLOGY, Diabetic nephropathy & vascular disease < DIABETES & ENDOCRINOLOGY, General diabetes < DIABETES & ENDOCRINOLOGY, EPIDEMIOLOGY, Diabetes & endocrinology < INTERNAL MEDICINE, Adult nephrology < NEPHROLOGY
For peer review only - http://bmjopen.bmj.com/site/about/guidelines.xhtml
BMJ Open on 25 M
arch 2019 by guest. Protected by copyright.
http://bmjopen.bm
j.com/
BM
J Open: first published as 10.1136/bm
jopen-2015-007599 on 5 June 2015. Dow
nloaded from
For peer review only
Impact of Ethnicity on Progress of Glycaemic Control: a Study of
131,935 Newly Diagnosed Patients with Type 2 Diabetes
Report by the Swedish National Diabetes Register
Araz Rawshani1, 2
Ann-Marie Svensson1, 2, 3
Annika Rosengren1, 2
Björn Zethelius4, 5
Björn Eliasson1, 2, 3
Soffia Gudbjornsdottir1, 2, 3
1 Department of Molecular and Clinical Medicine, University of Gothenburg, Gothenburg, Sweden
2 Sahlgrenska University Hospital, Gothenburg, Sweden
3 National Diabetes Register, Centre of Registers, Gothenburg, Sweden
4 Department of Public Health and Caring Sciences/Geriatrics, Uppsala University, Uppsala,
Sweden
5 Medical Products Agency, Epidemiology, Uppsala, Sweden
Corresponding author
Araz Rawshani
National Diabetes Register, Centre of Registers
Västra Götaland Region, 41345 Gothenburg, Sweden
ABSTRACT WORD COUNT 270
MAIN TEXT WORD COUNT 2708
TABLES 2
FIGURES 3
SUPPLEMENTARY MATERIAL 2 Figures
REFERENCES 38
Page 1 of 20
For peer review only - http://bmjopen.bmj.com/site/about/guidelines.xhtml
BMJ Open
123456789101112131415161718192021222324252627282930313233343536373839404142434445464748495051525354555657585960
on 25 March 2019 by guest. P
rotected by copyright.http://bm
jopen.bmj.com
/B
MJ O
pen: first published as 10.1136/bmjopen-2015-007599 on 5 June 2015. D
ownloaded from

For peer review only
Abstract
Objectives: Studies on ethnic disparities in glycaemic control have been contradictory and
compromised by excessively broad categories of ethnicity and inadequate adjustment for
socioeconomic differences. We aimed to study the effect of ethnicity on glycaemic control in a
large cohort of patients with type 2 diabetes.
Setting: We used nationwide data (mainly from primary care) from the Swedish National Diabetes
Register (2002-2011) to identify patients with newly diagnosed (within 12 months) type 2 diabetes.
Participants: We included 131,935 patients (with 713,495 appointments), representing 10 ethnic groups,
who were followed up to 10 years.
Primary and secondary outcome measures: Progress of HbA1c for up to 10 years was examined.
Mixed models were used to correlate ethnicity with HbA1c (mmol/mol). The effect of glycaemic
disparities was examined by assessing the risk of developing albuminuria. The impact of ethnicity
was compared to that of income, education and physical activity.
Results: Immigrants, particularly those of non-Western origin, received glucose-lowering therapy
earlier, had 30% more appointments but displayed poorer glycaemic control (2–5 mmol/mol higher
HbA1c than native Swedes). Probability of therapy failure was 28–111% higher for non-Western
groups than for native Swedes. High-income Western groups remained below the target-level of
HbA1c for 4–5 years, whereas non-Western populations never reached the target level. These
disparities translated into 51–92% higher risk of developing albuminuria. The impact of ethnicity
was greater than the effect of income and education, and equal to the effect of physical activity.
Conclusions: Despite earlier pharmacological treatment and more frequent appointments,
immigrants of non-Western origin display poorer glycaemic control and this is mirrored in a higher
risk of developing albuminuria.
Page 2 of 20
For peer review only - http://bmjopen.bmj.com/site/about/guidelines.xhtml
BMJ Open
123456789101112131415161718192021222324252627282930313233343536373839404142434445464748495051525354555657585960
on 25 March 2019 by guest. P
rotected by copyright.http://bm
jopen.bmj.com
/B
MJ O
pen: first published as 10.1136/bmjopen-2015-007599 on 5 June 2015. D
ownloaded from

For peer review only
Strengths and limitations of this study
• To our knowledge, this is the largest study on ethnic differences in progress of glycaemic control.
We included 131,935 patients (with 713,495 appointments) who were followed up to 10 years.
• All major ethnic groups in the world were represented in this study cohort and they had fully equal
access to, and use of, health care, regardless of ethnic and socioeconomic background. Indeed, we
report that immigrants had higher consumption of health care. This contrasts against previous
studies, which have been hampered by inappropriately broad categories of ethnicity, cross-sectional
design, small samples, short follow-up and unequal access to or consumption of health care.
• The longitudinal design, with at least annually updated information on all time-varying variables,
allow for reliable estimates of the effect of ethnicity. We could control adequately for
socioeconomic, demographic and health-related confounders.
• The main findings (immigrants, particularly those of non-Western origin, display poor glycaemic
control and have a considerably higher risk of developing albuminuria) indicate that much can be
done to improve diabetes care for a large proportion of the diabetic population in Western countries.
• When extrapolating our results, it need be taken into account that these ethnic differences could be
expected in an equitable health care system. This should be taken into consideration in countries
were access to health care is not equitable.
Page 3 of 20
For peer review only - http://bmjopen.bmj.com/site/about/guidelines.xhtml
BMJ Open
123456789101112131415161718192021222324252627282930313233343536373839404142434445464748495051525354555657585960
on 25 March 2019 by guest. P
rotected by copyright.http://bm
jopen.bmj.com
/B
MJ O
pen: first published as 10.1136/bmjopen-2015-007599 on 5 June 2015. D
ownloaded from
For peer review only
Introduction
Tight glucose control in type 2 diabetes has shown long-term beneficial effects on microvascular
complications, cardiovascular disease and mortality [1-5]. Studies of ethnic disparities in glycaemic
control have been contradictory [6-8]. They have, however, been hampered by inappropriately
broad categories of ethnicity, cross-sectional design, small samples, short follow-up and unequal
access to—or consumption of—health care. There are no reliable estimates of the true effect of
ethnicity on glycaemic control.
This issue is important in Western societies that are becoming more ethnically diverse due to
accelerated migration from other areas of the world [9]. The ethnic admixture of Western societies
is currently far more diverse than the risk estimate tools of clinicians are prepared to handle.
Immigrants may be at particular risk due to genetic susceptibility to insulin resistance [10,11],
difficult transitional phases, and rapid changes in diet and lifestyle [12], as well as linguistic,
cultural and financial barriers to obtaining proper health care [13,14].
Sweden is an ethnically heterogeneous country in which all inhabitants enjoy access to every level
of health care at a minimal cost [15]. Immigrants are targeted in an effort to promote healthy
lifestyles and consumption of health care [16,17]. The great majority of Swedes with type 2 diabetes
are included in the Swedish National Diabetes Register, which we used to analyse the impact of
ethnicity on the progress of glycaemic control and on albuminuria as a marker for diabetic
complications.
Methods
Data sources
Swedish authorities manage several nationwide registers, which may be linked through the unique
personal identification number assigned to every Swede. The National Diabetes Register (NDR) has
been described previously [18]. It was launched in 1996 as a care giver tool for local quality assurance
purposes and as a feed-back tool in diabetes care [19]. Data provided by nurses and physicians trained in
register procedures are obtained at visits in outpatient clinics of hospitals and primary care clinics.
Clinical information and various measurements are updated at least once a year.
Patients with at least one entry in the NDR from 1 January 2002 to 31 December 2011 were
included if they had been reported within 12 months of the date of diagnosis. Ninety-six per cent of
the subjects had been diagnosed with type 2 diabetes on the basis of a clinical assessment. The
remainder were included on the basis of the following definition: age 40 or older at the time of
diagnosis and treated either with diet only, diet combined with oral hypoglycaemic agents (OHA),
Page 4 of 20
For peer review only - http://bmjopen.bmj.com/site/about/guidelines.xhtml
BMJ Open
123456789101112131415161718192021222324252627282930313233343536373839404142434445464748495051525354555657585960
on 25 March 2019 by guest. P
rotected by copyright.http://bm
jopen.bmj.com
/B
MJ O
pen: first published as 10.1136/bmjopen-2015-007599 on 5 June 2015. D
ownloaded from
For peer review only
or a combination of OHA combined and insulin. This definition has been validated and used
previously [20-22].
Measures
Data on annual income in Swedish kronor, highest educational level regardless of country of
domicile and country of birth (used as proxy for ethnicity/race) were obtained from the
Longitudinal Integration Database for Health Insurance and Labour Market Studies, which is an
official database administered by the Swedish National Board of Health and Welfare. Educational
level was stratified into lower (9 years or less—the length of compulsory education in Sweden),
intermediate (10-12 years—upper secondary) and higher (college or university). Income was
stratified into quintiles (Q1 to Q5), with the highest (Q5) being the reference. Ethnic categories
were based on an appraisal of ancestry and geography, [23] with the exception of the fact that
Nordic countries were classified separately in the present study for the purpose of examining
whether immigrants from neighbouring countries also exhibited differences. Native Swedish
patients served as the reference group. Sixty-two individuals were excluded because information
about their country of birth was unavailable.
Glycaemic control was measured as HbA1c. Analyses were quality assured nationwide by regular
calibration with the HPLC Mono-S method, and then converted to mmol/mol [International
Federation of Clinical Chemistry (IFCC)] [24]. Albuminuria was defined as urine albumin excretion
>20µg/min at two out of three consecutive tests (microalbuminuria or macroalbuminuria). BMI was
calculated as weight in kilograms divided by height in metres squared. Systolic blood pressure was
the mean value of two supine readings (Korotkoff 1–5) with a cuff of appropriate size and after at
least 5 minutes of rest. LDL, HDL and total cholesterol were measured in mmol/L. Physical activity
was rated from 1 (never) to 5 (daily). Smoking was coded as present if the patient currently smoked.
Use of lipid lowering medications was dichotomized. Glucose-lowering treatment was categorized
as diet and lifestyle modifications, oral hypoglycaemic agents (OHAs), insulin, or insulin and
OHAs. A history of cardiovascular disease (CVD) was defined as previous hospitalization due to
acute myocardial infarction or stroke (ICD-10, I21, I60–I69; ICD-9, 410, 430–434, 436–438)
according to the Swedish National Discharge Register, which is a reliable validated method [25,26].
All time-varying variables are updated in the NDR following each appointment.
Analyses and statistics
Baseline
Page 5 of 20
For peer review only - http://bmjopen.bmj.com/site/about/guidelines.xhtml
BMJ Open
123456789101112131415161718192021222324252627282930313233343536373839404142434445464748495051525354555657585960
on 25 March 2019 by guest. P
rotected by copyright.http://bm
jopen.bmj.com
/B
MJ O
pen: first published as 10.1136/bmjopen-2015-007599 on 5 June 2015. D
ownloaded from
For peer review only
The first observation was used to present characteristics at time of diagnosis (within 12 months).
Continuous variables are reported as means, percentages and quintiles. T tests were used for
continuous variables with native Swedes as the reference group. Chi-square tests were used for
categorical variables. A p-value <0.01 was considered statistically significant but multiple
testing should be considered when interpreting the results.
Glycaemic control
Progress of glycaemic control was calculated as an unadjusted annual mean in relation to
ethnicity. Adjusted figures were calculated using linear regression, to estimate differences in
mmol/mol. Logistic regression was used to estimate the probability of achieving glycaemic
control (i.e. reaching target-level HbA1c <52 mmol/mol) during the second year after diagnosis.
To examine whether hypothesized differences in glycaemia is reflected on the risk of
complications, we calculated the probability of developing albuminuria during the second year
after diagnosis. Mixed effect models were used to account for repeated measurements on the
same unit [27-29]. HbA1c was centered around the mean.
Kaplan-Meier calculations were used to examine whether time to pharmacological treatment
differed among ethnic groups. This was done to examine whether differences in HbA1c could be
explained by disparities in use of medications.
Ethics
The study was approved by the regional ethical review board at the University of Gothenburg,
Gothenburg, Sweden. All patients give informed consent before being included in the NDR.
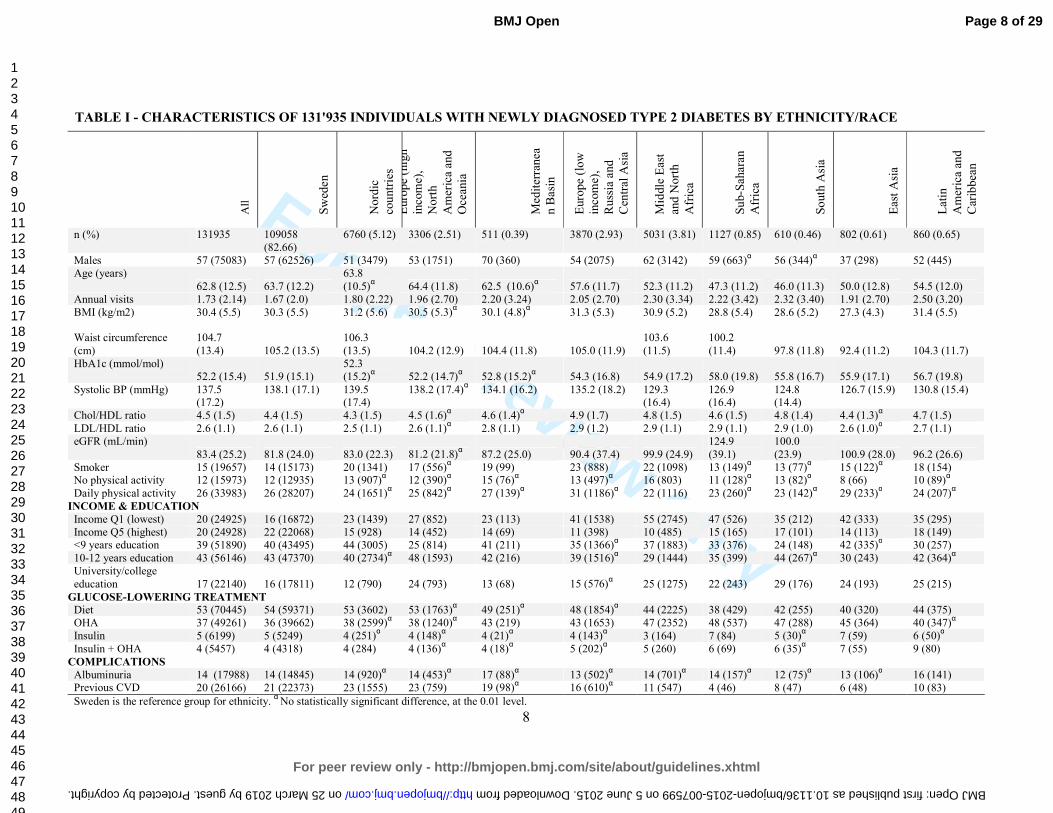
Results We included 131,935 individuals with newly diagnosed type 2 diabetes. A total of 713,495
appointments were registered. All major ethnic groups were represented in the study (Figure A,
supplementary material). A total of 82.7% of the study population consisted of native Swedes.
Immigrants had more appointments per year. Non-Western immigrants in particular had almost
30% more appointments (Table I).
Page 6 of 20
For peer review only - http://bmjopen.bmj.com/site/about/guidelines.xhtml
BMJ Open
123456789101112131415161718192021222324252627282930313233343536373839404142434445464748495051525354555657585960
on 25 March 2019 by guest. P
rotected by copyright.http://bm
jopen.bmj.com
/B
MJ O
pen: first published as 10.1136/bmjopen-2015-007599 on 5 June 2015. D
ownloaded from
For peer review only
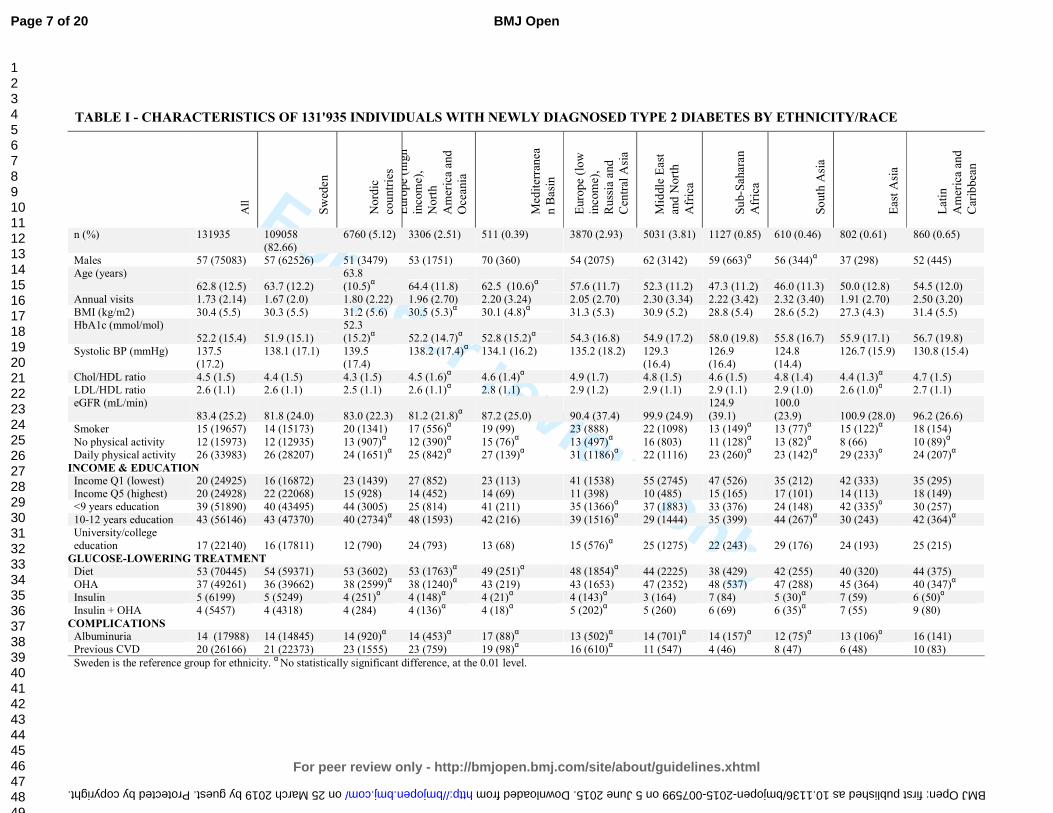
TABLE I - CHARACTERISTICS OF 131'935 INDIVIDUALS WITH NEWLY DIAGNOSED TYPE 2 DIABETES BY ETHNICITY/RACE
All
Sw
eden
Nord
ic
cou
ntr
ies
Euro
pe
(hig
h
inco
me)
,
Nort
h
Am
eric
a an
d
Oce
ania
Med
iter
ranea
n B
asi
n
Euro
pe
(low
inco
me)
,
Russ
ia a
nd
Cen
tral
Asi
a
Mid
dle
Eas
t
and N
ort
h
Afr
ica
Su
b-S
ahar
an
Afr
ica
So
uth
Asi
a
Eas
t A
sia
Lat
in
Am
eric
a an
d
Car
ibbea
n
n (%) 131935 109058
(82.66)
6760 (5.12) 3306 (2.51) 511 (0.39) 3870 (2.93) 5031 (3.81) 1127 (0.85) 610 (0.46) 802 (0.61) 860 (0.65)
Males 57 (75083) 57 (62526) 51 (3479) 53 (1751) 70 (360) 54 (2075) 62 (3142) 59 (663)α 56 (344)
α 37 (298) 52 (445)
Age (years)
62.8 (12.5) 63.7 (12.2)
63.8
(10.5)α 64.4 (11.8) 62.5 (10.6)
α 57.6 (11.7) 52.3 (11.2) 47.3 (11.2) 46.0 (11.3) 50.0 (12.8) 54.5 (12.0)
Annual visits 1.73 (2.14) 1.67 (2.0) 1.80 (2.22) 1.96 (2.70) 2.20 (3.24) 2.05 (2.70) 2.30 (3.34) 2.22 (3.42) 2.32 (3.40) 1.91 (2.70) 2.50 (3.20)
BMI (kg/m2) 30.4 (5.5) 30.3 (5.5) 31.2 (5.6) 30.5 (5.3)α 30.1 (4.8)
α 31.3 (5.3) 30.9 (5.2) 28.8 (5.4) 28.6 (5.2) 27.3 (4.3) 31.4 (5.5)
HbA1c (mmol/mol)
52.2 (15.4) 51.9 (15.1)
52.3
(15.2)α 52.2 (14.7)
α 52.8 (15.2)
α 54.3 (16.8) 54.9 (17.2) 58.0 (19.8) 55.8 (16.7) 55.9 (17.1) 56.7 (19.8)
Systolic BP (mmHg) 137.5
(17.2)
138.1 (17.1) 139.5
(17.4)
138.2 (17.4)α 134.1 (16.2) 135.2 (18.2) 129.3
(16.4)
126.9
(16.4)
124.8
(14.4)
126.7 (15.9) 130.8 (15.4)
Chol/HDL ratio 4.5 (1.5) 4.4 (1.5) 4.3 (1.5) 4.5 (1.6)α 4.6 (1.4)
α 4.9 (1.7) 4.8 (1.5) 4.6 (1.5) 4.8 (1.4) 4.4 (1.3)
α 4.7 (1.5)
LDL/HDL ratio 2.6 (1.1) 2.6 (1.1) 2.5 (1.1) 2.6 (1.1)α 2.8 (1.1) 2.9 (1.2) 2.9 (1.1) 2.9 (1.1) 2.9 (1.0) 2.6 (1.0)
α 2.7 (1.1)
eGFR (mL/min)
83.4 (25.2) 81.8 (24.0) 83.0 (22.3) 81.2 (21.8)α 87.2 (25.0) 90.4 (37.4) 99.9 (24.9)
124.9
(39.1)
100.0
(23.9) 100.9 (28.0) 96.2 (26.6)
Smoker 15 (19657) 14 (15173) 20 (1341) 17 (556)α 19 (99) 23 (888) 22 (1098) 13 (149)
α 13 (77)
α 15 (122)
α 18 (154)
No physical activity 12 (15973) 12 (12935) 13 (907)α 12 (390)
α 15 (76)
α 13 (497)
α 16 (803) 11 (128)
α 13 (82)
α 8 (66) 10 (89)
α
Daily physical activity 26 (33983) 26 (28207) 24 (1651)α 25 (842)
α 27 (139)
α 31 (1186)
α 22 (1116) 23 (260)
α 23 (142)
α 29 (233)
α 24 (207)
α
INCOME & EDUCATION
Income Q1 (lowest) 20 (24925) 16 (16872) 23 (1439) 27 (852) 23 (113) 41 (1538) 55 (2745) 47 (526) 35 (212) 42 (333) 35 (295)
Income Q5 (highest) 20 (24928) 22 (22068) 15 (928) 14 (452) 14 (69) 11 (398) 10 (485) 15 (165) 17 (101) 14 (113) 18 (149)
<9 years education 39 (51890) 40 (43495) 44 (3005) 25 (814) 41 (211) 35 (1366)α 37 (1883) 33 (376) 24 (148) 42 (335)
α 30 (257)
10-12 years education 43 (56146) 43 (47370) 40 (2734)α 48 (1593) 42 (216) 39 (1516)
α 29 (1444) 35 (399) 44 (267)
α 30 (243) 42 (364)
α
University/college
education 17 (22140) 16 (17811) 12 (790) 24 (793) 13 (68) 15 (576)α 25 (1275) 22 (243) 29 (176) 24 (193) 25 (215)
GLUCOSE-LOWERING TREATMENT
Diet 53 (70445) 54 (59371) 53 (3602) 53 (1763)α 49 (251)
α 48 (1854)
α 44 (2225) 38 (429) 42 (255) 40 (320) 44 (375)
OHA 37 (49261) 36 (39662) 38 (2599)α 38 (1240)
α 43 (219) 43 (1653) 47 (2352) 48 (537) 47 (288) 45 (364) 40 (347)
α
Insulin 5 (6199) 5 (5249) 4 (251)α 4 (148)
α 4 (21)
α 4 (143)
α 3 (164) 7 (84) 5 (30)
α 7 (59) 6 (50)
α
Insulin + OHA 4 (5457) 4 (4318) 4 (284) 4 (136)α 4 (18)
α 5 (202)
α 5 (260) 6 (69) 6 (35)
α 7 (55) 9 (80)
COMPLICATIONS
Albuminuria 14 (17988) 14 (14845) 14 (920)α 14 (453)
α 17 (88)
α 13 (502)
α 14 (701)
α 14 (157)
α 12 (75)
α 13 (106)
α 16 (141)
Previous CVD 20 (26166) 21 (22373) 23 (1555) 23 (759) 19 (98)α 16 (610)
α 11 (547) 4 (46) 8 (47) 6 (48) 10 (83)
Sweden is the reference group for ethnicity. α
No statistically significant difference, at the 0.01 level.
Page 7 of 20
For peer review only - http://bmjopen.bmj.com/site/about/guidelines.xhtml
BMJ Open
123456789101112131415161718192021222324252627282930313233343536373839404142434445464748495051525354555657585960
on 25 March 2019 by guest. Protected by copyright. http://bmjopen.bmj.com/ BMJ Open: first published as 10.1136/bmjopen-2015-007599 on 5 June 2015. Downloaded from
For peer review only
Characteristics at the time of diagnosis
Table 1 presents characteristics at the time of diagnosis. The proportion of males varied from
37% (East Asia) to 70% (Mediterranean Basin). Patients from high-income Western countries
were as much as 18 years older at the time of diagnosis. Particularly low age at the time of
diagnosis was found for South Asia (46.0), East Asia (50.0) and Sub-Saharan Africa (47.3). BMI
was 2–3 kg/m2 lower among non-Western groups. Native Swedish patients had the lowest mean
HbA1c (51.9 mmol/mol) of all groups. Low-income and non-Western groups had HbA1c
ranging from 54 to 58 mmol/mol. Systolic blood pressure was lower among non-Western
groups. Lipid profiles were less favourable among non-Western groups. There were no major
ethnic differences in terms of physical activity. Smoking rates were higher among patients from
the Middle East, North Africa and low-income Europe. A history of CVD was more common
among Western groups, but non-Western groups were 10–12 years younger at the onset of CVD.
The overall prevalence of albuminuria was approximately 14%, and there were no noteworthy
ethnic differences. College or university education was more common among non-Western
populations, but they were generally in lower income quintiles.
GLYCAEMIC CONTROL – CRUDE FIGURES
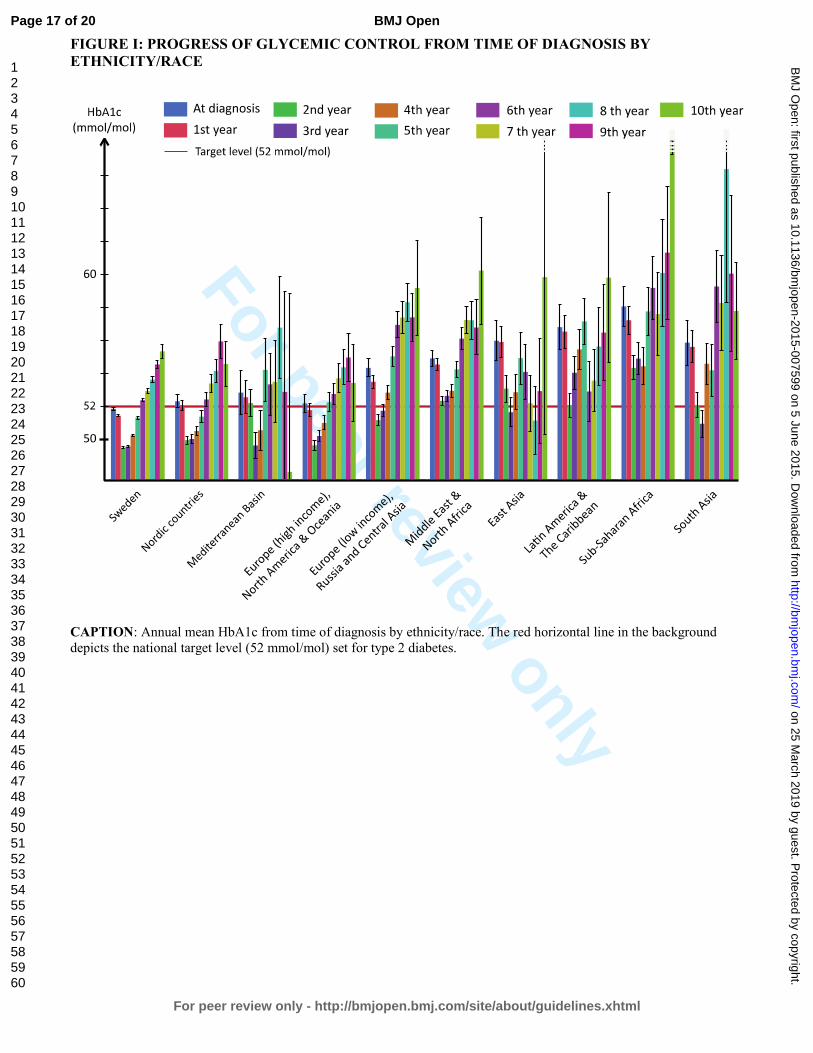
HbA1c declined during the first 1–3 years of follow-up and then increased for all ethnic groups
(Figure I). However, there were conspicuous and consistent ethnic differences in HbA1c levels
throughout the study. Swedish patients (the reference category) had the lowest mean HbA1c at
every point in time while patients from high-income Western countries had only slightly higher
levels. Patients from low-income Europe, Russia and Central Asia, as well as all non-Western
populations, had substantially higher HbA1c levels throughout the study. On average, Swedish
and other Nordic populations remained below the target level until the fifth year. Mediterranean
Basin, high-income European, North American and Oceanic populations remained below the
target level until the fourth year, whereas low-income European, Russian and Central Asian
populations remained below only until the second year. The remaining five ethnic groups did not
reach the target level at any point.
GLYCAEMIC CONTROL – ADJUSTED FIGURES
Because there was an interaction (p <0.0001) between ethnicity and glucose-lowering treatment,
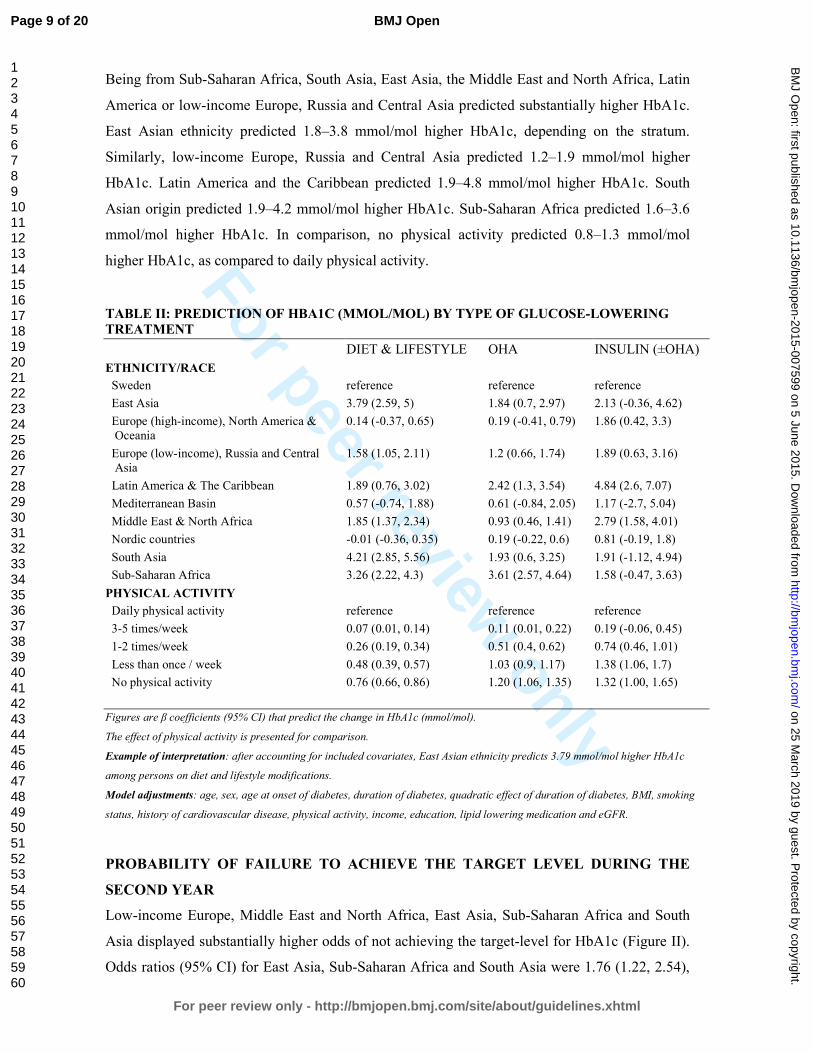
we stratified the analysis by type of treatment. Table II presents β coefficients (i.e predicted
difference in mmol/mol HbA1c) by ethnicity. To convey a sense of the impact of ethnicity as
compared to other factors, coefficients for physical activity are also presented.
Page 8 of 20
For peer review only - http://bmjopen.bmj.com/site/about/guidelines.xhtml
BMJ Open
123456789101112131415161718192021222324252627282930313233343536373839404142434445464748495051525354555657585960
on 25 March 2019 by guest. P
rotected by copyright.http://bm
jopen.bmj.com
/B
MJ O
pen: first published as 10.1136/bmjopen-2015-007599 on 5 June 2015. D
ownloaded from
For peer review only
Being from Sub-Saharan Africa, South Asia, East Asia, the Middle East and North Africa, Latin
America or low-income Europe, Russia and Central Asia predicted substantially higher HbA1c.
East Asian ethnicity predicted 1.8–3.8 mmol/mol higher HbA1c, depending on the stratum.
Similarly, low-income Europe, Russia and Central Asia predicted 1.2–1.9 mmol/mol higher
HbA1c. Latin America and the Caribbean predicted 1.9–4.8 mmol/mol higher HbA1c. South
Asian origin predicted 1.9–4.2 mmol/mol higher HbA1c. Sub-Saharan Africa predicted 1.6–3.6
mmol/mol higher HbA1c. In comparison, no physical activity predicted 0.8–1.3 mmol/mol
higher HbA1c, as compared to daily physical activity.
TABLE II: PREDICTION OF HBA1C (MMOL/MOL) BY TYPE OF GLUCOSE-LOWERING
TREATMENT
DIET & LIFESTYLE OHA INSULIN (±OHA)
ETHNICITY/RACE
Sweden reference reference reference
East Asia 3.79 (2.59, 5) 1.84 (0.7, 2.97) 2.13 (-0.36, 4.62)
Europe (high-income), North America &
Oceania
0.14 (-0.37, 0.65) 0.19 (-0.41, 0.79) 1.86 (0.42, 3.3)
Europe (low-income), Russia and Central
Asia
1.58 (1.05, 2.11) 1.2 (0.66, 1.74) 1.89 (0.63, 3.16)
Latin America & The Caribbean 1.89 (0.76, 3.02) 2.42 (1.3, 3.54) 4.84 (2.6, 7.07)
Mediterranean Basin 0.57 (-0.74, 1.88) 0.61 (-0.84, 2.05) 1.17 (-2.7, 5.04)
Middle East & North Africa 1.85 (1.37, 2.34) 0.93 (0.46, 1.41) 2.79 (1.58, 4.01)
Nordic countries -0.01 (-0.36, 0.35) 0.19 (-0.22, 0.6) 0.81 (-0.19, 1.8)
South Asia 4.21 (2.85, 5.56) 1.93 (0.6, 3.25) 1.91 (-1.12, 4.94)
Sub-Saharan Africa 3.26 (2.22, 4.3) 3.61 (2.57, 4.64) 1.58 (-0.47, 3.63)
PHYSICAL ACTIVITY
Daily physical activity reference reference reference
3-5 times/week 0.07 (0.01, 0.14) 0.11 (0.01, 0.22) 0.19 (-0.06, 0.45)
1-2 times/week 0.26 (0.19, 0.34) 0.51 (0.4, 0.62) 0.74 (0.46, 1.01)
Less than once / week 0.48 (0.39, 0.57) 1.03 (0.9, 1.17) 1.38 (1.06, 1.7)
No physical activity 0.76 (0.66, 0.86) 1.20 (1.06, 1.35) 1.32 (1.00, 1.65)
Figures are β coefficients (95% CI) that predict the change in HbA1c (mmol/mol).
The effect of physical activity is presented for comparison.
Example of interpretation: after accounting for included covariates, East Asian ethnicity predicts 3.79 mmol/mol higher HbA1c
among persons on diet and lifestyle modifications.
Model adjustments: age, sex, age at onset of diabetes, duration of diabetes, quadratic effect of duration of diabetes, BMI, smoking
status, history of cardiovascular disease, physical activity, income, education, lipid lowering medication and eGFR.
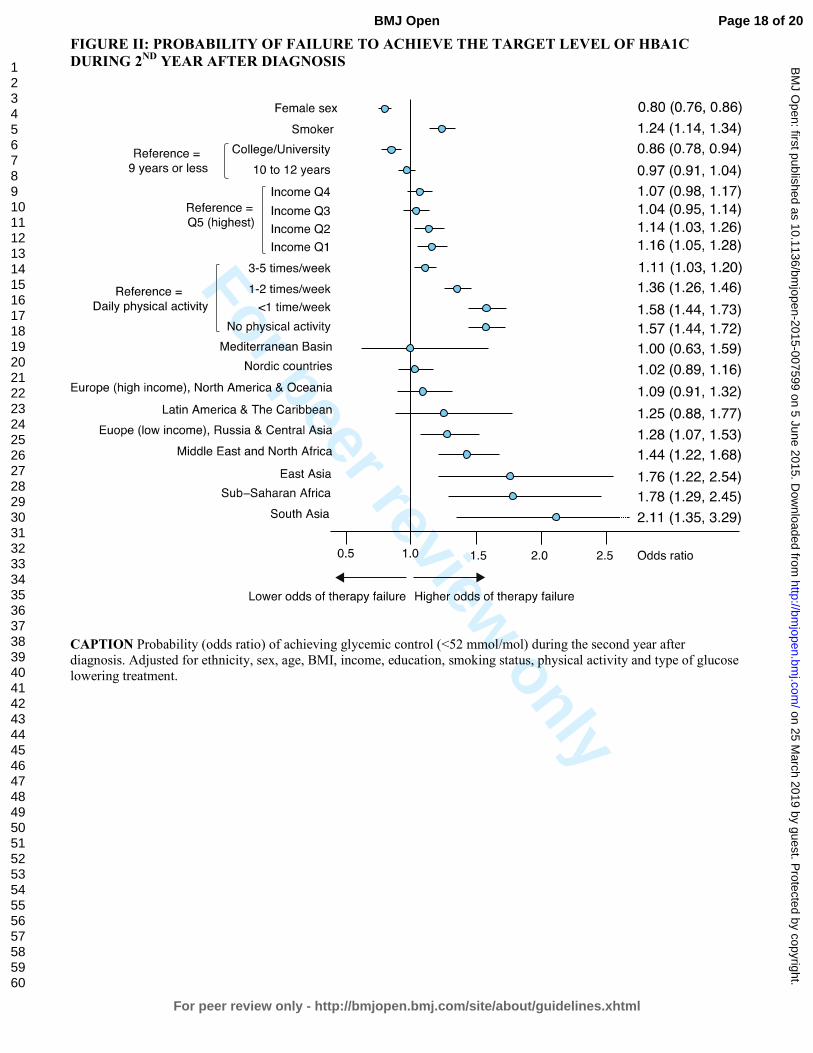
PROBABILITY OF FAILURE TO ACHIEVE THE TARGET LEVEL DURING THE
SECOND YEAR
Low-income Europe, Middle East and North Africa, East Asia, Sub-Saharan Africa and South
Asia displayed substantially higher odds of not achieving the target-level for HbA1c (Figure II).
Odds ratios (95% CI) for East Asia, Sub-Saharan Africa and South Asia were 1.76 (1.22, 2.54),
Page 9 of 20
For peer review only - http://bmjopen.bmj.com/site/about/guidelines.xhtml
BMJ Open
123456789101112131415161718192021222324252627282930313233343536373839404142434445464748495051525354555657585960
on 25 March 2019 by guest. P
rotected by copyright.http://bm
jopen.bmj.com
/B
MJ O
pen: first published as 10.1136/bmjopen-2015-007599 on 5 June 2015. D
ownloaded from
For peer review only
1.78 (1.29, 2.45) and 2.11 (1.35, 3.29), respectively. The effects of income and education were
significant, although less pronounced. Not being physically active was associated with 57%
higher odds of failure, as compared to daily physical activity.
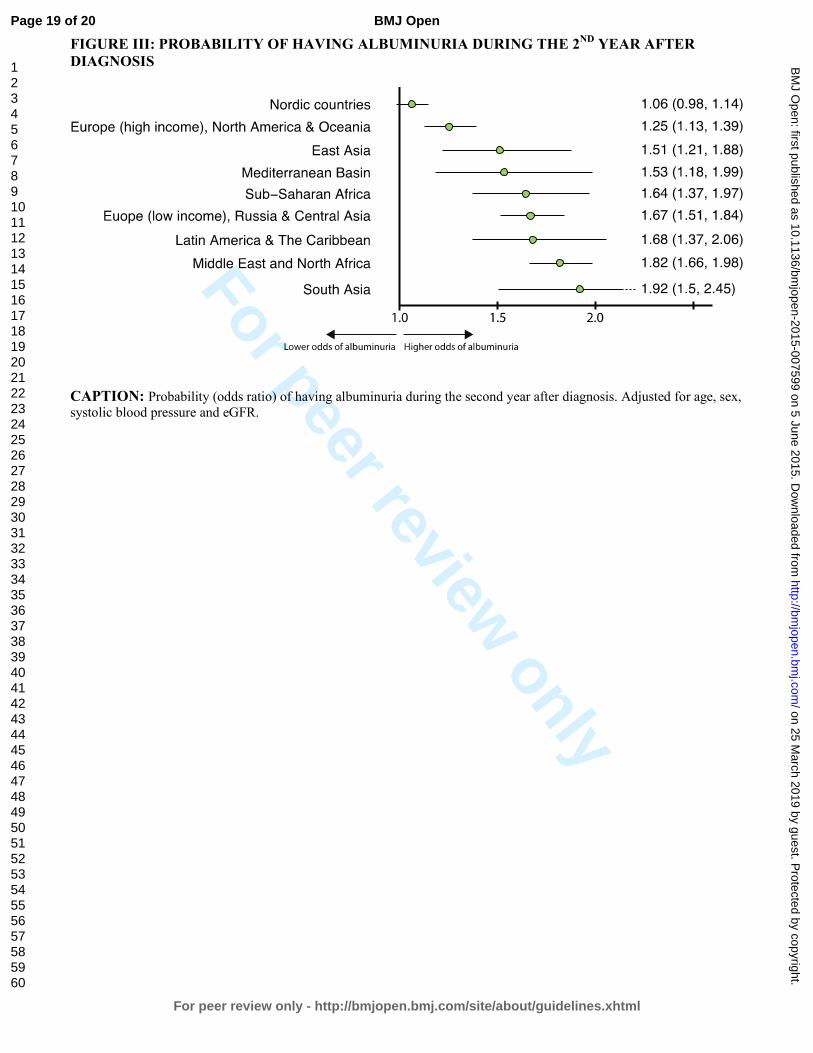
PROBABILITY OF HAVING ALBUMINURIA DURING THE SECOND YEAR
Immigrants had 6% to 92% higher odds of having albuminuria (Figure III). The risk of
albuminuria was particularly high (51% to 92% higher risk) in Non-Western and low-income
groups.
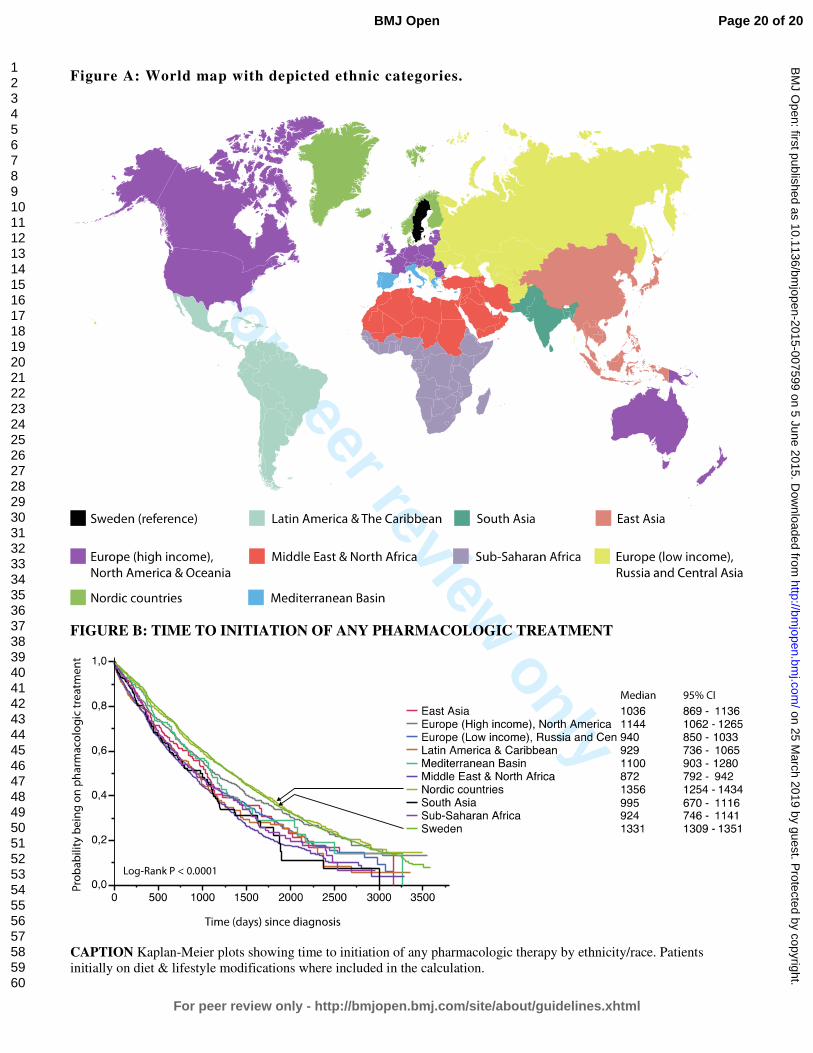
TIME TO START OF PHARMACOLOGICAL TREATMENT
Median time to start of pharmacological treatment was shorter for non-Western populations
compared with Western populations (Figure B, supplementary material).
Discussion Our study provides firm evidence that ethnicity is a strong predictor of glycaemic control, on a
par with physical activity. We also show ethnic differences in glycaemia for all major ethnic
groups and how these disparities are mirrored in another important riskmarker, i.e albuminuria.
We believe that our results call for a more individualized management and increased efforts to
eliminate ethnic inequalities.
Glucose control is a cornerstone of diabetes care. Previous studies on ethnic differences in
glycaemic control might be compromised in several ways; unequal access to—or use of—health
care, inappropriately broad categories of ethnicity, cross-sectional design, small samples and
short follow-up are frequent flaws, which might explain contradictory results [6-8].
We examined 131,935 newly diagnosed patients with type 2 diabetes, including 713,495
observations during a decade of monitoring. Our cohort contains the majority of all new cases of
type 2 diabetes in Sweden during the study period. All major ethnic groups were adequately
represented. All participants had full access to every level of health care at a minimal cost. The
Swedish social welfare system fully covers all necessary health care for individuals who do not
have an income. Thus, neither access to nor consumption of health care are likely to have
confounded our results. Swedish authorities frequently target immigrant and disadvantaged
groups in ways to increase their use of health care and promote health behaviours. This was
reflected in our study by the fact that immigrants had 30% more appointments at their clinic.
Page 10 of 20
For peer review only - http://bmjopen.bmj.com/site/about/guidelines.xhtml
BMJ Open
123456789101112131415161718192021222324252627282930313233343536373839404142434445464748495051525354555657585960
on 25 March 2019 by guest. P
rotected by copyright.http://bm
jopen.bmj.com
/B
MJ O
pen: first published as 10.1136/bmjopen-2015-007599 on 5 June 2015. D
ownloaded from
For peer review only
We noted marked ethnic differences in HbA1c both at the time of diagnosis and during follow-
up. Immigrants consistently exhibited poorer glycaemic control. High-income Western groups
remained below the target-level of HbA1c for 4–5 years after diagnosis, whereas low-income
Europe, Russia and Central Asian patients maintained the target level for an average of only 3
years. Non-Western populations had substantially higher HbA1c throughout the study and never
reached the guideline target level. Adjusted figures showed 2–5 mmol/mol higher HbA1c among
non-Western groups. These disparities translated into a 28–111% higher risk of not achieving
target level of HbA1c and a 51–92% higher risk of developing albuminuria among non-Western
groups compared with native Swedes. After the end of follow-up, 40–45% of individuals from
high-income Western countries were in glycaemic control, compared to 5%, 25% and 30% for
Sub-Saharan Africa, South Asia and the Middle East and North Africa, respectively. These
differences could not be explained by disparities in instituting glucose-lowering medications, use
or access to health care.
The risk of albuminuria was assessed in order to determine whether ethnic differences in
glycaemic control were reflected in the development of diabetes-related complications. Poor
glycaemic control is a main cause of albuminuria and renal lesions in diabetes, making
albuminuria a suitable marker for complications [30,31]. Studies have shown that African
Americans and Hispanics have a higher prevalence of albuminuria compared with Caucasians
[32]. Jolly et al reported that this was also true for Asians [33]. Our study describes the adjusted
risk of albuminuria in all major ethnic groups; immigrants, particularly those of non-Western
origin, have a substantially higher risk of developing albuminuria. This predicts a high future
risk of developing cardiovascular disease. It also suggests that ethnic differences in HbA1c
reflect actual differences in glucose-levels. Above all it underlines the need for ethnic-specific
screening and management.
The groups with the poorest glycaemic control and greatest risk of albuminuria in our study were
Asia, Sub-Saharan Africa, the Middle East & North Africa, low-income Europe, Russia and
Central Asia. They represent a large and growing proportion of the population in high-income
areas such as North American and the EU. We believe our results can be generalized to
economically developed Western countries. Clinicians and health care planners should be aware
of the challenges posed by immigrants and adjust the management accordingly. Effective
strategies to reduce these health disparities remain elusive and need to be addressed. The
problem might be further complicated by a potential interaction between ethnicity and the
effectiveness of glucose-lowering medications. Although our study was not designed to explore
Page 11 of 20
For peer review only - http://bmjopen.bmj.com/site/about/guidelines.xhtml
BMJ Open
123456789101112131415161718192021222324252627282930313233343536373839404142434445464748495051525354555657585960
on 25 March 2019 by guest. P
rotected by copyright.http://bm
jopen.bmj.com
/B
MJ O
pen: first published as 10.1136/bmjopen-2015-007599 on 5 June 2015. D
ownloaded from
For peer review only
these associations, we show that there was an effect-modification of ethnicity on glucose-
lowering therapy. A previous studies revealed ethnic differences in the efficacy of insulin, [34]
but there are considerable gaps in the knowledge that is currently available on this topic.
LIMITATIONS
It is important to consider the implications of the use of HbA1c when making ethnic
comparisons. HbA1c is not a direct measure of glycaemia and might be influenced by factors
that are independent of blood glucose levels. Studies have shown that African Americans
average approximately 0.20 percentage points higher HbA1c than Caucasian Americans [35,36].
However, the design of these studies differs from ours. Furthermore, African Americans descend
largely from West Africa. Africans exhibit the greatest genetic diversity of all human
populations [37]. A recent study examined two African populations and showed that their HbA1c
differed; lower levels were found for the East African population [38]. The African population in
our study descends largely from East Africa. Thus, we believe that our results for Sub-Saharan
Africans and the remaining ethnicities should be interpreted as reflecting differences in
glycaemic control. This is underscored by the fact that Sub-Saharan Africa, as well as the
remaining non-Western populations, in our study had considerably higher risk of developing the
glycaemia-related complication albuminuria.
CONCLUSIONS
Despite earlier start of glucose-lowering therapies, full access to health care at a minimal cost
and more appointments, immigrants—particularly those of non-Western origin—with type 2
diabetes have substantially higher HbA1c, greater risk of therapy failure and higher probability
of developing albuminuria than native Swedes. The impact of ethnicity on glycaemic control is
greater than the effect of income and educational level, and on a par with the effect of physical
activity. Thus, ethnicity is integral glycaemic control and needs to be carefully considered if
diabetes care is to improve.
Acknowledgements
We would like to thank the various regional NDR coordinators, as well as contributing nurses,
physicians, and patients. The Swedish Diabetes Association, and the Swedish Society of
Diabetology support the NDR. We would also like to thank George Lappas (University of
Gothenburg) and Szilard Nemes (University of Gothenburg) for their valuable statistical guidance.
Page 12 of 20
For peer review only - http://bmjopen.bmj.com/site/about/guidelines.xhtml
BMJ Open
123456789101112131415161718192021222324252627282930313233343536373839404142434445464748495051525354555657585960
on 25 March 2019 by guest. P
rotected by copyright.http://bm
jopen.bmj.com
/B
MJ O
pen: first published as 10.1136/bmjopen-2015-007599 on 5 June 2015. D
ownloaded from
For peer review only
Funding
This study was funded by the Swedish National Diabetes Register. The Swedish Association of
Local Authorities and Regions funds the NDR. Additional support: the Swedish Heart and Lung
Foundation, and the Swedish Research Council (SIMSAM) (grants number 2013-5187 and 2013-
4236).
Contributors ARa, AMS, ARo, BZ, BE and SG contributed to the conception and design of the study. ARa
performed statistical analyses and wrote the first draft of the article. ARa, AMS, ARo, BZ, BE and
SG contributed to the interpretation of data. ARa, AMS, ARo, BZ, BE and SG contributed to
critical revision of the article for important intellectual content.
Disclaimer The results and views of the study represent those of the authors only and not necessarily the
official position of the Swedish Medical Products Agency, at which BZ is employed.
Conflicts of interest There are no conflicts of interest to be reported (ARa, AMS, ARo, BZ, BE, SG).
Page 13 of 20
For peer review only - http://bmjopen.bmj.com/site/about/guidelines.xhtml
BMJ Open
123456789101112131415161718192021222324252627282930313233343536373839404142434445464748495051525354555657585960
on 25 March 2019 by guest. P
rotected by copyright.http://bm
jopen.bmj.com
/B
MJ O
pen: first published as 10.1136/bmjopen-2015-007599 on 5 June 2015. D
ownloaded from
For peer review only
REFERENCES
1. Holman RR, Paul SK, Bethel MA, Matthews DR, Neil HAW (2008) 10-year follow-up of intensive
glucose control in type 2 diabetes. The New England journal of medicine 359: 1577–1589.
doi:10.1056/NEJMoa0806470.
2. ADVANCE Collaborative Group, Patel A, MacMahon S, Chalmers J, Neal B, et al. (2008) Intensive
blood glucose control and vascular outcomes in patients with type 2 diabetes. The New England
journal of medicine 358: 2560–2572. doi:10.1056/NEJMoa0802987.
3. Emerging Risk Factors C, Sarwar N, Gao P, Seshasai SR, Gobin R, et al. (2010) Diabetes mellitus,
fasting blood glucose concentration, and risk of vascular disease: a collaborative meta-analysis of 102
prospective studies. 375: 2215–2222. Available: http://www.ncbi.nlm.nih.gov/pubmed/20609967.
4. Emerging Risk Factors C, Seshasai SR, Kaptoge S, Thompson A, Di Angelantonio E, et al. (2011)
Diabetes mellitus, fasting glucose, and risk of cause-specific death. 364: 829–841. Available:
http://www.ncbi.nlm.nih.gov/pubmed/21366474.
5. Lind M, Bounias I, Olsson M, Gudbjörnsdottir S, Svensson A-M, et al. (2011) Glycaemic control and
incidence of heart failure in 20,985 patients with type 1 diabetes: an observational study. Lancet 378:
140–146. doi:10.1016/S0140-6736(11)60471-6.
6. Fan T, Koro CE, Fedder DO, Bowlin SJ (2006) Ethnic disparities and trends in glycemic control
among adults with type 2 diabetes in the U.S. from 1988 to 2002. Diabetes care 29: 1924–1925.
doi:10.2337/dc05-2238.
7. Harris MI, Eastman RC, Cowie CC, Flegal KM, Eberhardt MS (1999) Racial and ethnic differences
in glycemic control of adults with type 2 diabetes. 22: 403–408. Available:
http://www.ncbi.nlm.nih.gov/pubmed/10097918.
8. Davis TM, Cull CA, Holman RR, U.K. Prospective Diabetes Study (UKPDS) Group (2001)
Relationship between ethnicity and glycemic control, lipid profiles, and blood pressure during the
first 9 years of type 2 diabetes: U.K. Prospective Diabetes Study (UKPDS 55). Diabetes care 24: 1167–1174.
9. Information UDOP (2013) International migration and development. United Nations Press Release.
10. Ramachandran A, Ma RCW, Snehalatha C (2010) Diabetes in Asia. Lancet 375: 408–418.
doi:10.1016/S0140-6736(09)60937-5.
11. Shai I, Jiang R, Manson JE, Stampfer MJ, Willett WC, et al. (2006) Ethnicity, obesity, and risk of
type 2 diabetes in women: a 20-year follow-up study. 29: 1585–1590. Available:
http://www.ncbi.nlm.nih.gov/pubmed/16801583.
12. Richard Sicree JSPZ (2013) The Global Burden of Diabetes and Impaired Glucose Tolerance.
International Diabetes Federation.
13. Lutsey PL, Pereira MA, Bertoni AG, Kandula NR, Jacobs DRJ (2010) Interactions between race/ethnicity and anthropometry in risk of incident diabetes: the multi-ethnic study of
atherosclerosis. 172: 197–204. Available: http://www.ncbi.nlm.nih.gov/pubmed/20570825.
14. Narayan KM, Boyle JP, Thompson TJ, Sorensen SW, Williamson DF (2003) Lifetime risk for
diabetes mellitus in the United States. 290: 1884–1890. Available:
http://www.ncbi.nlm.nih.gov/pubmed/14532317.
15. Davis K, Ballreich J (2014) Equitable access to care--how the United States ranks internationally. The New England journal of medicine 371: 1567–1570. doi:10.1056/NEJMp1406707.
Page 14 of 20
For peer review only - http://bmjopen.bmj.com/site/about/guidelines.xhtml
BMJ Open
123456789101112131415161718192021222324252627282930313233343536373839404142434445464748495051525354555657585960
on 25 March 2019 by guest. P
rotected by copyright.http://bm
jopen.bmj.com
/B
MJ O
pen: first published as 10.1136/bmjopen-2015-007599 on 5 June 2015. D
ownloaded from
For peer review only
16. Billing A (n.d.) Health assessment of newly immigrated individuals. Available:
http://www.folkhalsomyndigheten.se/pagefiles/12920/halsoundersokningar-nyanlanda-
invandrare.pdf.
17. Haglind P, editor (2012) Tobacco prevention among immigrants. 2nd ed. Institute of Population Health. Available: http://www.folkhalsomyndigheten.se/documents/livsvillkor-
levnadsvanor/andts/tobak/uppdrag/nationella-tobaksuppdraget/samverkansprojektet/slutrapport-
tobaksprevention-invandrargrupper.pdf.
18. Lind M, Svensson A-M, Kosiborod M, Gudbjörnsdottir S, Pivodic A, et al. (2014) Glycemic Control
and Excess Mortality in Type 1 Diabetes. The New England journal of medicine 371: 1972–1982.
doi:10.1056/NEJMoa1408214.
19. Gudbjornsdottir S, Cederholm J, Nilsson PM, Eliasson B, Steering Committee of the Swedish
National Diabetes R (2003) The National Diabetes Register in Sweden: an implementation of the St.
Vincent Declaration for Quality Improvement in Diabetes Care. 26: 1270–1276. Available:
http://www.ncbi.nlm.nih.gov/pubmed/12663609.
20. Ekstrom N, Schioler L, Svensson AM, Eeg-Olofsson K, Miao Jonasson J, et al. (2012) Effectiveness
and safety of metformin in 51 675 patients with type 2 diabetes and different levels of renal function:
a cohort study from the Swedish National Diabetes Register. 2. Available: http://www.ncbi.nlm.nih.gov/pubmed/22798258.
21. Cederholm J, Gudbjörnsdottir S, Eliasson B, Zethelius B, Eeg-Olofsson K, et al. (2012) Blood
pressure and risk of cardiovascular diseases in type 2 diabetes: further findings from the Swedish
National Diabetes Register (NDR-BP II). J Hypertens 30: 2020–2030. Available:
http://www.ncbi.nlm.nih.gov/pubmed/22871895.
22. Lind M, Olsson M, Rosengren A, Svensson AM, Bounias I, et al. (2012) The relationship between
glycaemic control and heart failure in 83,021 patients with type 2 diabetes. Diabetologia 55: 2946–
2953. Available: http://www.ncbi.nlm.nih.gov/pubmed/22895807.
23. Rotimi CN, Jorde LB (2010) Ancestry and disease in the age of genomic medicine. The New England journal of medicine 363: 1551–1558. doi:10.1056/NEJMra0911564.
24. Hoelzel W, Weykamp C, Jeppsson J-O, Miedema K, Barr JR, et al. (2004) IFCC reference system for
measurement of hemoglobin A1c in human blood and the national standardization schemes in the United States, Japan, and Sweden: a method-comparison study. Clin Chem 50: 166–174.
doi:10.1373/clinchem.2003.024802.
25. Ludvigsson JF, Andersson E, Ekbom A, Feychting M, Kim J-L, et al. (2011) External review and
validation of the Swedish national inpatient register. BMC Public Health 11: 450. doi:10.1186/1471-
2458-11-450.
26. Ingelsson E, Arnlöv J, Sundström J, Lind L (2005) The validity of a diagnosis of heart failure in a
hospital discharge register. Eur J Heart Fail 7: 787–791. doi:10.1016/j.ejheart.2004.12.007.
27. Diggle PJ HPLK-YZS (2002) Analysis of longitudinal data. Oxford University Press 2nd ed.
28. Egede LE, Gebregziabher M, Hunt KJ, Axon RN, Echols C, et al. (2011) Regional, geographic, and racial/ethnic variation in glycemic control in a national sample of veterans with diabetes. Diabetes
care 34: 938–943. doi:10.2337/dc10-1504.
29. Weinstock RS, Teresi JA, Goland R, Izquierdo R, Palmas W, et al. (2011) Glycemic control and health disparities in older ethnically diverse underserved adults with diabetes: five-year results from
the Informatics for Diabetes Education and Telemedicine (IDEATel) study. Diabetes care 34: 274–
279. doi:10.2337/dc10-1346.
Page 15 of 20
For peer review only - http://bmjopen.bmj.com/site/about/guidelines.xhtml
BMJ Open
123456789101112131415161718192021222324252627282930313233343536373839404142434445464748495051525354555657585960
on 25 March 2019 by guest. P
rotected by copyright.http://bm
jopen.bmj.com
/B
MJ O
pen: first published as 10.1136/bmjopen-2015-007599 on 5 June 2015. D
ownloaded from
For peer review only
30. Mogensen CE, Poulsen PL (2004) Microalbuminuria, glycemic control, and blood pressure predicting
outcome in diabetes type 1 and type 2. Kidney Int Suppl 66: S40–S41. doi:10.1111/j.1523-
1755.2004.09210.x.
31. Levin SR, Coburn JW, Abraira C, Henderson WG, Colwell JA, et al. (2000) Effect of intensive glycemic control on microalbuminuria in type 2 diabetes. Veterans Affairs Cooperative Study on
Glycemic Control and Complications in Type 2 Diabetes Feasibility Trial Investigators. Diabetes care
23: 1478–1485.
32. Sinha SK, Shaheen M, Rajavashisth TB, Pan D, Norris KC, et al. (2014) Association of
race/ethnicity, inflammation, and albuminuria in patients with diabetes and early chronic kidney
disease. Diabetes care 37: 1060–1068. doi:10.2337/dc13-0013.
33. Jolly SE, Burrows NR, Chen S-C, Li S, Jurkovitz CT, et al. (2010) Racial and ethnic differences in
albuminuria in individuals with estimated GFR greater than 60 mL/min/1.73 m(2): results from the
Kidney Early Evaluation Program (KEEP). Am J Kidney Dis 55: S15–S22.
doi:10.1053/j.ajkd.2009.09.034.
34. Davidson JA, Wolffenbuttel BH, Arakaki RF, Caballero AE, Jiang HH, et al. (2013) Impact of
race/ethnicity on efficacy and safety of two starter insulin regimens in patients with type 2 diabetes: a
posthoc analysis of the DURABLE trial. Ethn Dis 23: 393–400.
35. Ziemer DC, Kolm P, Weintraub WS, Vaccarino V, Rhee MK, et al. (2010) Glucose-independent,
black-white differences in hemoglobin A1c levels: a cross-sectional analysis of 2 studies. Ann Intern
Med 152: 770–777. doi:10.7326/0003-4819-152-12-201006150-00004.
36. Herman WH, Ma Y, Uwaifo G, Haffner S, Kahn SE, et al. (2007) Differences in A1C by race and
ethnicity among patients with impaired glucose tolerance in the Diabetes Prevention Program.
Diabetes care 30: 2453–2457. doi:10.2337/dc06-2003.
37. Tishkoff SA, Reed FA, Friedlaender FR, Ehret C, Ranciaro A, et al. (2009) The genetic structure and
history of Africans and African Americans. Science 324: 1035–1044. doi:10.1126/science.1172257.
38. Hare MJL, Magliano DJ, Zimmet PZ, Söderberg S, Joonas N, et al. (2013) Glucose-independent ethnic differences in HbA1c in people without known diabetes. Diabetes care 36: 1534–1540.
doi:10.2337/dc12-1210.
Page 16 of 20
For peer review only - http://bmjopen.bmj.com/site/about/guidelines.xhtml
BMJ Open
123456789101112131415161718192021222324252627282930313233343536373839404142434445464748495051525354555657585960
on 25 March 2019 by guest. P
rotected by copyright.http://bm
jopen.bmj.com
/B
MJ O
pen: first published as 10.1136/bmjopen-2015-007599 on 5 June 2015. D
ownloaded from
For peer review only
FIGURE I: PROGRESS OF GLYCEMIC CONTROL FROM TIME OF DIAGNOSIS BY
ETHNICITY/RACE
CAPTION: Annual mean HbA1c from time of diagnosis by ethnicity/race. The red horizontal line in the background
depicts the national target level (52 mmol/mol) set for type 2 diabetes.
Page 17 of 20
For peer review only - http://bmjopen.bmj.com/site/about/guidelines.xhtml
BMJ Open
123456789101112131415161718192021222324252627282930313233343536373839404142434445464748495051525354555657585960
on 25 March 2019 by guest. P
rotected by copyright.http://bm
jopen.bmj.com
/B
MJ O
pen: first published as 10.1136/bmjopen-2015-007599 on 5 June 2015. D
ownloaded from
For peer review only
FIGURE II: PROBABILITY OF FAILURE TO ACHIEVE THE TARGET LEVEL OF HBA1C
DURING 2ND YEAR AFTER DIAGNOSIS
CAPTION Probability (odds ratio) of achieving glycemic control (<52 mmol/mol) during the second year after
diagnosis. Adjusted for ethnicity, sex, age, BMI, income, education, smoking status, physical activity and type of glucose
lowering treatment.
Page 18 of 20
For peer review only - http://bmjopen.bmj.com/site/about/guidelines.xhtml
BMJ Open
123456789101112131415161718192021222324252627282930313233343536373839404142434445464748495051525354555657585960
on 25 March 2019 by guest. P
rotected by copyright.http://bm
jopen.bmj.com
/B
MJ O
pen: first published as 10.1136/bmjopen-2015-007599 on 5 June 2015. D
ownloaded from
For peer review only
FIGURE III: PROBABILITY OF HAVING ALBUMINURIA DURING THE 2ND YEAR AFTER
DIAGNOSIS
CAPTION: Probability (odds ratio) of having albuminuria during the second year after diagnosis. Adjusted for age, sex,
systolic blood pressure and eGFR.
Page 19 of 20
For peer review only - http://bmjopen.bmj.com/site/about/guidelines.xhtml
BMJ Open
123456789101112131415161718192021222324252627282930313233343536373839404142434445464748495051525354555657585960
on 25 March 2019 by guest. P
rotected by copyright.http://bm
jopen.bmj.com
/B
MJ O
pen: first published as 10.1136/bmjopen-2015-007599 on 5 June 2015. D
ownloaded from
For peer review only
Figure A: World map with depicted ethnic categories.
FIGURE B: TIME TO INITIATION OF ANY PHARMACOLOGIC TREATMENT
CAPTION Kaplan-Meier plots showing time to initiation of any pharmacologic therapy by ethnicity/race. Patients
initially on diet & lifestyle modifications where included in the calculation.
Page 20 of 20
For peer review only - http://bmjopen.bmj.com/site/about/guidelines.xhtml
BMJ Open
123456789101112131415161718192021222324252627282930313233343536373839404142434445464748495051525354555657585960
on 25 March 2019 by guest. P
rotected by copyright.http://bm
jopen.bmj.com
/B
MJ O
pen: first published as 10.1136/bmjopen-2015-007599 on 5 June 2015. D
ownloaded from
For peer review only
Impact of Ethnicity on Progress of Glycaemic Control in 131,935 Newly Diagnosed Patients with Type 2 Diabetes: a
Nationwide Observational Study from the Swedish National Diabetes Register
Journal: BMJ Open
Manuscript ID: bmjopen-2015-007599.R1
Article Type: Research
Date Submitted by the Author: 31-Mar-2015
Complete List of Authors: Rawshani, Araz; Institute of Medicine, Department of Molecular and Clinical Medicine Svensson, Ann-Marie; Centre of Registers in Region Västra Götaland, Rosengren, Annika; University of Gothenburg, Department of Medicine Zethelius, Bjorn.; Uppsala University, Public Health/Geriatrics Eliasson, Björn; University of Gothenburg, Department of Medicine Gudbjörnsdottir, Soffia; University of Gothenburg, Department of Medicine
<b>Primary Subject Heading</b>:
Diabetes and endocrinology
Secondary Subject Heading: Health policy, Epidemiology, Global health
Keywords:
DIABETES & ENDOCRINOLOGY, Diabetic nephropathy & vascular disease < DIABETES & ENDOCRINOLOGY, General diabetes < DIABETES & ENDOCRINOLOGY, EPIDEMIOLOGY, Diabetes & endocrinology < INTERNAL MEDICINE, Adult nephrology < NEPHROLOGY
For peer review only - http://bmjopen.bmj.com/site/about/guidelines.xhtml
BMJ Open on 25 M
arch 2019 by guest. Protected by copyright.
http://bmjopen.bm
j.com/
BM
J Open: first published as 10.1136/bm
jopen-2015-007599 on 5 June 2015. Dow
nloaded from
For peer review only
1
Impact of Ethnicity on Progress of Glycaemic Control in 131,935
Newly Diagnosed Patients with Type 2 Diabetes: a Nationwide
Observational Study from the Swedish National Diabetes Register.
Araz Rawshani1, 2
Ann-Marie Svensson1, 2, 3
Annika Rosengren1, 2
Björn Zethelius4, 5
Björn Eliasson1, 2, 3
Soffia Gudbjornsdottir1, 2, 3
1 Department of Molecular and Clinical Medicine, University of Gothenburg, Gothenburg, Sweden
2 Sahlgrenska University Hospital, Gothenburg, Sweden
3 National Diabetes Register, Centre of Registers, Gothenburg, Sweden
4 Department of Public Health and Caring Sciences/Geriatrics, Uppsala University, Uppsala,
Sweden
5 Medical Products Agency, Epidemiology, Uppsala, Sweden
Corresponding author
Araz Rawshani
National Diabetes Register, Centre of Registers
Västra Götaland Region, 41345 Gothenburg, Sweden
ABSTRACT WORD COUNT 270
MAIN TEXT WORD COUNT 3092
TABLES 2
FIGURES 3
SUPPLEMENTARY MATERIAL 2 Figures
REFERENCES 53
Page 1 of 29
For peer review only - http://bmjopen.bmj.com/site/about/guidelines.xhtml
BMJ Open
123456789101112131415161718192021222324252627282930313233343536373839404142434445464748495051525354555657585960
on 25 March 2019 by guest. P
rotected by copyright.http://bm
jopen.bmj.com
/B
MJ O
pen: first published as 10.1136/bmjopen-2015-007599 on 5 June 2015. D
ownloaded from

For peer review only
2
Abstract
Objectives: Studies on ethnic disparities in glycaemic control have been contradictory and
compromised by excessively broad categories of ethnicity and inadequate adjustment for
socioeconomic differences. We aimed to study the effect of ethnicity on glycaemic control in a
large cohort of patients with type 2 diabetes.
Setting: We used nationwide data (mainly from primary care) from the Swedish National Diabetes
Register (2002-2011) to identify patients with newly diagnosed (within 12 months) type 2 diabetes.
Participants: We included 131,935 patients (with 713,495 appointments), representing 10 ethnic groups,
who were followed up to 10 years.
Primary and secondary outcome measures: Progress of HbA1c for up to 10 years was examined.
Mixed models were used to correlate ethnicity with HbA1c (mmol/mol). The effect of glycaemic
disparities was examined by assessing the risk of developing albuminuria. The impact of ethnicity
was compared to that of income, education and physical activity.
Results: Immigrants, particularly those of non-Western origin, received glucose-lowering therapy
earlier, had 30% more appointments but displayed poorer glycaemic control (2–5 mmol/mol higher
HbA1c than native Swedes). Probability of therapy failure was 28–111% higher for non-Western
groups than for native Swedes. High-income Western groups remained below the target-level of
HbA1c for 4–5 years, whereas non-Western populations never reached the target level. These
disparities translated into 51–92% higher risk of developing albuminuria. The impact of ethnicity
was greater than the effect of income and education, and equal to the effect of physical activity.
Conclusions: Despite earlier pharmacological treatment and more frequent appointments,
immigrants of non-Western origin display poorer glycaemic control and this is mirrored in a higher
risk of developing albuminuria.
Page 2 of 29
For peer review only - http://bmjopen.bmj.com/site/about/guidelines.xhtml
BMJ Open
123456789101112131415161718192021222324252627282930313233343536373839404142434445464748495051525354555657585960
on 25 March 2019 by guest. P
rotected by copyright.http://bm
jopen.bmj.com
/B
MJ O
pen: first published as 10.1136/bmjopen-2015-007599 on 5 June 2015. D
ownloaded from
For peer review only
3
Strengths and limitations of this study
• To our knowledge, this is the largest study on ethnic differences in progress of glycaemic control.
We included 131,935 patients (with 713,495 appointments) who were followed up to 10 years.
• All major ethnic groups in the world were represented in this study cohort and they had fully equal
access to, and use of, health care, regardless of ethnic and socioeconomic background. Indeed, we
report that immigrants had higher consumption of health care. This contrasts against previous
studies, which have been hampered by inappropriately broad categories of ethnicity, cross-sectional
design, small samples, short follow-up and unequal access to or consumption of health care.
• The longitudinal design, with at least annually updated information on all time-varying variables,
allow for reliable estimates of the effect of ethnicity. We could control adequately for
socioeconomic, demographic and health-related confounders.
• The main findings (immigrants, particularly those of non-Western origin, display poor glycaemic
control and have a considerably higher risk of developing albuminuria) indicate that much can be
done to improve diabetes care for a large proportion of the diabetic population in Western countries.
• When extrapolating our results, it need be taken into account that these ethnic differences could be
expected in an equitable health care system. This should be taken into consideration in countries
were access to health care is not equitable.
Page 3 of 29
For peer review only - http://bmjopen.bmj.com/site/about/guidelines.xhtml
BMJ Open
123456789101112131415161718192021222324252627282930313233343536373839404142434445464748495051525354555657585960
on 25 March 2019 by guest. P
rotected by copyright.http://bm
jopen.bmj.com
/B
MJ O
pen: first published as 10.1136/bmjopen-2015-007599 on 5 June 2015. D
ownloaded from
For peer review only
4
Introduction
Tight glucose control in type 2 diabetes has shown long-term beneficial effects on microvascular
complications, cardiovascular disease and mortality [1-5]. Studies of ethnic disparities in glycaemic
control have been contradictory [6-9]. They have, however, been hampered by inappropriately
broad categories of ethnicity, cross-sectional design, small samples, short follow-up and unequal
access to—or consumption of—health care. There are no reliable estimates of the true effect of
ethnicity on glycaemic control.
This issue is important in Western societies that are becoming more ethnically diverse due to
accelerated migration from other areas of the world [10]. The ethnic admixture of Western societies
is currently far more diverse than the risk estimate tools of clinicians are prepared to handle.
Immigrants may be at particular risk due to genetic susceptibility to insulin resistance [11,12],
difficult transitional phases, and rapid changes in diet and lifestyle [13], as well as linguistic,
cultural and financial barriers to obtaining proper health care [14,15].
Sweden is an ethnically heterogeneous country in which all inhabitants enjoy access to every level
of health care at a minimal cost [16]. Immigrants are targeted in an effort to promote healthy
lifestyles and consumption of health care [17,18]. The great majority of Swedes with type 2 diabetes
are included in the Swedish National Diabetes Register, which we used to analyse the impact of
ethnicity on the progress of glycaemic control and on albuminuria as a marker for diabetic
complications.
Methods
Data sources
Swedish authorities manage several nationwide registers, which may be linked through the unique
personal identification number assigned to every Swede. The National Diabetes Register (NDR) has
been described previously [19]. It was launched in 1996 as a care giver tool for local quality assurance
purposes and as a feed-back tool in diabetes care [20]. Data provided by nurses and physicians trained in
register procedures are obtained at visits in outpatient clinics of hospitals and primary care clinics.
Clinical information and various measurements are updated at least once a year.
Patients with at least one entry in the NDR from 1 January 2002 to 31 December 2011 were
included if they had been reported within 12 months of the date of diagnosis. Ninety-six per cent of
the subjects had been diagnosed with type 2 diabetes on the basis of a clinical assessment. The
remainder were included on the basis of the following definition: age 40 or older at the time of
Page 4 of 29
For peer review only - http://bmjopen.bmj.com/site/about/guidelines.xhtml
BMJ Open
123456789101112131415161718192021222324252627282930313233343536373839404142434445464748495051525354555657585960
on 25 March 2019 by guest. P
rotected by copyright.http://bm
jopen.bmj.com
/B
MJ O
pen: first published as 10.1136/bmjopen-2015-007599 on 5 June 2015. D
ownloaded from
For peer review only
5
diagnosis and treated either with diet only, diet combined with oral hypoglycaemic agents (OHA),
or a combination of OHA combined and insulin. This definition has been validated and used
previously [21-23].
Measures
Data on annual income in Swedish kronor, highest educational level regardless of country of
domicile and country of birth (used as proxy for ethnicity/race) were obtained from the
Longitudinal Integration Database for Health Insurance and Labour Market Studies, which is an
official database administered by the Swedish National Board of Health and Welfare. Educational
level was stratified into lower (9 years or less—the length of compulsory education in Sweden),
intermediate (10-12 years—upper secondary) and higher (college or university). Income was
stratified into quintiles (Q1 to Q5), with the highest (Q5) being the reference. Ethnic categories
were based on an appraisal of ancestry and geography, [24] with the exception of the fact that
Nordic countries were classified separately in the present study for the purpose of examining
whether immigrants from neighbouring countries also exhibited differences. Native Swedish
patients served as the reference group. Sixty-two individuals were excluded because information
about their country of birth was unavailable.
Glycaemic control was measured as HbA1c. Analyses were quality assured nationwide by regular
calibration with the HPLC Mono-S method, and then converted to mmol/mol [International
Federation of Clinical Chemistry (IFCC)] [25]. Microalbuminuria was defined as two positive
results for three urine samples obtained within 1 year, with positivity defined as an
albumin:creatinine ratio of 3 to 30 mg per millimole (approximately 30 to 300 mg per gram) or a
urinary albumin clearance of 20 to 200 µg per minute (20 to 300 mg per liter). Macroalbuminuria
was defined as an albumin:creatinine ratio of more than 30 mg per millimole (close to 300 or more
mg per gram) or a urinary albumin clearance of more than 200 µg per minute (>300 mg per liter).
BMI was calculated as weight in kilograms divided by height in metres squared. Systolic blood
pressure was the mean value of two supine readings (Korotkoff 1–5) with a cuff of appropriate size
and after at least 5 minutes of rest. LDL, HDL and total cholesterol were measured in mmol/L.
Physical activity was rated from 1 (never) to 5 (daily). Smoking was coded as present if the patient
currently smoked. Use of lipid lowering medications was dichotomized. Glucose-lowering
treatment was categorized as diet and lifestyle modifications, oral hypoglycaemic agents (OHAs),
insulin, or insulin and OHAs. Antihypertensive medication was dichotomized. Estimated
glomerular filtration rate (eGFR) was calculated by the MDRD equation [26]. A history of
cardiovascular disease (CVD) was defined as previous hospitalization due to acute myocardial
Page 5 of 29
For peer review only - http://bmjopen.bmj.com/site/about/guidelines.xhtml
BMJ Open
123456789101112131415161718192021222324252627282930313233343536373839404142434445464748495051525354555657585960
on 25 March 2019 by guest. P
rotected by copyright.http://bm
jopen.bmj.com
/B
MJ O
pen: first published as 10.1136/bmjopen-2015-007599 on 5 June 2015. D
ownloaded from
For peer review only
6
infarction or stroke (ICD-10, I21, I60–I69; ICD-9, 410, 430–434, 436–438) according to the
Swedish National Discharge Register, which is a reliable validated method [27,28]. All time-
varying variables are updated in the NDR following each appointment.
Analyses and statistics
Baseline
The first observation was used to present characteristics at time of diagnosis (within 12 months).
Continuous variables are reported as means, percentages and quintiles. T tests were used for
continuous variables with native Swedes as the reference group. Chi-square tests were used for
categorical variables. A p-value <0.01 was considered statistically significant but multiple
testing should be considered when interpreting the results.
Glycaemic control
Progress of glycaemic control was calculated as an unadjusted annual mean in relation to
ethnicity. Adjusted figures were calculated using linear regression, to estimate differences in
mmol/mol. Logistic regression was used to estimate the probability of achieving glycaemic
control (i.e. reaching target-level HbA1c <52 mmol/mol) during the second year after diagnosis.
To examine whether hypothesized differences in glycaemia is reflected on the risk of
complications, we calculated the probability of developing albuminuria during the second year
after diagnosis.
Mixed effect models were used to account for repeated measurements on the same unit [29-31].
HbA1c was centered around the mean.
Kaplan-Meier calculations were used to examine whether time to pharmacological treatment
differed among ethnic groups. This was done to examine whether differences in HbA1c could be
explained by disparities in use of medications.
Analyses were performed with SAS version 9.4 (SAS Institute, USA) and R (R Foundation for
Statistical Computing).
Ethics
The study was approved by the regional ethical review board at the University of Gothenburg,
Gothenburg, Sweden. All patients give informed consent before being included in the NDR.
Page 6 of 29
For peer review only - http://bmjopen.bmj.com/site/about/guidelines.xhtml
BMJ Open
123456789101112131415161718192021222324252627282930313233343536373839404142434445464748495051525354555657585960
on 25 March 2019 by guest. P
rotected by copyright.http://bm
jopen.bmj.com
/B
MJ O
pen: first published as 10.1136/bmjopen-2015-007599 on 5 June 2015. D
ownloaded from
For peer review only
7
Results We included 131,935 individuals with newly diagnosed type 2 diabetes. A total of 713,495
appointments were registered. All major ethnic groups were represented in the study (Figure A,
supplementary material). A total of 82.7% of the study population consisted of native Swedes.
Immigrants had more appointments per year. Non-Western immigrants in particular had almost
30% more appointments (Table I).
Page 7 of 29
For peer review only - http://bmjopen.bmj.com/site/about/guidelines.xhtml
BMJ Open
123456789101112131415161718192021222324252627282930313233343536373839404142434445464748495051525354555657585960
on 25 March 2019 by guest. P
rotected by copyright.http://bm
jopen.bmj.com
/B
MJ O
pen: first published as 10.1136/bmjopen-2015-007599 on 5 June 2015. D
ownloaded from
For peer review only
8
TABLE I - CHARACTERISTICS OF 131'935 INDIVIDUALS WITH NEWLY DIAGNOSED TYPE 2 DIABETES BY ETHNICITY/RACE
All
Sw
eden
Nord
ic
cou
ntr
ies
Euro
pe
(hig
h
inco
me)
,
Nort
h
Am
eric
a an
d
Oce
ania
Med
iter
ranea
n B
asi
n
Euro
pe
(low
inco
me)
,
Russ
ia a
nd
Cen
tral
Asi
a
Mid
dle
Eas
t
and N
ort
h
Afr
ica
Su
b-S
ahar
an
Afr
ica
So
uth
Asi
a
Eas
t A
sia
Lat
in
Am
eric
a an
d
Car
ibbea
n
n (%) 131935 109058
(82.66)
6760 (5.12) 3306 (2.51) 511 (0.39) 3870 (2.93) 5031 (3.81) 1127 (0.85) 610 (0.46) 802 (0.61) 860 (0.65)
Males 57 (75083) 57 (62526) 51 (3479) 53 (1751) 70 (360) 54 (2075) 62 (3142) 59 (663)α 56 (344)
α 37 (298) 52 (445)
Age (years)
62.8 (12.5) 63.7 (12.2)
63.8
(10.5)α 64.4 (11.8) 62.5 (10.6)
α 57.6 (11.7) 52.3 (11.2) 47.3 (11.2) 46.0 (11.3) 50.0 (12.8) 54.5 (12.0)
Annual visits 1.73 (2.14) 1.67 (2.0) 1.80 (2.22) 1.96 (2.70) 2.20 (3.24) 2.05 (2.70) 2.30 (3.34) 2.22 (3.42) 2.32 (3.40) 1.91 (2.70) 2.50 (3.20)
BMI (kg/m2) 30.4 (5.5) 30.3 (5.5) 31.2 (5.6) 30.5 (5.3)α 30.1 (4.8)
α 31.3 (5.3) 30.9 (5.2) 28.8 (5.4) 28.6 (5.2) 27.3 (4.3) 31.4 (5.5)
Waist circumference
(cm)
104.7
(13.4) 105.2 (13.5)
106.3
(13.5) 104.2 (12.9) 104.4 (11.8) 105.0 (11.9)
103.6
(11.5)
100.2
(11.4) 97.8 (11.8) 92.4 (11.2) 104.3 (11.7)
HbA1c (mmol/mol)
52.2 (15.4) 51.9 (15.1)
52.3
(15.2)α 52.2 (14.7)
α 52.8 (15.2)
α 54.3 (16.8) 54.9 (17.2) 58.0 (19.8) 55.8 (16.7) 55.9 (17.1) 56.7 (19.8)
Systolic BP (mmHg) 137.5 (17.2)
138.1 (17.1) 139.5 (17.4)
138.2 (17.4)α 134.1 (16.2) 135.2 (18.2) 129.3
(16.4) 126.9 (16.4)
124.8 (14.4)
126.7 (15.9) 130.8 (15.4)
Chol/HDL ratio 4.5 (1.5) 4.4 (1.5) 4.3 (1.5) 4.5 (1.6)α 4.6 (1.4)
α 4.9 (1.7) 4.8 (1.5) 4.6 (1.5) 4.8 (1.4) 4.4 (1.3)
α 4.7 (1.5)
LDL/HDL ratio 2.6 (1.1) 2.6 (1.1) 2.5 (1.1) 2.6 (1.1)α 2.8 (1.1) 2.9 (1.2) 2.9 (1.1) 2.9 (1.1) 2.9 (1.0) 2.6 (1.0)
α 2.7 (1.1)
eGFR (mL/min)
83.4 (25.2) 81.8 (24.0) 83.0 (22.3) 81.2 (21.8)α 87.2 (25.0) 90.4 (37.4) 99.9 (24.9)
124.9
(39.1)
100.0
(23.9) 100.9 (28.0) 96.2 (26.6)
Smoker 15 (19657) 14 (15173) 20 (1341) 17 (556)α 19 (99) 23 (888) 22 (1098) 13 (149)
α 13 (77)
α 15 (122)
α 18 (154)
No physical activity 12 (15973) 12 (12935) 13 (907)α 12 (390)
α 15 (76)
α 13 (497)
α 16 (803) 11 (128)
α 13 (82)
α 8 (66) 10 (89)
α
Daily physical activity 26 (33983) 26 (28207) 24 (1651)α 25 (842)
α 27 (139)
α 31 (1186)
α 22 (1116) 23 (260)
α 23 (142)
α 29 (233)
α 24 (207)
α
INCOME & EDUCATION
Income Q1 (lowest) 20 (24925) 16 (16872) 23 (1439) 27 (852) 23 (113) 41 (1538) 55 (2745) 47 (526) 35 (212) 42 (333) 35 (295)
Income Q5 (highest) 20 (24928) 22 (22068) 15 (928) 14 (452) 14 (69) 11 (398) 10 (485) 15 (165) 17 (101) 14 (113) 18 (149) <9 years education 39 (51890) 40 (43495) 44 (3005) 25 (814) 41 (211) 35 (1366)
α 37 (1883) 33 (376) 24 (148) 42 (335)
α 30 (257)
10-12 years education 43 (56146) 43 (47370) 40 (2734)α 48 (1593) 42 (216) 39 (1516)
α 29 (1444) 35 (399) 44 (267)
α 30 (243) 42 (364)
α
University/college
education 17 (22140) 16 (17811) 12 (790) 24 (793) 13 (68) 15 (576)α 25 (1275) 22 (243) 29 (176) 24 (193) 25 (215)
GLUCOSE-LOWERING TREATMENT
Diet 53 (70445) 54 (59371) 53 (3602) 53 (1763)α 49 (251)
α 48 (1854)
α 44 (2225) 38 (429) 42 (255) 40 (320) 44 (375)
OHA 37 (49261) 36 (39662) 38 (2599)α 38 (1240)
α 43 (219) 43 (1653) 47 (2352) 48 (537) 47 (288) 45 (364) 40 (347)
α
Insulin 5 (6199) 5 (5249) 4 (251)α 4 (148)
α 4 (21)
α 4 (143)
α 3 (164) 7 (84) 5 (30)
α 7 (59) 6 (50)
α
Insulin + OHA 4 (5457) 4 (4318) 4 (284) 4 (136)α 4 (18)
α 5 (202)
α 5 (260) 6 (69) 6 (35)
α 7 (55) 9 (80)
COMPLICATIONS
Albuminuria 14 (17988) 14 (14845) 14 (920)α 14 (453)
α 17 (88)
α 13 (502)
α 14 (701)
α 14 (157)
α 12 (75)
α 13 (106)
α 16 (141)
Previous CVD 20 (26166) 21 (22373) 23 (1555) 23 (759) 19 (98)α 16 (610)
α 11 (547) 4 (46) 8 (47) 6 (48) 10 (83)
Sweden is the reference group for ethnicity. α
No statistically significant difference, at the 0.01 level.
Page 8 of 29
For peer review only - http://bmjopen.bmj.com/site/about/guidelines.xhtml
BMJ Open
123456789101112131415161718192021222324252627282930313233343536373839404142434445464748495051525354555657585960
on 25 March 2019 by guest. Protected by copyright. http://bmjopen.bmj.com/ BMJ Open: first published as 10.1136/bmjopen-2015-007599 on 5 June 2015. Downloaded from
For peer review only
9
Characteristics at the time of diagnosis
Table 1 presents characteristics at the time of diagnosis. The proportion of males varied from
37% (East Asia) to 70% (Mediterranean Basin). Patients from high-income Western countries
were as much as 18 years older at the time of diagnosis. Particularly low age at the time of
diagnosis was found for South Asia (46.0), East Asia (50.0) and Sub-Saharan Africa (47.3). BMI
was 2–3 kg/m2 lower among non-Western groups. Native Swedish patients had the lowest mean
HbA1c (51.9 mmol/mol) of all groups. Low-income and non-Western groups had HbA1c
ranging from 54 to 58 mmol/mol. Systolic blood pressure was lower among non-Western
groups. Lipid profiles were less favourable among non-Western groups. There were no major
ethnic differences in terms of physical activity. Smoking rates were higher among patients from
the Middle East, North Africa and low-income Europe. A history of CVD was more common
among Western groups, but non-Western groups were 10–12 years younger at the onset of CVD.
The overall prevalence of albuminuria was approximately 14%, and there were no noteworthy
ethnic differences. College or university education was more common among non-Western
populations, but they were generally in lower income quintiles.
GLYCAEMIC CONTROL – CRUDE FIGURES
HbA1c declined during the first 1–3 years of follow-up and then increased for all ethnic groups
(Figure I). However, there were conspicuous and consistent ethnic differences in HbA1c levels
throughout the study. Swedish patients (the reference category) had the lowest mean HbA1c at
every point in time while patients from high-income Western countries had only slightly higher
levels. Patients from low-income Europe, Russia and Central Asia, as well as all non-Western
populations, had substantially higher HbA1c levels throughout the study. On average, Swedish
and other Nordic populations remained below the target level until the fifth year. Mediterranean
Basin, high-income European, North American and Oceanic populations remained below the
target level until the fourth year, whereas low-income European, Russian and Central Asian
populations remained below only until the second year. The remaining five ethnic groups did not
reach the target level at any point.
GLYCAEMIC CONTROL – ADJUSTED FIGURES
Because there was an interaction (p <0.0001) between ethnicity and glucose-lowering treatment,
we stratified the analysis by type of treatment. Table II presents β coefficients (i.e predicted
difference in mmol/mol HbA1c) by ethnicity. To convey a sense of the impact of ethnicity as
compared to other factors, coefficients for physical activity are also presented.
Page 9 of 29
For peer review only - http://bmjopen.bmj.com/site/about/guidelines.xhtml
BMJ Open
123456789101112131415161718192021222324252627282930313233343536373839404142434445464748495051525354555657585960
on 25 March 2019 by guest. P
rotected by copyright.http://bm
jopen.bmj.com
/B
MJ O
pen: first published as 10.1136/bmjopen-2015-007599 on 5 June 2015. D
ownloaded from
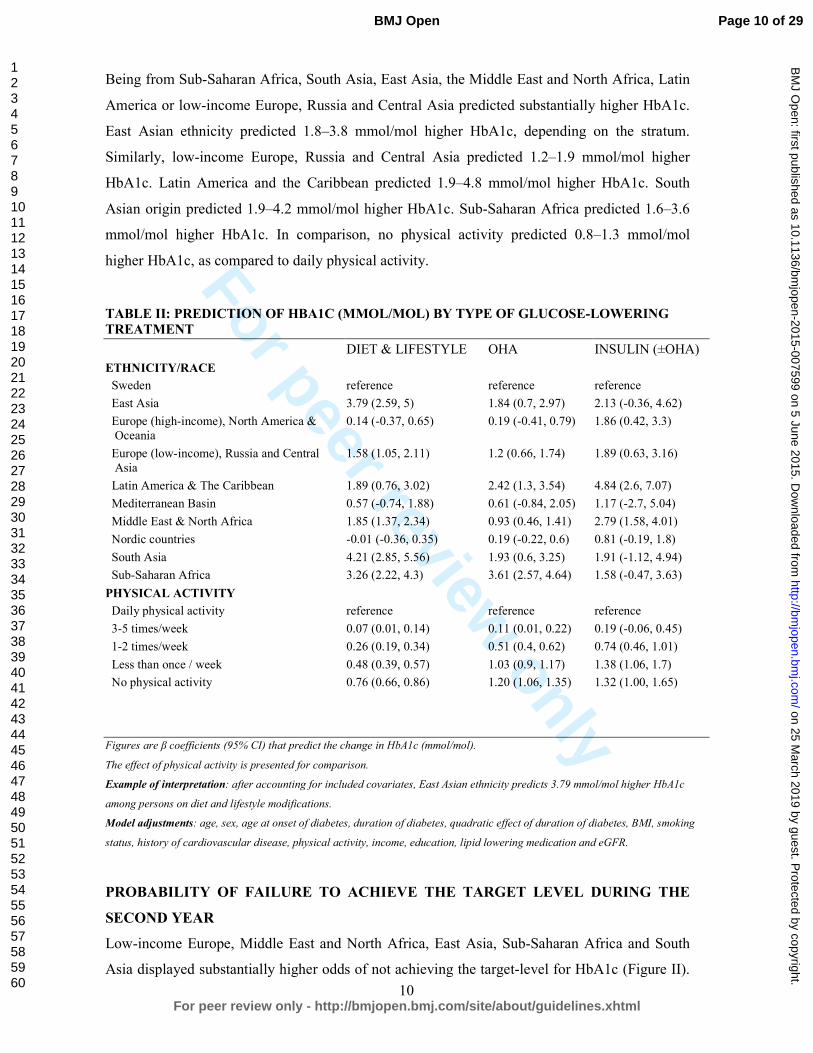
For peer review only
10
Being from Sub-Saharan Africa, South Asia, East Asia, the Middle East and North Africa, Latin
America or low-income Europe, Russia and Central Asia predicted substantially higher HbA1c.
East Asian ethnicity predicted 1.8–3.8 mmol/mol higher HbA1c, depending on the stratum.
Similarly, low-income Europe, Russia and Central Asia predicted 1.2–1.9 mmol/mol higher
HbA1c. Latin America and the Caribbean predicted 1.9–4.8 mmol/mol higher HbA1c. South
Asian origin predicted 1.9–4.2 mmol/mol higher HbA1c. Sub-Saharan Africa predicted 1.6–3.6
mmol/mol higher HbA1c. In comparison, no physical activity predicted 0.8–1.3 mmol/mol
higher HbA1c, as compared to daily physical activity.
TABLE II: PREDICTION OF HBA1C (MMOL/MOL) BY TYPE OF GLUCOSE-LOWERING
TREATMENT
DIET & LIFESTYLE OHA INSULIN (±OHA)
ETHNICITY/RACE
Sweden reference reference reference
East Asia 3.79 (2.59, 5) 1.84 (0.7, 2.97) 2.13 (-0.36, 4.62)
Europe (high-income), North America &
Oceania
0.14 (-0.37, 0.65) 0.19 (-0.41, 0.79) 1.86 (0.42, 3.3)
Europe (low-income), Russia and Central
Asia
1.58 (1.05, 2.11) 1.2 (0.66, 1.74) 1.89 (0.63, 3.16)
Latin America & The Caribbean 1.89 (0.76, 3.02) 2.42 (1.3, 3.54) 4.84 (2.6, 7.07)
Mediterranean Basin 0.57 (-0.74, 1.88) 0.61 (-0.84, 2.05) 1.17 (-2.7, 5.04)
Middle East & North Africa 1.85 (1.37, 2.34) 0.93 (0.46, 1.41) 2.79 (1.58, 4.01)
Nordic countries -0.01 (-0.36, 0.35) 0.19 (-0.22, 0.6) 0.81 (-0.19, 1.8)
South Asia 4.21 (2.85, 5.56) 1.93 (0.6, 3.25) 1.91 (-1.12, 4.94)
Sub-Saharan Africa 3.26 (2.22, 4.3) 3.61 (2.57, 4.64) 1.58 (-0.47, 3.63)
PHYSICAL ACTIVITY
Daily physical activity reference reference reference
3-5 times/week 0.07 (0.01, 0.14) 0.11 (0.01, 0.22) 0.19 (-0.06, 0.45)
1-2 times/week 0.26 (0.19, 0.34) 0.51 (0.4, 0.62) 0.74 (0.46, 1.01)
Less than once / week 0.48 (0.39, 0.57) 1.03 (0.9, 1.17) 1.38 (1.06, 1.7)
No physical activity 0.76 (0.66, 0.86) 1.20 (1.06, 1.35) 1.32 (1.00, 1.65)
Figures are β coefficients (95% CI) that predict the change in HbA1c (mmol/mol).
The effect of physical activity is presented for comparison.
Example of interpretation: after accounting for included covariates, East Asian ethnicity predicts 3.79 mmol/mol higher HbA1c
among persons on diet and lifestyle modifications.
Model adjustments: age, sex, age at onset of diabetes, duration of diabetes, quadratic effect of duration of diabetes, BMI, smoking
status, history of cardiovascular disease, physical activity, income, education, lipid lowering medication and eGFR.
PROBABILITY OF FAILURE TO ACHIEVE THE TARGET LEVEL DURING THE
SECOND YEAR
Low-income Europe, Middle East and North Africa, East Asia, Sub-Saharan Africa and South
Asia displayed substantially higher odds of not achieving the target-level for HbA1c (Figure II).
Page 10 of 29
For peer review only - http://bmjopen.bmj.com/site/about/guidelines.xhtml
BMJ Open
123456789101112131415161718192021222324252627282930313233343536373839404142434445464748495051525354555657585960
on 25 March 2019 by guest. P
rotected by copyright.http://bm
jopen.bmj.com
/B
MJ O
pen: first published as 10.1136/bmjopen-2015-007599 on 5 June 2015. D
ownloaded from
For peer review only
11
Odds ratios (95% CI) for East Asia, Sub-Saharan Africa and South Asia were 1.76 (1.22, 2.54),
1.78 (1.29, 2.45) and 2.11 (1.35, 3.29), respectively. The effects of income and education were
significant, although less pronounced. Not being physically active was associated with 57%
higher odds of failure, as compared to daily physical activity.
PROBABILITY OF HAVING ALBUMINURIA DURING THE SECOND YEAR
Immigrants had 6% to 92% higher odds of having albuminuria (Figure III). The risk of
albuminuria was particularly high (51% to 92% higher risk) in Non-Western and low-income
groups.
TIME TO START OF PHARMACOLOGICAL TREATMENT
Median time to start of pharmacological treatment was shorter for non-Western populations
compared with Western populations (Figure B, supplementary material).
Discussion Our study provides firm evidence that ethnicity is a strong predictor of glycaemic control, on a
par with physical activity. We also show ethnic differences in glycaemia for all major ethnic
groups and how these disparities are mirrored in another important riskmarker, i.e albuminuria.
We believe that our results call for a more individualized management and increased efforts to
eliminate ethnic inequalities.
Glucose control is a cornerstone of diabetes care. Previous studies on ethnic differences in
glycaemic control might be compromised in several ways; unequal access to—or use of—health
care, inappropriately broad categories of ethnicity, cross-sectional design, small samples and
short follow-up are frequent flaws, which might explain contradictory results [6-8].
We examined 131,935 newly diagnosed patients with type 2 diabetes, including 713,495
observations during a decade of monitoring. Our cohort contains the majority of all new cases of
type 2 diabetes in Sweden during the study period. All major ethnic groups were adequately
represented. All participants had full access to every level of health care at a minimal cost. The
Swedish social welfare system fully covers all necessary health care for individuals who do not
have an income. Thus, neither access to nor consumption of health care are likely to have
confounded our results. Swedish authorities frequently target immigrant and disadvantaged
Page 11 of 29
For peer review only - http://bmjopen.bmj.com/site/about/guidelines.xhtml
BMJ Open
123456789101112131415161718192021222324252627282930313233343536373839404142434445464748495051525354555657585960
on 25 March 2019 by guest. P
rotected by copyright.http://bm
jopen.bmj.com
/B
MJ O
pen: first published as 10.1136/bmjopen-2015-007599 on 5 June 2015. D
ownloaded from
For peer review only
12
groups in ways to increase their use of health care and promote health behaviours. This was
reflected in our study by the fact that immigrants had 30% more appointments at their clinic.
We noted marked ethnic differences in HbA1c both at the time of diagnosis and during follow-
up. Immigrants consistently exhibited poorer glycaemic control. High-income Western groups
remained below the target-level of HbA1c for 4–5 years after diagnosis, whereas low-income
Europe, Russia and Central Asian patients maintained the target level for an average of only 3
years. Non-Western populations had substantially higher HbA1c throughout the study and never
reached the guideline target level. Adjusted figures showed 2–5 mmol/mol higher HbA1c among
non-Western groups. These disparities translated into a 28–111% higher risk of not achieving
target level of HbA1c and a 51–92% higher risk of developing albuminuria among non-Western
groups compared with native Swedes. After the end of follow-up, 40–45% of individuals from
high-income Western countries were in glycaemic control, compared to 5%, 25% and 30% for
Sub-Saharan Africa, South Asia and the Middle East and North Africa, respectively. These
differences could not be explained by disparities in instituting glucose-lowering medications, use
or access to health care.
A recent Scottish study compared glycaemic control in Pakistanis, Indians, Chinese and African-
Caribbeans to White Scottish individuals. Unadjusted figures revealed that, compared to the White
Scottish group, all other groups had significantly greater proportions of people with suboptimal
glycaemic control (defined as HbA1c >58 mmol/mol). Adjusted odds ratios for suboptimal
glycaemic control were significantly higher among Pakistanis (odds ratio 1.85 [95% CI 1.68, 2.04])
and Indians (1.62 [95% CI 1.38, 1.89]) [9]. This is in line with our results and we provide additional
details and ethnic groups to this comparison.
The risk of albuminuria was assessed in order to determine whether ethnic differences in
glycaemic control were reflected in the development of diabetes-related complications. Poor
glycaemic control is a main cause of albuminuria and renal lesions in diabetes, making
albuminuria a suitable marker for complications [32,33].
Studies have shown that African Americans and Hispanics have a higher prevalence of
albuminuria compared with Caucasians [34]. Jolly et al reported that this was also true for Asians
[35]. Our study describes the adjusted risk of albuminuria in all major ethnic groups; immigrants,
particularly those of non-Western origin, have a substantially higher risk of developing
albuminuria. This predicts a high future risk of developing cardiovascular disease. It also
suggests that ethnic differences in HbA1c reflect actual differences in glucose-levels. Above all
it underlines the need for ethnic-specific screening and management.
Page 12 of 29
For peer review only - http://bmjopen.bmj.com/site/about/guidelines.xhtml
BMJ Open
123456789101112131415161718192021222324252627282930313233343536373839404142434445464748495051525354555657585960
on 25 March 2019 by guest. P
rotected by copyright.http://bm
jopen.bmj.com
/B
MJ O
pen: first published as 10.1136/bmjopen-2015-007599 on 5 June 2015. D
ownloaded from
For peer review only
13
This study shows that South Asians have the greatest risk of developing albuminuria. Previous
studies have shown that South Asians exhibit poor risk factor control and have an exceptionally
high waist-hip-ratio; [36,37] they are at greater risk of developing diabetes; [38,39] they develop
diabetes earlier in life, [40,41] and they exhibit poor glycaemic control [9,42]. A recent study
demonstrated that the cut-offs for overweight and obesity in South Asians are substantially lower
than cut-offs for white Europeans [43]. Clinicians should be aware of this vulnerability and
intensify risk factor control in South Asians.
The groups with the poorest glycaemic control and greatest risk of albuminuria in our study were
Asia, Sub-Saharan Africa, the Middle East & North Africa, low-income Europe, Russia and
Central Asia. They represent a large and growing proportion of the population in high-income
areas such as North American and the EU. We believe our results can be generalized to
economically developed Western countries. Clinicians and health care planners should be aware
of the challenges posed by immigrants and adjust the management accordingly. Effective
strategies to reduce these health disparities remain elusive and need to be addressed. The
problem might be further complicated by a potential interaction between ethnicity and the
effectiveness of glucose-lowering medications. Although our study was not designed to explore
these associations, we show that there was an effect-modification of ethnicity on glucose-
lowering therapy. A previous studies revealed ethnic differences in the efficacy of insulin, [44]
but there are considerable gaps in the knowledge that is currently available on this topic.
LIMITATIONS
It is important to consider the implications of the use of HbA1c when making ethnic
comparisons. HbA1c is not a direct measure of glycaemia and might be influenced by factors
that are independent of blood glucose levels. Studies have shown that African Americans
average approximately 0.20 percentage points higher HbA1c than Caucasian Americans [45,46].
However, the design of these studies differs from ours. Furthermore, African Americans descend
largely from West Africa. Africans exhibit the greatest genetic diversity of all human
populations [47]. A recent study examined two African populations and showed that their HbA1c
differed; lower levels were found for the East African population [48]. The African population in
our study descends largely from East Africa. Thus, we believe that our results for Sub-Saharan
Africans and the remaining ethnicities should be interpreted as reflecting differences in
glycaemic control. This is underscored by the fact that Sub-Saharan Africa, as well as the
Page 13 of 29
For peer review only - http://bmjopen.bmj.com/site/about/guidelines.xhtml
BMJ Open
123456789101112131415161718192021222324252627282930313233343536373839404142434445464748495051525354555657585960
on 25 March 2019 by guest. P
rotected by copyright.http://bm
jopen.bmj.com
/B
MJ O
pen: first published as 10.1136/bmjopen-2015-007599 on 5 June 2015. D
ownloaded from
For peer review only
14
remaining non-Western populations, in our study had considerably higher risk of developing the
glycaemia-related complication albuminuria.
We created ethnic categories by grouping geographically adjacent countries. One could argue that
this does not measure ethnicity per se. Regrettably there is no consensus regarding criteria for
defining an ethnic group. Many populations, both within and between countries, share
characteristics. Moreover, ethnicity is a changeable concept; neighbouring populations tend to adapt
and adopt each other, which blurs differences. Some individuals identify themselves with several
ethnicities [49]. We defined rather large ethnic categories by assessing each countries ethnical
composition, economic development, history and religion [50,51]. This ought to encircle ethnically
homogenous populations.
CONCLUSIONS
Despite earlier start of glucose-lowering therapies, full access to health care at a minimal cost
and more appointments, immigrants—particularly those of non-Western origin—with type 2
diabetes have substantially higher HbA1c, greater risk of therapy failure and higher probability
of developing albuminuria than native Swedes. The impact of ethnicity on glycaemic control is
greater than the effect of income and educational level, and on a par with the effect of physical
activity. Thus, ethnicity is integral glycaemic control and needs to be carefully considered if
diabetes care is to improve.
Acknowledgements
We would like to thank the various regional NDR coordinators, as well as contributing nurses,
physicians, and patients. The Swedish Diabetes Association, and the Swedish Society of
Diabetology support the NDR. We would also like to thank George Lappas (University of
Gothenburg) and Szilard Nemes (University of Gothenburg) for their valuable statistical guidance.
Funding
This study was funded by the Swedish National Diabetes Register. The Swedish Association of
Local Authorities and Regions funds the NDR. Additional support: the Swedish Heart and Lung
Foundation, and the Swedish Research Council (SIMSAM) (grants number 2013-5187 and 2013-
4236).
Contributors ARa, AMS, ARo, BZ, BE and SG contributed to the conception and design of the study. ARa
Page 14 of 29
For peer review only - http://bmjopen.bmj.com/site/about/guidelines.xhtml
BMJ Open
123456789101112131415161718192021222324252627282930313233343536373839404142434445464748495051525354555657585960
on 25 March 2019 by guest. P
rotected by copyright.http://bm
jopen.bmj.com
/B
MJ O
pen: first published as 10.1136/bmjopen-2015-007599 on 5 June 2015. D
ownloaded from
For peer review only
15
performed statistical analyses and wrote the first draft of the article. ARa, AMS, ARo, BZ, BE and
SG contributed to the interpretation of data. ARa, AMS, ARo, BZ, BE and SG contributed to
critical revision of the article for important intellectual content.
Data sharing The Swedish Data Protection Authority regulates access to the NDR, and any other public database,
through the Personal Data Act. Access to data requires approval from The Regional Ethical Review
Board, the National Board of Health and Welfare, Statistics Sweden and the Swedish National
Diabetes Register. The authors are happy to provide detailed information regarding this.
Competing interests There are no conflicts of interest to be reported (ARa, AMS, ARo, BZ, BE, SG).
Page 15 of 29
For peer review only - http://bmjopen.bmj.com/site/about/guidelines.xhtml
BMJ Open
123456789101112131415161718192021222324252627282930313233343536373839404142434445464748495051525354555657585960
on 25 March 2019 by guest. P
rotected by copyright.http://bm
jopen.bmj.com
/B
MJ O
pen: first published as 10.1136/bmjopen-2015-007599 on 5 June 2015. D
ownloaded from
For peer review only
16
REFERENCES
1 Holman RR, Paul SK, Bethel MA, et al. 10-year follow-up of intensive glucose control in type 2
diabetes. The New England journal of medicine 2008;359:1577–89. doi:10.1056/NEJMoa0806470
2 ADVANCE Collaborative Group, Patel A, MacMahon S, et al. Intensive blood glucose control and
vascular outcomes in patients with type 2 diabetes. The New England journal of medicine
2008;358:2560–72. doi:10.1056/NEJMoa0802987
3 Emerging Risk Factors C, Sarwar N, Gao P, et al. Diabetes mellitus, fasting blood glucose concentration, and risk of vascular disease: a collaborative meta-analysis of 102 prospective studies.
Lancet 2010;375:2215–22. doi:10.1016/S0140-6736(10)60484-9
4 Emerging Risk Factors C, Seshasai SR, Kaptoge S, et al. Diabetes mellitus, fasting glucose, and risk of cause-specific death. 2011;364:829–41. doi:10.1056/NEJMoa1008862
5 Lind M, Bounias I, Olsson M, et al. Glycaemic control and incidence of heart failure in 20,985 patients
with type 1 diabetes: an observational study. Lancet 2011;378:140–6. doi:10.1016/S0140-
6736(11)60471-6
6 Fan T, Koro CE, Fedder DO, et al. Ethnic disparities and trends in glycemic control among adults with
type 2 diabetes in the U.S. from 1988 to 2002. Diabetes care 2006;29:1924–5. doi:10.2337/dc05-2238
7 Harris MI, Eastman RC, Cowie CC, et al. Racial and ethnic differences in glycemic control of adults
with type 2 diabetes. 1999;22:403–8.http://www.ncbi.nlm.nih.gov/pubmed/10097918
8 Davis TM, Cull CA, Holman RR, et al. Relationship between ethnicity and glycemic control, lipid profiles, and blood pressure during the first 9 years of type 2 diabetes: U.K. Prospective Diabetes Study
(UKPDS 55). Diabetes care 2001;24:1167–74.
9 Negandhi PH, Ghouri N, Colhoun HM, et al. Ethnic differences in glycaemic control in people with type 2 diabetes mellitus living in Scotland. PLoS ONE 2013;8:e83292.
doi:10.1371/journal.pone.0083292
10 Information UDOP. International migration and development. United Nations Press Release 2013.
11 Ramachandran A, Ma RCW, Snehalatha C. Diabetes in Asia. Lancet 2010;375:408–18.
doi:10.1016/S0140-6736(09)60937-5
12 Shai I, Jiang R, Manson JE, et al. Ethnicity, obesity, and risk of type 2 diabetes in women: a 20-year
follow-up study. Diabetes care 2006;29:1585–90. doi:10.2337/dc06-0057
13 Richard Sicree JSPZ. The Global Burden of Diabetes and Impaired Glucose Tolerance. International
Diabetes Federation 2013.
14 Lutsey PL, Pereira MA, Bertoni AG, et al. Interactions between race/ethnicity and anthropometry in
risk of incident diabetes: the multi-ethnic study of atherosclerosis. 2010;172:197–204.
doi:10.1093/aje/kwq100
15 Narayan KM, Boyle JP, Thompson TJ, et al. Lifetime risk for diabetes mellitus in the United States. 2003;290:1884–90. doi:10.1001/jama.290.14.1884
16 Davis K, Ballreich J. Equitable access to care--how the United States ranks internationally. The New
England journal of medicine 2014;371:1567–70. doi:10.1056/NEJMp1406707
17 Billing A. Health assessment of newly immigrated individuals.
http://www.folkhalsomyndigheten.se/pagefiles/12920/halsoundersokningar-nyanlanda-invandrare.pdf
Page 16 of 29
For peer review only - http://bmjopen.bmj.com/site/about/guidelines.xhtml
BMJ Open
123456789101112131415161718192021222324252627282930313233343536373839404142434445464748495051525354555657585960
on 25 March 2019 by guest. P
rotected by copyright.http://bm
jopen.bmj.com
/B
MJ O
pen: first published as 10.1136/bmjopen-2015-007599 on 5 June 2015. D
ownloaded from
For peer review only
17
18 Haglind P, editor. Tobacco prevention among immigrants. 2nd ed. Institute of Population Health 2012.
http://www.folkhalsomyndigheten.se/documents/livsvillkor-
levnadsvanor/andts/tobak/uppdrag/nationella-tobaksuppdraget/samverkansprojektet/slutrapport-
tobaksprevention-invandrargrupper.pdf
19 Lind M, Svensson A-M, Kosiborod M, et al. Glycemic Control and Excess Mortality in Type 1
Diabetes. The New England journal of medicine 2014;371:1972–82. doi:10.1056/NEJMoa1408214
20 Gudbjornsdottir S, Cederholm J, Nilsson PM, et al. The National Diabetes Register in Sweden: an implementation of the St. Vincent Declaration for Quality Improvement in Diabetes Care.
2003;26:1270–6.http://www.ncbi.nlm.nih.gov/pubmed/12663609
21 Ekström N, Schiöler L, Svensson A-M, et al. Effectiveness and safety of metformin in 51 675 patients
with type 2 diabetes and different levels of renal function: a cohort study from the Swedish National
Diabetes Register. BMJ Open 2012;2:e001076–6. doi:10.1136/bmjopen-2012-001076
22 Cederholm J, Gudbjörnsdottir S, Eliasson B, et al. Blood pressure and risk of cardiovascular diseases in
type 2 diabetes: further findings from the Swedish National Diabetes Register (NDR-BP II). J
Hypertens 2012;30:2020–30. doi:10.1097/HJH.0b013e3283577bdf
23 Lind M, Olsson M, Rosengren A, et al. The relationship between glycaemic control and heart failure in
83,021 patients with type 2 diabetes. Diabetologia 2012;55:2946–53. doi:10.1007/s00125-012-2681-3
24 Rotimi CN, Jorde LB. Ancestry and disease in the age of genomic medicine. The New England journal
of medicine 2010;363:1551–8. doi:10.1056/NEJMra0911564
25 Hoelzel W, Weykamp C, Jeppsson J-O, et al. IFCC reference system for measurement of hemoglobin
A1c in human blood and the national standardization schemes in the United States, Japan, and Sweden:
a method-comparison study. Clin Chem 2004;50:166–74. doi:10.1373/clinchem.2003.024802
26 Levey AS, Bosch JP, Lewis JB, et al. A more accurate method to estimate glomerular filtration rate
from serum creatinine: a new prediction equation. Modification of Diet in Renal Disease Study Group.
Ann Intern Med 1999;130:461–70.
27 Ludvigsson JF, Andersson E, Ekbom A, et al. External review and validation of the Swedish national inpatient register. BMC Public Health 2011;11:450. doi:10.1186/1471-2458-11-450
28 Ingelsson E, Arnlöv J, Sundström J, et al. The validity of a diagnosis of heart failure in a hospital
discharge register. Eur J Heart Fail 2005;7:787–91. doi:10.1016/j.ejheart.2004.12.007
29 Diggle PJ HPLK-YZS. Analysis of longitudinal data. Oxford University Press 2002;2nd ed.
30 Egede LE, Gebregziabher M, Hunt KJ, et al. Regional, geographic, and racial/ethnic variation in
glycemic control in a national sample of veterans with diabetes. Diabetes care 2011;34:938–43.
doi:10.2337/dc10-1504
31 Weinstock RS, Teresi JA, Goland R, et al. Glycemic control and health disparities in older ethnically
diverse underserved adults with diabetes: five-year results from the Informatics for Diabetes Education
and Telemedicine (IDEATel) study. Diabetes care 2011;34:274–9. doi:10.2337/dc10-1346
32 Mogensen CE, Poulsen PL. Microalbuminuria, glycemic control, and blood pressure predicting
outcome in diabetes type 1 and type 2. Kidney Int Suppl 2004;66:S40–1. doi:10.1111/j.1523-1755.2004.09210.x
33 Levin SR, Coburn JW, Abraira C, et al. Effect of intensive glycemic control on microalbuminuria in
type 2 diabetes. Veterans Affairs Cooperative Study on Glycemic Control and Complications in Type 2 Diabetes Feasibility Trial Investigators. Diabetes care 2000;23:1478–85.
Page 17 of 29
For peer review only - http://bmjopen.bmj.com/site/about/guidelines.xhtml
BMJ Open
123456789101112131415161718192021222324252627282930313233343536373839404142434445464748495051525354555657585960
on 25 March 2019 by guest. P
rotected by copyright.http://bm
jopen.bmj.com
/B
MJ O
pen: first published as 10.1136/bmjopen-2015-007599 on 5 June 2015. D
ownloaded from
For peer review only
18
34 Sinha SK, Shaheen M, Rajavashisth TB, et al. Association of race/ethnicity, inflammation, and
albuminuria in patients with diabetes and early chronic kidney disease. Diabetes care 2014;37:1060–8.
doi:10.2337/dc13-0013
35 Jolly SE, Burrows NR, Chen S-C, et al. Racial and ethnic differences in albuminuria in individuals with estimated GFR greater than 60 mL/min/1.73 m(2): results from the Kidney Early Evaluation Program
(KEEP). Am J Kidney Dis 2010;55:S15–22. doi:10.1053/j.ajkd.2009.09.034
36 Lean ME, Han TS, Bush H, et al. Ethnic differences in anthropometric and lifestyle measures related to coronary heart disease risk between South Asian, Italian and general-population British women living
in the west of Scotland. Int J Obes Relat Metab Disord 2001;25:1800–5. doi:10.1038/sj.ijo.0801823
37 Forouhi NG, Sattar N, Tillin T, et al. Do known risk factors explain the higher coronary heart disease
mortality in South Asian compared with European men? Prospective follow-up of the Southall and
Brent studies, UK. Diabetologia 2006;49:2580–8. doi:10.1007/s00125-006-0393-2
38 Danaei G, Finucane MM, Lu Y, et al. National, regional, and global trends in fasting plasma glucose
and diabetes prevalence since 1980: systematic analysis of health examination surveys and
epidemiological studies with 370 country-years and 2·7 million participants. Lancet 2011;378:31–40.
doi:10.1016/S0140-6736(11)60679-X
39 Bellary S, O'Hare JP, Raymond NT, et al. Premature cardiovascular events and mortality in south Asians with type 2 diabetes in the United Kingdom Asian Diabetes Study - effect of ethnicity on risk.
Curr Med Res Opin 2010;26:1873–9. doi:10.1185/03007995.2010.490468
40 Mukhopadhyay B, Forouhi NG, Fisher BM, et al. A comparison of glycaemic and metabolic control
over time among South Asian and European patients with Type 2 diabetes: results from follow-up in a
routine diabetes clinic. Diabetic medicine : a journal of the British Diabetic Association 2006;23:94–8.
doi:10.1111/j.1464-5491.2005.01735.x
41 Ethnicity and cardiovascular disease. The incidence of myocardial infarction in white, South Asian, and
Afro-Caribbean patients with type 2 diabetes (U.K. Prospective Diabetes Study 32). Diabetes care
1998;21:1271–7.
42 Fischbacher CM, Bhopal R, Steiner M, et al. Is there equity of service delivery and intermediate
outcomes in South Asians with type 2 diabetes? Analysis of DARTS database and summary of UK
publications. J Public Health (Oxf) 2009;31:239–49. doi:10.1093/pubmed/fdp003
43 Ntuk UE, Gill JMR, Mackay DF, et al. Ethnic-specific obesity cutoffs for diabetes risk: cross-sectional
study of 490,288 UK biobank participants. Diabetes care 2014;37:2500–7. doi:10.2337/dc13-2966
44 Davidson JA, Wolffenbuttel BH, Arakaki RF, et al. Impact of race/ethnicity on efficacy and safety of
two starter insulin regimens in patients with type 2 diabetes: a posthoc analysis of the DURABLE trial.
Ethn Dis 2013;23:393–400.
45 Ziemer DC, Kolm P, Weintraub WS, et al. Glucose-independent, black-white differences in
hemoglobin A1c levels: a cross-sectional analysis of 2 studies. Ann Intern Med 2010;152:770–7.
doi:10.7326/0003-4819-152-12-201006150-00004
46 Herman WH, Ma Y, Uwaifo G, et al. Differences in A1C by race and ethnicity among patients with impaired glucose tolerance in the Diabetes Prevention Program. Diabetes care 2007;30:2453–7.
doi:10.2337/dc06-2003
47 Tishkoff SA, Reed FA, Friedlaender FR, et al. The genetic structure and history of Africans and African Americans. Science 2009;324:1035–44. doi:10.1126/science.1172257
48 Hare MJL, Magliano DJ, Zimmet PZ, et al. Glucose-independent ethnic differences in HbA1c in people
without known diabetes. Diabetes care 2013;36:1534–40. doi:10.2337/dc12-1210
Page 18 of 29
For peer review only - http://bmjopen.bmj.com/site/about/guidelines.xhtml
BMJ Open
123456789101112131415161718192021222324252627282930313233343536373839404142434445464748495051525354555657585960
on 25 March 2019 by guest. P
rotected by copyright.http://bm
jopen.bmj.com
/B
MJ O
pen: first published as 10.1136/bmjopen-2015-007599 on 5 June 2015. D
ownloaded from
For peer review only
19
49 Braun L, Fausto-Sterling A, Fullwiley D, et al. Racial categories in medical practice: how useful are
they? PLoS Med 2007;4:e271. doi:10.1371/journal.pmed.0040271
50 The Central Intelligence Agency. The World Fact Book. https://www.cia.gov/library/publications/the-
world-factbook/ (accessed 7 Mar2015).
51 Bank TW. Classification of Countries. http://www.worldbank.org/en/country (accessed 7 Mar2015).
Page 19 of 29
For peer review only - http://bmjopen.bmj.com/site/about/guidelines.xhtml
BMJ Open
123456789101112131415161718192021222324252627282930313233343536373839404142434445464748495051525354555657585960
on 25 March 2019 by guest. P
rotected by copyright.http://bm
jopen.bmj.com
/B
MJ O
pen: first published as 10.1136/bmjopen-2015-007599 on 5 June 2015. D
ownloaded from
For peer review only
20
FIGURE I: PROGRESS OF GLYCEMIC CONTROL FROM TIME OF DIAGNOSIS BY
ETHNICITY/RACE
CAPTION: Annual mean HbA1c from time of diagnosis by ethnicity/race. The red horizontal line in the background depicts the national target level (52 mmol/mol) set for type 2 diabetes.
FIGURE II: PROBABILITY OF FAILURE TO ACHIEVE THE TARGET LEVEL OF
HBA1C DURING 2ND YEAR AFTER DIAGNOSIS
CAPTION Probability (odds ratio) of achieving glycemic control (<52 mmol/mol) during the second year
after diagnosis. Adjusted for ethnicity, sex, age, BMI, income, education, smoking status, physical activity
and type of glucose lowering treatment.
FIGURE III: PROBABILITY OF HAVING ALBUMINURIA DURING THE 2ND YEAR
AFTER DIAGNOSIS
CAPTION: Probability (odds ratio) of having albuminuria during the second year after diagnosis. Adjusted
for age, sex, systolic blood pressure and eGFR.
Page 20 of 29
For peer review only - http://bmjopen.bmj.com/site/about/guidelines.xhtml
BMJ Open
123456789101112131415161718192021222324252627282930313233343536373839404142434445464748495051525354555657585960
on 25 March 2019 by guest. P
rotected by copyright.http://bm
jopen.bmj.com
/B
MJ O
pen: first published as 10.1136/bmjopen-2015-007599 on 5 June 2015. D
ownloaded from
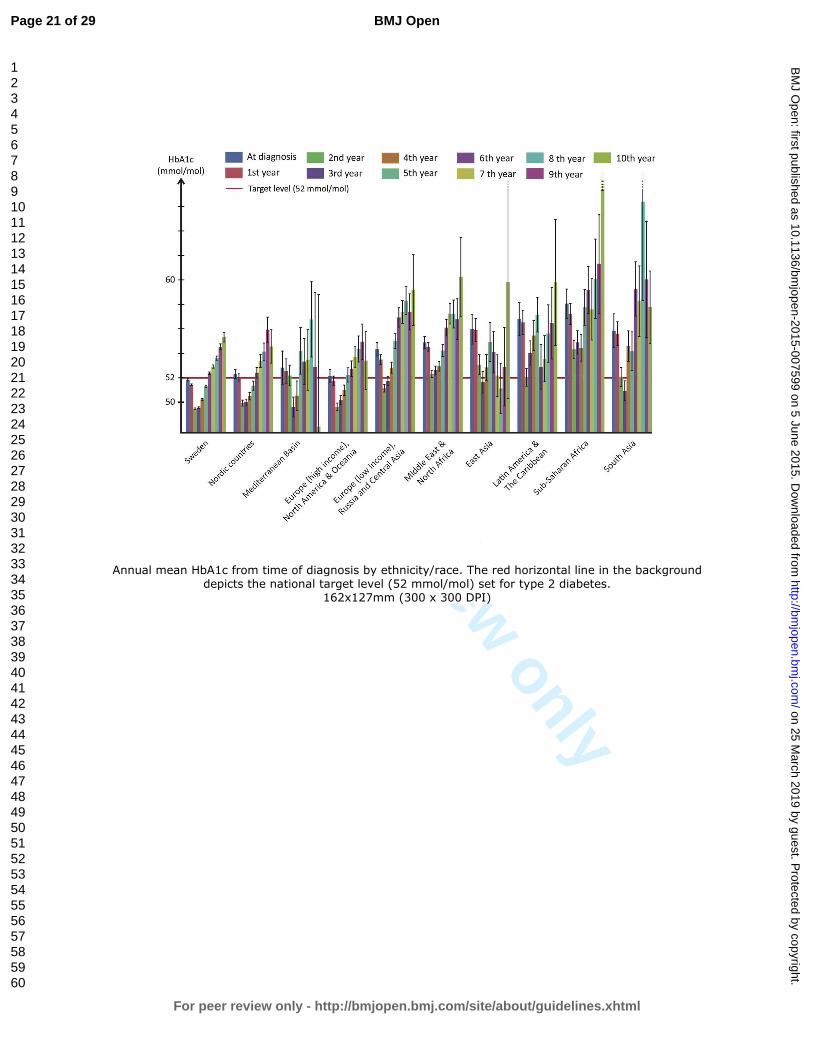
For peer review only
Annual mean HbA1c from time of diagnosis by ethnicity/race. The red horizontal line in the background depicts the national target level (52 mmol/mol) set for type 2 diabetes.
162x127mm (300 x 300 DPI)
Page 21 of 29
For peer review only - http://bmjopen.bmj.com/site/about/guidelines.xhtml
BMJ Open
123456789101112131415161718192021222324252627282930313233343536373839404142434445464748495051525354555657585960
on 25 March 2019 by guest. P
rotected by copyright.http://bm
jopen.bmj.com
/B
MJ O
pen: first published as 10.1136/bmjopen-2015-007599 on 5 June 2015. D
ownloaded from
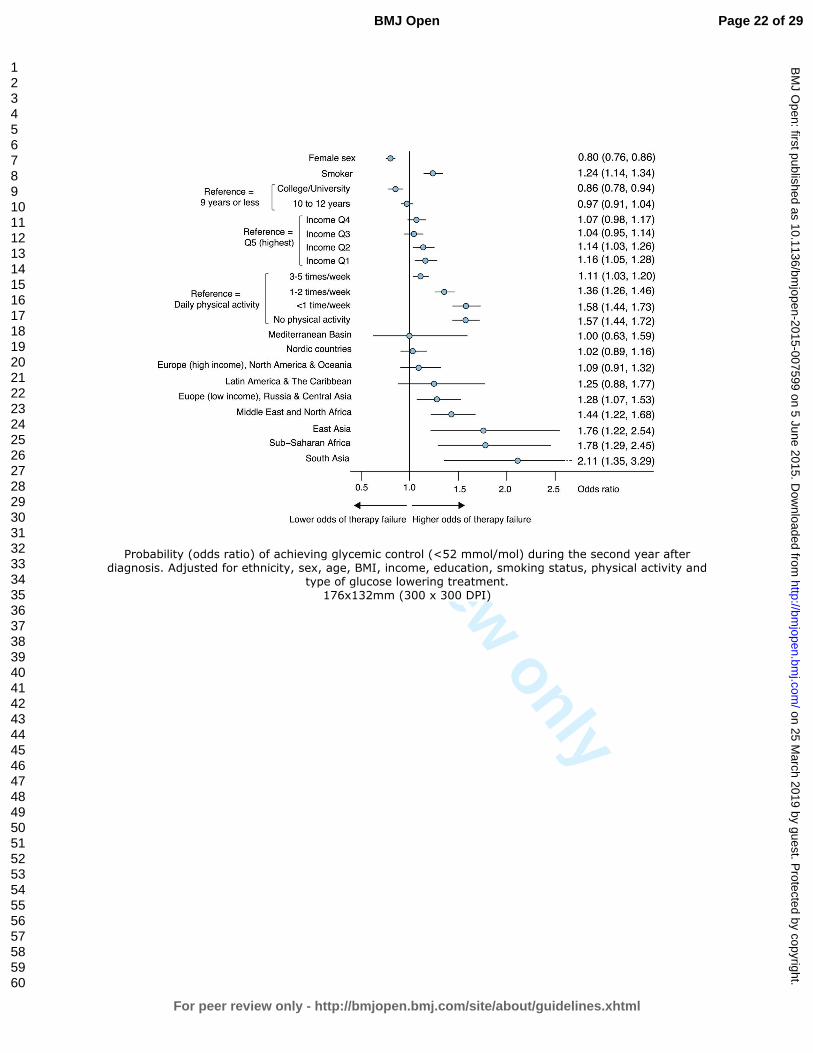
For peer review only
Probability (odds ratio) of achieving glycemic control (<52 mmol/mol) during the second year after diagnosis. Adjusted for ethnicity, sex, age, BMI, income, education, smoking status, physical activity and
type of glucose lowering treatment. 176x132mm (300 x 300 DPI)
Page 22 of 29
For peer review only - http://bmjopen.bmj.com/site/about/guidelines.xhtml
BMJ Open
123456789101112131415161718192021222324252627282930313233343536373839404142434445464748495051525354555657585960
on 25 March 2019 by guest. P
rotected by copyright.http://bm
jopen.bmj.com
/B
MJ O
pen: first published as 10.1136/bmjopen-2015-007599 on 5 June 2015. D
ownloaded from
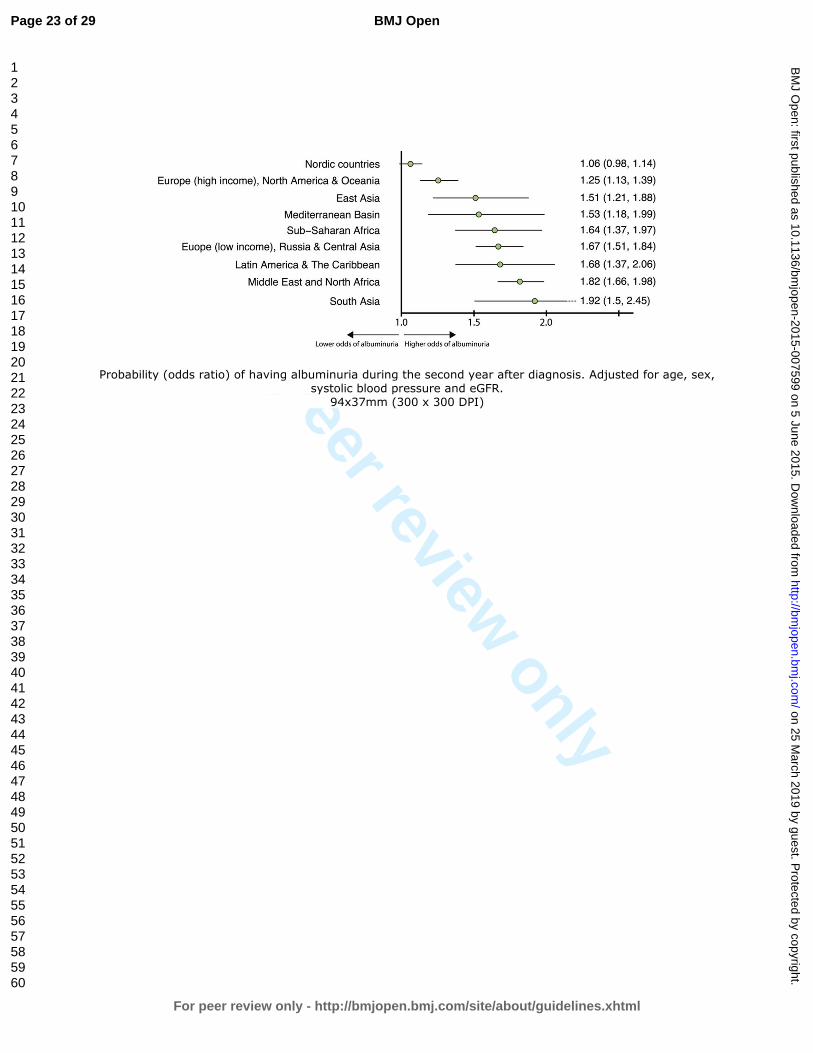
For peer review only
Probability (odds ratio) of having albuminuria during the second year after diagnosis. Adjusted for age, sex, systolic blood pressure and eGFR.
94x37mm (300 x 300 DPI)
Page 23 of 29
For peer review only - http://bmjopen.bmj.com/site/about/guidelines.xhtml
BMJ Open
123456789101112131415161718192021222324252627282930313233343536373839404142434445464748495051525354555657585960
on 25 March 2019 by guest. P
rotected by copyright.http://bm
jopen.bmj.com
/B
MJ O
pen: first published as 10.1136/bmjopen-2015-007599 on 5 June 2015. D
ownloaded from
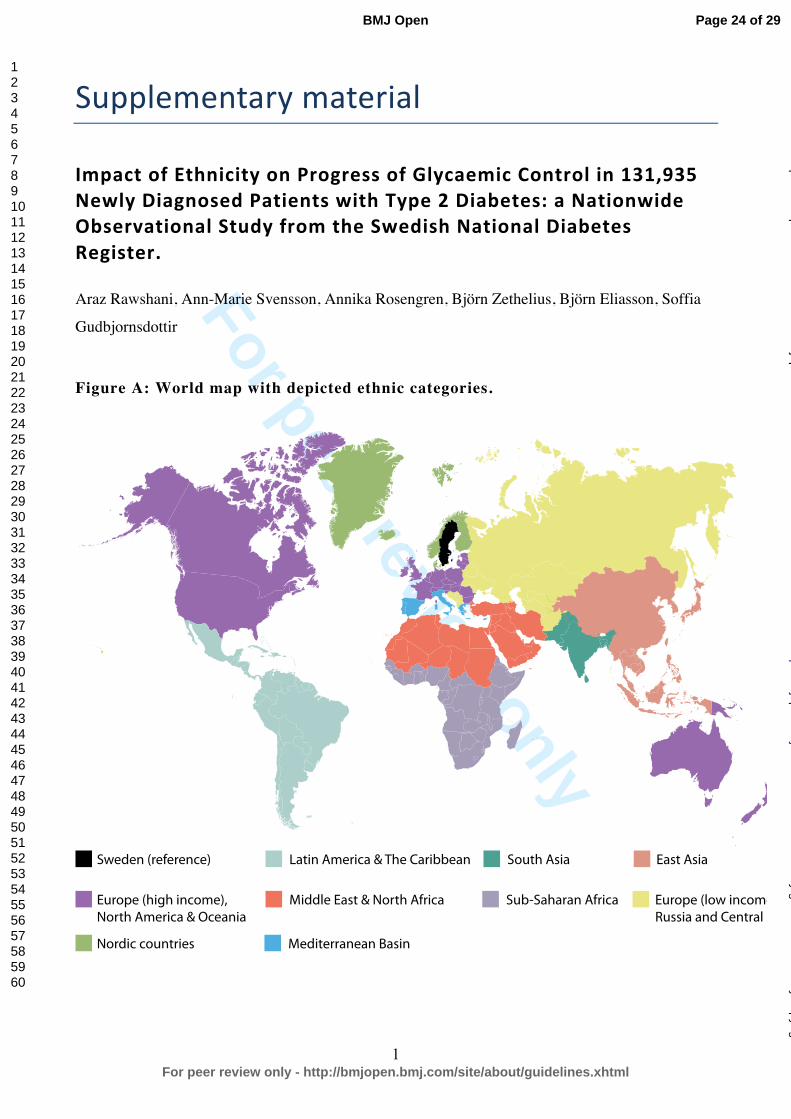
For peer review only
1
Supplementary material
Impact of Ethnicity on Progress of Glycaemic Control in 131,935 Newly Diagnosed Patients with Type 2 Diabetes: a Nationwide Observational Study from the Swedish National Diabetes Register.
Araz Rawshani, Ann-Marie Svensson, Annika Rosengren, Björn Zethelius, Björn Eliasson, Soffia
Gudbjornsdottir
Figure A: World map with depicted ethnic categories.
Sweden (reference)
Europe (high income),North America & Oceania
Nordic countries Mediterranean Basin
Latin America & The Caribbean South Asia
Middle East & North Africa Sub-Saharan Africa
East Asia
Europe (low income),Russia and Central Asia
Page 24 of 29
For peer review only - http://bmjopen.bmj.com/site/about/guidelines.xhtml
BMJ Open
123456789101112131415161718192021222324252627282930313233343536373839404142434445464748495051525354555657585960
on 25 March 2019 by guest. P
rotected by copyright.http://bm
jopen.bmj.com
/B
MJ O
pen: first published as 10.1136/bmjopen-2015-007599 on 5 June 2015. D
ownloaded from
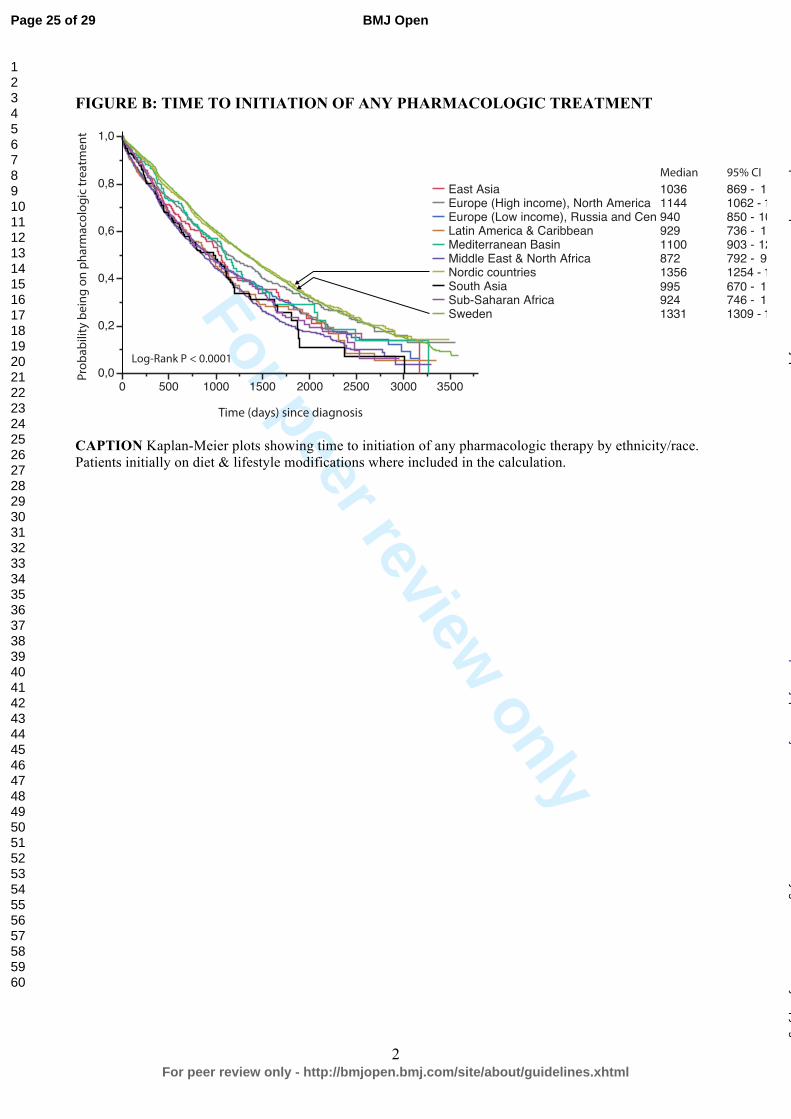
For peer review only
2
FIGURE B: TIME TO INITIATION OF ANY PHARMACOLOGIC TREATMENT
CAPTION Kaplan-Meier plots showing time to initiation of any pharmacologic therapy by ethnicity/race. Patients initially on diet & lifestyle modifications where included in the calculation.
0,0
0,2
0,4
0,6
0,8
1,0
0 500 1000 1500 2000 2500 3000 3500
East AsiaEurope (High income), North America Europe (Low income), Russia and CenLatin America & CaribbeanMediterranean BasinMiddle East & North AfricaNordic countriesSouth AsiaSub-Saharan AfricaSweden
10361144940929110087213569959241331
869 -1062 -850 -736 -903 -792 -1254 -670 -746 -1309 -
11361265
1033106512809421434
111611411351
Log-Rank P < 0.0001
Prob
abili
ty b
eing
on
phar
mac
olog
ic tr
eatm
ent
Time (days) since diagnosis
Median 95% CI
Page 25 of 29
For peer review only - http://bmjopen.bmj.com/site/about/guidelines.xhtml
BMJ Open
123456789101112131415161718192021222324252627282930313233343536373839404142434445464748495051525354555657585960
on 25 March 2019 by guest. P
rotected by copyright.http://bm
jopen.bmj.com
/B
MJ O
pen: first published as 10.1136/bmjopen-2015-007599 on 5 June 2015. D
ownloaded from
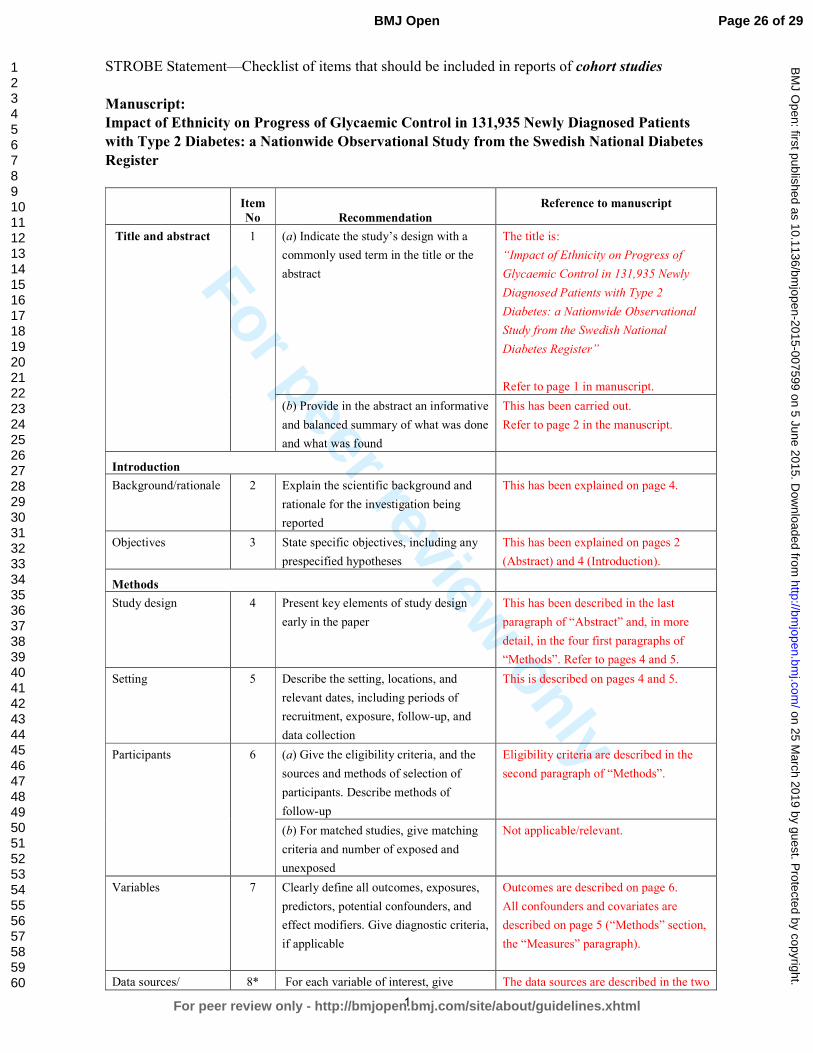
For peer review only
1
STROBE Statement—Checklist of items that should be included in reports of cohort studies
Manuscript:
Impact of Ethnicity on Progress of Glycaemic Control in 131,935 Newly Diagnosed Patients
with Type 2 Diabetes: a Nationwide Observational Study from the Swedish National Diabetes
Register
Item
No Recommendation
Reference to manuscript
Title and abstract 1 (a) Indicate the study’s design with a
commonly used term in the title or the
abstract
The title is:
“Impact of Ethnicity on Progress of
Glycaemic Control in 131,935 Newly
Diagnosed Patients with Type 2
Diabetes: a Nationwide Observational
Study from the Swedish National
Diabetes Register”
Refer to page 1 in manuscript.
(b) Provide in the abstract an informative
and balanced summary of what was done
and what was found
This has been carried out.
Refer to page 2 in the manuscript.
Introduction
Background/rationale 2 Explain the scientific background and
rationale for the investigation being
reported
This has been explained on page 4.
Objectives 3 State specific objectives, including any
prespecified hypotheses
This has been explained on pages 2
(Abstract) and 4 (Introduction).
Methods
Study design 4 Present key elements of study design
early in the paper
This has been described in the last
paragraph of “Abstract” and, in more
detail, in the four first paragraphs of
“Methods”. Refer to pages 4 and 5.
Setting 5 Describe the setting, locations, and
relevant dates, including periods of
recruitment, exposure, follow-up, and
data collection
This is described on pages 4 and 5.
Participants 6 (a) Give the eligibility criteria, and the
sources and methods of selection of
participants. Describe methods of
follow-up
Eligibility criteria are described in the
second paragraph of “Methods”.
(b) For matched studies, give matching
criteria and number of exposed and
unexposed
Not applicable/relevant.
Variables 7 Clearly define all outcomes, exposures,
predictors, potential confounders, and
effect modifiers. Give diagnostic criteria,
if applicable
Outcomes are described on page 6.
All confounders and covariates are
described on page 5 (“Methods” section,
the “Measures” paragraph).
Data sources/ 8* For each variable of interest, give The data sources are described in the two
Page 26 of 29
For peer review only - http://bmjopen.bmj.com/site/about/guidelines.xhtml
BMJ Open
123456789101112131415161718192021222324252627282930313233343536373839404142434445464748495051525354555657585960
on 25 March 2019 by guest. P
rotected by copyright.http://bm
jopen.bmj.com
/B
MJ O
pen: first published as 10.1136/bmjopen-2015-007599 on 5 June 2015. D
ownloaded from
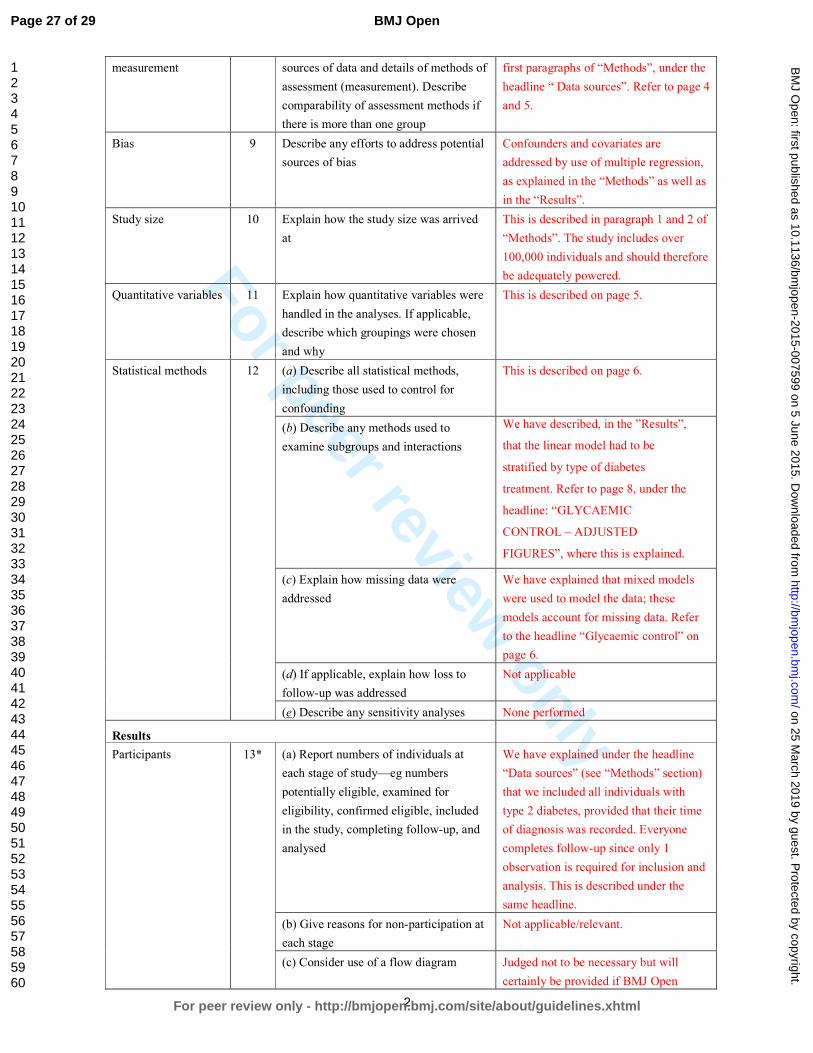
For peer review only
2
measurement sources of data and details of methods of
assessment (measurement). Describe
comparability of assessment methods if
there is more than one group
first paragraphs of “Methods”, under the
headline “ Data sources”. Refer to page 4
and 5.
Bias 9 Describe any efforts to address potential
sources of bias
Confounders and covariates are
addressed by use of multiple regression,
as explained in the “Methods” as well as
in the “Results”.
Study size 10 Explain how the study size was arrived
at
This is described in paragraph 1 and 2 of
“Methods”. The study includes over
100,000 individuals and should therefore
be adequately powered.
Quantitative variables 11 Explain how quantitative variables were
handled in the analyses. If applicable,
describe which groupings were chosen
and why
This is described on page 5.
Statistical methods 12 (a) Describe all statistical methods,
including those used to control for
confounding
This is described on page 6.
(b) Describe any methods used to
examine subgroups and interactions
We have described, in the ”Results”,
that the linear model had to be
stratified by type of diabetes
treatment. Refer to page 8, under the
headline: “GLYCAEMIC
CONTROL – ADJUSTED
FIGURES”, where this is explained.
(c) Explain how missing data were
addressed
We have explained that mixed models
were used to model the data; these
models account for missing data. Refer
to the headline “Glycaemic control” on
page 6.
(d) If applicable, explain how loss to
follow-up was addressed
Not applicable
(e) Describe any sensitivity analyses None performed
Results
Participants 13* (a) Report numbers of individuals at
each stage of study—eg numbers
potentially eligible, examined for
eligibility, confirmed eligible, included
in the study, completing follow-up, and
analysed
We have explained under the headline
“Data sources” (see “Methods” section)
that we included all individuals with
type 2 diabetes, provided that their time
of diagnosis was recorded. Everyone
completes follow-up since only 1
observation is required for inclusion and
analysis. This is described under the
same headline.
(b) Give reasons for non-participation at
each stage
Not applicable/relevant.
(c) Consider use of a flow diagram Judged not to be necessary but will
certainly be provided if BMJ Open
Page 27 of 29
For peer review only - http://bmjopen.bmj.com/site/about/guidelines.xhtml
BMJ Open
123456789101112131415161718192021222324252627282930313233343536373839404142434445464748495051525354555657585960
on 25 March 2019 by guest. P
rotected by copyright.http://bm
jopen.bmj.com
/B
MJ O
pen: first published as 10.1136/bmjopen-2015-007599 on 5 June 2015. D
ownloaded from
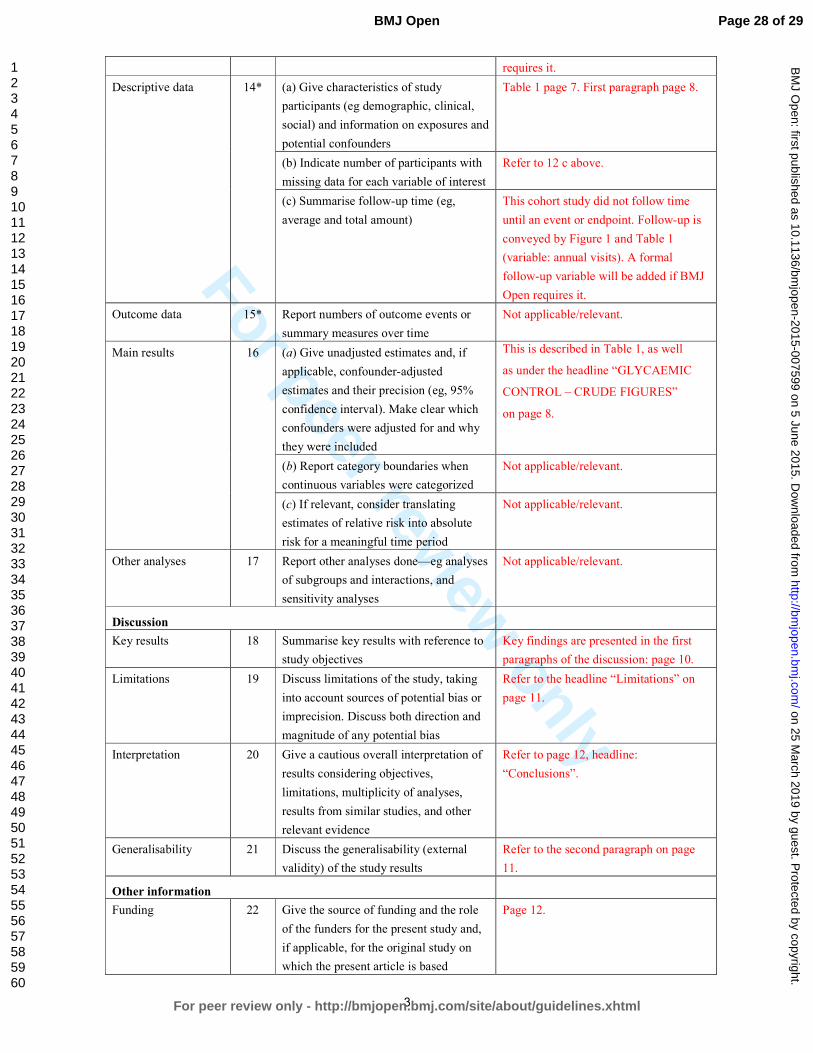
For peer review only
3
requires it.
Descriptive data 14* (a) Give characteristics of study
participants (eg demographic, clinical,
social) and information on exposures and
potential confounders
Table 1 page 7. First paragraph page 8.
(b) Indicate number of participants with
missing data for each variable of interest
Refer to 12 c above.
(c) Summarise follow-up time (eg,
average and total amount)
This cohort study did not follow time
until an event or endpoint. Follow-up is
conveyed by Figure 1 and Table 1
(variable: annual visits). A formal
follow-up variable will be added if BMJ
Open requires it.
Outcome data 15* Report numbers of outcome events or
summary measures over time
Not applicable/relevant.
Main results 16 (a) Give unadjusted estimates and, if
applicable, confounder-adjusted
estimates and their precision (eg, 95%
confidence interval). Make clear which
confounders were adjusted for and why
they were included
This is described in Table 1, as well
as under the headline “GLYCAEMIC
CONTROL – CRUDE FIGURES”
on page 8.
(b) Report category boundaries when
continuous variables were categorized
Not applicable/relevant.
(c) If relevant, consider translating
estimates of relative risk into absolute
risk for a meaningful time period
Not applicable/relevant.
Other analyses 17 Report other analyses done—eg analyses
of subgroups and interactions, and
sensitivity analyses
Not applicable/relevant.
Discussion
Key results 18 Summarise key results with reference to
study objectives
Key findings are presented in the first
paragraphs of the discussion: page 10.
Limitations 19 Discuss limitations of the study, taking
into account sources of potential bias or
imprecision. Discuss both direction and
magnitude of any potential bias
Refer to the headline “Limitations” on
page 11.
Interpretation 20 Give a cautious overall interpretation of
results considering objectives,
limitations, multiplicity of analyses,
results from similar studies, and other
relevant evidence
Refer to page 12, headline:
“Conclusions”.
Generalisability 21 Discuss the generalisability (external
validity) of the study results
Refer to the second paragraph on page
11.
Other information
Funding 22 Give the source of funding and the role
of the funders for the present study and,
if applicable, for the original study on
which the present article is based
Page 12.
Page 28 of 29
For peer review only - http://bmjopen.bmj.com/site/about/guidelines.xhtml
BMJ Open
123456789101112131415161718192021222324252627282930313233343536373839404142434445464748495051525354555657585960
on 25 March 2019 by guest. P
rotected by copyright.http://bm
jopen.bmj.com
/B
MJ O
pen: first published as 10.1136/bmjopen-2015-007599 on 5 June 2015. D
ownloaded from
For peer review only
4
*Give information separately for exposed and unexposed groups.
Note: An Explanation and Elaboration article discusses each checklist item and gives methodological background and
published examples of transparent reporting. The STROBE checklist is best used in conjunction with this article (freely
available on the Web sites of PLoS Medicine at http://www.plosmedicine.org/, Annals of Internal Medicine at
http://www.annals.org/, and Epidemiology at http://www.epidem.com/). Information on the STROBE Initiative is
available at http://www.strobe-statement.org.
Page 29 of 29
For peer review only - http://bmjopen.bmj.com/site/about/guidelines.xhtml
BMJ Open
123456789101112131415161718192021222324252627282930313233343536373839404142434445464748495051525354555657585960
on 25 March 2019 by guest. P
rotected by copyright.http://bm
jopen.bmj.com
/B
MJ O
pen: first published as 10.1136/bmjopen-2015-007599 on 5 June 2015. D
ownloaded from