Embed Size (px)
Citation preview

BioMed CentralBMC Evolutionary Biology
ss
Open AcceResearch articleIdentifying concerted evolution and gene conversion in mammalian gene pairs lasting over 100 million yearsAndrew R Carson1,2 and Stephen W Scherer*1,2Address: 1The Centre for Applied Genomics, Program in Genetics & Genome Biology, The Hospital for Sick Children, Toronto, Ontario, Canada and 2Department of Molecular Genetics, University of Toronto, Ontario, Canada
Email: Andrew R Carson - [email protected]; Stephen W Scherer* - [email protected]
* Corresponding author
AbstractBackground: Concerted evolution occurs in multigene families and is characterized by stretchesof homogeneity and higher sequence similarity between paralogues than between orthologues.Here we identify human gene pairs that have undergone concerted evolution, caused by ongoinggene conversion, since at least the human-mouse divergence. Our strategy involved theidentification of duplicated genes with greater similarity within a species than between species.These genes were required to be present in multiple mammalian genomes, suggesting duplicationearly in mammalian divergence. To eliminate genes that have been conserved due to strongpurifying selection, our analysis also required at least one intron to have retained high sequencesimilarity between paralogues.
Results: We identified three human gene pairs undergoing concerted evolution (BMP8A/B,DDX19A/B, and TUBG1/2). Phylogenetic investigations reveal that in each case the duplicationappears to have occurred prior to eutherian mammalian radiation, with exactly two paraloguespresent in all examined species. This indicates that all three gene duplication events wereestablished over 100 million years ago.
Conclusion: The extended duration of concerted evolution in multiple distant lineages suggeststhat there has been prolonged homogenization of specific segments within these gene pairs.Although we speculate that selection for homogenization could have been utilized in order tomaintain crucial homo- or hetero- binding domains, it remains unclear why gene conversion haspersisted for such extended periods of time. Through these analyses, our results demonstrateadditional examples of a process that plays a definite, although unspecified, role in molecularevolution.
BackgroundOver the past few decades, gene duplications have beenrecognized as one of the main forces capable of generatinglarge gene families with novel functions. In fact, duplica-tions are thought to be one of the primary sources of
adaptive evolution given that they generate new geneticmaterial, and in doing so, create substrates that canundergo divergence through mutations [1]. Thus, geneduplications have the potential to affect genomic evolu-tion dependent on the results of these mutations.
Published: 7 July 2009
BMC Evolutionary Biology 2009, 9:156 doi:10.1186/1471-2148-9-156
Received: 7 April 2009Accepted: 7 July 2009
This article is available from: http://www.biomedcentral.com/1471-2148/9/156
© 2009 Carson and Scherer; licensee BioMed Central Ltd. This is an Open Access article distributed under the terms of the Creative Commons Attribution License (http://creativecommons.org/licenses/by/2.0), which permits unrestricted use, distribution, and reproduction in any medium, provided the original work is properly cited.
Page 1 of 16(page number not for citation purposes)

BMC Evolutionary Biology 2009, 9:156 http://www.biomedcentral.com/1471-2148/9/156
Duplicated genes are subject to the same forces that affectthe evolution of single copy genes. These include geneticdrift, which is opposed by negative or purifying selection,and positive selection, which can fix advantageouschanges faster than expected by chance [2-4]. Addition-ally, other forces affect the evolution of duplicated genes.Functional redundancy can permit the accumulation ofchanges in one copy of the gene without negative conse-quences to an organism's proteome. Although this oftenleads to silencing or deletion of one gene copy, it can alsolead to improvements on the ancestral functions or thedevelopment of new functions [5-9]. Subfunctionaliza-tion [6,7], where an ancestral gene's functions are sharedbetween the descendant genes, and neofunctionalization[5], where one copy acquires a novel gene function, arepossible consequences of divergence following geneduplication.
Most duplicated genes tend to diverge over time [1,10].However, in some instances the genes, or parts of thegenes, evolve together in a process known as concertedevolution [8,9,11]. Essentially, instead of gene sequencesbecoming progressively more dissimilar, the sequencesremain highly similar or even identical. Although lowdivergence can also be explained by strong purifying selec-tion, these two phenomena can be distinguished by com-parisons across species. The hallmark of concertedevolution is that high sequence similarity between genesis maintained within a species (between paralogues)while divergence occurs between species (between ortho-logues). This is distinct from strong purifying selection,where divergence is impeded both within and betweenspecies such that the function, which is highly susceptibleto changes, is preserved.
Concerted evolution between duplicated genes can becaused by ongoing genetic exchange called gene conver-sion [12-14]. Gene conversion is the non-reciprocalexchange of genetic material between homologoussequences. This process can have both positive and nega-tive consequences. Beneficially, gene conversion candecrease mutational load, eliminate deleterious muta-tions, and spread advantageous alleles, thus playing a rolein adaptive evolution [13,14]. Conversely, gene conver-sion can produce harmful phenotypes, such as Gaucherdisease [15] and Shwachman-Diamond syndrome [16],when disruptive mutations from a pseudogene are substi-tuted into its functional duplicate. The duration and fre-quency of the exchange between duplicated sequences isthought to be variable [11] and appears to depend uponseveral factors, including the distance between sequences.Several studies have shown a negative correlation betweenthe frequency of gene conversion and the distancebetween homologous sequences [17,18], with a drop-offin frequency at distances greater than 55 kb [19]. Addi-
tionally, regions undergoing gene conversion may be dis-rupted by a few key mutations, such as the insertion ofmobile elements or by the gradual accumulation of singlenucleotide mutations [20]. Gene conversion can be a sto-chastic process, and it is unclear what effect selection hason the duration of gene conversion.
Gene conversion is also variable in the amount of genesequence involved. While some entire gene sequenceshave undergone concerted evolution, others have amosaic evolution pattern. Under mosaic evolution, seg-ments of the gene are homogenized and evolve in concert,while others diverge without gene conversion [21]. Thiscan complicate phylogenetic reconstruction, often pro-ducing trees that appear to indicate that multiple, inde-pendent and parallel duplications have occurred [20,22].
Characteristically, regions undergoing gene conversionhave an elevated GC content relative to flankingsequences [23-25]. Intragenically, this can be seen withinintrons as well as at the third codon positions withinexons (GC3). An increased GC content can be explainedby the biased gene conversion (BGC) model, whichasserts that heteroduplexes formed during gene conver-sion are preferentially repaired to GC alleles over AT alle-les [24,25]. This leads to an increase in GC fixation and anelevated GC content. Biased DNA repair has beenreported in mammalian cells, lending weight to thismodel [26]. This characteristic increase in GC content canbe used in support of other evidence that a region isundergoing gene conversion.
Here we performed a whole genome analysis to look forduplicated genes undergoing concerted evolution. Previ-ous whole genome analyses have been conducted lookingfor gene conversion in C. elegans [17], S. cerevisiae [18],rodent genomes [19], bacterial genomes [27], the ricegenome [28] and D. melanogaster [29]. Until recently [30],there were no whole genome analyses of gene conversionin the human genome. Benovoy and Drouin [30] recentlyused a whole genome approach to identify examples ofgene conversion in the human genome. However, theiranalysis was restricted to multigene families with three ormore members. Our study differs in that we attempt toidentify gene pairs (gene families with only two mem-bers) created by duplication early in mammalian radia-tion that have maintained regions of high sequencesimilarity due to ongoing gene conversion.
Our goal was to identify examples of gene conversion pre-served in all, or a large majority, of mammalian species. Asmall number of other genes, such as Oxct2a and Oxct2b,EMR2 with CD97 and EMR3, TLR1 and TLR6, and CCR2and CCR5 [31-34], have been reported to be evolving inconcert by gene conversion in multiple lineages. By look-
Page 2 of 16(page number not for citation purposes)

BMC Evolutionary Biology 2009, 9:156 http://www.biomedcentral.com/1471-2148/9/156
ing for duplicated genes in both the human and mousegenomes with greater sequence percent identity betweenparalogues than between orthologues, we identified threegene pairs with signals of long enduring concerted evolu-tion: BMP8A/B, DDX19A/B, and TUBG1/2. Two of these(DDX19A/B, and TUBG1/2) are novel examples, whileone (BMP8A/B) has been reported previously [34]. Wealso detail a detection strategy that can be applied to iden-tify additional examples of genes evolving by this phe-nomenon. We performed extensive phylogenetic studiesand analyzed the selective pressures acting on the genepairs as well as their relative expression patterns in severalhuman tissues. Through these examinations we show thatgene conversion has been occurring between the genepairs for over 100 million years, and the extended dura-tion of this process in multiple distant lineages suggeststhat there has been prolonged selection for homogeniza-tion of segments within the genes.
ResultsIdentification of Gene PairsUsing our search criteria, outlined in Methods [also seeAdditional file 1], we were able to identify three gene pairsas candidate loci for concerted evolution. Due to the filter-ing steps we utilized, each gene pair is less than 1 Mb apartand shares high sequence similarity (>97%) in at least twoconsecutive exons and their intervening intron. The threegene pairs we identified are: BMP8A/B, DDX19A/B, andTUBG1/2. Figure 1 shows the gene structure and orienta-tion of these gene pairs in the human genome.
BMP8A and BMP8B are members of the bone morpho-genesis protein family, a subfamily of the transforminggrowth factor type beta (TGF-β) supergene family, foundon chromosome 1p34 approximately 235 Kb apart in aninverted orientation. Each gene has seven exons with anopen reading frame (ORF) of 1209 bps encoding a proteincontaining 402 amino acids. Bone morphogenesis pro-teins are known to be involved in vertebrate development[35,36]. While little has been reported about their func-tion in humans, this gene pair has been linked to involve-ment in reproductive system development in the mouse(Bmp8a is expressed in the epididymis in males and thedecidual cells of the uterus in pregnant females; Bmp8b isexpressed in the germ cells of the testis in males and thetrophoblast cells of the placenta in pregnant females)[37,38]. Concerted evolution of this gene pair was previ-ously reported [34].
DDX19A and DDX19B are DEAD box helicase genes thatare found on chromosome 16q22.1. These genes are tan-demly duplicated (direct orientation) 13 Kb apart. Bothgenes have 12 exons but differ by 3 bps (CTG) in theirORFs. While DDX19A's ORF transcript size is 1437 bps(encoding a 478 aa protein), DDX19B has an additional
codon (1440 bps ORF encoding a 479 aa protein). Usingchicken, which has a single orthologue of DDX19, as anoutgroup, it is apparent that DDX19A has undergone adeletion of 3 bps near the start of exon 3. This deletion isseen in all investigated mammalian orthologues ofDDX19A, including opossum. Although the functions ofthese genes are not well characterized, both genes arethought to be ATP-dependent RNA helicases that areinvolved in mRNA transport from the nucleus [39].
TUBG1 and TUBG2 are gamma tubulin genes on chromo-some 17q21.31 and are situated in direct orientationapproximately 45 Kb apart. Both genes have 11 exonswith an ORF size of 1356 bps, encoding a protein with451 amino acids. The gamma tubulin genes are compo-nents of the microtubule organizing centers where theyplay a central role in the nucleation of microtubules[40,41].
Identification of OrthologuesUsing various techniques, including BLAT [42], BLAST[43] and RT-PCR, we identified homologues of each genein additional organisms. In all three cases, orthologues ofboth copies within the gene pair were identified in euthe-rian mammals, while only a single orthologue was foundin non-mammalian vertebrates. Also, in each mammalianspecies investigated, only two copies of each gene couldbe identified, indicating that these multigene familieshave a consistent copy number of two in mammals. Inter-estingly, only a single orthologue of BMP8A/B was foundin the opossum, while orthologues appear to exist forboth genes from the DDX19A/B and TUBG1/2 gene pairsin this organism. Although the low sequence coverage andincomplete assembly of the opossum genome could pre-vent the identification of a second BMP8 orthologue,another explanation involves different timings for the ori-gins of these gene pairs. In each case, since two ortho-logues are present in all eutherian mammals examined,the most parsimonious explanation is that a duplicationevent occurred early in mammalian evolution. ForBMP8A/B, the absence of the duplication in opossum sug-gests that the duplication event occurred after the diver-gence of the opossum lineage (order Marsupialia) from thearmadillo (order Edentata). This would place the duplica-tion event somewhere between 129 and 173 million yearsago (MYA) [44]. For DDX19A/B and TUBG1/2, the pres-ence of the duplication in opossum suggests that theduplication event is older, occurring before the divergenceof opossum lineage (>173 MYA).
Phylogenetic AnalysesWe created phylogenetic trees using two different meth-ods, Neighbor-joining (Figure 2) and maximum likeli-hood [see Additional file 2], to examine the evolution ofthe duplicated gene pairs in the mammalian lineage.
Page 3 of 16(page number not for citation purposes)
BMC Evolutionary Biology 2009, 9:156 http://www.biomedcentral.com/1471-2148/9/156
Page 4 of 16(page number not for citation purposes)
Structure and orientation of gene pairsFigure 1Structure and orientation of gene pairs. Gene structures of a) BMP8A/B, b) DDX19A/B and c) TUBG1/2 are presented. While BMP8A/B are in an inverted orientation with respect to each other, DDX19A/B and TUBG1/2 are in a direct orientation. The chromosomal band and distances between the gene pairs is also shown. Light grey boxes represent regions that show high sequence identity (>97%) between the gene pairs (determined by mVISTA).

BMC Evolutionary Biology 2009, 9:156 http://www.biomedcentral.com/1471-2148/9/156
Page 5 of 16(page number not for citation purposes)
Neighbor-joining trees of gene pairsFigure 2Neighbor-joining trees of gene pairs. Neighbor-joining trees of gene pairs a) BMP8A/B, b) DDX19A/B and c) TUBG1/2 were created in MEGA3 using a Tamura-Nei model of sequence evolution. Opossum Bmp8, chicken Ddx19 and chicken Tubg were used as outgroups to root the trees. Bootstrap values (10,000 replicates) are shown on the interior branches of the tree. A distance scale is shown below each tree. Underlined species in a) are missing exon 1, preventing the use of this exon in the phylogenetic analysis (see Methods). Additionally, maximum likelihood trees were created for comparison and show highly similar patterns of evolution with the above trees [see Additional file 2].

BMC Evolutionary Biology 2009, 9:156 http://www.biomedcentral.com/1471-2148/9/156
Comparison of the trees created by these two differentmethods showed that the branching pattern and nodestructure were highly similar in every case.
Generally, duplicated genes that undergo divergent evolu-tion display a tree in which the orthologues cluster and aremonophyletic. In contrast, duplicated genes that evolve ina concerted fashion display trees where paralogues cluster.Examining the phylogenetic trees in Figure 2, it is appar-ent that these trees show signatures of both types of evo-lution. For example, in Figure 2b, DDX19A and its threeprimate orthologues are monophyletic, as is DDX19B andits primate orthologues. A similar phylogeny is also seenin the rodent lineage. This pattern is typical of divergentevolution. In contrast, the pattern for dog, cow, horse andopossum is distinct in that the paralogues group together.This could be indicative of concerted evolution. An alter-nate explanation for this pattern involves multiple inde-pendent duplications. DDX19A/B's phylogeny could beexplained by six independent duplications (in primates,rodents, dog, cow, horse and opossum). However, a singleduplication that predates the mammalian divergencewould be a more parsimonious explanation. In thishypothesis, mosaic evolution, where some exons evolvedivergently and others evolve concertedly, would explainthe mixture of evolutionary patterns seen in the phyloge-netic trees.
To test this hypothesis, we performed a sliding windowanalysis on the gene pairs [see Additional files 3 and 4]then built new phylogenetic trees (Figure 3) after separat-ing the exons into divergently or concertedly evolving cat-egories [also see Additional file 5]. Both analyses favor theconclusion that these gene pairs are evolving in a mosaicpattern. The exons were categorized as divergently or con-certedly evolving using a combination of the mVISTAidentities shown in Figure 1, the sliding window plots [seeAdditional files 3 and 4], and a visual inspection of themultiple alignments. Figure 3 shows that categorizing theexons before building phylogenetic trees is sufficient toseparate the two signatures of evolution observed in Fig-ure 2 [also see Additional file 5]. The divergent gene treesfor DDX19A/B and TUBG1/2 (Figure 3b and 3c) showmonophyletic clades in which all the eutherian mammalorthologues cluster. This phylogeny is not seen forBMP8A/B, except for in the rodent lineage, but can beexplained by the greater stretch of high similarity betweenparalogues in non-rodent mammals (Figure 1 and slidingwindow analysis [see Additional files 3 and 4]). In con-trast, the convergent gene trees for all three gene pairs (Fig-ure 3d, e and 3f) have paralogues grouping together inalmost all instances. The only exceptions are the humanand chimpanzee branches in DDX19A/B and TUBG1/2.These phylogenetic trees illustrate that these gene pairshave evolved in a mosaic pattern. A summary of the per-
cent similarity between the human genes in divergent andconcerted regions was also generated [see Additionalfile 6].
Evidence of Gene ConversionOne cause of concerted evolution is gene conversion. Tolook for statistically significant evidence of homogeniza-tion, we used the program Geneconv [45]. Multiple align-ments, both of the ORFs and the genomic sequences, wereused as input for Geneconv in order to detect candidatefragments of aligned gene conversion. The results identifyseveral statistically significant fragments in both the ORFalignments and the genomic sequence alignments (Table1). From the table, it is clear that the regions detected byGeneconv overlap to a large degree with the peaks of highsequence identity between paralogues (Figure 1 and thesliding window analysis [see Additional files 3 and 4]).
Increased GC content at the third codon position and inintrons has also been used as evidence for gene conver-sion [25,33]. GC content was calculated for each gene inboth the divergent and concerted regions in multiple spe-cies. The average GC content was calculated at each of thecodon positions and plotted with p-values ascertainedwithin the human sequences using a Fisher Exact Testand/or Yates-corrected Chi-square test (Figure 4). ForBMP8A/B, only rodent sequences were used because inother species all of the exons appear to be evolving in con-cert. From these plots, it is clear that there is a significantdifference (P < 0.05) in the third codon position forDDX19A/B and TUBG1/2 (Figure 4b, c). However,although there is an increase in the third codon positionof the rodent Bmp8a/b (Figure 4a), the difference is notsignificant. A similar comparison was undertaken usingthe introns from these three gene pairs. Again, a signifi-cant increase in GC content is seen in the introns thatappear to be evolving under concerted evolution, asopposed to the introns evolving divergently as well as 10kb of upstream and downstream flanking sequence (Fig-ure 4d). Taken together with the results from Geneconv,the increase in GC content suggests that gene conversionis the cause of the concerted evolution in these three genepairs.
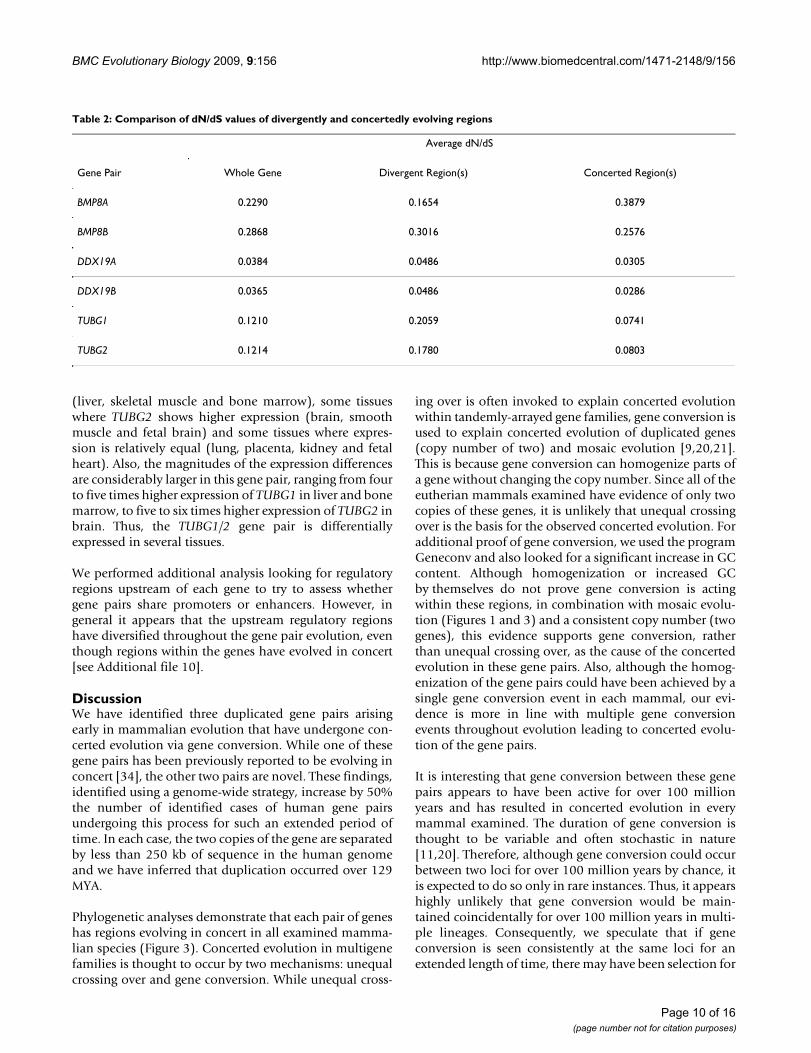
Sequence Evolution and Functional DomainsWe investigated the selective pressures working on thesegene pairs by calculating the dN/dS ratios between theorthologues. Of interest was whether the regions evolvingdivergently were under different selective pressures thanthe regions evolving in concert. Average dN/dS values, cal-culated using pairs of orthologues, are shown in Table 2.Values of dN/dS are calculated for the whole gene, as wellas the regions evolving divergently and concertedly (aspreviously defined). As you can see from this table, five ofthe six values of dN/dS for the concerted regions are lower
Page 6 of 16(page number not for citation purposes)

BMC Evolutionary Biology 2009, 9:156 http://www.biomedcentral.com/1471-2148/9/156
Page 7 of 16(page number not for citation purposes)
Neighbor-joining trees showing mosaic evolution within gene pairsFigure 3Neighbor-joining trees showing mosaic evolution within gene pairs. Neighbor-joining trees of gene pairs a) and d) BMP8A/B, b) and e) DDX19A/B and c) and f) TUBG1/2 were created in MEGA3 using a Tamura-Nei model of sequence evolu-tion. Exons were divided into two categories and phylogenetic trees, showing a), b) and c) divergent evolution or d), e) and f) concerted evolution, are illustrated. Opossum Bmp8, chicken Ddx19 and chicken Tubg were used as outgroups to root the trees. Bootstrap values (10,000 replicates) are shown on the interior branches of the tree. A distance scale is shown below each tree. Underlined species in a) and d) are missing exon 1, preventing the use of this exon in the phylogenetic analysis. Addi-tionally, maximum likelihood trees were created for comparison, showing highly similar patterns of evolution with the above trees [see Additional file 5].

BMC Evolutionary Biology 2009, 9:156 http://www.biomedcentral.com/1471-2148/9/156
than the dN/dS values for the divergent regions. This sug-gests that either these regions are under more negativeselective pressure or it could indicate that a consequenceof gene conversion is lower nonsynonymous divergencebetween sequences.
We also performed sliding window and PAML analyses tofurther examine the dN/dS values in the gene pairs [seeAdditional files 7 and 8]. Although the results from someanalyses show suggestions of positive selection, no signif-icant evidence was found. Therefore, there does notappear to be an overlap between the regions undergoingconcerted evolution and positive selection. Conversely,there is some evidence indicating that the regions under-going concerted evolution have lower dN/dS values, sug-gesting that both gene conversion and purifying selectionare acting at these sites.
Additionally, we looked to see if the regions undergoingconcerted evolution contained or overlapped with specificfunctional domains within these genes. However, in eachcase there did not appear to be any significant overlap ofthe functional domains with the regions undergoing con-certed evolution [see Additional file 9]. Although parts ofsome domains overlap regions of concerted evolution,there is no clear relationship that could indicate the selec-tion for gene conversion limited to a particular domain. Insome cases, the exons involved in concerted evolution falloutside of the known functional domains. This couldindicate that there is another functional domain in theseexons that has not been previously described.
Gene Expression AnalysisWe performed gene expression analyses to determinewhether there is differential tissue expression within the
gene pairs. We used qPCR and pyrosequencing assays toattain a ratio of expression between the two members ofthe gene pair. However, the BMP8A/B gene pair was resist-ant to both assays. Therefore, although we were able toobtain measurements of expression for DDX19A/B andTUBG1/2, the expression analysis of BMP8A/B is limitedto previously published reports in mice.
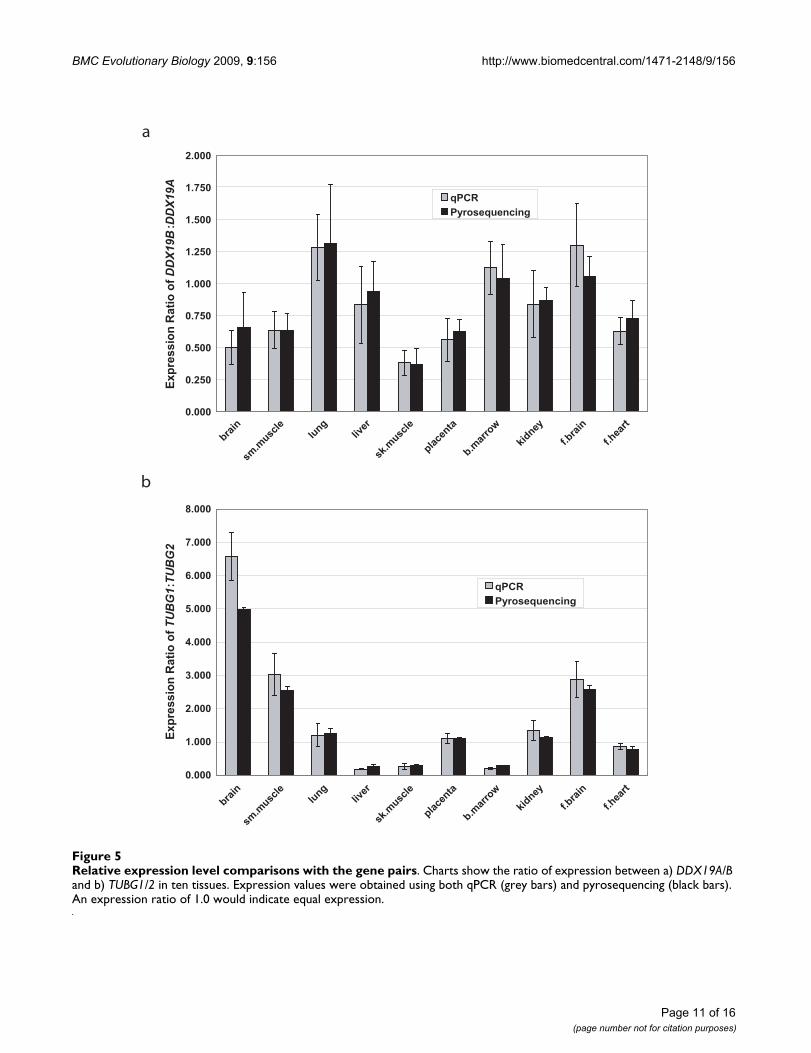
For DDX19A/B, we were able to use both qPCR (exon 7)and pyrosequencing (exons 8 and 10) to obtain expres-sion ratios (Figure 5a). Although the values for each assayare slightly different, the overall trend is consistent. Thereappears to be several tissues where the expression level ofthe two genes is similar (lung, liver, bone marrow, kidneyand fetal brain). However, in several other tissues theexpression level of DDX19A is higher than the expressionlevel of DDX19B (brain, smooth muscle, skeletal muscle,placenta, and fetal heart). In these tissues, it appears thatDDX19B is expressed at about one half to three quartersthe level of DDX19A, with the highest degree of differen-tial expression seen in skeletal muscle.
Although the expression level difference betweenDDX19A and DDX19B is not considerable in most tissues,the expression ratio for TUBG1 and TUBG2 is moreremarkable (Figure 5b). Again we used both qPCR (exon11) and pyrosequencing (exon 8) to obtain expressionratios. Similarly, both assays are relatively consistent intheir findings, although there are some small differencesin their absolute values. Interestingly, for this gene pairthere are several tissues where there is a significant differ-ence in the level of expression between the two genes.Unlike DDX19A/B, where either the expression was equalor one gene (DDX19A) was higher in expression, there aresome tissues where TUBG1 shows higher expression
Table 1: Positive fragments identified by Geneconv
ORF1 Genomic DNA1,2
Primate Rodent Human Mouse
BMP8A/B (Exons 1–5h) (Exons 2–4r) Exon 1-Intron 1 Intron 1-Intron 3Intron 3-Intron 6 Intron 4-Intron 5
DDX19A/B Exons 8–12a Exons 8–12a Exon 8-Intron 8 Exon 8-Exon 12Exon 10-Intron 10Intron 10-Intron 11
TUBG1/2 Exons 2–3h, c, rh Exons 6–10a Intron 1-Intron 3 Intron 2-Exon 3Exons 7–11c, o, rh Intron 6-Intron 7 Exon 7-Intron 10
Intron 8-Intron 10
1 Exons were included if >50 bps were within the positive fragment.2 Introns were included if >100 bps were within the positive fragment.h Human, c chimp, o orangutan, rh rhesus macaque, r rat, a all primates or rodents.Hits enclosed by brackets are positive pairwise fragments only. P-value for that region in the global analysis is not significant (>0.05).Hits within genomic DNA span both introns and exons.
Page 8 of 16(page number not for citation purposes)

BMC Evolutionary Biology 2009, 9:156 http://www.biomedcentral.com/1471-2148/9/156
Page 9 of 16(page number not for citation purposes)
GC content analysis within the gene pairsFigure 4GC content analysis within the gene pairs. Charts compare the GC content of regions evolving in concert with regions evolving divergently. The GC contents at each codon position within gene pairs a) BMP8A/B, b) DDX19A/B and c) TUBG1/2 are shown, along with d) the GC content of introns and 10 kb of upstream and downstream flanking sequence of each gene. GC contents were calculated as an average of five (BMP8A/B) or eight (DDX19A/B and TUBG1/2) multiple sequences (available upon request). Statistical tests (Fisher-Exact test and Yates-corrected Chi-square test) were calculated using the GC content in the human sequences and used to look for significance. P-values less than 0.05 are indicated by *, while P-values less than 0.01 are indicated by **.
BMC Evolutionary Biology 2009, 9:156 http://www.biomedcentral.com/1471-2148/9/156
(liver, skeletal muscle and bone marrow), some tissueswhere TUBG2 shows higher expression (brain, smoothmuscle and fetal brain) and some tissues where expres-sion is relatively equal (lung, placenta, kidney and fetalheart). Also, the magnitudes of the expression differencesare considerably larger in this gene pair, ranging from fourto five times higher expression of TUBG1 in liver and bonemarrow, to five to six times higher expression of TUBG2 inbrain. Thus, the TUBG1/2 gene pair is differentiallyexpressed in several tissues.
We performed additional analysis looking for regulatoryregions upstream of each gene to try to assess whethergene pairs share promoters or enhancers. However, ingeneral it appears that the upstream regulatory regionshave diversified throughout the gene pair evolution, eventhough regions within the genes have evolved in concert[see Additional file 10].
DiscussionWe have identified three duplicated gene pairs arisingearly in mammalian evolution that have undergone con-certed evolution via gene conversion. While one of thesegene pairs has been previously reported to be evolving inconcert [34], the other two pairs are novel. These findings,identified using a genome-wide strategy, increase by 50%the number of identified cases of human gene pairsundergoing this process for such an extended period oftime. In each case, the two copies of the gene are separatedby less than 250 kb of sequence in the human genomeand we have inferred that duplication occurred over 129MYA.
Phylogenetic analyses demonstrate that each pair of geneshas regions evolving in concert in all examined mamma-lian species (Figure 3). Concerted evolution in multigenefamilies is thought to occur by two mechanisms: unequalcrossing over and gene conversion. While unequal cross-
ing over is often invoked to explain concerted evolutionwithin tandemly-arrayed gene families, gene conversion isused to explain concerted evolution of duplicated genes(copy number of two) and mosaic evolution [9,20,21].This is because gene conversion can homogenize parts ofa gene without changing the copy number. Since all of theeutherian mammals examined have evidence of only twocopies of these genes, it is unlikely that unequal crossingover is the basis for the observed concerted evolution. Foradditional proof of gene conversion, we used the programGeneconv and also looked for a significant increase in GCcontent. Although homogenization or increased GCby themselves do not prove gene conversion is actingwithin these regions, in combination with mosaic evolu-tion (Figures 1 and 3) and a consistent copy number (twogenes), this evidence supports gene conversion, ratherthan unequal crossing over, as the cause of the concertedevolution in these gene pairs. Also, although the homog-enization of the gene pairs could have been achieved by asingle gene conversion event in each mammal, our evi-dence is more in line with multiple gene conversionevents throughout evolution leading to concerted evolu-tion of the gene pairs.
It is interesting that gene conversion between these genepairs appears to have been active for over 100 millionyears and has resulted in concerted evolution in everymammal examined. The duration of gene conversion isthought to be variable and often stochastic in nature[11,20]. Therefore, although gene conversion could occurbetween two loci for over 100 million years by chance, itis expected to do so only in rare instances. Thus, it appearshighly unlikely that gene conversion would be main-tained coincidentally for over 100 million years in multi-ple lineages. Consequently, we speculate that if geneconversion is seen consistently at the same loci for anextended length of time, there may have been selection for
Table 2: Comparison of dN/dS values of divergently and concertedly evolving regions
Average dN/dS
Gene Pair Whole Gene Divergent Region(s) Concerted Region(s)
BMP8A 0.2290 0.1654 0.3879
BMP8B 0.2868 0.3016 0.2576
DDX19A 0.0384 0.0486 0.0305
DDX19B 0.0365 0.0486 0.0286
TUBG1 0.1210 0.2059 0.0741
TUBG2 0.1214 0.1780 0.0803
Page 10 of 16(page number not for citation purposes)
BMC Evolutionary Biology 2009, 9:156 http://www.biomedcentral.com/1471-2148/9/156
Page 11 of 16(page number not for citation purposes)
Relative expression level comparisons with the gene pairsFigure 5Relative expression level comparisons with the gene pairs. Charts show the ratio of expression between a) DDX19A/B and b) TUBG1/2 in ten tissues. Expression values were obtained using both qPCR (grey bars) and pyrosequencing (black bars). An expression ratio of 1.0 would indicate equal expression.
BMC Evolutionary Biology 2009, 9:156 http://www.biomedcentral.com/1471-2148/9/156
this process and the maintenance of homogenized genesequences.
The duration and prevalence of gene conversion withinthese gene pairs is suggestive of selection for homogeniza-tion and co-evolution. However, the basis for this pro-posed selection is unclear. Our analyses do not show anyobvious overlap of the regions evolving in concert withprotein domains or known functional sequences. Never-theless, a few previous reports have identified similar pat-terns of concerted evolution which could provide clues asto why gene conversion can be maintained for suchextended periods of time. Three of the reports describingsimilar gene pairs suggest that protein binding co-evolu-tion between two genes might be the basis for the con-served gene conversion. The Vazquez-Salat et al [33]study, which looks at gene conversion between CCR2 andCCR5, suggests that along with homodimerization, theseproteins also heterodimerize, creating a synergistic effectwhich enhances their function. Similarly, Kruithof [31]and Kwakkenbos [32] looked at gene conversion betweenTLR1 and TLR6 and between EMR2, CD97 and EMR3,respectively, and suggest that gene conversion may beused to conserve or co-evolve binding regions. Thesepapers propose that mosaic evolution maintains struc-tural or binding regions, while receptor, ligand binding orother functional domains are allowed to diverge. A similarproposal can be applied to explain the mosaic evolutionidentified in the three gene pairs we investigated. Addi-tionally, the conserved boundaries of the mosaic evolu-tion in multiple species further supports the idea thatwhile some regions are co-evolving to maintain a specificfunction, other regions are diverging in both sequenceand function.
Interestingly, if we look at the protein binding of the genepairs we identified, there are some indications these pro-teins have conserved binding partners. We speculate thatgene conversion has been utilized to maintain perfecthomology at binding sites. Additionally, our results indi-cate that the regions undergoing gene conversion tend tohave lower dN/dS values than the sequences evolvingdivergently (Table 2 and dN/dS sliding window analysis[see Additional files 7 and 8]). This suggests a secondprocess, stronger negative selection in combination withgene conversion, has been utilized to conserve these sites.An example of binding site co-evolution occurs betweenBMP8A and BMP8B, which, like other BMP8 proteins,work as homodimers [46,47]. These proteins could theo-retically interact and form heterodimers, similar to theinteraction of BMPs -4 and -7 [48]. Perhaps a heterodimerwould perform an additional or enhanced function. Sim-ilarly, by assessing TUBG1 and TUBG2 binding partnersusing NCBI's Entrez database [49] it is clear from in vivoevidence, based on affinity capture experiments, that bothproteins interact with PXN, RNF19A, and TUBGCP3. In
this case, although there is no evidence that the proteinproducts of TUBG1/2 interact with each other directly,they may interact with the same partners and thus need toshare a highly similar or identical binding domain.Although similar evidence is not available for DDX19A/B,shared binding partners may be identified by functionalinteraction analyses of these proteins. However, our asser-tion that gene conversion is being selected to maintainbinding sites is purely speculative. While it appears thatselection may be acting to maintain gene conversionwithin these regions, the purpose and evolutionary impli-cations of this process are still largely unknown.
Our gene expression analyses of DDX19A/B and TUBG1/2(Figure 5) indicate that although these genes could sharesome functions, they may act in different tissues. This is aform of subfunctionalization. An example occurs inrodent Bmp8a/b, which have been shown to have differen-tial expression in the mouse reproductive system [37,38].The most striking example of subfunctionalization wasthe differences seen in the expression between TUBG1 andTUBG2. These genes appear to have significantly differentexpression in six of the ten examined tissues (three withhigher TUBG1 expression, and three with higher TUBG2expression). These results agree with previously reportedexpression analyses of these genes, such as the increasedexpression of TUBG1 in liver and TUBG2 in brain [40,41].This could indicate that the genes have different func-tional relevance in different tissues. We attribute the sub-functionalization of tissue expression patterns observedin the three gene pairs to the divergence of regulatoryregions upstream of each gene. When we examine 10 kbof sequence upstream of each gene, we see little to nooverlap in predicted or known enhancers and conservedtranscription binding sites. These results again show themosaic pattern of evolution within these gene pairs,where some regions evolve in concert to maintain func-tion. Other regions, including regulatory regions, are notpreserved, leading to diverging functions and subfunc-tionalization.
ConclusionIn conclusion, it appears that gene or domain homogeni-zation caused by extended periods of gene conversion canresult in concerted evolution that may be maintained, per-haps by selection, throughout mammalian evolution. Wespeculate that this process is being used to maintainhomo- or hetero- binding domains within gene pairs. Wehave identified additional examples of this relatively rareform of evolution and, although it is rare, postulate that ithas relevance within gene duplication evolution
MethodsIdentification of Gene PairsTo search for gene pairs potentially undergoing concertedevolution, we initially used MEGABLAST [50] to compare
Page 12 of 16(page number not for citation purposes)
BMC Evolutionary Biology 2009, 9:156 http://www.biomedcentral.com/1471-2148/9/156
the masked human genome (Build 36; hg18) againstitself. We then filtered out self-hits to look for regions ofthe human genome that have high sequence identity toanother region (>90% identity over 100 bp). Next, usingthe genomic coordinates of all Refseq genes, we look forduplicated regions that overlap genes. At this stage, theseduplications could be intronic or exonic. The next stepinvolved isolating genes that shared higher levels ofsequence identity (>97%) spanning two consecutiveexons and an intervening intron (exon x - intron x - exonx+1 matching exon y - intron y - exon y+1) [see Additionalfile 1]. At this stage, the dataset was large (containing1260 hits) and comprised mainly of recently expandedgene families. To simplify our dataset, we next performedtwo filtering steps that greatly reduced the number of hits.We filtered for i) copy number, keeping only the hits thatwere present as a pair and ii) gene distance, keeping onlythe hits that were located less than 1 Mb apart. We filteredfor copy number because this would eliminate large genefamilies that could be undergoing concerted evolutionthrough the process of unequal crossing over. We filteredfor gene distance since gene conversion seems to beenriched between sequences that are closer together [17-19]. The choice of a 1 Mb cutoff was arbitrary. However, itappears to be generous given that it has been shown thatmost examples of gene conversion have been found sepa-rated by less than 55 kb of intervening sequence [19].
The dataset (containing 182 hits) created by these filteringsteps contained human duplicated gene pairs that sharegreater than 97% identity in at least two consecutive exonsand the intervening intron and are less than 1 Mb apart.However, this dataset is predisposed to contain mostlyrecent duplications. To eliminate these, we manuallycompared our dataset with the mouse genome to see if acorresponding gene pair (or more copies) existed. If onlya single gene was found in mouse, we concluded that theduplication was recent (occurred after the human-mousedivergence). If a gene pair was also seen in mouse, thereare at least two possible explanations: the gene was inde-pendently duplicated in both the mouse and humangenomes or the gene was duplicated a single time in acommon ancestor (before human-mouse divergence). Torule out independent duplications, we manually lookedfor the duplication in other mammals (initially rat anddog, but then expanded to all other mammals available).In some instances the genes did appear to be independ-ently duplicated (such as ELA3A/B, data not shown).However, an ancestral duplication was apparent in threeof the gene pairs. These gene pairs were kept for furtheranalysis.
Analysis of Gene PairsInitial analysis of the gene pairs was performed using theUCSC genome browser [51]. Using the utilities and data
present within this browser, we were able to obtain thesequence and structure of each gene of interest. We thenused mVISTA [52,53] to compare the gene pairs' genomicsequences (exonic and intronic) with one another(Figure 1).
We then expanded our analysis to additional mammaliangenomes. Using a combination of BLAT against the UCSCgenome browser [42], BLAST against multiple NCBI data-bases including the trace archives [43] and RT-PCR usingprimers (available upon request) designed within highlyconserved sequences of the gene, we were able to obtainsequences from multiple mammals. Due to the incom-plete assembly of available DNA sequences from manyorganisms, we were occasionally unable to assemble thefull-length sequence of one or more orthologues. In theseinstances, we eliminated the species from further phyloge-netic analyses. However, for BMP8A/B, exon 1 has a highGC content which prevented PCR amplification of itssequence. Hence, we were unable to confirm this exon infour genes within the eight species with assembledsequences (4 of the 15 genes). Therefore, the phylogeneticanalyses for this gene pair do not include exon 1.
Once these sequences were obtained, we used two differ-ent tools, MEGA3 [54] and PAUP [55] to analyze the phy-logeny of the gene pairs. ClustalW [56] was used to alignthe cDNA sequences. This was followed by manual correc-tion of the alignments. These corrected alignments werethen used to create Neighbor-joining trees under theTamura-Nei model of evolution in MEGA3 and replicatedwith 10,000 bootstraps. To verify the structure of thesetrees, we used PAUP [55,57] to create maximum likeli-hood trees. The likelihood settings used by PAUP weredetermined using MODELTEST [58] to select the best-fitmodel by hLRT (parameters available upon request).Using regions delimited by the mVISTA and sliding win-dow [see Additional files 3 and 4] results, we performedadditional phylogenetic analyses (same methods asdescribed above) to compare the regions evolving diver-gently to the regions evolving in concert.
Evidence of Gene ConversionWe used two methods to look for evidence of gene conver-sion. First we used Geneconv [45] to look for regions thathave statistically significant evidence for gene conversion.For this program, we used alignments created by clustalW[56] (cDNA) and by CHAOS with DIALIGN [59](genomic DNA) as the input. Geneconv was then able todetect candidate fragments of aligned gene conversionbetween the gene pairs (mismatches allowed).
Second, we looked for evidence of increased GC contentin the third codon position and in introns of the regionsundergoing concerted evolution. Using MEGA3, GC con-
Page 13 of 16(page number not for citation purposes)

BMC Evolutionary Biology 2009, 9:156 http://www.biomedcentral.com/1471-2148/9/156
tent was calculated in multiple sequences from bothexonic and intronic sequences, as well as 10 kb ofupstream and downstream flanking sequence of eachgene. These sequences were divided into regions evolvingin concert versus regions evolving divergently. GC con-tents were calculated as an average of five (BMP8A/B) oreight (DDX19A/B and TUBG1/2) multiple sequences. TheGC content was compared between these regions andFisher Exact and Yates-corrected Chi-square statistical testswere performed on the results to look for significantenrichment of GC in regions evolving in concert.
Selection AnalysisWe analyzed the selective pressures on the gene pairs bycalculating the dN/dS ratio between orthologues. Theseratios were calculated between pairs of orthologues usingMEGA3. Values were calculated for the whole genesequence, as well as divergently evolving and concertedlyevolving subsections of the sequence. dN/dS values wereaveraged and then comparisons were drawn between thegene pairs and their different regions.
Gene Expression AnalysisWe used two techniques to look at the relative expressionlevels within the gene pairs. For the first, qPCR, wedesigned unique primers (available upon request) indiverged exons. These primers were chosen such that theydid not span an intron-exon boundary and hence wouldamplify both cDNA and genomic DNA. Genomic DNAcould then be used as a two copy control in the qPCR reac-tion. Thus, amplification of genomic DNA could be usedto create a standard curve for both genes, normalizing theexpression of each gene and allowing their ratio of expres-sion to be calculated. Expression analysis was performedon 10 tissues (brain, smooth muscle, lung, liver, skeletalmuscle, placenta, bone marrow, kidney, fetal brain andfetal heart).
For the second analysis, pyrosequencing, we designedprimers in exons evolving in concert, in sequences thatshare 100% percent identity between the two paralogues.Thus, these primers would be used to amplify both copieswithin the gene pair. Each primer set contained a forwardprimer, a reverse biotinylated primer and a sequencingprimer adjacent to a paralogous sequence variant (PSV)(sequences available upon request). These primers weredesigned within a single exon (such that both cDNA andgenomic DNA would be amplified) following the PSQ 96preparation guide. Pyrosequencing was performed usingthe Pyro Gold Enzyme Mixture (Biotage) and analyzedusing PSQ 96MA 2.1 ID System and amplification ofgenomic DNA was used to normalize the expression levels(since PSV peaks in the genomic DNA should be in a 1:1
ratio). The pyrosequencing analyses were performed onthe same 10 tissues as the qPCR analyses.
AbbreviationsBGC: Biased gene conversion; ORF: Open reading frame;MYA: Million years ago; TFBS: Transcription factor bind-ing sites; PSV: Paralogous sequence variant.
Authors' contributionsWhile ARC was responsible for the acquisition, analysisand interpretation of data, both ARC and SWS wereinvolved in the conception and design of the study andthe preparation and revision of the manuscript. Bothauthors have read and approved the final manuscript.
Additional material
Additional file 1Flow chart of identification strategy. This file shows a flow chart illus-trating the method used to identify potential gene pairs that have under-gone concerted evolution.Click here for file[http://www.biomedcentral.com/content/supplementary/1471-2148-9-156-S1.pdf]
Additional file 2Maximum likelihood trees of gene pairs. This file shows maximum like-lihood trees of gene pairs created in PAUP.Click here for file[http://www.biomedcentral.com/content/supplementary/1471-2148-9-156-S2.pdf]
Additional file 3Sliding window analysis calculating percent identity between ortho-logues and paralogues. This file details a sliding window percent identity analysis that shows the mosaic evolution within the gene pairs. This figure shows the sliding window analysis plot with the percent identities calcu-lated between orthologues and paralogues.Click here for file[http://www.biomedcentral.com/content/supplementary/1471-2148-9-156-S3.doc]
Additional file 4Sliding window of percent identities figure. This figure shows the sliding window analysis plot with the percent identities calculated between ortho-logues and paraloguesClick here for file[http://www.biomedcentral.com/content/supplementary/1471-2148-9-156-S4.pdf]
Additional file 5Maximum likelihood trees showing mosaic evolution within gene pairs. This file shows maximum likelihood maximum likelihood trees cre-ated in PAUP of gene pairs, in which the exons are divided into two cat-egories showing divergent and concerted evolution.Click here for file[http://www.biomedcentral.com/content/supplementary/1471-2148-9-156-S5.pdf]
Page 14 of 16(page number not for citation purposes)

BMC Evolutionary Biology 2009, 9:156 http://www.biomedcentral.com/1471-2148/9/156
AcknowledgementsWe thank Junjun Zhang, John Wei, and Girish Rao for technical assistance, Dr. David Irwin, Dr. Lars Feuk, Dr. Christian Marshall and Dr. Dalila Pinto for helpful discussions, and The Centre for Applied Genomics for support. This work was supported in parts by Genome Canada/Ontario Genomics Institute, the Canadian Institutes for Health Research (CIHR), the Canadian Institutes for Advanced Research, the McLaughlin Centre for Molecular Medicine, the Canadian Foundation for Innovation, the Ontario Ministry of Research and Innovation, and The Hospital for Sick Children Foundation (SWS) and by a Natural Science and Engineering Research Council scholar-ship (ARC). SWS holds the GlaxoSmithKline-CIHR Pathfinder Chair in Genetics and Genomics at the University of Toronto and The Hospital for Sick Children.
References1. Ohno S: Evolution by Gene Duplication. New York: Springer;
1970.
2. Kimura M: The Neutral Theory of Molecular Evolution. Cam-bridge, UK: Cambridge University Press; 1983.
3. Nei M: Molecular Evolutionary Genetics. New York: ColumbiaUniversity Press; 1987.
4. Fay JC, Wyckoff GJ, Wu CI: Positive and negative selection onthe human genome. Genetics 2001, 158(3):1227-1234.
5. Ohta T: Simulating Evolution by Gene Duplication. Genetics1987, 115(1):207-213.
6. Force A, Lynch MF, Pickett B, Amores A, Yan Y-l, Postlethwait J:Preservation of Duplicate Genes by Complementary,Degenerative Mutations. Genetics 1999, 151(4):1531-1545.
7. Lynch M, Force A: The Probability of Duplicate Gene Preser-vation by Subfunctionalization. Genetics 2000, 154(1):459-473.
8. Ohta T: Evolution and Variation of Multigene Families. NewYork: Springer-Verlag; 1980.
9. Li W-H: Molecular Evolution. Sunderland, MA: Sinauer Assocs;1999.
10. Walsh B: Population-genetic models of the fates of duplicategenes. Genetica 2003, 118(2–3):279-294.
11. Sugino RP, Innan H: Estimating the time to the whole-genomeduplication and the duration of concerted evolution via geneconversion in yeast. Genetics 2005, 171(1):63-69.
12. Walsh JB: Sequence-dependent gene conversion: can dupli-cated genes diverge fast enough to escape conversion? Genet-ics 1987, 117(3):543-557.
13. Hansen TF, Carter AJ, Chiu CH: Gene conversion may aid adap-tive peak shifts. J Theor Biol 2000, 207(4):495-511.
14. Ohta T: Role of diversifying selection and gene conversion inevolution of major histocompatibility complex loci. Proc NatlAcad Sci USA 1991, 88(15):6716-6720.
15. Tayebi N, Stubblefield BK, Park JK, Orvisky E, Walker JM, LaMarcaME, Sidransky E: Reciprocal and nonreciprocal recombinationat the glucocerebrosidase gene region: implications for com-plexity in Gaucher disease. Am J Hum Genet 2003, 72(3):519-534.
16. Boocock GR, Morrison JA, Popovic M, Richards N, Ellis L, Durie PR,Rommens JM: Mutations in SBDS are associated with Shwach-man-Diamond syndrome. Nat Genet 2003, 33(1):97-101.
17. Semple C, Wolfe KH: Gene duplication and gene conversion inthe Caenorhabditis elegans genome. J Mol Evol 1999,48(5):555-564.
18. Drouin G: Characterization of the gene conversions betweenthe multigene family members of the yeast genome. J MolEvol 2002, 55(1):14-23.
19. Ezawa K, S OO, Saitou N: Proceedings of the SMBE Tri-National Young Investigators' Workshop 2005. Genome-wide search of gene conversions in duplicated genes ofmouse and rat. Mol Biol Evol 2006, 23(5):927-940.
20. Teshima KM, Innan H: The effect of gene conversion on thedivergence between duplicated genes. Genetics 2004,166(3):1553-1560.
21. Wen Y, Irwin DM: Mosaic evolution of ruminant stomach lys-ozyme genes. Mol Phylogenet Evol 1999, 13(3):474-482.
22. Gogarten JP, Olendzenski L: Orthologs, paralogs and genomecomparisons. Curr Opin Genet Dev 1999, 9(6):630-636.
23. Galtier N: Gene conversion drives GC content evolution inmammalian histones. Trends Genet 2003, 19(2):65-68.
24. Marais G: Biased gene conversion: implications for genomeand sex evolution. Trends Genet 2003, 19(6):330-338.
25. Galtier N, Piganeau G, Mouchiroud D, Duret L: GC-content evolu-tion in mammalian genomes: the biased gene conversionhypothesis. Genetics 2001, 159(2):907-911.
26. Bill CA, Duran WA, Miselis NR, Nickoloff JA: Efficient repair of alltypes of single-base mismatches in recombination interme-diates in Chinese hamster ovary cells. Competition betweenlong-patch and G-T glycosylase-mediated repair of G-T mis-matches. Genetics 1998, 149(4):1935-1943.
27. Morris RT, Drouin G: Ectopic gene conversions in bacterialgenomes. Genome 2007, 50(11):975-984.
28. Xu S, Clark T, Zheng H, Vang S, Li R, Wong GK, Wang J, Zheng X:Gene conversion in the rice genome. BMC Genomics 2008, 9:93.
29. Osada N, Innan H: Duplication and gene conversion in the Dro-sophila melanogaster genome. PLoS Genet 2008,4(12):e1000305.
30. Benovoy D, Drouin G: Ectopic gene conversions in the humangenome. Genomics 2009, 93(1):27-32.
Additional file 6Description and percent similarity between gene pairs. This file con-tains a table containing information about the gene pairs, including their ORF size, number of exons, and the percent identities of regions evolving divergently or concertedly.Click here for file[http://www.biomedcentral.com/content/supplementary/1471-2148-9-156-S6.doc]
Additional file 7Sliding window analysis calculating dN/dS between paralogues and orthologues. This file shows sliding windows used to calculate dN/dS between gene pairs.Click here for file[http://www.biomedcentral.com/content/supplementary/1471-2148-9-156-S7.doc]
Additional file 8Sliding windows calculating dN/dS figure. This figure shows the sliding window analysis plot with the dN/dS values calculated between gene pairs.Click here for file[http://www.biomedcentral.com/content/supplementary/1471-2148-9-156-S8.pdf]
Additional file 9Analysis of functional domains. This file contains a description of the analysis looking for overlap between functional domains and regions evolving in concert.Click here for file[http://www.biomedcentral.com/content/supplementary/1471-2148-9-156-S9.doc]
Additional file 10Analysis of upstream regulatory regions. This file describes the analysis of predicted regulatory regions in the 10 kb of sequence upstream from each gene. It also contains a table showing the predicted regulatory regions in these sequences.Click here for file[http://www.biomedcentral.com/content/supplementary/1471-2148-9-156-S10.doc]
Page 15 of 16(page number not for citation purposes)
BMC Evolutionary Biology 2009, 9:156 http://www.biomedcentral.com/1471-2148/9/156
Publish with BioMed Central and every scientist can read your work free of charge
"BioMed Central will be the most significant development for disseminating the results of biomedical research in our lifetime."
Sir Paul Nurse, Cancer Research UK
Your research papers will be:
available free of charge to the entire biomedical community
peer reviewed and published immediately upon acceptance
cited in PubMed and archived on PubMed Central
yours — you keep the copyright
Submit your manuscript here:http://www.biomedcentral.com/info/publishing_adv.asp
BioMedcentral
31. Kruithof EK, Satta N, Liu JW, Dunoyer-Geindre S, Fish RJ: Gene con-version limits divergence of mammalian TLR1 and TLR6.BMC Evol Biol 2007, 7:148.
32. Kwakkenbos MJ, Matmati M, Madsen O, Pouwels W, Wang Y, Bon-trop RE, Heidt PJ, Hoek RM, Hamann J: An unusual mode of con-certed evolution of the EGF-TM7 receptor chimera EMR2.Faseb J 2006, 20(14):2582-2584.
33. Vazquez-Salat N, Yuhki N, Beck T, O'Brien SJ, Murphy WJ: Geneconversion between mammalian CCR2 and CCR5 chemok-ine receptor genes: a potential mechanism for receptordimerization. Genomics 2007, 90(2):213-224.
34. Onishi M, Yasunaga T, Tanaka H, Nishimune Y, Nozaki M: Genestructure and evolution of testicular haploid germ cell-spe-cific genes, Oxct2a and Oxct2b. Genomics 2004, 83(4):647-657.
35. Kawabata M, Imamura T, Miyazono K: Signal transduction bybone morphogenetic proteins. Cytokine Growth Factor Rev 1998,9(1):49-61.
36. Chen D, Zhao M, Mundy GR: Bone morphogenetic proteins.Growth Factors 2004, 22(4):233-241.
37. Zhao GQ, Hogan BL: Evidence that mouse Bmp8a (Op2) andBmp8b are duplicated genes that play a role in spermatogen-esis and placental development. Mech Dev 1996, 57(2):159-168.
38. Zhao GQ, Liaw L, Hogan BL: Bone morphogenetic protein 8Aplays a role in the maintenance of spermatogenesis and theintegrity of the epididymis. Development 1998,125(6):1103-1112.
39. Linder P: Dead-box proteins: a family affair – active and pas-sive players in RNP-remodeling. Nucleic Acids Res 2006,34(15):4168-4180.
40. Wise DO, Krahe R, Oakley BR: The gamma-tubulin gene familyin humans. Genomics 2000, 67(2):164-170.
41. Yuba-Kubo A, Kubo A, Hata M, Tsukita S: Gene knockout analysisof two gamma-tubulin isoforms in mice. Dev Biol 2005,282(2):361-373.
42. Kent WJ: BLAT – The BLAST-Like Alignment Tool. GenomeRes 2002, 12(4):656-664.
43. Altshul SF, Gish WR, Miller W, Myers EW, Lipman DJ: Basic localalignment search tool. J Mol Biol 1990, 215(3):403-410.
44. Kumar S, Hedges SB: A molecular timescale for vertebrate evo-lution. Nature 1998, 392(6679):917-920.
45. Sawyer SA: GENECONV: A computer package for the statis-tical detection of gene conversion. 1999 [http://www.math.wustl.edu/~sawyer/geneconv/]. Distributed by the author,Department of Mathematics, Washington University in St Louis
46. Yamashita H, Ten Dijke P, Heldin CH, Miyazono K: Bone morpho-genetic protein receptors. Bone 1996, 19(6):569-574.
47. Hogan BL: Bone morphogenetic proteins: multifunctional reg-ulators of vertebrate development. Genes Dev 1996,10(13):1580-1594.
48. Hazama M, Aono A, Ueno N, Fujisawa Y: Efficient expression of aheterodimer of bone morphogenetic protein subunits usinga baculovirus expression system. Biochem Biophys Res Commun1995, 209(3):859-866.
49. NCBI's Entrez database [http://www.ncbi.nlm.nih.gov/Entrez]50. Zhang Z, Schwartz S, Wagner L, Miller W: A greedy algorithm for
aligning DNA sequences. J Comput Biol 2000, 7(1–2):203-214.51. UCSC genome browser [http://genome.ucsc.edu/]52. Mayor C, Brudno M, Schwartz JR, Poliakov A, Rubin EM, Frazer KA,
Pachter LS, Dubchak I: VISTA: visualizing global DNA sequencealignments of arbitrary length. Bioinformatics 2000,16(11):1046-1047.
53. Frazer KA, Pachter L, Poliakov A, Rubin EM, Dubchak I: VISTA:computational tools for comparative genomics. Nucleic AcidsRes 2004:W273-279.
54. Kumar S, Tamura K, Nei M: MEGA3: Integrated software forMolecular Evolutionary Genetics Analysis and sequencealignment. Brief Bioinform 2004, 5(2):150-163.
55. Swofford D: PAUP*:Phylogenetic Analysis Using Parsimony(*and other methods), Version 4.0b10. Sunderland, Massachu-setts.: Sinauer Associates; 2003.
56. Thompson JD, Higgins DG, Gibson TJ: CLUSTAL W: improvingthe sensitivity of progressive multiple sequence alignmentthrough sequence weighting, position-specific gap penaltiesand weight matrix choice. Nucleic Acids Res 1994,22(22):4673-4680.
57. Wilgenbusch JC, Swofford D: Inferring evolutionary trees withPAUP*. Curr Protoc Bioinformatics 2003, Chapter 6(Unit 6):4.
58. Posada D, Crandall KA: MODELTEST: testing the model ofDNA substitution. Bioinformatics 1998, 14(9):817-818.
59. Brudno M, Steinkamp R, Morgenstern B: The CHAOS/DIALIGNWWW server for multiple alignment of genomic sequences.Nucleic Acids Res 2004:W41-44.
Page 16 of 16(page number not for citation purposes)


![BMC Evolutionary Biology BioMed Central · 2016-08-01 · BMC Evolutionary Biology Research article Open Access ... the horizontal transfer events are strongly doc-umented [16-18]](https://img.pdfslide.us/doc/110x75/5eb4152e96adee2c1d7bc8db/bmc-evolutionary-biology-biomed-central-2016-08-01-bmc-evolutionary-biology-research.jpg)