Embed Size (px)
Citation preview
BioMed CentralBMC Cell Biology
ss
Open AcceMethodology articleOptical biosensor differentiates signaling of endogenous PAR1 and PAR2 in A431 cellsYe Fang* and Ann M FerrieAddress: Biochemical Technologies, Science and Technology Division, Corning Incorporated, Sullivan Park, Corning, NY 14831, USA
Email: Ye Fang* - [email protected]; Ann M Ferrie - [email protected]
* Corresponding author
AbstractBackground: Protease activated receptors (PARs) consist of a family of four G protein-coupledreceptors. Many types of cells express several PARs, whose physiological significance is mostlyunknown.
Results: Here, we show that non-invasive resonant waveguide grating (RWG) biosensordifferentiates signaling of endogenous protease activated receptor subtype 1 (PAR1) and 2 (PAR2)in human epidermoid carcinoma A431 cells. The biosensor directly measures dynamic massredistribution (DMR) resulted from ligand-induced receptor activation in adherent cells. In A431,both PAR1 and PAR2 agonists, but neither PAR3 nor PAR4 agonists, trigger dose-dependent Ca2+
mobilization as well as Gq-type DMR signals. Both Ca2+ flux and DMR signals display comparabledesensitization patterns upon repeated stimulation with different combinations of agonists.However, PAR1 and PAR2 exhibit distinct kinetics of receptor re-sensitization. Furthermore, bothtrypsin- and thrombin-induced Ca2+ flux signals show almost identical dependence on cell surfacecholesterol level, but their corresponding DMR signals present different sensitivities.
Conclusion: Optical biosensor provides an alternative readout for examining receptor activationunder physiologically relevant conditions, and differentiates the signaling of endogenous PAR1 andPAR2 in A431.
BackgroundProtease activated receptors (PARs) comprise a family ofG protein-coupled receptors (GPCRs) which to dateinclude PAR1, PAR2, PAR3 and PAR4 [1-5]. Instead of beingactivated through reversible ligand binding, PARs utilize aunique proteolytic mechanism for activation [6-8]. Serineproteases such as thrombin and trypsin site-specificallycleave the receptor within the extracellular N-terminalexodomain. The activating cleavage site is the residue 41–42 (R↓SFLLRN), 36–37(R↓SLIGKV), 38–39 (K↓TFRGAP)and 47–48 (R↓GYPGQV) for human PAR1, PAR2, PAR3and PAR4, respectively [9]. The cleavage unmasks a new N-
terminus, which, in turn, acts as a tethered ligandsequence. The tethered ligand domain binds intramolecu-larly to and activates the receptor, thus initiating signal-ing. The proteases that activate PARs include coagulationfactors (e.g. thrombin, coagulation factors VIIa and Xa),proteases from inflammatory cells (e.g., mast cell tryptase,neutrophil cathepsin G) and enzymes from epithelial tis-sues (e.g., trypsins). PAR1, PAR3 and PAR4 are activatedprincipally by thrombin, while PAR2 is activated bytrypsin-like proteases such as mast cell tryptase and coag-ulation Factor Xa. Synthetic PAR-activating peptides(PAR-APs), corresponding to the first five or six amino
Published: 22 June 2007
BMC Cell Biology 2007, 8:24 doi:10.1186/1471-2121-8-24
Received: 1 December 2006Accepted: 22 June 2007
This article is available from: http://www.biomedcentral.com/1471-2121/8/24
© 2007 Fang and Ferrie; licensee BioMed Central Ltd. This is an Open Access article distributed under the terms of the Creative Commons Attribution License (http://creativecommons.org/licenses/by/2.0), which permits unrestricted use, distribution, and reproduction in any medium, provided the original work is properly cited.
Page 1 of 12(page number not for citation purposes)
BMC Cell Biology 2007, 8:24 http://www.biomedcentral.com/1471-2121/8/24
acids of the tethered ligand sequences, can directly acti-vate PARs, except for PAR3 [3,9-13]. Since these syntheticpeptides function as receptor agonists independent ofproteolysis, PAR-APs are useful for studying the physio-logical and pathophysiological functions of PARs.
PARs are found in a large variety of normal and malignanttissues and cells including skin, platelets, endothelial
cells, gastrointestinal tract, brain and lungs. Most celltypes express several PARs; for example, A431 cells endog-enously express PAR1 and PAR2 [14,15]. The presence ofseveral PARs in a cell type makes it unclear how the celldifferentiates among these signaling. Recently, we haddeveloped a non-invasive and manipulation-free cellassay technology, termed MRCAT (Mass RedistributionCell Assay Technology), which is centred on resonant
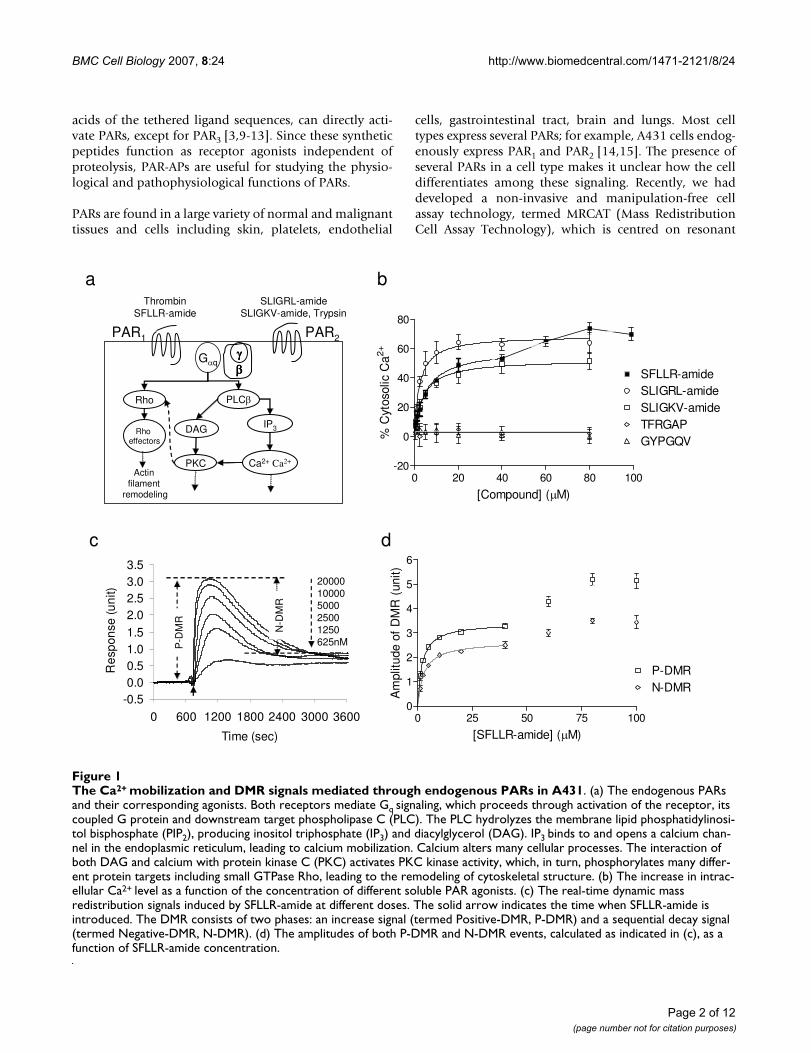
The Ca2+ mobilization and DMR signals mediated through endogenous PARs in A431Figure 1The Ca2+ mobilization and DMR signals mediated through endogenous PARs in A431. (a) The endogenous PARs and their corresponding agonists. Both receptors mediate Gq signaling, which proceeds through activation of the receptor, its coupled G protein and downstream target phospholipase C (PLC). The PLC hydrolyzes the membrane lipid phosphatidylinosi-tol bisphosphate (PIP2), producing inositol triphosphate (IP3) and diacylglycerol (DAG). IP3 binds to and opens a calcium chan-nel in the endoplasmic reticulum, leading to calcium mobilization. Calcium alters many cellular processes. The interaction of both DAG and calcium with protein kinase C (PKC) activates PKC kinase activity, which, in turn, phosphorylates many differ-ent protein targets including small GTPase Rho, leading to the remodeling of cytoskeletal structure. (b) The increase in intrac-ellular Ca2+ level as a function of the concentration of different soluble PAR agonists. (c) The real-time dynamic mass redistribution signals induced by SFLLR-amide at different doses. The solid arrow indicates the time when SFLLR-amide is introduced. The DMR consists of two phases: an increase signal (termed Positive-DMR, P-DMR) and a sequential decay signal (termed Negative-DMR, N-DMR). (d) The amplitudes of both P-DMR and N-DMR events, calculated as indicated in (c), as a function of SFLLR-amide concentration.
0 20 40 60 80 100-20
0
20
40
60
80
SLIGRL-amideSLIGKV-amide
SFLLR-amide
TFRGAPGYPGQV
[Compound] (μM)
% C
ytos
olic
Ca2+
0 25 50 75 1000
1
2
3
4
5
6
P-DMRN-DMR
[SFLLR-amide] (μM)
Am
plitu
de o
f D
MR
(un
it)
-0.50.00.51.01.52.02.53.03.5
0 600 1200 1800 2400 3000 3600
Time (sec)
Res
pons
e (u
nit)
2000010000500025001250625nM
PAR1 PAR2
ThrombinSFLLR-amide
SLIGRL-amideSLIGKV-amide, Trypsin
a b
c d
ββββ
Ca2+ Ca2+
IP3
PLCβ
DAG
PKC
Gαqγγγγ
Rho
Actin filament
remodeling
Rho effectors
P-D
MR
N-D
MR
Page 2 of 12(page number not for citation purposes)
BMC Cell Biology 2007, 8:24 http://www.biomedcentral.com/1471-2121/8/24
waveguide grating (RWG) biosensor [16]. The RWG bio-sensor directly measures ligand-induced dynamic massredistribution (DMR) within the bottom portion ofadherent cells. Theoretical and numerical analysis sug-gests that the resultant DMR signal such as the Gq-typeDMR [16] represents a novel physiological readout for cellsignaling, which consists of contributions of many cellu-lar events downstream the ligand-induced receptor activa-tion. The MRCAT enables the study of systems cell biologyof receptors including epidermal growth factor receptor(EGFR) [17] and bradykinin B2 receptor [18]. Here weapplied the MRCAT to investigate the actions of severalPAR agonists, with a special emphasis on the roles of cho-lesterol in regulating the signaling of endogenous PARs inA431 cells.
ResultsPAR1 and PAR2 transduce Gq/11 signaling in A431To probe the signaling of endogenous PARs in A431, bothconventional Ca2+ flux assay and the MRCAT were used toexamine the cellular responses induced by several PARagonists. The agonists were thrombin and SFLLR-amide(PAR1), trypsin, SLIGKV-amide and SLIGRL-amide(PAR2), TFRGAP (PAR3), and GYPGQV (PAR4). Amongthem, only PAR1 and PAR2 agonists resulted in rapid andtransient increase in intracellular Ca2+ ([Ca2+]i) as well asGq-type DMR signals in quiescent A431 cells (Fig. 1 andFig. 2a). These results were consistent with the expressionpattern and signaling of endogenous PARs in A431. A431is known to express PAR1 and PAR2, which both mediateclassical Gq signaling [14,15].
Table 1: EC50 values of PAR agonists in A431. EC50 values were obtained using conventional Ca2+ flux assay, in comparison with those obtained using the MRCAT. In the case of MRCAT data, the amplitudes of both P-DMR and N-DMR events as a function of agonist concentration (as indicated in Fig. 1c) were used to calculate EC50.
Ligand EC50 (n = 3)
Ca2+ flux assay P-DMR N-DMR
Trypsin 45.7 ± 5.8 nM 98.0 ± 27.8 nM 102.1 ± 21.9 nMSLIGRL-amide 2.5 ± 0.3 μM 2.3 ± 0.6 μM 3.2 ± 0.8 μMSLIGKV-amide 3.8 ± 0.4 μM 6.1 ± 1.0 μM 9.1 ± 2.2 μM
Thrombin 6.0 ± 1.0 unit/ml 9.6 ± 2.0 unit/ml 11.0 ± 1.9 unit/mlSFLLR-amide 5.0 ± 0.4 μM 1.9 ± 0.1 μM 3.1 ± 0.2 μM
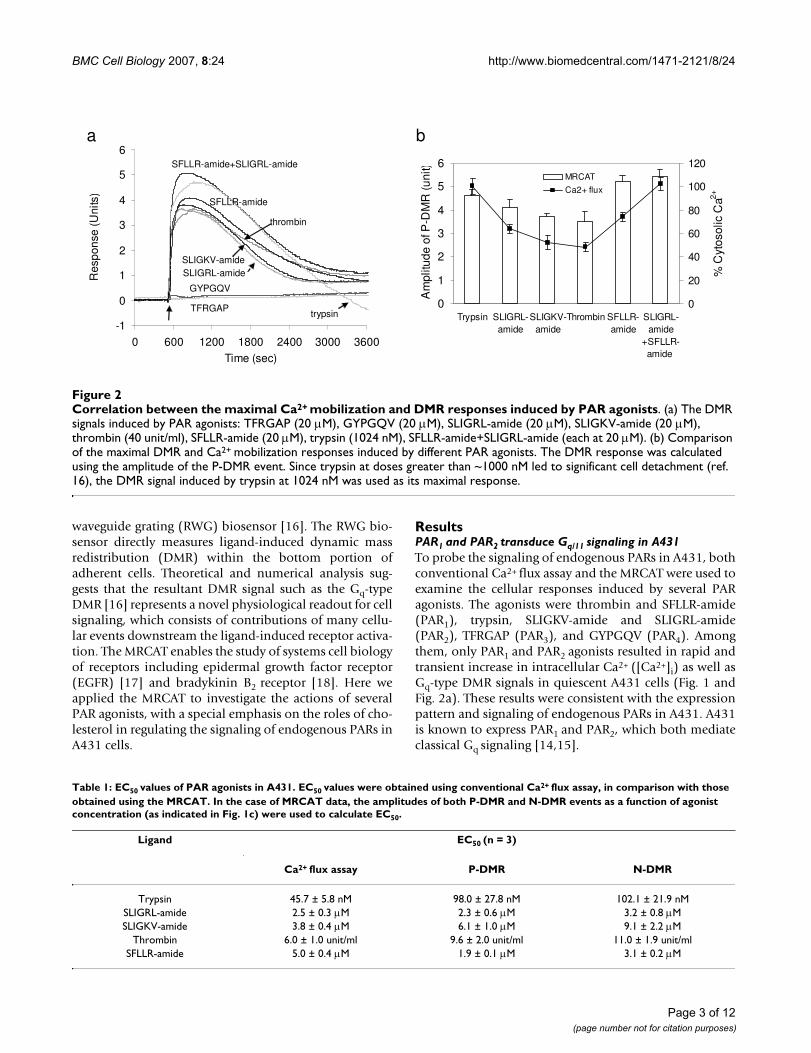
Correlation between the maximal Ca2+ mobilization and DMR responses induced by PAR agonistsFigure 2Correlation between the maximal Ca2+ mobilization and DMR responses induced by PAR agonists. (a) The DMR signals induced by PAR agonists: TFRGAP (20 μM), GYPGQV (20 μM), SLIGRL-amide (20 μM), SLIGKV-amide (20 μM), thrombin (40 unit/ml), SFLLR-amide (20 μM), trypsin (1024 nM), SFLLR-amide+SLIGRL-amide (each at 20 μM). (b) Comparison of the maximal DMR and Ca2+ mobilization responses induced by different PAR agonists. The DMR response was calculated using the amplitude of the P-DMR event. Since trypsin at doses greater than ~1000 nM led to significant cell detachment (ref. 16), the DMR signal induced by trypsin at 1024 nM was used as its maximal response.
�
0
1
2
3
4
5
6
Trypsin SLIGRL-amide
SLIGKV-amide
Thrombin SFLLR-amide
SLIGRL-amide
+SFLLR-amide
Am
plitu
de o
f P-D
MR
(uni
t)
0
20
40
60
80
100
120
% C
ytos
olic
Ca2+
MRCAT
Ca2+ flux
-1
0
1
2
3
4
5
6
0 600 1200 1800 2400 3000 3600Time (sec)
Res
pons
e (U
nits
)
GYPGQV
TFRGAP
SFLLR-amide+SLIGRL-amide
trypsin
SFLLR-amide
SLIGKV-amideSLIGRL-amide
thrombin
a b
Page 3 of 12(page number not for citation purposes)
BMC Cell Biology 2007, 8:24 http://www.biomedcentral.com/1471-2121/8/24
Both Ca2+ mobilization and DMR signals were dose-dependent and saturable to each agonist, includingtrypsin or SFLLR-amide at low doses. The saturationcurves obtained seem fit well with one-site binding, basedon non-linear regression and Scatchard analysis. The EC50values of each agonist obtained using both methods werecomparable (Table 1), suggesting that similar to conven-tional Ca2+ signals, the ligand-induced DMR signals couldalso be used as alternative readouts for examining recep-tor activation. We previously had shown that trypsin ofhigh doses (>~1000 nM) led to complicated DMR signals,due to the combination of trypsin-induced cell signalingand cell detachment from the sensor surface [16]. Thus,the DMR signals induced by trypsin only at low doseswere analyzed. Interestingly, SFLLR-amide at high doses(>40 μM) led to intracellular Ca2+ level as well as DMR sig-nal to another elevated level (Fig. 1b and 1d). A possibleexplanation is that SFLLR-amide at high doses activatesboth PAR1 and PAR2, consistent with the previous find-ings done by others that SFLLR-amide has higher efficacyto activate PAR1 than PAR2 [9]. Alternatively, beside the Gqpathway, SFLLR-amide at high doses may also lead to theactivation of a second signaling pathway, which could fur-ther increase both the Ca2+ mobilization and DMR sig-nals. It has been reported that the activation of several Gi-coupled receptors results in Ca2+ mobilization throughGβγ subunits of Gi/o proteins [19], and a dose-dependentswitching of receptor signaling could occur for someGPCR-ligand systems [20].
Functional interactions between PAR1 and PAR2Since A431 expresses both PAR1 and PAR2, we were inter-ested in the possibility of functional interactions betweenthe two receptors. First, we examined the maximalresponses induced by PAR agonists (Fig. 2). The maximal[Ca2+]i elevation induced by trypsin, SLIGRL-amide,SLIGKV-amide, thrombin, and SFLLR-amide was found tobe 100 ± 6%, 64 ± 4%, 52 ± 6%, 48 ± 4%, and 74 ± 4%,respectively. The maximal [Ca2+]i elevation induced bytrypsin was approximately 2 fold as high as those inducedby thrombin, SLIGKV-amide or SLIGRL-amide, whereasSFLLR-amide at 80 μM led to an intermediate maximal[Ca2+]i elevation. Furthermore, a mixture of SFLLR-amideand SLIGKV-amide (both at 20 μM) resulted in an [Ca2+]ielevation of 102 ± 5.4%. At saturating concentrations,these agonists also led to similar DMR signals but withdifferent maximal amplitudes (Fig. 2a). The maximalamplitudes of these DMR signals had an order that isalmost identical, but less pronounced, to those obtainedusing Ca2+ flux measurements (Fig. 2b). It is worthy not-ing that the PAR2-specific agonist SLIGKV-amide led to
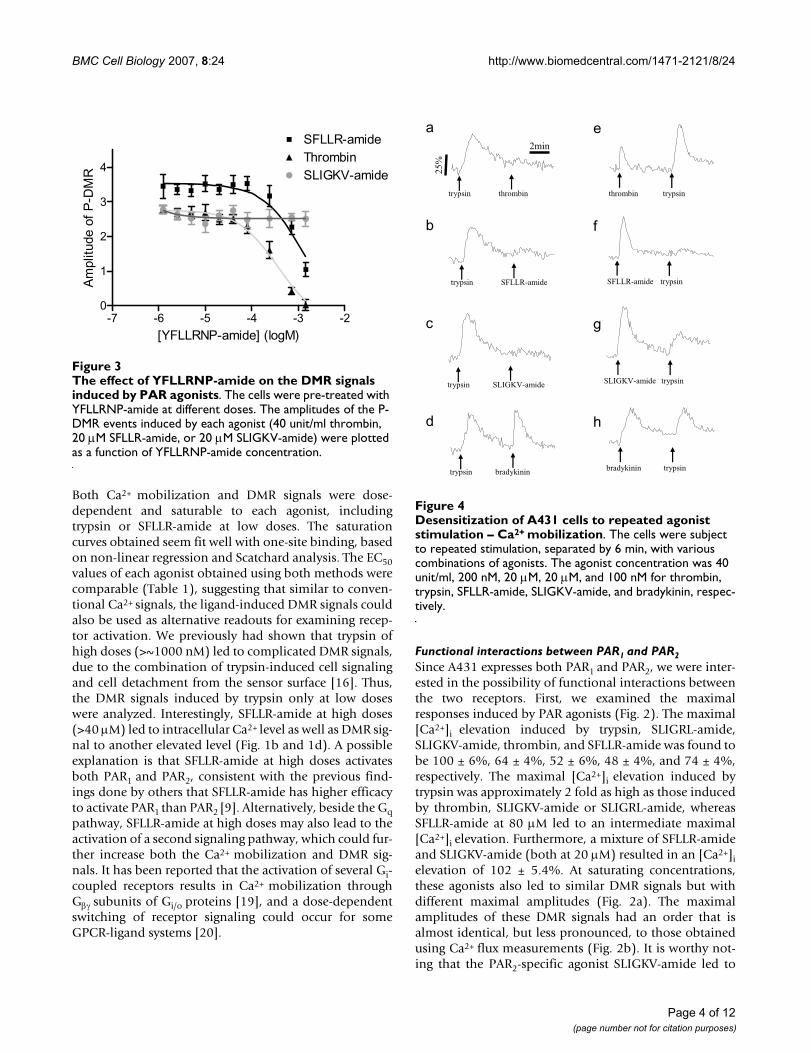
Desensitization of A431 cells to repeated agonist stimulation – Ca2+ mobilizationFigure 4Desensitization of A431 cells to repeated agonist stimulation – Ca2+ mobilization. The cells were subject to repeated stimulation, separated by 6 min, with various combinations of agonists. The agonist concentration was 40 unit/ml, 200 nM, 20 μM, 20 μM, and 100 nM for thrombin, trypsin, SFLLR-amide, SLIGKV-amide, and bradykinin, respec-tively.
trypsin bradykinin
trypsin SFLLR-amide
trypsin thrombin
bradykinin trypsin
SFLLR-amide trypsin
25%
2min
thrombin trypsin
trypsin SLIGKV-amideSLIGKV-amide trypsin
a
b
c
d
e
f
g
h
The effect of YFLLRNP-amide on the DMR signals induced by PAR agonistsFigure 3The effect of YFLLRNP-amide on the DMR signals induced by PAR agonists. The cells were pre-treated with YFLLRNP-amide at different doses. The amplitudes of the P-DMR events induced by each agonist (40 unit/ml thrombin, 20 μM SFLLR-amide, or 20 μM SLIGKV-amide) were plotted as a function of YFLLRNP-amide concentration.
-7 -6 -5 -4 -3 -20
1
2
3
4
SFLLR-amide
Thrombin
SLIGKV-amide
[YFLLRNP-amide] (logM)
Am
plitu
de o
f P
-DM
R
Page 4 of 12(page number not for citation purposes)
BMC Cell Biology 2007, 8:24 http://www.biomedcentral.com/1471-2121/8/24
relatively lower maximal responses, in terms of both Ca2+
mobilization and DMR signal, than another PAR2-specificagonist SLIGRL-amide did.
Second, we examined the effect of PAR1 specific partialagonist YFLLRNP-amide on ligand-induced cellularresponses. Results showed that YFLLRNP-amide at dosesup to 729 μM did not lead to any significant elevation of[Ca2+]i; however, at high doses (>80 μM) it led to a smallDMR signal (data not shown). This is consistent with theprevious observations done by others that YFLLRNP-amide can activate G12/13resulting in the cell shapechange, but not Gq-mediated Ca2+ signaling in humanplatelets [21,22]. Furthermore, YFLLRNP-amide dose-dependently attenuated the DMR signals induced by
thrombin or SFLLR-amide, but not SLIGKV-amide (Fig.3). However, at the highest dose examined YFLLRNP-amide almost completely blocked the thrombin-inducedDMR, but only partially attenuated the SFLLR-amide-induced DMR.
Third, we examined the desensitization patterns of recep-tor signaling, since either thrombin or trypsin potentiallyactivates several PARs. Figure 4 summarized Ca2+ mobili-zation patterns in A431 in response to repeated stimula-tion, separated by 6 min, with various combinations ofagonists. Pre-stimulation of A431 with trypsin completelyblocked the ability of PAR agonists (thrombin, SFLLR-amide, SLIGKV-amide, SLIGRL-amide, or trypsin) to pro-voke Ca2+ moblization (Fig. 4a–c, data not shown). Con-versely, neither of PAR agonists examined had any effecton the Ca2+ mobilization induced by bradykinin, an ago-nist for bradykinin B2 receptor which is also expressed inA431 [18,23] (exampled in Fig. 4d), suggesting that theinhibition of the response to PAR agonists by the preced-ing stimulation with trypsin is not due to any non-specificdigestion of the membrane proteins. On the other hand,the pre-stimulation with thrombin completely inhibitedthe responsiveness of cells to thrombin, only partially totrypsin, but not to SLIGKV-amide or SLIGRL-amide. Inaddition, the preceding stimulation with SFLLR-amide,SLIGKV-amide or SLIGRL-amide all partially attenuatedthe trypsin-induced Ca2+ mobilization (Fig. 4e–g; data notshown). Conversely, SFLLR-amide still led to a significantintracellular Ca2+ elevation (32 ± 4.3%) in the thrombin-stimulated cells, consistent with the previous observations
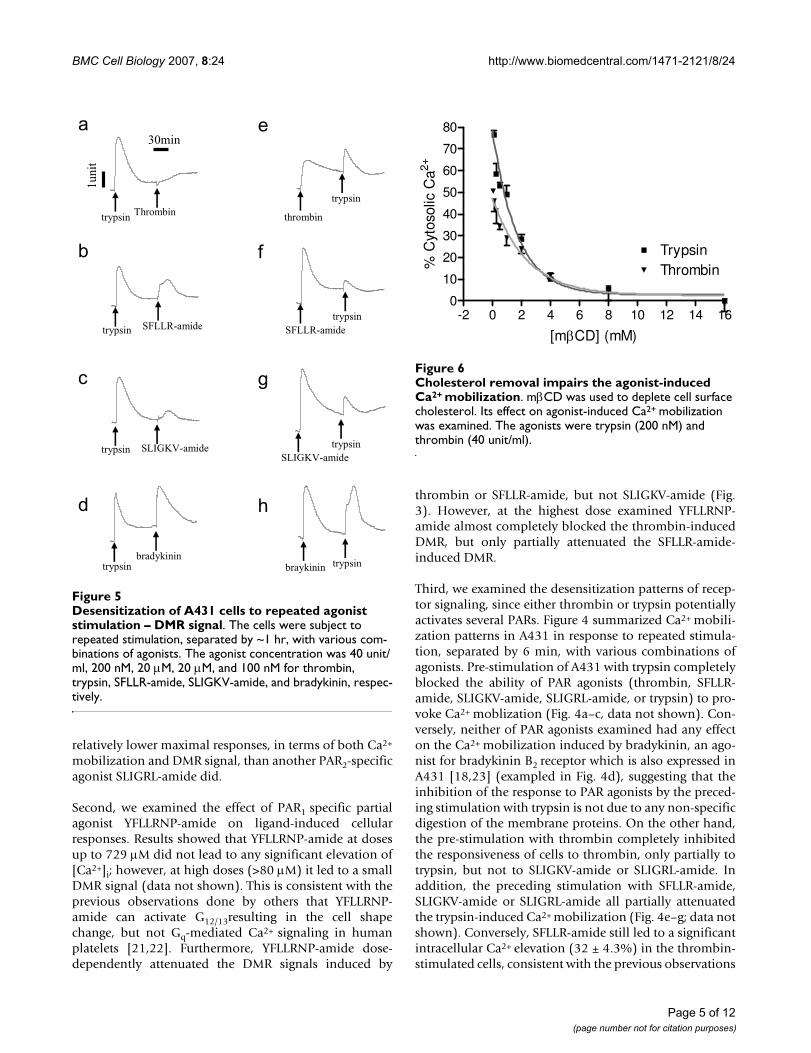
Cholesterol removal impairs the agonist-induced Ca2+ mobi-lizationFigure 6Cholesterol removal impairs the agonist-induced Ca2+ mobilization. mβCD was used to deplete cell surface cholesterol. Its effect on agonist-induced Ca2+ mobilization was examined. The agonists were trypsin (200 nM) and thrombin (40 unit/ml).
-2 0 2 4 6 8 10 12 14 160
10
20
30
40
50
60
70
80
ThrombinTrypsin
[mβCD] (mM)
% C
ytos
olic
Ca2+
Desensitization of A431 cells to repeated agonist stimulation – DMR signalFigure 5Desensitization of A431 cells to repeated agonist stimulation – DMR signal. The cells were subject to repeated stimulation, separated by ~1 hr, with various com-binations of agonists. The agonist concentration was 40 unit/ml, 200 nM, 20 μM, 20 μM, and 100 nM for thrombin, trypsin, SFLLR-amide, SLIGKV-amide, and bradykinin, respec-tively.
1u
nit
30min
trypsinbradykinin
braykinin trypsin
trypsinThrombin
thrombin
trypsin
trypsin SFLLR-amide SFLLR-amide
trypsin
trypsin SLIGKV-amideSLIGKV-amide
trypsin
a
b
c
d
e
f
g
h
Page 5 of 12(page number not for citation purposes)
BMC Cell Biology 2007, 8:24 http://www.biomedcentral.com/1471-2121/8/24
done by others that SFLLR-amide activates both PAR1 andPAR2 [24,25].
Since the ligand-induced Gq-type DMR signals typicallyproceed about 30 min to 1 hour, we were interested in thedesensitization and resensitization patterns of cells inresponse to repeated stimulation, separated by ~1 hr, withvarious combinations of GPCR agonists. Results showedthat the trypsin-treated cells became completely desensi-tized to trypsin, or thrombin (Fig. 5a), only partially toSFLLR-amide, SLIGKV-amide, or SLIGRL-amide (Fig. 5b–c, data not shown), but not to bradykinin (Fig. 5d). Onthe other hand, the preceding stimulation with thrombin,SFLLR-amide, SLIGKV-amide or SLIGRL-amide only par-tially attenuated the DMR signal induced by trypsin (Fig.5e–g; data not shown), while bradykinin had no obviouseffect on the DMR signal induced by any PAR agonist (Fig.5h, data not shown). Furthermore, SLIGKV-amide andSLIGRL-amide led to almost identical DMR signals in cellswith or without pre-stimulation with thrombin (data notshown). Together, these results suggest that both SFLLR-amide and trypsin may activate both PAR1 and PAR2.
Differentiated regulation of PAR1 and PAR2 signalingSince the physiological significance of co-expression oftwo receptors in A431 is unclear, we were interested in thepossibility of differentiated regulation of PAR1 and PAR2signaling. A common mechanism for the cell to regulateand differentiate receptor signaling is compartmentaliza-tion of receptors and/or their signaling components.Amassing evidences support the hypothesis that there aremany cholesterol-rich microdomains at the cell surfacemembrane, although their characteristics are still underextensive investigations. Such microdomain is believed toenable the sorting and segregation of receptors and theirsignaling cascades, thus regulating cell signaling [26].Methyl-β-cyclodextrin (mβCD) has been widely used toextract cell surface choleterol primarily through effluxing[27], thus disrupting these cholesterol-rich microdo-mains. Thus, we examined the effect of cholesterol deple-tion by mβCD on both Ca2+ mobilization and DMRresponses induced by thrombin and trypsin. The pre-treat-ment of quiescent A431 cells with mβCD up to 16 mM ledto a dose-dependent suppression of Ca2+ mobilizationinduced by either trypsin or thrombin (Fig. 6). Both dose-dependent inhibition curves appeared fit well with a one-phase decay non-linear regression, leading to an almostidentical half-concentration (C1/2 of ~1.5 mM) of mβCD.This is consistent with the fact that mβCD results in rapideffluxing of cell membrane cholesterol molecules; and theamount of remain cell surface cholesterol depends on theconcentration of mβCD in solution [27]. The higher con-centration mβCD is, the less cholesterol is retained at thecell surface membrane. Since α-cyclodextrin (αCD) is aninactive cyclodextrin analog and has been found to be
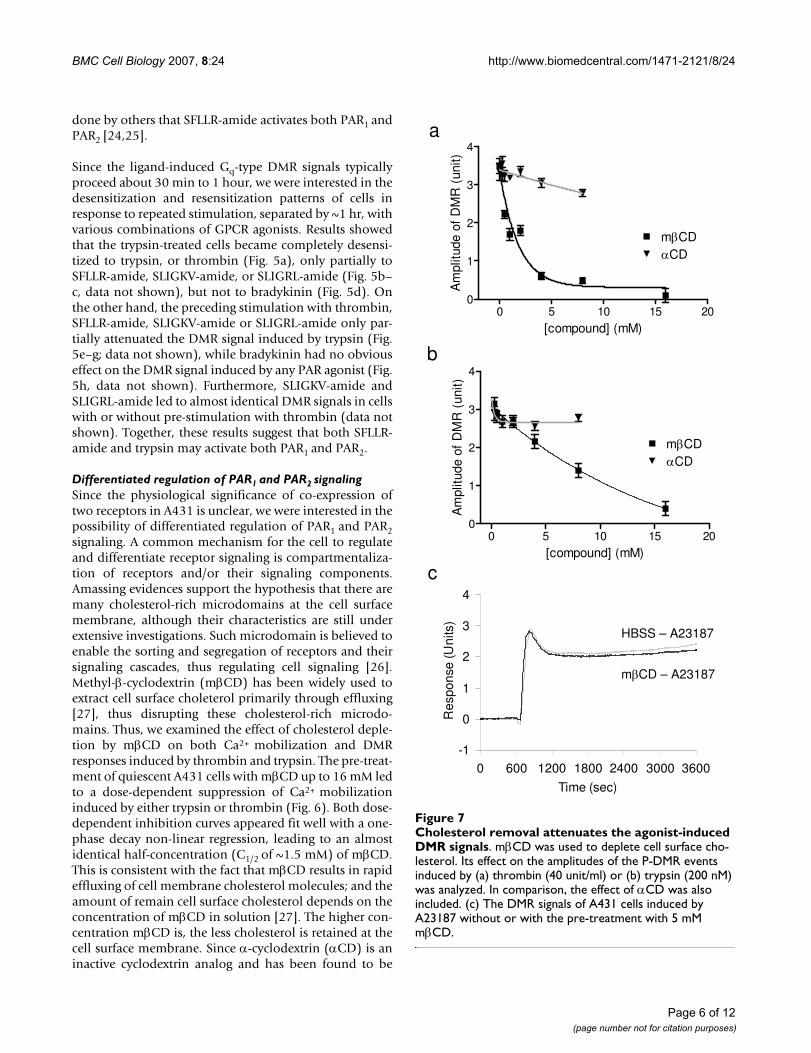
Cholesterol removal attenuates the agonist-induced DMR signalsFigure 7Cholesterol removal attenuates the agonist-induced DMR signals. mβCD was used to deplete cell surface cho-lesterol. Its effect on the amplitudes of the P-DMR events induced by (a) thrombin (40 unit/ml) or (b) trypsin (200 nM) was analyzed. In comparison, the effect of αCD was also included. (c) The DMR signals of A431 cells induced by A23187 without or with the pre-treatment with 5 mM mβCD.
�
0 5 10 15 200
1
2
3
4
mβCDαCD
[compound] (mM)
Am
plitu
de o
f D
MR
(un
it)
0 5 10 15 200
1
2
3
4
αCDmβCD
[compound] (mM)
Am
plitu
de o
f D
MR
(un
it)
a
b
-1
0
1
2
3
4
0 600 1200 1800 2400 3000 3600
Time (sec)
Res
pons
e (U
nits
)
c
HBSS – A23187
mβCD – A23187
Page 6 of 12(page number not for citation purposes)
BMC Cell Biology 2007, 8:24 http://www.biomedcentral.com/1471-2121/8/24
incapable of extracting cholesterol from cultured cells[28], αCD was used as a negative control to study the reg-ulation of PAR signaling by cholesterol. Unlike mβCD upto 16 mM, αCD at high doses (>8 mM) resulted in detect-able cell toxicity as well as significant amounts of cellsdetached from the biosensor surface (data not shown).Thus, only low doses of αCD were used. Results showedthat αCD up to 8 mM had little effect on both trypsin andthrombin-induced Ca2+ mobilization responses (data notshown).
Similarly, the mβCD pre-treatment also led to a dose-dependent attenuation of the DMR signals induced bythrombin or trypsin (Fig. 7). However, there is a clear dis-tinction between the inhibition curves of trypsin- andthrombin-induced DMR signals by mβCD. The suppres-sion of the thrombin-induced DMR by mβCD exhibited adose-dependency (C1/2 of 1.2 ± 0.3 mM) similar to thatmeasured with Ca2+ mobilization (Fig. 7a). On the otherhand, the inhibition of the trypsin-mediated DMR bymβCD displayed a much slower decay to increased con-centrations of mβCD, which apparently fits well with a 2-phase decay, leading to C1/2 of 5 ± 1 mM and 11 ± 2 mM,respectively (Fig. 7b). This difference suggests that thetrypsin-mediated DMR signal involves more complicatedcellular mechanisms than that induced by thrombin. Asexpected, αCD up to 8 mM had little effect on both ago-nist-induced DMR responses. On the other hand, the pre-treatment of A431 cells with mβCD at 5 mM had littleeffect on the DMR signal induced by 5 μM A23187 (Fig.
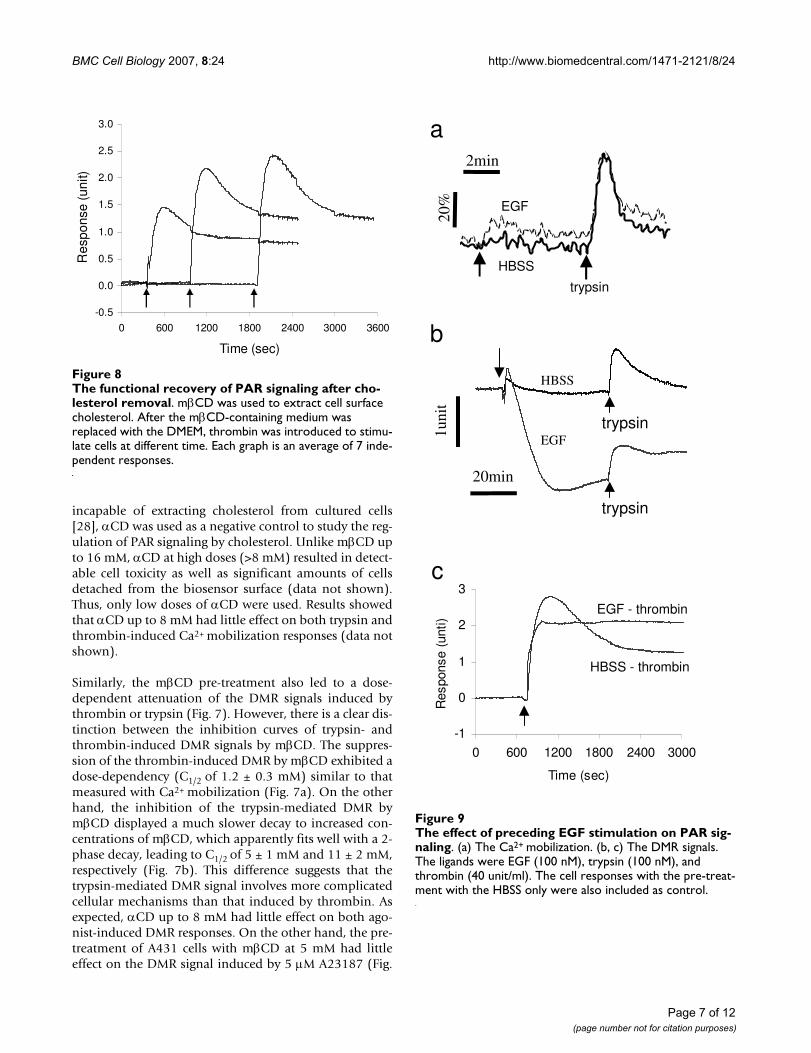
The effect of preceding EGF stimulation on PAR signalingFigure 9The effect of preceding EGF stimulation on PAR sig-naling. (a) The Ca2+ mobilization. (b, c) The DMR signals. The ligands were EGF (100 nM), trypsin (100 nM), and thrombin (40 unit/ml). The cell responses with the pre-treat-ment with the HBSS only were also included as control.
-1
0
1
2
3
0 600 1200 1800 2400 3000
Time (sec)
Res
pons
e (u
nti)
20%
2min
1unit
20min
EGF
HBSS
trypsin
trypsin
a
b
c
HBSS - thrombin
EGF - thrombin
EGF
HBSS
trypsin
The functional recovery of PAR signaling after cholesterol removalFigure 8The functional recovery of PAR signaling after cho-lesterol removal. mβCD was used to extract cell surface cholesterol. After the mβCD-containing medium was replaced with the DMEM, thrombin was introduced to stimu-late cells at different time. Each graph is an average of 7 inde-pendent responses.
-0.5
0.0
0.5
1.0
1.5
2.0
2.5
3.0
0 600 1200 1800 2400 3000 3600
Time (sec)
Res
pons
e (u
nit)
Page 7 of 12(page number not for citation purposes)
BMC Cell Biology 2007, 8:24 http://www.biomedcentral.com/1471-2121/8/24
7c), suggesting that the cholesterol-depleted cells are stillresponsive to non-membrane elicited events. A23187 is aCa2+ ionophore, and is able to release stored Ca2+ from theendoplasmic reticulum in cells. Interestingly, the A23187-induced DMR signal somewhat mimics the PAR agonist-induced DMR signals (Fig. 2a), suggesting that Ca2+ path-way is part of the response pathway(s), and the PAR ago-nist-induced DMR is largely downstream cellular events ofCa2+ mobilization mediated through the receptor activa-tion.
We further studied the functional recovery of PAR signal-ing after cholesterol depletion with mβCD. This wasbased on the timely recovery of cell surface cholesterol inthe mβCD-treated cells after replacing the medium con-taining mβCD with the medium only. Results showedthat the thrombin-induced DMR signal progressivelyrecovered (Fig. 8), indicating that the formation of choles-terol-assisted microdomains is dynamic and reversible,and cholesterol concentration at the cell membranes isimportant in regulating the PAR signaling.
Previously we had shown that blockage of EGFR tyrosinekinase activity by AG1478 partially attenuated the trypsin-induced DMR signal in A431 [16], suggesting that EGFRtransactivation may be a downstream event of trypsin-induced response. A431 cells express large numbers ofEGF receptors [29]. AG1478 is a potent and selectiveEGFR tyrosine kinase inhibitor. It is also known that cho-lesterol removal by mβCD triggers a ligand-independenttransactivation of EGFR in A431 cells [28,30]. Thus, wewere interested the interference of EGFR activation withPAR signaling. The preceding stimulation with EGF hadlittle effect on the Ca2+ mobilization induced by trypsin(Fig. 9a) or thrombin (data not shown). However, at 100nM EGF almost completely inhibited the N-DMR event,but only slightly attenuated the P-DMR event in the DMRsignal induced by either trypsin (Fig. 9b) or thrombin(Fig. 9c). However, the pre-treatment of A431 cells withAG1478 did not counter the inhibitory effect of choles-terol depletion on the trypsin-induced DMR signals (datanot shown). Together, these results suggest that bothtrypsin and thrombin-induced signaling are sensitive toEGFR activation.
DiscussionThere is growing evidence that GPCR signaling is compli-cated – many GPCRs including PAR2 elicit both G protein-dependent and independent signaling events [20,31]. Tocomplicate this, a GPCR may exist in a collection ofmicrostates (i.e., conformations), and different agonistsmay result in distinct active-state conformations, thusdirecting the receptor-induced signals to various cellularpathways [32,33]. Conventional cell-based assays typi-cally measure a singular cellular response (e.g., second
messenger generation, protein interactions or trafficking).Because of that, these assays may lead to false negatives,due to alternative pathway a ligand may selectively acti-vate. On the other hand, the non-invasive optical biosen-sor used here utilizes an evanescent wave with a shortpenetration depth (~200 nm) to probe ligand-induceddynamic redistribution of cellular matter; the resultantDMR signal is an integrated cellular response [16]. Thus,the use of the DMR signal as an alternative readout forreceptor activation is advantageous. Since many cell sign-aling events involve significant redistribution of cellularmatters, the biosensor-based assays may find broad appli-cability in many different types of targets includingGPCRs [16,18,34], EGFR [17] and ion channels (unpub-lished data). In A431 cells, we recently have identifiedthree classes of DMR signals induced by panels of GPCRagonists targeting several endogenous receptors, each ofwhich was correlated well with the activation of a class ofGPCRs, depending on the G protein with which the recep-tor is coupled (i.e., Gq, Gs and Gi).
Because of the short penetration depth of the evanescentwave of the present biosensor, only cellular events occur-ring within the detection zone of the cell layer contributeto ligand-induced DMR signals. Although ligand-inducedreceptor activation may lead to an array of signaling path-ways or events [16-18], only signaling events having sig-nificant redistribution of cellular matters could bedetected. Recently we have developed a mathematicalmodel for the DMR signals mediated by Gq-coupledreceptors [16]. We also have shown that a GPCR ligand-induced DMR signal primarily consists of three compo-nents: trafficking of intracellular targets to the activatedreceptors and subsequently receptor internalization [16],changes in cell adhesion degree [35], and cytoskeletalremodelling which is at the crossroad of the receptor acti-vation to downstream signaling events [[18], unpublisheddata].
Here we examined the signaling of endogenous PARs inA431. Among PAR agonists examined, only PAR1 andPAR2 agonists resulted in significant Ca2+ mobilizationand Gq-type DMR signals. This result is consistent with thefact that only PAR1 and PAR2 are endogenously expressedin A431, and both receptors elicit Gq signaling. The DMRsignals induced by all PAR1 and PAR2 agonists sharealmost identical dynamics, except of the signaling ampli-tudes (Fig. 2a). The overall dynamics – an initial rapid P-DMR event followed by a relatively slow N-DMR event –is also similar to those mediated through the activation ofother endogenous Gq-coupled receptors in A431 cells[[17,34]; unpublished data]. Our recent theoretical analy-sis suggests that for Gq-coupled receptors, the P-DMR isprimarily resulted from the recruitment of intracellulartargets to the activated receptors at the cell membrane,
Page 8 of 12(page number not for citation purposes)

BMC Cell Biology 2007, 8:24 http://www.biomedcentral.com/1471-2121/8/24
while the receptor internalization is a major contributorto the N-DMR event [16]. Furthermore, the PAR agonist-induced DMR signals also share similarity with the Ca2+
ionophore A23187-induced DMR signal (Fig. 7c), sug-gesting that the DMR signals of PAR agonists obtained aremainly downstream of Ca2+ pathway. In addition, com-pared to Ca2+ mobilization signals, the less pronounceddifference in the maximal DMR responses of different PARagonists also indicates that the DMR signals are down-stream of Ca2+ mobilization. It is a recent finding that inmany cases an agonist-induced maximal response, ameasure of agonist efficacy, is dependent on the cellularevents measured. This is because GPCR signaling typicallyproceeds through a series of amplification steps. As aresult, the closer to the receptor activation step the cellularevent measured is, the bigger difference the agonist effi-cacy might be [32]. Together, these results suggest that theDMR signals of PAR agonists are primarily resulted fromGq signaling, although one cannot rule out the contribu-tions of other signaling pathways to the overall DMR sig-nal.
Nonetheless, similar to Ca2+ mobilization, the ligand-induced DMR signals are not only dependent on and sat-urable to ligand concentrations (Fig. 1), but also showclassical desensitization patterns upon repeated agoniststimulation (Fig. 5), suggesting that the DMR signal canserve as a novel readout for monitoring receptor activa-tion. Interestingly, the two PAR2-specific agonists SLIGRL-amide and SLIGKV-amide-induced maximal responses,measured using both Ca2+ flux and MRCAT assays, weresignificantly different (Fig. 2b). Such difference may bedue to the functional selectivity of G protein signaling bysoluble PAR agonists [33].
Three lines of evidences suggest that there are functionalinteractions between PAR1 and PAR2 in A431. First,among PAR1,2 agonists examined, trypsin resulted in thehighest Ca2+ mobilization, while SFLLR-amide led to anintermediate Ca2+ mobilization. Similar trend was alsoobserved in their DMR signals (Fig. 2). Co-stimulationwith SFLLR-amide and SLIGKV led to Ca2+ mobilizationor a DMR signal that is at the level similar to that inducedby trypsin alone. These results suggest that: (i) the solublePAR1 ligand SFLLR-amide may partially activate PAR2, and(ii) trypsin may transactivate PAR1 through unknownmechanism(s). Secondly, the desensitization patterns, asexamined using repeated stimulation with various combi-nations of PAR agonists, also support the functional inter-actions between PAR1 and PAR2. The trypsin-treated cellslost their responsiveness to either PAR agonist examined,but not to bradykinin, while the thrombin-treated cellsstill respond to trypsin. Thirdly, a PAR1 partial agonistYFLLRNP-amide can attenuate the DMR signals inducedby thrombin or SFLLR-amide, but not SLIGKV-amide. At
729 μM YFLLRNP-amide totally blocked the DMR signalinduced by thrombin, but only partially attenuated thoseinduced by either SFLLR-amide or trypsin. Collectively,these results suggest that both SFLLR-amide and trypsinmight activate both receptors.
Although it appears that both receptors elicit Gq signalingin A431, there is distinct difference in the kinetics ofreceptor re-sensitization. The prolonged stimulation (~1hr) with trypsin resulted in complete desensitization ofcells to sequential stimulation with thrombin, but partialdesensitization to SFLLR-amide, SLIGKV-amide or SLI-GRL-amide (Fig. 5). On the other hand, the cells stillrespond to trypsin, after pre-stimulation with thrombin,SFLLR-amide, SLIGKV-amide, or SLIGRL-amide. Thesesuggest that PAR2 resensitizes much faster than PAR1. It isknown that receptor proteolysis and phosphorylation reg-ulate the activities of PARs through receptor internaliza-tion and the inhibition of intracellular signal transduction[9,36,37]. Depending on the cellular context, the recoveryof functional receptors at the cell surface could take fromtens of minutes to hours [38,39].
The almost identical sensitivity of both trypsin- andthrombin-induced Ca2+ mobilization to cholesterolremoval suggests that the cell surface cholesterol levelplays an equally important role in regulating the ampli-tudes of Ca2+ mobilization induced by the activation ofboth PAR1 and PAR2. It is known that cholesterol extrac-tion leads to the loss of compartmentalization of PtdIns4,5-P2, and Gq, two important molecules for PAR signal-ing [40,41]. The suppression of Ca2+mobilization by cho-lesterol depletion might be a direct result ofdelocalization of PtdIns and Gq.
Interestingly, the DMR signals induced by trypsin orthrombin exhibited different dependency on the concen-tration of mβCD in solution. The pre-treatment of cellswith mβCD but not its inactive analog αCD attenuatedPAR signaling including Ca2+ mobilization and DMR sig-nals induced by thrombin or trypsin. The partial inhibi-tory effect of EGF pre-treatment suggests that thetransactivation of EGFR by cholesterol depletion mayattenuate, directly or indirectly, the N-DMR event medi-ated by thrombin or trypsin (Fig. 8b and 8c). Since theDMR signal is an integrated cellular response, it is verysensitive to the cellular background [17,18]. The activa-tion of EGFR directly by EGF, or indirectly by cholesteroldepletion, could alter the cellular background, thus indi-rectly impairing the N-DMR event induced by both PARagonists. Alternatively, the EGFR activation or transactiva-tion could lead to signaling pathway(s) crosstalking withGPCR signaling.
Page 9 of 12(page number not for citation purposes)
BMC Cell Biology 2007, 8:24 http://www.biomedcentral.com/1471-2121/8/24
For PAR1, the cell surface cholesterol level seems equallyregulate both Ca2+ mobilization and DMR signal, becauseboth types of cellular responses induced by thrombinexhibited the same sensitivity to mβCD concentration insolution. Conversely, for PAR2 the cell surface cholesterollevel appears regulate Ca2+ mobilization and DMR signaldifferently. Such a difference in sensitivity to mβCD con-centration between the trypsin- and thrombin-inducedDMR signals suggest that two receptors may involve dif-ferent cellular mechanism(s) or signaling network interac-tions.
ConclusionThe signaling of endogenous PAR1 and PAR2 in A431 wasstudied using non-invasive and manipulation-free opticalbiosensor. The biosensor-manifested DMR signals followclassical receptor biology. Similar to Ca2+ mobilization,the DMR signals are saturable to ligand concentrations;exhibit comparable desensitization patterns in responseto repeated stimulation with various combinations ofagonists; and are sensitive to cell surface cholesterol level.More significantly, data analysis suggests that the biosen-sor differentiates the signaling of PAR1 and PAR2 in A431under physiologically relevant conditions.
MethodsReagentsThrombin, trypsin, methyl-β-cyclodextrin (mβCD),A23187, AG1478, α-cyclodextrin (αCD), and epidermalgrowth factor (EGF) were purchased from Sigma Chemi-cal Co. (St. Louis, MO). Fluo-3 was obtained from Molec-ular Probes (Eugene, OR). SFLLR-amide, SLIGKV-amide,SLIGRL-amide, bradykinin, TFRGAP, GYPGQV, and YFLL-RNP-amide were obtained from Bachem (King of Prussia,PA). All compounds were used as received. Corning®
Epic™ 96well biosensor microplates were obtained fromCorning Inc (Corning, NY), and cleaned by exposure tohigh intensity UV light (UVO-cleaner, Jelight CompanyInc., Laguna Hills, CA) for 6 minutes before use.
Cell cultureHuman epidermoid carcinoma A431 cells (AmericanType Cell Culture) were grown in Dulbecco's modifiedEagle's medium (DMEM) supplemented with 10% fetalbovine serum (FBS), 4.5 g/liter glucose, 2 mM glutamine,and antibiotics. ~5 × 10⁴ cells at passage 3 to 8 suspendedin 200 μl the DMEM medium containing 10% FBS wereplaced in each well of a 96well microplate, and were cul-tured at 37°C under air/5% CO2 for ~2 days, followed by~20 hr starvation through continuously culturing in theserum-free DMEM.
Fluo-3 Ca2+ mobilization assayCells were grown in Costar™ 96well clear cell culturemicroplates. After starvation, the cells were washed with
1× HBSS (1× regular Hank's balanced salt solution, 20mM HEPES buffer, pH 7.0) in the presence of 2.5 mMprobenicid, and labeled in the same buffer containing 4μM Fluo-3 for 1 hour at room temperature. The cells werethen washed twice with buffer, maintained with 100 μl 1×HBSS containing 2.5 mM probenicid. The assay was initi-ated by transferring 50 μl PAR agonist solution to the cellplate, and calcium signal was recorded over 6 minuteswith a 6 sec interval using HTS7000 BioAssay Reader(PerkinElmer Life Science, Boston, MA). The fluorescentintensity before stimulation was recorded and used as abaseline. The percentage increase in fluorescence intensityafter stimulation, relative to the baseline fluorescence, wasanalyzed and used directly as a measure for the increase ofintracellular Ca2+ level induced by PAR agonists.
Optical biosensor measurementsCorning® Epic™ angular interrogation system with trans-verse magnetic or p-polarized TM0 mode was used for allstudies. The detailed instrumental setup and assay proto-cols had been previously described [16-18]. Briefly, allcompound solutions were prepared using 1 × HBSS con-taining minimal amount of dimethyl sulfoxide, while thestarved cells were washed and maintained with 100 μl theserum-free DMEM. The cells were then treated with 50 μl1 × HBSS buffered solution in the absence and presence ofa compound, followed by stimulation with ligand solu-tions. The cellular responses were monitored in real timethroughout the assays.
For functional recovery after cholesterol removal withmβCD, the quiescent A431 cells were treated with 5 mMmβCD for 15 minutes to ensure the removal of cell surfacecholesterol content, followed by washing the treated cellsthree times with the medium only. The cells were thenmaintained with 100 μl the medium, and placed into theoptical systems. After incubation for 15 minutes to allowcells reaching reasonably steady state, a 100 μl solution ofthrombin at 80 unit/ml was added to each well at specifictime. The optical responses were recorded throughout theassays.
Statistical analysisUnless specifically mentioned, three replicates were car-ried out for each measurement or each compound. Thestandard deviation was derived from these measurements(n = 3). The assay coefficient of variation was found to betypically less than 10%. All dose-dependent responseswere analyzed using non-linear regression method withthe Prism software (Graph Pad).
Authors' contributionsYF designed and executed part of experiments, and pro-vided interpretation of results. AMF executed most of the
Page 10 of 12(page number not for citation purposes)
BMC Cell Biology 2007, 8:24 http://www.biomedcentral.com/1471-2121/8/24
optical biosensor experiments. Both authors read andapproved the final manuscript.
AcknowledgementsThe authors would like to thank Dr. Norman H. Fontaine for his support in instrumentation.
References1. Vu TK, Hung DT, Wheaton VI, Coughlin SR: Molecular cloning of
a functional thrombin receptor reveals a novel proteolyticmechanism of receptor activation. Cell 1991, 64:1057-1068.
2. Negrescu EV, de Quintana KL, Siess W: Platelet shape changeinduced by thrombin receptor activation. Rapid stimulationof tyrosine phosphorylation of novel protein substratesthrough an integrin- and Ca2+-independent mechanism. J BiolChem 1995, 270:1057-1061.
3. Ishihara H, Connolly AJ, Zeng D, Kahn ML, Zheng YW, Timmons C,Tram T, Coughlin SR: Protease-activated receptor 3 is a secondthrombin receptor in humans. Nature 1997, 386:502-506.
4. Kahn ML, Zheng YW, Huang W, Bigornia V, Zeng D, Moff S, FareseRV, Tam C, Coughlin SR: A dual thrombin receptor system forplatelet activation. Nature 1998, 394:690-694.
5. Xu WF, Andersen H, Whitmore TE, Presnell SR, Yee DP, Ching A,Gilbert T, Davie EW, Foster DC: Cloning and characterization ofhuman protease-activated receptor 4. Proc Natl Acad Sci USA1998, 95:6642-6646.
6. Coughlin SR: How the protease thrombin talks to cells. ProcNatl Acad Sci USA 1999, 96:11023-11027.
7. Cottrell GS, Amadesi S, Schmidlin F, Bunnett N: Protease-acti-vated receptor 2: activation, signalling and function. BiochemSoc Trans 2003, 31(Pt 6):1191-1197.
8. Cottrell GS, Coelho AM, Bunnett NW: Protease-activated recep-tors: the role of cell-surface proteolysis in signalling. Essays inBiochemistry 2002, 38:169-183.
9. Macfarlane SR, Seatter MJ, Kanke T, Hunter GD, Plevin R: Protein-ase-activated receptors. Pharmacol Rev 2001, 53:245-282.
10. Al-Ani B, Wijesuriya SJ, Hollenberg MD: Proteinase-activatedreceptor 2: differential activation of the receptor by teth-ered ligand and soluble peptide analogs. J Pharmacol Exp Ther2002, 302:1046-1054.
11. Hansen KK, Saifeddine M, Hollenberg MD: Tethered ligand-derived peptides of proteinase-activated receptor 3 (PAR3)activate PAR1 and PAR2 in Jurkat T cells. Immunology 2004,112:183-190.
12. Kanke T, Ishiwata H, Kabeya M, Saka M, Doi T, Hattori Y, KawabataA, Plevin R: Binding of a highly potent protease-activatedreceptor-2 (PAR2) activating peptide, [3H]2-furoyl-LIGRL-NH2, to human PAR2. Br J Pharmacol 2005, 145:255-263.
13. Kawabata A, Saifeddine M, Al-Ani B, Leblond L, Hollenberg MD: Eval-uation of proteinase-activated receptor-1 (PAR1) agonistsand antagonists using a cultured cell receptor desensitiza-tion assay: activation of PAR2 by PAR1-targeted ligands. JPharmacol Exp Ther 1999, 288:358-370.
14. Iwakiri K, Ghazizadeh M, Jin E, Fujiwara M, Takemura T, Takezaki SI,Kawana S, Yasuoka S, Kawanami O: Human airway trypsin-likeprotease induce PAR-2 mediated IL-8 release in psoriasisvulgaris. J Invest Dermatol 2004, 122:937-944.
15. van Baal J, de Widt J, Divecha N, van Blitterswijk WJ: Translocationof diacylglycerol kinase θ from cytosol to plasma membranein response to activation of G protein-coupled receptors andprotein kinase C. J Biol Chem 2005, 280:9870-9878.
16. Fang Y, Ferrie AM, Fontaine NH, Mauro J, Balakrishnan J: Resonantwaveguide grating biosensor for living cell sensing. Biophys J2006, 91:1925-1940.
17. Fang Y, Ferrie AM, Fontaine NH, Yuen PK: Characteristics ofdynamic mass redistribution of EGF receptor signaling in liv-ing cells measured with label free optical biosensors. AnalChem 2005, 77:5720-5725.
18. Fang Y, Li G, Peng J: Optical biosensor provides insights forbradykinin B2 receptor signaling in A431 cells. FEBS Lett 2005,579:6365-6374.
19. Uezono Y, Kaibara M, Murasaki O, Taniyama K: Involvement of Gprotein βγ-subunits in diverse signaling induced by Gi/o-cou-
pled receptors: study using the Xenopus oocyte expressionsystem. Am J Physiol Cell Physiol 2004, 287:C885-C894.
20. Sun Y, Huang J, Xiang Y, Bastepe M, Juppner H, Kobilka BK, Zhang JJ,Huang XY: Dosage-dependent switch from G protein-coupledto G protein-independent signaling by a GPCR. EMBO J 2007,26:53-64.
21. Rasmussen UB, Gachet C, Schlesinger Y, Hanau D, Ohlmann P, vanObberghen-Schilling E, Pouyssegur J, Cazenave JP, Pavirani A: A pep-tide ligand of the human thrombin receptor antagonizes α-thrombin and partially activates platelets. J Biol Chem 1993,268:14322-14328.
22. Dorsam RT, Kim S, Jin J, Kunapuli SP: Coordinated Signalingthrough Both G12/13 and Gi Pathways Is Sufficient to ActivateGPIIb/IIIa in Human Platelets. J Biol Chem 2002,277:47588-47595.
23. Liebmann C, Graness A, Ludwig B, Adomeit A, Boehmer A, BoehmerFD, Nürnberg B, Wetzker R: Dual bradykinin B2 receptor signal-ling in A431 human epidermoid carcinoma cells: activationof protein kinase C is counteracted by a Gs-mediated stimu-lation of the cyclic AMP pathway. Biochem J 1996, 313:109-118.
24. Blackhart BD, Emilsson K, Nguyen D, Teng GW, Martelli AJ, NystedS, Sundelin J, Scarborough RM: Ligand cross-reactivity within theprotease-activated receptor family. J Biol Chem 1996,271:16466-16471.
25. Nakayama T, Hirano K, Shintani Y, Nishimura J, Nakatsuka A, Kuga H,Takahashi S, Kanaide H: Unproductive cleavage and the inacti-vation of protease-activated receptor-1 by trypsin in vascu-lar endothelial cells. Br J Pharmacol 2003, 138:121-130.
26. Simons K, Ikonen E: How cells handle cholesterol. Science 2000,290:1721-1726.
27. Haynes MP, Phillips MC, Rothblat GH: Efflux of cholesterol fromdifferent cellular pools. Biochemistry 2000, 39:4508-4517.
28. Westover EJ, Covey DF, Brockman HL, Brown RE, Pike LJ: Choles-terol depletion results in site-specific increases in epidermalgrowth factor receptor phosphorylation due to membranelevel effects: studies with cholesterol enantiomers. J Biol Chem2003, 27:51125-51133.
29. Barnes DW: Epidermal growth factor inhibits growth of A431human epidermoid carcinoma in serum-free cell culture. JCell Biol 1982, 93:1-4.
30. Fang Y, Ferrie AM, Li G, Fontaine NH: Cellular functions of cho-lesterol probed with optical biosensors. Biochim Biophys Acta2006, 1763:254-261.
31. Dorsam RT, Kim S, Jin J, Kunapuli SP: Coordinated signalingthrough both G12/13 and Gi pathways is sufficient to activateGPIIb/IIIa in human platelets. J Biol Chem 2002,277:47588-47595.
32. Kenakin T: Drug efficacy at G protein-coupled receptors. AnnuRev Pharmacol Toxicol 2002, 42:349-379.
33. McLaughlin JN, Shen L, Holinstat M, Brooks JD, DiBenedetto E,Hamm HE: Functional selectivity of G protein signaling byagonist peptides and thrombin for the protease-activatedreceptor-1. J Biol Chem 2005, 280:25048-25059.
34. Fang Y, Li G, Ferrie AM: Non-invasive optical biosensor forassaying endogenous G protein-coupled receptors in adher-ent cells. J Pharmacol Toxicol Methods 2007, 55:314-322.
35. Fang Y, Ferrie AM, Lahiri J: Systems biology and systems phar-macology of β2-adrenergic receptors in human epidermoidcarinoma cells. In Trends in Signal Transduction Research Edited by:Meyers JN. Nova Science Publishers, Inc., Ney York; 2007:145-171.
36. Mizuno O, Hirano K, Nishimura J, Kubo C, Kanaide H: Proteolysisand phosphorylation-mediated regulation of thrombinreceptor activity in in situ endothelial cells. Eur J Pharmacol2000, 389:13-23.
37. Bohm SK, Khitin LM, Grady EF, Aponte G, Payan DG, Bunnett NW:Mechanisms of desensitization and resensitization of protei-nase-activated receptor-2. J Biol Chem 1996, 271:22003-22016.
38. Woolkalis MJ, Demelfi TM, Blanchard N, Hoxie JA, Brass LF: Regu-lation of thrombin receptors on human umbilical veinendothelial cells. J Biol Chem 1995, 270:9868-9875.
39. Hoxie JA, Ahuja M, Belmonte E, Pizarro S, Parton R, Brass LF: Inter-nalization and recycling of activated thrombin receptors. JBiol Chem 1993, 268:13756-13763.
40. Pike LJ, Gasey L: Localization and turnover of phosphatidyli-nositol 4,5-bisphosphate in caveolin-enriched membranedomains. J Biol Chem 1996, 271:26453-26456.
Page 11 of 12(page number not for citation purposes)
BMC Cell Biology 2007, 8:24 http://www.biomedcentral.com/1471-2121/8/24
Publish with BioMed Central and every scientist can read your work free of charge
"BioMed Central will be the most significant development for disseminating the results of biomedical research in our lifetime."
Sir Paul Nurse, Cancer Research UK
Your research papers will be:
available free of charge to the entire biomedical community
peer reviewed and published immediately upon acceptance
cited in PubMed and archived on PubMed Central
yours — you keep the copyright
Submit your manuscript here:http://www.biomedcentral.com/info/publishing_adv.asp
BioMedcentral
41. Pike LJ, Miller JM: Cholesterol depletion delocalizes phosphati-dylinositol bisphosphate and inhibits hormone-stimulatedphosphatidylinositol turnover. J Biol Chem 1998,273:22298-22304.
Page 12 of 12(page number not for citation purposes)