Embed Size (px)
Citation preview
Accepted Manuscript
Blunt defect assessment in the framework of the failure assessment diagram
Jae-Jun Han, Yun-Jae Kim, Nicolas Larrosa, Robert A. Ainsworth
PII: S0308-0161(16)30266-6
DOI: 10.1016/j.ijpvp.2016.07.006
Reference: IPVP 3550
To appear in: International Journal of Pressure Vessels and Piping
Received Date: 15 September 2014
Revised Date: 15 July 2016
Accepted Date: 18 July 2016
Please cite this article as: Han J-J, Kim Y-J, Larrosa N, Ainsworth RA, Blunt defect assessment in theframework of the failure assessment diagram, International Journal of Pressure Vessels and Piping(2016), doi: 10.1016/j.ijpvp.2016.07.006.
This is a PDF file of an unedited manuscript that has been accepted for publication. As a service toour customers we are providing this early version of the manuscript. The manuscript will undergocopyediting, typesetting, and review of the resulting proof before it is published in its final form. Pleasenote that during the production process errors may be discovered which could affect the content, and alllegal disclaimers that apply to the journal pertain.
MANUSCRIP
T
ACCEPTED
ACCEPTED MANUSCRIPT
BLUNT DEFECT ASSESSMENT IN THE FRAMEWORK OF THE
FAILURE ASSESSMENT DIAGRAM
Jae-Jun Han, Yun-Jae Kim Department of Mechanical Engineering, Korea University
Anam-Dong, Seongbuk-Gu Seoul 136-701, Korea
Nicolas Larrosa*, Robert A Ainsworth
School of Mechanical, Aerospace & Civil Engineering, The University of Manchester Manchester M13 9PL, UK
Order of Authors: Jae-Jun Han; Nicolas O Larrosa; Yun-Jae Kim; Robert A Ainsworth. * Corresponding author (E-Mail) [email protected]
Manuscript for Submission to International Journal of Pressure Vessels and Piping
Submission Date: September 2014
MANUSCRIP
T
ACCEPTED
ACCEPTED MANUSCRIPT
1
ABSTRACT In order to reduce over-conservatism in fitness-for-service assessment procedures, experimental evidence and recent analytical developments recognise the importance of considering the actual shape of non-sharp flaws and/or the real geometric constraint conditions at the crack tip. This paper addresses the effect of blunt defects on the structural integrity assessment of reactor pressure vessel (RPV) and pipeline steels. Parametric studies for compact tension specimens with various notch root radii are performed using finite element analysis. The notch fracture toughness, the resistance to the onset of ductile cracking and the J-integral, quantifying the notch driving force, are evaluated. A stress-modified fracture strain model is used as a virtual testing method. The results are analysed in the framework of the failure assessment diagram (FAD), showing that the existing shape of the FAD is also suitable for assessments of blunt defects and how the concepts introduced can be used to reduce the conservatism in defect assessment, define margins on failure and indicate when plastic collapse is the dominant failure mechanism. KEYWORDS: Blunt defects; Failure assessment diagram; Defect assessment; Stress-modified fracture strain; Virtual testing; J-integral; Finite element analysis; Effective fracture toughness
NOMENCLATURE
a crack length ao initial crack length ∆a average crack growth B specimen thickness E elastic modulus
F Kr
reserve factor on Kr
F Kr(crack)
reserve factor on Kr for a sharp crack F
Kr(ρ) reserve factor on Kr for a blunt defect
J J-integral Jel elastic J-integral Jel
crack J value evaluated elastically for a sharp crack
Jelρ
J value evaluated elastically for a blunt defect
JICcrack
J value at 0.2mm crack growth for a sharp crack
JICρ
J value at 0.2mm crack growth for a blunt defect; effective fracture toughness
∆εe p incremental equivalent plastic strain
KI mode I stress intensity factor Kmat fracture toughness P applied load Pmax maximum load PL (plastic) limit load of a structure containing defects W specimen width α, β, γ material constants, see Eq. (5)
MANUSCRIP
T
ACCEPTED
ACCEPTED MANUSCRIPT
2
εf fracture strain σflow flow stress σu ultimate tensile stress σ0.2 0.2% proof stress σe von Mises effective stress σh negative hydrostatic (mean normal) stress σh/σe stress triaxiality σe, σm equivalent stress and hydrostatic stress σ1, σ2, σ3 principal stresses, see Eq. (4) ν Poisson’s ratio ω, ∆ω accumulated damage and incremental damage respectively Abbreviations ASTM American Society for Testing and Materials CTOD crack tip opening displacement C(T) compact tension EPFM elastic-plastic fracture mechanics FAD failure assessment diagram FE finite element FFS fitness-for-service LEFM linear elastic fracture mechanics LLD load-line displacement MPC multi-point constraint N-SIF notch stress intensity factor SIF stress intensity factor
MANUSCRIP
T
ACCEPTED
ACCEPTED MANUSCRIPT
3
1. INTRODUCTION
There exist many situations in engineering applications in which detected defects are not sharp [1-3]. However, it is common practice to simplify and re-characterise these defects into shapes more amenable to analysis. Current assessment procedures such as API579-1 [4], R6 [5] and BS7910 [6] usually treat defects as infinitely sharp cracks, both because they can be treated by well-known approaches like linear elastic fracture mechanics (LEFM) or elastic plastic fracture mechanics (EPFM) and also because this assumption represents the worst case scenario, thus being conservative from a fitness-for-service (FFS) point of view.
The material resistance to fracture is usually described by critical stress intensity factor (SIF),
crack tip opening displacement (CTOD) or J-integral values. A considerable amount of published work recognises the benefit of using an apparent/effective fracture toughness in FFS assessments [7-10]. Constraint, that is, the level of triaxial state of stress, is usually related to the capacity to absorb more energy by accommodating plastic deformation. The local stress and strain fields surrounding a non-sharp defect are known to be less severe than those at the tip of a sharp crack, thus exhibiting a reduced constraint condition. The initiation and propagation of damage under these conditions will occur at higher values of applied J and higher J-R curves will be typically measured experimentally. Thus, in FFS calculations, this increased toughness implies that the conditions for repair or replacement of a component containing a non-sharp defect could be relaxed.
A number of authors have tested components containing non-sharp defects to evaluate the
effective fracture toughness for a variety of materials and notch geometries. Both cleavage fracture [11,12] and ductile tearing [13-16] as well as the influence of the notch geometry on the mechanisms triggering fracture have been reported in the literature [8,17,18].
The evaluation of the effective fracture toughness for a given material requires extensive
experimental testing for the component of interest and for different notch/defect geometries. Thus, it is expensive and time-consuming. Different approaches making use of minimum experimental information may be needed to reduce the number of tests. In this context, several authors [19-23] have proposed and validated different procedures to include the effect of the geometry on both the driving force and the constraint conditions at the defect. Most of these approaches consider small-scale yielding conditions and use LEFM or EPFM to evaluate the notch driving force (e.g., N-SIF, notch J-integral) and an additional parameter (e.g., Q- or T-stress) which defines the constraint condition in the process zone. These procedures are usually called global approaches.
An alternative framework for effective fracture toughness assessment is the application of
failure models, often referred to as local approaches. Local approaches couple the loading history (stress-strain) near the crack-tip region with micro-structural features of the fracture mechanism [24]. The parameters depend only on the material and not on the geometry, and this leads to better transferability from specimens to structures than single- and two-parameter fracture mechanics methods [25]. Several models based on local approaches have been applied with considerable success for the fracture initiation mechanism given by cleavage fracture or ductile tearing. In this
MANUSCRIP
T
ACCEPTED
ACCEPTED MANUSCRIPT
4
study, due to the high ductility of the materials under analysis, ductile tearing is considered to be the principal mechanism for fracture.
The most commonly used models for ductile fracture are the Beremin ductile model [26], the
Gurson-Tvergaard-Needleman [27-29] and Rousselier [30] models. These models consider the effects of void nucleation and growth on the material stress-strain behaviour, and thus are usually called 'micromechanical models for ductile failure'. Although of some physical meaning, the number of independent parameters and the difficulty in their determination make the use of these models cumbersome for practical engineering applications.
There is another type of ductile model, usually referred to as a phenomenological model,
which involves fewer parameters and is of simpler implementation. Due to the fact that stress triaxiality has a strong influence on void growth and therefore on the strain to fracture [31-35], phenomenological models correlate stress triaxiality with the critical strain to fracture. Such models have been researched by McClintock [31], Rice and Tracey [32], Hancock and Mackenzie [33,34] and Hancock and Brown [35], and further developed based on the concept of a stress-modified critical strain [36,37]. From this concept, more recently, a simple method to simulate ductile failure using a finite element (FE) technique has been proposed which is called a stress-modified fracture strain model [38,39]. This has been extensively applied to components containing defects, showing good agreement with test results including those from sharp cracks and blunt defects [39-43].
In this work, finite element ductile fracture simulations using the stress-modified fracture
strain model are performed to evaluate the effect of notch radius. The varying severity of the stress fields due to the presence of the notch and the implications of the different constraint levels due to notch acuity are analyzed within the framework of the failure assessment diagram (FAD). Compact tension, C(T), specimens with a wide range of notch root radii are modeled using FEA and ductile damage simulation to construct resistance curves (J-R curves) for four different materials, showing different fracture criteria and tensile properties. Effective fracture toughness values are obtained from the J-R curves and the applied elastic J and the limit load, representing the notch driving force, are derived and assessed on the FAD. Section 2 reviews the FAD assessment. Section 3 briefly explains the damage model and the simulation technique and summarises the material properties used in this work. The different geometries of C(T) specimens and FE analysis details are described in Section 4. Results are presented and discussed in Section 5. The benefits from considering the blunt shape of defects are also discussed by means of showing the effect on reserve factor relative to that for a sharp defect. The work is concluded in Section 6.
MANUSCRIP
T
ACCEPTED
ACCEPTED MANUSCRIPT
5
2. REVIEW OF FAILURE ASSESSMENT DIAGRAM APPROACH The FAD is the most widely used engineering approach for assessing the integrity of
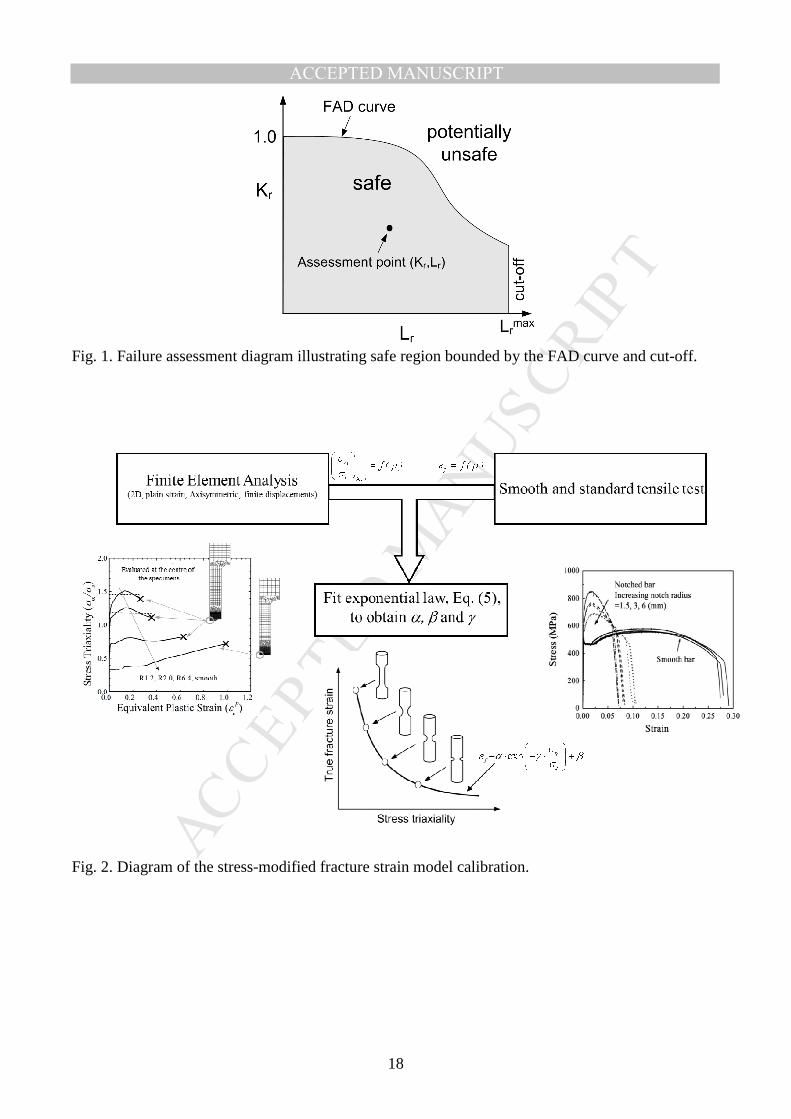
structures containing defects. The FAD curve is a graphical description of the limiting driving force as a function of the applied load [44]. Figure 1 shows a schematic representation of a typical failure assessment diagram. The assessment involves the calculation of both the fracture ratio rK and the
plastic collapse ratio rL . The ordinate Kr, and abscissa Lr represent the proximity to fracture and to
failure by plastic collapse and are calculated as:
( , )Ir
mat
K P aK
K= (1a)
0.2( , )rL
PL
P a=
σ (1b)
where KI, P, a, Kmat, σ0.2 and PL are the stress intensity factor, applied load, crack size, fracture toughness, 0.2% proof stress and limit load, respectively. Equation (1a) is written for primary loading, P, only but has been extended to combined primary and secondary loading, as incorporated in the procedures [4-6] and recently discussed in [45]. The present study only addresses primary loading and therefore the simplified form of Eq. (1a) is sufficient.
The failure assessment curve, which determines the safety of components assessed, is defined by
max
max
( ) for
with ( ) 0 for
r r r r
r r r
K f L L L
f L L L
= <
= ≥ (2)
where Lr
max is an indicator of failure by plastic collapse, and is a cut-off line for the failure assessment curve. The definition is given by
max flow
0.2rL
σ=σ
(3)
where σflow is the flow stress defined as the mean of the yield stress and ultimate tensile stress. Provided the assessment point (Lr, Kr) lies within the area bounded by Eqs. (2) and (3), the component is regarded as safe, as shown in Fig. 1. Otherwise, failure is conceded. The appropriate shape of the failure assessment curve, f(Lr), for application to blunt notches is discussed in Section 5.4.
3. DUCTILE FRACTURE SIMULATION AND MATERIAL PROPERTIES
3.1 Damage Model and Simulation Technique
MANUSCRIP
T
ACCEPTED
ACCEPTED MANUSCRIPT
6
In this work, as a local failure criterion, a phenomenological model which is based on the concept of stress modified fracture strain [36-39] is used to simulate ductile fracture of C(T) specimens containing cracks or notches of differing radii, of varying level of constraint conditions. It has been demonstrated that, in the ductile fracture mechanism, true fracture strain strongly depends on the stress triaxiality [31-35], defined by:
1 2 3
3m
e e
σ σ σ σσ σ
+ += (4)
where σi (i=1-3) are principal stresses and σe is the equivalent tensile stress or von Mises stress. The true fracture strain can be determined from the stress triaxiality using an exponential relationship [32]:
exp mf
e
σε α γ βσ
= − +
(5)
where α, β and γ are material constants obtained from smooth and notched bar tensile tests [39]. A schematic description of the calibration process and the conceptual idea of the damage model is shown in Fig. 2. Once the material constants are available, damage, ω, is calculated by summing the incremental damage (at each FE loading step), ∆ω, given by
pe
f= ∆ε∆ω
ε (6a)
( ) ( ) ( )1 2 2 3 1
2 2 2
32
3ep p p p p p pε ε ε ε ε ε ε∆ = ∆ − ∆ + ∆ − ∆ + ∆ − ∆ (6b)
where pe∆ε is the equivalent plastic strain increment, obtained from the principal plastic strain
increments pi∆ε (i=1-3) calculated from FE analysis. When the accumulated damage becomes
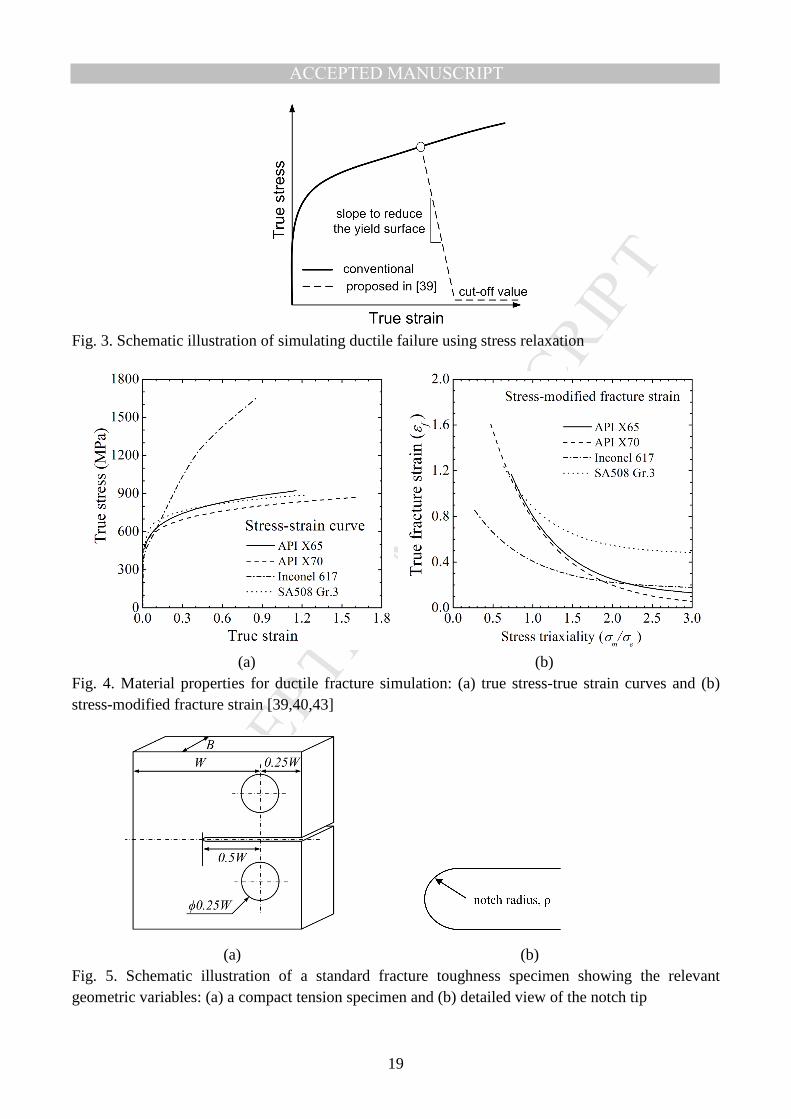
equal to unity (ω =1), local failure is assumed to occur and crack growth is simulated by reducing all the stress components to a small plateau value as schematically presented in Fig. 3. This procedure is implemented using the ABAQUS UHARD and USDFLD user-defined subroutines [46] coded in FORTRAN 90. 3.2 Summary of Material Properties
The calibration of the damage model for any material is performed by combining detailed elastic–plastic FE analyses with smooth and notched bar tensile test results. From the experimental results, true fracture strains as a function of notch radii are determined. From FEA analysis, variations in stress triaxiality until fracture are considered for each geometry. As a result of this procedure, the equivalent fracture strain is expressed as a function of stress triaxiality and this relation is assumed to be material-dependent only. In this work, the failure criterion is based on
MANUSCRIP
T
ACCEPTED
ACCEPTED MANUSCRIPT
7
averaged stress and strain information over the ligament where ductile fracture is expected to occur [38].
Although, labour intensive and time consuming, once the damage model is calibrated and the material parameters evaluated, this phenomenological damage model can be applied to predict the ductile fracture behaviour of any component or structure. A detailed description of the methodology can be found in [38].
In this work, tensile properties and stress-modified fracture strains of four different materials were taken from the literature [47,48] and our previous work [39,40,43]. API X65 and X70 pipeline steels, Inconel alloy 617, and SA508 grade 3 low alloy steel were chosen to study the effect of different tensile and fracture behaviours. The true stress-strain curves and stress-modified fracture strains were determined from tensile tests on notched bars with various notch radii. The results are summarised in Fig. 4, and Eq. (7):
Criterion for API X65: 3.29 exp 1.54 0.01mf
e
σεσ
= × − × +
(7a)
Criterion for API X70: 3.10 exp 1.40 0.01mf
e
σεσ
= × − × +
(7b)
Criterion for Alloy 617: 1.01 exp 1.43 0.17mf
e
σεσ
= × − × +
(7c)
Criterion for SA508 Gr.3: 2.24 exp 1.69 0.47mf
e
σεσ
= × − × +
(7d)
As shown in Fig. 4, the true fracture strain of X70 is larger than that of X65. API X65 pipeline steel and SA508 Gr.3 steel have similar stress-strain behaviour; however, the effect of stress triaxiality on fracture strain differs significantly. The Inconel alloy shows a larger strain hardening effect than the other materials and due to that, in the lower range of stress triaxiality, the critical fracture strain is lower. Tensile properties are summarised in Table 1. It should be noted that, in previous work [39,40,43], all tensile properties and stress-modified fracture strains were verified by comparison with experimental data on fracture toughness test specimens and pressurised pipes with gouges, which can be regarded as the blunt defects considered in this work. In Section 4, using these data, virtual tests for fracture toughness of notched specimens are carried out and the results are discussed.
4. GEOMETRY AND FINITE ELEMENT ANALYSIS
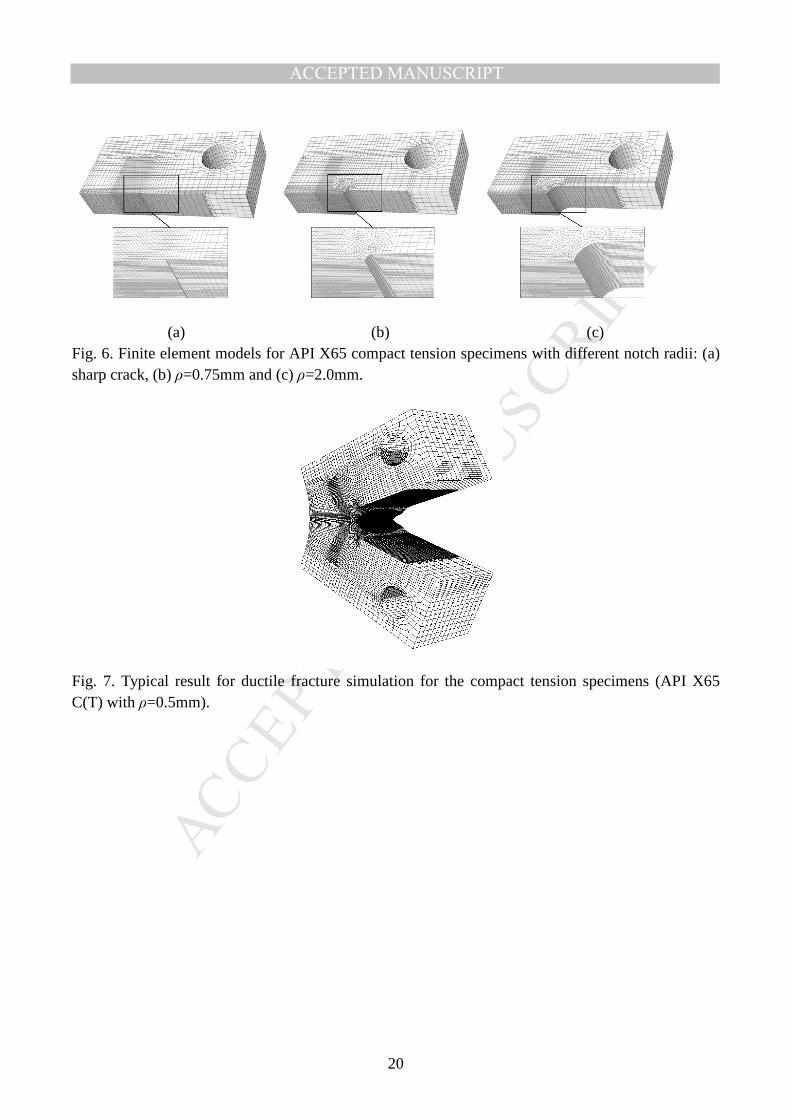
To study the effect of notch bluntness on defect assessment, 0.5T standard sized compact tension specimens used in fracture toughness testing [49,50] with seven different notch root radii from a sharp crack to a notch radius of 2.0mm were considered as shown in Fig. 5. The specimen width, W, and thickness, B, are 25.4mm and 12.7mm, respectively. Figure 6 shows the 3-D FE models used in fracture simulation for the different notch root radii. Specimens without side grooves were considered in order for such side grooves not to affect the stress states in the regions surrounding the blunt defect. Models of quarter notched C(T) specimens were developed taking advantage of the symmetry conditions of load and geometry, to improve the time-efficiency. In
MANUSCRIP
T
ACCEPTED
ACCEPTED MANUSCRIPT
8
previous work [39] it has been found that element size in the defect section affects the results for the damage accumulation process; therefore, these values must be determined by comparison with test results. The element sizes used in this work, which have been calibrated from test data, are 0.15mm [39], 0.1mm [40], 0.25mm [40] and 0.1mm [43] for API X65, X70, Inconel 617 and SA508 Gr.3, respectively, and specimens with notches of these radii are regarded as the cases of sharp cracks. The total numbers of elements/nodes in the FE models range from 23,366/26,016 to 88,929/95,542.
A displacement boundary condition was applied to a load pin and controlled by a reference
node which was coupled with surface nodes of the pin hole using the MPC (multi-point constraint) option within ABAQUS. Elastic-plastic damage analyses (or elastic analyses) were carried out considering large deformation effects. In the calculation process of damage accumulation, Eqs. (6) and (7) were implemented by means of UHARD and USDFLD subroutines. In order to avoid numerical instability arising from the rapid decrease of stress, the decreasing slope and the cut-off shown in Fig. 3 had values of 1/5000 and less than 10% of the yield strength, respectively, based on a sensitivity analysis. More detailed information can be found in [39].
The crack extension, ∆a, in the FE analysis was obtained by using the nine-point average
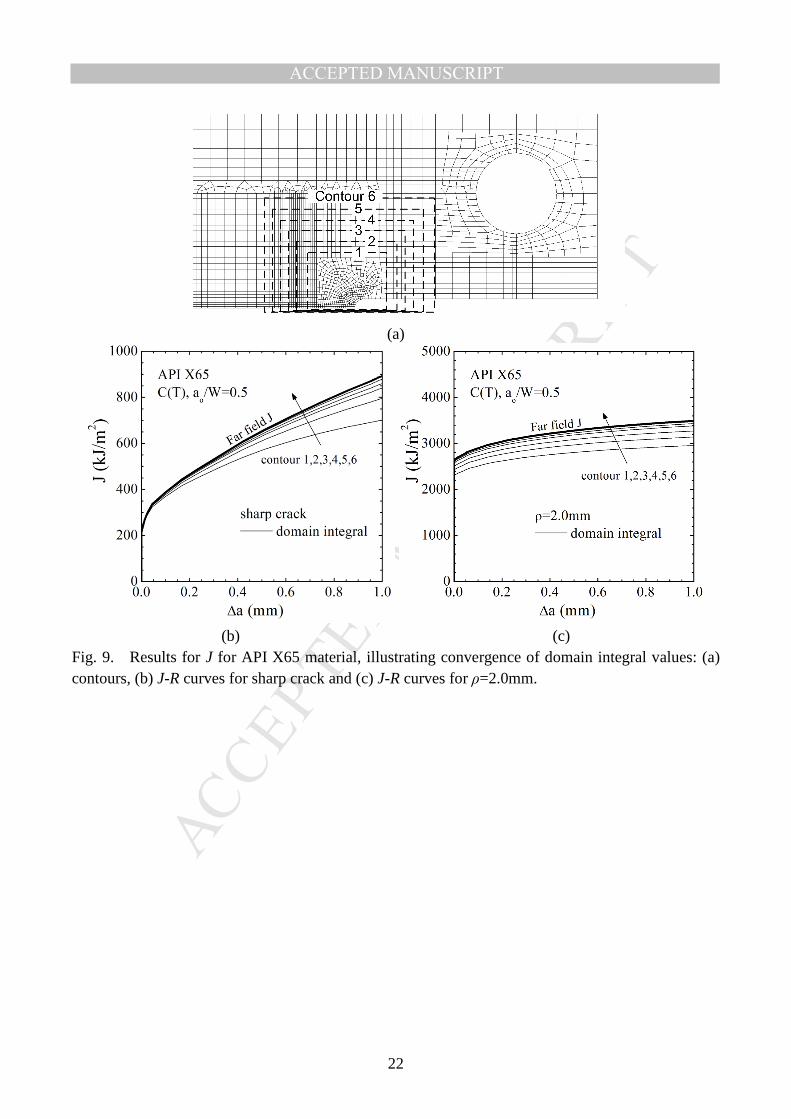
method recommended in the ASTM testing standard [49]. J-integral values for the C(T) specimens with varying crack length were obtained from the FE results by means of the domain integral method [51,52]. The domains were chosen to be sufficiently far away from the crack tip to include the whole stress fields produced by the presence of the notch but close enough to avoid any errors resulting from the influence of specimen boundaries. The values of J were averaged through the specimen thickness. In addition, the load-load line displacement records were extracted at the centre of the pin hole using the reference point from the FE results to provide an alternative estimate of J and to construct J-R curves following the procedures of ASTM E1820-13e1 [49].
5. RESULTS
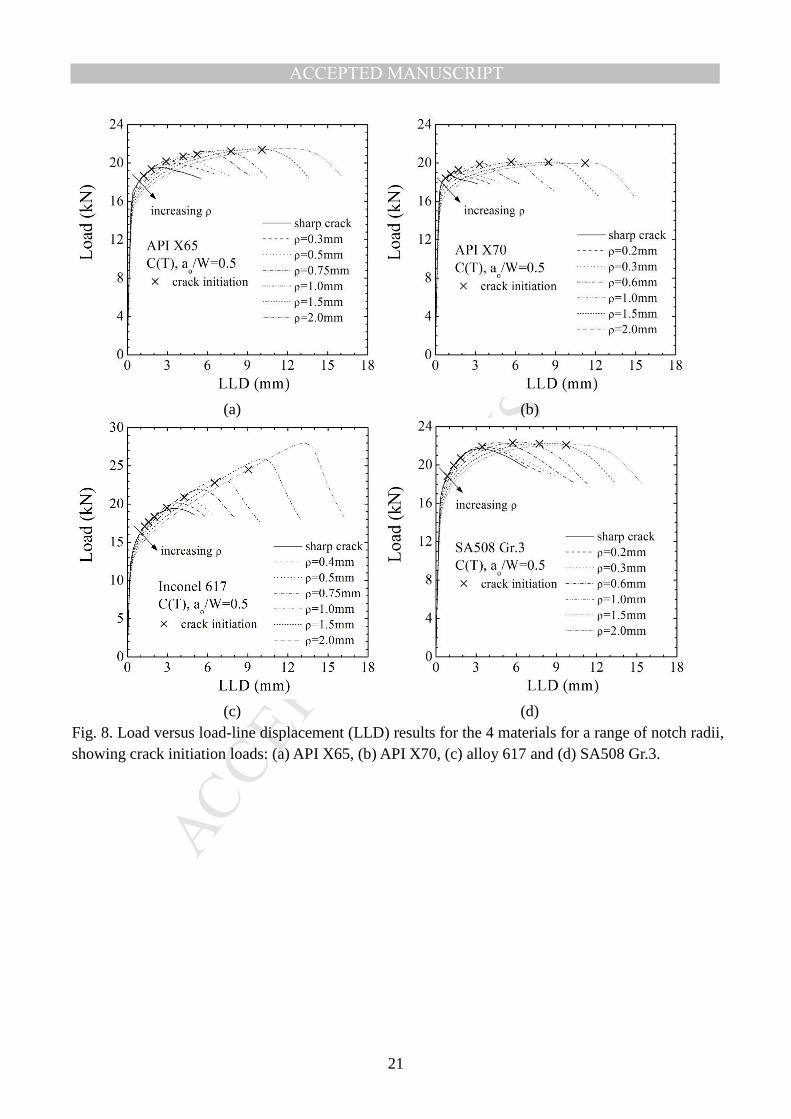
In this section, results from the ductile fracture simulation of the compact tension specimens with various notch radii are reported and graphically presented in the framework of the failure assessment diagram. After presenting load-load line displacement curves, J-R curves calculated in accordance with the ASTM standard [49] are compared with those obtained using the domain integral method. From the constructed J-R curves, the fracture toughness, JIC, defined as the J-integral value at a crack extension of 0.2mm, is determined and discussed. As a quantity representing the crack driving force, applied elastic J values are also calculated and used together with the fracture toughness values to assess the fracture ratio Kr for a FAD assessment. 5.1 Load-Load Line Displacement Data Figure 8 shows the load-load line displacement records for the four materials described in Section 3.2 for a wide range of notch root radii. Crack initiation points, defined by any accumulated damage at Gauss points reaching the critical value (ω=1) are highlighted. For sharp defects,
MANUSCRIP
T
ACCEPTED
ACCEPTED MANUSCRIPT
9
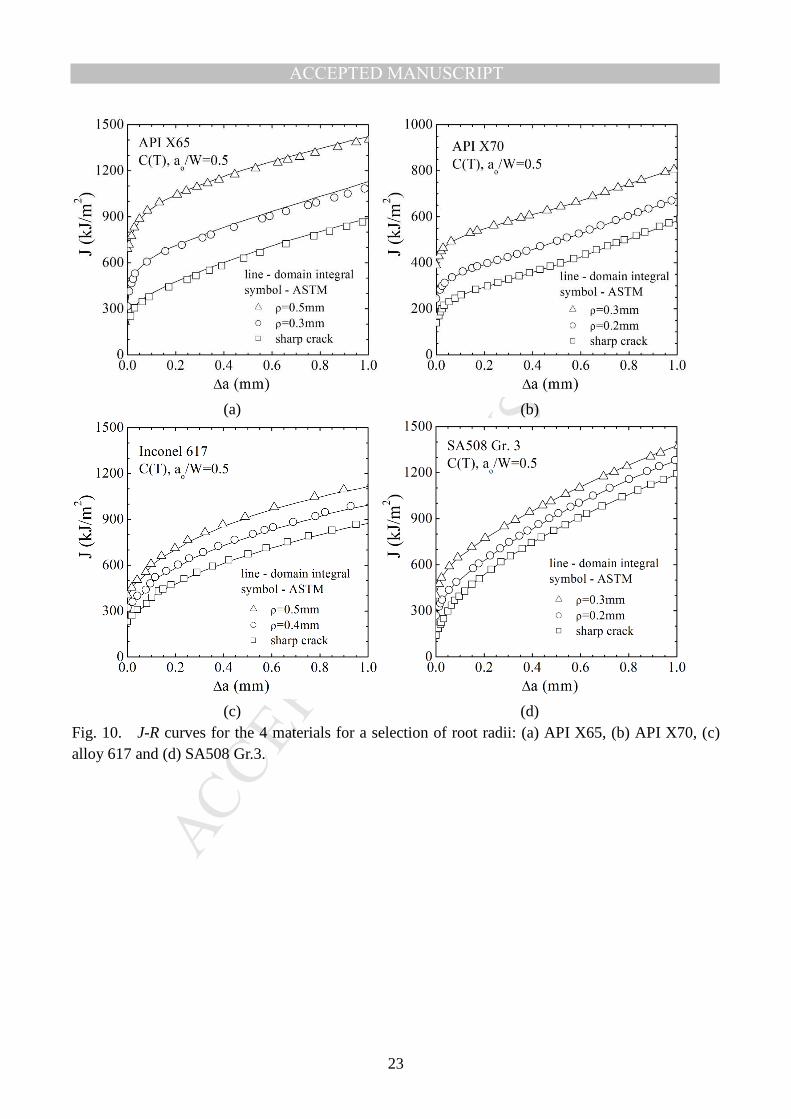
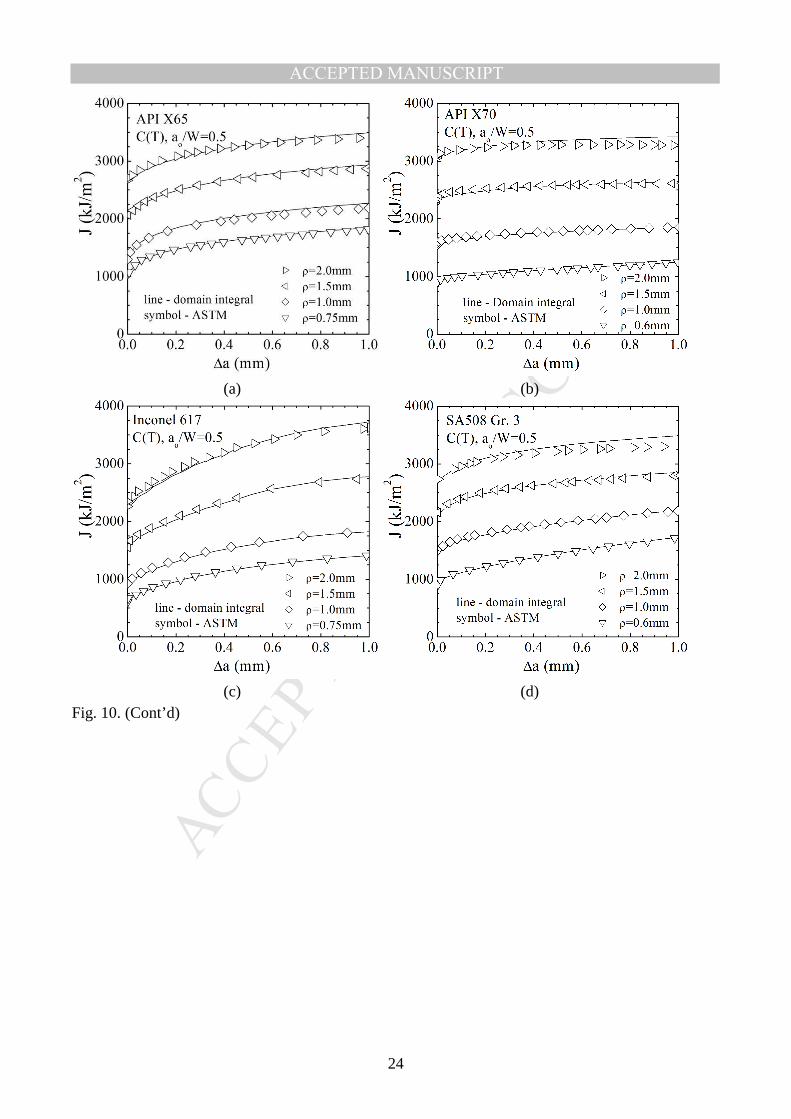
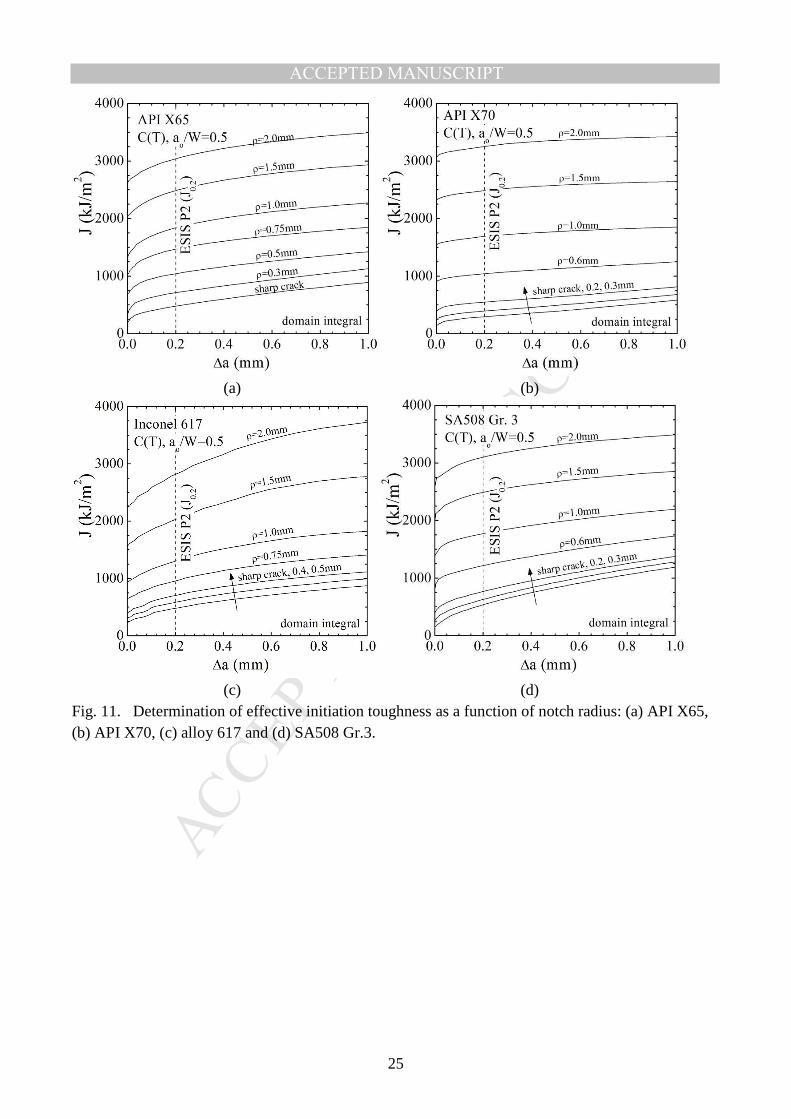
initiation occurs before the maximum load, Pmax, is reached, ranging from 0.85Pmax to 0.98Pmax, depending on the material. As the notch root radius increases, initiation loads become close to the maximum loads due to the loss of constraint. Apart from the Inconel 617 alloy, maximum loads converged to become independent of notch radius for notch radii of 0.6mm or larger. A typical deformed shape of a C(T) specimen from a ductile fracture simulation is shown in Fig. 7. 5.2 J-R Curves and Determination of Fracture Toughness for Blunt Notch J-R curves were constructed using two different procedures: from the domain integral method and from the FE load-displacement results using the testing standard in [49]. When the domain integral method is used for evaluating the J-integral, care should be taken to ensure that far-field J values are obtained in order to match values that would be obtained from experimental data [53-56]. Figure 9 shows convergence of the J values for different contours obtained from the domain integral method. The far-field J values were plotted as a function of crack extension and compared with J-R curves derived from load-load line displacement data according to ASTM E1820-13e1 with FE crack growth averaged through the thickness. For all cases, from sharp cracks to blunt defects, the results of both methods showed good agreement as depicted in Fig. 10. As input to the FAD framework, elastic J integral values were first calculated from linear-elastic FE analysis, using the domain integral method. Secondly, the evaluation of the effective initiation fracture toughness for blunt defects, JIC
ρ, defined by the J value at 0.2mm crack growth, is
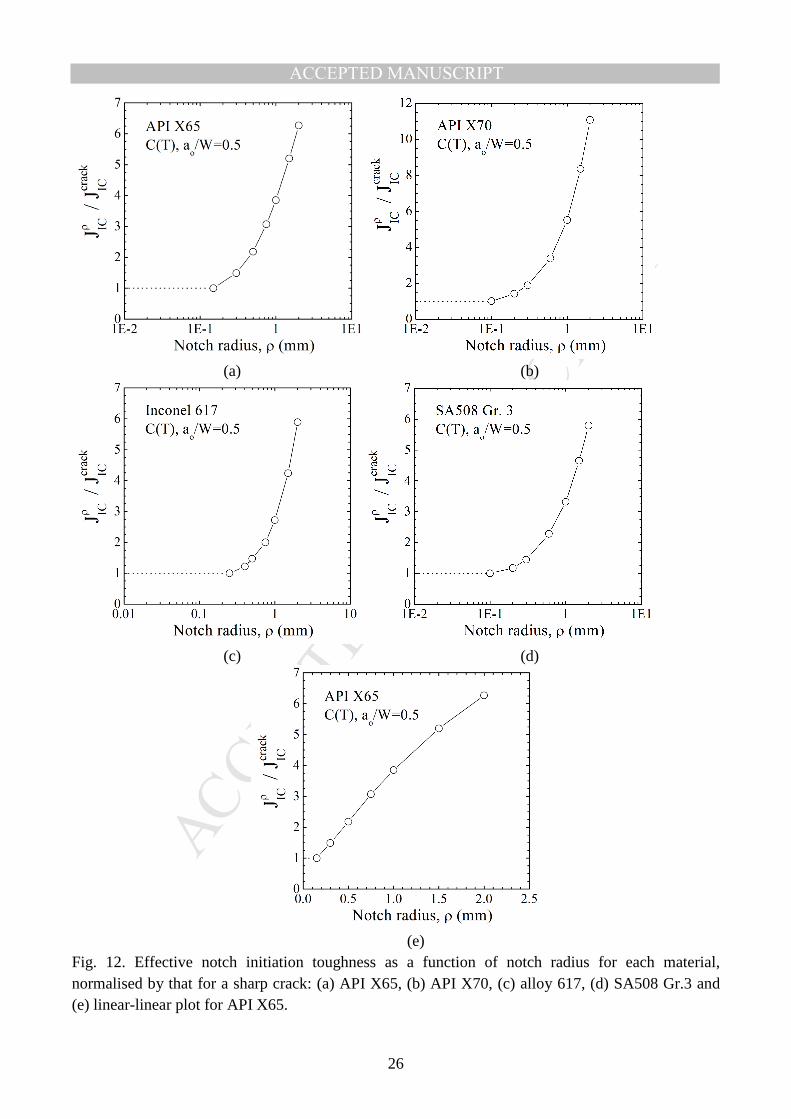
assessed and shown in Figure 11. The normalised value JICρ/JIC
crack, determined from Fig. 11, is
plotted in terms of notch radius in Fig. 12a-d in a linear-log scale. From the results, it is evident that notch root radius has a strong influence on effective fracture toughness. This can lead to an increase of a factor of 11 for the API X65 steel and a factor of 6 for the other materials. This would show a clear benefit in a FAD assessment, or indeed in direct J assessment methods, in comparison with assuming the defect is a sharp crack. It is also observed that the effective fracture toughness linearly increases with notch radius, as illustrated by Fig. 12e, a result has also been found in a number of experimental investigations for blunt defects [57-59].
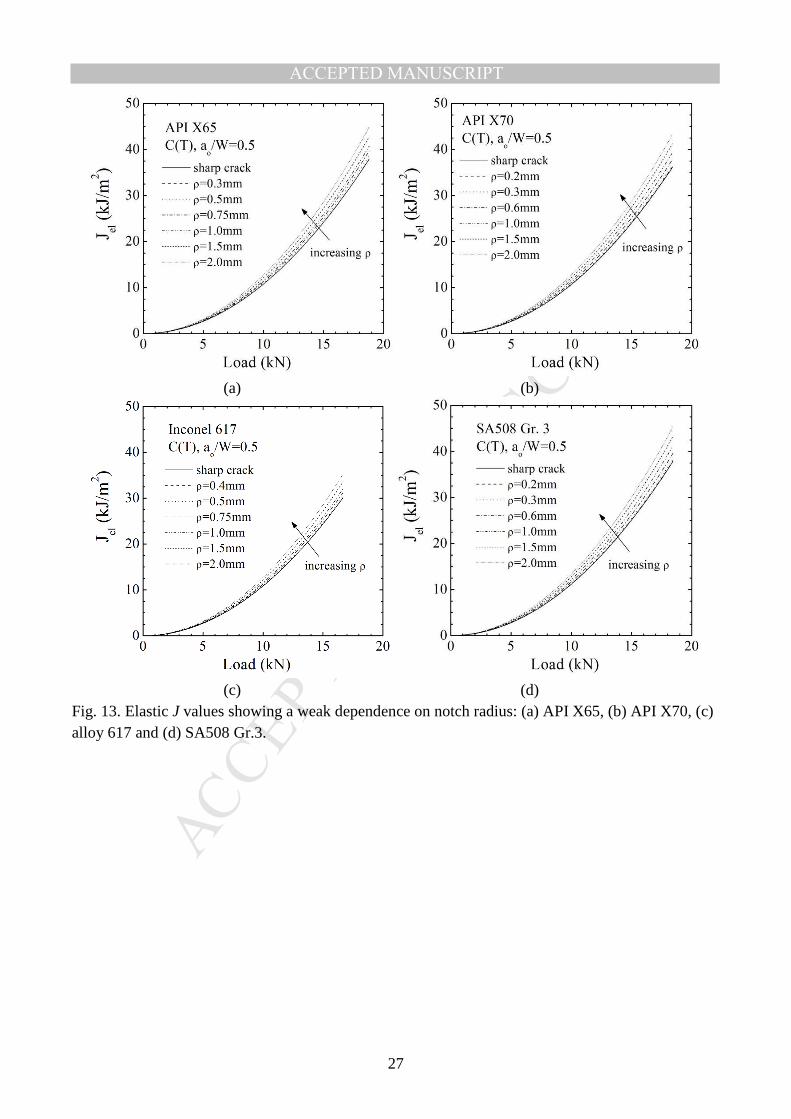
5.3 Estimating a Crack Driving Force for a Blunt Notch The J-integral as defined by Rice [60] can have different interpretations. In our case, the
relevant interpretation is that related to the characterisation of the singularity in the deformation field surrounding the tip of a defect, either a notch or a crack. Different notch acuities represent different deformation fields with the value of J characterising the deformation fields of the blunt notches.
The value of J increases with decreasing notch acuity, that is, the crack driving force for a
blunt defect is higher than that for a sharper one at a given load. This fact does not mean that a blunt notch is more detrimental than a sharp notch. There is a balance in terms of loss of constraint for the case of the blunt notch, which corresponds to an increase in the capacity of the blunt notched component to sustain load before fracture, which is evident in structures with blunt defects exhibiting higher values of effective fracture toughness.
MANUSCRIP
T
ACCEPTED
ACCEPTED MANUSCRIPT
10
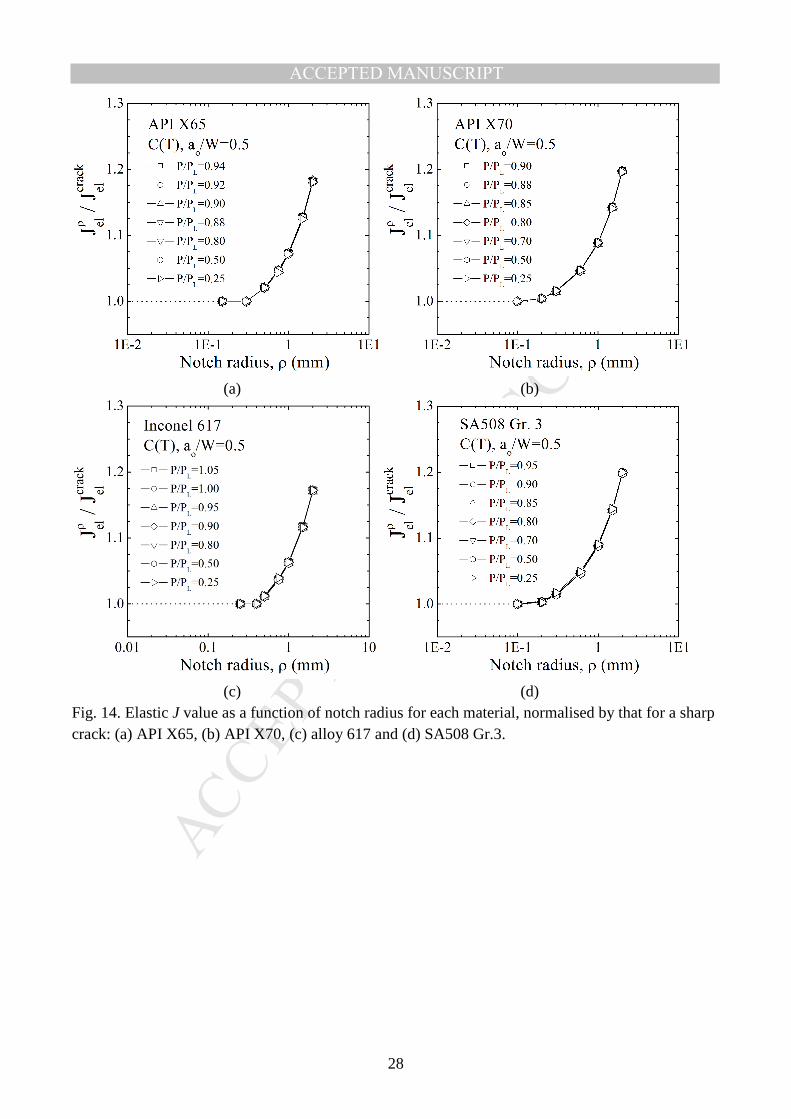
Figure 13 shows the variation of elastic J values with applied load. As mentioned above, the value of J increases with increasing notch radius, although this dependency is weak. The elastic J-integral was evaluated from the same contours used in Section 5.2 and the applied load was chosen, depending on the material, to be before crack initiation so that there was no influence of crack extension. In Fig. 14 normalised J values are shown, defined as the elastic J for a blunt notch, Jel
ρ,
divided by that for the sharp crack, Jelcrack
, for different notch acuities, showing identical results regardless of the loading level because of the elastic response. The seven different cases for the ratio of applied load to the limit load, P/PL, were selected to study the effect of loading ratio on the FAD assessments presented later. The solution (IV.1.5.1-3) provided in R6 [3] was used to calculate PL:
0.2L LP n WB= σ (8a)
222.702 4.599 (1 1.702 ) ; /
3Ln a W = + β − + β β =
(8b)
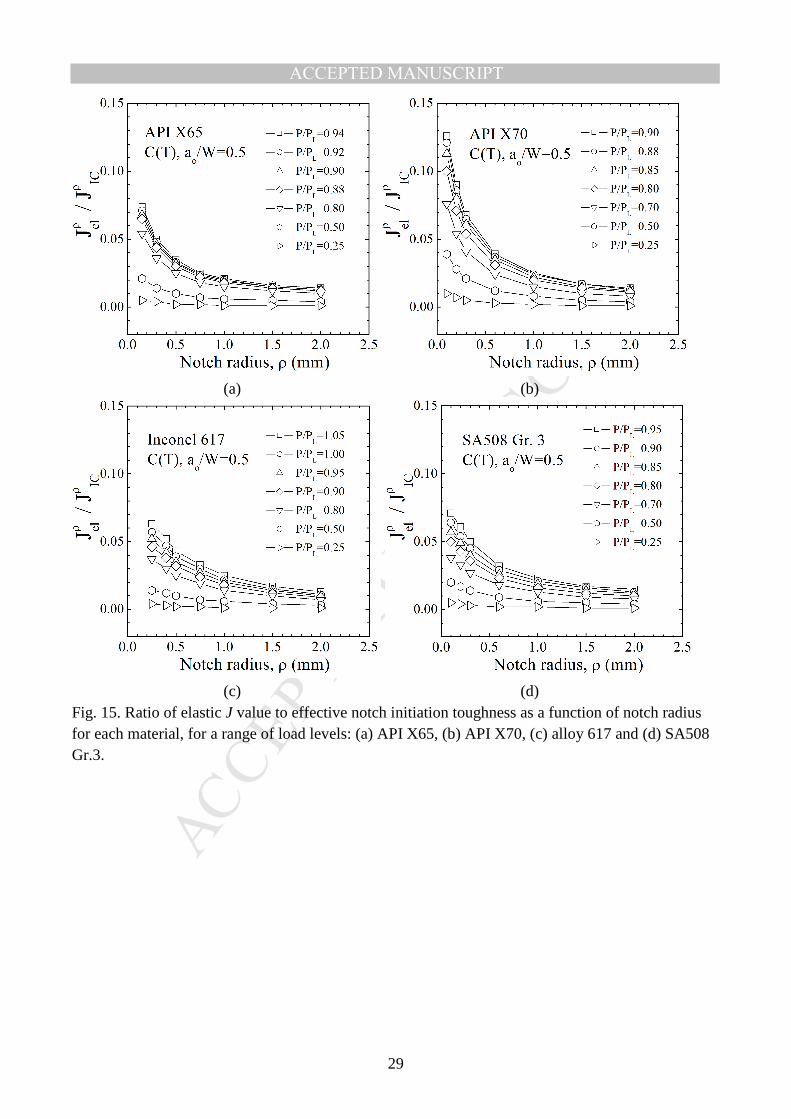
where B, W and σ0.2 are specimen thickness, width and 0.2% proof stress, respectively. The results did not take into account the effect of notch radius on limit load. Although the limit load will reduce with increasing notch radius, the effect is expected to be small as the largest notch radius (2mm) is small compared to the dimensions of the C(T) specimen (25.4mm). The small influence of notch radius is also seen in the elastic response in Fig. 14: the differences in Jel values for sharp and blunt defects are shown to be at most around a factor of 1.2, which is a considerably lower factor than that of 6 to 11 on effective fracture toughness. The results show the clear benefit of considering the blunt defect shape and the reduction of constraint associated with that shape and the benefits are examined in the context of the FAD next. 5.4 Failure Assessment Diagram Analysis Failure Assessment Diagrams were constructed using the results obtained following the analysis procedure described above. The assessment was carried out to quantitatively estimate the conservatism involved in the assumption of treating defects as infinitely sharp cracks. Figure 15 normalises the Jel
ρ values by the effective fracture toughness, JIC
ρ. Although this ratio does not
control ductile fracture because of the absence of plasticity effects in elastic applied J values, the reduction of this ratio with increase in notch radius can be seen in Fig. 15. As the notch radius increases, the ratio Jel
ρ/JIC
ρ decreases and seems to converge for a notch radius of 1.0 to 1.5mm,
depending on the material. To assess the C(T) specimens with various notch radii on the FAD, the coordinates of the assessment points (Lr, Kr) were evaluated using the data presented in Fig. 15. The value of Kr of Eq. (1a) is derived from Eq. (9):
elIr
mat IC
JKK
K J
ρ
ρ= = for blunt defects (9)
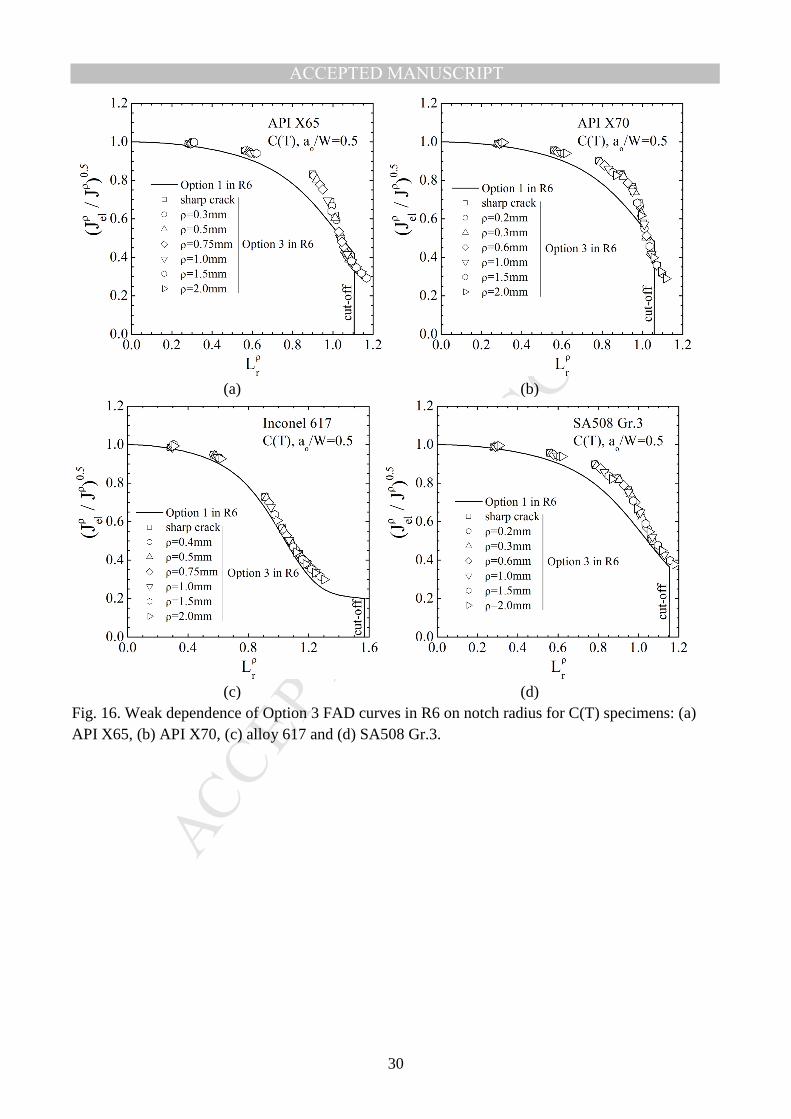
The Option 1 FAD curve in R6 was shown in [22] to be only weakly dependent on notch radius for single edge notch bend specimens. Figure 16 presents FAD assessment points for C(T) specimens using R6 Option 3. With this option, Kr is defined as the square root of the ratio of the elastic J for a
MANUSCRIP
T
ACCEPTED
ACCEPTED MANUSCRIPT
11
blunt notch, Jelρ, to the elastic-plastic J for a blunt notch, J
ρ; the load ratio of Eq. (1) is the ratio of
the load to the limit load, allowing for the effect of notch radius on limit load, and here denoted Lrρ.
Figure 16 confirms that the result of [22] also holds for C(T) specimens: the failure assessment curve shows only a weak dependence on notch radius and is close to R6 Option 1 in all cases.
For further FAD assessments, the value of Lr of Eq. (1b) was determined from the various loading ratios, P/PL, in Fig. 15 corresponding to the values of Kr, but without allowing for the weak effect of notch radius on limit load. This simplification enables the effect of notch radius on margins to be more readily visualised. The Option 1 FAD curve in R6 was chosen as it has been shown above that the failure assessment curve is only weakly dependent on notch radius. The cut-off, Lr
max,
was calculated using Eq. (3).
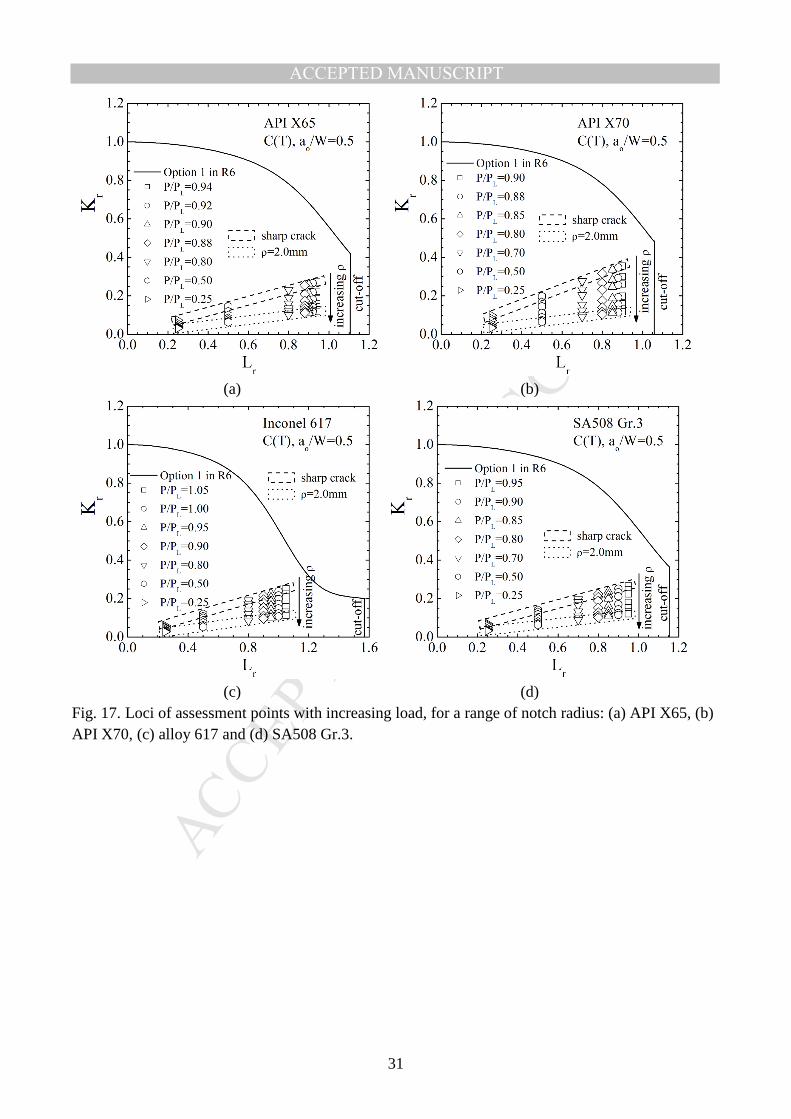
Figure 17 shows the FAD assessments for the four different materials. The extremes of the notch profiles are shown by the assessment points within the dashed box and the dotted box, which correspond to C(T) specimens with a sharp crack and a blunt notch of ρ=2.0mm, respectively. The Kr points of each notch radius linearly increase with increasing Lr. Results show that as the notch radius becomes larger the assessment points are shifted downward. The reduction in Kr is driven by an increase in effective toughness which results in safer conditions within the FAD framework. The approach of using the definition of Kr of Eq. (9) is essentially that followed by Horn and Sherry [22], although their application was largely for cleavage fracture. In R6 [5], reserve factors are defined to quantify the margins in the assessment. One of these factors is that on Kr defined by:
value which would produce a limiting condition
value being assessedrK r
r
KF
K= (10)
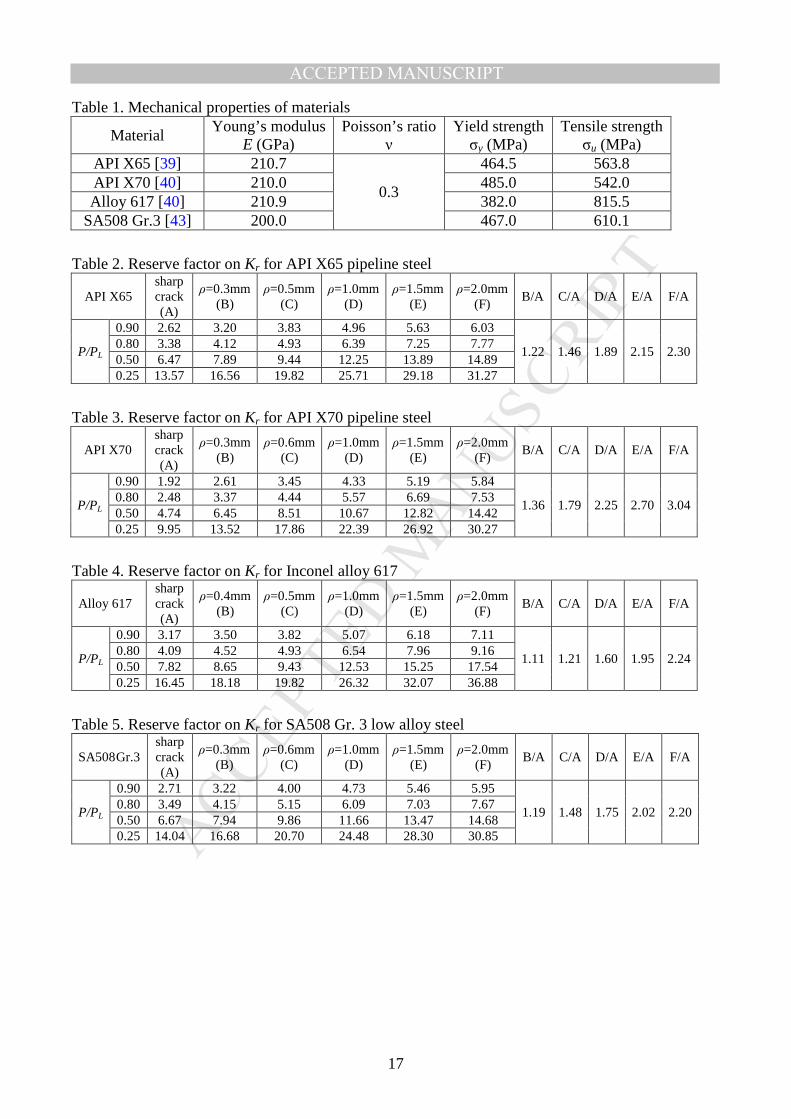
Tables 2 to 5 present the reserve factors calculated for the different materials. Results show that
rKF values decrease with increasing applied load reflecting that the differences between the assessment points and the FAD curve are lower as applied load increases. Also, due to the linear relationship of both Kr and Lr with applied load (P), the ratio of the reserve factor for a blunt notch (B-F) to that for a sharp crack (A) is independent of the load ratio P/PL.
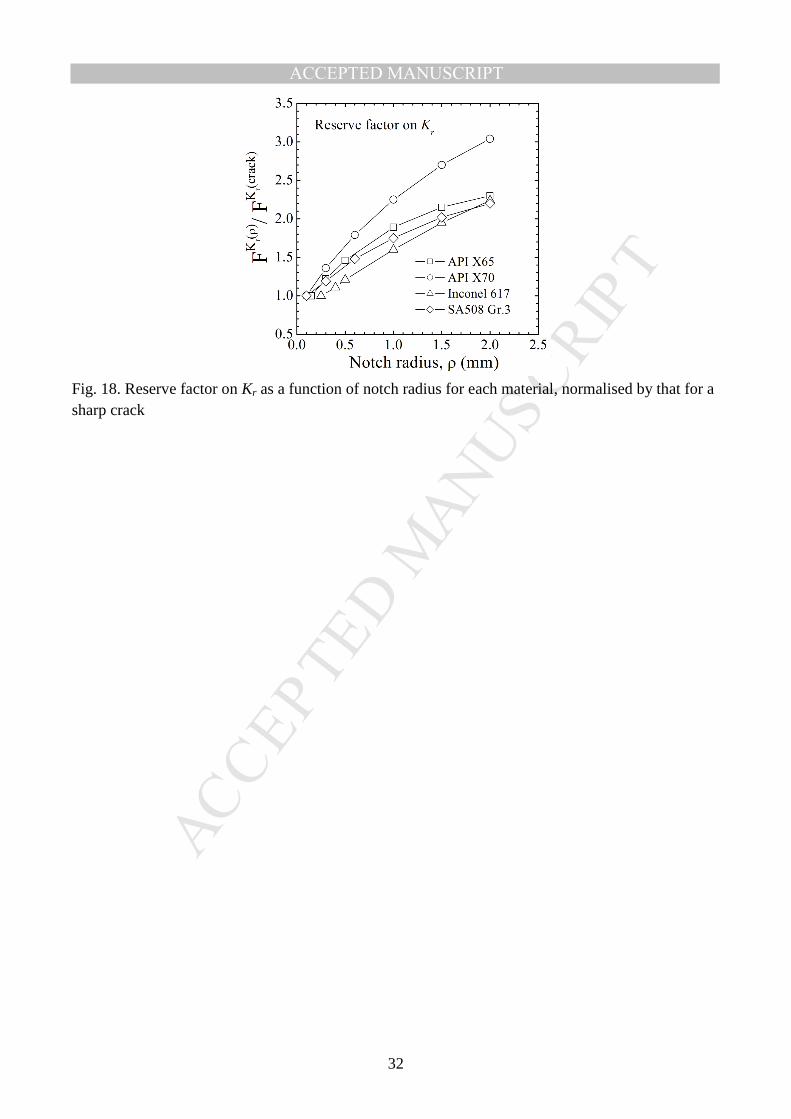
To demonstrate the effect of notch radius, the ratio of reserve factor increase with increasing notch radius (F > E > D > C > B) is shown in Fig. 18. The conservatism in assuming a “sharp-defect” for the FAD assessment can be up to a factor of 3 for API X70 and up to a factor of 2.2~2.3 for other materials in terms of reserve factor on Kr. Interestingly, apart from API X70 material, this ratio seems somewhat independent of material. However, more generally, it has been shown in this analysis that the severity of a defect on the fracture behaviour of a component is both material and geometry dependent. The approach presented here would be useful for reducing the conservatism in defect assessment of real components containing blunt defects.
MANUSCRIP
T
ACCEPTED
ACCEPTED MANUSCRIPT
12
Another widely used factor in FFS assessments is the load factor. This is the factor on load required to put an assessment point on the failure assessment curve. It is apparent from Fig. 17 that all the loci of assessment points for the C(T) specimens would intersect the FAD at the cut-off, independent of notch radius, apart from those for Inconel 617. The limiting loads in these cases are essentially independent of notch radius, apart from the weak dependence of limit load on notch radius noted earlier. This is a consequence of FFS assessments limiting the load carrying capacity to the limit load based on a flow stress. If assessments were allowed to continue to higher loads, then some dependence of load carrying capacity on notch radius would occur, as depicted in Fig. 8. However, as discussed earlier, the dependence of maximum load on notch radius is weak, apart from the results for Inconel 617. This is not surprising as small C(T) specimens generally fail at plastic collapse for ductile materials and testing standards have been developed to obtain meaningful J values for such situations. For large components, where applied loads are generally a modest fraction of the limit load, loci of assessment points are likely to intersect the FAD on the failure assessment curve rather than at the cut-off and an effect of notch radius is more likely. Such an effect is shown by the results for Inconel 617 in Fig. 17c. Here this is for a notch radius greater than 1mm as the corresponding loci in Fig. 17c intersect the FAD on the cut-off rather than on the Option 1 failure assessment curve. Hence, it is possible to identify a notch radius above which plastic collapse, rather than ductile fracture, is the limiting failure condition. Assessments of real engineering components with gouges and notches are often based on plastic collapse only; it is apparent that the approach presented here, as illustrated in Fig. 17c, could be used to provide a basis for defining the shapes of notches for which such an approach is appropriate.
6. CONCLUDING REMARKS
Ductile fracture simulations have been performed for standard C(T) specimens with a wide range of notch radii based on the concept of stress-modified fracture strain. Fracture simulations were made for four different materials: API X65 and X70 pipeline steels, Inconel alloy 617, and SA508 Gr.3 low alloy steel. For the assessment of effective fracture toughness, J-R curves were constructed by using both the domain integral method and the FE load-displacement results with the method of the ASTM testing standard. Elastic J-integral values were also calculated for different applied loads in order to assess the points (Lr, Kr) within the FAD framework. The degree of conservatism was quantified by a reserve factor on Kr, and results showed that the reserve factors could be up to a factor of 3 greater for notched specimens than for specimens with sharp cracks. The ratio of reserve factor for a notched specimen to that for a specimen with a sharp crack converged with increasing notch radius, except for API X70, see Figure 18. It has been shown that the Option 1 FAD developed for sharp cracks is also relevant to blunt notched C(T) specimens and that the approach presented here may be applied with the FAD method to define a notch radius above which analysis may be based simply on plastic collapse, without the need to consider ductile fracture initiation.
The phenomenological ductile fracture model used in this work provides an alternative framework to one- and two-parameter fracture mechanics for constraint analyses and effective
MANUSCRIP
T
ACCEPTED
ACCEPTED MANUSCRIPT
13
fracture toughness assessment. The ductile fracture model only considers a small area ahead of the crack tip (allowing the analysis to become geometry independent) and couples the loading history with phenomenological features of the microstructural fracture mechanism. Thus, the method can be used, in principle, to assess any defective component or structure.
Confidence in the use of the methodology is due to the good agreement of estimated and experimental tensile test results shown in previous work [39,40]. Despite this, the use of this methodology to assess the apparent fracture toughness for non-sharp defects needs to be validated by comparison with experimental J-R curves; such studies are being currently undertaken. In addition, due to the high cost of experimental tests required for the calibration of the failure criterion, there have been attempts [61,62,63] to reduce the number of constants in Eq. (5), for less expensive calibration and more efficient application of the approach.
ACKNOWLEDGEMENT The authors wish to acknowledge useful discussions with Prof. Jae-Hoon Kim of Chungnam National University and Dr. Nak-Hyun Kim of Korea Atomic Energy Research Institute (KAERI). Part-funding for this research has been provided by B.P. through the B.P. International Centre for Advanced Materials. REFERENCES [1] EGIG-group, Gas Pipeline Incidents, 8th Report of the European Pipeline Incident Data Group (document number EGIG 11.R.0402), 2011. [2] Akid R, Rodigues E. Internal Corrosion Assessment of the Otter Oil Production Spool. SPE International Oilfield Corrosion Conference and Exhibition: Society of Petroleum Engineers; 2014. [3] Pluvinage G, Allouti M, Schmitt C, Capelle J. Assessment of a gouge, a dent, or a dent plus a gouge, in a pipe using limit analysis or notch fracture mechanics. Journal of Pipeline Engineering. 2011;10. [4] API 579-1/ASME FFS-1: Fitness-for-service, American Society of Mechanical Engineers, 2007. [5] R6: assessment of the integrity of structures containing defects, Revision 4. British Energy Generation Limited; 2010. [6] BSI. BS 7910: Guide on methods for assessing the acceptability of flaws in metallic structures. British Standards Institute; 2013. [7] Spink G, Worthington P, Heald P. The effect of notch acuity on fracture toughness testing. Materials Science and Engineering. 1973;11:113-7. [8] Milne I, Chell G, Worthington P. The mechanisms of fracture in blunt-notched specimens of a low alloy steel and the effect on failure assessment. Materials Science and Engineering. 1979;40:145-57. [9] Srinivas M, Kamat S, Rao PR. Effect of notch root radius on ductile fracture toughness of Armco Iron. Int J Fract. 1992;58:R15-R21. [10] Horn AJ, Sherry AH. Prediction of cleavage fracture from non-sharp defects using the Weibull stress based toughness scaling model. International Journal of Pressure Vessels and Piping. 2010;87:670-80. [11] Kim JH, Kim DH, Moon SI. Evaluation of static and dynamic fracture toughness using apparent fracture toughness of notched specimen. Materials Science and Engineering: A. 2004;387:381-4. [12] Livieri P. Use of J-integral to predict static failures in sharp V-notches and rounded U-notches. Engineering Fracture Mechanics. 2008;75:1779-93.
MANUSCRIP
T
ACCEPTED
ACCEPTED MANUSCRIPT
14
[13] Yoda M. The effect of the notch root radius on the J-integral fracture toughness under modes I, II and III loadings. Engineering Fracture Mechanics. 1987;26:425-31. [14] Faucher B, Tyson W, Hong Y, Boutin J. Dependence of ductile fracture toughness of a weld metal on notch root radius and inclusion content. Int J Fract. 1990;46:173-84. [15] Kamat S, Srinivas M. Investigation of blunting line and evaluation of fracture toughness under mixed mode I/III loading in commercially pure titanium. Materials science and technology. 2003;19:62-6. [16] Susmel L, Taylor D. On the use of the Theory of Critical Distances to predict static failures in ductile metallic materials containing different geometrical features. Engineering Fracture Mechanics. 2008;75:4410-21. [17] Suo Z, Ho S, Gong X. Notch ductile-to-brittle transition due to localized inelastic band. Journal of engineering materials and technology. 1993;115:319-26. [18] Cicero S, Gutiérrez-Solana F, Horn AJ. Experimental analysis of differences in mechanical behaviour of cracked and notched specimens in a ferritic–pearlitic steel: Considerations about the notch effect on structural integrity. Engineering Failure Analysis. 2009;16:2450-66. [19] Matvienko YG, Morozov E. Calculation of the energy J-integral for bodies with notches and cracks. Int J Fract. 2004;125:249-61. [20] Taylor D, Cornetti P, Pugno N. The fracture mechanics of finite crack extension. Engineering Fracture Mechanics. 2005;72:1021-38. [21] Cicero S, Gutiérrez-Solana F, Álvarez J. Structural integrity assessment of components subjected to low constraint conditions. Engineering Fracture Mechanics. 2008;75:3038-59. [22] Horn A, Sherry A. An engineering assessment methodology for non-sharp defects in steel structures–part I: procedure development. International Journal of Pressure Vessels and Piping. 2012;89:137-50. [23] Horn A, Sherry A. An engineering assessment methodology for non-sharp defects in steel structures–Part II: Procedure validation and constraint analysis. International Journal of Pressure Vessels and Piping. 2012;89:151-61. [24] Pineau A. Development of the local approach to fracture over the past 25 years: theory and applications. Int J Fract. 2006;138:139-66. [25] Ruggieri C, Dodds Jr RH. A transferability model for brittle fracture including constraint and ductile tearing effects: a probabilistic approach. Int J Fract. 1996;79:309-40. [26] Beremin F. Cavity formation from inclusions in ductile fracture of A508 steel. Metallurgical Transactions A. 1981;12:723-31. [27] Gurson AL. Continuum theory of ductile rupture by void nucleation and growth: Part I—Yield criteria and flow rules for porous ductile media. Journal of engineering materials and technology. 1977;99:2-15. [28] Tvergaard V. On localization in ductile materials containing spherical voids. Int J Fract. 1982;18:237-52. [29] Needleman A, Tvergaard V. An analysis of ductile rupture modes at a crack tip. Journal of the Mechanics and Physics of Solids. 1987;35:151-83. [30] Rousselier G. Ductile fracture models and their potential in local approach of fracture. Nuclear Engineering and Design 1987;105:97-111. [31] McClintock FA. A Criterion for Ductile Fracture by the Growth of Holes. Journal of Applied Mechanics. 1968;35:363-71. [32] Rice JR, Tracey DM. On the ductile enlargement of voids in triaxial stress fields. Journal of the Mechanics and Physics of Solids. 1969;17:201-17. [33] Hancock JW, Mackenzie AC. On the mechanisms of ductile failure in high-strength steels subjected to multi-axial stress-states. Journal of the Mechanics and Physics of Solids 1976;24:147-60.
MANUSCRIP
T
ACCEPTED
ACCEPTED MANUSCRIPT
15
[34] Mackenzie AC, Hancock JW, Brown DK. On the influence of state of stress on ductile failure initiation in high strength steels. Engineering Fracture Mechanics 1977;9:167-88. [35] Hancock J, Brown D. On the role of strain and stress state in ductile failure. Journal of the Mechanics and Physics of Solids. 1983;31:1-24. [36] Bao Y, Wierzbicki T. On fracture locus in the equivalent strain and stress triaxiality space. International Journal of Mechanical Sciences. 2004;46:81-98. [37] Bao Y. Dependence of ductile crack formation in tensile tests on stress triaxiality, stress and strain ratios. Engineering fracture mechanics. 2005;72:505-22. [38] Oh C-K, Kim Y-J, Baek J-H, Kim W-S. Development of stress-modified fracture strain for ductile failure of API X65 steel. Int J Fract. 2007;143:119-33. [39] Oh C-S, Kim N-H, Kim Y-J, Baek J-H, Kim Y-P, Kim W-S. A finite element ductile failure simulation method using stress-modified fracture strain model. Engineering Fracture Mechanics. 2011;78:124-37. [40] Kim N-H, Oh C-S, Kim Y-J, Yoon K-B, Ma Y-H. Comparison of fracture strain based ductile failure simulation with experimental results. International Journal of Pressure Vessels and Piping. 2011;88:434-47. [41] Kim N-H, Oh C-S, Kim Y-J. A numerical method to simulate ductile failure of tensile plates with interacting through-wall cracks. Fatigue & Fracture of Engineering Materials & Structures. 2011;34:215-26. [42] Kim J-H, Kim N-H, Kim Y-J, Hasegawa K, Miyazaki K. Ductile fracture simulation of 304 stainless steel pipes with two circumferential surface cracks. Fatigue & Fracture of Engineering Materials & Structures. 2013;36(10):1067-80. [43] Jeon J-Y, Kim N-H, Kim Y-J, Lee S-Y, Kim J-W. Predictions of Mechanical Properties From Small Punch Test Results Using FE Damage Analyses. ASME 2013 Pressure Vessels and Piping Conference: American Society of Mechanical Engineers; 2013. [44] Ainsworth R. The assessment of defects in structures of strain hardening material. Engineering Fracture Mechanics. 1984;19:633-42. [45] Ainsworth R. Consideration of elastic follow-up in the treatment of combined primary and secondary stresses in fracture assessments. Engineering Fracture Mechanics. 2012;96:558-69. [46] ABAQUS Version 6.11, 2011. Analysis User’s Manual. Dassault Systemes Simulia Corp., Providence, RI. [47] Rivalin F, Pineau A, Di Fant M, Besson J. Ductile tearing of pipeline-steel wide plates: I. Dynamic and quasi-static experiments. Engineering Fracture Mechanics 2000;68:329-45. [48] Rivalin F, Besson J, Pineau A, Di Fant M. Ductile tearing of pipeline-steel wide plates: II. Modeling of in-plane crack propagation. Engineering Fracture Mechanics. 2000;68:347-64. [49] ASTM E1820-11e1: Standard test method for measurement for fracture toughness. American Society of Testing and Materials, Philadelphia, 2011. [50] ESIS P2-92: ESIS procedure for determining the fracture behaviour of materials; 1992. [51] Parks D. The virtual crack extension method for nonlinear material behavior. Computer Methods in Applied Mechanics and Engineering. 1977;12:353-64. [52] Shih C, Moran B, Nakamura T. Energy release rate along a three-dimensional crack front in a thermally stressed body. Int J Fract. 1986;30:79-102. [53] Brocks W, Yuan H. Numerical investigations on the significance of J for large stable crack growth. Engineering Fracture Mechanics. 1989;32:459-68. [54] Yuan H, Brocks W. On the J-integral concept for elastic-plastic crack extension. Nuclear Engineering and Design. 1991;131:157-73.
MANUSCRIP
T
ACCEPTED
ACCEPTED MANUSCRIPT
16
[55] Østby E, Thaulow C, Zhang ZL. Numerical simulations of specimen size and mismatch effects in ductile crack growth – Part I: Tearing resistance and crack growth paths. Engineering Fracture Mechanics. 2007;74:1770-92. [56] Brocks W, Anuschewski P, Scheider I. Ductile tearing resistance of metal sheets. Engineering Failure Analysis. 2010;17:607-16. [57] Akourri O, Louah M, Kifani A, Gilgert G, Pluvinage G. The effect of notch radius on fracture toughness JIC. Engineering Fracture Mechanics. 2000;65:491-505. [58] Srinivas M, Kamat S, Rao PR. Effect of notch root radius on ductile fracture toughness of Armco Iron. Int J Fract. 1992;58:R15-R21. [59] Kamaya M. Estimation of elastic–plastic fracture toughness by numerical simulation based on a stress-based criterion for ductile crack initiation. International Journal of Pressure Vessels and Piping. 2014;117:2-8. [60] Rice JR. A path independent integral and the approximate analysis of strain concentration by notches and cracks. Journal of applied mechanics. 1968;35:379-86. [61] Bae K-D, Ryu H-W, Kim Y-J, Kim J-S. Comparison of ductile tearing simulation with complex cracked pipe test data. ASME. Journal of Pressure Vessel Technology. 2016 (in press). doi:10.1115/1.4033771. [62] Ryu H.-W., Bae K.-D., Kim Y.-J., Han J.-J., Kim J.-S. and Budden P. J. Ductile tearing simulation of Battelle pipe test using simplified stress-modified fracture strain concept. Fatigue & Fracture of Engineering Materials & Structures. 2016 (in press). doi: 10.1111/ffe.12456. [63] Nam H.-S., Oh Y.-R., Kim Y.-J., Kim J.-S., Miura N. Application of engineering ductile tearing simulation method to CRIEPI pipe test. Engineering Fracture Mechanic. 2016;153:128-142.
MANUSCRIP
T
ACCEPTED
ACCEPTED MANUSCRIPT
17
Table 1. Mechanical properties of materials
Material Young’s modulus
E (GPa) Poisson’s ratio
ν Yield strength σy (MPa)
Tensile strength σu (MPa)
API X65 [39] 210.7
0.3
464.5 563.8 API X70 [40] 210.0 485.0 542.0 Alloy 617 [40] 210.9 382.0 815.5
SA508 Gr.3 [43] 200.0 467.0 610.1 Table 2. Reserve factor on Kr for API X65 pipeline steel
API X65 sharp crack (A)
ρ=0.3mm (B)
ρ=0.5mm (C)
ρ=1.0mm (D)
ρ=1.5mm (E)
ρ=2.0mm (F)
B/A C/A D/A E/A F/A
P/PL
0.90 2.62 3.20 3.83 4.96 5.63 6.03
1.22 1.46 1.89 2.15 2.30 0.80 3.38 4.12 4.93 6.39 7.25 7.77 0.50 6.47 7.89 9.44 12.25 13.89 14.89 0.25 13.57 16.56 19.82 25.71 29.18 31.27
Table 3. Reserve factor on Kr for API X70 pipeline steel
API X70 sharp crack (A)
ρ=0.3mm (B)
ρ=0.6mm (C)
ρ=1.0mm (D)
ρ=1.5mm (E)
ρ=2.0mm (F)
B/A C/A D/A E/A F/A
P/PL
0.90 1.92 2.61 3.45 4.33 5.19 5.84
1.36 1.79 2.25 2.70 3.04 0.80 2.48 3.37 4.44 5.57 6.69 7.53 0.50 4.74 6.45 8.51 10.67 12.82 14.42 0.25 9.95 13.52 17.86 22.39 26.92 30.27
Table 4. Reserve factor on Kr for Inconel alloy 617
Alloy 617 sharp crack (A)
ρ=0.4mm (B)
ρ=0.5mm (C)
ρ=1.0mm (D)
ρ=1.5mm (E)
ρ=2.0mm (F)
B/A C/A D/A E/A F/A
P/PL
0.90 3.17 3.50 3.82 5.07 6.18 7.11
1.11 1.21 1.60 1.95 2.24 0.80 4.09 4.52 4.93 6.54 7.96 9.16 0.50 7.82 8.65 9.43 12.53 15.25 17.54 0.25 16.45 18.18 19.82 26.32 32.07 36.88
Table 5. Reserve factor on Kr for SA508 Gr. 3 low alloy steel
SA508 Gr.3 sharp crack (A)
ρ=0.3mm (B)
ρ=0.6mm (C)
ρ=1.0mm (D)
ρ=1.5mm (E)
ρ=2.0mm (F)
B/A C/A D/A E/A F/A
P/PL
0.90 2.71 3.22 4.00 4.73 5.46 5.95
1.19 1.48 1.75 2.02 2.20 0.80 3.49 4.15 5.15 6.09 7.03 7.67 0.50 6.67 7.94 9.86 11.66 13.47 14.68 0.25 14.04 16.68 20.70 24.48 28.30 30.85
MANUSCRIP
T
ACCEPTED
ACCEPTED MANUSCRIPT
18
Fig. 1. Failure assessment diagram illustrating safe region bounded by the FAD curve and cut-off.
Fig. 2. Diagram of the stress-modified fracture strain model calibration.
MANUSCRIP
T
ACCEPTED
ACCEPTED MANUSCRIPT
19
Fig. 3. Schematic illustration of simulating ductile failure using stress relaxation
(a) (b)
Fig. 4. Material properties for ductile fracture simulation: (a) true stress-true strain curves and (b) stress-modified fracture strain [39,40,43]
(a) (b)
Fig. 5. Schematic illustration of a standard fracture toughness specimen showing the relevant geometric variables: (a) a compact tension specimen and (b) detailed view of the notch tip
MANUSCRIP
T
ACCEPTED
ACCEPTED MANUSCRIPT
20
(a) (b) (c) Fig. 6. Finite element models for API X65 compact tension specimens with different notch radii: (a) sharp crack, (b) ρ=0.75mm and (c) ρ=2.0mm.
Fig. 7. Typical result for ductile fracture simulation for the compact tension specimens (API X65 C(T) with ρ=0.5mm).
MANUSCRIP
T
ACCEPTED
ACCEPTED MANUSCRIPT
21
(a) (b)
(c) (d)
Fig. 8. Load versus load-line displacement (LLD) results for the 4 materials for a range of notch radii, showing crack initiation loads: (a) API X65, (b) API X70, (c) alloy 617 and (d) SA508 Gr.3.
MANUSCRIP
T
ACCEPTED
ACCEPTED MANUSCRIPT
22
(a)
(b) (c)
Fig. 9. Results for J for API X65 material, illustrating convergence of domain integral values: (a) contours, (b) J-R curves for sharp crack and (c) J-R curves for ρ=2.0mm.
MANUSCRIP
T
ACCEPTED
ACCEPTED MANUSCRIPT
23
(a) (b)
(c) (d)
Fig. 10. J-R curves for the 4 materials for a selection of root radii: (a) API X65, (b) API X70, (c) alloy 617 and (d) SA508 Gr.3.
MANUSCRIP
T
ACCEPTED
ACCEPTED MANUSCRIPT
24
(a) (b)
(c) (d)
Fig. 10. (Cont’d)
MANUSCRIP
T
ACCEPTED
ACCEPTED MANUSCRIPT
25
(a) (b)
(c) (d)
Fig. 11. Determination of effective initiation toughness as a function of notch radius: (a) API X65, (b) API X70, (c) alloy 617 and (d) SA508 Gr.3.
MANUSCRIP
T
ACCEPTED
ACCEPTED MANUSCRIPT
26
(a) (b)
(c) (d)
(e)
Fig. 12. Effective notch initiation toughness as a function of notch radius for each material, normalised by that for a sharp crack: (a) API X65, (b) API X70, (c) alloy 617, (d) SA508 Gr.3 and (e) linear-linear plot for API X65.
MANUSCRIP
T
ACCEPTED
ACCEPTED MANUSCRIPT
27
(a) (b)
(c) (d)
Fig. 13. Elastic J values showing a weak dependence on notch radius: (a) API X65, (b) API X70, (c) alloy 617 and (d) SA508 Gr.3.
MANUSCRIP
T
ACCEPTED
ACCEPTED MANUSCRIPT
28
(a) (b)
(c) (d)
Fig. 14. Elastic J value as a function of notch radius for each material, normalised by that for a sharp crack: (a) API X65, (b) API X70, (c) alloy 617 and (d) SA508 Gr.3.
MANUSCRIP
T
ACCEPTED
ACCEPTED MANUSCRIPT
29
(a) (b)
(c) (d)
Fig. 15. Ratio of elastic J value to effective notch initiation toughness as a function of notch radius for each material, for a range of load levels: (a) API X65, (b) API X70, (c) alloy 617 and (d) SA508 Gr.3.
MANUSCRIP
T
ACCEPTED
ACCEPTED MANUSCRIPT
30
(a) (b)
(c) (d)
Fig. 16. Weak dependence of Option 3 FAD curves in R6 on notch radius for C(T) specimens: (a) API X65, (b) API X70, (c) alloy 617 and (d) SA508 Gr.3.
MANUSCRIP
T
ACCEPTED
ACCEPTED MANUSCRIPT
31
(a) (b)
(c) (d)
Fig. 17. Loci of assessment points with increasing load, for a range of notch radius: (a) API X65, (b) API X70, (c) alloy 617 and (d) SA508 Gr.3.
MANUSCRIP
T
ACCEPTED
ACCEPTED MANUSCRIPT
32
Fig. 18. Reserve factor on Kr as a function of notch radius for each material, normalised by that for a sharp crack

MANUSCRIP
T
ACCEPTED
ACCEPTED MANUSCRIPT
Highlights:
• Ductile fracture simulations have been performed for standard C(T)
specimens with a wide range of notch radii based on the concept of stress-
modified fracture strain.
• J-R curves were constructed by using both the domain integral method and
the FE load-displacement results with the method of the ASTM testing
standard.
• Results showed that the reserve factors could be up to a factor of 3 greater
for notched specimens than for specimens with sharp cracks.
• The ductile fracture model only considers a small area ahead of the crack tip
(allowing the analysis to become geometry independent) can be used, in
principle, to assess any defective component or structure.
• The method show to be an alternative framework to one- and two-parameter fracture mechanics for constraint analyses and effective fracture toughness assessment.