Embed Size (px)
Citation preview

District: Bankura Project: Bankura/IWMP—14/2011-12 Watershed Name: Chhendapathar
West Bengal State Watershed Development Agency (WBSWDA)
WEST BENGAL
INTEGRATED WATERSHED MANAGEMENT PROGRAMME BLOCK—RANIBANDH, DISTRICT—BANKURA
DETAILED PROJECT REPORT

Detailed Project Report Integrated Watershed Management
Programme
District: Bankura Project: Bankura/IWMP-14/2011-12
Watershed Name: Chhendapathar
Project Implementing Agency
FORUM OF SCIENTISTS, ENGINEERS AND TECHNOLOGISTS
(FOSET) 15N, Nelli Sengupta Sarani, New CMC Building, 5th Floor, Kolkata – 700 087
Telephone No. (033)2252 9675, E-mail: [email protected], Website: www.fosetonline.org
Watershed Cell cum Data Centre District Rural Development Cell
Bankura Zilla Parishad, Bankura
Chandmaridanga, Dak Bungalow Campus Post & District – Bankura
Pin – 722 101 Telephone No. 03242-251088/089, Telefax: 03242-257483 E-mail: [email protected]/[email protected]
October, 2014

INTEGRATED WATERSHED MANAGEMENT PROGRAMME CHHENDAPATHAR
BLOCK – RANIBANDH, DISTRICT – BANKURA
IWMP – 14 /2011-12
THE PROJECT AT A GLANCE
Project Implementing Agency (PIA):
FORUM OF SCIENTISTS, ENGINEERS AND TECHNOLOGISTS (FOSET)
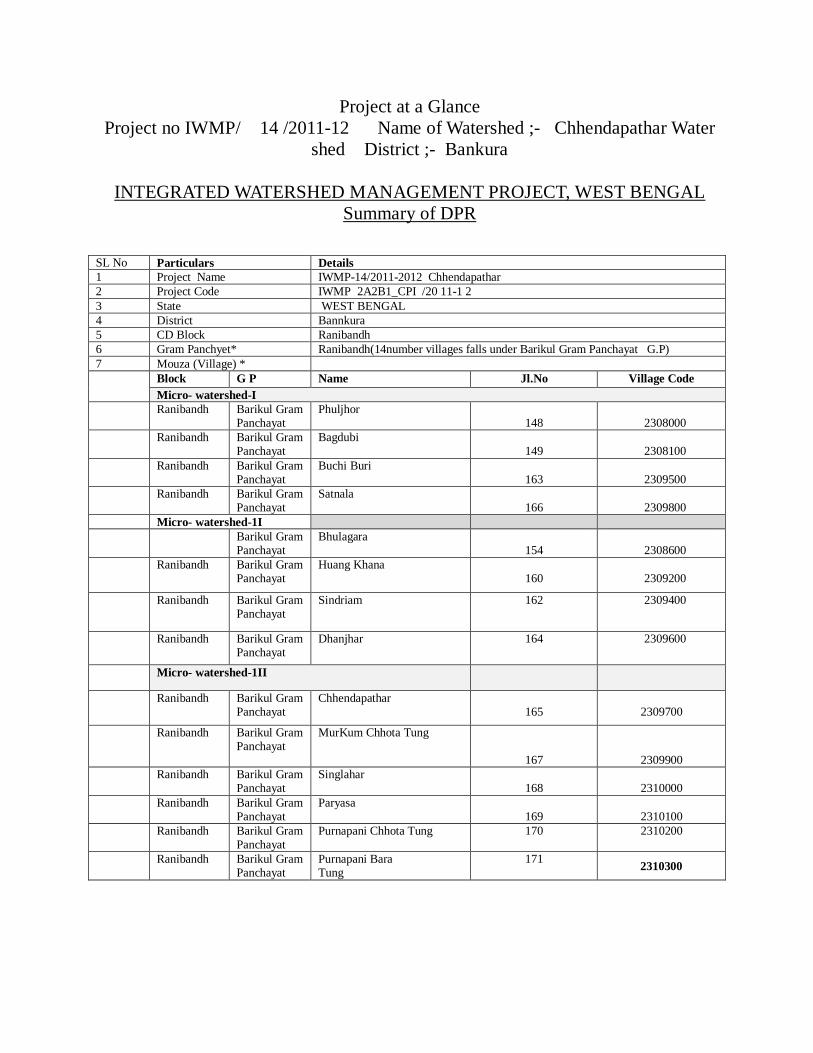
Project at a Glance Project no IWMP/ 14 /2011-12 Name of Watershed ;- Chhendapathar Water
shed District ;- Bankura
INTEGRATED WATERSHED MANAGEMENT PROJECT, WEST BENGAL Summary of DPR
SL No Particulars Details 1 Project Name IWMP-14/2011-2012 Chhendapathar 2 Project Code IWMP 2A2B1_CPI /20 11-1 2 3 State WEST BENGAL 4 District Bannkura 5 CD Block Ranibandh 6 Gram Panchyet* Ranibandh(14number villages falls under Barikul Gram Panchayat G.P) 7 Mouza (Village) * Block G P Name Jl.No Village Code
Micro- watershed-I Ranibandh Barikul Gram
Panchayat Phuljhor
148
2308000 Ranibandh Barikul Gram
Panchayat Bagdubi
149
2308100 Ranibandh Barikul Gram
Panchayat Buchi Buri
163
2309500 Ranibandh Barikul Gram
Panchayat Satnala
166
2309800 Micro- watershed-1I Barikul Gram
Panchayat Bhulagara
154
2308600 Ranibandh Barikul Gram
Panchayat Huang Khana
160
2309200
Ranibandh Barikul Gram Panchayat
Sindriam 162 2309400
Ranibandh Barikul Gram Panchayat
Dhanjhar 164 2309600
Micro- watershed-1II
Ranibandh Barikul Gram Panchayat
Chhendapathar 165
2309700
Ranibandh Barikul Gram Panchayat
MurKum Chhota Tung
167
2309900 Ranibandh Barikul Gram
Panchayat Singlahar
168
2310000 Ranibandh Barikul Gram
Panchayat Paryasa
169
2310100 Ranibandh Barikul Gram
Panchayat Purnapani Chhota Tung 170 2310200
Ranibandh Barikul Gram Panchayat
Purnapani Bara Tung
171 2310300
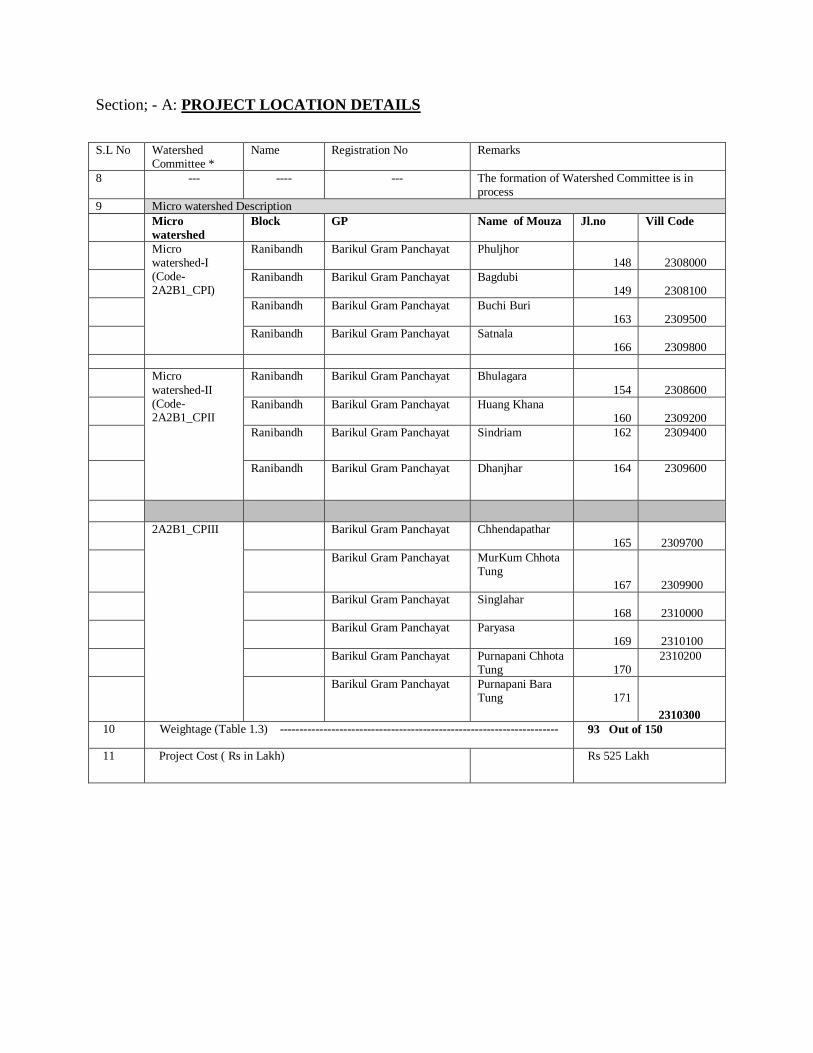
Section; - A: PROJECT LOCATION DETAILS
S.L No Watershed Committee *
Name Registration No Remarks
8 --- ---- --- The formation of Watershed Committee is in process
9 Micro watershed Description Micro
watershed Block GP Name of Mouza Jl.no Vill Code
Micro watershed-I (Code-2A2B1_CPI)
Ranibandh Barikul Gram Panchayat Phuljhor 148
2308000
Ranibandh Barikul Gram Panchayat Bagdubi 149
2308100
Ranibandh Barikul Gram Panchayat Buchi Buri 163
2309500
Ranibandh Barikul Gram Panchayat Satnala 166
2309800
Micro
watershed-II (Code-2A2B1_CPII
Ranibandh Barikul Gram Panchayat Bhulagara 154
2308600
Ranibandh Barikul Gram Panchayat Huang Khana 160
2309200
Ranibandh Barikul Gram Panchayat Sindriam 162 2309400
Ranibandh Barikul Gram Panchayat Dhanjhar 164 2309600
2A2B1_CPIII Barikul Gram Panchayat Chhendapathar 165
2309700
Barikul Gram Panchayat MurKum Chhota Tung
167
2309900 Barikul Gram Panchayat Singlahar
168
2310000 Barikul Gram Panchayat Paryasa
169
2310100 Barikul Gram Panchayat Purnapani Chhota
Tung
170 2310200
Barikul Gram Panchayat Purnapani Bara Tung
171
2310300 10 Weightage (Table 1.3) ---------------------------------------------------------------------- 93 Out of 150
11 Project Cost ( Rs in Lakh) Rs 525 Lakh

SECTION B SOCIO ECONOMIC PROFILE OF THE PROJECT AREA Sl. No Particulars Ref Table No. DPR
(Format) Details
1 Name of Project Implementing Agency (PIA)
Table No 4.1 FOSET is a national level voluntary organization of professionals engaged in rural developmental work through application of cost-effective technologies. More details has been described in chapter IV.
2 Nature of PIA (a) VO b) Pancheyat c) Others
Table No 4.1 Others
3 Total Population in the Watershed 3.12 Total population is 7858 in numbers 4 Total Number of households 3.12.1 Total number of households are 1597 in
numbers 5 Total Number of ST households
( Tot. Po. / Tot. Family.* ST Po.) 3.12 Total number of S.T households are 1125 in
numbers 6 Total Number of SC households
( Tot. Family/ Tot. Po.* SC Po.) 3.12 Total number of S.C households are 44 in
numbers 7 Total Number of BPL households 3.12.1 Total number of BPL population are 1327in
numbers 8 Total Number of Small Farmer
household 2 (appox) ( Computed from Agri Census 2005-06 and table 3.14)
3.14 Total number of Small Farmer population are 145 in numbers
9
Total number of Marginal farmer household3 (appox) ( Computed from Agri Census 2005-06 and table 3.14)
3.14
Total number of Marginal Farmer are 1163 n numbers
10 Total number of landless and asset less households (BPL + Landless families)
As per tale of 3.12.1 & table no 3.14
Total number of landless and asset less households are 275 in numbers
11 Number of person days of seasonal migration
As per tale of 3.22 Number of persons are migrating are 686 in numbers for 120days in a year.

Section C Other Detail from Base line Survey
Sl.No Description Ref Table No. DPR (Format)
Particulars
1 Total geographical area (ha) Executive Summary 4951ha 2 Treatable area 1) a) Waste land fit for cultivation
(ha) (excluding area in 1c) Executive Summary 65ha
1) b) Waste land unfit for cultivation (ha) (excluding area in 1c)
NIL
1) c)Forest area available for treatment (Fringe Forest area and Degraded forest area)
Annexture-1 956 ha
Total Wasteland (1a) +1b)+1c) 1021 ha 2) Rain fed agriculture land (ha) Executive Summary 1977ha 3)Total Treatable Area (ha)
{1+2}1 Annexture-1 2998 ha
4)Forest Rea in the Watershed Executive Summary 2292 ha
3 Total cropped area (ha) 2 Table 3.9 2755ha
4 Net sown area (ha) 3 Table No 3.6, 3.8 & Table 3.9
2138.60 ha
5 Average Cropping Intensity {3/4 *100}
Table 3.8 129
6 Total No. of water storage structure4
Table 3.3 Total number of water extracting is 40nos. As annexed in annexture-2
7 Total storage capacity of water storage structure (cum) (Considering, farm pond- 50m x40mx 2m avg. Depth x no of ponds and WHS – 10mx5mx 2m avg x no. Of WHS)
Table 3.3 352314.114cu-meter. As annexed in annexture-2.
8 Total number of water extracting units 5
Table 3.5 Total number of water extracting is 32nos.
9 Depth of ground water (bgl) in m Table 3.3 a) Pre monsoon 0.3m
b) Post monsoon 2m

Section D Year wise Action plan (Physical) Sl.no Particulars Ref table of
DPR Format 2014-15 2015-16 2016-17 2017-18 2018-19 Total
1 Watershed Development works (Non- arable)
1.1 Land Development
1.1.1 A forestation (on wasteland) (ha) (Plantation and nursery)
Table 5.3 Non- arable
00 00 00 00 00 00
1.1.2 A forestation (on other land) ha
Table 5.3 Non- arable
2.5 3.5 1 1 00 8.0
1.1.3 Horticulture (on waste land) (ha)
Table 5.3 Non- arable
6.00 6.00 12.00 10.00 9.00 43.00
1.1.4 Horticulture (on other land) (ha)
Table 5.3 Non- arable
0 0 0 0 0 0
1.1.5 Agriculture (on waste land) (ha)
Table 5.3 Non- arable
00 00 00 00 00 00
1.1.6 Agriculture (on other land) (ha)
Table 5.3 Non- arable
00 00 00 00 00 00
1.1.7 Pasture Dev ( on waste land) (ha)
Table 5.3 Non- arable
5 5 3 10 00 23
1.1.8 Pasture dev (on other land)
Table 5.3 Non- arable
00 00 00 00 00 00
1.2 Soil and moisture conservation
Table 5.3 Non- arable
1.2.1 Staggered Tranching (ha)
Table 5.3 Non- arable
00 00 00 00 00 00
1.2.2 Contour Bunding (ha)
Table 5.3 Non- arable
00 00 00 00 00 00
1.2.3 Graded Bunding (ha)
Table 5.3 Non- arable
00 00 00 00 00 00
1.2.4 Bench terracing (ha)
Table 5.3 Non- arable
00 00 00 00 00 00
1.2.5 Others
1.2.6 a)Land Shaping & Periphery banding
Table 5.3 Non- arable
12.35
22.6847 22.8689 15.9584 5.45 79.312
1.2.7
Re-habilitation of degraded forest land
Table 5.3 Non- arable
300 300 300 300 257 1457
1.2.8 Gap filling and post plantation care over 8 ha
Table 5.3 Non- arable
00 2.5 3.5 1 1 8
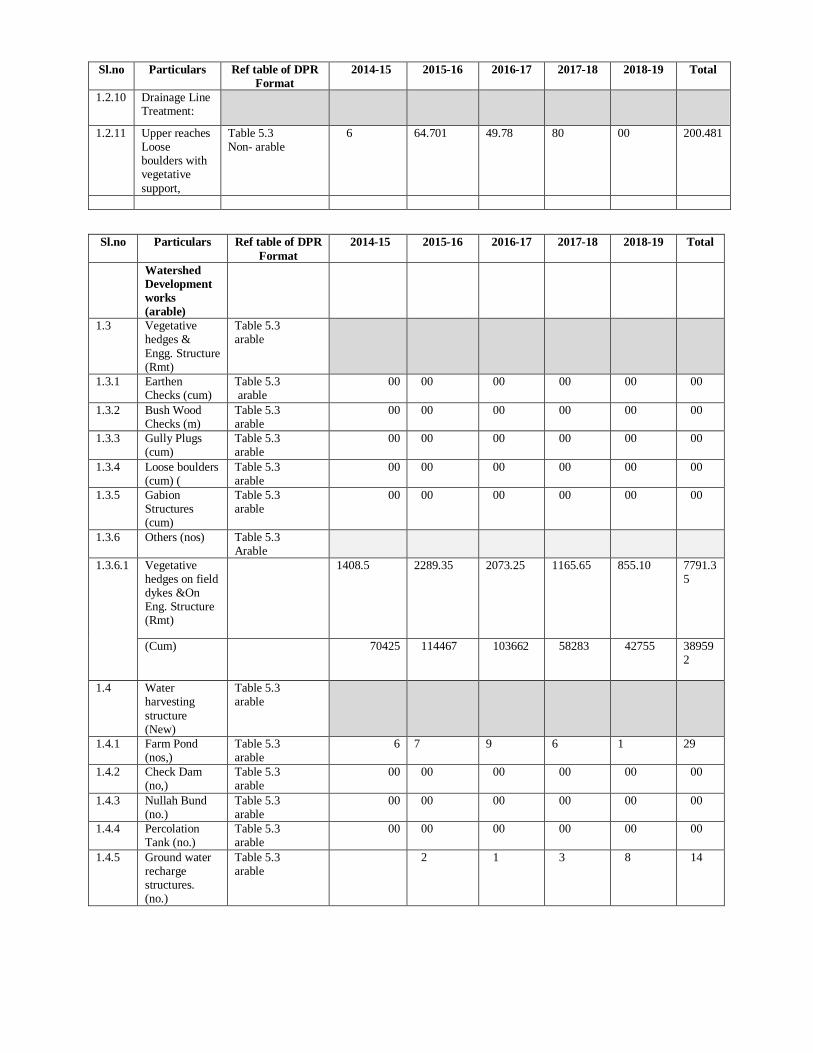
Sl.no Particulars Ref table of DPR Format
2014-15 2015-16 2016-17 2017-18 2018-19 Total
Watershed Development works (arable)
1.3 Vegetative hedges & Engg. Structure (Rmt)
Table 5.3 arable
1.3.1 Earthen Checks (cum)
Table 5.3 arable
00 00 00 00 00 00
1.3.2 Bush Wood Checks (m)
Table 5.3 arable
00 00 00 00 00 00
1.3.3 Gully Plugs (cum)
Table 5.3 arable
00 00 00 00 00 00
1.3.4 Loose boulders (cum) (
Table 5.3 arable
00 00 00 00 00 00
1.3.5 Gabion Structures (cum)
Table 5.3 arable
00 00 00 00 00 00
1.3.6 Others (nos) Table 5.3 Arable
1.3.6.1
Vegetative hedges on field dykes &On Eng. Structure (Rmt)
1408.5
2289.35
2073.25
1165.65 855.10
7791.35
(Cum) 70425 114467 103662 58283 42755 389592
1.4 Water
harvesting structure (New)
Table 5.3 arable
1.4.1 Farm Pond (nos,)
Table 5.3 arable
6 7 9 6 1 29
1.4.2 Check Dam (no,)
Table 5.3 arable
00 00 00 00 00 00
1.4.3 Nullah Bund (no.)
Table 5.3 arable
00 00 00 00 00 00
1.4.4 Percolation Tank (no.)
Table 5.3 arable
00 00 00 00 00 00
1.4.5 Ground water recharge structures. (no.)
Table 5.3 arable
2 1 3 8 14
Sl.no Particulars Ref table of DPR Format
2014-15 2015-16 2016-17 2017-18 2018-19 Total
1.2.10
Drainage Line Treatment:
1.2.11 Upper reaches Loose boulders with vegetative support,
Table 5.3 Non- arable
6 64.701 49.78 80
00 200.481

Sl.no Particulars Ref table of DPR Format
2014-15 2015-16 2016-17 2017-18 2018-19 Total
1.4.5 Others(no.) Table 5.3 arable
1.4.5.1 Dams Table 5.3 arable
00 00 00 00 4 4
1.4.5.2 Irrigation Channel
Table 5.3 arable
2 1 7 10
1.5 Water harvesting structure (renovated)
1.5.1 Farm Pond (nos,) Table 5.3 arable
14 13 10 7 7 51
(cum) Table 5.3 arable
00 00 00 00 00 00
1.5.2 Check Bund (no,) Table 5.3 arable
00 00 00 00 00 00
(cum) Table 5.3 arable
00 00 00 00 00 00
1.5.3 Nullah Bund (no.)
Table 5.3 arable
00 00 00 00 00 00
(cum) Table 5.3 arable
00 00 00 00 00 00
1.5.4 Percolation Tank (no.)
Table 5.3 arable
00 00 00 00 00 00
(cum) Table 5.3 arable
00 00 00 00 00 00
1.5.5 Ground water recharge structures. (no.)
Table 5.3 arable
00 00 00 00 00 00
(cum) Table 5.3 arable
00 00 00 00 00 00
1.5.6 Others Table 5.3 arable
00 00 00 00 00 00
(cum) Table 5.3 arable
00 00 00 00 00 00

2 Entry Point Activities Sl.no Particulars Location Ref table of
DPR Format 2013-2014 2014-2015
2.0 Entry Point Activities 2.1.1 Culvert/ causeway on village road as
per schedule of item & drawing , & ect
Puljhar -148
Table 5.2
Executed
0
2.1.2 Culvert/ causeway on village road as per schedule of item & drawing , & ect
Purnapani bara Tung-171
Table 5.2
Executed 0
2.1.3 Culvert/ causeway on village road as per scheduleof item & drawing , & ect
Buchiburi -163
Table 5.2
Executed 0
2.1.4 Construction of one causeway on Huangkhana Village Road Huang Khana -160 Table 5.2
Executed 0
2.1.5 Construction of one box culvert on Satnala - Murkum Road
Satnala -166
Table 5.2
Executed 0
2.1.6 Erection & commission of iron & Bacteria free community Drinking water supply pants
Bhulagara -154 Table 5.2
Executed 0
2.1.7 High-low benches for Primary school children
Puljhar -148 Table 5.2
Executed 0
2.1.8 High-low benches for Primary school children
Chandapathar -165 Table 5.2
Executed 0
2.1.9 High-low benches for Primary school children
Purnapani Chatatung -170
Table 5.2
Executed 0
2.1.10 High-low benches for Primary school children
Satnala -166
Table 5.2
Executed 0
2.1.11 High-low benches for Primary school children
Bagdubi-149 Table 5.2
Executed 0
2.1.12 Erection & commission of iron & Bacteria free community Drinking water supply pants
Singlolar -168 Table 5.2
Executed 0
2.1.13 Culvert/ causeway on village road as per scheduleof item & drawing , & ect
Paryasa -169
Table 5.2
0 To be executed
2.1.14 Culvert/ causeway on village road as per scheduleof item & drawing , & ect
Bagdubi-149
Table 5.2
0 To be executed
2.1.15 High-low benches for Primary school children
Dhanjhar-164 Table 5.2
0 To be executed
2.1.16 High-low benches for Primary school children
Sindriam Table 5.2
0 To be executed
2.1.17 High-low benches for Primary school children
Murkum-Chhota Tung-167
Table 5.2
0 To be executed
2.1.18 High-low benches for Primary school children
Purnapani bara Tung-171
Bhulagara -154
0 To be executed

3.0 Institution & capacity Building
Sl. No
Item of works Unite Phasing of Institution & capacity Building
Remarks
Preparatory phase Work Phase Consolidati
on Phase Total
2013-2014 2014-2015 2015-2016 2016-2017 2017-2018 2018-2019 3.1 SGH
Formation (Newly created)
nos 7 00 00 00 00 00 7
Regarding the formation of New SHGs please see article no 3.17.1 & 5.6.11(lively hood activities
Will be created nos 0 0 0 0 3 38 41
3.2 Existing SGH nos 73 00 00 00 00 00 73 As per table no 3.17
3.2.1 No. of SHGs to be assisted
nos 00 13 25 25 13 38 114 Under IWMP 102 Number will be assisted. All as per table 5.6.12, 3.17 &3.17.1
3.2.2 Total No, of SHG members
nos 00 161 314 277 156 530 1438 As per 3.17 &3.17.1
3.3 User group formation
Till this date 16nos has been formed. with 163 nos of members
3.3.1 Total No. of User Groups (Proposed)
16 12 5 5 5 2 45 It is estimated that 45 Numbers of homogeneous User groups will be formed & each User groups will comprise of 28 members in each group.
3.3.2 Total No. of Members of User Groups
163 957 140 140 140 57 1597 There are 1597nos of house hold & short fall of 285 nos in 2013-2014 will be adjusted in 2014-2015) against the same. User group.
3.4 Formation of Federation
Federation not yet been formed
3.4.1 No. of Federation
00 3 6 6 3 14 32 Proposed
3.4.2 Total number of members of federation
00 15 30 30 15 70 160 As per article 5.6.8 Funding for Major Livelihood activities

Capacity building training
Sl. No
Item of works unit Phasing of Training Remarks Preparatory phase Work Phase Consolid
ation Phase
Total
2013-2014 2014-2015 2015-2016 2016-2017 2017-20182018-2019 3.5 Level of trg 3.5.1 S.L.N.A Level
No of training 00 1 1 1 1 1 5 Proposed No. of Persons to be trained
1 1 1 1 1 5
3.5.2 District level(as directed
No of training 00 4 1 1 1 1 8 ( Only WDT MEMBERS) No. of Persons to be
trained 00 4 1 1 1 1 4
3.5.3 PIAs' Level
No Awareness Generation camp On IWMP
4
00 00 00 00 00 4nos
a)No. of Persons to be trained
1597 00 00 00 00 00 1597 Total House hoid
b) camp on self analysis on progress & quality of IWMP works in different micro water shed
00 00 1 1 1 00 3
No. of Persons to be participated
00 00 533 532 532 00 1597 Total House hoid
3.5.4 WDT Level
No. of Batches 00 1 1 1 1 00 4 No. of Persons to be trained
00 2 2 2 2 00 4
3.5.5 W.C Level
Details has been discussed in article 6.3
No. of Batches 00 2 1 1 1 1 6 4 nos from each moujas No. of Persons to be
trained 00 56 56 56 56 56 56
3.5.6 SHGs level
No. of Batches 00 28 5 5 5 2 45 DO No. of Persons to be trained
00 1008 140 140 140 10 1438
3.5.7 U.Gs Level
DO
No. of Batches 00 28
5 5 5 2 45 Total house hold of the watershed No. of Persons to be
trained 00 1120 140 140 140 57 1597

4) Livelihood Activities for asset less people
Sl. No
Item of works Phasing of Livelihood Activities Total 2014-2015 2015-2016 2016-2017 2017-2018 2018-2019
No. of Activities 4.1 RF to be released to
SHG/ SHGs @ Rs 25,000/- as seed money which will be transferred through WC
13 25 25 13 38 114
4.2 No. of Beneficiaries 161 314 277 156 530 1438
4.3 Livelihoods Promotional Grant per enterprising individuals as seed money which will be transferred through WC
1 3 3 1 5 13
4.4 No. of Beneficiaries 1 3 3 1 5 13 4.5 RF to be released as a
grant -in -aid for
enterprising SHGs/
SHG federations to
undertake major
livelihood activities).
3 6 6 3 9 28
4.6 No. of Beneficiaries 3 6 6 3 9 28
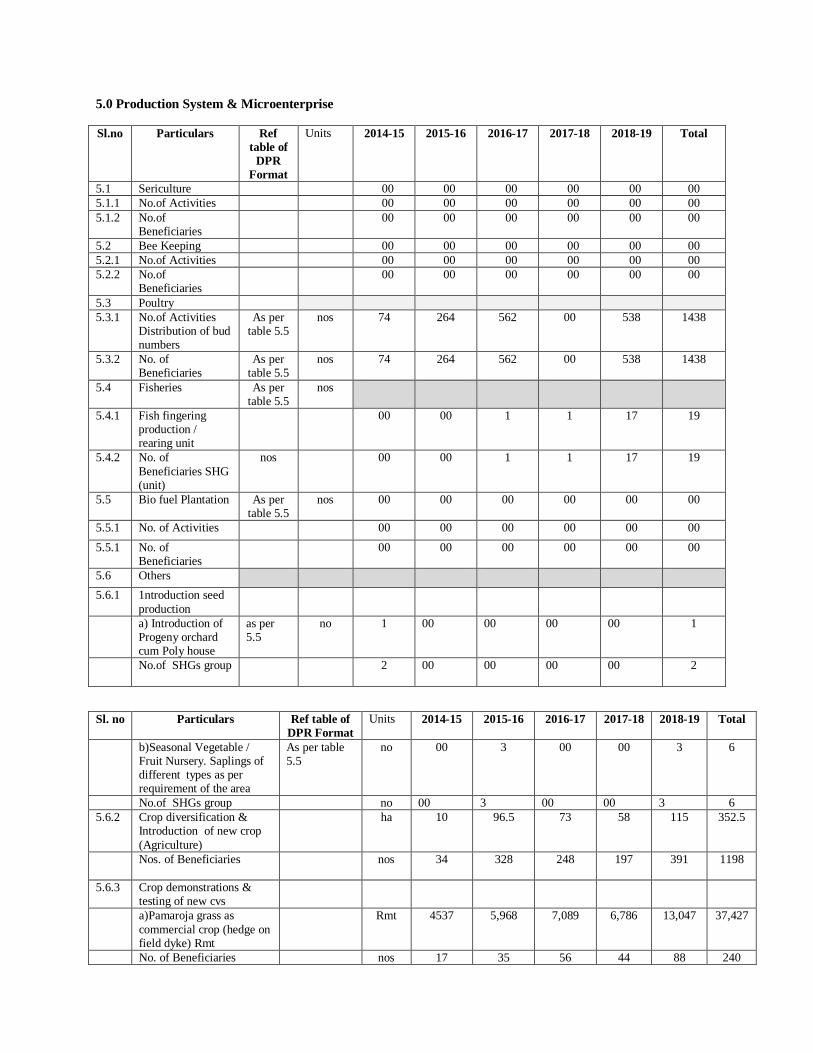
5.0 Production System & Microenterprise
Sl.no Particulars Ref table of
DPR Format
Units 2014-15 2015-16 2016-17 2017-18 2018-19 Total
5.1 Sericulture 00 00 00 00 00 00 5.1.1 No.of Activities 00 00 00 00 00 00 5.1.2 No.of
Beneficiaries 00 00 00 00 00 00
5.2 Bee Keeping 00 00 00 00 00 00 5.2.1 No.of Activities 00 00 00 00 00 00 5.2.2 No.of
Beneficiaries 00 00 00 00 00 00
5.3 Poultry 5.3.1 No.of Activities
Distribution of bud numbers
As per table 5.5
nos 74 264 562 00 538 1438
5.3.2 No. of Beneficiaries
As per table 5.5
nos 74 264 562 00 538 1438
5.4 Fisheries As per table 5.5
nos
5.4.1 Fish fingering production / rearing unit
00 00 1 1 17 19
5.4.2 No. of Beneficiaries SHG (unit)
nos 00 00 1 1 17 19
5.5 Bio fuel Plantation As per table 5.5
nos 00 00 00 00 00 00
5.5.1 No. of Activities 00 00 00 00 00 00 5.5.1 No. of
Beneficiaries 00 00 00 00 00 00
5.6 Others 5.6.1 1ntroduction seed
production
a) Introduction of Progeny orchard cum Poly house
as per 5.5
no 1 00 00 00 00 1
No.of SHGs group 2 00 00 00 00 2
Sl. no Particulars Ref table of DPR Format
Units 2014-15 2015-16 2016-17 2017-18 2018-19 Total
b)Seasonal Vegetable / Fruit Nursery. Saplings of different types as per requirement of the area
As per table 5.5
no 00 3
00 00 3
6
No.of SHGs group no 00 3 00 00 3 6 5.6.2 Crop diversification &
Introduction of new crop (Agriculture)
ha 10
96.5
73
58
115
352.5
Nos. of Beneficiaries nos 34
328 248 197 391 1198
5.6.3 Crop demonstrations & testing of new cvs
a)Pamaroja grass as commercial crop (hedge on field dyke) Rmt
Rmt 4537
5,968
7,089
6,786
13,047
37,427
No. of Beneficiaries nos 17 35 56 44 88 240

b) Demo on Susbania acculiata (Dhaincha) as green manuring crop in rice fields
ha 00 00 16
12
20
48
No. of Beneficiaries nos 00 00 32 24 40 96 5.6.4 Adoption of new
technology
a)System of rice intensification (SRI) in ha
21
48
84
16
169
No. of Beneficiaries nos 00 42 96 168 32 338 b)System of Maize
intensification 6
10
12
4
32
No. of Beneficiaries nos 00 13 20 26 13 72
Sl.no Particulars Ref table of
DPR Format
Units 2014-15 2015-16 2016-17 2017-18 2018-19 Total
c) Providing critical inputs for systematic Rice Intensification to the limited Farmers
nos 51
37
18
13
119
No. of Beneficiaries
51
37
18
13
119
5.6.5 Integrated farming system
As per table 5.5
a) Land based integration through multi storied production system with incorporation of small animals(Chicks, Ducks)
8
3
2
4
00 17
b)Pond based integration with Fruit + Vegetable + duck + fish
nos 10
5
4
3
22
No. of Beneficiaries in groups or 2 to 3 number of SHG
nos 36 16 12 14 00 78
5.6.6 Livestock management related services:
As per table 5.5
a)Organization of quarterly animal vaccination camp in numbers
Nos 24
40
42
47
29
182
No. of Beneficiaries
Each house hold will be the Beneficiaries of this activities 1597
Pureline selection & dev. Of local goat through replacement
Nos 16
16
14
00 14
60
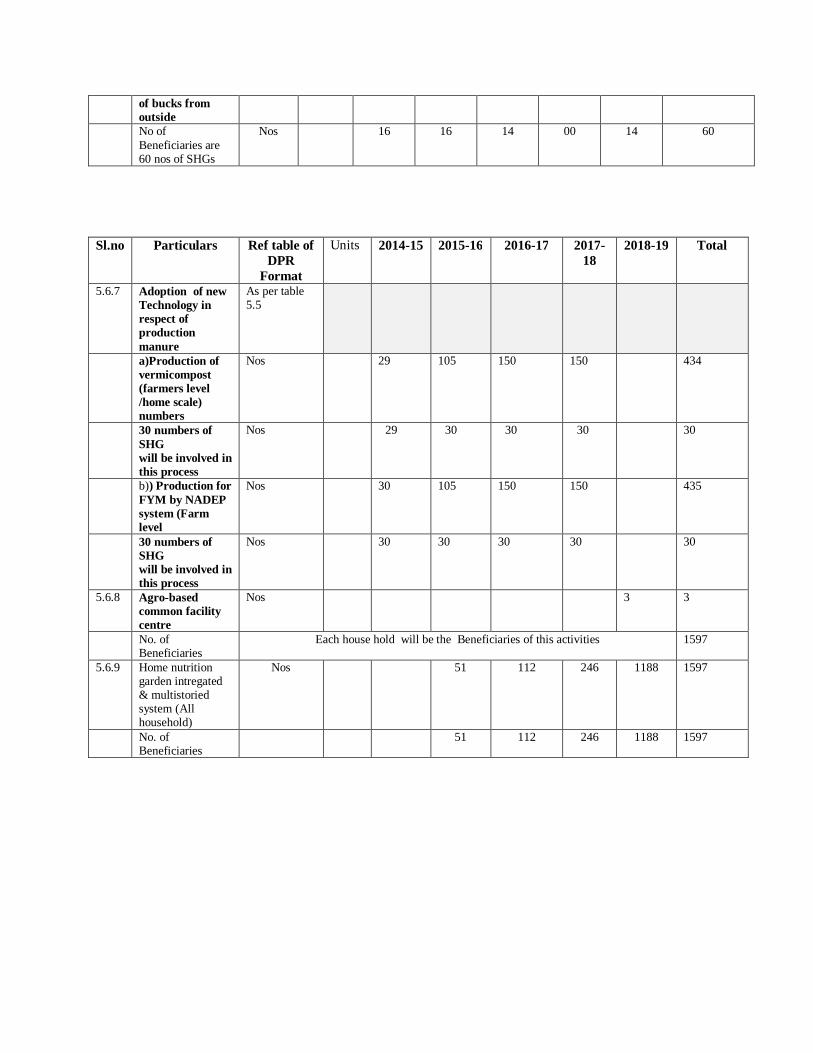
of bucks from outside
No of Beneficiaries are 60 nos of SHGs
Nos 16
16
14
00 14
60
Sl.no Particulars Ref table of DPR
Format
Units 2014-15 2015-16 2016-17 2017-18
2018-19 Total
5.6.7 Adoption of new Technology in respect of production manure
As per table 5.5
a)Production of vermicompost (farmers level /home scale) numbers
Nos 29
105
150
150
434
30 numbers of SHG will be involved in this process
Nos 29 30 30 30 30
b)) Production for FYM by NADEP system (Farm level
Nos 30
105
150
150
435
30 numbers of SHG will be involved in this process
Nos 30 30 30 30 30
5.6.8 Agro-based common facility centre
Nos 3
3
No. of Beneficiaries
Each house hold will be the Beneficiaries of this activities 1597
5.6.9 Home nutrition garden intregated & multistoried system (All household)
Nos 51
112
246
1188
1597
No. of Beneficiaries
51
112
246
1188
1597
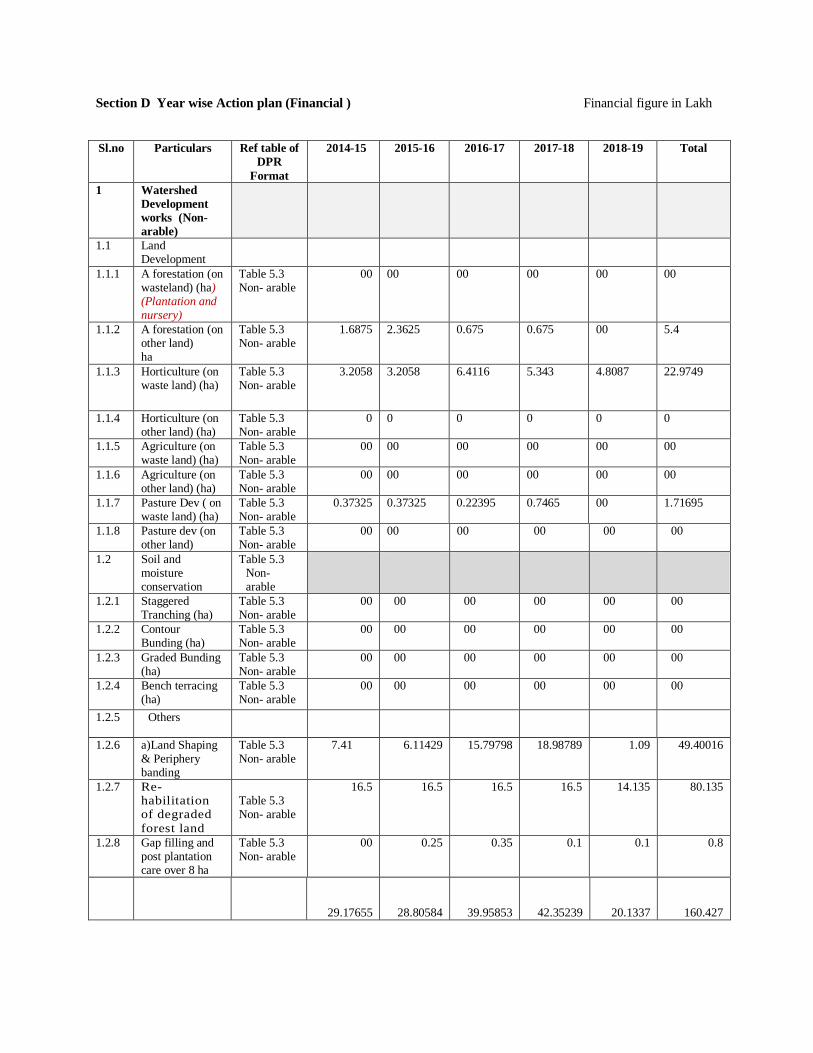
Section D Year wise Action plan (Financial ) Financial figure in Lakh
Sl.no Particulars Ref table of DPR
Format
2014-15 2015-16 2016-17 2017-18 2018-19 Total
1 Watershed Development works (Non- arable)
1.1 Land Development
1.1.1 A forestation (on wasteland) (ha) (Plantation and nursery)
Table 5.3 Non- arable
00 00 00 00 00 00
1.1.2 A forestation (on other land) ha
Table 5.3 Non- arable
1.6875 2.3625 0.675 0.675 00 5.4
1.1.3 Horticulture (on waste land) (ha)
Table 5.3 Non- arable
3.2058 3.2058 6.4116 5.343 4.8087 22.9749
1.1.4 Horticulture (on other land) (ha)
Table 5.3 Non- arable
0 0 0 0 0 0
1.1.5 Agriculture (on waste land) (ha)
Table 5.3 Non- arable
00 00 00 00 00 00
1.1.6 Agriculture (on other land) (ha)
Table 5.3 Non- arable
00 00 00 00 00 00
1.1.7 Pasture Dev ( on waste land) (ha)
Table 5.3 Non- arable
0.37325 0.37325 0.22395 0.7465 00 1.71695
1.1.8 Pasture dev (on other land)
Table 5.3 Non- arable
00 00 00 00 00 00
1.2 Soil and moisture conservation
Table 5.3 Non- arable
1.2.1 Staggered Tranching (ha)
Table 5.3 Non- arable
00 00 00 00 00 00
1.2.2 Contour Bunding (ha)
Table 5.3 Non- arable
00 00 00 00 00 00
1.2.3 Graded Bunding (ha)
Table 5.3 Non- arable
00 00 00 00 00 00
1.2.4 Bench terracing (ha)
Table 5.3 Non- arable
00 00 00 00 00 00
1.2.5 Others
1.2.6 a)Land Shaping & Periphery banding
Table 5.3 Non- arable
7.41 6.11429 15.79798 18.98789 1.09 49.40016
1.2.7
Re-habilitation of degraded forest land
Table 5.3 Non- arable
16.5 16.5 16.5 16.5 14.135 80.135
1.2.8 Gap filling and post plantation care over 8 ha
Table 5.3 Non- arable
00 0.25 0.35 0.1 0.1 0.8
29.17655 28.80584 39.95853 42.35239 20.1337 160.427
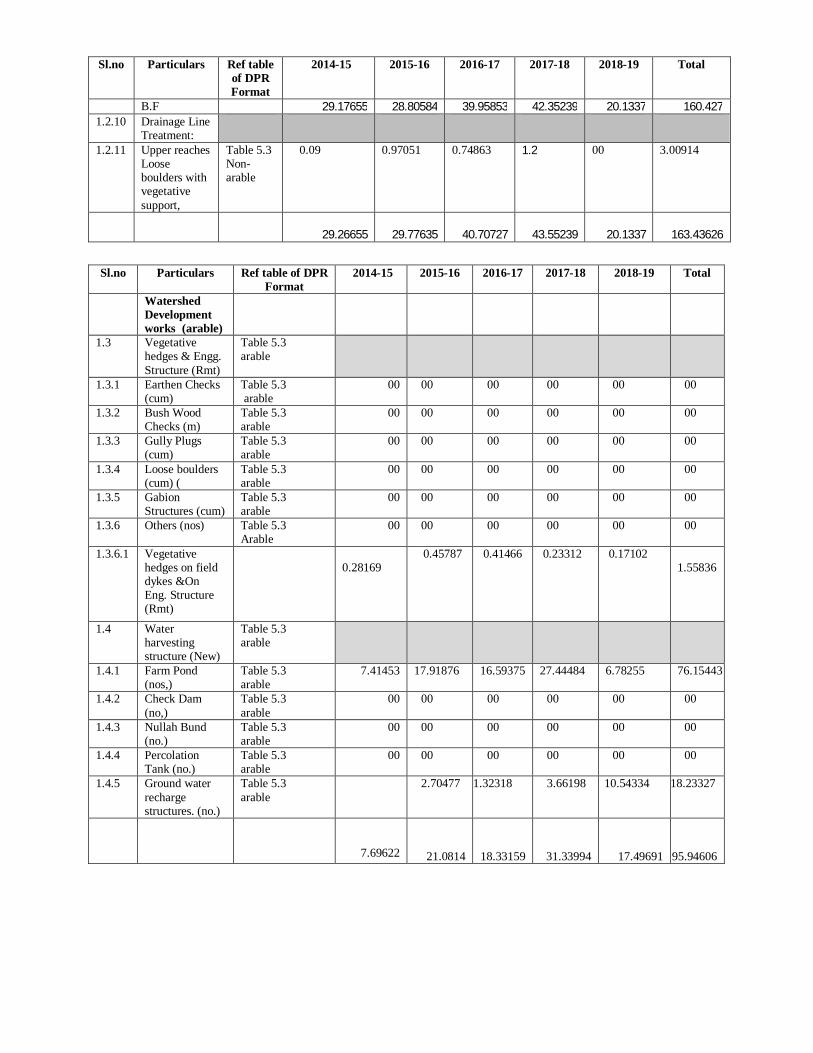
Sl.no Particulars Ref table of DPR Format
2014-15 2015-16 2016-17 2017-18 2018-19 Total
B.F 29.17655 28.80584 39.95853 42.35239 20.1337 160.427 1.2.10
Drainage Line Treatment:
1.2.11 Upper reaches Loose boulders with vegetative support,
Table 5.3 Non- arable
0.09 0.97051 0.74863 1.2
00 3.00914
29.26655 29.77635 40.70727 43.55239 20.1337
163.43626
Sl.no Particulars Ref table of DPR Format
2014-15 2015-16 2016-17 2017-18 2018-19 Total
Watershed Development works (arable)
1.3 Vegetative hedges & Engg. Structure (Rmt)
Table 5.3 arable
1.3.1 Earthen Checks (cum)
Table 5.3 arable
00 00 00 00 00 00
1.3.2 Bush Wood Checks (m)
Table 5.3 arable
00 00 00 00 00 00
1.3.3 Gully Plugs (cum)
Table 5.3 arable
00 00 00 00 00 00
1.3.4 Loose boulders (cum) (
Table 5.3 arable
00 00 00 00 00 00
1.3.5 Gabion Structures (cum)
Table 5.3 arable
00 00 00 00 00 00
1.3.6 Others (nos) Table 5.3 Arable
00 00 00 00 00 00
1.3.6.1
Vegetative hedges on field dykes &On Eng. Structure (Rmt)
0.28169
0.45787
0.41466
0.23312 0.17102
1.55836
1.4 Water harvesting structure (New)
Table 5.3 arable
1.4.1 Farm Pond (nos,)
Table 5.3 arable
7.41453 17.91876 16.59375 27.44484 6.78255 76.15443
1.4.2 Check Dam (no,)
Table 5.3 arable
00 00 00 00 00 00
1.4.3 Nullah Bund (no.)
Table 5.3 arable
00 00 00 00 00 00
1.4.4 Percolation Tank (no.)
Table 5.3 arable
00 00 00 00 00 00
1.4.5 Ground water recharge structures. (no.)
Table 5.3 arable
2.70477 1.32318 3.66198 10.54334 18.23327
7.69622 21.0814 18.33159 31.33994 17.49691 95.94606

Details of Convergence have been discussed under Section F in the year wise Action plan.
Sl.no Particulars Ref table of DPR Format
2014-15 2015-16 2016-17 2017-18 2018-19 Total
7.69622 21.0814 18.33159 31.33994 17.49691 95.94606
1.4.6 Others(no.) Table 5.3 arable
00
00
00
00
00
00
1.4.6. Dams Table 5.3 arable
00 00 00 00 22.04663 22.04663
1.4.6. Irrigation Channel
Table 5.3 arable
00 00 5.59174 5.00533 28.79603 39.39310
1.5 Water harvesting structure (renovated)
1.5.1 Farm Pond (nos,) Table 5.3 arable
26.32223 24.25643 20.16956 13.34023 18.62467 102.71312
(cum) Table 5.3 arable
00 00 00 00 00 00
1.5.2 Check Bund (no,) Table 5.3 arable
00 00 00 00 00 00
(cum) Table 5.3 arable
00 00 00 00 00 00
1.5.3 Nullah Bund (no.)
Table 5.3 arable
00 00 00 00 00 00
(cum) Table 5.3 arable
00 00 00 00 00 00
1.5.4 Percolation Tank (no.)
Table 5.3 arable
00 00 00 00 00 00
(cum) Table 5.3 arable
00 00 00 00 00 00
1.5.5 Ground water recharge structures. (no.)
Table 5.3 arable
00 00 00 00 00 00
(cum) Table 5.3 arable
00 00 00 00 00 00
1.5.6 Others Table 5.3 arable
00 00 00 00 00 00
(cum) Table 5.3 arable
00 00 00 00 00 00
Total 34.01845 45.33783 44.09289 49.6855 86.96424 260.0989
Total of Arable +Non Arable =260.0989 +163.43626 423.53516
Fund available under IWMP 294.00000
Convergence to other schemes
129.53516

2 Entry Point Activities( Financial)
Sl.no Particulars Location Ref table of DPR Format
2013-2014 2014-2015
Total
2.0 Entry Point Activities 2.1.1 Culvert/ causeway on village road as
per scheduleof item & drawing , & ect
Puljhar -148 Table 5.2
1.55334 0 1.55334
2.1.2 Culvert/ causeway on village road as per scheduleof item & drawing , & ect
Purnapani bara Tung-171
Table 5.2
1.35 0 1.35
2.1.3 Culvert/ causeway on village road as per scheduleof item & drawing , & ect
Buchiburi -163 Table 5.2
1.35 0 1.35
2.1.4 Construction of one causeway on Huangkhana Village Road Huang Khana -160 Table 5.2
0.87211 0 0.87211
2.1.5 Construction of one box culvert on Satnala - Murkum Road
Satnala -166
Table 5.2
1.38072 0 1.38072
2.1.6 Erection & commission of iron & Bacteria free community Drinking water supply pants
Bhulagara -154 Table 5.2
5.28305 0 5.28305
2.1.7 High-low benches for Primary school children Puljhar -148 Table 5.2
0.08091 0 0.08091
2.1.8 High-low benches for Primary school children Chandapathar -165 Table 5.2
0.08091 0 0.08091
2.1.9 High-low benches for Primary school children
Purnapani Chatatung -170
Table 5.2
0.08091 0 0.08091
2.1.10 High-low benches for Primary school children
Satnala -166
Table 5.2
0.08091 0 0.08091
2.1.11 High-low benches for Primary school children Bagdubi-149 Table 5.2
0.08091 0 0.08091
2.1.12 Erection & commission of iron & Bacteria free community Drinking water supply pants
Singlolar -168 Table 5.2
5.28305 0 5.28305
2.1.13 Culvert/ causeway on village road as per scheduleof item & drawing , & ect
Paryasa -169 Table 5.2
0 1.55334 1.55334
2.1.14 Culvert/ causeway on village road as per scheduleof item & drawing , & ect
Bagdubi-149 Table 5.2
0 1.55334 1.55334
2.1.15 High-low benches for Primary school children Dhanjhar-164 Table 5.2
0 0.08091 0.08091
2.1.16 High-low benches for Primary school children
Sindriam Table 5.2
0 0.08091 0.08091
2.1.17 High-low benches for Primary school children
Murkum-Chhota Tung-167
Table 5.2
0 0.08091 0.08091
2.1.18 High-low benches for Primary school children
Purnapani bara Tung-171
Bhulagara -154
0 0.08091 0.08091
Total 17.47682
3.43032
20.90714
Cost of transportation charges of High-low benches to the respective Primary Schools 0.09286 Total 21.00

Capacity and Institution Building Financial figure in Lakh
Sl. No Item of works unit Phasing of Training Remarks Preparatory phase Work Phase Consolid
ation Phase
Total
2013-2014 2014-2015 2015-2016 2016-2017 2017-2018 2018-2019 3 Level of trg S.L.N.A Level As
directed Training Cost 0.9 0.18 0.18 0.18 0.06 1.5 No. of Persons to
be trained 2 1 1 00 00 4
3.5.1 District level(as directed
3.5.2 Training Cost 0.78 0.1218 0.1218 0.1218 0.1546 1.3 (WDT MEMBERS) No. of Persons to
be trained 4 1 1 1 1 4
3.5.3 PIAs' Level
3.5.4 No Awareness Generation camp On IWMP ( Training Cost)
0.7044 00 00 00 00 00 0.7044
3.5.5 a)No. of Persons to be trained
1597 00 00 00 00 00 1597 Total House hoid
3.5.6 b) camp on self analysis on progress & quality of IWMP works in different micro water shed
00 00 0.32749 0.32749 0.32749 00 0..98247
No. of Persons to be participated
00 00 533 532 532 00 1597 Total House hoid
WDT Level
Training cost 0.2 0.2 0.2 0.2 00
0.8
3.6.7 No. of Persons to be trained
4 4 4 4 00 4
3.6.8 W.C Level
3.6.9 Training cost 0.331 0.166 0.166 0.166 0.166 0.994 3.6.10 No. of Persons to
be trained 56x2
times 56x1 times
56x1 times
56x1 times
56x1 times
56x 6 nos
3.6.11 SHGs level
3.6.12 Training cost 6.33 1.13 1.13 1.13 0.23 9.94 3.6.13 No. of Persons to
be trained 1008 140 140 140 10 1438
3.6.14 U.Gs Level
3.6.15 Training cost 5.74
1.03 1.03 1.03 0.40 9.23
3.6.16 No. of Persons to be trained
1120 140 140 180 57 1597

4 Livelihood Activities for asset less people Financial figure in Lakh
Sl. No
Item of works Phasing of Livelihood Activities Total 2014-2015 2015-2016 2016-2017 2017-2018 2018-2019
No. of Activities 4.1 RF to be released to
SHG/ SHGs @ Rs 25,000/- as seed money which will be transferred through WC
3.25 6.25 6.25 3.25 9.5 28.5
4.3 Livelihoods Promotional Grant per enterprising individuals as seed money which will be transferred through WC
0.425 1.1 1.1 0.425 1.75 4.8
4.5 RF to be released as a
grant -in -aid for
enterprising SHGs/
SHG federations to
undertake major
livelihood activities).
1.575 3.15 3.15 1.575 4.5 13.95
Total 5.25 10.5 10.5 5.25 15.75 47.25

5.0 Production System & Microenterprise (*Financial
Sl.no Particulars Ref table of
DPR Format
Units 2014-15 2015-16 2016-17 2017-18 2018-19 Total
5.1 Sericulture 5.1.1 No.of Activities 00 00 00 00 00 00 5.1.2 No.of
Beneficiaries 00 00 00 00 00 00
5.2 Bee Keeping 5.2.1 No.of Activities 00 00 00 00 00 00 5.2.2 No.of
Beneficiaries 00 00 00 00 00 00
5.3 Poultry 5.3.1 No.of Activities
Distribution of bud numbers
As per table 5.5
@Rs 400 / unit
0.29600
1.05600
2.24800
00 2.15200
5.75200
5.3.2 No. of Beneficiaries
74 264 562 00 538 1438
5.4 Fisheries 5.4.1 Fish fry & Fish
fingering production / rearing unit
00 00 0.18 0.18 3.06000
3.42
5.4.2 No. of Beneficiaries SHG (1unit/per SHG which is comprises of 5 to 8 members)
00 00 1 1 17 19
5.5 Bio fuel Plantation
00 00 00 00 00 00
5.5.1 No. of Activities 00 00 00 00 00 00 5.5.1 No. of
Beneficiaries 00 00 00 00 00 00
5.6 Others 5.6.1 1ntroduction
seed production
a) Introduction of Progeny orchard cum Poly house
As per table 5.5
no 1.5 00 00 00 00 1.5
No.of SHGs group(1unit/per SHG which is comprises of 16 to 18 members)
1 00 00 00 00 00
1.796 1.056 2.428 0.18 5.212 10.672

Sl.no Particulars Ref table of
DPR Format
Units 2014-15 2015-16 2016-17 2017-18 2018-19 Total
B.F 1.796 1.056 2.428 0.18 5.212 10.672 b)Seasonal
Vegetable / Fruit Nursery. Saplings of different types as per requirement of the area
As per table 5.5
no 00 0.67500
00 00 0.67500
1.35000
No.of SHGs group
no 00 3 00 00 3 6
5.6.2 Crop diversification & Introduction of new crop (Agriculture)
ha 0.52328
3.80184
1.69060
1.72360
4.49138
12.23070
Nos. of Beneficiaries
nos 34
328 248 197 391 1198
5.6.3 Crop demonstrations & testing of new cvs
a)Pamaroja grass as commercial crop (hedge on field dyke) Rmt
Rmt 0.04537
0.05968
0.07089
0.06786
0.13047
0.37427
No. of Beneficiaries
nos 17 35 56 44 88 240
b) Demo on Susbania acculiata (Dhaincha) as green manuring crop in rice fields
ha 00 00 0.12
0.09
0.15
0.36
No. of Beneficiaries
nos 00 00 32 24 40 96
5.6.4 Adoption of new technology
a)System of rice intensification (SRI) in ha
ha 00 0.07875
0.18
0.315
0.06
0.63375
No. of Beneficiaries
nos 00 42 96 168 32 338
b)System of Maize intensification
00 0.072
0.12
0.144
0.048
0.384
No. of Beneficiaries
nos 00 13 20 26 13 72
2.36465 5.74327 4.60949 2.52046 10.76685 26.00472
Sl.no Particulars Ref table of
DPR Format
Units 2014-15 2015-16 2016-17 2017-18 2018-19 Total

B.F 2.36465 5.74327 4.60949 2.52046 10.76685 26.00472 c) Providing critical inputs for systematic Rice Intensification to the limited Farmers
nos 0.30243
0.21941
0.10674
0.07709
0.70567
No. of Beneficiaries is each SHG
00 51 37 18 13 119
5.6.5 Integrated farming system
As per table 5.5
a) Land based integration through multi storied production system with incorporation of small animals(Chicks, Ducks)
0.64
0.24
0.16
0.32
00 1.36
b)Pond based integration with Fruit + Vegetable + duck + fish
0.8
0.4
0.32
0.24
1.76
No. of Beneficiaries in groups or SHG s is in group comprising 2 to 3 number of SHG
36 16 12 14 78
5.6.6 Livestock management related services:
As per table 5.5
a)Organization of quarterly animal vaccination camp in numbers
0.24
0.40
0.42
0.47
0.29
1.82
No. of Beneficiaries
Each house hold will be the Beneficiaries of this activities 1597
Pureline selection & dev. Of local goat through replacement of bucks from outside
0.408
0.408
0.357
00 0.357
1.53
No of Beneficiaries are 60 nos of SHGs
16
16
14
00 14
60
4.45265 7.4937 6.0859 3.6572 11.49094 33.18039

Sl.no Particulars Ref table of
DPR Format
Units 2014-15 2015-16 2016-17 2017-18 2018-19 Total
4.45265 7.4937 6.0859 3.6572 11.49094 33.18039 5.6.7 Adoption of new
Technology in respect of production manure
As per table 5.5
a)Production of vermicompost (farmers level /home scale) numbers
0.49735
1.80075
2.57250
2.57250
7.44310
30 numbers of SHG will be involved in this process
30 30 30 30 30
b)) Production for FYM by NADEP system (Farm level
0.3
1.05
1.5
1.5
4.35
30 numbers of SHG will be involved in this process
30 30 30 30 30
5.6.8 Agro-based common facility centre
2.65566
2.65566
No. of Beneficiaries
Each house hold will be the Beneficiaries of this activities 1597
5.6.9 Home nutrition garden intregated & multistoried system (All household)
0.15555
0.34160
0.75030
3.62340
4.87085
No. of Beneficiaries
51 112 246 1188 1597
5.25 10.5 10.5 8.48 14.77 52.5
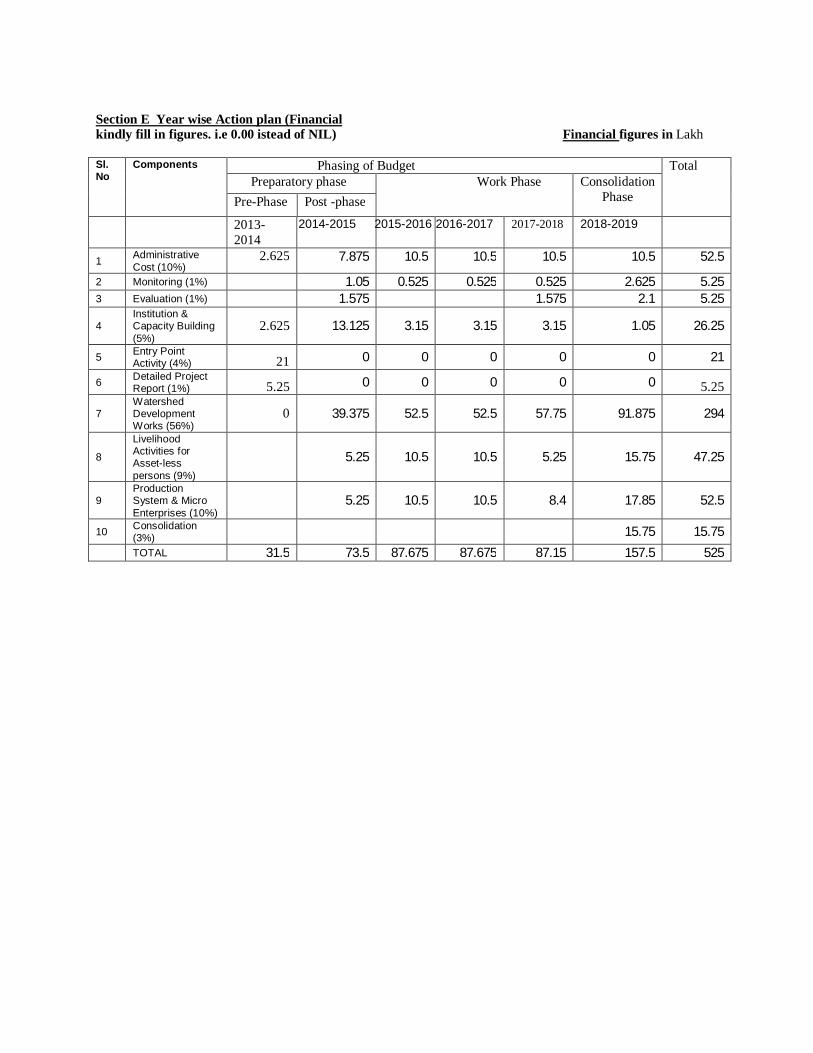
Section E Year wise Action plan (Financial kindly fill in figures. i.e 0.00 istead of NIL) Financial figures in Lakh Sl. No
Components Phasing of Budget Total Preparatory phase Work Phase Consolidation
Phase Pre-Phase Post -phase
2013-2014
2014-2015 2015-2016 2016-2017 2017-2018 2018-2019
1 Administrative Cost (10%)
2.625 7.875 10.5 10.5 10.5 10.5 52.5
2 Monitoring (1%) 1.05 0.525 0.525 0.525 2.625 5.25 3 Evaluation (1%) 1.575 1.575 2.1 5.25
4 Institution & Capacity Building (5%)
2.625 13.125 3.15 3.15 3.15 1.05 26.25
5 Entry Point Activity (4%) 21 0 0 0 0 0 21
6 Detailed Project Report (1%) 5.25 0 0 0 0 0 5.25
7 Watershed Development Works (56%)
0 39.375 52.5 52.5 57.75 91.875 294
8
Livelihood Activities for Asset-less persons (9%)
5.25 10.5 10.5 5.25 15.75 47.25
9 Production System & Micro Enterprises (10%)
5.25 10.5 10.5 8.4 17.85 52.5
10 Consolidation (3%) 15.75 15.75
TOTAL 31.5 73.5 87.675 87.675 87.15 157.5 525

Section F Year wise Action plan (Convergnce ) Financial figure in Lakh F.I Works to be taken up through convergence
Fill Works to be taken up through convergence under Financial figure in Lakh Section G Likely Project Outcome
Waste land likely to be converted to productive use (ha) 1.1) Total waste land likely to be taken up As per land records of B.L.RO of Ranibandh that the 66 hectare of land has been identified as waste land &fit for cultivation. These 66 hectare of waste land is not owned by Government but it is under the possession of the inhabitance of the Chhendapathar watershed. Further during the time of execution of PRA exercise. Further the inhabitance of watershed approaches to bring a portion these land under the coverage of the horticulture species & the development of Pasture and accordingly it has been included in our project proposal for productive use of for raising of Horticulture species as well as the the development of Pasture . 1.2 Total waste land likely to be brought under agriculture Out of 66 hectare 43 hectare of waste land &23 hectare waste land has been brought under horticulture the horticulture species and for the development of the Pasture respectively. It has been indicated in 1.1.3 & 1.1.7 Watershed Development works (Non- arable) 1.3 Total waste land likely to be brought under horticulture
Sl.no
Particulars unit 2014-15
2015-16 2016-17 2017-18 2018-19 Total
Phy Fin Phy Fin Phy Fin Phy Fin Phy
Fin Phy Fin
1 Soil & Moisture Conservation Works
Land leveling, Periphery banding
ha 12.35
7.41
22.6847
6.11429
22.8689
15.79798
15.9584
18.98789 5.41
1.09 79.312 49.40016
2 Re-habilitation of degraded forest land
ha 300 16.5 300 16.5 300 16.5 300 16.5 257 14.135 1457 80.135
Total 23.91 22.61429 32.29798
35.48789
15.225
129.53516
Sl.no Particulars 2014-15 2015-16 2016-17 2017-18 2018-19 Total 1 MGNREGA 23.91 22.61429 32.29798 35.48789 15.225 129.53516 2 RKVY 00 00 00 00 00 00 Total 23.91 22.61429 32.29798 35.48789 15.225 129.53516
It was discussed under the item no 1.1 1.4 Total wasteland likely to be brought under other productive uses It was discussed under the item no 1.1 2 Cropping intensity The cropping intensity in different block under the Bankura district is varying. The highest cropping intensity is 195 which is falls under Raipur block & lowest one is 104 which is falls under Ganjalghatti of the Bankura district. However the cropping intensity of the Ranibandh block is 129. But the cropping intensity of Chhendapathar watershed is 129 which is lagging behind the block average. Therefore it is required to provide more attention to improve the cropping intensity. Further the watershed approaches of planning has provided us to identify some trust areas and interventions, which will be helpful in increasing the production and productivity in agricultural sectors. The strategy is being fallowed in the Chhendapathar watershed is to go for crop diversification along with en-lighted modern technology. Further newly constructed water harvesting structure and renovation of existing water harvesting structure will helps in recharging of ground water table and consequently ground water table will rises up. Apart from live saving irrigation, theses processes will definitely helps in production and productivity of agricultural crops. 2.1 Likely cropping intensity after the project (%):- The cropping intensity is
likely to be increased from 129 to 160. 2.2 Likely change in cropping intensity (% increase/ decrease):-- The cropping intensity will be changed in positive sides. 3 Water Storage Structure/ irrigation 3.1 Water Storage Structure (renovated) nos.:- 51 in numbers has been proposed in the D.P R. 3.2 Water Storage Structure (created) nos.:- 33 number has been proposed in the D.P R 3.3 Increase in storage capacity of water storage structure (cum) The additional increase of storage capacity of water
harvesting structure is 126898cu-meter 3.4 Increase in storage capacity of water storage structure (%);- The increase in the percentage storage capacity of water by
25.24%( Details in this matter has been discussed in the article 5.4.1
3.5 Additional water extracting units proposed to be created (nos);-All 84 numbers of water bodies will be used as live saving irrigation right from paddy to vegetables. And will assist to
transform to a portion mono crop areas to multiple/double cropping areas. Details has been discussed in the estimation of Run-off under article 5.3
3.6 Additional area proposed to be brought under irrigation (ha) ;- 168 ha additional area has been proposed to be brought
under irrigation Likely Beneficiary related outcome The invaluable contribution of soil and water conservation measures can never be accounted for in terms of benefit. It is difficult to count all direct and indirect benefits of soil and water conservation measures, because it matures over a longer period However 1597 nos of household will be benefited directly or indirectly. These include 1163 nos of marginal farmers, 275 nos landless / asset less people. The other details have been discussed in respective chapter.

5. Employment likely to be generated
Part 2 Expected Flow of benefits ( in nos)
Item of works 1st year
2nd year
3rd year
4th year
5th year Total
Post project / annum
Watershed development works 11400 15100 15250 15900 26000 83650 12000 Production system & micro enterprise
1440 2880 3000 2200 4500 14020 27000
Livelihood activities for the asset less persons- 45 days employment per Landless labourer through watershed activities expected.
-
Consolidation - EPA 500 500 - Administrative - Monitoring - Institution & capacity building - DPR - Post- project sustainable man days to be created per annum
Total 13340 17980 18250 18100 30500 98170 39000
S.L No
Beneficiaries
SHG UG Micro Tot
Beneficiaries
M F Tot M F Tot M F Tot M F Tot
1 SC 00 13 13 24 20 44 91 78 169 115 111 226 2 ST 00 600 600 65
5 470 1125 193
4 1661 3595 2589 2731 5320
3 Minority
00 00 00 00 00 00 00 00 00 00 00 00
4 Others 00 260 260 229
199 428 932 692 1624 1161 1151 2312
Total 00 873 873 908
689 1597 2957
2431 5388 3865 3993 7858


![Nelli rrr [autosaved]](https://img.pdfslide.us/doc/110x75/5487750bb4af9fa00d8b545b/nelli-rrr-autosaved.jpg)