Embed Size (px)
Citation preview
Yecenia Rivera Ortiz & Nghi Tran 2007© - 1 -
Blekinge Institute of Technology, Ronneby, Sweden
Master Thesis in Business Administration
June 2007
Rewarding and Recognizing Employees:
How IT Professionals in Sweden and in Finland are Motivated and
Prefer to be Rewarded
Authors: Yecenia Rivera Ortiz
Supervisor:
Dr. Klaus Solberg Søilen
Nghi Tran
Yecenia Rivera Ortiz & Nghi Tran 2007© - 2 -
Abstract
Title
Rewarding and Recognizing Employees: How IT Professionals in Sweden and in
Finland are motivated and prefer to be rewarded
Authors
Yecenia Rivera Ortiz
Nghi Tran
Supervisor
Dr. Klaus Solberg Søilen
Course
Master Thesis in Business Administration
Purpose
With this thesis we want to investigate through an empirical and a theoretical study
how IT professionals in Sweden and in Finland are motivated and how they prefer to be
rewarded and recognized.
Method
The methodology for this thesis is both a quantitative and qualitative research
methodology. The data was collected through questionnaires which contained multiple
choice questions and open questions. The Statistical Analysis of Data presentation was
performed for the multiple-choice questions and Qualitative analysis for the open
questions.
Conclusions
Motivating, recognizing and rewarding IT-professionals is a severely complicated issue
of great importance to both employers and employees. IT-professionals does not appear
to be fully motivated and recognized and they would do a better work if they where,
according to them self. It is important that the management in the organizations
dedicate time and interest to their employee’s individual needs and to improve their
motivation. By doing so, the quality of work and efficiency might be improved.
Key Words
Information technology, motivation, rewards and recognition
Yecenia Rivera Ortiz & Nghi Tran 2007© - 3 -
Acknowledgements
The completion of our MBA thesis would not have been possible without the help of
these people:
First of all, we would like to thank our thesis supervisor Dr. Klaus Solberg Søilen for
his support and guidance.
We want to thank the companies: Sesca in Finland, Sony Ericsson AB (Hässleholm’s
division), and Conagri AB (Malmö’s division) in Sweden for helping us with the
collection of our questionnaires.
Tran Nghi wants to thank Heikki Kvist, Timo Sivula and Anne Brandt for their support
in the collection of the questionnaires. He also wants to thanks his family, brothers,
especially he wants to thanks his wife Anne Partanen, who always supports and
encourages him!
Yecenia Rivera would like to thank Niklas Petterson, Rony Roos, and Per-Olof Olsson
for their support in the collection of the questionnaires. She also wants to thank her
parents and brother for their support, especially her husband, for his unconditionally
support and help through this journey! ¡Gracias mi amor! But most of all, she wants to
thank God, He deserves all Glory!
Finally, the authors want also to thanks the students in the MBA Part-time Program for
their comments and suggestions.
Nghi Tran Yecenia Rivera Ortiz

Yecenia Rivera Ortiz & Nghi Tran 2007© - 4 -
Table of Contents
1 INTRODUCTION AND LITERATURE REVIEW..……………………………………7
1.1 Motivation-Definition and Theories………………………………………………..7
1.1.1 Abraham Maslow: Hierarchy of Needs………………………………………………..8
1.1.2 Douglas McGregor: Theory X/Theory Y……………………………………………..10
1.1.3 Frederick Herzberg: Motivation-Hygiene…………………………………………….11
1.1.4 David McClelland: Achievement, Affiliation, and Power Motives…………………12
1.1.5 J. Stacey Adams: Equity Theory……………………………………………………..13
1.1.6 Victor Vroom: Expectancy Theory……………………………………………………14
1.2 Intrinsic versus Extrinsic Motivation……………………………………………..15
1.3 Motivational Factor…………………………………………………………………..16
1.4 Motivation through Financial Incentive…………………………………………..17
1.5 Individual Factors and Motivation……………………………….………………..17
1.6 Rewarding……………………………………………………………………………..22
1.7 Recognition…………………………………………………….……………………..22
1.8 Motivation within IT-organizations……………………………………………..…24
1.9 Research Objectives……………………………………………….………………..25
1.10 Limitations of the Research…………………………………………………..…..25
2 RESEARCH METHODOLOGY..…………………………………….………………27
2.1 Method of Research Used…………………………………………………………..27
2.2 Data collection………………………………………………………………………..28
2.3 Validity and Reliability………………..……………………………………………..28
2.4 Respondents and Sampling Procedures………………………………………...29
3 PRESENTATION OF DATA…..……………………………………..………………31
3.1 Sampling and Selection…...…………………………………..…………………....31
3.2 Data Collection…………………………………...……………..…………………....32
3.2.1 Demographical Data………………………………………….…………………………..33
3.2.2 Hypothesis 1………………………….……………………….…………………………..36
3.2.3 Hypothesis 2………………………………………………….……………….…………..41
3.2.4 Hypothesis 3………………………………………………….…………………………...48
4 METHOD DISCUSSION………..…………………………………….………………53
4.1 Selections of Participants…………………………..……………………………....53
4.2 Logistics and Communication……………………………..……………...……....53

Yecenia Rivera Ortiz & Nghi Tran 2007© - 5 -
4.3 Questionnaire………………………….………………………..…………………....54
4.4 Analysis of data………………….……………………………..…………………....54
5 DISCUSSION OF RESULTS..…………………….………………..……………….55
6 CONCLUSION AND RECOMMENDATIONS…….………………..……………….58
7 REFERENCES..………………………..………….………………..……………….60
7.1 Books……………………………………………...……………..…………………....60
7.2 Articles…………………………………………...……………...……………….…....61
7.3 Research Papers………………………………...……………..…………………....62
7.4 Websites…………………………………………...……………..…………………...62
8 APPENDICES..………………………...………….………………..……………….64
8.1 Appendix A: Presentation Letter…………...………………..…………………...64
8.2 Appendix B: Questionnaire………………........……………..…………………...65
List of Figures
Figure 1: Maslow’s Need Hierarchy…………………………………………………9
Figure 2: Differences between Intrinsic and Extrinsic Motivation…………….....15
Figure 3: Structures of Rewards……………………………………………………21
List of Tables
Table 1: Difference between Groups and Teams…………………………………..19
Table 2: Companies Contacted with Fitted Criteria……………………………....31
Table 3: Distribution of Questionnaires…………………………………………....32
Table 4: Demographical Data……………………………………………………….33
Table 5: Question 12…………………………………………………...…………….37
Table 6: Question 15………………………………………………………………....47
Table 7: Question 16………………………………………………………………....38
Table 8: Question 17………………………………………………………………....39
Table 9: Question 2…………………………………………………………………..42

Yecenia Rivera Ortiz & Nghi Tran 2007© - 6 -
Table 10: Question 5…………………………………………………………...44 & 49
Table 11: Question 7....................................................................................................44
Table 12: Question 19………………………………………………………………..52
List of Graphics
Graphic 1: Question 11………………………………………………………………36
Graphic 2: Question 13………………………………………………………………47
Graphic 3: Question 14………………………………………………………………38
Graphic 4: Question 18………………………………………………………………40
Graphic 5: Question 1………………………………………………………….41 & 48
Graphic 6: Question 3……………………………………………………………......42
Graphic 7: Question 4………………….………………………………………43 & 53
Graphic 8: Question 8…………………………………….………………………….45
Graphic 9: Question 9……………………………………………………………......46
Graphic 10: Question 6………………………………………………………………50
Yecenia Rivera Ortiz & Nghi Tran 2007© - 7 -
1 Introduction and Literature Review
Most business and organizations strive to improve quality and performance of their
products, services, internal or external operations. The reasons for this can be various,
depending on the goals the business or the organization have set. Important goals could
concern an effort to assure a firm and stable ground in the market or to improve cost-
effectiveness. The competition between organizations and business can be a difficult
task, and make it difficult to reach higher goals and development (Bolman 1997).
One strategy for reaching higher goals and development is motivation. Employees who
are motivated produce a higher quality of work and effectiveness which means that
motivation is a key factor for progress within an organization or business. A profound
knowledge of motivation and its meaning is therefore essential for success and
development (Paré 2001, De Cenzo 1996).
Motivating employees is a key factor for a company to success in their business. The
authors are planning to open their own companies in Sweden and Finland. In order to
manage and run their companies well, they are very interested and would like to know
and understand how to motivate their employees, how to reward and recognize them. It
is very good for them to dig deeper in reward and recognition, which might be valid
and valuable in their future as a manager of their own small venture.
1.1 Motivation – Definition and Theories
Motivation is a complex phenomenon which is influenced of individual, cultural, ethnic
and historical factors. According to De Cenzo et al., (1996), people who are motivated
use a greater effort to perform a job than those who are not motivated. Motivation can
be defined as “a series of energizing forces that originate both with and beyond an
individual’s self”. These forces determine the person’s behavior and therefore,
influence his/her productivity (Jackson, 1995). In other words this means that all
thinkable factors of physical or psychological aspects that we interact with, leads to a
reaction within our self or of the entire organization.

Yecenia Rivera Ortiz & Nghi Tran 2007© - 8 -
This reaction can be either positive or negative and lead to an increased or decreased
productivity and motivation. Energizing forces can therefore be anything from the work
environment to the charisma of the management and so on.
Another definition for Motivation is “the willingness to do something, conditioned by
the action’s ability to satisfy some need”. Although in a basic sense this definition is
correct, it needs to be modified for organizational reasons, that is, the effort that
employees make can be misguided. Therefore, it must be focused toward some
organizational goals and at the same time must satisfy both organizational and
individual needs (De Cenzo et al., 1996).
Motivation was in the beginning of the 1900 thought only to be monetary. It was
discovered during the 20-th century that there are more factors than just money to
motivate employees. The employees’ satisfaction with their job is an important
indicator for a good job performance and that happy employees are productive. It is
also concluded that motivation is a psychological factor and is affected by the workers
mental attitude and health (Latham and Ernst, 2006).
In order to be motivated, a person needs to have certain basic needs fulfilled. If these
needs are lacking, a persons self esteem and self actualization can not develop. This
could result in lack of interest to progress and develop, both professionally and
personally. There are several theories of human needs which are the foundation of
motivation (Latham and Ernst et al., 2006).
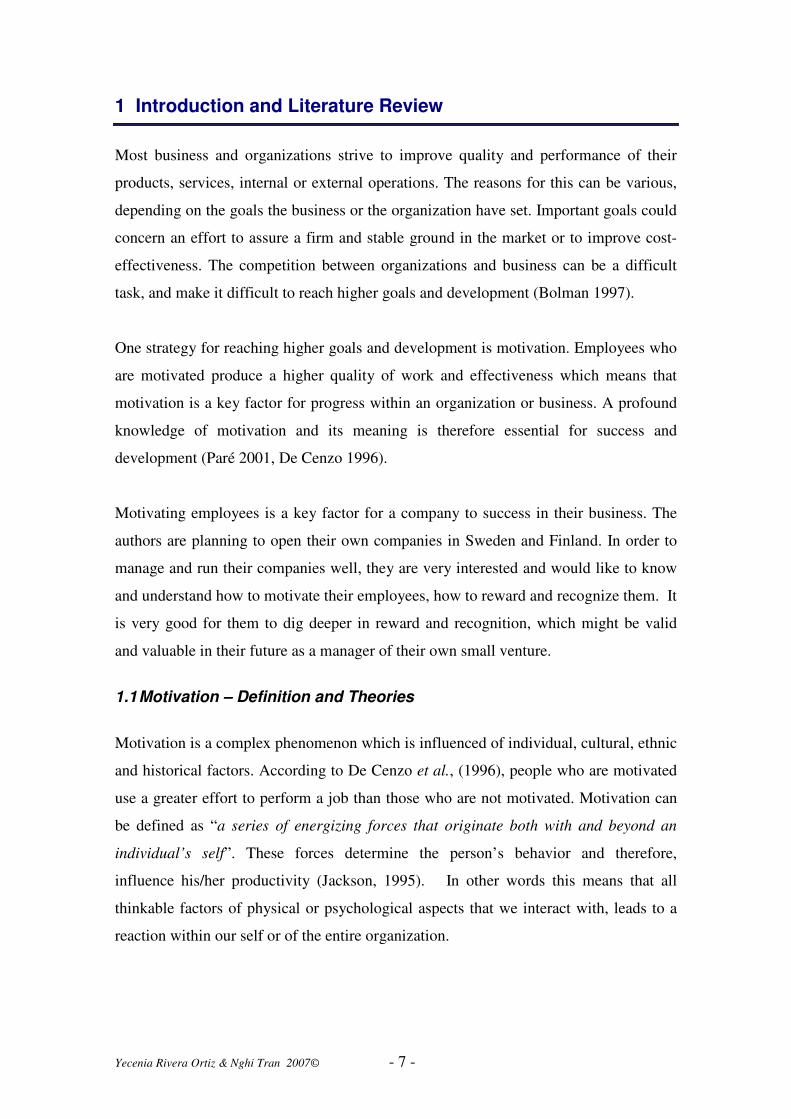
1.1.1 Abraham Maslow: Hierarchy of Needs
Five needs rank in a hierarchical order from lowest to highest: physiological, safety,
belonging, esteem, and self-actualization. An individual moves up the hierarchy, when
a need is substantially realized (Shah, K. and Shah, P.J., 2007).

Yecenia Rivera Ortiz & Nghi Tran 2007© - 9 -
Figure 1: Maslow’s Need Hierarchy
1. Physiological needs: The basic physical needs for sustaining the human life. For
example food, water, sleep, medicine, education (Shah, K. and Shah, P.J. et al.,
2007; Latham and Ernst et al., 2006).
2. Safety needs: To be free of physical danger and of the fear of losing a job, property,
food or shelter. To protect against any emotional harm. To have a safe home, secure
income, sufficient salary, benefits and medical insurance (Shah, K. and Shah, P.J. et
al., 2007; Latham and Ernst et al., 2006).
3. Social needs: Because people are social beings, they need to belong and be
accepted by others. They like to have family and friends. People try to satisfy their
need for affection, acceptance and friendship. Interaction and cooperation with
coworkers and leaders (Shah, K. and Shah, P.J. et al., 2007; Latham and Ernst et
al., 2006).
4. Esteem needs: To be held in esteem both by themselves and by others. This kind of
need produces such satisfaction as power, prestige status and self-confidence. It
includes both internal esteem factors like self-respect, autonomy, achievements and
external esteem factors such as states, recognition and attention (Shah, K. and Shah,
P.J. et al., 2007; Latham and Ernst et al., 2006).
5. Self-actualization: This is the highest need in Maslow’s hierarchy. This need is to
fulfill one’s potential and self-fulfillment and maximize one’s potential and to
accomplish something. Employees in this rank try to maximize their knowledge,
skills and performance to do a good job (Shah, K. and Shah, P.J. et al., 2007;
Latham and Ernst et al., 2006).
SSeellff
AAccttuuaalliizzaattiioonn
EEsstteeeemm
SSoocciiaall
SSaaffeettyy
PPhhyyssiioollooggiiccaall

Yecenia Rivera Ortiz & Nghi Tran 2007© - 10 -
There are some criticisms to Maslow’s theory. There are arguments that there is still no
adequate empirical verification to support Maslow’s theory and frame work (Bowditch,
1997). It also concerns the numbers of levels where research suggests that there maybe
only two or three levels instead of five levels (Aamodt, 2007). Thirdly concerns the
methodology, where the numbers of people included are small and by Maslow himself
declared self-actualizing. This methodology might be a suboptimal sample,
scientifically spoken (Boeree, 2006). Maslow also predicts that human beings will
move up the hierarchy, satisfying one need before moving on. There are many
examples of people who exhibited at very least aspects of self-actualization and they
were far from having their lower needs taken care of. Many artists and scientists, (Van
Gogh and Galileo, for example), suffered from mental illness, and yet were able to
produce works that changed the world (Boeree et al., 2006). Maslow’s theory predicts
that once the needs at one level are satisfied, the next needs level should become more
important. Researches have shown that this does not necessarily happen (Aamodt et al.,
2007).
Although, Maslow’s theory is still useful in certain areas, the main strength of this
theory is the recognition and identification of individual needs for the purpose of
motivating behavior (Bowditch et al., 1997).
1.1.2 Douglas McGregor: Theory X/Theory Y
McGregor’s theory, which is built on Maslow’s theory, adds a central idea: that
managers’ assumptions about their employees can effect their motivation. This theory
proposes two alternative and extreme views to see the human being: Theory X and
Theory Y. According to Theory X the employee is viewed as mainly negative, lazy,
resist change and unable to motivate. This produces a controlled environment with
strict rules, threats and punishments. Employees in an organization like this tends to
perform less effective, gives low productivity, produces aggressions and conflicts
(Bolman et al., 1997). Theory Y on the other hand strives to maximize the employee’s
individual goals and efforts by giving workers greater job involvement and autonomy.
This means that employees are given the possibility to grow and achieve their own
goals within the organization. Employees are viewed as positive and open to
development. The management’s goal is to make the employee happy and satisfied
with their work and performance (Bolman et al., 1997; Matteson 1999).

Yecenia Rivera Ortiz & Nghi Tran 2007© - 11 -
Nowadays, Douglas McGregor theories are seldom used because this theory has been
influenced during the past decades by many new ideas and modern theories. This
theory has also been criticized of being too black and white in its division of employees
and managers. However, Theory X and Theory Y are still important terms in the field
of management and motivation. Taken not too literally the theory can provide a useful
tool for the motivation and management research (DefineThis, 2007). In addition, these
theories remain as a guiding principle of positive approaches for management, to
organizational development and to improve organizational culture (Wikipedia, 2007a).
1.1.3 Frederick Herzberg: Motivation-Hygiene
Herzberg argues that intrinsic job factors are motivating, whereas extrinsic factors only
placate employees. In this theory there are two group factors. The first one is
motivating factors or satisfaction, which include (Wikipedia, 2007b):
Achievement
Recognition
Work itself
Responsibility
Promotion
Growth
The second one is hygiene factors or dissatisfaction, hygiene factors can be defined as
the following:
Pay and benefits
Company Policy and Administration
Relationships with co-workers
Physical Environment
Supervision
Status
Job security
The absence of money as a hygiene factor, will lead to dissatisfaction and prevent to
motivate the worker (Wikipedia, 2007b). Money is also used to motivate an individual

Yecenia Rivera Ortiz & Nghi Tran 2007© - 12 -
to perform a task. More money is often offered to an individual for to do the task again
(Examstutor, 2007).
According to Herzberg, the workers get motivated when they are responsible for their
work. He also proposed that managers can give their employees more authority to their
job and offer them direct and individual feedback in order to motivate and help
employees to connect to their work (Wirralmet, 2007). Furthermore, Herzberg also
recommended that the job should have sufficient challenge to utilize the full ability of
the employee. If the job is not sufficient challenge enough and not use an employee’s
full abilities, the company should replace the employee with the one who has a lower
level of skill to do the job (NetMBA, 2007).
Most empirical studies have refuted predictions based on Herzberg’s theory. According
to Herzberg’s theory, he concluded that hygiene factors are related with dissatisfaction
rather than satisfaction. However, recent researches have found contradictions and
opposite with his theory. This theory also got criticism in its methodology leading to
limitations on the results (Bowditch et al., 1997).
Another problem with Herzberg’s theory is that some employees show no particular
interest in such motivators as opportunity for growth and advancement (Dubrin, 2002).
In spite of criticisms, Herzberg’s theory provided a new way of thinking about worker
motivation and his theory remains as an influential factor in attempts to make the
motivation theory in an organizational way (Dubrin et al., 2002).
Herzberg’s theory implication in real work life for a manager and management in the
company who want to motivate their employees would include these activities: provide
the employees with good compensation, flexible company policies and being connected
to their own employees. In addition, the manager also recognizes the good work from
their employees and gives their employees the opportunities to grow and develop their
skills, knowledge and experience.
1.1.4 David McClelland: Achievement, Affiliation, and Power Motives
McClelland proposes that there are three major needs in workplace situations:
achievement, affiliation, and power. A high need to achieve has been positively related
Yecenia Rivera Ortiz & Nghi Tran 2007© - 13 -
to higher work performance when jobs provide responsibility, feedback, and moderate
challenge (Kreitner, 2002).
The need for achievement: The desire to accomplish something difficult, to
overcome obstacles and attain a high standard, to excel, to rival and surpass
others.
The need for affiliation: The desire to form and maintain a few lasting, positive
and important interpersonal relationships.
The need for power: The individual’s desire to influence, coach, teach, or
encourage others to achieve.
According to David McClelland, the success will come if the employee is dedicated to
the company, committed to the work ethic and unflagging in energy and devotion.
However, the increasing popularity of switching jobs as a method of rapid advancement
and the rapidity of change in organizations somewhat contradicts this type of thinking
(Stuart, 2007).
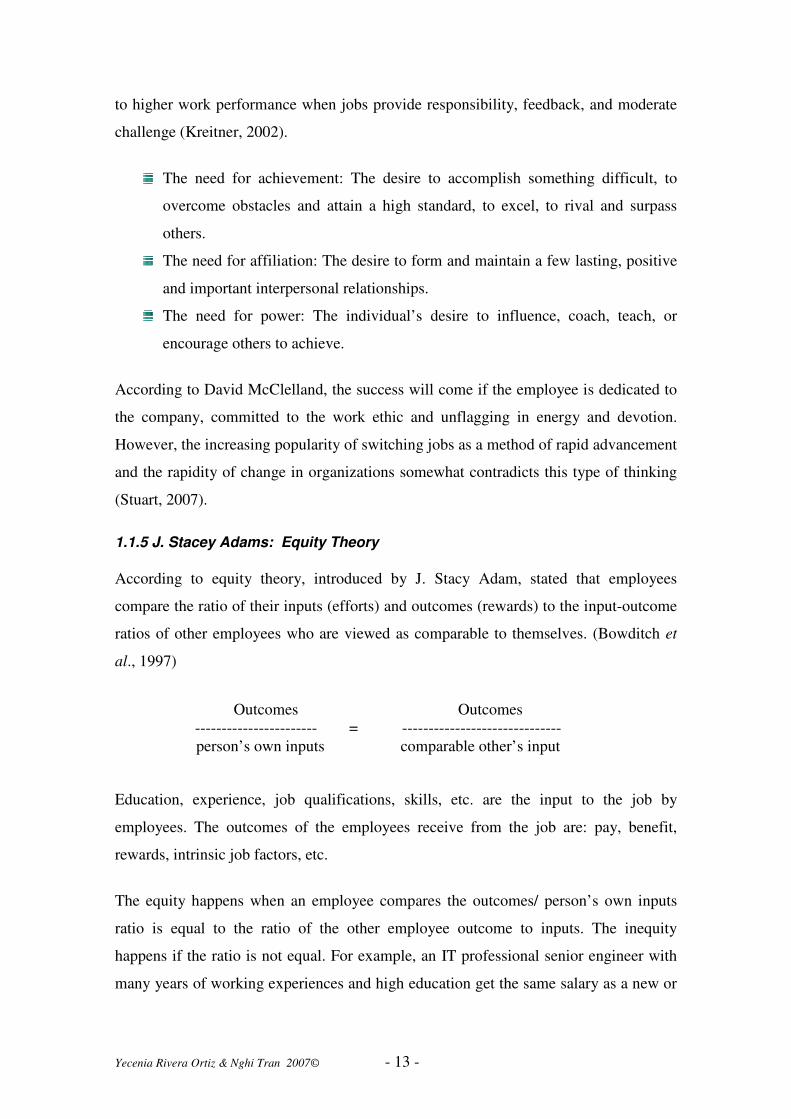
1.1.5 J. Stacey Adams: Equity Theory
According to equity theory, introduced by J. Stacy Adam, stated that employees
compare the ratio of their inputs (efforts) and outcomes (rewards) to the input-outcome
ratios of other employees who are viewed as comparable to themselves. (Bowditch et
al., 1997)
Education, experience, job qualifications, skills, etc. are the input to the job by
employees. The outcomes of the employees receive from the job are: pay, benefit,
rewards, intrinsic job factors, etc.
The equity happens when an employee compares the outcomes/ person’s own inputs
ratio is equal to the ratio of the other employee outcome to inputs. The inequity
happens if the ratio is not equal. For example, an IT professional senior engineer with
many years of working experiences and high education get the same salary as a new or
Outcomes Outcomes
----------------------- = ------------------------------
person’s own inputs comparable other’s input

Yecenia Rivera Ortiz & Nghi Tran 2007© - 14 -
recent graduated junior engineer, the senior engineer will perceive it as an inequity and
therefore unjust.
When the employee perceive an inequity, he or she will do in one of the following
actions: (Dubrin et al., 2002)
Alter the outcome: An underpaid person will ask for more salary or bonus,
promotional opportunities, or vacation time.
Alter the inputs: An underpaid person or a person who feels treated inequitable
might decrease effort or time devoted to work. Someone even create faking sick
days to take care of personal business.
Distort the perception: a person, who feels of inequity, can distort his or her
perception of their own or other’s inputs or outcomes.
Change the reference source: he or she can change to another reference source
whose outcome/input ratio is similar to his or her own.
Leave the situation: a person who feels of inequity, can choose to quit a job and
get greater equity in another.
There is very little application of Equity theory in the workplace. Furthermore, the
individuals are very sensitive with inequity. It is better to identify those inequities and
have some research before some application can be applied (“Motivation to Work”,
2007).
1.1.6 Victor Vroom: Expectancy Theory
Vroom proposes that motivation is a function of value of effort-performance and
performance-rewarded relationships. Expectancy theory emphasizes the role of
individual perceptions and feelings (expectations of particular results) in determining
motivation and behavior.
The best way to view the expectancy theory is with the acronym VIE, which stands for:
Valence, Instrumentality, and Expectancy, where (Bounds, 1995):
Valence is the value or anticipated satisfaction that an individual attaches to an
outcome.

Yecenia Rivera Ortiz & Nghi Tran 2007© - 15 -
Instrumentality is the possibility that a doing well performance will yield the
valued outcome.
Expectancy is the possibility that a certain level of effort will result in
successful behavioral performance.
One criticism of the expectancy theory is that this theory focuses on individual
perceptions of the work environment and the interactions of that context with one's
personal expectations. In addition, empirical support for the concepts of expectancy,
instrumentality, and valences has been rather broad. Also the expectancy theory does
not specify which outcomes which are relevant to individuals in any situation (Enoch,
2005). Despite the criticism, Expectancy Theory is still one of the most useful for
predicting employee behavior (Aamodt et al., 2007).
1.2 Intrinsic versus Extrinsic Motivation
Bounds et al. (1995) define intrinsic motivation as the process of being motivated is
based on the satisfaction derived from the behavior itself, at the other hand, extrinsic
motivation suggests that our behavior is designed to please others rather than ourselves
to get certain rewards. Bounds et al. (1995) describe that one of the deficiencies of
expectancy theory makes the managers think that all kind of behavior is motivated by
extrinsic rewards.
Figure 2 summarizes the difference between intrinsic and extrinsic motivation:
Figure 2 Differences between Intrinsic and Extrinsic Motivation
(Bounds et al., 1995)
AAccttiivviittyy iiss
iittss oowwnn
rreewwaarrdd
AAccttiivviittyy ggeenneerraatteess
rreewwaarrddss
ccoonnttrroolllleedd bbyy
ootthheerrss
Intrinsic Motivation Extrinsic Motivation
Yecenia Rivera Ortiz & Nghi Tran 2007© - 16 -
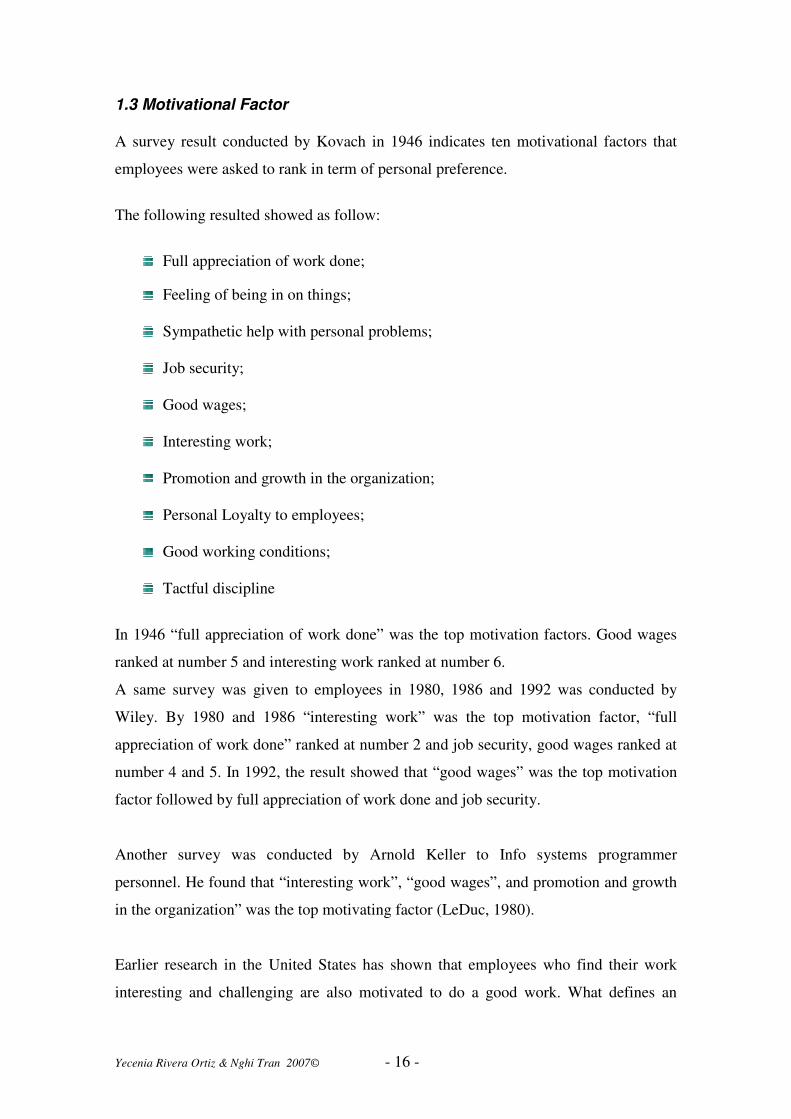
1.3 Motivational Factor
A survey result conducted by Kovach in 1946 indicates ten motivational factors that
employees were asked to rank in term of personal preference.
The following resulted showed as follow:
Full appreciation of work done;
Feeling of being in on things;
Sympathetic help with personal problems;
Job security;
Good wages;
Interesting work;
Promotion and growth in the organization;
Personal Loyalty to employees;
Good working conditions;
Tactful discipline
In 1946 “full appreciation of work done” was the top motivation factors. Good wages
ranked at number 5 and interesting work ranked at number 6.
A same survey was given to employees in 1980, 1986 and 1992 was conducted by
Wiley. By 1980 and 1986 “interesting work” was the top motivation factor, “full
appreciation of work done” ranked at number 2 and job security, good wages ranked at
number 4 and 5. In 1992, the result showed that “good wages” was the top motivation
factor followed by full appreciation of work done and job security.
Another survey was conducted by Arnold Keller to Info systems programmer
personnel. He found that “interesting work”, “good wages”, and promotion and growth
in the organization” was the top motivating factor (LeDuc, 1980).
Earlier research in the United States has shown that employees who find their work
interesting and challenging are also motivated to do a good work. What defines an

Yecenia Rivera Ortiz & Nghi Tran 2007© - 17 -
interesting or challenging work can only be done by the employee himself. It could be
the possibility to work with technical opportunities, to expand their knowledge and so
forth (Ferratt, 1999).
1.4 Motivation through Financial Incentive
According to Dubrin (2004), the motivation through financial incentive include:
Linking pay to performance, stock option and gain sharing.
Linking pay to performance: Linking pay to performance generally motivates
people to work harder. Ratings are viewed by managers on employee
development, team productivity, and leadership. Merit pay for both individuals
and the team is based on actual results. Merit pay runs from 5 percent to over 15
percent of total compensation.
Stock Option: Stock options give the employees the right to purchase certain of
company shares in the future at the specified price. Stock options also are used
to attract and retain employees, as well as reward them. For example, many IT
workers in Silicon Valley became rich or millionaires with their stock option.
Gain sharing is a formal and win-win program that allows employees to participate
financially in the productivity, both the employer and the employee benefit from
increased productivity, thus enhancing motivation.
In the future and in today’s global organizations motivation could no longer depend on
traditional leadership. It is more likely that motivation and leadership will rise from
within groups and in the interaction with coworkers rather than from executives. There
is already evidence to support this development (Latham and Ernst et al., 2006).
1.5 Individual Factors and Motivation
According to Colin Pitts (1995) there are some forms of recognition that really only
work for individuals including personal skills and promotion. With personal skill, the
individuals feel motivated having given chance to show his personal talent in the wider
area than his normal work groups. Colin Pitts debates effectiveness of promotion as a
factor of individual recognition.
Yecenia Rivera Ortiz & Nghi Tran 2007© - 18 -
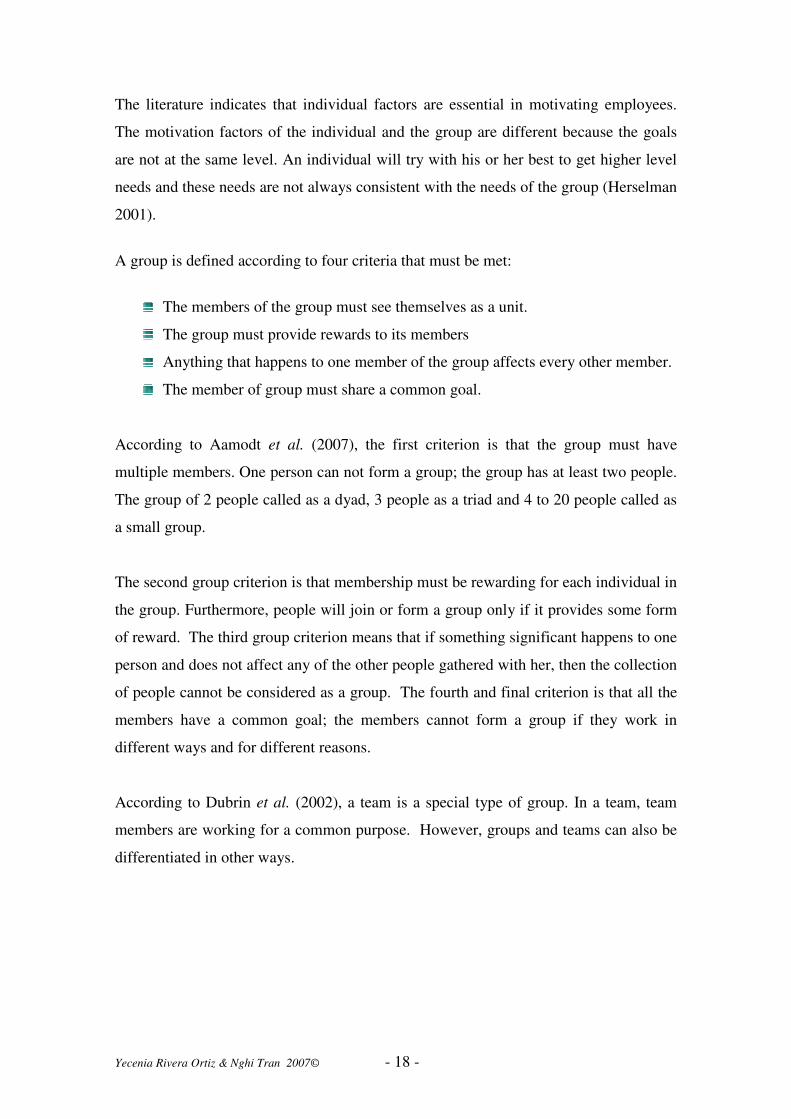
The literature indicates that individual factors are essential in motivating employees.
The motivation factors of the individual and the group are different because the goals
are not at the same level. An individual will try with his or her best to get higher level
needs and these needs are not always consistent with the needs of the group (Herselman
2001).
A group is defined according to four criteria that must be met:
The members of the group must see themselves as a unit.
The group must provide rewards to its members
Anything that happens to one member of the group affects every other member.
The member of group must share a common goal.
According to Aamodt et al. (2007), the first criterion is that the group must have
multiple members. One person can not form a group; the group has at least two people.
The group of 2 people called as a dyad, 3 people as a triad and 4 to 20 people called as
a small group.
The second group criterion is that membership must be rewarding for each individual in
the group. Furthermore, people will join or form a group only if it provides some form
of reward. The third group criterion means that if something significant happens to one
person and does not affect any of the other people gathered with her, then the collection
of people cannot be considered as a group. The fourth and final criterion is that all the
members have a common goal; the members cannot form a group if they work in
different ways and for different reasons.
According to Dubrin et al. (2002), a team is a special type of group. In a team, team
members are working for a common purpose. However, groups and teams can also be
differentiated in other ways.

Yecenia Rivera Ortiz & Nghi Tran 2007© - 19 -
The difference between groups and team is shown below in Table 1:
Groups Teams
Strong, clearly focused leader Team leader shares leadership roles
Individual accountability Individual and mutual accountability
Individual work-products Deliver actual joint work products
Runs efficient meetings
Encourages open-ended discussion and
full participation in problem solving
Table 1: Difference between groups and teams (Dubrin et al., 2002)
According to Dubrin et al. (2002), there are four representative of work team: cross
function team, top management team, affinity group, and virtual team.
Cross function team: A cross function team is a work group composed of workers from
different specialties who come together to fulfill a task. In order to perform well on a
cross-function team, a person should have to think and contribute for his organization
rather than his or her own specialty.
Top management team: Top management team is a group of managers/executives
working together within the same organization. However, this kind of team sometimes
has difficult to get good cooperation and team spirit because of strong personalities and
the members in the team have their own agenda.
Affinity group: Affinity group is a group composed of professional –level (or
knowledge) workers who work as self-directing and has a formal charter.
Virtual team: A virtual team is a small group of people who conduct almost of their
collaborative work by electronic communication rather than face to face meeting. For
example in high-tech or IT companies have been conducted virtual team nowadays.
In conclusion, in order to get motivation and strong satisfaction in the workplace, the
individual should like the job what is doing, and he or she also believe that he or she

Yecenia Rivera Ortiz & Nghi Tran 2007© - 20 -
make a good contribution for the company or organization. The employee also feels
that the job is challenging and demanding. The manager of the company should give
the job suitable with her or him capability and responsibility. He or she also gets
recognition from his or her contribution for a company.
In order to get motivation for a team or group, the team member also should trust their
manager, they also feel the job they are doing is interesting and meaningful, and the
team members also get the reward and recognition with their effort and contribution for
the company or organization. Team members have also mutual respect each other. The
company also provide good working environment for the team, group and individual to
work.
In attempt to motivate, employers can use rewards and recognition to motivate
employees.
1.6 Rewarding
According to Colin Pitts et al. (1995) reward is the benefit that arise from performing a
task, rendering a service or discharging a responsibility. In general, the principal reward
is pay. Besides the pay, employers also quite often offer the whole reward package that
include not only wages and salaries but many other rewards such as bonus, pension
scheme, health insurance, allocated cars, and mortgage assistance, beneficial loans,
subsidized meals, and profit sharing, share schemes, share options and so on.
There are two kinds of rewards including: intrinsic rewards and extrinsic rewards.
Intrinsic rewards are the satisfaction or accomplishment an employee gets from the job
itself. For example, an employee works overtime because he or she likes the job that he
or she is doing. He or she also motivates with the challenging project, the opportunities
for learning and personal growth from the project (Pitts et al., 1995).
A survey of IT professionals working in state agencies and universities of Louisiana,
USA, conducted in 2002, showed that employees were mostly satisfied with intrinsic
factors, such as: the technical aspects of the work and working with new technologies,
the intellectual challenge and creativity require to solve complex technical problems,
Yecenia Rivera Ortiz & Nghi Tran 2007© - 21 -
the constant learning and master skills related to new technologies, and a sense of
contribution and pride in their accomplishment. (Pawlowski, 2005)
Extrinsic rewards are rewards an employee gets from the employer such as praise,
money, a promotion, or benefits, etc. For example, an employee works overtime
because he or she wants to get more money or overtime payment (Pitts et al., 1995).
A survey also shows that the employees also satisfied with extrinsic factors, such as
working environment, their co-workers and the professional work climate, benefits, job
securities and flexible/normal work hours (Pawlowski et al., 2005). Another study
performed by Baer (2003), showed that extrinsic rewards were positive for employees
occupying simple jobs and negative for employees having jobs that were difficult and
challenging.
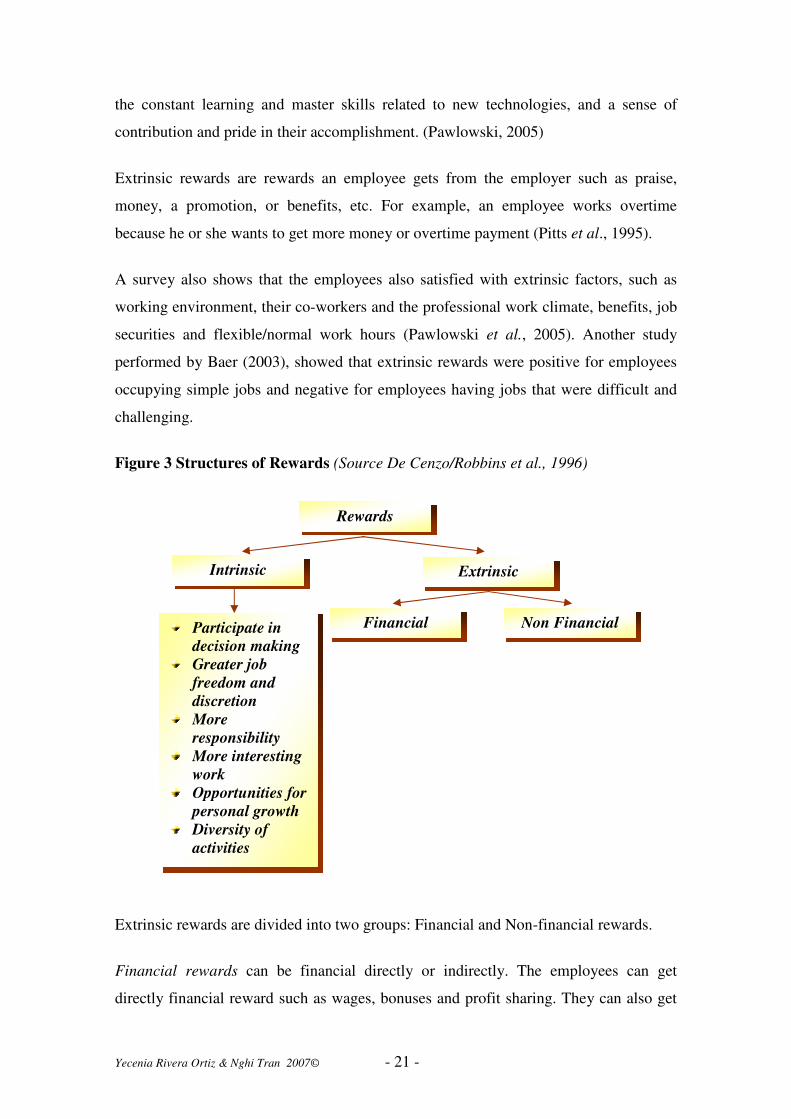
Figure 3 Structures of Rewards (Source De Cenzo/Robbins et al., 1996)
Extrinsic rewards are divided into two groups: Financial and Non-financial rewards.
Financial rewards can be financial directly or indirectly. The employees can get
directly financial reward such as wages, bonuses and profit sharing. They can also get
Financial Participate in
decision making
Greater job
freedom and
discretion
More
responsibility
More interesting
work
Opportunities for
personal growth
Diversity of
activities
Non Financial
Extrinsic
Rewards
Intrinsic

Yecenia Rivera Ortiz & Nghi Tran 2007© - 22 -
indirectly supportive benefits such as pension plans, paid vacations, paid sick leaves
and purchase discounts. (De Cenzo/Robbins et al, 1996)
Research shows that some employees are motivated by financial rewards and that
money is a strong motivator for them. A survey that was conducted in Malaysian
organizations found that most of the employees prefer to have a cash reward. (Rafikul,
2004).
Non-financial rewards such as having lunch with the boss of the company or preferred
lunch hours, receiving the office furnishing, having a change to work with congenial
colleagues, and achieving a desired work assignments or an assignments where the
worker can operate without close supervision. Non-monetary rewards can help to build
feelings of confidence and satisfaction in the employees. Research has revealed that
non-monetary awards may be more rewarding than monetary awards to many
employees (De Cenzo/Robbins et al., 1996).
According to a survey conducted in 2000 by Watson Wyatt to 410 North American
companies and 3,600 of their top performers, the survey found that three commonly
used non-monetary rewards by employers include advancement opportunities (76
percent), flexible work schedules (73 percent), and opportunities to learn new skills (68
percent) (Rowe, 2001).
1.7 Recognition
Recognition is also a strong motivator, because it is a normal human need to long for.
Dubrin et al. (2004) states that ‘motivating others by giving them recognition and
praise can be considered a direct application of positive reinforcement’. Studies
conducted since 50 years ago have indicated that employees welcome praise for a job
well done as much as they welcome a regular paycheck (Dubrin et al., 2004).
Recognizing an employee can be seen as expressing appreciation for his or her efforts,
is a good and positive practice for both parts (Bowen, 2000). Recognition must be
consistent, given in a regular basis, and most important, part of the organization.
There are two kinds of recognitions: informal recognitions and formal recognitions.
Informal recognition can be described as an individual thing. It could be from a work
partner to another, from a manager to his or her subordinate.
Yecenia Rivera Ortiz & Nghi Tran 2007© - 23 -
Bowen et al. (2000) underlines some examples of informal recognition, as follows:
Time off with pay
Lunch “on the house”
Cards and letters for all occasions (Birthdays, Thank You Notes)
Certificates for outstanding service, ideas, top productivity (giving the extra
mile)
Formal Recognitions are concentrated from an organizational achievement perspective,
where employees are recognized when they achieve organizational objectives, when
they meet performance goals, solving departmental organizational problems (Bowen et
al., 2000).
Bowen states that compared with informal recognition, the formal recognition
programs lean to:
Look out over longer time horizons
Incorporate benchmarks, e.g., years of services or achievements, profit
objectives, etc.
Be performed-based
Focus on the value of the organization, e.g., employee commitment, market
appreciation, investor loyalty, etc.
Be connected with the organization’s compensation programs
Involve both reward and risk
Planned, rather than spontaneous
Nelson (2004) argues that formal recognition programs are an ‘anachronism’. He
suggests a more informal and collaborative approach.
In the IT sector, investigations has shown successful practices, where providing a
persistent and accurate feedback to IT staff, recognition and tangible rewards develops
the teamwork spirit, and makes an achievement of balance between an individual’s
professional and personal identity (Agarwal, 1998). Agarwal and Ferratt found in their
investigation that further than financial compensations, Chief Information Officers

Yecenia Rivera Ortiz & Nghi Tran 2007© - 24 -
made clear that the importance for additional recognition practices, some of which can
be “low cost and highly effective such as birthday cards and welcome baskets”.
1.8 Motivation within IT-organizations
Motivating IT-professionals has been, and still are troublesome for management and
need further attention (Bennett, 2006).
Evidence support that job satisfaction is important among IT-professionals and one
crucial ingredient to retain employees (Bennett et al., 2006; Ferratt, 1999). Job
satisfaction can be improved by non-monetary (intrinsic) motivation. Non-monetary
motivation appears to have a direct effect on IT-professionals job satisfaction and their
commitment to the organization they are working for. On the other hand, non-monetary
motivation does not appear to have a great importance to improve IT-professionals
autonomy. It is suggested that management can use skill variation as a motivator and
improve job satisfaction (Bennett et al., 2006).
Monetary and hygiene factors also appear to have an important influence upon IT-
professional and their job satisfaction. It is suggested that these factors also can have a
positive impact upon retention and creativity. IT-professionals have a high need for
growth and development and it is therefore important to future investigate motivation
among IT-professionals. It has not fully been investigated what monetary or non-
monetary factors IT-professionals prefer. It is important to investigate how IT-
professionals want to be motivated but also to compare if there are differences between
IT-professionals concerning their tasks and positions (Bennett et al., 2006).
Due to cultural differences between societies, groups and countries it is difficult to
generalize individual factors concerning motivation (Herselman et al., 2001). It is
therefore important to further investigate motivation factors for IT-professionals in
Scandinavia.

Yecenia Rivera Ortiz & Nghi Tran 2007© - 25 -
1.9 Research Objectives:
After studying in the literature review and earlier researches mentioned above, the
authors wanted to investigate the following hypotheses among employees in IT
organizations in Sweden and Finland:
H1: The most important motivational factor of IT professionals is a challenging and
interesting work, according to their own definition thereof.
H2: Individualized rewards and recognitions motivate an employee more than general
rewards and recognitions.
H3: Employees in the IT sector value non-monetary incentives more than monetary
incentives.
1.10 Limitations of the Research
Communication:
In performing our investigation we contacted a limited number of companies within the
IT-sector in Finland and Sweden. We relayed on the support of the management of
these companies to distribute and collect the questionnaires we sent to them. This is a
limitation though we do not have complete control of the data collection or any bias
that might have occurred during the data collection. There might have been a higher
amount of non-responding participants due to failure to follow or instructions.
Another limitation in this study was the distance between the authors who lives in
Sweden and Finland. The communication has not been a problem to maintain due to
communication by Microsoft messenger, Skype, email, university communication
software and effective teamwork.
Time:
The timeframe has been limited during the study period and have therefore been a
limitation to our study. With more time and preparations we could have performed a
wider study.

Yecenia Rivera Ortiz & Nghi Tran 2007© - 26 -
Budget:
Performing an empirical study usually needs funds for producing questionnaires, pay
for postal services etc. This study has also been limited by these costs to some extent. A
wider investigation would require more funding.
Inclusion criteria:
To only include employees who have been employed for more than two years could
have affected our result. This was done to assure that the employees have good
knowledge about the company they work with. Also, the probability to have received
some sort of reward or recognition is much higher. By not including employees with
lower years of employment we might have lost the possibility to see a different view
among these employees.
Factors of motivation:
Other limitation with this empirical study is that the area of motivation is a complicated
and divers arena. Our small study can not possible cover all aspects of the area of
motivation.

Yecenia Rivera Ortiz & Nghi Tran 2007© - 27 -
2 Research Methodology
In this chapter we will describe the research methodology for the data collection,
define the qualitative and quantitative approaches, and describe validity and reliability.
2.1 Method of Research Used
This thesis is an empirical research where both a quantitative and a qualitative research
design have been used. The benefit of a quantitative research design lets the researcher
to quantify the respondent’s answers towards certain variables, hypothesis or
demographic data to draw statistical conclusions and comparisons. This is one of the
foremost advantages of the quantitative design and a common design in scientific
reports and studies in all areas.
The quantitative design strives to be objective, to be logic, to conclude results of facts
and reason. It is often used for hypothetical testing studies and for this reason the
quantitative design has often been related as the true scientific method of research
(Ghauri, 2005). A quantitative methodology for our thesis is a logic step because we
intend to compare different motivational factors in relation to each other, towards
demographic data and our stated hypothesis. This could reveal patterns which would
verify or dement our stated hypothesis and therefore lead to new scientifically
conclusions.
The disadvantage of the quantitative method is the lack of the ability to understand the
respondent’s point of view. The qualitative research design, on the other hand has a
stronghold when investigating respondents feelings, opinions and other subjective
variables. Instead of a wide range of sampling, the study often intends to reach depth
and to explore a phenomena or problem in its natural environment to achieve
understanding (Ghauri et al., 2005). A qualitative research method in our thesis could
increase the likelihood that we can retrieve the respondent’s true opinions on
motivational and rewarding factors. We feel that this is essential and necessary to reach
an understanding to be able to improve motivation of employees.
Yecenia Rivera Ortiz & Nghi Tran 2007© - 28 -
2.2 Data collection
The data in this thesis was collected through questionnaires (Appendix B). These
questionnaires were constructed according to this thesis hypothesis and purpose. The
questionnaire was constructed of four parts; demographic data, rewarding factors,
recognition factors, and motivational factors.
The questions were constructed as multiple choice questions and open questions. The
multiple choice questions represent the quantitative research method and the open
questions represent the qualitative research method.
2.3 Validity and Reliability
According to Easterby-Smith (2002), expressions like validity and reliability were
originally used in quantitative science. These two concepts are used to discuss the
trustworthiness of the research that has been done. It is essential to underline these
elements when an investigation has been performed since it shows an understanding of
possible lacks and faults of a study. These concepts can also be applied in qualitative
research, where the researcher is committed to provide a faithful description of others’
understandings and opinions (Easterby-Smith et al., 2002).
Validity refers to how exactly a scientific investigation is carried out and how accurate
the instruments and methods are, according to the purpose of the study. To study what
you really intended to study and nothing else. The instrument is a key factor in
scientific investigations that will inflict upon the purpose of the study if it is not
constructed in an adequate way. To prevent this, many instruments such as
questionnaires are tested to verify that they measure what they are supposed to do. This
can also be done for qualitative studies and by using the following question: “Has the
researcher achieved full access to the knowledge and meanings of the informants?”
(Easterby-Smith et al., 2002).
Reliability is a common word used in scientific literature. Its meaning and purpose is to
describe how trustworthy the collected data is and the methods by which they have
been collected. A high level of reliability can not exist if the validity is low. Accurate
measuring is necessary to achieve high reliability. To determine the reliability the
Yecenia Rivera Ortiz & Nghi Tran 2007© - 29 -
following question can be of use: “Will similar observations be made by different
researchers on different occasions?” (Easterby-Smith et al., 2002).
2.4 Respondents and Sampling Procedures
The organizations that were investigated are within the Information Technology (IT)
sector. The amount of employees expected to be investigated were 150 employees in
total from Sweden and Finland. For Sweden, the companies that allowed us to perform
our investigation were Sony Ericsson AB in Hässleholm and Conagri AB in Malmö.
For Finland, the company Sesca Technologies OY located in Kokkola was the
company that let us carried out our investigation.
Sony Ericsson made a merge in 2002 between Sony Corporation, the Japanese
consumer electronics and with Ericsson, the Swedish telecommunications company.
Sony Ericsson AB is a leading international company with approximately 8,000
employees’ worldwide. Sony Ericsson is today the second most profitable phone maker
and has accomplished this because of its growth in high end mobile phone market
(Wikipedia, 2007c). Today Hässleholm’s division count with 84 employees and is
located in the center of the city.
Sesca Technologies OY was found in 1998 and is located in Kokkola, Finland. Their
business line is specializing in Software Design. Sesca offers IT and a
telecommunications service to different enterprises, between those services includes:
comprehensive project management, configuration, design, execution and testing of
systems, applications, and solutions. Today, Kokkola’s division count with 150
employees (Sesca, 2007).
In 2007 Conagri AB celebrated their 20 years of foundation. Conagri develops and deal
with IT systems for information management. That includes everything from
developing unique systems through consulting and building infrastructure to operation
and support. Conagri counts with approximately 145 employees in all Sweden, but
Yecenia Rivera Ortiz & Nghi Tran 2007© - 30 -
Malmö’s Headquarters count with 50 employees. Today Conagri AB is owned by
Swedish Farmers Supply and Crop Marketing Association (51%) and Scan AB (49%),
(Conagri 2007).
Our inclusion criteria for the employees that were included in our investigation was that
the respondents must be more than 18 years old; able to write and read in English, and
employed with the target company for more than two years, in order to have good
knowledge of the organization. It was also important that the respondents were willing
to participate in our study. Statistical presentation was performed for the multiple-
choice questions using the program Microsoft Excel and Qualitative analysis for the
open questions.
Yecenia Rivera Ortiz & Nghi Tran 2007© - 31 -
3 Presentation of Data
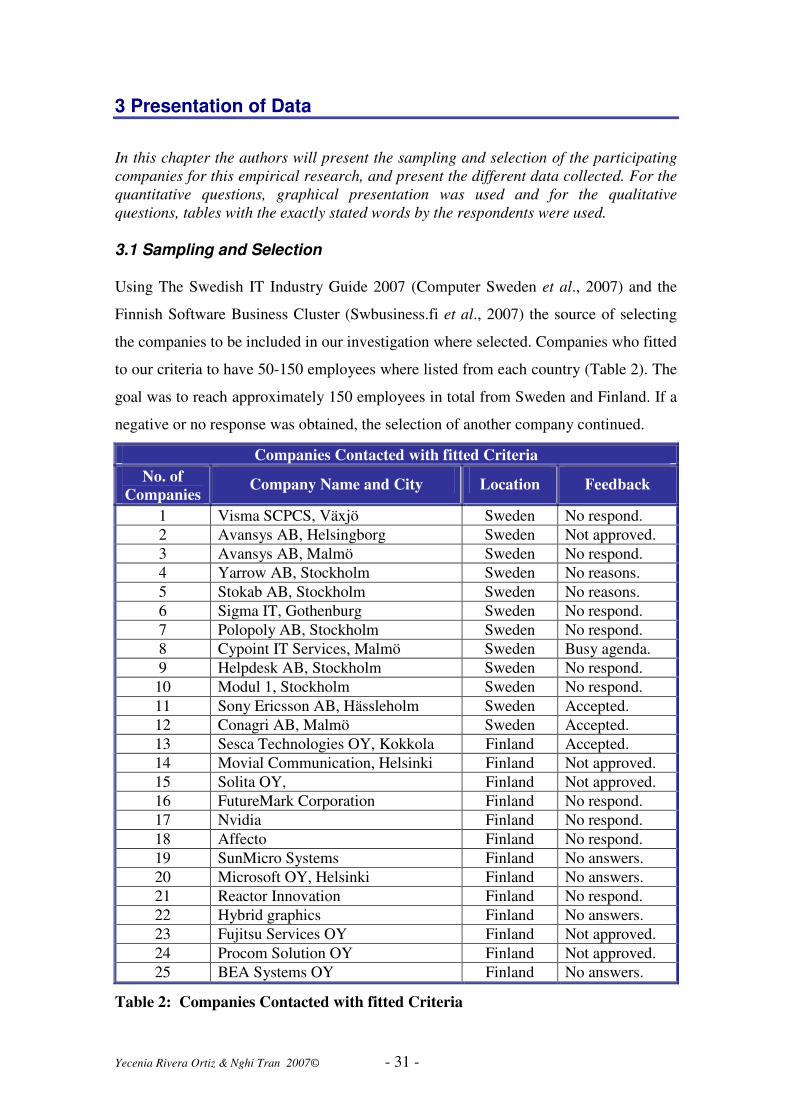
In this chapter the authors will present the sampling and selection of the participating
companies for this empirical research, and present the different data collected. For the
quantitative questions, graphical presentation was used and for the qualitative
questions, tables with the exactly stated words by the respondents were used.
3.1 Sampling and Selection
Using The Swedish IT Industry Guide 2007 (Computer Sweden et al., 2007) and the
Finnish Software Business Cluster (Swbusiness.fi et al., 2007) the source of selecting
the companies to be included in our investigation where selected. Companies who fitted
to our criteria to have 50-150 employees where listed from each country (Table 2). The
goal was to reach approximately 150 employees in total from Sweden and Finland. If a
negative or no response was obtained, the selection of another company continued.
Companies Contacted with fitted Criteria
No. of
Companies Company Name and City Location Feedback
1 Visma SCPCS, Växjö Sweden No respond.
2 Avansys AB, Helsingborg Sweden Not approved.
3 Avansys AB, Malmö Sweden No respond.
4 Yarrow AB, Stockholm Sweden No reasons.
5 Stokab AB, Stockholm Sweden No reasons.
6 Sigma IT, Gothenburg Sweden No respond.
7 Polopoly AB, Stockholm Sweden No respond.
8 Cypoint IT Services, Malmö Sweden Busy agenda.
9 Helpdesk AB, Stockholm Sweden No respond.
10 Modul 1, Stockholm Sweden No respond.
11 Sony Ericsson AB, Hässleholm Sweden Accepted.
12 Conagri AB, Malmö Sweden Accepted.
13 Sesca Technologies OY, Kokkola Finland Accepted.
14 Movial Communication, Helsinki Finland Not approved.
15 Solita OY, Finland Not approved.
16 FutureMark Corporation Finland No respond.
17 Nvidia Finland No respond.
18 Affecto Finland No respond.
19 SunMicro Systems Finland No answers.
20 Microsoft OY, Helsinki Finland No answers.
21 Reactor Innovation Finland No respond.
22 Hybrid graphics Finland No answers.
23 Fujitsu Services OY Finland Not approved.
24 Procom Solution OY Finland Not approved.
25 BEA Systems OY Finland No answers.
Table 2: Companies Contacted with fitted Criteria
Yecenia Rivera Ortiz & Nghi Tran 2007© - 32 -
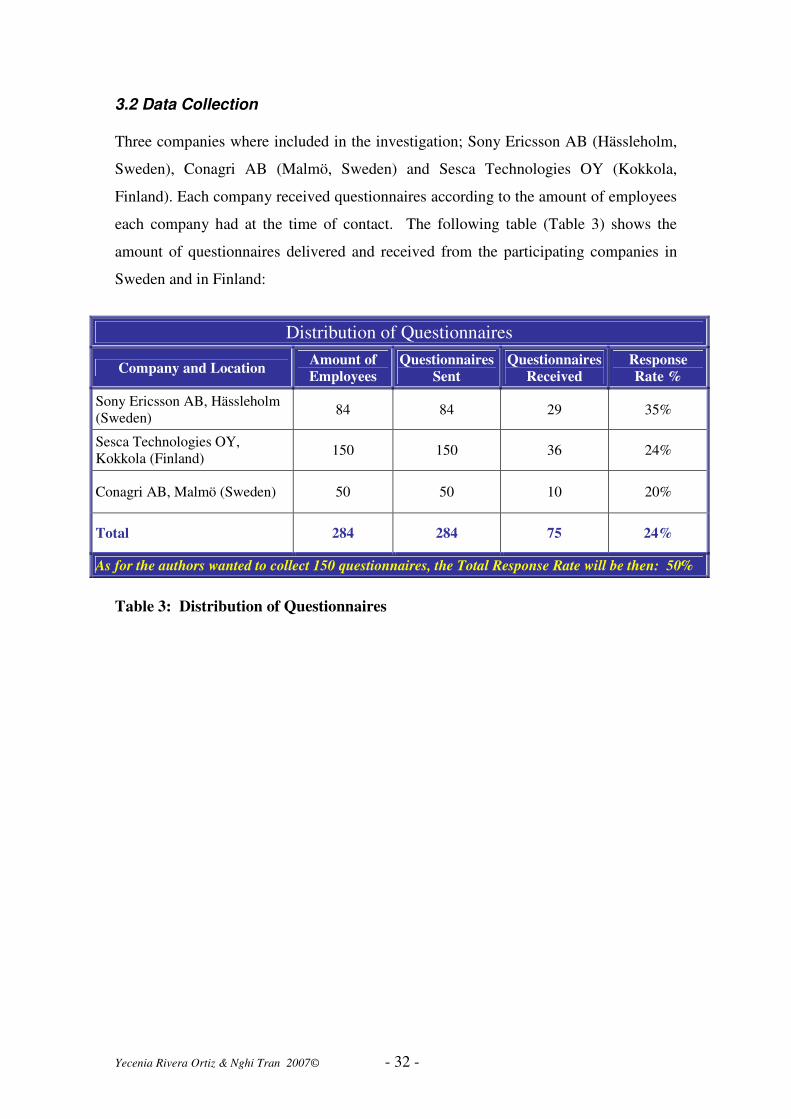
3.2 Data Collection
Three companies where included in the investigation; Sony Ericsson AB (Hässleholm,
Sweden), Conagri AB (Malmö, Sweden) and Sesca Technologies OY (Kokkola,
Finland). Each company received questionnaires according to the amount of employees
each company had at the time of contact. The following table (Table 3) shows the
amount of questionnaires delivered and received from the participating companies in
Sweden and in Finland:
Distribution of Questionnaires
Company and Location Amount of
Employees
Questionnaires
Sent
Questionnaires
Received
Response
Rate %
Sony Ericsson AB, Hässleholm
(Sweden) 84 84 29 35%
Sesca Technologies OY,
Kokkola (Finland) 150 150 36 24%
Conagri AB, Malmö (Sweden) 50 50 10 20%
Total 284 284 75 24%
As for the authors wanted to collect 150 questionnaires, the Total Response Rate will be then: 50%
Table 3: Distribution of Questionnaires
Yecenia Rivera Ortiz & Nghi Tran 2007© - 33 -
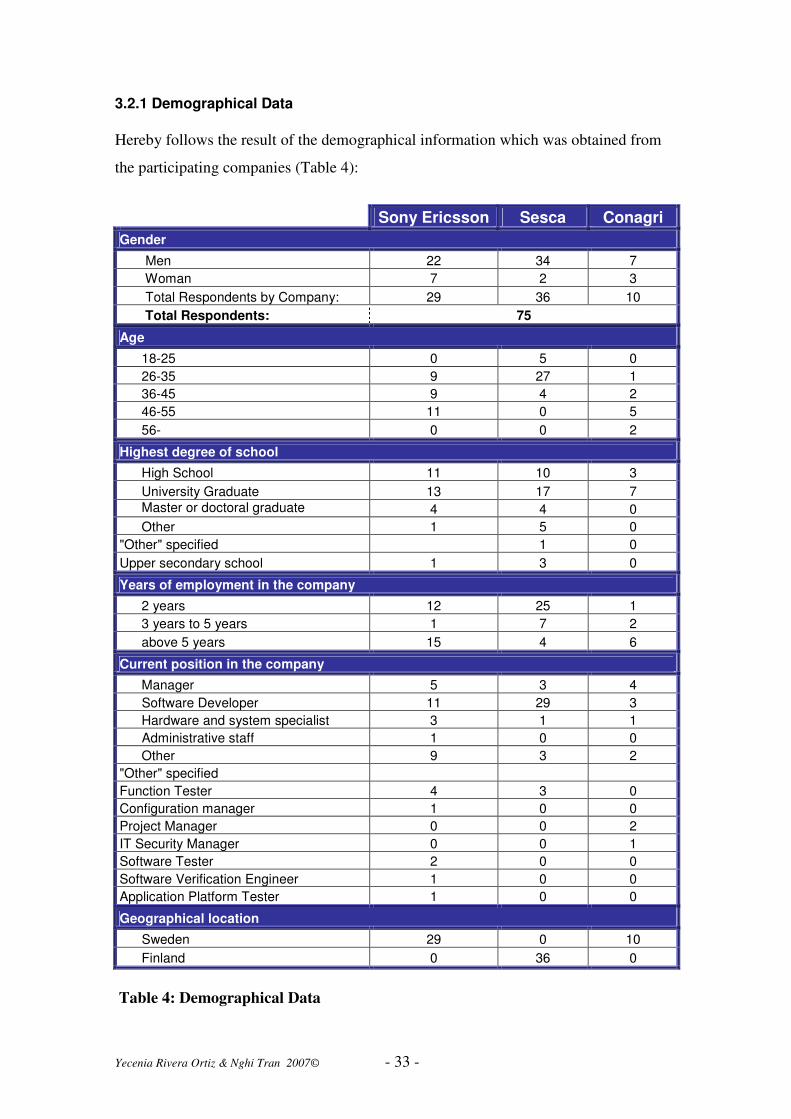
3.2.1 Demographical Data
Hereby follows the result of the demographical information which was obtained from
the participating companies (Table 4):
Sony Ericsson Sesca Conagri
Gender
Men 22 34 7
Woman 7 2 3
Total Respondents by Company: 29 36 10
Total Respondents: 75
Age
18-25 0 5 0
26-35 9 27 1
36-45 9 4 2
46-55 11 0 5
56- 0 0 2
Highest degree of school
High School 11 10 3
University Graduate 13 17 7
Master or doctoral graduate 4 4 0
Other 1 5 0
"Other" specified 1 0
Upper secondary school 1 3 0
Years of employment in the company
2 years 12 25 1
3 years to 5 years 1 7 2
above 5 years 15 4 6
Current position in the company
Manager 5 3 4
Software Developer 11 29 3
Hardware and system specialist 3 1 1
Administrative staff 1 0 0
Other 9 3 2
"Other" specified
Function Tester 4 3 0
Configuration manager 1 0 0
Project Manager 0 0 2
IT Security Manager 0 0 1
Software Tester 2 0 0
Software Verification Engineer 1 0 0
Application Platform Tester 1 0 0
Geographical location
Sweden 29 0 10
Finland 0 36 0
Table 4: Demographical Data
Yecenia Rivera Ortiz & Nghi Tran 2007© - 34 -
The demographic information reveals a high quantity of men. The males constitutes
84 % (n=63) of the respondents and the women 16% (n=12).
In the aspect of age, the majority of the respondents, 49 % (n=37) are within the age
range of 26-35 years. Within the age range of 36-45 years constitutes of 20 % (n= 15)
and within 46-55 years, 21% (n=16). The minority of the respondents belong to the
younger population of 18-25 years, 7 % (n=5) and the senior population of 56 years and
over, 3% (n=2).
The majority of the women, 42% (n=5) where in the age range of 36-45 years, where as
for the majority of the men, 54% (n=34) were in the age range of 26-35 years. 17%
(n=11) of the men where found in the age range of 36-45 and 19% (n=12) where in the
age range of 46-55 years. 33% (n=4) of the women where in the age range of 46-55
years, but no women where over 55 years old. A minority of the men 6% (n=4) and
women 8% (n=1) where in the age range of 18-25 years old. The oldest population of
56 years and over where of men only, 3% (n=2).
Most of the participants, 49% (n=37) have a university education. Secondly, 32%
(n=24) of the respondents have high school as highest level of education. 11% (n=8)
have master or doctoral degree. Respondents with other level of education where 8%
(n=6) and the majority of these possesses upper secondary school education.
The participating women where equally divided to 33% (n=4) for high school, 33%
(n=4) university education and 33% (n=4) master/doctoral degree. No women stated
“other education”. The majority of the men 51% (n=32) had university degree, 32%
(n=20) had high school education and only 8% (n=5) had master/doctoral degree. 10 %
of the men stated “Other education” where upper secondary school was mostly
recorded.
The time of employment with the company shows that 51% (n=38) had an employment
of 2 years. 33% (n=25) had an employment of more than 5 years and 13% (n=10) of 3-
5 years. 3 % (n=2) did not respond to the question.
Yecenia Rivera Ortiz & Nghi Tran 2007© - 35 -
3% (n=2) of the women did not state their duration of employment. Most women 42%
(n=5) where employed for more than 5 years where as for the men only, 32% (n=20)
where employed for more than 5 years. 33% (n=4) of the women had an employment
duration of 2 years where as for the men, 54% (n=34) had an employment of 2 years.
8% (n=1) of the women and 14% (n=9) of the men had an employment duration of 3-5
years.
The positions held by the participants constitutes of 57% (n=43) Software Developers,
16% (n=12) Managers, 7 % (n=5) Hardware and System Specialists, 1%
Administrative Staff and 19% (n=14) of other positions than mentioned above. Among
these, the position of Function Tester where most common.
62% (n=39) of the men and 33% (n=4) of the women where assigned as software
developer. 25% (n=3) of the women where managers where as for the men only 14%
(n=9) where managers. 17% (n=2) of the women where hardware and system
specialists and for men only 5% (n=3). 17% of the women (n=2) and 19% (n=12) of the
men filed “other position”. In this area the position as function tester was most
common.
The geographical information shows that 52 % (n=39) are from Sweden and 48%
(n=36) is from Finland.

Yecenia Rivera Ortiz & Nghi Tran 2007© - 36 -
3.2.2 Hypothesis 1
“The most important motivational factor of IT-Professionals is a challenging and
interesting work, according to their own definition thereof”.
The Questions 11, 12, 14, 16, and 18 were related to Hypothesis 1.
Question 11: “Arrange the following motivational factors in order of your preference
from 1-10, where 1 represents the best type of motivational factor and 10 represent the
least best type of motivational factor”. (Graphic 1)
0
200
400
600
800Question 11
Sony Ericsson 172 163 78 120 107 211 163 110 187 265
Sesca 208 199 97 189 128 265 183 155 224 295
Conagri 64 54 21 37 32 73 69 48 68 84
Total Points 444 416 196 346 267 549 415 313 479 644
V1 V2 V3 V4 V5 V6 V7 V8 V9 V10
Variables:
V1: Job Security
V2: Promotion and growth in the organization
V3: Challenging and Interesting Work
V4: Full appreciation of work done
V5: Pay and Benefits
V6: Physical Environment
V7: Work itself
V8: Relationships with Co-workers
V9: Achievement
V10: Company Policy and Administration
Graphic 1: Lowest total of points is the most preferable variable which was
“Challenging and Interesting Work”. This was followed by “Pay and Benefits” and
“Relationships with Co-workers”.

Yecenia Rivera Ortiz & Nghi Tran 2007© - 37 -
Question 12: “What factors motivates you to do a good work?”
(Table 5)
Sony Ericsson
Sesca Conagri Totals
Valid F* % F* % F* % F* %
Interesting Work/Task 9 31 9 25 1 10 19 25
Appreciation 4 14 1 3 1 10 6 8
Being a part-off 1 3 0 0 0 0 1 1
To demonstrate competence 1 3 0 0 0 0 1 1
Pay and Benefits/Salary/Money 3 10 2 6 0 0 5 7
New exciting things/Challenging task/Challenge work
1 3 3 8 2 20 6 8
Job satisfaction 1 3 0 0 0 0 1 1
Feedback 2 7 0 0 0 0 2 3
Good co-workers/Relationship with co-workers 3 10 7 19 0 0 10 13
No answer 4 14 9 25 3 30 16 21
Independent tasks, responsibility/Responsibility
0 0 1 3 1 10 2 3
Encouraging working environment 0 0 1 3 0 0 1 1
Salary Raise 0 0 1 3 0 0 1 1
Promotion and growth 0 0 1 3 0 0 1 1
Meaningful goals 0 0 1 3 0 0 1 1
Good work 0 0 0 0 1 10 1 1
Satisfied customer 0 0 0 0 1 10 1 1
Totals 29 100 36 100 10 100 75 100
F* (Frequency)
Table 5: According to the respondents the most frequently repeated answers were
“Intresting work” 25% (n=19), “No answer” 21% (n=16) and “Good co-workers/
Relationship with co-workers” with 13% (n=10).

Yecenia Rivera Ortiz & Nghi Tran 2007© - 38 -
Question 14: “Are you motivated to do a good work?” (Graphic 3)
0
10
20
30
40
50
Question 14
Sony Ericsson 0 16 14
Sesca 0 21 16
Conagri 0 4 6
Total 0 41 36
Not at all To some extent Yes, always
Graphic 3: 54% (n=41) of the participants showed that “To some extent” they are
motivated to do a good work, as per 48% (n=36) showed that are always motivated.
Question 16: “What factors do you consider as motivating?” (Table 7)
Sony Ericsson
Sesca Conagri Totals
Valid F* % F* % F* % F* %
Interesting and Challenging tasks/work 3 10 11 31 3 30 17 23
Salary/Wage/Pay or benefits/Money 7 24 5 14 0 0 12 16
Feedback/Positive feedback 2 7 1 3 0 0 3 4
Clear goal 1 3 0 0 0 0 1 1
Personal goal 1 3 0 0 0 0 1 1
Verbally, cheering talk 1 3 0 0 0 0 1 1
Appreciation 6 21 1 3 1 10 8 11
To demonstrate competence/Opportunities to prove oneself
1 3 1 3 0 0 2 3
Good environment/Good working environment 1 3 4 11 0 0 5 7
Co-workers 1 3 2 6 0 0 3 4
Gift 1 3 0 0 0 0 1 1
No answer 4 14 4 11 4 40 12 16
Bonus 0 0 1 3 0 0 1 1
Promotion 0 0 1 3 0 0 1 1
Satisfaction and excitement 0 0 1 3 0 0 1 1
Achievement promising results in a project 0 0 1 3 0 0 1 1
Encouragement 0 0 1 3 0 0 1 1
Good management 0 0 1 3 0 0 1 1
Responsibility and trust from employer 0 0 1 3 0 0 1 1
Yecenia Rivera Ortiz & Nghi Tran 2007© - 39 -
Sony Ericsson
Sesca Conagri Totals
Valid F* % F* % F* % F* %
Responsibility 0 0 0 0 1 10 1 1
Freedom to organize the work 0 0 0 0 1 10 1 1
Totals 29 100 36 100 10 100 75 100
F* (Frequency)
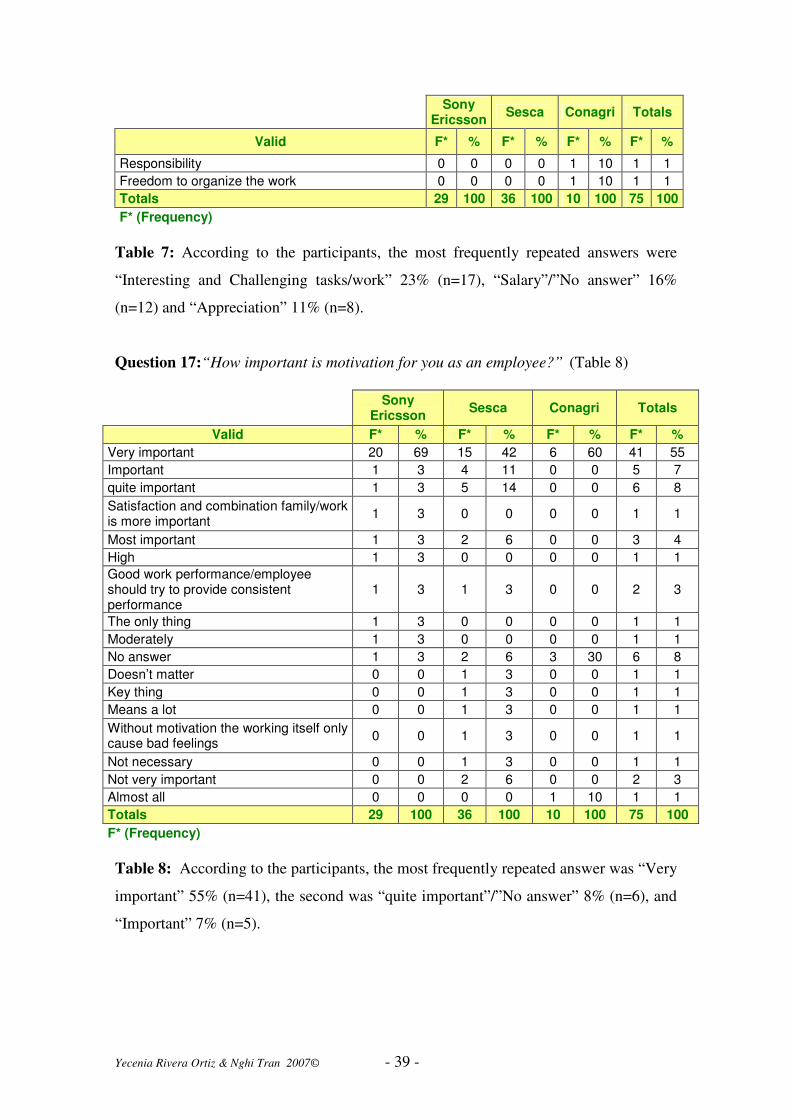
Table 7: According to the participants, the most frequently repeated answers were
“Interesting and Challenging tasks/work” 23% (n=17), “Salary”/”No answer” 16%
(n=12) and “Appreciation” 11% (n=8).
Question 17:“How important is motivation for you as an employee?” (Table 8)
Sony Ericsson
Sesca Conagri Totals
Valid F* % F* % F* % F* %
Very important 20 69 15 42 6 60 41 55
Important 1 3 4 11 0 0 5 7
quite important 1 3 5 14 0 0 6 8
Satisfaction and combination family/work is more important
1 3 0 0 0 0 1 1
Most important 1 3 2 6 0 0 3 4
High 1 3 0 0 0 0 1 1
Good work performance/employee should try to provide consistent performance
1 3 1 3 0 0 2 3
The only thing 1 3 0 0 0 0 1 1
Moderately 1 3 0 0 0 0 1 1
No answer 1 3 2 6 3 30 6 8
Doesn’t matter 0 0 1 3 0 0 1 1
Key thing 0 0 1 3 0 0 1 1
Means a lot 0 0 1 3 0 0 1 1
Without motivation the working itself only cause bad feelings
0 0 1 3 0 0 1 1
Not necessary 0 0 1 3 0 0 1 1
Not very important 0 0 2 6 0 0 2 3
Almost all 0 0 0 0 1 10 1 1
Totals 29 100 36 100 10 100 75 100
F* (Frequency)
Table 8: According to the participants, the most frequently repeated answer was “Very
important” 55% (n=41), the second was “quite important”/”No answer” 8% (n=6), and
“Important” 7% (n=5).
Yecenia Rivera Ortiz & Nghi Tran 2007© - 40 -
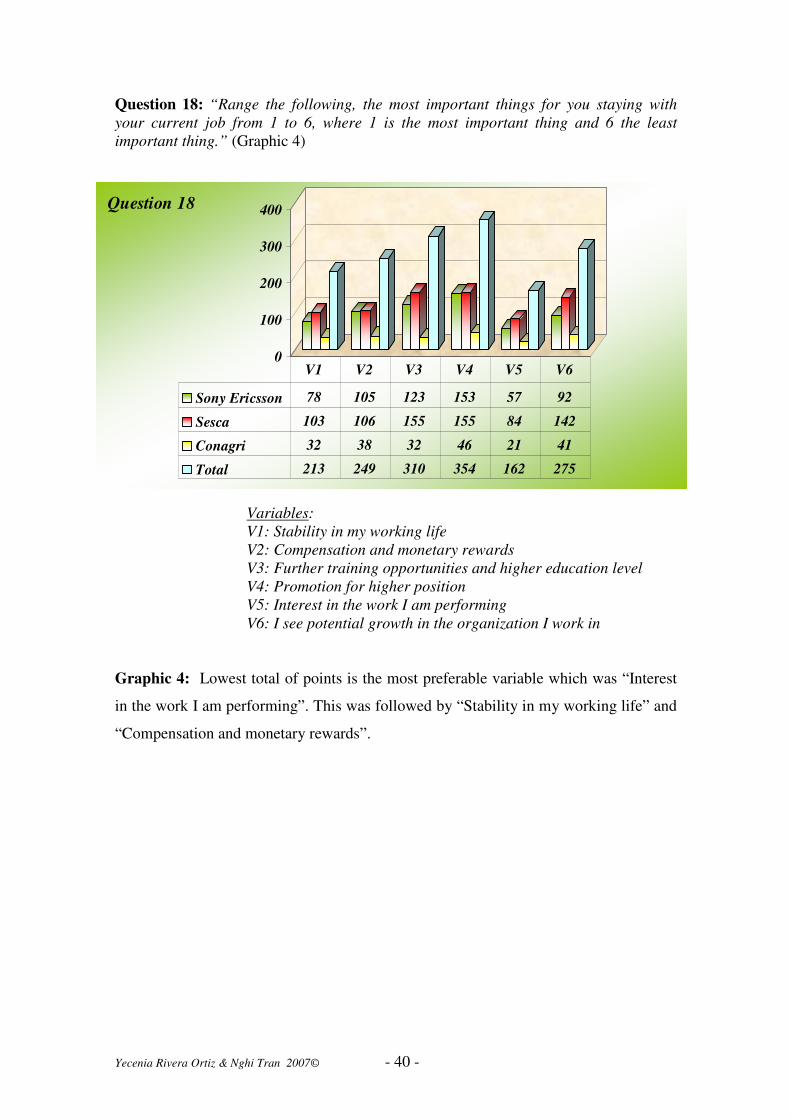
Question 18: “Range the following, the most important things for you staying with
your current job from 1 to 6, where 1 is the most important thing and 6 the least
important thing.” (Graphic 4)
0
100
200
300
400Question 18
Sony Ericsson 78 105 123 153 57 92
Sesca 103 106 155 155 84 142
Conagri 32 38 32 46 21 41
Total 213 249 310 354 162 275
V1 V2 V3 V4 V5 V6
Variables:
V1: Stability in my working life
V2: Compensation and monetary rewards
V3: Further training opportunities and higher education level
V4: Promotion for higher position
V5: Interest in the work I am performing
V6: I see potential growth in the organization I work in
Graphic 4: Lowest total of points is the most preferable variable which was “Interest
in the work I am performing”. This was followed by “Stability in my working life” and
“Compensation and monetary rewards”.

Yecenia Rivera Ortiz & Nghi Tran 2007© - 41 -
3.2.3 Hypothesis 2
“Individualized rewards and recognitions motivate an employee more than general
rewards and recognitions”.
The Questions 1, 2, 3, 4, 5, 7, 8, 9, 10, 13 and 15 were related to Hypothesis 2.
Question 1: “Arrange the following rewards in order of your preference from 1-10,
where 1 represent the best reward and 10 the least best reward”. (Graphic 5)
0
200
400
600
800Question 1
Sony Ericsson 167 156 245 75 119 143 103 178 163 246
Sesca 209 277 270 78 154 166 136 180 209 297
Conagri 62 62 73 23 32 43 44 74 54 83
Total 438 495 588 176 305 352 283 432 426 626
V1 V2 V3 V4 V5 V6 V7 V8 V9 V10
Variables:
V1: Share Options
V2: Pension Plans
V3: Beneficial Loans
V4: Job Satisfaction
V5: Intellectual Challenge and Creativity
V6: Training for Professional Development
V7: Paid Vacation
V8: Christmas Bonus
V9: Participation in Decision Making
V10: Other
Graphic 5: Lowest total of points is the most preferable variable which was “Job
Satisfaction”. This was followed by “Paid Vacations” and “Intellectual Challenge and
Creativity”.

Yecenia Rivera Ortiz & Nghi Tran 2007© - 42 -
Question 2: “What is the Best Reward you have received?” (Table 9)
Sony Ericsson
Sesca Conagri Totals
Valid F* % F* % F* % F* %
Working Abroad 1 3 0 0 0 0 1 1
Verbal Recognition 3 10 0 0 0 0 3 4
Stocks Options/Share Options 6 21 0 0 2 20 8 11
Bonus 5 17 15 42 2 20 22 29
Salary Raise/High Salary 6 21 2 6 2 20 10 13
Bottle of Wine 1 3 0 0 0 0 1 1
Flower in their Birthday 1 3 0 0 0 0 1 1
No Answers 6 21 10 28 2 20 18 24
Good Support from Supervisors and Trainings
0 0 1 3 0 0 1 1
Job Satisfaction 0 0 2 6 0 0 2 3
Paid Vacation 0 0 2 6 0 0 2 3
Merit Pay 0 0 2 6 0 0 2 3
Money 0 0 2 6 0 0 2 3
Use Free Car 0 0 0 0 1 10 1 1
Responsibility 0 0 0 0 1 10 1 1
Totals 29 100 36 100 10 100 75 100
F* (Frequency)
Table 9: Shows that the best rewards the respondents have received are “Bonus” 29%
(n=22), “No answers” 24% (n=18) and “Salary Raise/High Salary” 13% (n=10).
Question 3: “How do you receive your rewards from your employer?” (Graphic 6)
0
20
40Question 3
Sony Ericsson 7 6 13 3
Sesca 9 3 22 2
Conagri 4 2 4 0
Total 20 11 39 5
V1 V2 V3 V4
Variables:
V1: As a group/team
V2: To me personally
V3: Both in person and as group/team
V4: Other
Yecenia Rivera Ortiz & Nghi Tran 2007© - 43 -
Graphic 6: 52% (n=39) of the respondents showed that “Both in person and as
group/team” is the way they receive rewards from their employer. 38% (n=20) of the
respondents showed that “As a group/team” is the way they receive rewards from their
employer. The last least two variables were Variable 2 (To me personally) which was
15% (n=11) and Variable 4 (Other) which was 6% (n=5).
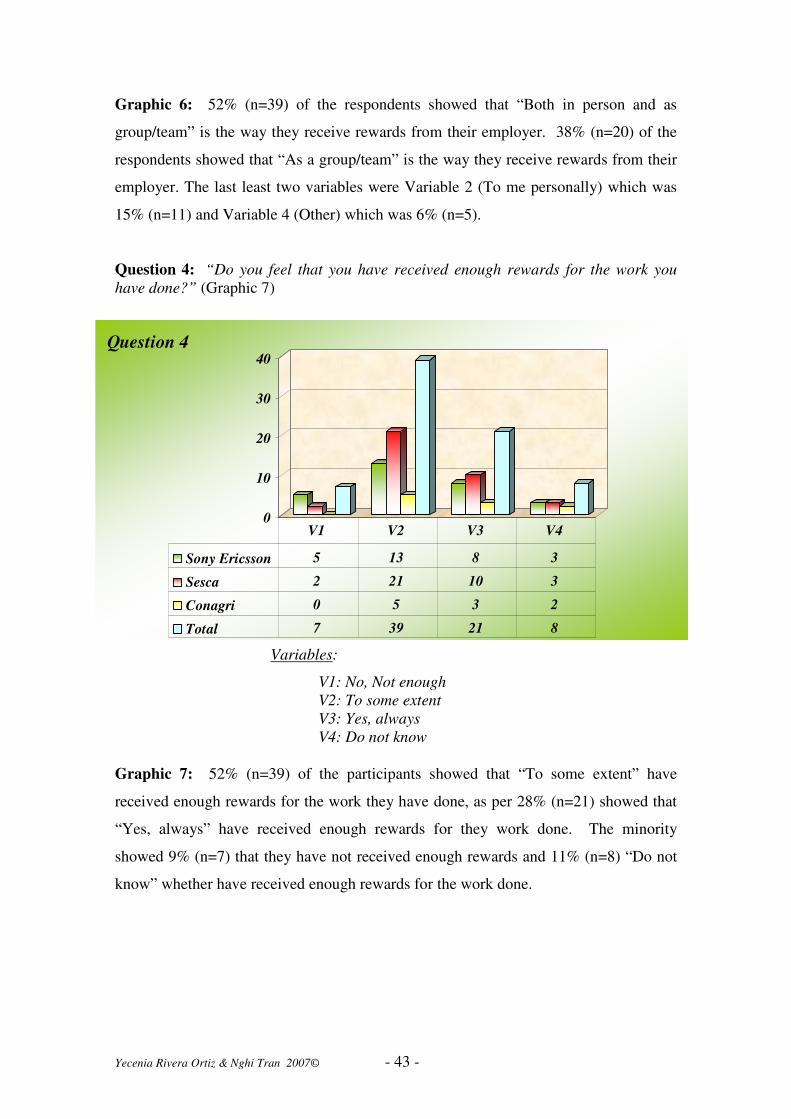
Question 4: “Do you feel that you have received enough rewards for the work you
have done?” (Graphic 7)
0
10
20
30
40Question 4
Sony Ericsson 5 13 8 3
Sesca 2 21 10 3
Conagri 0 5 3 2
Total 7 39 21 8
V1 V2 V3 V4
Variables:
V1: No, Not enough
V2: To some extent
V3: Yes, always
V4: Do not know
Graphic 7: 52% (n=39) of the participants showed that “To some extent” have
received enough rewards for the work they have done, as per 28% (n=21) showed that
“Yes, always” have received enough rewards for they work done. The minority
showed 9% (n=7) that they have not received enough rewards and 11% (n=8) “Do not
know” whether have received enough rewards for the work done.

Yecenia Rivera Ortiz & Nghi Tran 2007© - 44 -
Question 5: “How would you like to be rewarded when you have done a Good Work?”
(Table 10)
Sony Ericsson
Sesca Conagri Totals
Valid F* % F* % F* % F* %
Pay Raise/Salary Raise 6 21 7 19 0 0 13 17
Free Time/Time off' 2 7 0 0 0 0 2 3
Monetary Benefits/Bonus 6 21 6 17 0 0 12 16
Stock/Share Options 1 3 0 0 1 10 2 3
Feedback/Positive feedback 6 21 7 19 4 40 17 23
Paid Dinner 2 7 0 0 0 0 2 3
Paid Vacation 1 3 0 0 0 0 1 1
Personal Awards 1 3 0 0 0 0 1 1
No Answer 4 14 8 22 5 50 17 23
Encourage 0 0 1 3 0 0 1 1
Extra Payoff 0 0 2 6 0 0 2 3
Vacation 0 0 3 8 0 0 3 4
Variation in the Tasks 0 0 1 3 0 0 1 1
Career Development 0 0 1 3 0 0 1 1
Totals 29 100 36 100 10 100 75 100
F* (Frequency)
Table 10: 23% (n=17) would like to be rewarded with positive feedback from their
employer. Half of the participants did not answer this question 23% (n=17) gave “No
answer”, and 17% (n=13) would like “Pay Raise/Salary Raise.
Question 7: “What is the Best Recognition you have received?” (Table 11)
Sony Ericsson
Sesca Conagri Totals
Valid F* % F* % F* % F* %
Movie Tickets 1 3 0 0 0 0 1 1
Role As Manager 2 7 0 0 0 0 2 3
Verbal Positive Feedback 7 24 9 25 4 40 20 27
Lunch on the House 2 7 3 8 0 0 5 7
Promotion 1 3 0 0 0 0 1 1
Bonus 1 3 3 8 0 0 4 5
Don't Know 1 3 0 0 0 0 1 1
Nothing 2 7 3 8 0 0 5 7
Share Option 1 3 0 0 0 0 1 1
A Bottle of Wine 1 3 1 3 1 10 3 4
No Answer 10 34 7 19 4 40 21 28
Employee Award 0 0 1 3 0 0 1 1
Salary Raise/Extra Salary 0 0 3 8 1 10 4 5
Gift from Employer 0 0 2 6 0 0 2 3
Time Off with Pay 0 0 1 3 0 0 1 1
Yecenia Rivera Ortiz & Nghi Tran 2007© - 45 -
Sony Ericsson
Sesca Conagri Totals
Valid F* % F* % F* % F* %
Trust to me Personally 0 0 1 3 0 0 1 1
Thank You Note 0 0 2 6 0 0 2 3
Totals 29 100 36 100 10 100 75 100
F* (Frequency)
Table 11: Shows that most of the respondents did not answer the question 28% (n=21),
followed by these, were 27% (n=20) respondents that have received “Verbal Positive
Feedback” as Recognition.
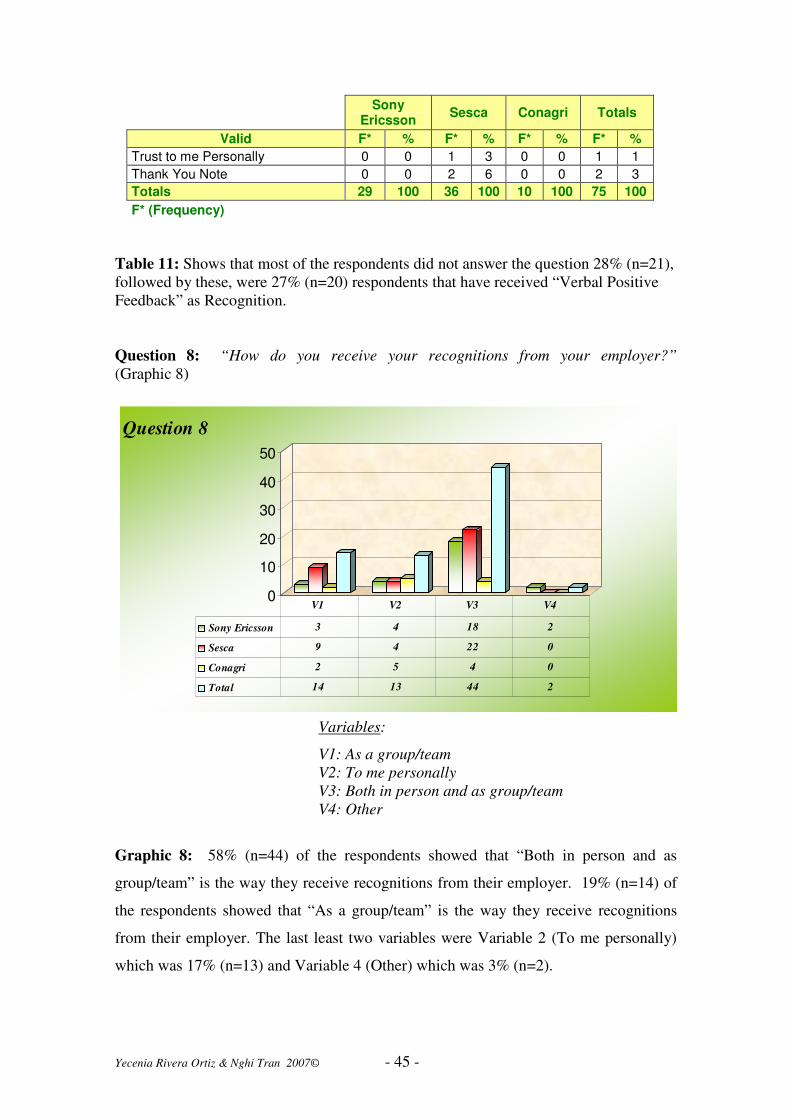
Question 8: “How do you receive your recognitions from your employer?”
(Graphic 8)
0
10
20
30
40
50
Question 8
Sony Ericsson 3 4 18 2
Sesca 9 4 22 0
Conagri 2 5 4 0
Total 14 13 44 2
V1 V2 V3 V4
Variables:
V1: As a group/team
V2: To me personally
V3: Both in person and as group/team
V4: Other
Graphic 8: 58% (n=44) of the respondents showed that “Both in person and as
group/team” is the way they receive recognitions from their employer. 19% (n=14) of
the respondents showed that “As a group/team” is the way they receive recognitions
from their employer. The last least two variables were Variable 2 (To me personally)
which was 17% (n=13) and Variable 4 (Other) which was 3% (n=2).
Yecenia Rivera Ortiz & Nghi Tran 2007© - 46 -
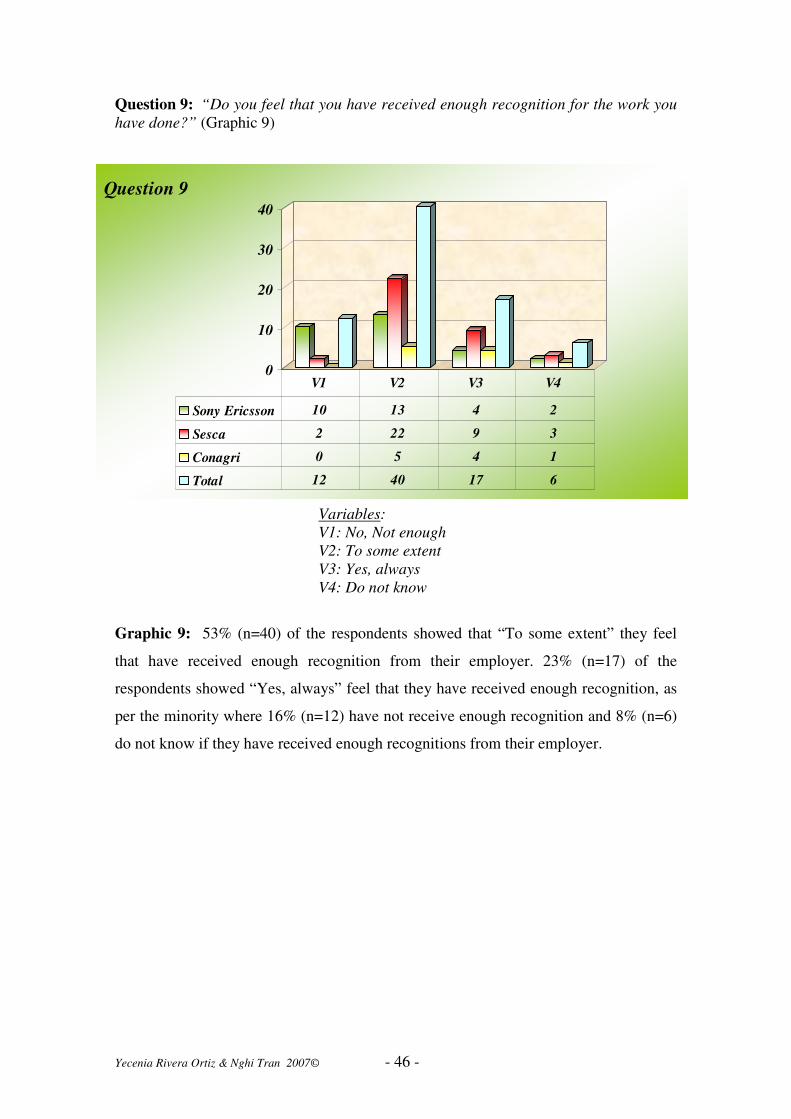
Question 9: “Do you feel that you have received enough recognition for the work you
have done?” (Graphic 9)
0
10
20
30
40
Question 9
Sony Ericsson 10 13 4 2
Sesca 2 22 9 3
Conagri 0 5 4 1
Total 12 40 17 6
V1 V2 V3 V4
Variables:
V1: No, Not enough
V2: To some extent
V3: Yes, always
V4: Do not know
Graphic 9: 53% (n=40) of the respondents showed that “To some extent” they feel
that have received enough recognition from their employer. 23% (n=17) of the
respondents showed “Yes, always” feel that they have received enough recognition, as
per the minority where 16% (n=12) have not receive enough recognition and 8% (n=6)
do not know if they have received enough recognitions from their employer.
Yecenia Rivera Ortiz & Nghi Tran 2007© - 47 -
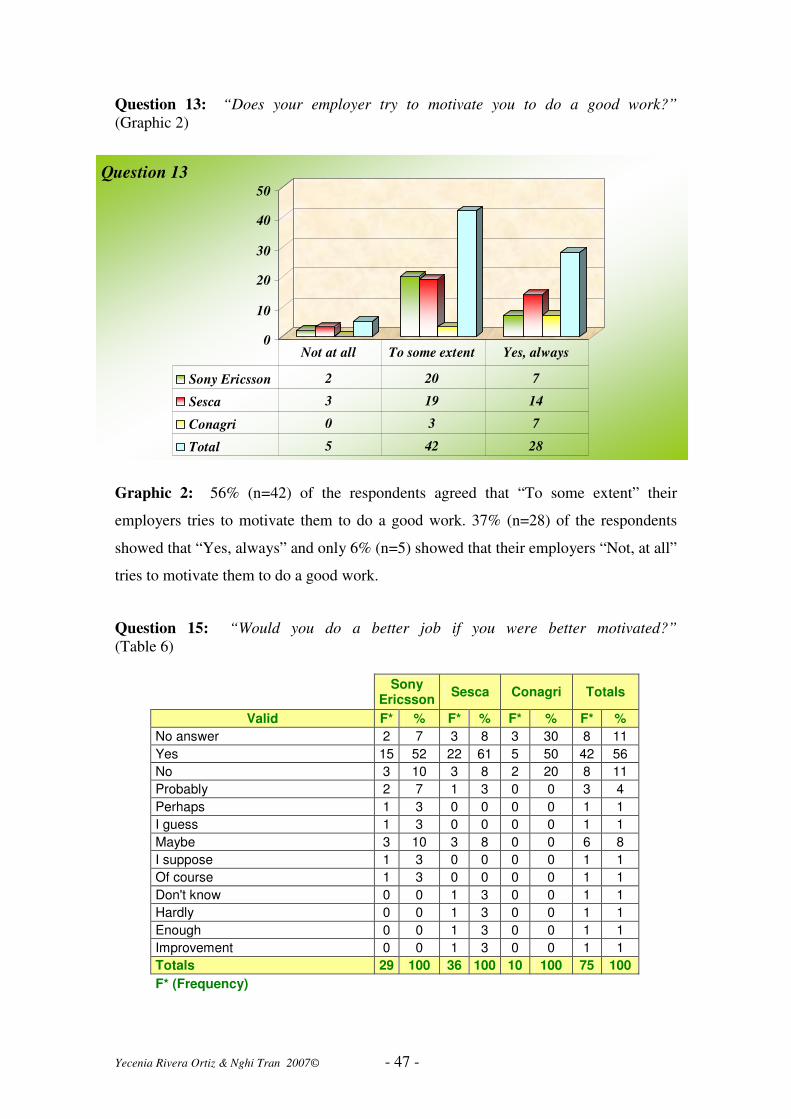
Question 13: “Does your employer try to motivate you to do a good work?”
(Graphic 2)
0
10
20
30
40
50
Question 13
Sony Ericsson 2 20 7
Sesca 3 19 14
Conagri 0 3 7
Total 5 42 28
Not at all To some extent Yes, always
Graphic 2: 56% (n=42) of the respondents agreed that “To some extent” their
employers tries to motivate them to do a good work. 37% (n=28) of the respondents
showed that “Yes, always” and only 6% (n=5) showed that their employers “Not, at all”
tries to motivate them to do a good work.
Question 15: “Would you do a better job if you were better motivated?”
(Table 6)
Sony Ericsson
Sesca Conagri Totals
Valid F* % F* % F* % F* %
No answer 2 7 3 8 3 30 8 11
Yes 15 52 22 61 5 50 42 56
No 3 10 3 8 2 20 8 11
Probably 2 7 1 3 0 0 3 4
Perhaps 1 3 0 0 0 0 1 1
I guess 1 3 0 0 0 0 1 1
Maybe 3 10 3 8 0 0 6 8
I suppose 1 3 0 0 0 0 1 1
Of course 1 3 0 0 0 0 1 1
Don't know 0 0 1 3 0 0 1 1
Hardly 0 0 1 3 0 0 1 1
Enough 0 0 1 3 0 0 1 1
Improvement 0 0 1 3 0 0 1 1
Totals 29 100 36 100 10 100 75 100
F* (Frequency)
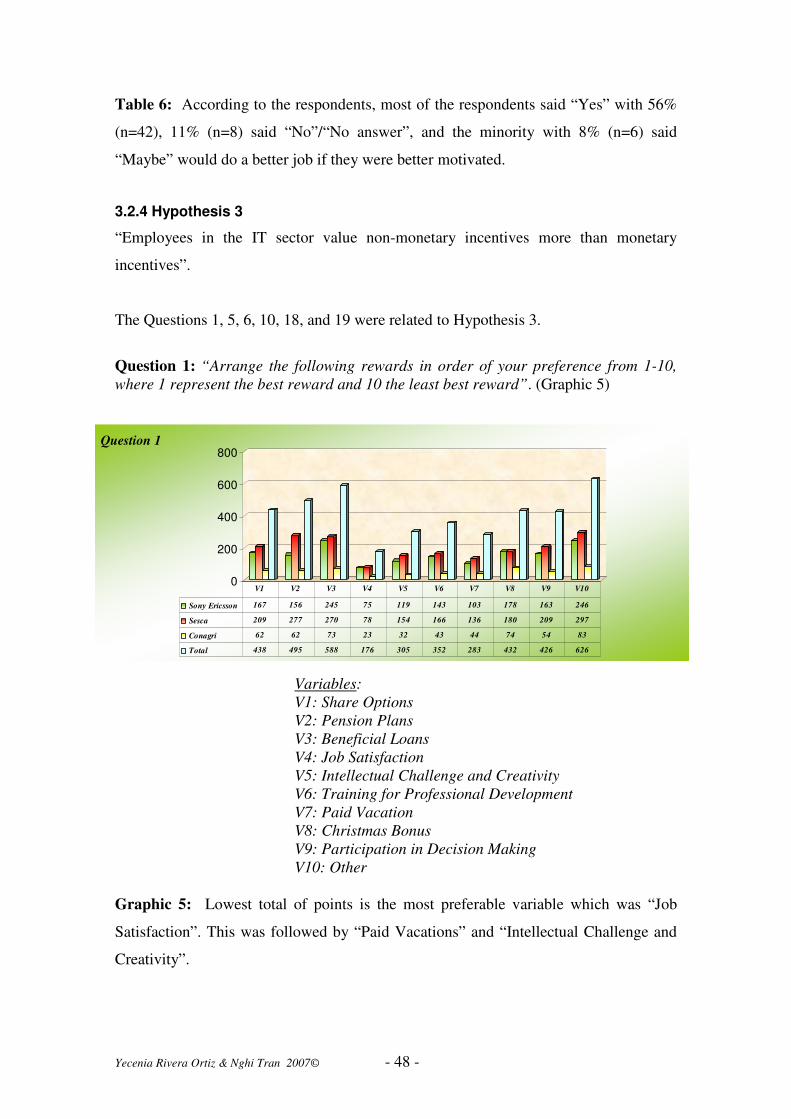
Yecenia Rivera Ortiz & Nghi Tran 2007© - 48 -
Table 6: According to the respondents, most of the respondents said “Yes” with 56%
(n=42), 11% (n=8) said “No”/“No answer”, and the minority with 8% (n=6) said
“Maybe” would do a better job if they were better motivated.
3.2.4 Hypothesis 3
“Employees in the IT sector value non-monetary incentives more than monetary
incentives”.
The Questions 1, 5, 6, 10, 18, and 19 were related to Hypothesis 3.
Question 1: “Arrange the following rewards in order of your preference from 1-10,
where 1 represent the best reward and 10 the least best reward”. (Graphic 5)
0
200
400
600
800Question 1
Sony Ericsson 167 156 245 75 119 143 103 178 163 246
Sesca 209 277 270 78 154 166 136 180 209 297
Conagri 62 62 73 23 32 43 44 74 54 83
Total 438 495 588 176 305 352 283 432 426 626
V1 V2 V3 V4 V5 V6 V7 V8 V9 V10
Variables:
V1: Share Options
V2: Pension Plans
V3: Beneficial Loans
V4: Job Satisfaction
V5: Intellectual Challenge and Creativity
V6: Training for Professional Development
V7: Paid Vacation
V8: Christmas Bonus
V9: Participation in Decision Making
V10: Other
Graphic 5: Lowest total of points is the most preferable variable which was “Job
Satisfaction”. This was followed by “Paid Vacations” and “Intellectual Challenge and
Creativity”.

Yecenia Rivera Ortiz & Nghi Tran 2007© - 49 -
Question 5: “How would you like to be rewarded when you have done a Good Work?”
(Table 10)
Sony Ericsson
Sesca Conagri Totals
Valid F* % F* % F* % F* %
Pay Raise/Salary Raise 6 21 7 19 0 0 13 17
Free Time/Time off' 2 7 0 0 0 0 2 3
Monetary Benefits/Bonus 6 21 6 17 0 0 12 16
Stock/Share Options 1 3 0 0 1 10 2 3
Feedback/Positive feedback 6 21 7 19 4 40 17 23
Paid Dinner 2 7 0 0 0 0 2 3
Paid Vacation 1 3 0 0 0 0 1 1
Personal Awards 1 3 0 0 0 0 1 1
No Answer 4 14 8 22 5 50 17 23
Encourage 0 0 1 3 0 0 1 1
Extra Payoff 0 0 2 6 0 0 2 3
Vacation 0 0 3 8 0 0 3 4
Variation in the Tasks 0 0 1 3 0 0 1 1
Career Development 0 0 1 3 0 0 1 1
Totals 29 100 36 100 10 100 75 100
F* (Frequency)
Table 10: 23% (n=17) would like to be rewarded with positive feedback from their
employer. Half of the participants did not answer this question 23% (n=17) gave “No
answer”, and 17% (n=13) would like “Pay Raise/Salary Raise.
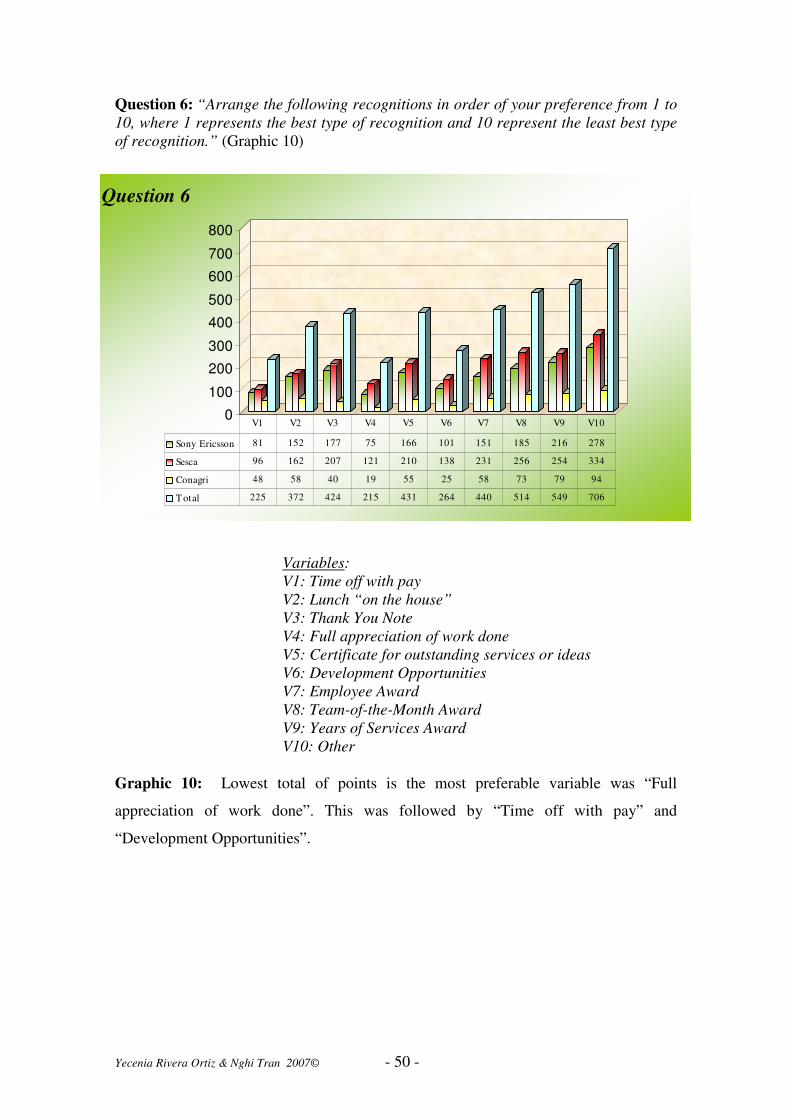
Yecenia Rivera Ortiz & Nghi Tran 2007© - 50 -
Question 6: “Arrange the following recognitions in order of your preference from 1 to
10, where 1 represents the best type of recognition and 10 represent the least best type
of recognition.” (Graphic 10)
Variables:
V1: Time off with pay
V2: Lunch “on the house”
V3: Thank You Note
V4: Full appreciation of work done
V5: Certificate for outstanding services or ideas
V6: Development Opportunities
V7: Employee Award
V8: Team-of-the-Month Award
V9: Years of Services Award
V10: Other
Graphic 10: Lowest total of points is the most preferable variable was “Full
appreciation of work done”. This was followed by “Time off with pay” and
“Development Opportunities”.
0
100
200
300
400
500
600
700
800
Question 6
Sony Ericsson 81 152 177 75 166 101 151 185 216 278
Sesca 96 162 207 121 210 138 231 256 254 334
Conagri 48 58 40 19 55 25 58 73 79 94
T otal 225 372 424 215 431 264 440 514 549 706
V1 V2 V3 V4 V5 V6 V7 V8 V9 V10
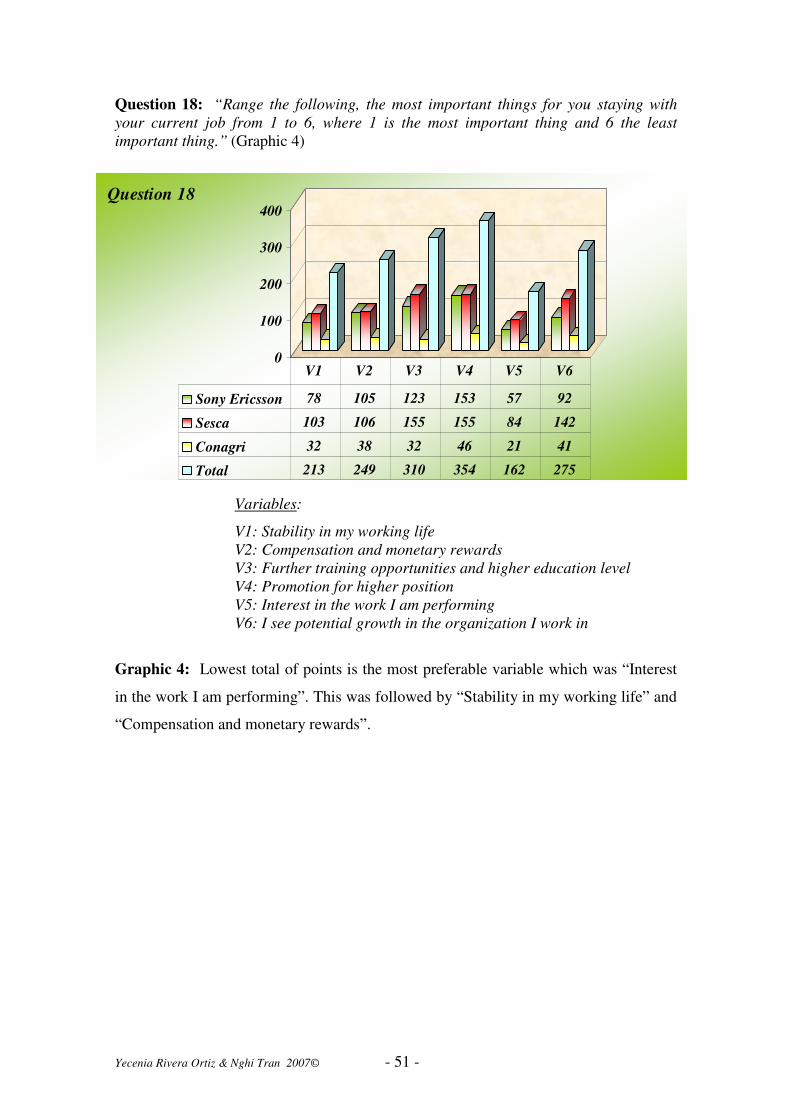
Yecenia Rivera Ortiz & Nghi Tran 2007© - 51 -
Question 18: “Range the following, the most important things for you staying with
your current job from 1 to 6, where 1 is the most important thing and 6 the least
important thing.” (Graphic 4)
0
100
200
300
400Question 18
Sony Ericsson 78 105 123 153 57 92
Sesca 103 106 155 155 84 142
Conagri 32 38 32 46 21 41
Total 213 249 310 354 162 275
V1 V2 V3 V4 V5 V6
Variables:
V1: Stability in my working life
V2: Compensation and monetary rewards
V3: Further training opportunities and higher education level
V4: Promotion for higher position
V5: Interest in the work I am performing
V6: I see potential growth in the organization I work in
Graphic 4: Lowest total of points is the most preferable variable which was “Interest
in the work I am performing”. This was followed by “Stability in my working life” and
“Compensation and monetary rewards”.
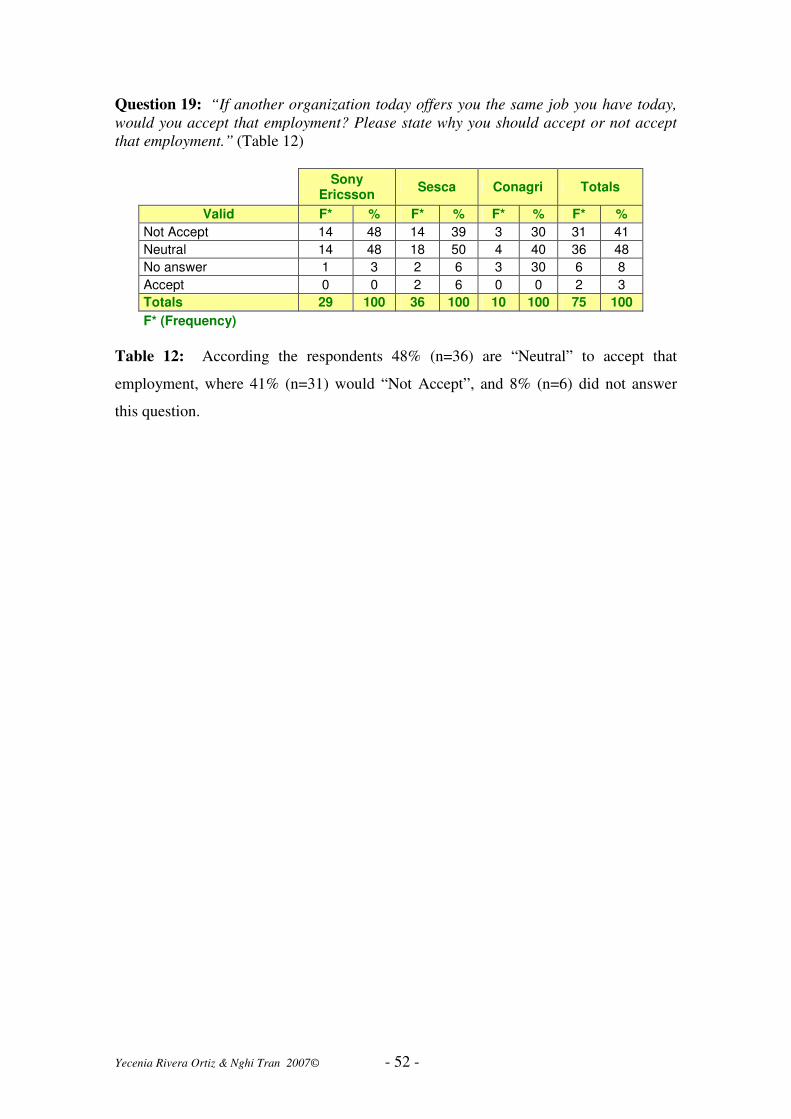
Yecenia Rivera Ortiz & Nghi Tran 2007© - 52 -
Question 19: “If another organization today offers you the same job you have today,
would you accept that employment? Please state why you should accept or not accept
that employment.” (Table 12)
Sony Ericsson
Sesca Conagri Totals
Valid F* % F* % F* % F* %
Not Accept 14 48 14 39 3 30 31 41
Neutral 14 48 18 50 4 40 36 48
No answer 1 3 2 6 3 30 6 8
Accept 0 0 2 6 0 0 2 3
Totals 29 100 36 100 10 100 75 100
F* (Frequency)
Table 12: According the respondents 48% (n=36) are “Neutral” to accept that
employment, where 41% (n=31) would “Not Accept”, and 8% (n=6) did not answer
this question.

Yecenia Rivera Ortiz & Nghi Tran 2007© - 53 -
4 Method Discussion
In this chapter, the authors discuss the method utilized in this empirical study. First, the
authors discuss the Selection of Participants, secondly the Logistics and
Communication with IT-organizations, thirdly they discuss the Questionnaire and
finally the Analysis of Data.
There are numerous variables that could have caused the low rate of response, which
we did not foresee when performing the study. Both researchers have limited
experience of empirical investigations and this might have been a contributing factor
when planning and performing the investigation. During the journey it was discovered
various benefits and disadvantages which some, but far from all, where foreseen.
4.1 Selection of Participants
The selection of the companies to participate in the study has not been a difficult task.
By utilizing the Swedish IT-industry Guide 2007 (Computer Sweden, 2007) and the
Finnish Software Business Cluster (Swbusiness.fi, 2007), it was a fairly easy task to
accomplish. The difficulty was to establish a communication with these companies and
their managers. All companies where contacted by phone or email and received a brief
presentation (Appendix A) and a polite request to perform the study. The request to
carry out the investigation has not been meet with ease, neither in Sweden nor in
Finland (Table 2). Some companies did not return our calls, messages or emails when
we tried to contact them which have been a frustrating and time consuming problem.
One can speculate in the reasons to why the acceptances of performing empirical
investigations are low and why we did not receive any response from some companies.
We did in fact receive the reason to why some of the companies did not wish to
participate in the study (Table 2).
4.2 Logistics & Communication
In communication with the companies it was said that their IT-professionals are often
on the move and it is not unusual that their work concerns stress, tight timetables and
travelling. This might also have had an impact on the response rate and no control over
who have received or not received the questionnaire. It has been out of the authors
control to distribute the questionnaires among the employees within the participating
companies. This responsibility has been taken by the managers of the companies. This

Yecenia Rivera Ortiz & Nghi Tran 2007© - 54 -
loss of control means that the distribution of the questionnaires leaves no guarantee that
all the employees of each participating company have received a questionnaire. The
authors live and study in different countries and the communication has therefore been
an important issue. This has been performed by utilizing internet communications tools
and telephone. Apart from minor difficulties and interference there have been no
problems of communications between the authors.
4.3 Questionnaire
Making the questionnaire in English only could have been a factor of great importance
concerning the response rate in this study. The knowledge and ability of reading and
understanding English could be varied from person to person, even in the IT-area. It
could be suspected that if the questionnaires had contained the native languages of
Swedish and Finish the response rate would be higher.
The authors are positive that our questionnaire has collected the information it intended
to do, assuming that the respondents understand English. It is the authors’ opinion that
the questions are logical to the purpose of this study and easy to understand. To
understand a question is essential to reach a correct answer. If the question is difficult
to understand, then this will affect the result significantly in a negative manner
(Burgess, 2001).
The questionnaire also includes a quantitative and a qualitative design which even
further elevates the accuracy to measure the selected variables (Ghauri et al., 2005).
This way the respondents have the ability to express them selves and share issues and
opinions that a multiple choice question can not. It is the authors’ opinion that the
questionnaire has a high level of accuracy to measure the intended variables. This is a
basic ingredient to reach high validity in scientific investigations (Ghauri et al., 2005).
4.4 Analysis of data
The material is not large enough to make and rely on calculation of statistical
significance and we have therefore excluded this part. Analysis of the demographic and
quantitative and qualitative data were done with Microsoft Excel where the answers
where added to the worksheets.
Yecenia Rivera Ortiz & Nghi Tran 2007© - 55 -
5 Discussion of Results
The findings in this study show that the respondents prefer a challenging and
interesting work. The same result has been found in earlier studies performed in the
United States who showed that the majority of the IT professionals feel that an
interesting and challenging work is an important motivational factor for performing a
good work (Ferratt, et al., 1999; LeDuc 1980; Gill et al., 2001; Agarwal et al., 1998).
Our conclusion is therefore that this hypothesis is true. A challenging and interesting
work is an important factor for IT-professionals to be motivated and to perform a good
work. By confirming this hypothesis it raises the question about what makes a
challenging and interesting work. This could of course depend upon several factors
such as age, gender, geographical location, position, level of education etc. It is our
opinion that this is a crucial task for the employers to investigate for maintaining the
level of motivation among their employees. It is also a topic for further research and
investigations.
It was also found that 62% of the respondents in this investigation are not fully satisfied
with how their employer tries to motivate them. This means that the employers still
have the opportunity to boost performance and quality of work and better to motivate
their employees. What further more support this, is that most of the respondents in this
study would do a better work if they where better motivated. To maintain motivation it
is according to Paré (et al., 2001), important that managers take care of their employees
in a manner that they feel appreciated for their knowledge and that they take an interest
in their individual careers and try to help them develop within the organization. It is
also important that the managers try to maintain their employees to feel worth fully.
Further research should be dedicated to investigate if the management in the IT-sector
really does take interest in the IT-professionals individual careers and career
development. Another crucial issue is that the management has to try and maintain a
good communication for constant flow of information and to make the employees feel
that they really are part of the organization (Ferratt, et al., 1999).
It is therefore logical that job satisfaction also becomes an important factor to be
motivated as an employee, which this investigation also indicates. These facts are
supported by others (Ferratt, et al., 2001; Bennett 2006). It has also been found that job
Yecenia Rivera Ortiz & Nghi Tran 2007© - 56 -
satisfaction has been related to employee’s supervision and pay satisfaction, which is
evidence that monetary incentives are a motivating factor (Bennett et al., 2006). Pay
and benefits which are hygiene factors also appears to be of importance to improve job
retention. Even if the employees are intrinsically motivated, the organization can lose
employees if they don’t pay attention to hygiene factors such as work environment,
training, career development, pay and benefits (Bennett et al., 2006, Gill et al., 2001).
This complicates the issue of motivation further where motivation is a complex and
multi factor phenomena. Frederick Herzberg’s theory states that satisfaction and
dissatisfaction are driven by individual and hygiene factors, respectively (Latham et al.,
2006). According to Maslow’s theory of Needs, self-actualization is the highest need in
the hierarchy. Employers should try and help their employees to reach self-actualization
level. This could lead to a maximization of their knowledge, skills and their
performance to achieve a good work.
Even though pay and benefits appears to be important, we have found contradicting
evidence for this hypothesis. Pay and benefits where found to be the second best factor
of motivation after a challenging and interesting work. On the other hand the
participants did not mention that pay and benefits would motivate them to do a better
work. This contradiction would be interesting to investigate further. The importance of
monetary incentives for IT-professionals might also depend upon on the current salary
and benefits from their employers which would be interesting to study. Our conclusion
is therefore that the hypothesis indeed confirms that IT-professionals value more non-
monetary incentives than monetary incentives. Never the less, monetary incentives still
remains an important motivating factor to IT-professionals.
It has also been shown in this study that IT-professionals are not always recognized for
a good work done. The result reveals that the majority of the respondents would
appreciate feedback and verbal recognition from their employers. This supports our
hypothesis where individualized rewards and recognitions motivate an employee more
than general ones. Receiving a personal feedback for a well done work from the
manager or a colleague, maintains the employee in a positive thinking way about their
job and make them give an extra mile to achieve the organization’s goals. Recent
studies support also this hypothesis where IT employees whose work performance is
Yecenia Rivera Ortiz & Nghi Tran 2007© - 57 -
recognized by their superiors or colleagues will be likely to do more than what is
formally required from their responsibilities (Paré et al., 2001).
There are support and evidence that by providing recognitions and rewards to IT-
professionals it assures the employees professional and individual identity. This is
considered as an effective way to retain the employees (Agarwal et al., 1998). It has
also been found that salaries and benefits also are important for maintaining the
employees from leaving their current jobs (Bennett et al., 2006, Gill et al., 2001). In
our investigation we found that a great deal of the participants where neutral to the
question if they where to accept another employment if they got better benefits and
salary. This further strengthen the evidence of that monetary incentives are not the most
important motivating factor. This could indicate that even if they employees are not
fully recognized or do not receive enough rewards from their employers, there is a
sense of commitment to their organization. It could also mean that the employees still
appreciate their work and are satisfied. Never the less, it also indicates that there is still
much to be done to try and improve job retention and satisfaction. It is shown in earlier
investigations that if the management gives more attention to training and career
development to their employees, it will be a step for gaining superior employee
commitment, which in return, it can enhance, organizational knowledge management
(Trauth, 1999).

Yecenia Rivera Ortiz & Nghi Tran 2007© - 58 -
6 Conclusions and Recommendations
Our conclusions is that motivating, recognizing and rewarding IT-professionals is a
severely complicated issue, but of great importance. There are various factors that
influence each other and they depend upon a numerous variables such as environment,
gender, age, culture, society, social factors, individual goals, psychological and
physiological needs among others. This phenomenon can not be discouraged and is
crucial to both employers and employees in various ways. To employers, the benefits of
motivation could improve and maintain high efficiency, quality of work and job
retention. For the employees it can lead to career development, professional and
personal growth.
We have answered our three hypotheses and confirmed that they are true. Never the
less, as this study shows, there are still work to do in this area. IT-professionals do not
appear to be fully motivated and recognized. They would do a better work if they where
better motivated, according to them self. It is our recommendation to management in
the IT-industries to dedicate more time and interest to their employee’s individual
needs and to improve motivation, recognition and rewards systems.
It is crucial that the employers identify the factors which constitute a challenging and
interesting work. By doing so, the maximal potential in each employee can be reached
and in a whole improve the entire organization to the better. It is also important that
scientifical investigations are initiated to study this area further. This research should
include both quantitative and qualitative methods where the last could be dedicated to
reach to the depth on the view upon motivation, rewarding and recognizing. This has to
be done by including both employees and management. There might be gaps in the
understanding between employees and employers which influences the ways of that
motivation, recognition and rewarding is carried out.
In our study there where small possibilities to further investigate the female role among
the IT-professionals concerning motivation, recognition and rewarding. It would be
interesting to study if the female view carried a different focus upon motivational
Yecenia Rivera Ortiz & Nghi Tran 2007© - 59 -
factors and the hypotheses of this study. The women in the IT-industry are a minority
but deserve more attention and investigations.
Yecenia Rivera Ortiz & Nghi Tran 2007© - 60 -
7 References
7.1 Books
Aamodt, Michael G. (2007) Industrial/Organizational Psychology: An Applied
Approach, Fifth Edition,. Thomson Learning Inc, Belmont, CA.
ISBN: 0-495-09306-8
Bolman, Lee G. and Deal, Terrence E. (1997) Reframing Organizations: Artistry,
Choice, and Leadership, Second Edition, Jossey-Bass, San Francisco, CA.
ISBN: 0-7879-0821-5
Bounds, Gregory M., Dobbins, Gregory H., Fowler, Oscar L. (1995) Management: A
Total Quality Perspective, South-Western College Publishing, Cincinnati, Ohio.
ISBN: 0-538-84344-6
Bowditch, James L., Buono, Anthony F (1997) A primer on Organization Behavior,
John Wiley & Son, Inc., United States. ISBN: 0-471-16006-7
Bowen, Brayton R. (2000) Recognizing and Rewarding Employees, McGraw-Hill
Professional Book Group, EBook, Blacklick, OH, USA.
Colin, Pitts (1995) Motivating your Organization: Achieving Business Success through
Reward and Recognition, McGraw-Hill Book Company Europe, England.
ISBN: 0-07-707967-1
De Cenzo, David A. and Robbins, Stephen P. (1996) Human Resource Management,
John Wiley & Sons, Inc., New York, Chichester, Brisbane, Toronto, Singapore.
ISBN: 0-471-12420-6
Dubrin, Andrew J. (2002) Fundamentals of Organization Behavior. Thomson Learning,
South Western, Ohio. ISBN: 0-324-02281-6
Dubrin, Andrew J. (2004) Leadership: Research findings, Practice, and Skills,
Houghton Mifflin Company, New York. ISBN: 0-618-30596-3
Easterby-Smith, M., Thorpe, Richard, and Lowe, Andy (2002) Management Research:
An introduction, Sage Publications ltd, London. ISBN: 0-7619-7284-6
Ghauri, Pervez and Grönhaug, Kjell (2005) Research Methods in Business Studies, A
Practical Guide, Prentice Hall, England ISBN: 0-273-68156-7
Gordon, Judith R. (1991) A Diagnostic Approach to Organizational Behavior, Allyn
and Bacon, a Division of Simon & Schuster Inc., Massachusetts.
ISBN: 0-205-12090-3
Kreitner, R., Kinicki, A. (2002): Organizational Behavior, McGraw-Hill Education
ISBN: 0077098285

Yecenia Rivera Ortiz & Nghi Tran 2007© - 61 -
Matteson, Michael T. and Ivancevich, John M. (1999) Management and Organizational
Behavior Classics, Seventh Edition, Irwin Mc-Graw Hill, Boston, USA.
ISBN: 0-256-2647-0
7.2 Articles
Agarwal, Ritu and Ferratt, Thomas W. (1998), ‘Recruiting, Retaining, and Developing
IT Professionals: An Empirically Derived Taxonomy of Human Resource Practices’,
CPR98 Boston MA, USA Copyright 1998 0-89791-959-9/98/3, pp 292-302.
Baer, M., Oldham, G.R., and Cummings, A. (2003), ‘Rewarding Creativity: When does
it really matter?’ Pergamon, The Leadership Quarterly, doi: 10.1016/S1048-9843
(03)00052-3.
Bennett Thatcher, J., Yongmei, L., Stepina, Lee P., Goodman, Joseph M., and
Treadway, Darren C. (2006), ‘IT Work Turnover: An Empirical Examination of
Intrinsic Motivation’, The DATA BASE for Advances in Information Systems-Spring-
Summer, Vol. 37, Nos. 2 & 3), pp 133-146.
Burgess, Thomas F., Dr. (2001), ‘Guide to the Design of Questionnaires’, Information
Systems Services, University of Leeds, Edition 1.1, pp 1-27.
Ferratt, T.W., Agarwal, R., Moore, J.E., and Brown, C.V. (1999), ‘Observations from
the “The Front”: IT Executives on Practices to Recruit and Retain Information
Technology Professionals’, SIGCPR, New Orleans, USA, ACM: 1-58113-063-5/99/04,
pp 1-10.
Ferratt, T.W., Enns, H.G. and Prasad, J. (2001), ‘Satisfaction of IT Professionals with
Employment Arrangements in Traditional and Virtual Contexts’, University of Dayton,
School of Business Administration, Dayton OH, USA, Copyright ACM 2001 1-58113-
363-1/01/04, pp 78-86.
Gill, Brian and Banks Pidduck, Anne (2001), ‘IT Staffing and Retention: A Success
Story’, SIGCPR 2001, San Diego CA, USA, Copyright ACM 2001 1-58113-363-
1/01/01/04, pp 87-92.
Latham, G.P. and Ernst, C.T. (2006), ’Keys to motivating tomorrow’s workforce’,
Human Resource Management Review, 16/2006, pp. 181-198.
Herselman, S. (2001), ‘Performance motivation among employees of a wholesale
company’, S.Afr J. Ethnol, 24 (1), pp. 1-10.
Jackson, T. (1995), ‘Cross-cultural Management’, Butterworth-Heinemann, Oxford.
LeDuc Jr., A.L. (1980), Motivation of Programmers, Data Base, Miami-Dade
Community Collage, pp 4-11.
Yecenia Rivera Ortiz & Nghi Tran 2007© - 62 -
Paré, G., Tremblay, M., and Lalonde, P. (2001), ‘Workforce Retention: What Do IT
Employees Really Want?’, SIGCPR 2001 San Diego, CA, USA, Copyright ACM 2001
1-58113-363-1/01/04
Pawlowski, Suzanne D., Datta, Patrin and Houston, Andrea L. (2005), ‘The (Gradually)
Changing Face of State IT Jobs’, Communications of the ACM, May /Vol. 48, No.5.
Rafikul Islam, Ahmad Zaki Hj. Ismail (2004), ‘Ranking of Employee’s Reward and
Recognition Approaches: A Malaysian Perspective, Journal of International Business
and Entrepreneurship Development’ ISSN 1549-9324, August/Vol 2, No.2.
Tarver, Lisa R., Godkin, Lynn (2005),’Employee Motivation: Intrinsic Motivation vs.
Extrinsic Rewards’, Lamar University.
Trauth, Eileen M., Ph.D. (1999), ‘Who Owns my Soul? The Paradox of Pursuing
Organizational Knowledge in a Work Culture of Individualism’, Northeastern
University, Boston, MA, United States. Copyright ACM 1999 1-58113-063-5/99/04.
7.3 Research Papers
Enoch Tyilana, X. (2005) Magister Commerci in Business Management: The Impact
of Motivation on Job Satisfaction amongst Employees of a National Broadcaster,
University of Johannesburg
7.4 Websites
Boeree, George C. Dr. (2006). Abraham Maslow, Personalities Theories (online).
Webspace.com. Available from: http://webspace.ship.edu/cgboer/maslow.html
Computer Sweden (2007). The Swedish IT Industry Guide 2007 (online). Available
from: http://cstjanster.idg.se/itguide/default.asp?letter=A
Conagri (2007). History (online). Available from: http://www.conagri.se/
Define This (2007). Theory X and theory Y (online). Definethis.org Available from:
http://www.definethis.org/word/Theory_X.html
Dongho, Kim (2006). Employee Motivation: “Just Ask your Employees”, Volume 12,
Number 1 (online). Seoul Journal of Business. Available from:
http://cba.snu.ac.kr/sjb/data/4%20Kim%20Dongho(%EC%82%BC).pdf
Examstutor.com (2007). Herzerbg’s Two Factor Theory (1959) (online). Available
from:
http://www.examstutor.com/business/resources/studyroom/people_and_organisations/
motivation_theory/4-herzbergstwofactortheory.php
Graves, Pat R. (2007). Motivation (online). Answers.com, Encyclopedia of Business.
Available from: http://www.answers.com/topic/motivation
Yecenia Rivera Ortiz & Nghi Tran 2007© - 63 -
“Motivation to Work” (2007). Community.org (online). Available from:
http://community.ocr.org.uk/core/community/public/download_file?rid=202
Nelson, Bob (2004). Everything you thought you knew about Recognition (online).
Workforce Management. Available from:
http://www.workforce.com/section/01/feature/23/61/87/index.html
NetMBA (2007). Herzberg’s Motivation-Hygiene Theory (Two Factor Theory)
(online). Available from: http://www.netmba.com/mgmt/ob/motivation/herzberg/
Rowe, Megan (2207). Motivation Trends (online). Prism Business Media. Available
from:
http://meetingsnet.com/corporatemeetingsincentives/meetings_motivation_trends/
Sesca Technologies OY (2007). Mobile, Network and Operator Technology Services
(online). Available from: http://www.sesca.com/Default.aspx?id=516313
Shah, K. and Shah, P.J. (2007). Theories of Motivation (online). Available from:
http://www.laynetworks.com/Theories-of-Motivation.html
Stuart-Kotze, Robin (2007). Motivation Theory (online). Goal Setting-Guide.com.
Available from: http://www.goal-setting-guide.com/motivation-theory.html
SwBusiness.fi (2007). Finnish Software Business Cluster (online). Available from:
http://www.swbusiness.fi/portal/sw_companies/search/?searchmode=companies&mode
=3&term=Sweden&page=1
Wikipedia (2007a). Theory X and Y (online) Available from:
http://en.wikipedia.org/wiki/Theory_X_and_theory_Y
Wikipedia (2007b). Fredrick Herzberg (online). Available from:
http://en.wikipedia.org/?title=Frederick_Herzberg
Wikipedia (2007c). Sony Ericsson (online) Available from:
http://en.wikipedia.org/wiki/Sony_Ericsson
Wirralmet (2007). Introduction to Management-Motivation (online). Available from:
http://www.wmc.ac.uk/flm/text_version/section02.html

Yecenia Rivera Ortiz & Nghi Tran 2007© - 64 -
8 Appendices
8.1. Appendix A: Presentation Letter
Rewarding and Recognizing Employees:
How IT Professionals in Sweden and in Finland are
Motivated and Prefer to be Rewarded
Hässleholm/Helsinki, May ___, 2007
Estimated Mr./Mrs.....................:
My name is Yecenia Rivera/Nghi Tran, and I am a student of the Master of Business
Administration Program at the Blekinge Institute of Technology in Ronneby. At the
moment, my school partner Yecenia Rivera/Nghi Tran and me are looking at IT
companies in Sweden and in Finland to collect data for our thesis.
Our thesis topic is “Rewarding and Recognizing Employees: How IT Professionals in
Sweden and in Finland are Motivated and Prefer to be Rewarded”. I am therefore
interested in your company’s employees because I know your company is doing
business within the IT sector.
I would be very happy if your company accepts me to collect the data needed for our
investigation. The data will be collected through questionnaires that are easy to fill. If
you accept the questionnaires will then be distributed to your employees. Enclosed is
the questionnaire, for your consideration. There will not be any expenses on your
account.
Please feel free to contact me, if you need more information or have any questions. I
am looking forward for your reply. Thank you for your time!
Best regards,
Yecenia Rivera/Nghi Tran
MBA Student
Blekinge Institute of Technology
Sweden
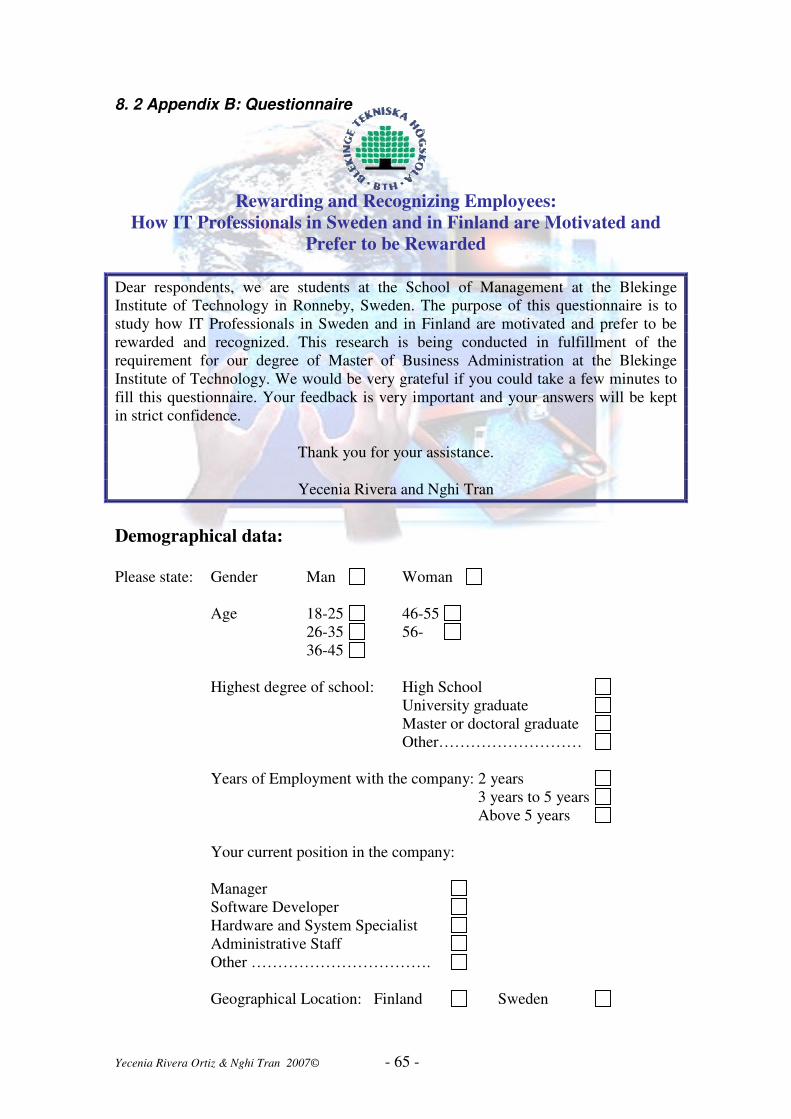
Yecenia Rivera Ortiz & Nghi Tran 2007© - 65 -
8. 2 Appendix B: Questionnaire
Rewarding and Recognizing Employees:
How IT Professionals in Sweden and in Finland are Motivated and
Prefer to be Rewarded
Dear respondents, we are students at the School of Management at the Blekinge
Institute of Technology in Ronneby, Sweden. The purpose of this questionnaire is to
study how IT Professionals in Sweden and in Finland are motivated and prefer to be
rewarded and recognized. This research is being conducted in fulfillment of the
requirement for our degree of Master of Business Administration at the Blekinge
Institute of Technology. We would be very grateful if you could take a few minutes to
fill this questionnaire. Your feedback is very important and your answers will be kept
in strict confidence.
Thank you for your assistance.
Yecenia Rivera and Nghi Tran
Demographical data:
Please state: Gender Man Woman
Age 18-25 46-55
26-35 56-
36-45
Highest degree of school: High School
University graduate
Master or doctoral graduate
Other………………………
Years of Employment with the company: 2 years
3 years to 5 years
Above 5 years
Your current position in the company:
Manager
Software Developer
Hardware and System Specialist
Administrative Staff
Other …………………………….
Geographical Location: Finland Sweden

Yecenia Rivera Ortiz & Nghi Tran 2007© - 66 -
Rewards:
(Recognition is ways your employer has given you feedback for the work you have done
in form of money, raise, medical benefits etc.)
1. Arrange the following rewards in order of your preference from 1 to 10, where 1
represent the best reward and 10 the least best reward:
( ) Share Options
( ) Pension Plans
( ) Beneficial Loans
( ) Job Satisfaction
( ) Intellectual Challenge and Creativity
( ) Trainings for professional development
( ) Paid Vacations
( ) Christmas Bonus
( ) Participation in Decision Making
( ) Other…………………………………..
2. What is the best reward you have received? ______
3. How do you receive your As a group/team
rewards from your employer?
To me personally
Both in person and
as a group/team
Other …………………..
4. Do you feel that you have received enough rewards for the work you have done?
No, not enough To some extent Yes, always Do Not Know
5. How would you like to be rewarded when you have done a good work?
____________________________________________________________________
_____________________________________________________________________

Yecenia Rivera Ortiz & Nghi Tran 2007© - 67 -
Recognition:
(Recognition is ways your employer has given you feedback for the work you have done
in written or spoken ways.)
6. Arrange the following recognitions in order of your preference from 1 to 10, where
1 represents the best type of recognition and 10 represent the least best type of
recognition:
( ) Time off with Pay
( ) Lunch “on the house”
( ) Thank You Note
( ) Full appreciation of work done
( ) Certificate for outstanding service or ideas
( ) Development Opportunities
( ) Employee Award
( ) Team-of-the-Month Award
( ) Years of Service Awards
( ) Other………………………………
7. What is the best recognition you have received? ___________________________
8. How do you receive your As a group/team
recognitions from your employer?
To me personally
Both in person and
as a group/team
Other……………………
9. Do you feel that you have received enough recognition for the work you have
done?
No, not enough To some extent Yes, always Do not know
10. How would you like to be recognized when you have done a good work?
______
Yecenia Rivera Ortiz & Nghi Tran 2007© - 68 -
Motivation:
11. Arrange the following motivational factors in order of your preference from 1 to
10, where 1 represent the best type of motivational factor and 10 represent the
least best type of motivational factor:
( ) Job Security
( ) Promotion and growth in the organization
( ) Challenging and Interesting work
( ) Full appreciation of work done
( ) Pay and benefits
( ) Physical Environment
( ) Work itself
( ) Relationships with co-workers
( ) Achievement
( ) Company Policy and Administration
12. What factors motivates you to do a good work?
13. Does your employer Not at all To some extent Yes always,
try to motivate you
to do a good work?
14. Are you motivated Not at all To some extent Yes, always
to do a good work?
15. Would you do a better job if you were better motivated?____________________
_____________________________________________________________________
_____________________________________________________________________
16. What factors do you consider as motivating?_____________________________
_____________________________________________________________________
_____________________________________________________________________
17. How important is motivation for you as an employee?_____________________
_____________________________________________________________________
_____________________________________________________________________

Yecenia Rivera Ortiz & Nghi Tran 2007© - 69 -
Individual Motive:
18. Range the following the most important things for you staying with your current
job from 1 to 6, where 1 is the most important thing and 6 the least important
thing:
( ) Stability in my working life
( ) Compensation and monetary rewards
( ) Further training opportunities and higher education level
( ) Promotion for higher position
( ) Interest in the work I am performing
( ) I see potential growth in the organization I work in
19. If another organization today offers you the same job you have today, would you
accept that employment? Please state why you should accept or not accept that
employment:
_____________________________________________________________________
_____________________________________________________________________
_____________________________________________________________________
Thanks again for your assistance!