Embed Size (px)
Citation preview
Report EUR 26522 EN
20 14
Marco Peroni George Solomos Bernard Viaccoz
BLAST Simulator project:
Performance assessment and preliminary tests
Administrative Arrangement No JRC 32253-2011 with DG HOME
Activity A5 – Blast Simulation Technology Development
European Commission
Joint Research Centre
Institute for Protection and Security of the Citizen
Contact information
Marco Peroni
Address: Joint Research Centre, Via Enrico Fermi 2749, TP 480, 21027 Ispra (VA), Italy
E-mail: [email protected]
Tel.: +39 0332 78 9775
Fax: +39 0332 78 9049
http://www.jrc.ec.europa.eu/
Legal Notice
Neither the European Commission nor any person acting on behalf of the Commission
is responsible for the use which might be made of this publication.
Europe Direct is a service to help you find answers to your questions about the European Union
Freephone number (*): 00 800 6 7 8 9 10 11
(*) Certain mobile telephone operators do not allow access to 00 800 numbers or these calls may be billed.
A great deal of additional information on the European Union is available on the Internet.
It can be accessed through the Europa server http://europa.eu/.
JRC86864
EUR 26522 EN
ISBN 978-92-79-35528-8
ISSN 1831-9424
doi:10.2788/77666
Luxembourg: Publications Office of the European Union, 2014
© European Union, 2014
Reproduction is authorised provided the source is acknowledged.
Printed in Italy
BLAST Simulator project:
Performance assessment and preliminary tests
Administrative Arrangement No JRC 32253-2011 with DG HOME
Activity A5 – Blast Simulation Technology Development
Marco Peroni
George Solomos
Bernard Viaccoz
European Laboratory for Structural Assessment
December 2013

1. Introduction
Critical infrastructures in fields such as energy, health, communication, government,
transport etc. are made of physical structures, or are housed in physical structures. Such
structures may naturally become the target of terrorist bombing attacks. Measures to
protect them will certainly be taken, involving prevention, intelligence, detection,
deterrence etc, but if everything fails, it is very important that the mechanical structure
itself mitigates some effects of the explosion and maintains certain functionalities.
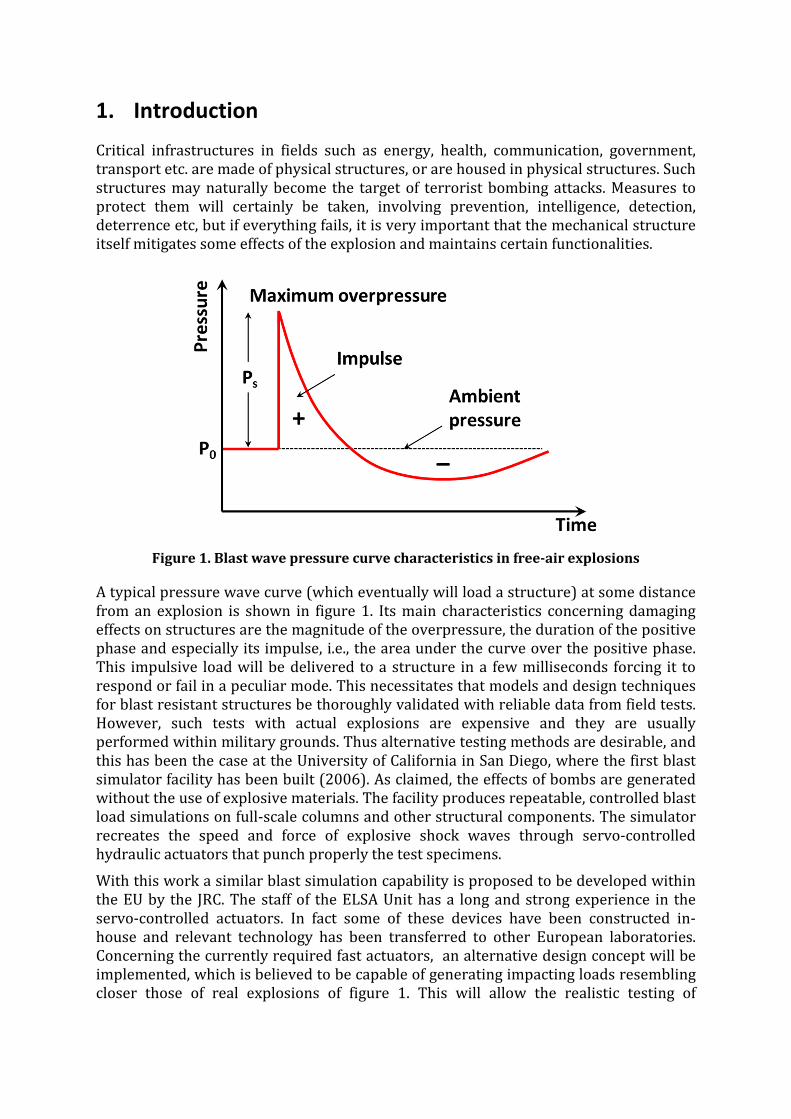
Figure 1. Blast wave pressure curve characteristics in free-air explosions
A typical pressure wave curve (which eventually will load a structure) at some distance
from an explosion is shown in figure 1. Its main characteristics concerning damaging
effects on structures are the magnitude of the overpressure, the duration of the positive
phase and especially its impulse, i.e., the area under the curve over the positive phase.
This impulsive load will be delivered to a structure in a few milliseconds forcing it to
respond or fail in a peculiar mode. This necessitates that models and design techniques
for blast resistant structures be thoroughly validated with reliable data from field tests.
However, such tests with actual explosions are expensive and they are usually
performed within military grounds. Thus alternative testing methods are desirable, and
this has been the case at the University of California in San Diego, where the first blast
simulator facility has been built (2006). As claimed, the effects of bombs are generated
without the use of explosive materials. The facility produces repeatable, controlled blast
load simulations on full-scale columns and other structural components. The simulator
recreates the speed and force of explosive shock waves through servo-controlled
hydraulic actuators that punch properly the test specimens.
With this work a similar blast simulation capability is proposed to be developed within
the EU by the JRC. The staff of the ELSA Unit has a long and strong experience in the
servo-controlled actuators. In fact some of these devices have been constructed in-
house and relevant technology has been transferred to other European laboratories.
Concerning the currently required fast actuators, an alternative design concept will be
implemented, which is believed to be capable of generating impacting loads resembling
closer those of real explosions of figure 1. This will allow the realistic testing of

components to “simulated” explosions and will provide the necessary data for the
verification and validation of the computer tools.
The development of this technology will be important both for the research and the
practicing engineers and architects who need design rules and guidelines. Besides
characterizing blast effects on structural systems, the methodology will contribute to
evaluating technologies for hardening and retrofitting buildings and bridges against
terrorist bomb attacks. Further, it will help in the investigation of the problem of
progressive collapse, i.e., the phenomenon where a local failure propagates in a
disproportionate manner to lead to global failure (Oklahoma City bombing case).
2. Experimental setup
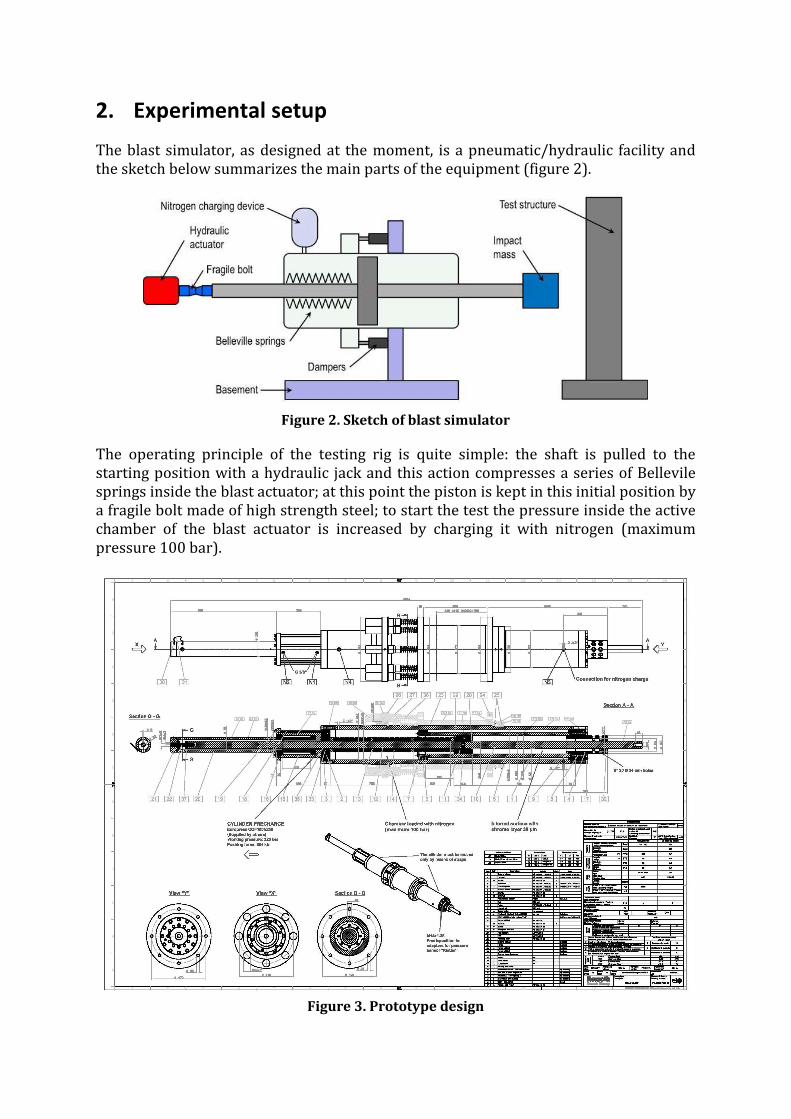
The blast simulator, as designed at the moment, is a pneumatic/hydraulic facility and
the sketch below summarizes the main parts of the equipment (figure 2).
Figure 2. Sketch of blast simulator
The operating principle of the testing rig is quite simple: the shaft is pulled to the
starting position with a hydraulic jack and this action compresses a series of Bellevile
springs inside the blast actuator; at this point the piston is kept in this initial position by
a fragile bolt made of high strength steel; to start the test the pressure inside the active
chamber of the blast actuator is increased by charging it with nitrogen (maximum
pressure 100 bar).
Figure 3. Prototype design
When the pressure load produces a force greater than the strength of the fragile, the
bolt suddenly breaks and the piston and shaft of the blast actuator rapidly accelerate
pushing the impacting mass, attached at the other extreme of the shaft. When the piston
has done most of its stroke, it starts to decelerate (with a combined pneumatic and
rubber device) and transfers its remaining energy to the whole actuator, which is
supported with a series of high performance dampers. When the shaft of the actuator
decelerates the impacting mass is detached from it and collides with the tested
structure reproducing local pressure similar to that of a blast wave.
The cylinder has been designed with the supports of the ELSA researchers by Bosh
Rexroth and the final design of the prototype is shown in figure 3.
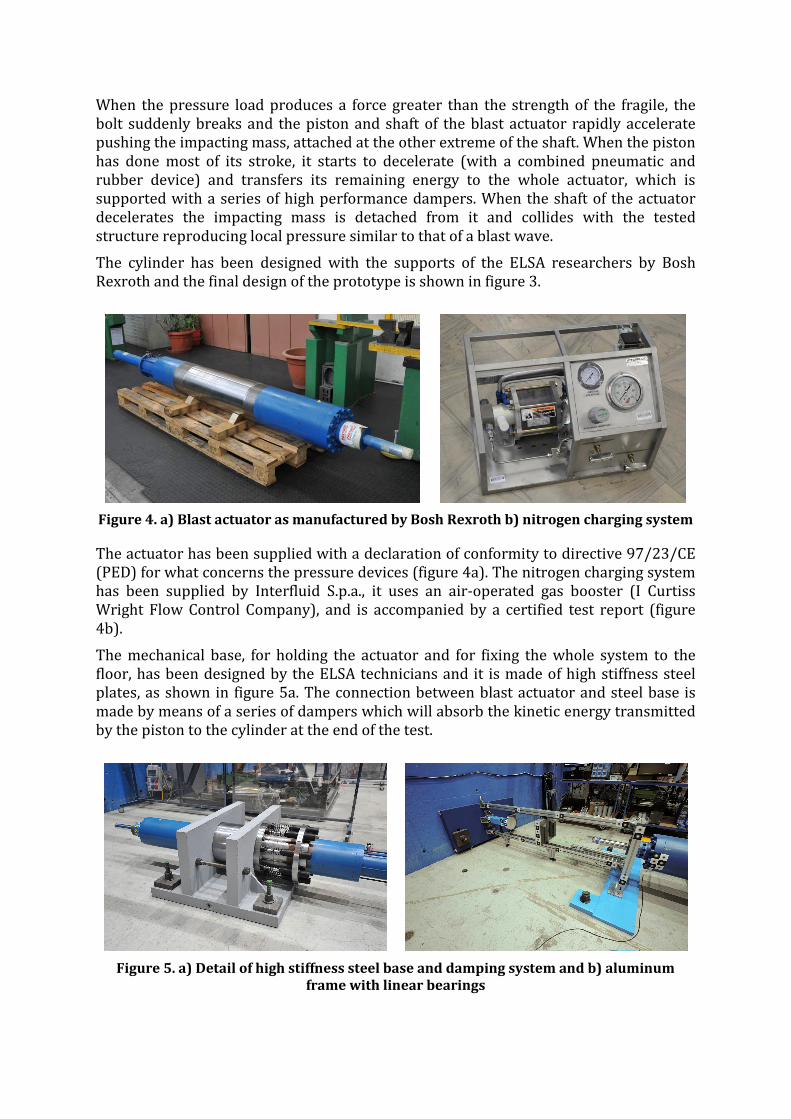
Figure 4. a) Blast actuator as manufactured by Bosh Rexroth b) nitrogen charging system
The actuator has been supplied with a declaration of conformity to directive 97/23/CE
(PED) for what concerns the pressure devices (figure 4a). The nitrogen charging system
has been supplied by Interfluid S.p.a., it uses an air-operated gas booster (I Curtiss
Wright Flow Control Company), and is accompanied by a certified test report (figure
4b).
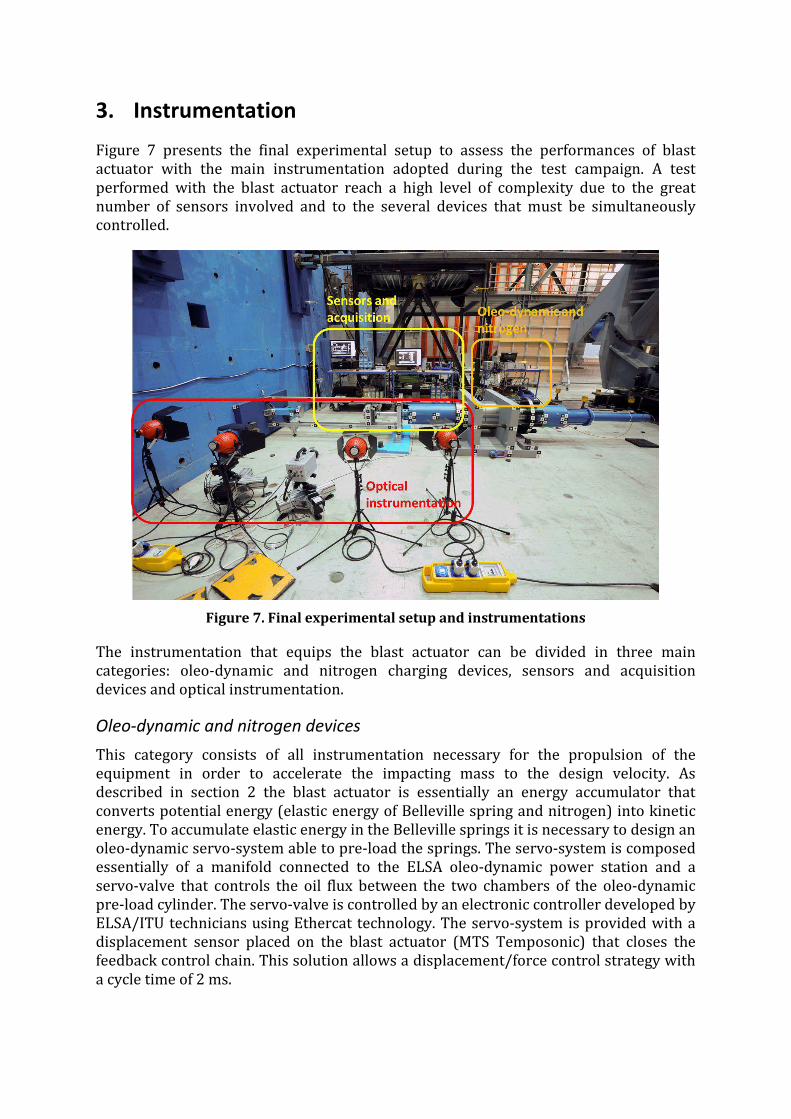
The mechanical base, for holding the actuator and for fixing the whole system to the
floor, has been designed by the ELSA technicians and it is made of high stiffness steel
plates, as shown in figure 5a. The connection between blast actuator and steel base is
made by means of a series of dampers which will absorb the kinetic energy transmitted
by the piston to the cylinder at the end of the test.
Figure 5. a) Detail of high stiffness steel base and damping system and b) aluminum
frame with linear bearings

To verify the performances of blast actuator it is also essential to accelerate a variable
mass to the design velocity and to ensure, for safety reasons, that the mass was guided
during all the test execution. To do this a modular aluminum frame was designed that
supports two linear bearing (THK) and an instrumented aluminum/lead mass. The two
linear bearings ensure a frictionless movement of the mass in the test direction and a
high stiffness in the other directions. For these reasons this structure ensures the safety
requirements of a testing laboratory.
The impact mass is made in three different parts as shown in figures 6. The main
structure is made of a high strength aluminum alloy (plate 300x300x60 mm in 7075T6)
that is connected to the linear bearings with two carriages leading to a high stiffness
moving structure. The mass can be varied adding to the back of the aluminum plate
some modular lead blocks rigidly connected to the aluminum part with bolts. In this
way the impacting mass can be easily modified in the range between 20 to 60 kg. The
aluminum mass does not impact directly but an aluminum plate is placed before the
main mass to protect the structure. The circular plate is connected to the main mass
with two load cells that allow a noiseless measurement of the impact force.
Figure 6. Details of the impacting mass
3. Instrumentation
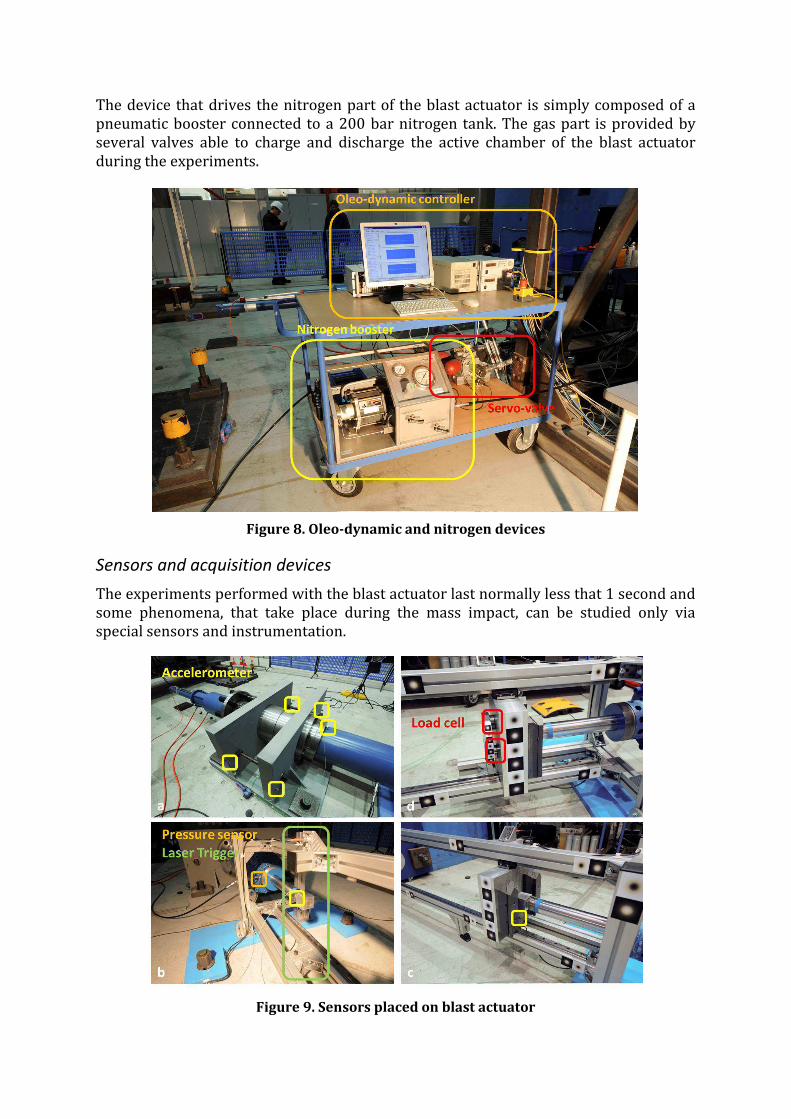
Figure 7 presents the final experimental setup to assess the performances of blast
actuator with the main instrumentation adopted during the test campaign. A test
performed with the blast actuator reach a high level of complexity due to the great
number of sensors involved and to the several devices that must be simultaneously
controlled.
Figure 7. Final experimental setup and instrumentations
The instrumentation that equips the blast actuator can be divided in three main
categories: oleo-dynamic and nitrogen charging devices, sensors and acquisition
devices and optical instrumentation.
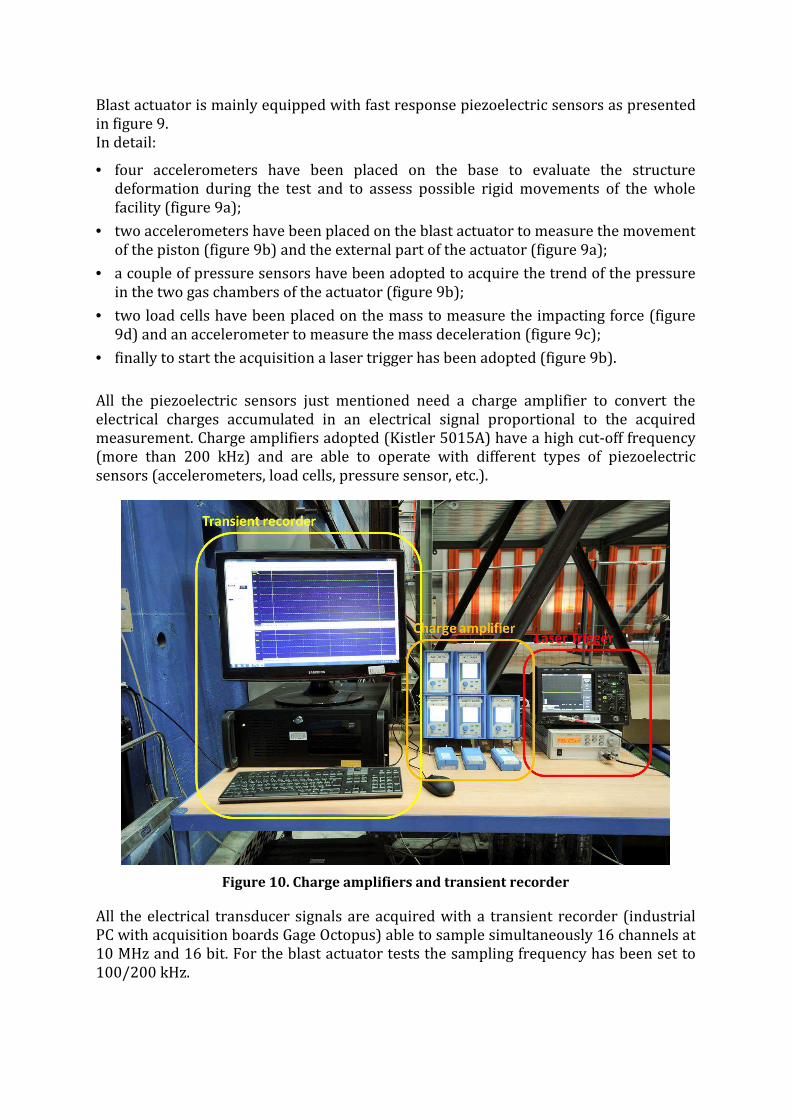
Oleo-dynamic and nitrogen devices
This category consists of all instrumentation necessary for the propulsion of the
equipment in order to accelerate the impacting mass to the design velocity. As
described in section 2 the blast actuator is essentially an energy accumulator that
converts potential energy (elastic energy of Belleville spring and nitrogen) into kinetic
energy. To accumulate elastic energy in the Belleville springs it is necessary to design an
oleo-dynamic servo-system able to pre-load the springs. The servo-system is composed
essentially of a manifold connected to the ELSA oleo-dynamic power station and a
servo-valve that controls the oil flux between the two chambers of the oleo-dynamic
pre-load cylinder. The servo-valve is controlled by an electronic controller developed by
ELSA/ITU technicians using Ethercat technology. The servo-system is provided with a
displacement sensor placed on the blast actuator (MTS Temposonic) that closes the
feedback control chain. This solution allows a displacement/force control strategy with
a cycle time of 2 ms.
The device that drives the nitrogen part of the blast actuator is simply composed of a
pneumatic booster connected to a 200 bar nitrogen tank. The gas part is provided by
several valves able to charge and discharge the active chamber of the blast actuator
during the experiments.
Figure 8. Oleo-dynamic and nitrogen devices
Sensors and acquisition devices
The experiments performed with the blast actuator last normally less that 1 second and
some phenomena, that take place during the mass impact, can be studied only via
special sensors and instrumentation.
Figure 9. Sensors placed on blast actuator
Blast actuator is mainly equipped with fast response piezoelectric sensors as presented
in figure 9.
In detail:
• four accelerometers have been placed on the base to evaluate the structure
deformation during the test and to assess possible rigid movements of the whole
facility (figure 9a);
• two accelerometers have been placed on the blast actuator to measure the movement
of the piston (figure 9b) and the external part of the actuator (figure 9a);
• a couple of pressure sensors have been adopted to acquire the trend of the pressure
in the two gas chambers of the actuator (figure 9b);
• two load cells have been placed on the mass to measure the impacting force (figure
9d) and an accelerometer to measure the mass deceleration (figure 9c);
• finally to start the acquisition a laser trigger has been adopted (figure 9b).
All the piezoelectric sensors just mentioned need a charge amplifier to convert the
electrical charges accumulated in an electrical signal proportional to the acquired
measurement. Charge amplifiers adopted (Kistler 5015A) have a high cut-off frequency
(more than 200 kHz) and are able to operate with different types of piezoelectric
sensors (accelerometers, load cells, pressure sensor, etc.).
Figure 10. Charge amplifiers and transient recorder
All the electrical transducer signals are acquired with a transient recorder (industrial
PC with acquisition boards Gage Octopus) able to sample simultaneously 16 channels at
10 MHz and 16 bit. For the blast actuator tests the sampling frequency has been set to
100/200 kHz.

Optical instrumentation
In addition to standard instrumentation for the blast actuator tests, extensive use of
optical methods has been made in order to detect and identify possible unexpected
phenomena and to precisely measure the velocity of the several moving parts of the
actuator. The optical instrumentation adopted is essentially composed of two high-
speed cameras (IDT Y4 and Photron SA1) and a set of halogen lamps to provide the
necessary light for a high speed photo capture (Figure 11). For the range of velocity of
the moving parts reached during the tests the sample rate of the two cameras does not
exceed 5000 fps.
Figure 11. Optical instrumentation
To compute the trajectories of moving parts a tracking algorithm, implemented in
Matlab, has been largely used. This numerical procedure is based on specific targets
(figures 7, 9c, 9d) directly attached to the structures that must be tracked. The use of
these targets allows an accurate evaluation of their positions (5/100 of pixel
dimension) with a relatively low time-consuming numerical procedure. The operating
principle of this algorithm is rather simple: a well-known grey profile (the grey trend of
the target) is tracked in the pictures series with an optimization algorithm. In this way
the information captured by several pixels are elaborated simultaneously (usually at
least a 10x10 grid of pixels), thus increasing substantially the measurement accuracy.

4. Experimental tests
This section summarizes the preliminary tests performed with the blast actuator in
order to assess its performance. Table 1 presents schematically the tests carried out and
the test type with some additional information.
Table 1. Experimental tests performed
Tests name Accelerated mass notes
Blast 1 No mass Only spring, fragile bolt 5 mm
Blast 2 No mass Only spring, fragile bolt 8 mm
Blast 3 No mass Only spring, fragile bolt 10 mm
Blast 4 No mass Check ole-dynamic part
Blast 5 23.4 kg Only spring, fragile bolt 5 mm
Blast 6 23.4 kg Only spring, fragile bolt 8 mm
Blast 7 40.3 kg Only spring, fragile bolt 8 mm
Blast 8 40.3 kg Spring+nitrogen (10 bar), fragile bolt 10 mm
Blast 9 40.3 kg Spring+nitrogen (15 bar), fragile bolt 10 mm
Blast 10 40.3 kg Only spring, fragile bolt 5 mm
Blast 11 40.3 kg Only spring, fragile bolt 5 mm
The test campaign has been conducted taking into account safety issues due to the high
level of energy stored and quickly released during the experiments. For this reason the
complexity level and the energy stored during the experiments has been increased
gradually.
In the firsts three experiments only the actuator has been tested with an increasing
velocity to verify the correct functioning of the equipment and possible damages to seal
and mechanical structures. After each test the blast actuator has been inspected.
Experiment Blast 4 involved only the oleo-dynamic pre-load system to investigate the
performances of a new controller generation (ethercat technology) developed in the
ELSA/ITU laboratory.
Experiments Blast 5-7 involved for the first time the acceleration of a mass only with
the springs propulsion. Finally, greater velocities have been reached in experiments
Blast 8-9 using for propulsion both the spring and the pressurized nitrogen.
The last two experiments involved the reproduction of a blast pressure profile using a
foamed material to “smooth” the pressure profile generated by the impact of the
accelerated mass.
In the next pages a schematic overview of the signals acquired during the tests will be
presented and some additional detail of the tests will be provided.

Blast 1
Blast 1 experiment as mentioned before involved only the blast actuator without any
accelerated mass. The energy has been accumulated only in the springs and the fragile
bolts adopted had a notched section of 5 mm diameter. A velocity of approximately 4.5
m/s has been reached and no substantial accelerations have been recorded on the
mechanical base.
Figure 12. Camera acquisitions and computed targets
Camera SA1
1 2 3 4 5 6 7 8 9 10 11 12
13 14
15 16
17 18 19 20
100 200 300 400 500 600 700 800 900 1000
50
100
150
200
250
300
350
400
450
500
Camera Y4
1 2
3 4
5 6
7 8
9 10 11
12 13 14 15 16
100 200 300 400 500 600 700 800 900 1000
100
200
300
400
500
600
700
800
900
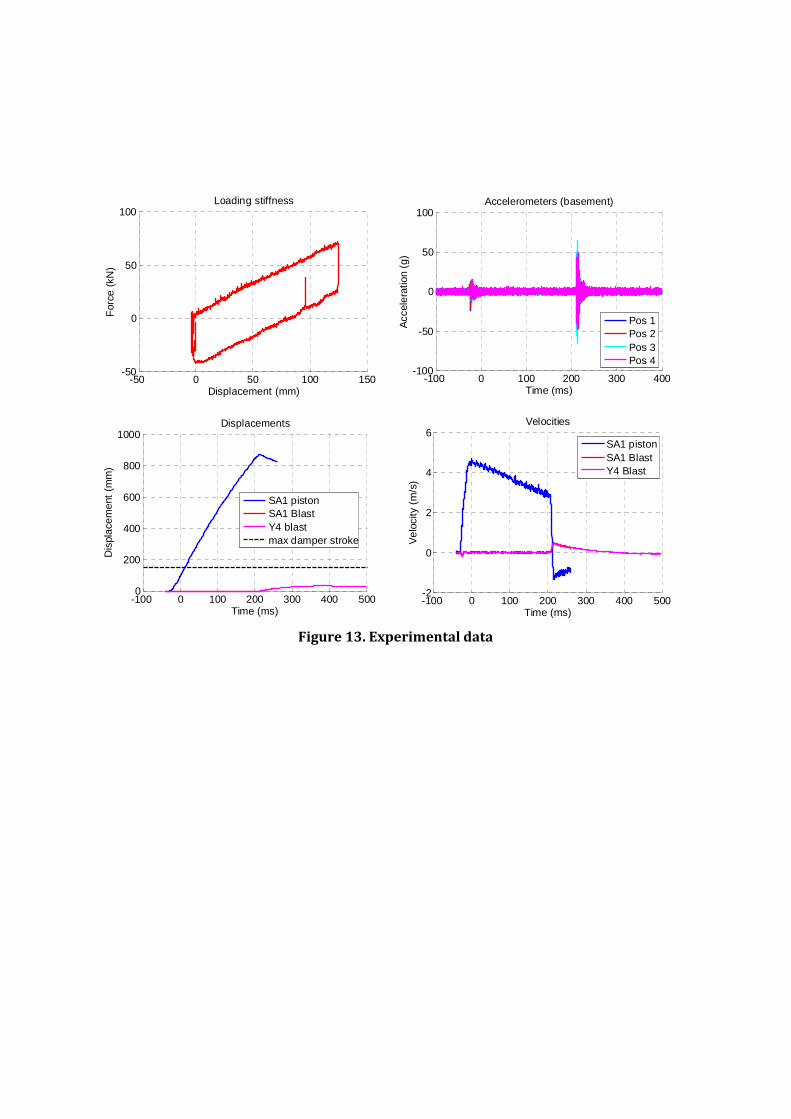
Figure 13. Experimental data
-50 0 50 100 150-50
0
50
100Loading stiffness
For
ce (
kN)
Displacement (mm)-100 0 100 200 300 400
-100
-50
0
50
100Accelerometers (basement)
Acc
eler
atio
n (g
)Time (ms)
Pos 1Pos 2Pos 3Pos 4
-100 0 100 200 300 400 5000
200
400
600
800
1000Displacements
Time (ms)
Dis
plac
emen
t (m
m)
SA1 pistonSA1 BlastY4 blastmax damper stroke
-100 0 100 200 300 400 500-2
0
2
4
6Velocities
Time (ms)
Vel
ocity
(m
/s)
SA1 pistonSA1 BlastY4 Blast
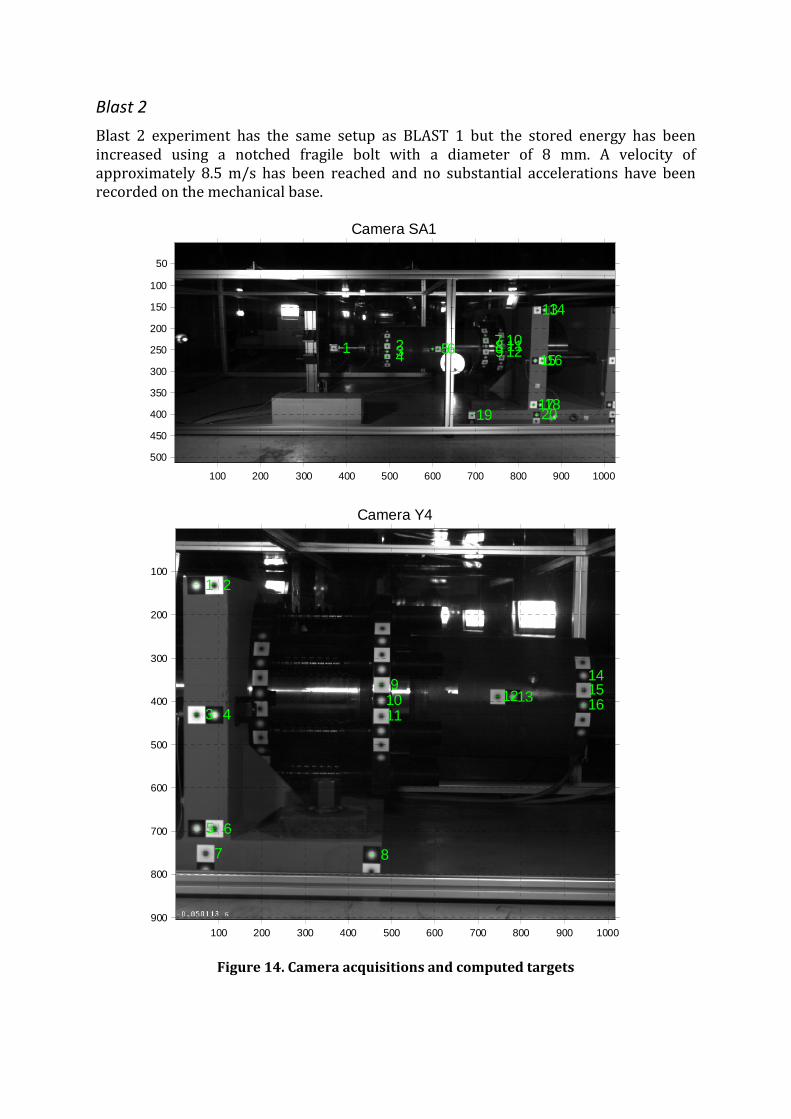
Blast 2
Blast 2 experiment has the same setup as BLAST 1 but the stored energy has been
increased using a notched fragile bolt with a diameter of 8 mm. A velocity of
approximately 8.5 m/s has been reached and no substantial accelerations have been
recorded on the mechanical base.
Figure 14. Camera acquisitions and computed targets
Camera SA1
1 2 3 4 5 6 7 8 9 10 11 12
13 14
15 16
17 18 19 20
100 200 300 400 500 600 700 800 900 1000
50
100
150
200
250
300
350
400
450
500
Camera Y4
1 2
3 4
5 6
7 8
9 10 11
12 13 14 15 16
100 200 300 400 500 600 700 800 900 1000
100
200
300
400
500
600
700
800
900

Figure 15. Experimental data
0 50 100 150 200-100
-50
0
50
100Loading stiffness
For
ce (
kN)
Displacement (mm)-100 0 100 200 300 400
-100
-50
0
50
100Accelerometers (basement)
Acc
eler
atio
n (g
)Time (ms)
Pos 1Pos 2Pos 3Pos 4
-100 0 100 200 300 400 5000
200
400
600
800
1000Displacements
Time (ms)
Dis
plac
emen
t (m
m)
SA1 pistonSA1 BlastY4 blastmax damper stroke
0 100 200 300 400 500-4
-2
0
2
4
6
8
10Velocities
Time (ms)
Vel
ocity
(m
/s)
SA1 pistonSA1 BlastY4 Blast
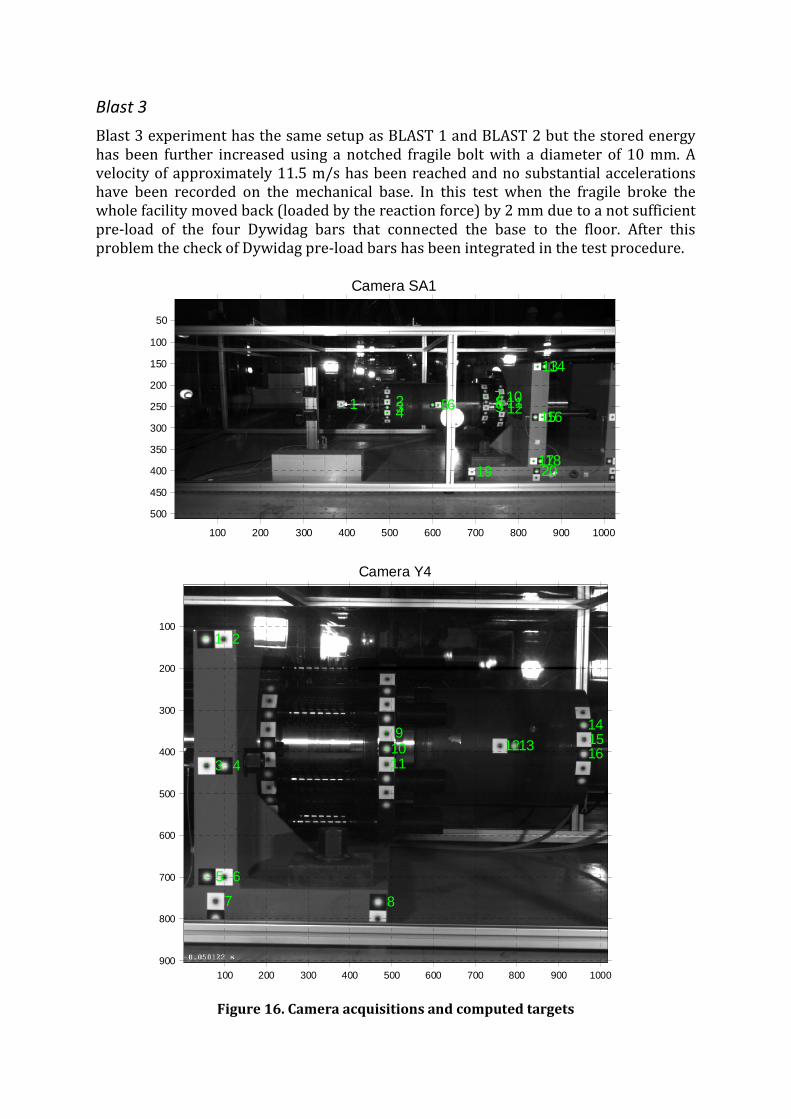
Blast 3
Blast 3 experiment has the same setup as BLAST 1 and BLAST 2 but the stored energy
has been further increased using a notched fragile bolt with a diameter of 10 mm. A
velocity of approximately 11.5 m/s has been reached and no substantial accelerations
have been recorded on the mechanical base. In this test when the fragile broke the
whole facility moved back (loaded by the reaction force) by 2 mm due to a not sufficient
pre-load of the four Dywidag bars that connected the base to the floor. After this
problem the check of Dywidag pre-load bars has been integrated in the test procedure.
Figure 16. Camera acquisitions and computed targets
Camera SA1
1 2 3 4 5 6 7 8 9 10 11 12
13 14
15 16
17 18 19 20
100 200 300 400 500 600 700 800 900 1000
50
100
150
200
250
300
350
400
450
500
Camera Y4
1 2
3 4
5 6
7 8
9 10 11
12 13 14 15 16
100 200 300 400 500 600 700 800 900 1000
100
200
300
400
500
600
700
800
900
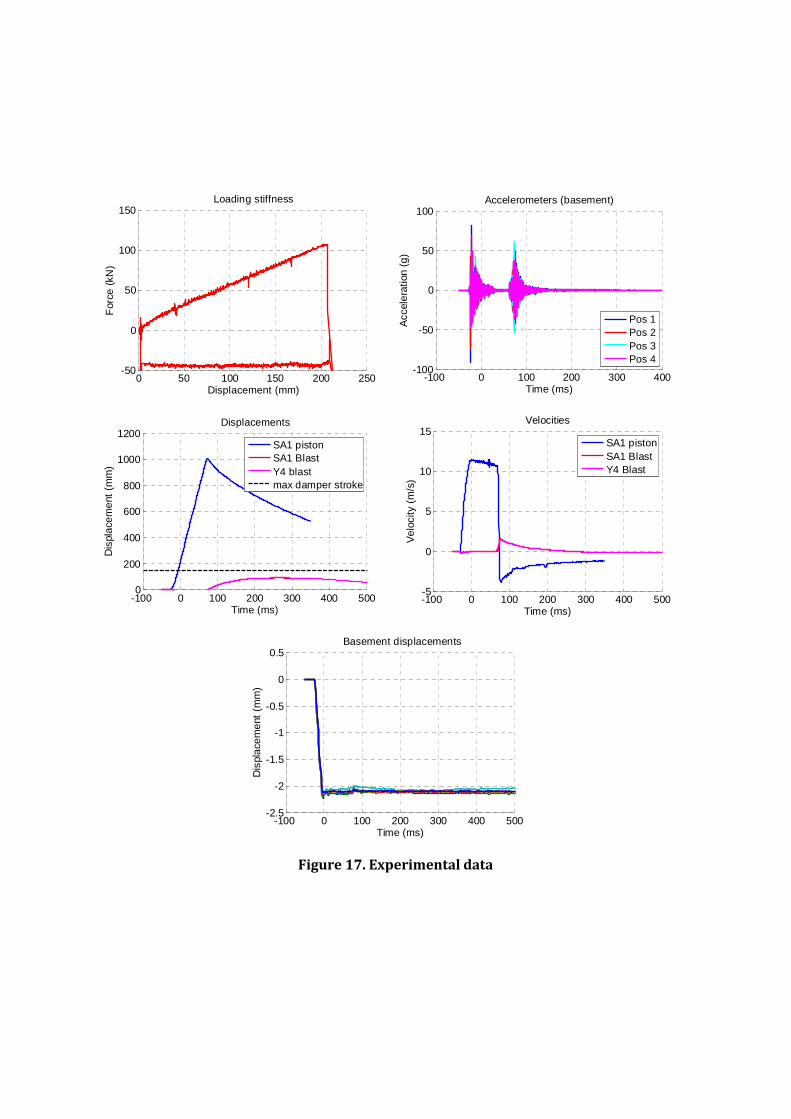
Figure 17. Experimental data
0 50 100 150 200 250-50
0
50
100
150Loading stiffness
For
ce (
kN)
Displacement (mm)-100 0 100 200 300 400
-100
-50
0
50
100Accelerometers (basement)
Acc
eler
atio
n (g
)Time (ms)
Pos 1Pos 2Pos 3Pos 4
-100 0 100 200 300 400 5000
200
400
600
800
1000
1200Displacements
Time (ms)
Dis
plac
emen
t (m
m)
SA1 pistonSA1 BlastY4 blastmax damper stroke
-100 0 100 200 300 400 500-5
0
5
10
15Velocities
Time (ms)
Vel
ocity
(m
/s)
SA1 pistonSA1 BlastY4 Blast
-100 0 100 200 300 400 500-2.5
-2
-1.5
-1
-0.5
0
0.5Basement displacements
Dis
plac
emen
t (m
m)
Time (ms)
Blast 4
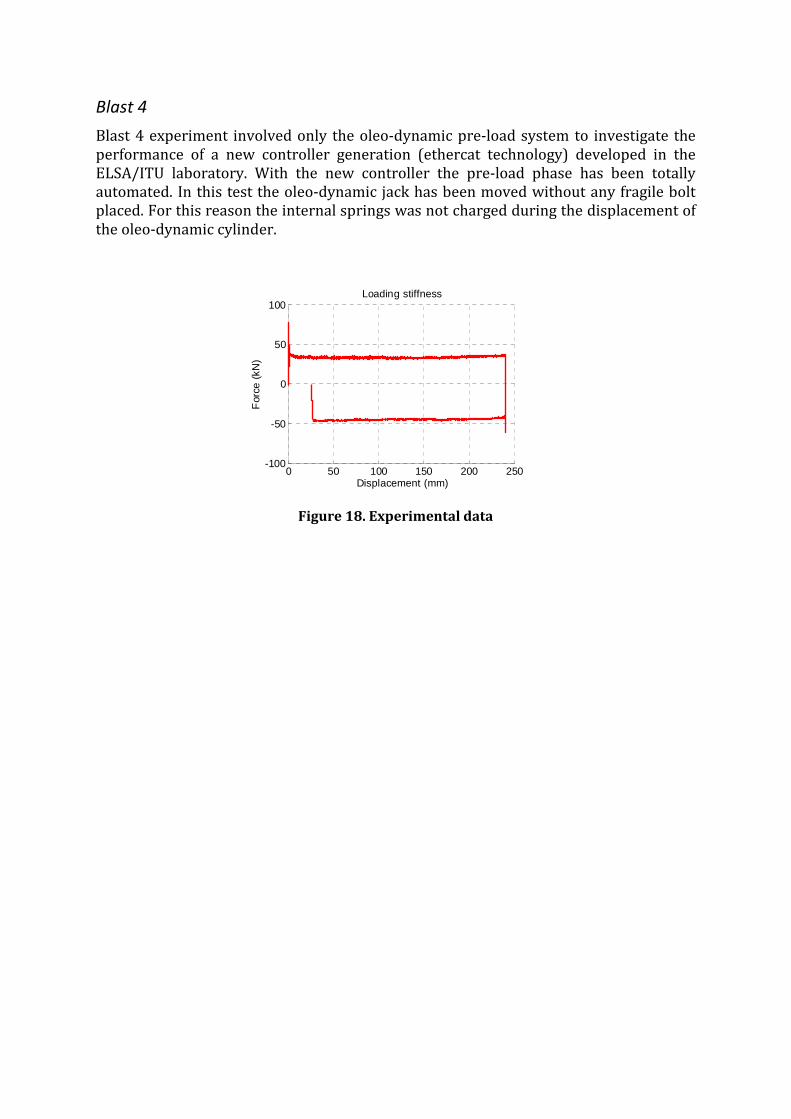
Blast 4 experiment involved only the oleo-dynamic pre-load system to investigate the
performance of a new controller generation (ethercat technology) developed in the
ELSA/ITU laboratory. With the new controller the pre-load phase has been totally
automated. In this test the oleo-dynamic jack has been moved without any fragile bolt
placed. For this reason the internal springs was not charged during the displacement of
the oleo-dynamic cylinder.
Figure 18. Experimental data
0 50 100 150 200 250-100
-50
0
50
100Loading stiffness
For
ce (
kN)
Displacement (mm)

Blast 5
Blast 5 experiment involved the complete setup, shown in figure 7-9, concerning the
acceleration of a mass against a rigid wall. To absorb part of the impacting energy an
aluminum tube has been placed between the two impacting plates as shock absorber. As
in the preview tests only the propulsion energy stored in the springs has been used. To
check the performances of the rail structure the stored energy has been limited using a
low strength fragile bolt of 5 mm diameter. Unfortunately, due to unexpected
connection problems the acquisition of SA1 Photron camera failed during the
experiment. Also the load cells applied between the impact plate and the aluminum
mass did not work correctly because of an unexpected movement of the impact plates.
Figure 19. Camera acquisitions and computed targets.
Camera Y4
1 2
3 4
5 6
7 8
9 10
11 12 13
14 15
100 200 300 400 500 600 700 800 900 1000
100
200
300
400
500
600
700
800
900
1000
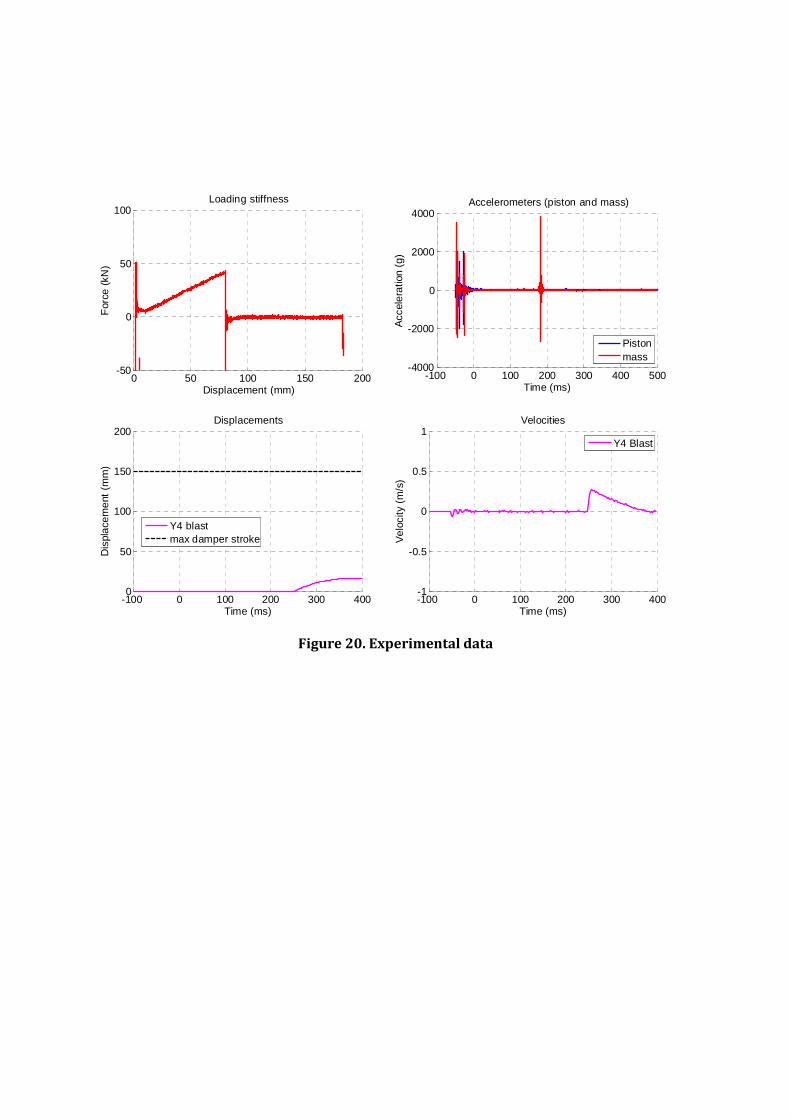
Figure 20. Experimental data
0 50 100 150 200-50
0
50
100Loading stiffness
For
ce (
kN)
Displacement (mm)-100 0 100 200 300 400 500
-4000
-2000
0
2000
4000Accelerometers (piston and mass)
Acc
eler
atio
n (g
)Time (ms)
Pistonmass
-100 0 100 200 300 4000
50
100
150
200Displacements
Time (ms)
Dis
plac
emen
t (m
m)
Y4 blastmax damper stroke
-100 0 100 200 300 400-1
-0.5
0
0.5
1Velocities
Time (ms)
Vel
ocity
(m
/s)
Y4 Blast
Blast 6
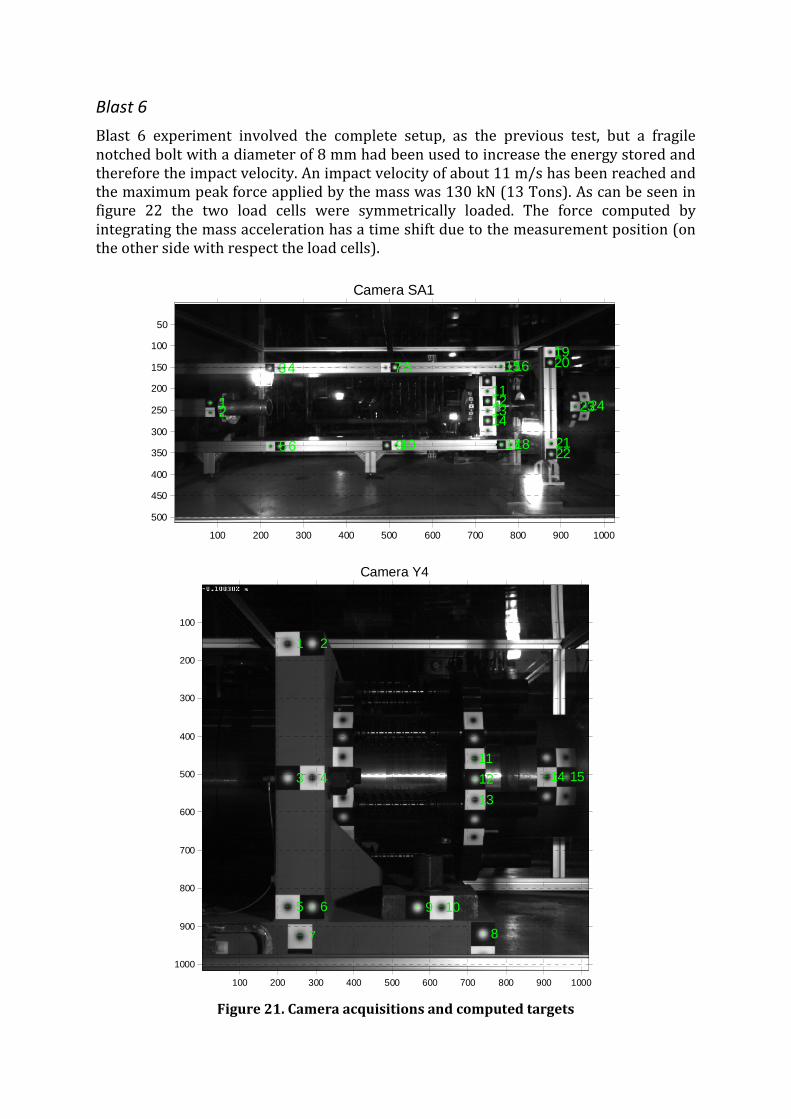
Blast 6 experiment involved the complete setup, as the previous test, but a fragile
notched bolt with a diameter of 8 mm had been used to increase the energy stored and
therefore the impact velocity. An impact velocity of about 11 m/s has been reached and
the maximum peak force applied by the mass was 130 kN (13 Tons). As can be seen in
figure 22 the two load cells were symmetrically loaded. The force computed by
integrating the mass acceleration has a time shift due to the measurement position (on
the other side with respect the load cells).
Figure 21. Camera acquisitions and computed targets
Camera SA1
1 2
3 4
5 6
7 8
9 10
11 12 13 14
15 16
17 18
19 20
21 22
23 24
100 200 300 400 500 600 700 800 900 1000
50
100
150
200
250
300
350
400
450
500
Camera Y4
1 2
3 4
5 6
7 8
9 10
11
12
13
14 15
100 200 300 400 500 600 700 800 900 1000
100
200
300
400
500
600
700
800
900
1000
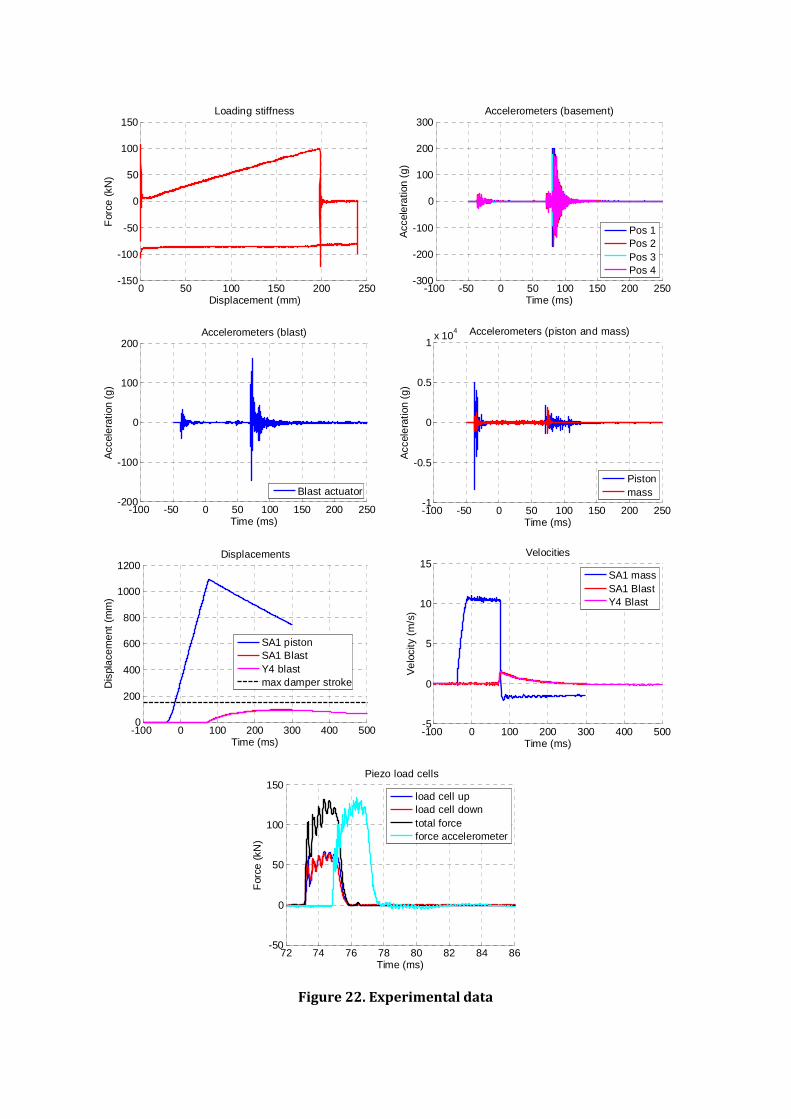
Figure 22. Experimental data
0 50 100 150 200 250-150
-100
-50
0
50
100
150Loading stiffness
For
ce (
kN)
Displacement (mm)-100 -50 0 50 100 150 200 250
-300
-200
-100
0
100
200
300Accelerometers (basement)
Acc
eler
atio
n (g
)
Time (ms)
Pos 1Pos 2Pos 3Pos 4
-100 -50 0 50 100 150 200 250-200
-100
0
100
200Accelerometers (blast)
Acc
eler
atio
n (g
)
Time (ms)
Blast actuator
-100 -50 0 50 100 150 200 250-1
-0.5
0
0.5
1x 10
4 Accelerometers (piston and mass)
Acc
eler
atio
n (g
)
Time (ms)
Pistonmass
-100 0 100 200 300 400 5000
200
400
600
800
1000
1200Displacements
Time (ms)
Dis
plac
emen
t (m
m)
SA1 pistonSA1 BlastY4 blastmax damper stroke
-100 0 100 200 300 400 500-5
0
5
10
15Velocities
Time (ms)
Vel
ocity
(m
/s)
SA1 massSA1 BlastY4 Blast
72 74 76 78 80 82 84 86-50
0
50
100
150Piezo load cells
For
ce (
kN)
Time (ms)
load cell upload cell downtotal forceforce accelerometer
Blast 7
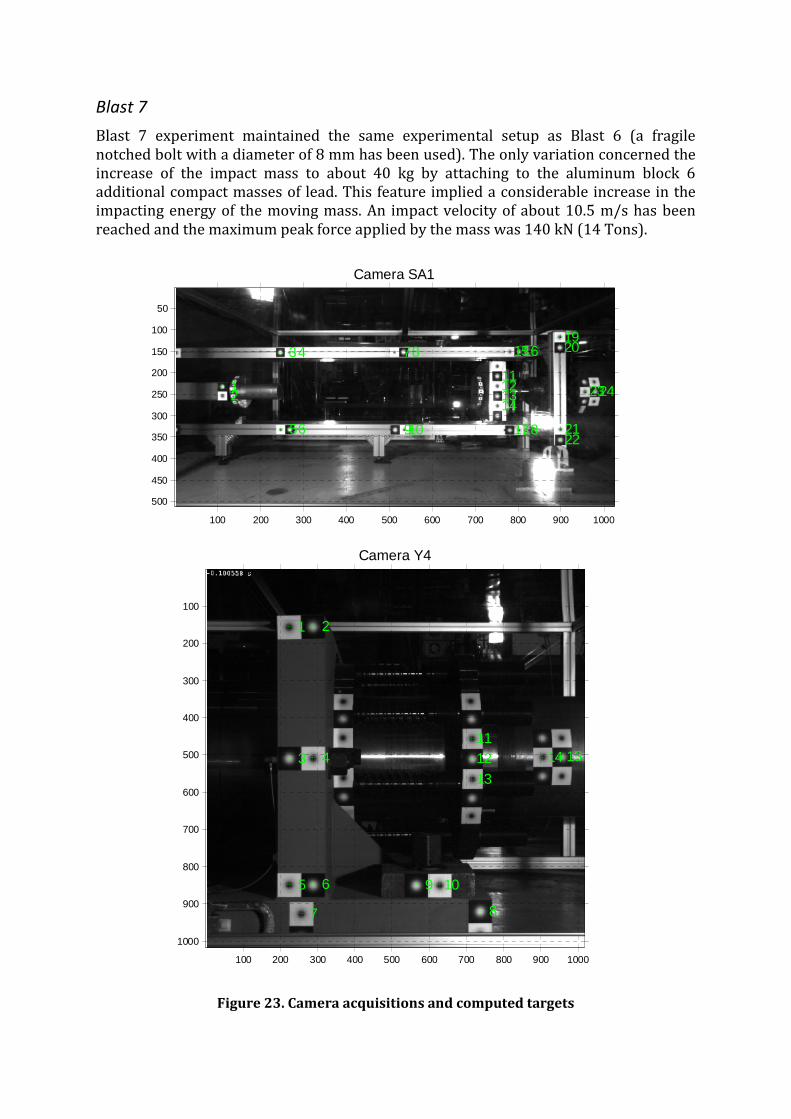
Blast 7 experiment maintained the same experimental setup as Blast 6 (a fragile
notched bolt with a diameter of 8 mm has been used). The only variation concerned the
increase of the impact mass to about 40 kg by attaching to the aluminum block 6
additional compact masses of lead. This feature implied a considerable increase in the
impacting energy of the moving mass. An impact velocity of about 10.5 m/s has been
reached and the maximum peak force applied by the mass was 140 kN (14 Tons).
Figure 23. Camera acquisitions and computed targets
Camera SA1
1 2
3 4
5 6
7 8
9 10
11 12 13 14
15 16
17 18
19 20
21 22
23 24
100 200 300 400 500 600 700 800 900 1000
50
100
150
200
250
300
350
400
450
500
Camera Y4
1 2
3 4
5 6
7 8
9 10
11 12 13
14 15
100 200 300 400 500 600 700 800 900 1000
100
200
300
400
500
600
700
800
900
1000
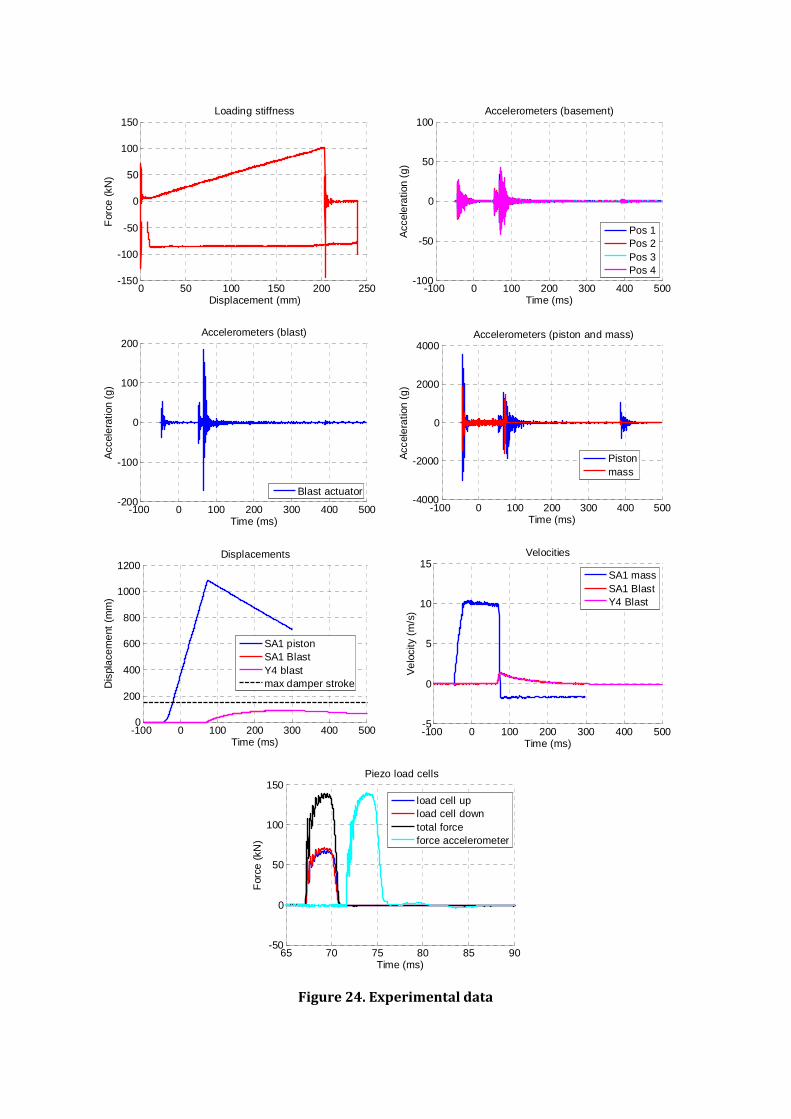
Figure 24. Experimental data
0 50 100 150 200 250-150
-100
-50
0
50
100
150Loading stiffness
For
ce (
kN)
Displacement (mm)-100 0 100 200 300 400 500
-100
-50
0
50
100Accelerometers (basement)
Acc
eler
atio
n (g
)
Time (ms)
Pos 1Pos 2Pos 3Pos 4
-100 0 100 200 300 400 500-200
-100
0
100
200Accelerometers (blast)
Acc
eler
atio
n (g
)
Time (ms)
Blast actuator
-100 0 100 200 300 400 500-4000
-2000
0
2000
4000Accelerometers (piston and mass)
Acc
eler
atio
n (g
)
Time (ms)
Pistonmass
-100 0 100 200 300 400 5000
200
400
600
800
1000
1200Displacements
Time (ms)
Dis
plac
emen
t (m
m)
SA1 pistonSA1 BlastY4 blastmax damper stroke
-100 0 100 200 300 400 500-5
0
5
10
15Velocities
Time (ms)
Vel
ocity
(m
/s)
SA1 massSA1 BlastY4 Blast
65 70 75 80 85 90-50
0
50
100
150Piezo load cells
For
ce (
kN)
Time (ms)
load cell upload cell downtotal forceforce accelerometer
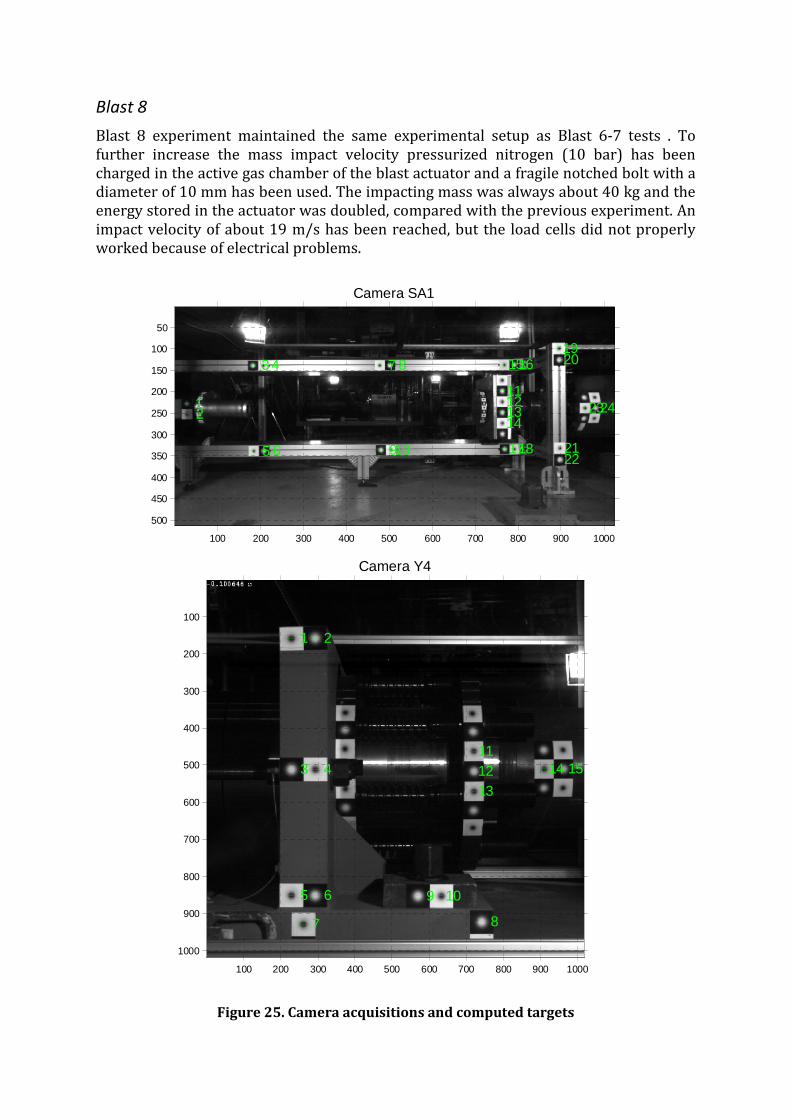
Blast 8
Blast 8 experiment maintained the same experimental setup as Blast 6-7 tests . To
further increase the mass impact velocity pressurized nitrogen (10 bar) has been
charged in the active gas chamber of the blast actuator and a fragile notched bolt with a
diameter of 10 mm has been used. The impacting mass was always about 40 kg and the
energy stored in the actuator was doubled, compared with the previous experiment. An
impact velocity of about 19 m/s has been reached, but the load cells did not properly
worked because of electrical problems.
Figure 25. Camera acquisitions and computed targets
Camera SA1
1 2
3 4
5 6
7 8
9 10
11 12 13 14
15 16
17 18
19 20
21 22
23 24
100 200 300 400 500 600 700 800 900 1000
50
100
150
200
250
300
350
400
450
500
Camera Y4
1 2
3 4
5 6
7 8
9 10
11 12 13
14 15
100 200 300 400 500 600 700 800 900 1000
100
200
300
400
500
600
700
800
900
1000
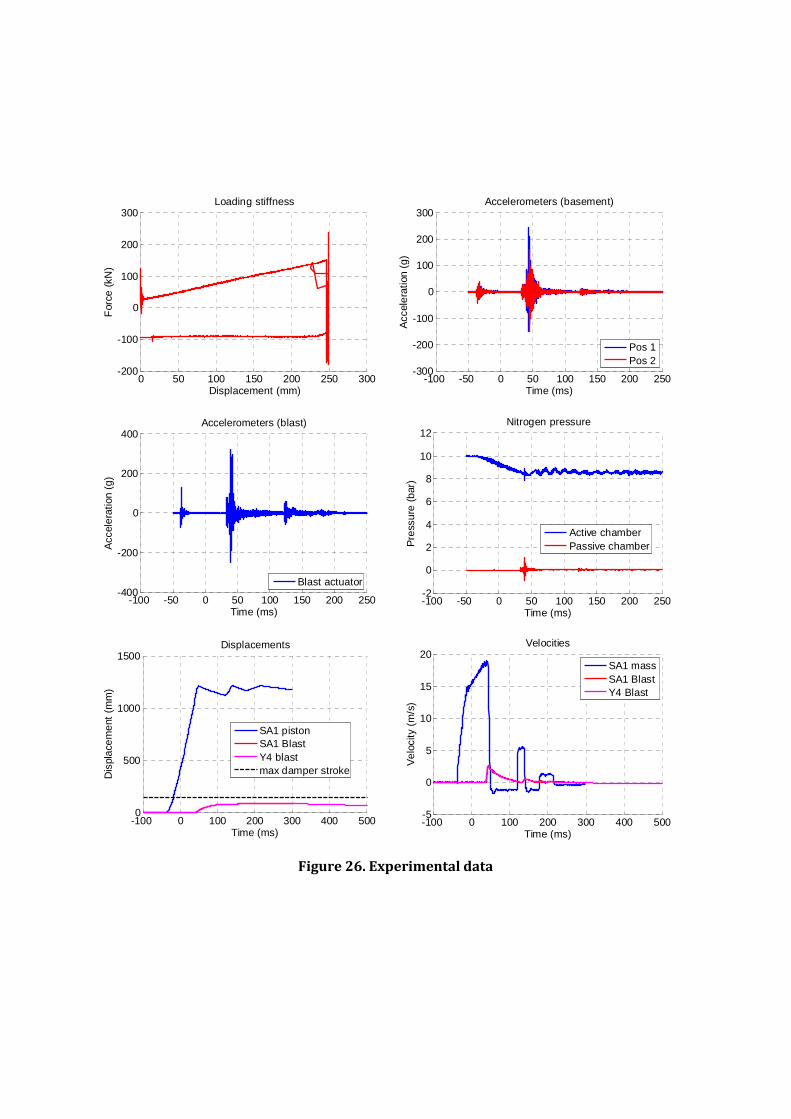
Figure 26. Experimental data
0 50 100 150 200 250 300-200
-100
0
100
200
300Loading stiffness
For
ce (
kN)
Displacement (mm)-100 -50 0 50 100 150 200 250
-300
-200
-100
0
100
200
300Accelerometers (basement)
Acc
eler
atio
n (g
)Time (ms)
Pos 1Pos 2
-100 -50 0 50 100 150 200 250-400
-200
0
200
400Accelerometers (blast)
Acc
eler
atio
n (g
)
Time (ms)
Blast actuator
-100 -50 0 50 100 150 200 250-2
0
2
4
6
8
10
12Nitrogen pressure
Pre
ssur
e (b
ar)
Time (ms)
Active chamberPassive chamber
-100 0 100 200 300 400 5000
500
1000
1500Displacements
Time (ms)
Dis
plac
emen
t (m
m)
SA1 pistonSA1 BlastY4 blastmax damper stroke
-100 0 100 200 300 400 500-5
0
5
10
15
20Velocities
Time (ms)
Vel
ocity
(m
/s)
SA1 massSA1 BlastY4 Blast
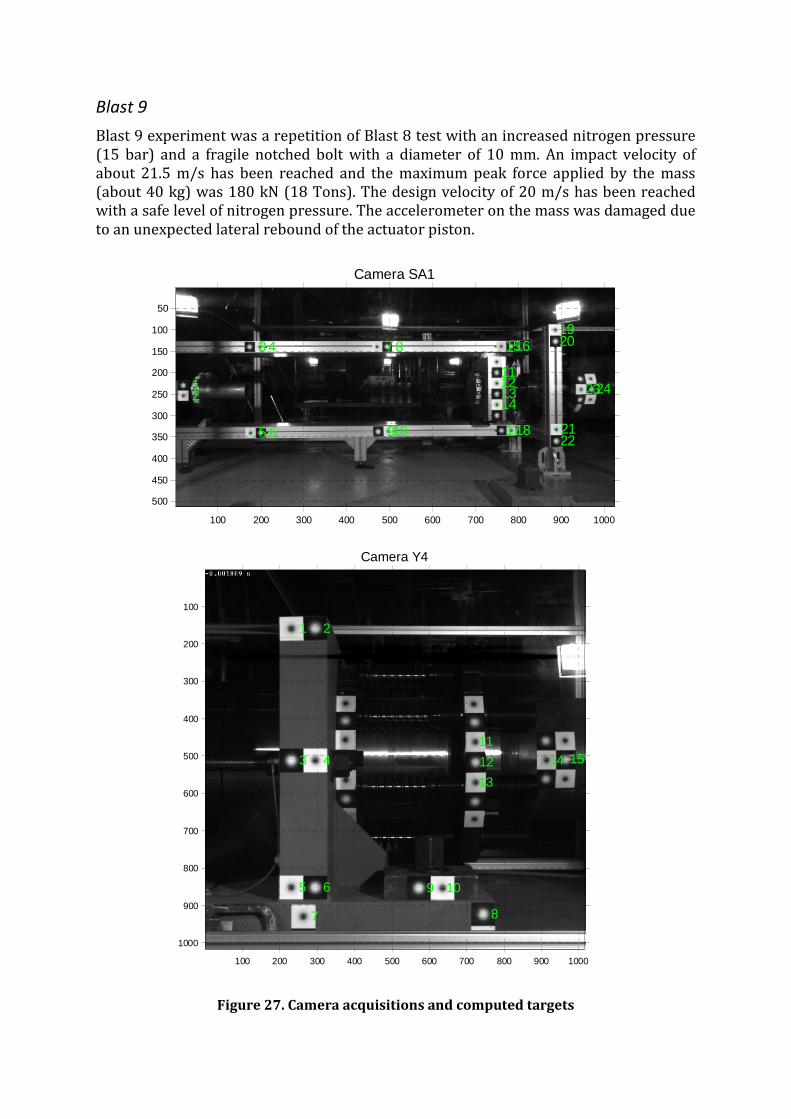
Blast 9
Blast 9 experiment was a repetition of Blast 8 test with an increased nitrogen pressure
(15 bar) and a fragile notched bolt with a diameter of 10 mm. An impact velocity of
about 21.5 m/s has been reached and the maximum peak force applied by the mass
(about 40 kg) was 180 kN (18 Tons). The design velocity of 20 m/s has been reached
with a safe level of nitrogen pressure. The accelerometer on the mass was damaged due
to an unexpected lateral rebound of the actuator piston.
Figure 27. Camera acquisitions and computed targets
Camera SA1
1 2
3 4
5 6
7 8
9 10
11 12 13 14
15 16
17 18
19 20
21 22
23 24
100 200 300 400 500 600 700 800 900 1000
50
100
150
200
250
300
350
400
450
500
Camera Y4
1 2
3 4
5 6
7 8
9 10
11
12
13
14 15
100 200 300 400 500 600 700 800 900 1000
100
200
300
400
500
600
700
800
900
1000
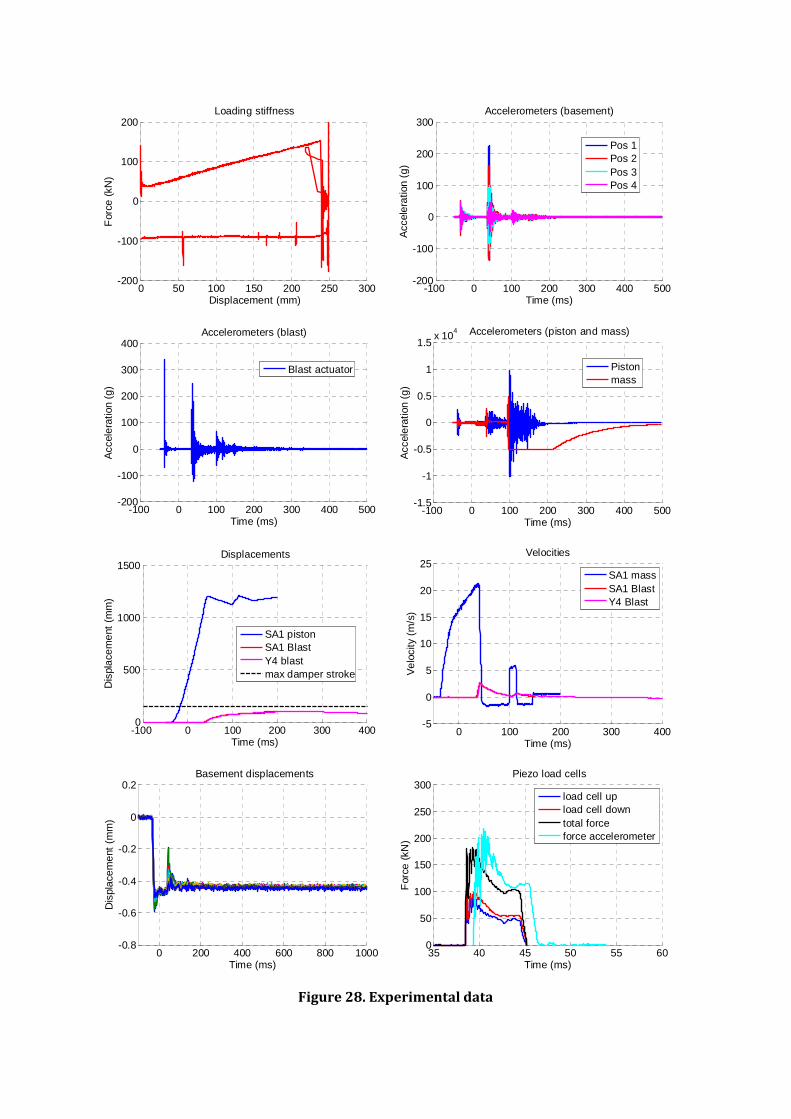
Figure 28. Experimental data
0 50 100 150 200 250 300-200
-100
0
100
200Loading stiffness
For
ce (
kN)
Displacement (mm)-100 0 100 200 300 400 500
-200
-100
0
100
200
300Accelerometers (basement)
Acc
eler
atio
n (g
)
Time (ms)
Pos 1Pos 2Pos 3Pos 4
-100 0 100 200 300 400 500-200
-100
0
100
200
300
400Accelerometers (blast)
Acc
eler
atio
n (g
)
Time (ms)
Blast actuator
-100 0 100 200 300 400 500-1.5
-1
-0.5
0
0.5
1
1.5x 10
4 Accelerometers (piston and mass)
Acc
eler
atio
n (g
)
Time (ms)
Pistonmass
-100 0 100 200 300 4000
500
1000
1500Displacements
Time (ms)
Dis
plac
emen
t (m
m)
SA1 pistonSA1 BlastY4 blastmax damper stroke
0 100 200 300 400-5
0
5
10
15
20
25Velocities
Time (ms)
Vel
ocity
(m
/s)
SA1 massSA1 BlastY4 Blast
0 200 400 600 800 1000-0.8
-0.6
-0.4
-0.2
0
0.2Basement displacements
Dis
plac
emen
t (m
m)
Time (ms)35 40 45 50 55 600
50
100
150
200
250
300Piezo load cells
For
ce (
kN)
Time (ms)
load cell upload cell downtotal forceforce accelerometer
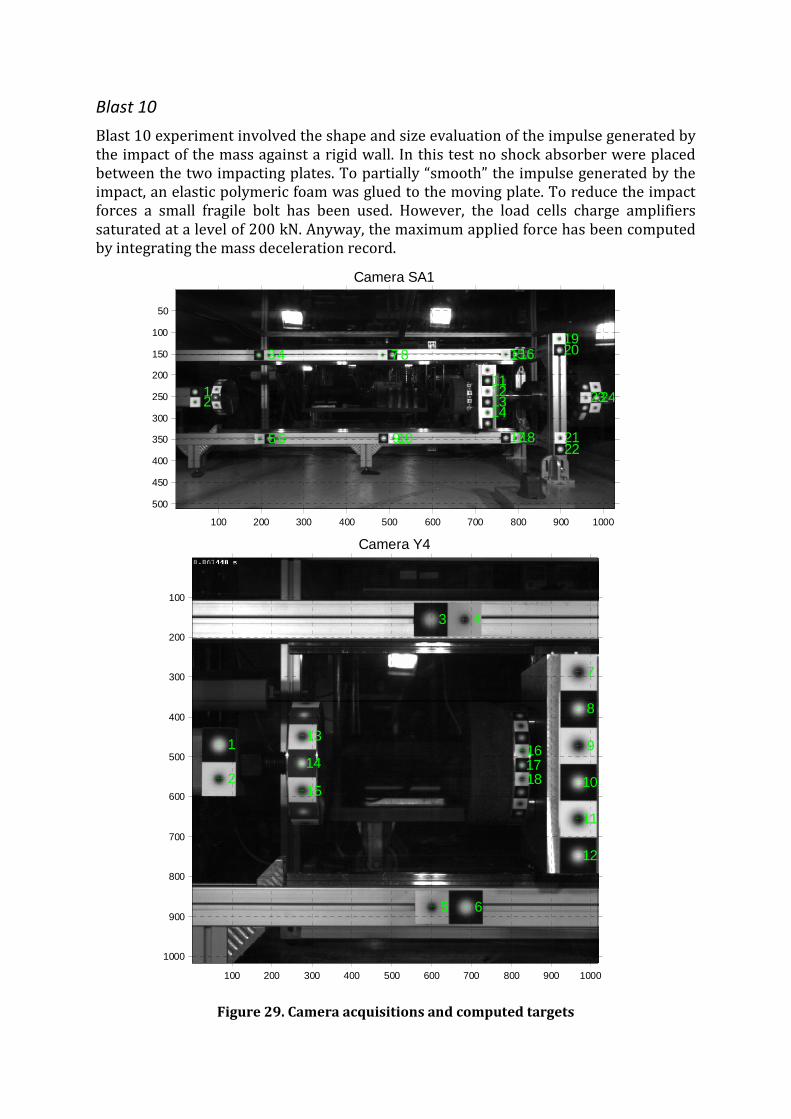
Blast 10
Blast 10 experiment involved the shape and size evaluation of the impulse generated by
the impact of the mass against a rigid wall. In this test no shock absorber were placed
between the two impacting plates. To partially “smooth” the impulse generated by the
impact, an elastic polymeric foam was glued to the moving plate. To reduce the impact
forces a small fragile bolt has been used. However, the load cells charge amplifiers
saturated at a level of 200 kN. Anyway, the maximum applied force has been computed
by integrating the mass deceleration record.
Figure 29. Camera acquisitions and computed targets
Camera SA1
1 2
3 4
5 6
7 8
9 10
11 12 13 14
15 16
17 18
19 20
21 22
23 24
100 200 300 400 500 600 700 800 900 1000
50
100
150
200
250
300
350
400
450
500
Camera Y4
1
2
3 4
5 6
7
8
9
10
11
12
13
14
15
16 17 18
100 200 300 400 500 600 700 800 900 1000
100
200
300
400
500
600
700
800
900
1000

Figure 30. Experimental data
0 50 100 150 200 250 300-200
-100
0
100
200Loading stiffness
For
ce (
kN)
Displacement (mm)-100 0 100 200 300 400 500
-1.5
-1
-0.5
0
0.5
1
1.5x 10
4 Accelerometers (piston and mass)
Acc
eler
atio
n (g
)Time (ms)
Pistonmass
-50 0 50 100 150 200 250 3000
500
1000
1500Displacements
Time (ms)
Dis
plac
emen
t (m
m)
SA1 massSA1 BlastY4 massmax damper stroke
-50 0 50 100 150 200 250 300-10
-5
0
5
10Velocities
Time (ms)
Vel
ocity
(m
/s)
SA1 massSA1 BlastY4 massY4 plate
90 95 100 105 110 115 120-100
0
100
200
300
400
500Piezo load cells
For
ce (
kN)
Time (ms)
load cell upload cell downtotal forceforce accelerometer
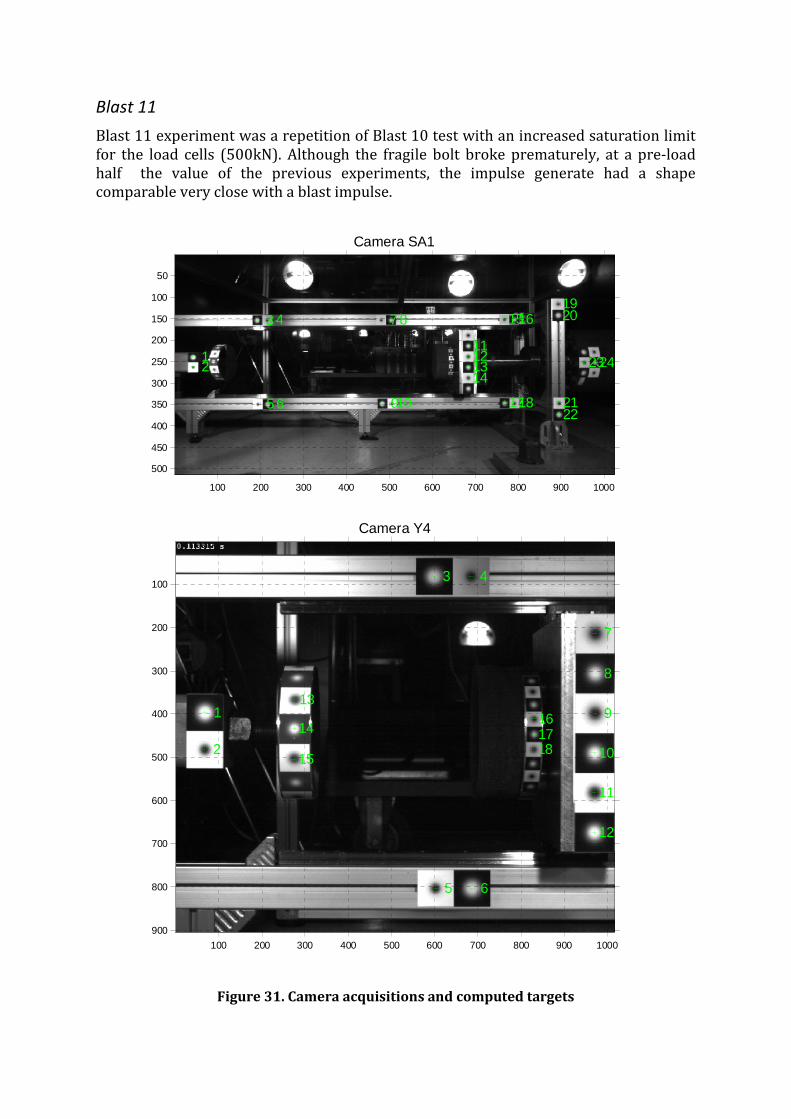
Blast 11
Blast 11 experiment was a repetition of Blast 10 test with an increased saturation limit
for the load cells (500kN). Although the fragile bolt broke prematurely, at a pre-load
half the value of the previous experiments, the impulse generate had a shape
comparable very close with a blast impulse.
Figure 31. Camera acquisitions and computed targets
Camera SA1
1 2
3 4
5 6
7 8
9 10
11 12 13 14
15 16
17 18
19 20
21 22
23 24
100 200 300 400 500 600 700 800 900 1000
50
100
150
200
250
300
350
400
450
500
Camera Y4
1
2
3 4
5 6
7
8
9
10
11
12
13
14
15
16 17 18
100 200 300 400 500 600 700 800 900 1000
100
200
300
400
500
600
700
800
900
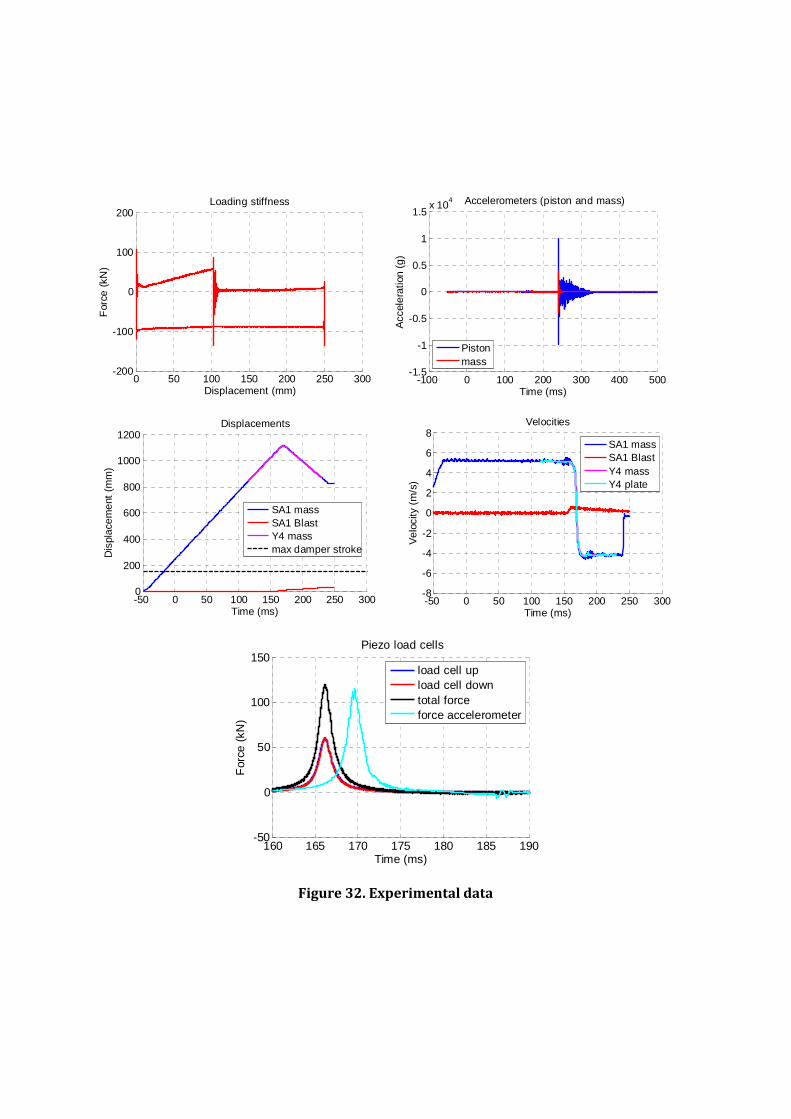
Figure 32. Experimental data
0 50 100 150 200 250 300-200
-100
0
100
200Loading stiffness
For
ce (
kN)
Displacement (mm)-100 0 100 200 300 400 500
-1.5
-1
-0.5
0
0.5
1
1.5x 10
4 Accelerometers (piston and mass)
Acc
eler
atio
n (g
)Time (ms)
Pistonmass
-50 0 50 100 150 200 250 3000
200
400
600
800
1000
1200Displacements
Time (ms)
Dis
plac
emen
t (m
m)
SA1 massSA1 BlastY4 massmax damper stroke
-50 0 50 100 150 200 250 300-8
-6
-4
-2
0
2
4
6
8Velocities
Time (ms)
Vel
ocity
(m
/s)
SA1 massSA1 BlastY4 massY4 plate
160 165 170 175 180 185 190-50
0
50
100
150Piezo load cells
For
ce (
kN)
Time (ms)
load cell upload cell downtotal forceforce accelerometer
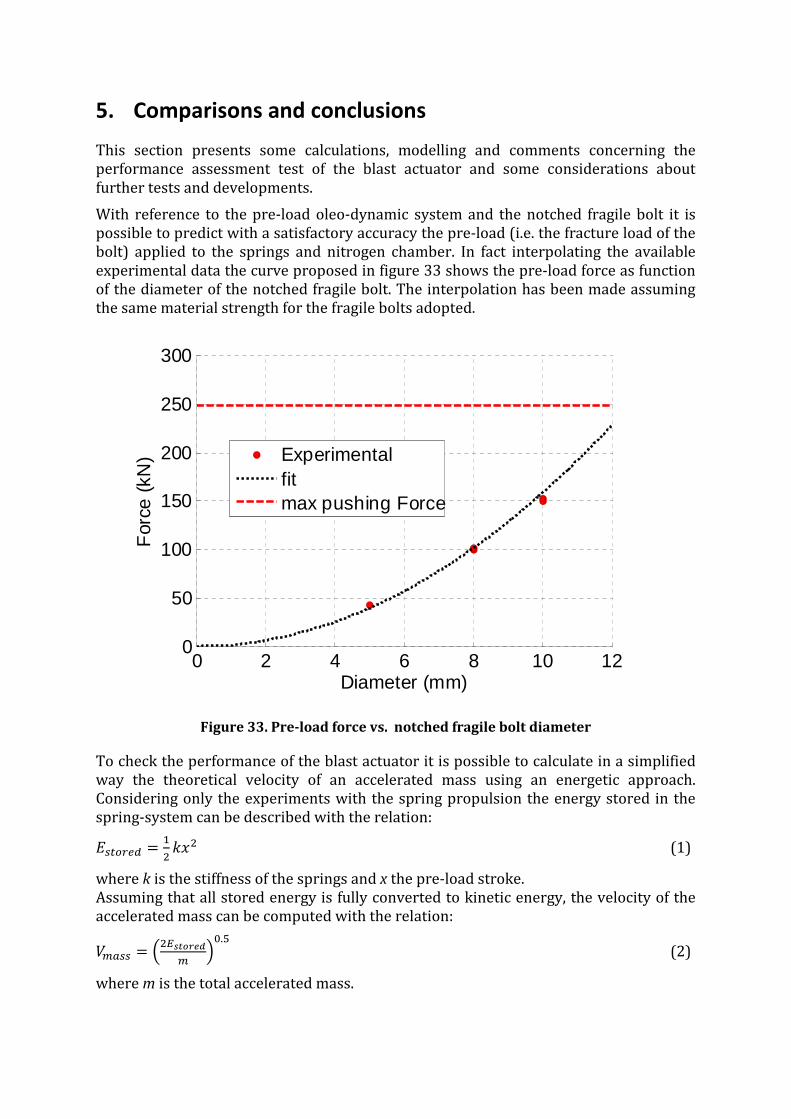
5. Comparisons and conclusions
This section presents some calculations, modelling and comments concerning the
performance assessment test of the blast actuator and some considerations about
further tests and developments.
With reference to the pre-load oleo-dynamic system and the notched fragile bolt it is
possible to predict with a satisfactory accuracy the pre-load (i.e. the fracture load of the
bolt) applied to the springs and nitrogen chamber. In fact interpolating the available
experimental data the curve proposed in figure 33 shows the pre-load force as function
of the diameter of the notched fragile bolt. The interpolation has been made assuming
the same material strength for the fragile bolts adopted.
Figure 33. Pre-load force vs. notched fragile bolt diameter
To check the performance of the blast actuator it is possible to calculate in a simplified
way the theoretical velocity of an accelerated mass using an energetic approach.
Considering only the experiments with the spring propulsion the energy stored in the
spring-system can be described with the relation:
������� = ��
(1)
where k is the stiffness of the springs and x the pre-load stroke.
Assuming that all stored energy is fully converted to kinetic energy, the velocity of the
accelerated mass can be computed with the relation:
���� = ��������� ��.�
(2)
where m is the total accelerated mass.
0 2 4 6 8 10 120
50
100
150
200
250
300
Diameter (mm)
For
ce (
kN)
Experimentalfitmax pushing Force
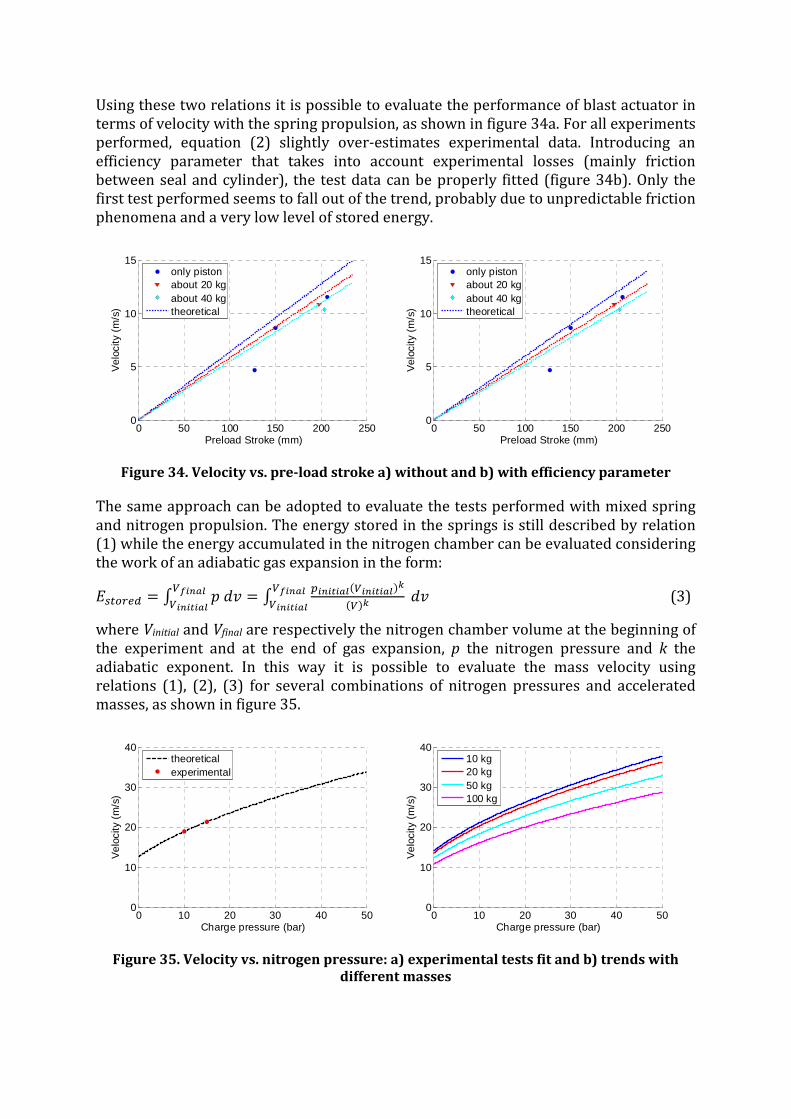
Using these two relations it is possible to evaluate the performance of blast actuator in
terms of velocity with the spring propulsion, as shown in figure 34a. For all experiments
performed, equation (2) slightly over-estimates experimental data. Introducing an
efficiency parameter that takes into account experimental losses (mainly friction
between seal and cylinder), the test data can be properly fitted (figure 34b). Only the
first test performed seems to fall out of the trend, probably due to unpredictable friction
phenomena and a very low level of stored energy.
Figure 34. Velocity vs. pre-load stroke a) without and b) with efficiency parameter
The same approach can be adopted to evaluate the tests performed with mixed spring
and nitrogen propulsion. The energy stored in the springs is still described by relation
(1) while the energy accumulated in the nitrogen chamber can be evaluated considering
the work of an adiabatic gas expansion in the form:
������� = � �� !"#$%&!#$#�#%& = � '#$#�#%&(!#$#�#%&)*
(!)* � !"#$%&!#$#�#%& (3)
where Vinitial and Vfinal are respectively the nitrogen chamber volume at the beginning of
the experiment and at the end of gas expansion, p the nitrogen pressure and k the
adiabatic exponent. In this way it is possible to evaluate the mass velocity using
relations (1), (2), (3) for several combinations of nitrogen pressures and accelerated
masses, as shown in figure 35.
Figure 35. Velocity vs. nitrogen pressure: a) experimental tests fit and b) trends with
different masses
0 50 100 150 200 2500
5
10
15
Vel
ocity
(m
/s)
Preload Stroke (mm)
only pistonabout 20 kgabout 40 kgtheoretical
0 50 100 150 200 2500
5
10
15
Vel
ocity
(m
/s)
Preload Stroke (mm)
only pistonabout 20 kgabout 40 kgtheoretical
0 10 20 30 40 500
10
20
30
40
Vel
ocity
(m
/s)
Charge pressure (bar)
theoreticalexperimental
0 10 20 30 40 500
10
20
30
40
Vel
ocity
(m
/s)
Charge pressure (bar)
10 kg20 kg50 kg100 kg
With the same efficiency parameter introduced before, experimental data can be
properly fitted also in this case and useful estimates of impact mass velocity can be
obtained.
As mentioned in the section 1, the objective of this project is to reproduce, in a testing
laboratory, the pressure impulse generated by an explosion without using explosives.
Assessed the blast actuator performance in terms of accelerated masses and velocities,
another import feature relates to the momentum and the kinetic energy (stored into the
accelerated mass) and their conversion into a pressure impulse. In fact the pressure
impulse onto a structure generated by an explosion has a particular shape that must be
reproduced in order to achieve the same effects on the structure.
To reach this goal it is possible to experimentally control three main parameters: the
impacting mass, the impact velocity and the geometry/mechanical properties of the
material placed between the impacting mass and the structure. This latter is generally a
plastic foamed material.
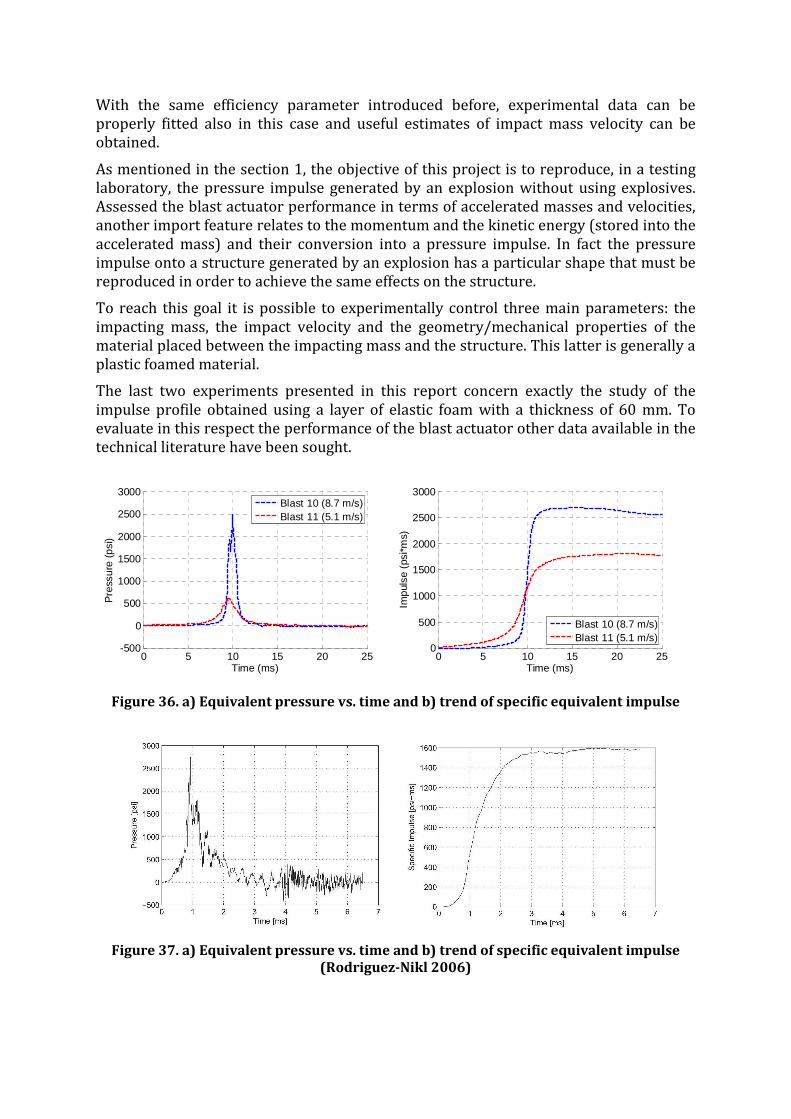
The last two experiments presented in this report concern exactly the study of the
impulse profile obtained using a layer of elastic foam with a thickness of 60 mm. To
evaluate in this respect the performance of the blast actuator other data available in the
technical literature have been sought.
Figure 36. a) Equivalent pressure vs. time and b) trend of specific equivalent impulse
Figure 37. a) Equivalent pressure vs. time and b) trend of specific equivalent impulse
(Rodriguez-Nikl 2006)
0 5 10 15 20 25-500
0
500
1000
1500
2000
2500
3000
Pre
ssur
e (p
si)
Time (ms)
Blast 10 (8.7 m/s)Blast 11 (5.1 m/s)
0 5 10 15 20 250
500
1000
1500
2000
2500
3000
Impu
lse
(psi
*ms)
Time (ms)
Blast 10 (8.7 m/s)Blast 11 (5.1 m/s)
Figure 36 shows experimental results of the Blast 10 and Blast 11 tests in terms of
equivalent pressure (figure 36a) and equivalent specific impulse (figure 36b). English
units have been used for comparison purposes. Figure 37 presents relevant
experimental data from tests on a structural component conducted at the San Diego
Blast Simulator Facility (Rodriguez-Nikl, “Experimental simulations of explosive loading
on structural components: reinforced concrete columns with advanced composite
jackets”, UC San Diego Electronic Theses and Dissertations, 2006).
It is observed that the order of magnitude of the values of the peak pressure and
impulse generated by the impacting mass are perfectly compatible and, as expected, the
impact velocity has a strong influence on these two quantities. It can thus be concluded
with confidence that the developed blast actuator is capable of reproducing through
impact the required pressure levels. A further experimental investigation will be
essential to calibrate the pressure history applied by the mass in order to perform a
large scale test on structural components and reproduce reliably the desired blast
pressure loading profiles.

Annex A: Test procedure
1. Check the pre-stress of Dywidag bar of BLAST base and other
equipment plates
2. Place the fragile bolt and the safety box
3. Check the connection of emergency cable for pumping station
shutdown
4. Switch on the POWER SUPPLIES of i) charge amplifiers, ii)
lamps, iii) high-speed cameras iv) servo-hydraulic system.
5. Transient recorder PC: Launch acquisition software for
transient recorder and high speed cameras
6. Transient recorder PC: Load transient recorder and high speed
cameras configuration files for the tests
7. Transient recorder PC: check the triggering of digital
acquisition systems
8. Servo Controller: Launch controller software
9. Servo Controller: Load acquisition and generator files and start
PID (F3)
10. Pumping station: start the circulation pump (no pressure) to
allow the oil to get warm.
11. Pumping station: Start the low pressure. Verify to have 30÷80
bar.
12. Servo Controller: Consider to make F6 to set Tempo to zero
13. Servo Controller: F1 open ON-OFF valve.
14. Pumping station: Pass to high pressure, verify that the
pressure is 150 bar.
15. Control test PC: Connect transient recorder PC via Remote
Desktop.
16. switch on lamps

17. Control test PC: press “shading”, record, trigger in on SA1
software
18. Control test PC: press “record” on Y4 software and arm the
two acquisition boards of transient recorder
19. Servo Controller: start the ramp generator
20. Blast Actuator Test
21. Switch off lamps
22. Transient recorder PC: save transient recorder and high-speed
camera acquisition

European Commission
EUR 26522 EN – Joint Research Centre – Institute for the Protection and Security of Citizen
Title: BLAST Simulator project: Performance assessment and preliminary tests
Author(s): Marco Peroni, George Solomos, Bernard Viaccoz
Luxembourg: Publications Office of the European Union
2014 – 44 pp. – 21.0 x 29.7 cm
EUR – Scientific and Technical Research series – ISSN 1831-9424
ISBN 978-92-79-35528-8
doi:10.2788/77666
Abstract
The Blast Simulator project involves the development of an apparatus able to reproduce the effects of a blast pressure
wave on large scale structural components (such as columns, walls, etc.) with the objective to improve their strength in
these severe loading situations. This technical report presents the setting up and the performance assessment of the
prototype blast actuator developed at the JRC. The first preliminary tests performed have been described and
evaluated. Satisfactory results have been obtained with respect to impacting masses and velocities and with the finally
obtained pressure values.

z
ISBN 978-92-79-35528-8
doi:10.2788/77666
As the Commission’s in-house science service, the Joint Research Centre’s mission is to provide EU policies with independent, evidence-based scientific and technical support throughout the whole policy cycle. Working in close cooperation with policy Directorates-General, the JRC addresses key societal challenges while stimulating innovation through developing new standards, methods and tools, and sharing and transferring its know-how to the Member States and international community. Key policy areas include: environment and climate change; energy and transport; agriculture and food security; health and consumer protection; information society and digital agenda; safety and security including nuclear; all supported through a cross-cutting and multi-disciplinary approach.
LB-N
A-2
6522-E
N-N


![Pandur Dynamic Driving Simulator - Analysis of mine blast ... · Pandur Dynamic Driving Simulator - Analysis of mine blast effects Armando J. Loureiro da Silva ... mass of 6 [Kg]](https://img.pdfslide.us/doc/110x75/5e6d513b241fb16f2e44f9e7/pandur-dynamic-driving-simulator-analysis-of-mine-blast-pandur-dynamic-driving.jpg)