Embed Size (px)
DESCRIPTION
Best Detailing for blast design.
Citation preview
Blast analysis of complex structures using physics-basedfast-running models
p
David D. Bogosiana,*, Brian W. Dunna, Jon D. Chrostowskib
aKaragozian & Case Structural Engineers, 625 North Maryland Ave, Glendale, CA 91206-2245, USAbACTA Inc., Torrance, California, USA
Abstract
For situations requiring large numbers of parametric analyses, complex nonlinear models are too computationallyintensive to be used. Instead, simpli®ed engineering models (such as single degree of freedom) are often substituted,but at the risk of reduced ®delity in representing the response of the structure. In this paper, a hybrid method is
presented whereby a complex ADINA model of a frame building is combined with a simpli®ed engineering model toyield a physics-based fast-running model for computing the building's response to a range of blast loadings. Thismethod allows realistic modeling of the load±de¯ection characteristics of each lateral load resisting frame (based onthe nonlinear material properties and actual framing and bracing sizes and geometry) while running su�ciently
quickly to allow analysis of numerous loading scenarios. The building analyzed is the Vertical Integration Building(VIB) at Cape Canaveral Air Station in Florida, a more than 200-foot high steel braced frame structure. Its analysisis part of ongoing range safety activities sponsored by the US Air Force 30th and 45th Space Wings, Safety
Directorates. # 1999 Elsevier Science Ltd. All rights reserved.
1. Introduction
The proliferation of nonlinear structural analysis
packages coupled with steady improvements in compu-
tational performance make nonlinear ®nite element
analysis an attractive option for many formerly intract-
able tasks. Nevertheless, classes of problems continue
to exist for which application of detailed, complex
®nite element models is either not practical due to the
intensive computational requirements, or beyond the
budgeted scope of the project. One example of such a
class of problem is a structural response model that
forms the inner core of a Monte Carlo loop, where
sampling is performed over a set of parameters and
the structural response is computed for each combi-
nation. Another example requires computation of
structural response for a set of parametric variations in
order to assess sensitivities or produce response func-
tionals.
In both these instances, the limitation on run time is
quite stringent. An individual analysis must be com-
pleted on the order of seconds, since the total number
of runs may run into the hundreds (in the case of para-
metric studies) or even the tens and hundreds of thou-
sands (for Monte Carlo analyses). In either case, use
of a detailed nonlinear ®nite element model is pre-
cluded. Typically, analysts have turned to much sim-
pler models such as single degree of freedom (SDOF)
Computers and Structures 72 (1999) 81±92
0045-7949/99/$ - see front matter # 1999 Elsevier Science Ltd. All rights reserved.
PII: S0045-7949(99 )00030-9
pSome of the original ®gures for this paper were generated
with a colour-producing terminal and submitted in colour.
* Corresponding author. Tel.: +1-818-240-1919, ext. 111;
fax: +1-818-240-4966.
E-mail address: [email protected] (D.D. Bogosian)
for these applications, thereby compromising much ofthe physical and geometric verisimilitude of the com-
plex model. Constraints of schedule and budget addfurther incentive toward this approximation.This paper documents an alternate approach that
uses a set of parametric calculations to assess the vul-
nerability of a large, complex building to blast fromaccidental explosions. Complex nonlinear models were
used to develop the characteristics of much smaller,faster running, lumped mass and spring models so thatthe fundamental nonlinear physics of the actual struc-
ture were represented in the simpler model to a reason-
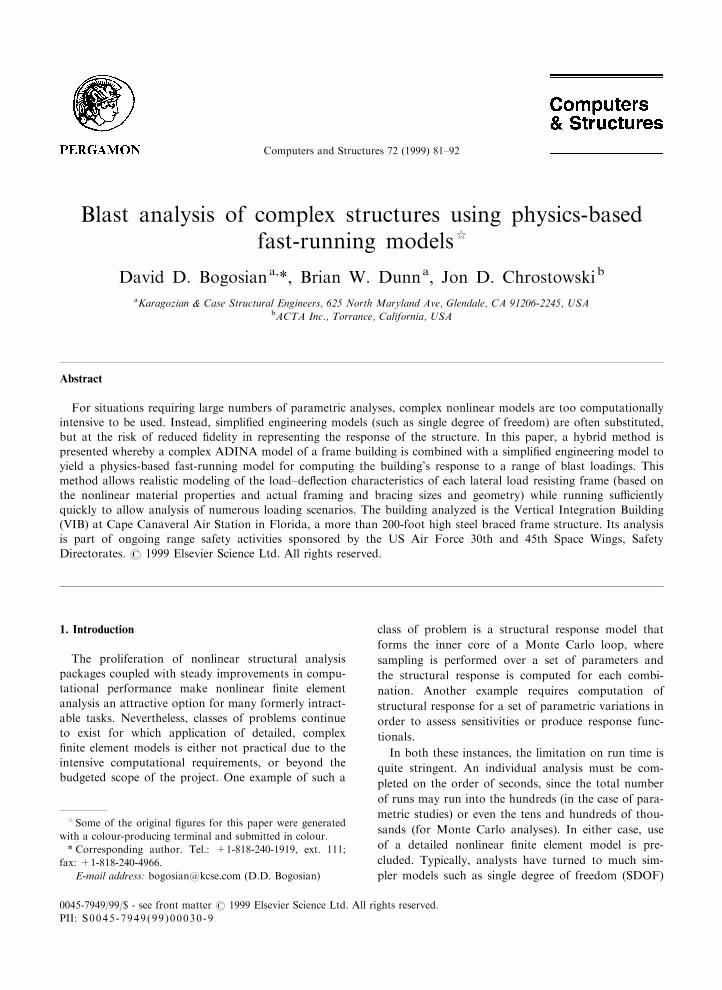
Fig. 1. Flowchart of methodology used to perform blast response analyses.
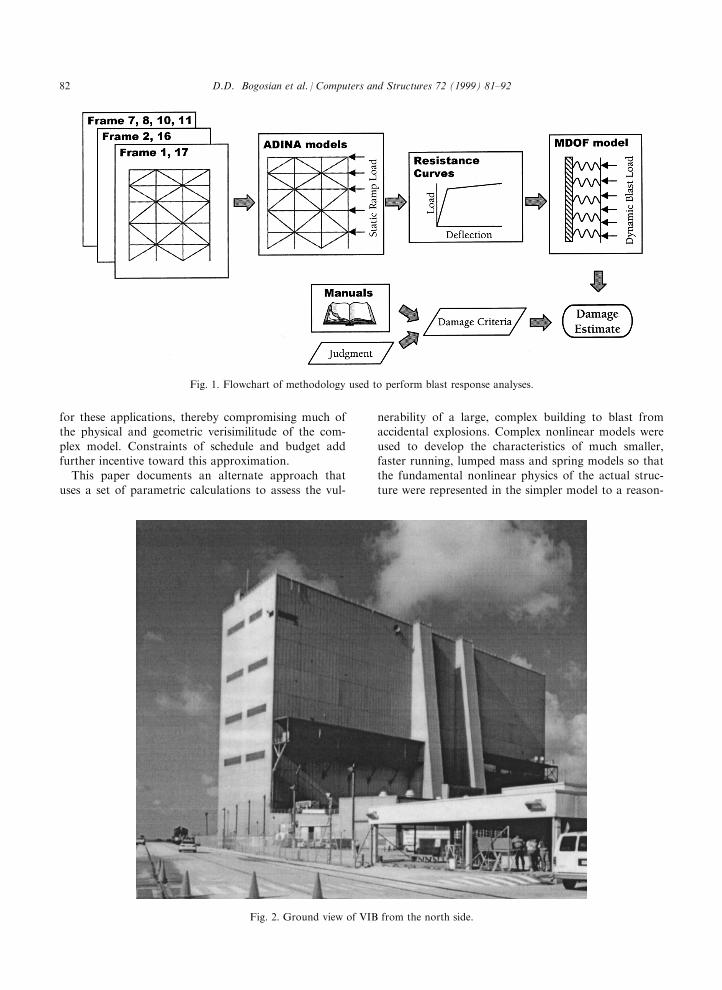
Fig. 2. Ground view of VIB from the north side.
D.D. Bogosian et al. / Computers and Structures 72 (1999) 81±9282
able degree of ®delity. Moreover, the approach is
amenable to incremental improvements in modeling ac-curacy, which can be implemented as desired by theclient to reduce conservatism and re®ne/check theresults of the simpler model, and it is o�ered as a gen-
eric and easily adaptable alternative to other tra-ditional methods. A schematic overview of theapproach is presented in Fig. 1.
2. Case study description
As part of an ongoing e�ort to manage the risks toboth on- and o�-base personnel due to failed space
launches, the US Air Force, 30th and 45th SpaceWings, Safety Directorates have sponsored the devel-opment of analytical tools to predict the probability ofcasualties and/or fatalities resulting from blast e�ects
on buildings. The blast wave would be generated bythe impact of explosive debris (e.g. sections of solidrocket propellant) that detonates in the proximity of a
structure. The models include breakup scenarios forthe launch vehicle that predict the number, size andtrajectory of all fragments for failures at various times
during the early portions of the launch.The particular building that was the subject of this
study, the Vertical Integration Building (VIB), is a
roughly 220 ft high steel frame structure located at
Cape Canaveral Air Station, Florida, and used to
assemble components into completed Titan IV space
launch vehicles. This building was selected because of
its high pro®le and its relatively poor ®t into any of
the generic building categories already being de®ned
for ongoing range safety analyses. A ground view of
the building is seen in Fig. 2; its high-bay portion is
350 ft long by 100 ft wide. An aerial view of the build-
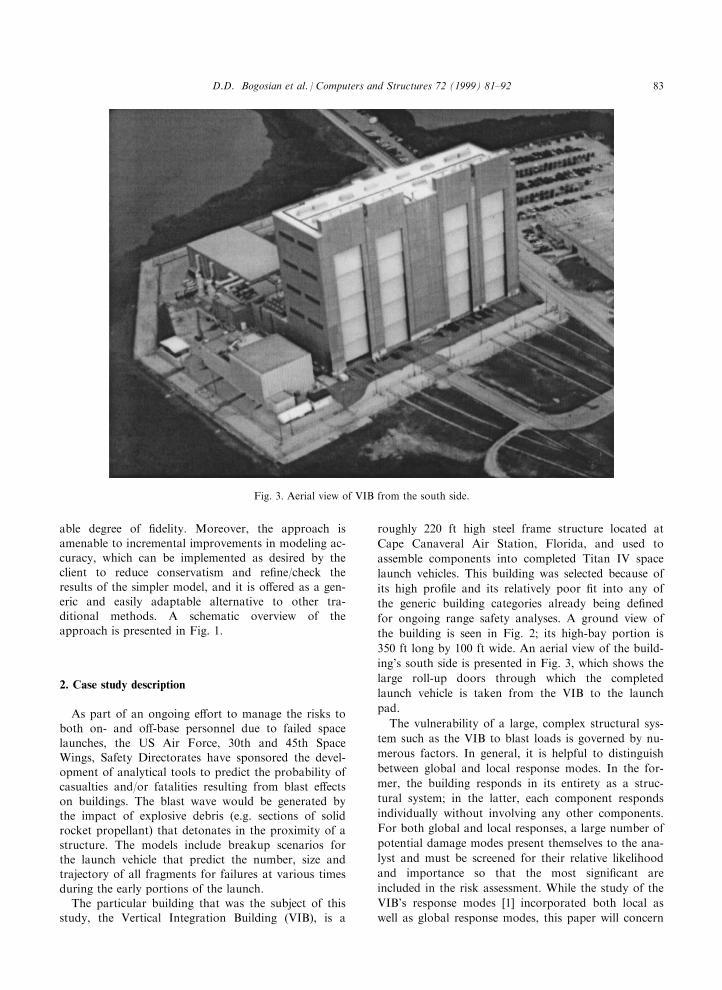
ing's south side is presented in Fig. 3, which shows the
large roll-up doors through which the completed
launch vehicle is taken from the VIB to the launch
pad.
The vulnerability of a large, complex structural sys-
tem such as the VIB to blast loads is governed by nu-
merous factors. In general, it is helpful to distinguish
between global and local response modes. In the for-
mer, the building responds in its entirety as a struc-
tural system; in the latter, each component responds
individually without involving any other components.
For both global and local responses, a large number of
potential damage modes present themselves to the ana-
lyst and must be screened for their relative likelihood
and importance so that the most signi®cant are
included in the risk assessment. While the study of the
VIB's response modes [1] incorporated both local as
well as global response modes, this paper will concern
Fig. 3. Aerial view of VIB from the south side.
D.D. Bogosian et al. / Computers and Structures 72 (1999) 81±92 83
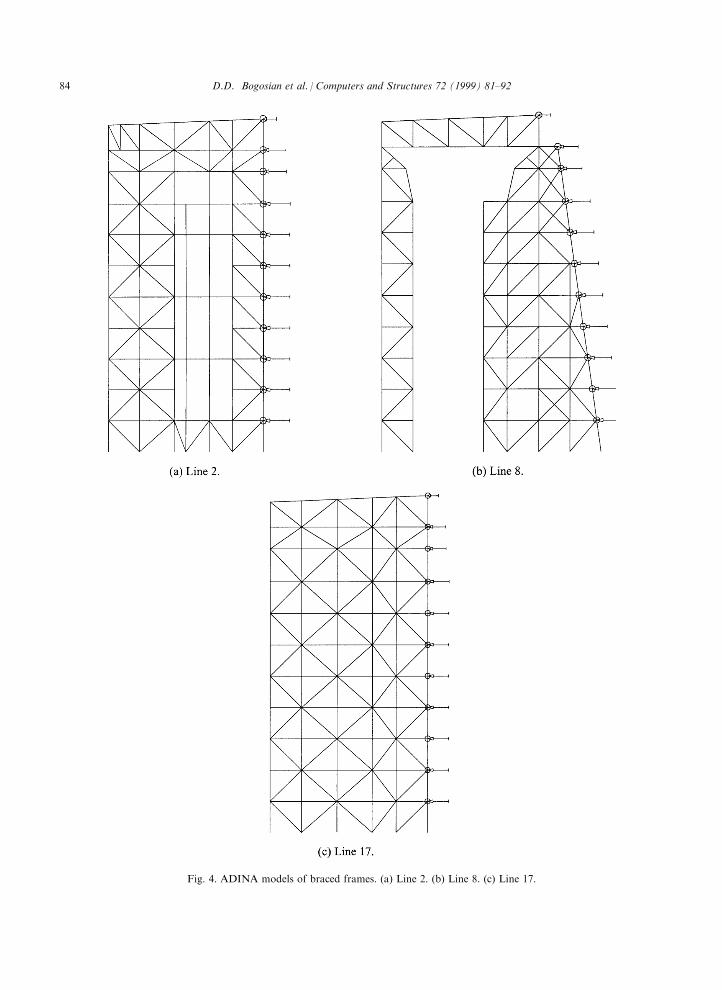
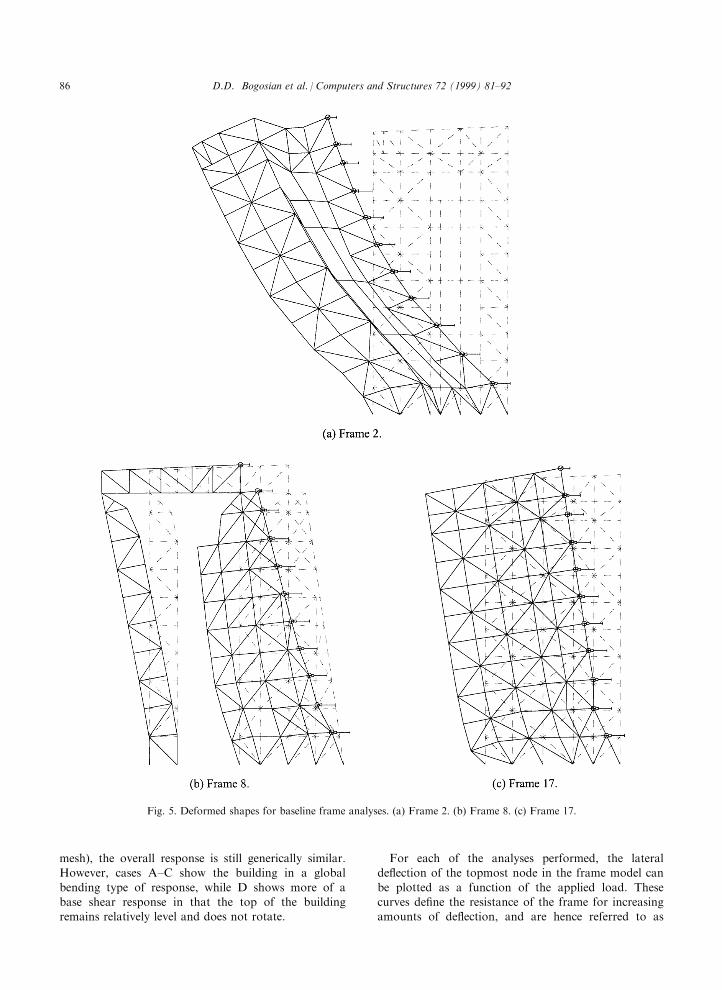
Fig. 4. ADINA models of braced frames. (a) Line 2. (b) Line 8. (c) Line 17.
D.D. Bogosian et al. / Computers and Structures 72 (1999) 81±9284
itself exclusively with the global response of the build-ing to lateral loads.The lateral load resistance of the VIB relies on diag-
onally braced frames in both the North±South (N±S)and East±West (E±W) directions, along exterior col-umn lines and several interior lines. The lateral resist-
ance of the frames in the two directions was assumedto be roughly comparable since it is governed by windloads which are applied uniformly from both direc-
tions. Consequently, the analyses focused exclusivelyon the N±S frames since they are smaller and easier tomodel. Moreover, the global failure mode is only an-ticipated for very large explosive weights at su�cient
distance to generate nearly uniform pressures over theheight and width of the VIB, similar to the designwind load (albeit dynamic instead of steady state).
There are a total of 17 frames running in the N±Sdirection, numbered consecutively from 1 to 17.Consideration of the structural drawings indicated that
eight of these (numbers 1, 2, 7, 8, 10, 11, 16, 17) weresigni®cant contributors to the lateral load resisting ca-pacity. Because of their similarity, only three of theseframes were analyzed (2, 8 and 17) and their character-
istics applied to the others. Thus, the frame on line 8was used to represent lines 7, 10 and 11; line 17 wastaken as representative of line 1; and line 2 was taken
to be representative of line 16.
3. Frame models
Each of the three frames analyzed was modeled
using the ADINA nonlinear ®nite element code [2].This code is able to represent material and geometricnonlinearity and is well suited to the analyses requiredfor this task. Plots of the three models, all of them
two-dimensional, are shown in Fig. 4. Beam elements(one between joints) were used to represent the col-umns and girders, while truss elements were used for
all diagonal bracing. The columns were modeled ascontinuous over the full height of the building, consist-ent with the design details in the drawings. Columns
and beams that were not part of the braced frame sys-tem were omitted from the models since they only pro-vide vertical load resistance and none in the lateral
direction. Both ®xed and pinned boundary conditions
at the base of the building were applied during the
analyses. A spatially uniform load, increasing linearly
in magnitude with quasi-time, was applied laterally to
one side of the building to obtain the load±de¯ection
characteristics of each frame. These analyses were per-
formed statically, that is, no inertia e�ects were
included in the calculations.
For each frame, a total of four analyses was per-
formed, designated A±D according to the scheme out-
lined in Table 1. For the baseline analysis (case A), the
nodes at the base of all the columns were ®xed and the
load applied to the north face of the building. For case
B, the direction of loading was reversed, since the
frames are not symmetric and their resistance may dif-
fer signi®cantly in each direction. In case C, the loaded
face reverted to the north side while the boundary con-
dition was changed to pinned to assess its importance.
For case D all the compressive braces were removed
from the model to simulate the condition where all the
compressive braces have buckled and no longer
actively resist the lateral load. The rationale for case D
is that the model, which has only one element between
joints, cannot be expected to capture the buckling re-
sponse unless more sophisticated modeling techniques
are used, which was judged to lie beyond the scope of
the present study.
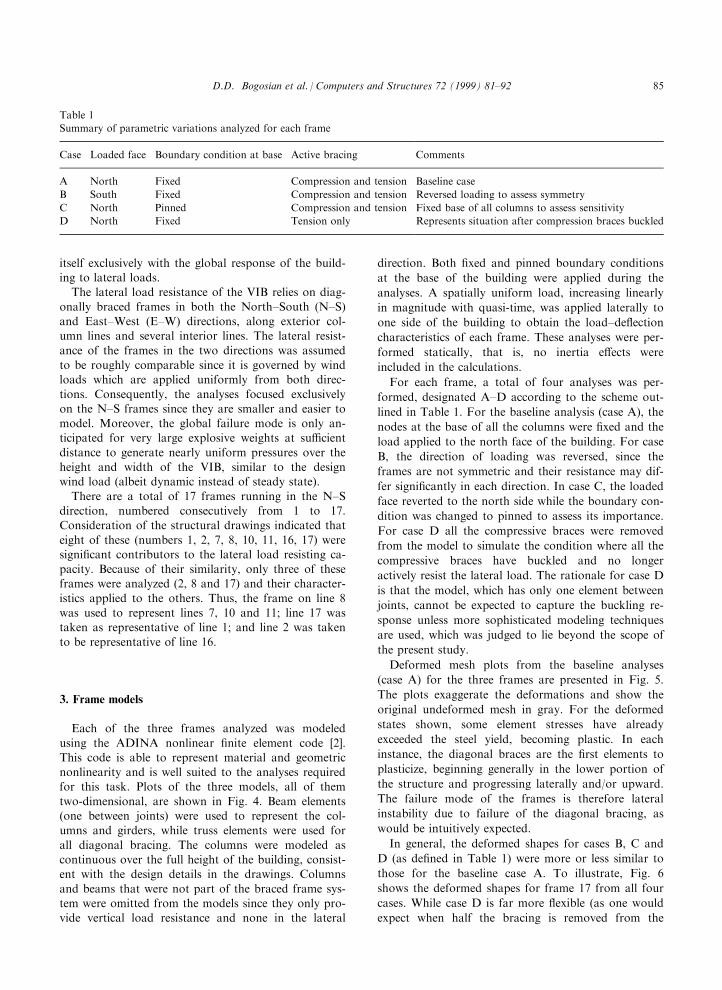
Deformed mesh plots from the baseline analyses
(case A) for the three frames are presented in Fig. 5.
The plots exaggerate the deformations and show the
original undeformed mesh in gray. For the deformed
states shown, some element stresses have already
exceeded the steel yield, becoming plastic. In each
instance, the diagonal braces are the ®rst elements to
plasticize, beginning generally in the lower portion of
the structure and progressing laterally and/or upward.
The failure mode of the frames is therefore lateral
instability due to failure of the diagonal bracing, as
would be intuitively expected.
In general, the deformed shapes for cases B, C and
D (as de®ned in Table 1) were more or less similar to
those for the baseline case A. To illustrate, Fig. 6
shows the deformed shapes for frame 17 from all four
cases. While case D is far more ¯exible (as one would
expect when half the bracing is removed from the
Table 1
Summary of parametric variations analyzed for each frame
Case Loaded face Boundary condition at base Active bracing Comments
A North Fixed Compression and tension Baseline case
B South Fixed Compression and tension Reversed loading to assess symmetry
C North Pinned Compression and tension Fixed base of all columns to assess sensitivity
D North Fixed Tension only Represents situation after compression braces buckled
D.D. Bogosian et al. / Computers and Structures 72 (1999) 81±92 85
mesh), the overall response is still generically similar.However, cases A±C show the building in a global
bending type of response, while D shows more of abase shear response in that the top of the buildingremains relatively level and does not rotate.
For each of the analyses performed, the lateralde¯ection of the topmost node in the frame model can
be plotted as a function of the applied load. Thesecurves de®ne the resistance of the frame for increasingamounts of de¯ection, and are hence referred to as
Fig. 5. Deformed shapes for baseline frame analyses. (a) Frame 2. (b) Frame 8. (c) Frame 17.
D.D. Bogosian et al. / Computers and Structures 72 (1999) 81±9286
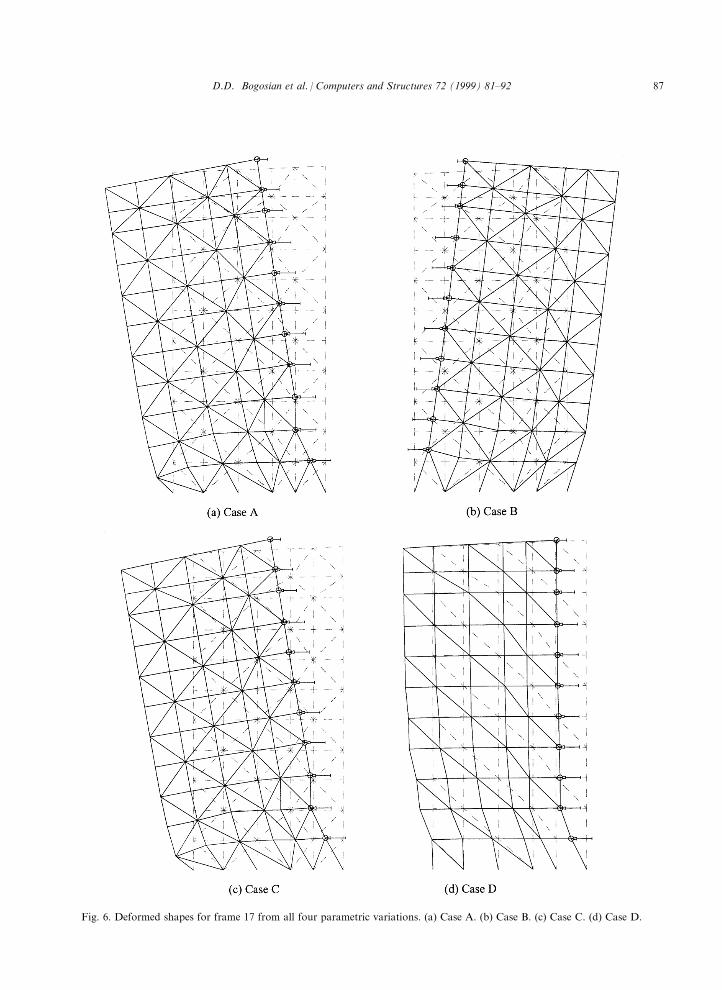
Fig. 6. Deformed shapes for frame 17 from all four parametric variations. (a) Case A. (b) Case B. (c) Case C. (d) Case D.
D.D. Bogosian et al. / Computers and Structures 72 (1999) 81±92 87
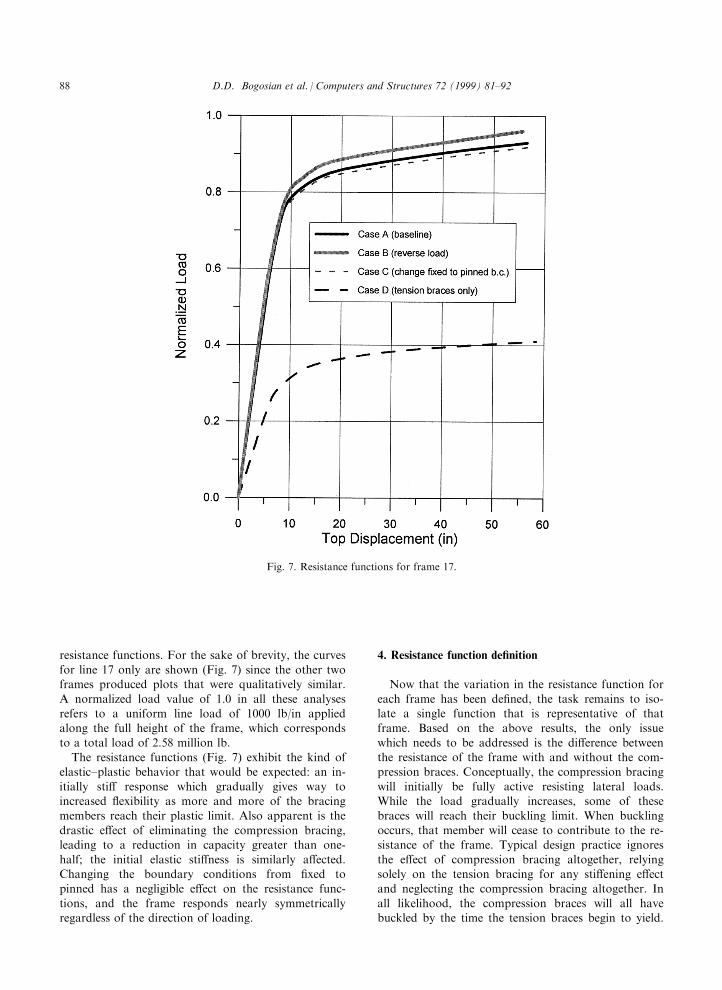
resistance functions. For the sake of brevity, the curves
for line 17 only are shown (Fig. 7) since the other twoframes produced plots that were qualitatively similar.
A normalized load value of 1.0 in all these analyses
refers to a uniform line load of 1000 lb/in appliedalong the full height of the frame, which corresponds
to a total load of 2.58 million lb.
The resistance functions (Fig. 7) exhibit the kind ofelastic±plastic behavior that would be expected: an in-
itially sti� response which gradually gives way toincreased ¯exibility as more and more of the bracing
members reach their plastic limit. Also apparent is the
drastic e�ect of eliminating the compression bracing,leading to a reduction in capacity greater than one-
half; the initial elastic sti�ness is similarly a�ected.Changing the boundary conditions from ®xed to
pinned has a negligible e�ect on the resistance func-
tions, and the frame responds nearly symmetricallyregardless of the direction of loading.
4. Resistance function de®nition
Now that the variation in the resistance function for
each frame has been de®ned, the task remains to iso-late a single function that is representative of that
frame. Based on the above results, the only issue
which needs to be addressed is the di�erence betweenthe resistance of the frame with and without the com-
pression braces. Conceptually, the compression bracing
will initially be fully active resisting lateral loads.While the load gradually increases, some of these
braces will reach their buckling limit. When bucklingoccurs, that member will cease to contribute to the re-
sistance of the frame. Typical design practice ignores
the e�ect of compression bracing altogether, relyingsolely on the tension bracing for any sti�ening e�ect
and neglecting the compression bracing altogether. In
all likelihood, the compression braces will all havebuckled by the time the tension braces begin to yield.
Fig. 7. Resistance functions for frame 17.
D.D. Bogosian et al. / Computers and Structures 72 (1999) 81±9288
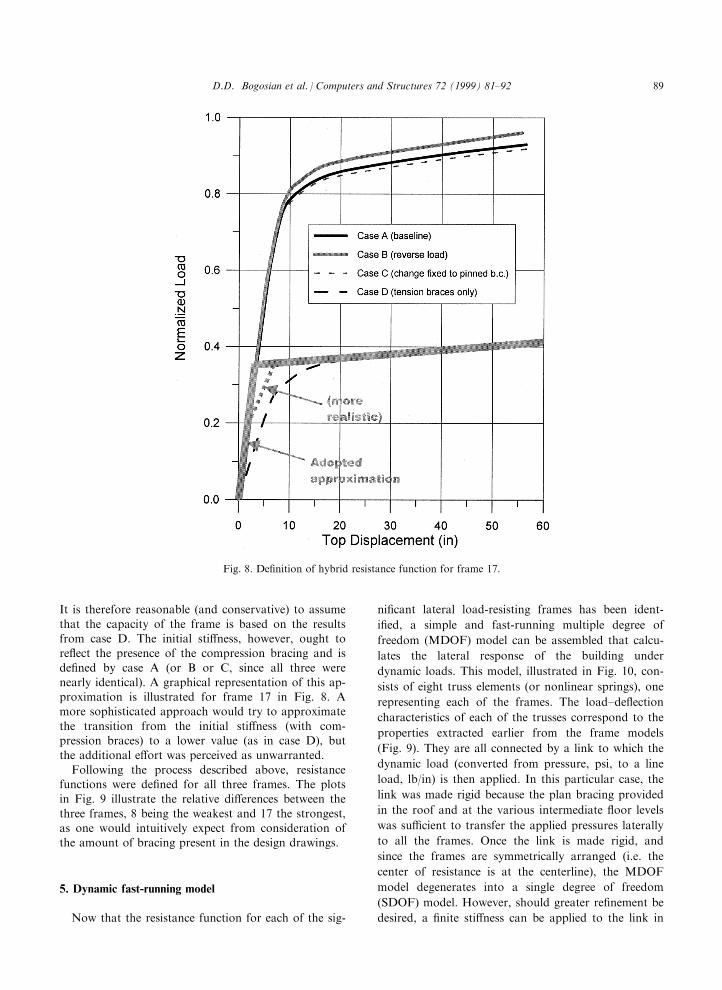
It is therefore reasonable (and conservative) to assume
that the capacity of the frame is based on the resultsfrom case D. The initial sti�ness, however, ought tore¯ect the presence of the compression bracing and is
de®ned by case A (or B or C, since all three werenearly identical). A graphical representation of this ap-proximation is illustrated for frame 17 in Fig. 8. Amore sophisticated approach would try to approximate
the transition from the initial sti�ness (with com-pression braces) to a lower value (as in case D), butthe additional e�ort was perceived as unwarranted.
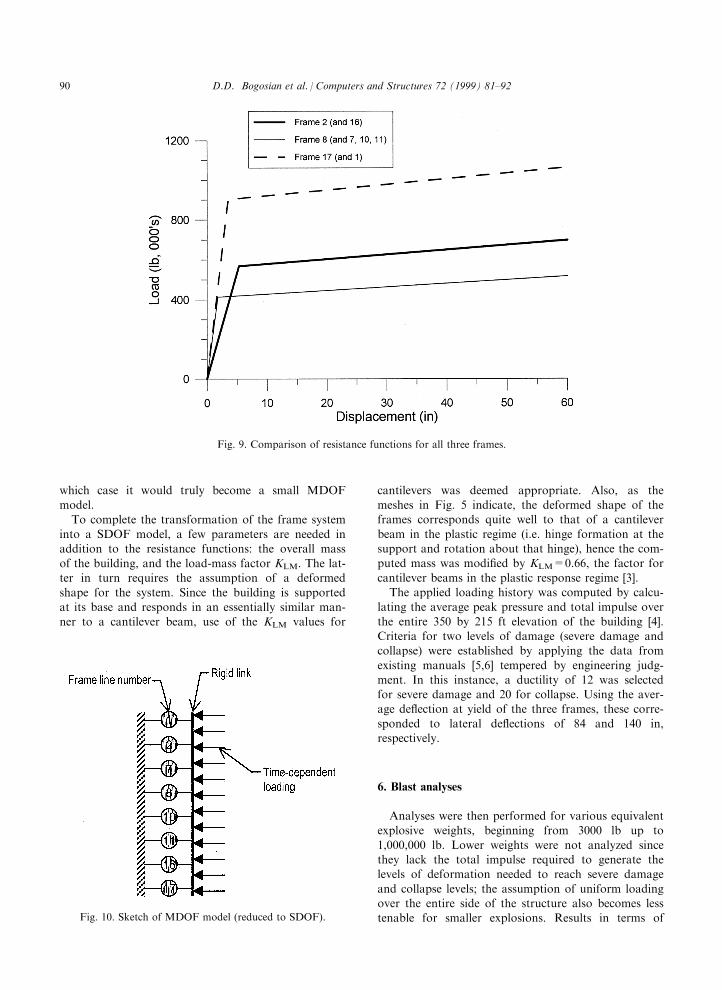
Following the process described above, resistancefunctions were de®ned for all three frames. The plotsin Fig. 9 illustrate the relative di�erences between the
three frames, 8 being the weakest and 17 the strongest,as one would intuitively expect from consideration ofthe amount of bracing present in the design drawings.
5. Dynamic fast-running model
Now that the resistance function for each of the sig-
ni®cant lateral load-resisting frames has been ident-
i®ed, a simple and fast-running multiple degree of
freedom (MDOF) model can be assembled that calcu-
lates the lateral response of the building under
dynamic loads. This model, illustrated in Fig. 10, con-
sists of eight truss elements (or nonlinear springs), one
representing each of the frames. The load±de¯ection
characteristics of each of the trusses correspond to the
properties extracted earlier from the frame models
(Fig. 9). They are all connected by a link to which the
dynamic load (converted from pressure, psi, to a line
load, lb/in) is then applied. In this particular case, the
link was made rigid because the plan bracing provided
in the roof and at the various intermediate ¯oor levels
was su�cient to transfer the applied pressures laterally
to all the frames. Once the link is made rigid, and
since the frames are symmetrically arranged (i.e. the
center of resistance is at the centerline), the MDOF
model degenerates into a single degree of freedom
(SDOF) model. However, should greater re®nement be
desired, a ®nite sti�ness can be applied to the link in
Fig. 8. De®nition of hybrid resistance function for frame 17.
D.D. Bogosian et al. / Computers and Structures 72 (1999) 81±92 89
which case it would truly become a small MDOFmodel.
To complete the transformation of the frame system
into a SDOF model, a few parameters are needed inaddition to the resistance functions: the overall mass
of the building, and the load-mass factor KLM. The lat-ter in turn requires the assumption of a deformed
shape for the system. Since the building is supportedat its base and responds in an essentially similar man-
ner to a cantilever beam, use of the KLM values for
cantilevers was deemed appropriate. Also, as themeshes in Fig. 5 indicate, the deformed shape of theframes corresponds quite well to that of a cantilever
beam in the plastic regime (i.e. hinge formation at thesupport and rotation about that hinge), hence the com-puted mass was modi®ed by KLM=0.66, the factor for
cantilever beams in the plastic response regime [3].The applied loading history was computed by calcu-
lating the average peak pressure and total impulse over
the entire 350 by 215 ft elevation of the building [4].Criteria for two levels of damage (severe damage andcollapse) were established by applying the data from
existing manuals [5,6] tempered by engineering judg-ment. In this instance, a ductility of 12 was selectedfor severe damage and 20 for collapse. Using the aver-age de¯ection at yield of the three frames, these corre-
sponded to lateral de¯ections of 84 and 140 in,respectively.
6. Blast analyses
Analyses were then performed for various equivalentexplosive weights, beginning from 3000 lb up to
1,000,000 lb. Lower weights were not analyzed sincethey lack the total impulse required to generate thelevels of deformation needed to reach severe damage
and collapse levels; the assumption of uniform loadingover the entire side of the structure also becomes lesstenable for smaller explosions. Results in terms of
Fig. 9. Comparison of resistance functions for all three frames.
Fig. 10. Sketch of MDOF model (reduced to SDOF).
D.D. Bogosian et al. / Computers and Structures 72 (1999) 81±9290
peak lateral de¯ection were accumulated and are pre-sented in Fig. 11 alongside the two damage criteria.The steep slopes associated with each of the response
curves indicates that the choice of failure criterion isnot particularly signi®cant in terms of the failure dis-
tance for each explosive weight. In other words, dou-bling the failure criterion would only produce a 20±30% decrease in the failure distance.
The results shown in Fig. 11 were then combinedwith functionals that de®ne probabilities of casualties
Fig. 11. Lateral response of VIB compared to damage criteria.
Fig. 12. Probability of casualties from global response.
D.D. Bogosian et al. / Computers and Structures 72 (1999) 81±92 91
or fatalities for each damage level to obtain lethalitycurves like the ones illustrated in Fig. 12. These in turn
were combined with other similar curves for the build-ing's other response modes, such as local failure of thesiding or of the girts supporting the siding, to produce
®nal lethality relationships. These were integrated (aslook-up tables, with interpolation as needed) intoMonte Carlo risk models used to assess the risk for a
particular launch. The VIB model, thus derived, wasfast enough so as not to adversely a�ect the overallrun time of the launch risk assessment code.
7. Conclusions
The foregoing study illustrates the primary bene®tsof using a hybrid physics-based approach to developfast-running models for risk assessments from blast
loadings:
. The fundamental physics underlying the problem are
adequately represented by the two dimensionalframe models, such as material nonlinearity and bra-cing geometry.
. The parametric sensitivity of frame resistance andsti�ness to such variables as loading direction andboundary conditions can be quantitatively deter-mined with little additional e�ort.
. Speed of execution is not sacri®ced, since theMDOF model is fast enough to be incorporatedwithin a Monte Carlo analysis or to easily sweep
out large numbers of parametric results.. The approach is modular and amenable to incre-
mental improvements depending on the availability
of time and money. For instance, the two dimen-sional frame models could be improved by the in-clusion of buckling e�ects on the compressivebracing elements. Alternatively, instead of assuming
similarity of frame resistance functions, additional
individual frames could be subjected to analysis, or,instead of assuming the rigidity of the ¯oor/roof dia-
phragms, the actual ¯exibility of those systems couldbe computed (once again using two dimensionalmodels) and utilized within the MDOF model.
Acknowledgements
The investigations described in this paper were per-formed under the sponsorship of the US Air Force
30th and 45th Space Wings, Safety Directorates, undercontract no. FO4684-97-C-0001, in a continuing e�ortto provide public protection during space launches and
missile operations. The Air Force, however, neitherapproves nor disapproves of the reported results.
References
[1] Bogosian D, Dunn B. Blast vulnerability of the Vertical
Integration Building, Cape Canaveral Air Station.
Karagozian & Case, Glendale, CA, technical report TR-
98-28, September 1998.
[2] ADINA user interface command reference manual.
ADINA R&D Inc., Watertown, MA, October 1996.
[3] Biggs JM. Introduction to structural dynamics. New
York: McGraw-Hill, 1964.
[4] Fundamentals of protective design for conventional weap-
ons, technical manual TM 5-855-1. Headquarters,
Department of the Army, November 1986.
[5] Facility and Component Explosive Damage Assessment
Program (FACEDAP). Theory manual, version 1.2, tech-
nical report no. 92-2. Department of the Army, Corps of
Engineers, Omaha District, CEMRO-ED-ST, Omaha,
NE, May 1994.
[6] Design and analysis of hardened structures to conven-
tional weapons e�ects (DAHS CWE) manual. (Army
TM-5-855-1, Air Force AFJMAN32-1055, Navy
NAVFAC P-1080, and DSWA DAHSCWEMAN-97),
Chap. 4, Material properties.
D.D. Bogosian et al. / Computers and Structures 72 (1999) 81±9292