Embed Size (px)
Citation preview
BladeRunner — 2020 "the next transport revolution" Silvertip Design
Page 1 of 11 December, 2005
BladeRunner 2020 "the next transport
revolution" Carl Henderson B.Eng. (Hons), MSc,
MIRTE, MSOE
Silvertip Design, Richmond, North Yorkshire.
Presented at the Evolution of Modern Traction conference
LOCOMOTIVE & CARRIAGE INSTITUTION
Imperial College, London
— 5 November 2005
Abstract This paper explores the reasoning behind the BladeRunner concept. A concept that could deliver five times the capacity of a road lane or railway line and a halving of the emissions by 2020. By 2050 commercial transport could be entirely powered by renewable energy sources. BladeRunner is a new vehicle based on the already proven SCM 16-metre semi-trailer and takes the opportunity to introduce a number of further improvements to the articulated configuration. Fuel intensity data is used to compare vehicle types and benchmark road transport against combined transport (CT) chains. New configurations are proposed which should perform equally as efficiently as today's typical CT rail in 'accompanied' and 'unaccompanied' chains. But run at or near capacity CT rail will always have the potential to out perform road/rail hybrids. To enable the railways to achieve their ultimate potential BladeRunner can be used as a regional system feeding loads to the railways and, as a parallel corridor service, carry excess load shed by the railways when necessary. The International Loading Unit (ILU) is seen as the key to the efficiency of the modal interface. The core loading units are pallets of 1 x 1.2m and 0.8 x 1.2m. Multiples of these imply logistically convenient nominal interior body and container lengths in 4m increments to use available space fully. This, further, means that the most productive maximum-size container should be a nominal 16m long. Also given the benefits of linked steered
semi-trailer configurations like the SCM and that container freight is expected to increase by 50% by 2015. A 'new generation' of loading unit must be optimised around the 16-metre load length (A1650, B825) and introduced without delay. Efficiency of all transport modes would be enhanced. To prove the logistical practicality of a revised schedule of container-lengths based on 4m increments, a 16m semi-trailer for road-freight elements has already been built by Silvertip Design (Richmond, North Yorkshire) and Don-Bur (Stoke-on-Trent). By having a self-steering bogie it tracks around a turning circle even smaller than that laid down in transport legislation. Therefore the ability to transfer American-length 16m containers between rail and road is already evident. Furthermore the engineering for this semi-trailer has led to the development of the Blade Runner in which the vehicle can travel on rail as well as road – a dual-mode vehicle that saves energy and can make rail routes viable that are under threat of being judged uneconomic. Such extension of transport versatility and economy could justify change. BladeRunner offers the capacity; efficiency and affordability to justify adapting the current infrastructure to road/rail hybrid corridors and allow the economics of
combined transport chains to be realigned with the needs and aspirations of society.
1 Background
1.1 SCM semi-trailer
The BladeRunner configuration is based on the already proven SCM 16m semi-trailer (Plan - Figure 1). By steering the entire rear bogie of the semi-trailer, a longer body can be negotiated around the legal turning circles (5.3m inner and 12.5m outer radius) with less cut-in and less swing out than the standard 13.6m fixed axle vehicle that now dominates freight transport. This manoeuvrability improves the flow of traffic, the length improves transport efficiency and the steering reduces road damage [1]. But as with any articulated vehicle there remain the efficiency and safety implications of the cab-to-trailer gap and fifth wheel coupling arrangement.
The cab gap is necessary to allow relative articulation between the separate tractor and trailer units as the vehicle turns a corner or pitches up and down over bumps in the road. This gap increases the aerodynamic drag of the vehicle, isolates the driver from the motion of the load and as the vehicle turns a corner, the body of the semi-trailer obscures or blocks rearward view through the mirrors.
Figure 1 — Articulated vehicle developments address: safety, efficiency and capacity
BladeRunner — 2020 "the next transport revolution" Silvertip Design
Page 2 of 11 December, 2005
Because of the popularity of the configuration these are difficult issues to address.
The fifthwheel coupling is designed to apportion the imposed load of the semi-trailer between the axles of the tractor unit by incorporating a vertical plane pitch axis and by positioning the coupling near the back of the tractor unit close to the driven axle. As the vehicle rounds a corner the pitch freedom turns into roll freedom and front-end roll support for the trailer diminishes. The coupling also secures the kingpin to define the articulation axis for the vehicle. By having to combine these two functions at the back of the tractor unit the vehicle can become dynamically unstable, sometimes enough to promote a jacknife action, although this is mostly inhibited now by electronic controls that intervene to stop wheel slip.
The need for long service hoses and cables (susies) between the tractor and semi-trailer mean that they are exposed to damage.
Finally the two issues of coupling arrangement and cab gap combine to create additional problems. Improving efficiency by reducing the cab gap — close coupling the trailer — hardly leaves enough room for the driver to connect the susies.
1.2 BladeRunner
Cab-gap and susie connections
The BladeRunner project takes the opportunity to introduce a new coupling design that eliminates both the cab gap and sussi hoses and importantly the risks associated with them. The new coupling uses a turntable bearing to support the trailer over the whole angular movement, with continual roll stability. Also it moves the articulation axis nearer the tractor unit’s centre of gravity and incorporates mechanical stops to make it impossible to jacknife the combination. The driver is also able to couple/uncouple the semi-trailer without having to leave the cab, other than for the final walk-round inspection before going onto the road.
With the new coupling used at both ends of the vehicle the twin bogie BladeRunner becomes symmetrical and provides the ideal platform for a road/rail hybrid. A rail axle is mounted below the turntable on each bogie and is steered slightly to
ensure that the drive axle on the tractor unit and the fixed axle on the rear bogie always remain on the railhead to provide traction or braking when required. In other words the rail wheels guide while the road tyres continue to provide traction. Automatic guidance affords road-rail transfer on the move.
By switching from road to rail BladeRunner vehicles acquire the robust physical guidance of the rails while also improving the efficiency, ride quality and appeal of their services.
2 Transport crisis Pollution & Congestion
In addition to the now obvious energy crisis [20], the current crisis in transport is also being defined in terms of levels of pollution and congestion.
10
20
25
50
100
240
290
320
0 100 200 300 400
Rail Freight38t (2+3) articulated HGV
31t (4 axle) rigid HGV17t (2 axle) rigid HGV7.5t (2 axle) rigid HGV
Air FreightLight Van (diesel)Light Van (petrol)
Index of CO2 emissions [per freight.tonne.km]
Figure 2 — relative CO2 emissions for various types of vehicle
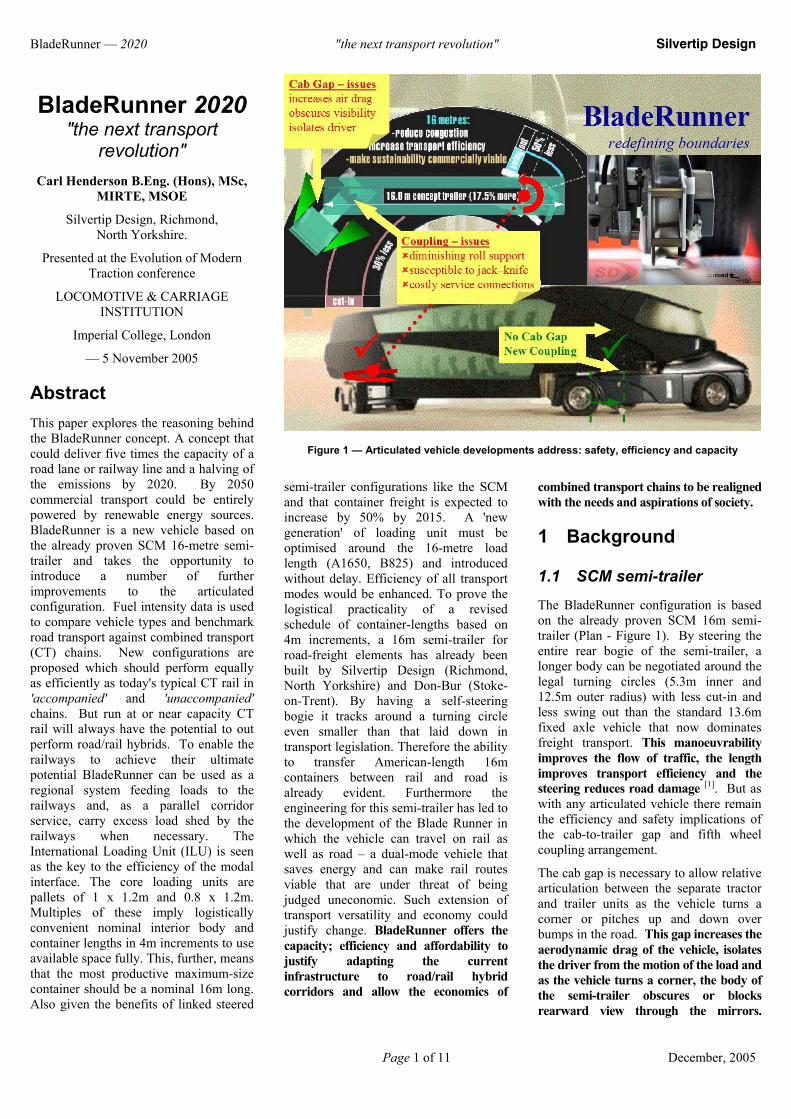
The British Department for Transport (DfT) 1999 data for relative vehicle emissions (Figure 2) show that rail
freight and articulated heavy goods vehicles (HGV) perform the best, producing only 10% and 20% respectively of the emissions of a 7.5t 2-axle rigid vehicle. The light vans on the other hand are significantly worse, emitting three times the CO2 of the 7.5t rigid and sixteen times that of the articulated HGV, for the same freight moved.
The picture is similar in terms of road space and congestion. The (2+3) articulated vehicle could carry 25 tonnes of payload, the light vans just one or two tonnes. The space each vehicle occupies in traffic is the length of the vehicle plus a one or two second headway. For the large truck the vehicle is just over 16 metres long and with 40 metres of headway, the vehicle requires 56m of road space. The sixteen small vans needed to replace this one truck each occupy about 35m of road space, together requiring ten times the lane capacity of a single truck and compounding road congestion on the available infrastructure.
3 SCM prototype
3.1 Road trials
The prototype 16m self-steering semi-trailer for articulated road trucks (Figure 3) is longer than currently allowed for general freight on European roads but offers many potential benefits. The concept was first promoted at the 1999 Commercial Vehicle Show Birmingham. The dynamic
Figure 3 — SCM (16 m) semi-trailer demonstrating both low-speed manoeuvrability and high-speed stability. http://www.silvertipdesign.com/SCM(left_turn).avi ../SCM(slalom).avi
BladeRunner — 2020 "the next transport revolution" Silvertip Design
Page 3 of 11 December, 2005
performance of the pivotal bogie design was evaluated at Leyland Technical Centre (LTC) and then, in a comparison study, also by Cambridge University at MIRA [2].
The Cambridge study investigated the relative performance of different steering systems and compared the results to Australia's National Road Transport Commission's (NRTC) proposed performance-based standards (PBS). In all but the Tail Swing (TS) and High-Speed Steady State Off-tracking (SSO) the SCM semi-trailer meets the PBS requirements. The tail swing was recorded at 0.68m (entry) and 0.39m (exit) and the PBS requirement is for a maximum of 0.35m (entry & exit). However the Swept Path (SP90) is just 3.8m compared to a PBS. With present, fixed axle, semi-trailers the driver has to swing wide to account for the significant cut-in of the trailer wheels; tail swing is then of additional concern. The self-steering SCM vehicle sweeps a narrow path (1.2m less than PBS) giving the driver ample room to position the vehicle to stay inside the lane markings even on tight turns (Figure 3).
The steady-state off-tracking (SSO) is defined as the "maximum lateral distance the rear axle tracks outside the path of the front axle". In the Cambridge study because the bogie swivels the SSO was measured to the centre of the back of the body and not the rear axle, exaggerating any offset. Even so the SSO is only 0.1m outside the (PBS) proposed limit of 0.5m as measured. Neither this nor the fact the SCM semi-trailer geometry under test is for a 16m long semi-trailer was made clear in the Cambridge report. Nevertheless the findings in preference of steered over non-steered semi-trailers reaffirms the earlier work of Coleman and Sweatman [1].
3.2 Fuel-consumption trials
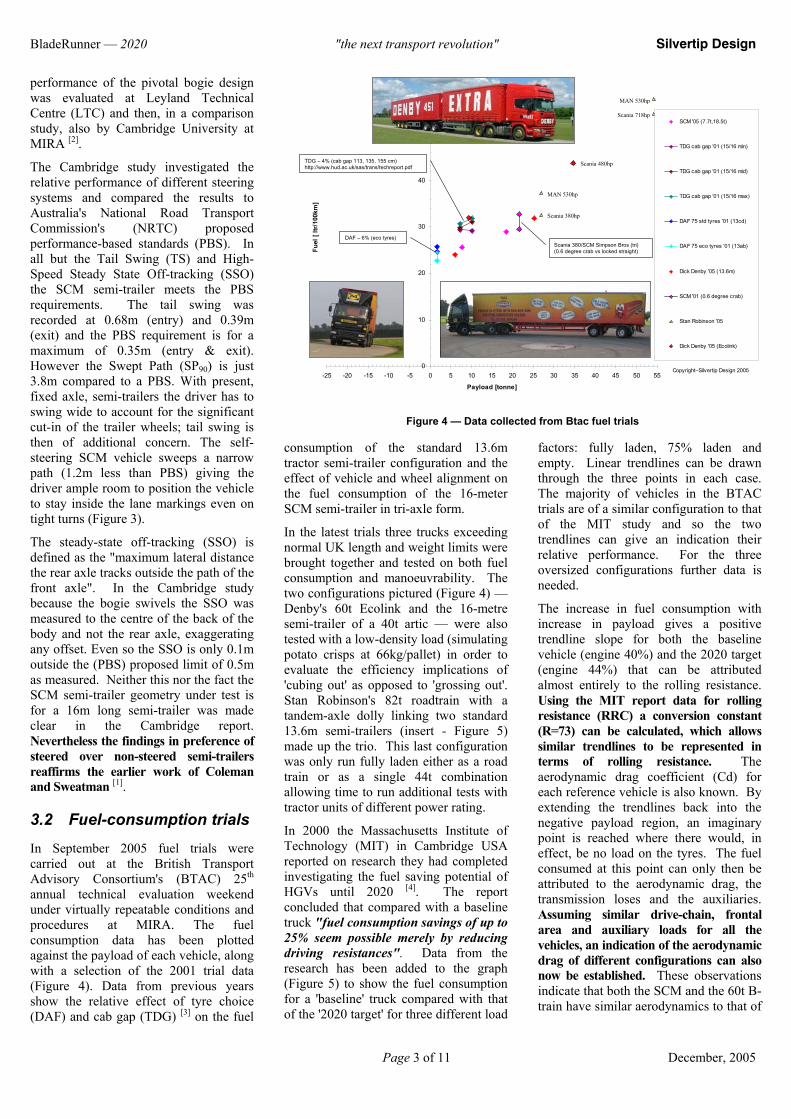
In September 2005 fuel trials were carried out at the British Transport Advisory Consortium's (BTAC) 25th annual technical evaluation weekend under virtually repeatable conditions and procedures at MIRA. The fuel consumption data has been plotted against the payload of each vehicle, along with a selection of the 2001 trial data (Figure 4). Data from previous years show the relative effect of tyre choice (DAF) and cab gap (TDG) [3] on the fuel
consumption of the standard 13.6m tractor semi-trailer configuration and the effect of vehicle and wheel alignment on the fuel consumption of the 16-meter SCM semi-trailer in tri-axle form.
In the latest trials three trucks exceeding normal UK length and weight limits were brought together and tested on both fuel consumption and manoeuvrability. The two configurations pictured (Figure 4) — Denby's 60t Ecolink and the 16-metre semi-trailer of a 40t artic — were also tested with a low-density load (simulating potato crisps at 66kg/pallet) in order to evaluate the efficiency implications of 'cubing out' as opposed to 'grossing out'. Stan Robinson's 82t roadtrain with a tandem-axle dolly linking two standard 13.6m semi-trailers (insert - Figure 5) made up the trio. This last configuration was only run fully laden either as a road train or as a single 44t combination allowing time to run additional tests with tractor units of different power rating.
In 2000 the Massachusetts Institute of Technology (MIT) in Cambridge USA reported on research they had completed investigating the fuel saving potential of HGVs until 2020 [4]. The report concluded that compared with a baseline truck "fuel consumption savings of up to 25% seem possible merely by reducing driving resistances". Data from the research has been added to the graph (Figure 5) to show the fuel consumption for a 'baseline' truck compared with that of the '2020 target' for three different load
factors: fully laden, 75% laden and empty. Linear trendlines can be drawn through the three points in each case. The majority of vehicles in the BTAC trials are of a similar configuration to that of the MIT study and so the two trendlines can give an indication their relative performance. For the three oversized configurations further data is needed.
The increase in fuel consumption with increase in payload gives a positive trendline slope for both the baseline vehicle (engine 40%) and the 2020 target (engine 44%) that can be attributed almost entirely to the rolling resistance. Using the MIT report data for rolling resistance (RRC) a conversion constant (R=73) can be calculated, which allows similar trendlines to be represented in terms of rolling resistance. The aerodynamic drag coefficient (Cd) for each reference vehicle is also known. By extending the trendlines back into the negative payload region, an imaginary point is reached where there would, in effect, be no load on the tyres. The fuel consumed at this point can only then be attributed to the aerodynamic drag, the transmission loses and the auxiliaries. Assuming similar drive-chain, frontal area and auxiliary loads for all the vehicles, an indication of the aerodynamic drag of different configurations can also now be established. These observations indicate that both the SCM and the 60t B-train have similar aerodynamics to that of
0
10
20
30
40
50
60
-25 -20 -15 -10 -5 0 5 10 15 20 25 30 35 40 45 50 55
Payload [tonne]
Fuel
[ ltr
/100
km]
SCM '05 (7.7t,18.5t)
TDG cab gap '01 (15/16 min)
TDG cab gap '01 (15/16 mid)
TDG cab gap '01 (15/16 max)
DAF 75 std tyres '01 (13cd)
DAF 75 eco tyres '01 (13ab)
Dick Denby '05 (13.6m)
SCM '01 (0.6 degree crab)
Stan Robinson '05
Dick Denby '05 (Ecolink)
Copyright–Silvertip Design 2005
TDG – 4% (cab gap 113, 135, 155 cm)http://www.hud.ac.uk/sas/trans/techreport.pdf
DAF – 6% (eco tyres)Scania 380/SCM Simpson Bros (tri)(0.6 degree crab vs locked straight)
Scania 480hp
MAN 530hp
Scania 380hp
MAN 530hp
Scania 718hp
Figure 4 — Data collected from Btac fuel trials
BladeRunner — 2020 "the next transport revolution" Silvertip Design
Page 4 of 11 December, 2005
the 2020 target (Cd 0.4) but that the rolling resistance of the B-train appears higher at 0.006 compared with 0.0053 for the SCM. It must be noted that the B-train trials for the two different payloads were completed at the same venue but in consecutive years. Any change in the position of either one of the points would alter the trendline. The rolling resistance is however unlikely to be worse than 0.006 and the aerodynamic drag is unlikely to be better than 0.4. Although there are many parameters that may vary, a slight increase in Cd with a corresponding token reduction in RRC is the most probable variation, if any.
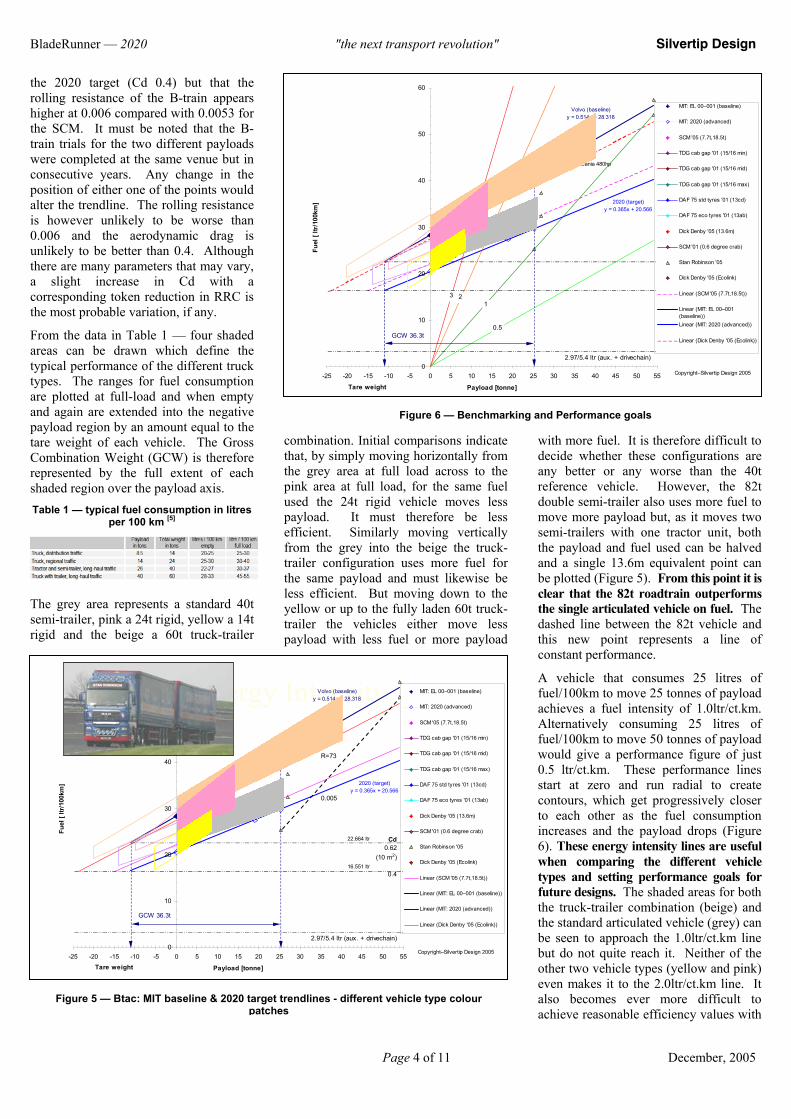
From the data in Table 1 — four shaded areas can be drawn which define the typical performance of the different truck types. The ranges for fuel consumption are plotted at full-load and when empty and again are extended into the negative payload region by an amount equal to the tare weight of each vehicle. The Gross Combination Weight (GCW) is therefore represented by the full extent of each shaded region over the payload axis. Table 1 — typical fuel consumption in litres
per 100 km [5]
The grey area represents a standard 40t semi-trailer, pink a 24t rigid, yellow a 14t rigid and the beige a 60t truck-trailer
combination. Initial comparisons indicate that, by simply moving horizontally from the grey area at full load across to the pink area at full load, for the same fuel used the 24t rigid vehicle moves less payload. It must therefore be less efficient. Similarly moving vertically from the grey into the beige the truck-trailer configuration uses more fuel for the same payload and must likewise be less efficient. But moving down to the yellow or up to the fully laden 60t truck-trailer the vehicles either move less payload with less fuel or more payload
with more fuel. It is therefore difficult to decide whether these configurations are any better or any worse than the 40t reference vehicle. However, the 82t double semi-trailer also uses more fuel to move more payload but, as it moves two semi-trailers with one tractor unit, both the payload and fuel used can be halved and a single 13.6m equivalent point can be plotted (Figure 5). From this point it is clear that the 82t roadtrain outperforms the single articulated vehicle on fuel. The dashed line between the 82t vehicle and this new point represents a line of constant performance.
A vehicle that consumes 25 litres of fuel/100km to move 25 tonnes of payload achieves a fuel intensity of 1.0ltr/ct.km. Alternatively consuming 25 litres of fuel/100km to move 50 tonnes of payload would give a performance figure of just 0.5 ltr/ct.km. These performance lines start at zero and run radial to create contours, which get progressively closer to each other as the fuel consumption increases and the payload drops (Figure 6). These energy intensity lines are useful when comparing the different vehicle types and setting performance goals for future designs. The shaded areas for both the truck-trailer combination (beige) and the standard articulated vehicle (grey) can be seen to approach the 1.0ltr/ct.km line but do not quite reach it. Neither of the other two vehicle types (yellow and pink) even makes it to the 2.0ltr/ct.km line. It also becomes ever more difficult to achieve reasonable efficiency values with
Energy IntensityVolvo (baseline)y = 0.514x + 28.318
2020 (target)y = 0.365x + 20.566
0
10
20
30
40
50
60
-25 -20 -15 -10 -5 0 5 10 15 20 25 30 35 40 45 50 55
Payload [tonne]
Fuel
[ ltr
/100
km]
MIT: EL 00–001 (baseline)
MIT: 2020 (advanced)
SCM '05 (7.7t,18.5t)
TDG cab gap '01 (15/16 min)
TDG cab gap '01 (15/16 mid)
TDG cab gap '01 (15/16 max)
DAF 75 std tyres '01 (13cd)
DAF 75 eco tyres '01 (13ab)
Dick Denby '05 (13.6m)
SCM '01 (0.6 degree crab)
Stan Robinson '05
Dick Denby '05 (Ecolink)
Linear (SCM '05 (7.7t,18.5t))
Linear (MIT: EL 00–001 (baseline))
Linear (MIT: 2020 (advanced))
Linear (Dick Denby '05 (Ecolink))
Tare weight
GCW 36.3t
Cd0.62
(10 m2)
0.4
2.97/5.4 ltr (aux. + drivechain)
Rr0.007
R=73
0.005
22.664 ltr
Copyright–Silvertip Design 2005
16.551 ltr
Volvo (baseline)y = 0.514x + 28.318
2020 (target)y = 0.365x + 20.566
0
10
20
30
40
50
60
-25 -20 -15 -10 -5 0 5 10 15 20 25 30 35 40 45 50 55
Payload [tonne]
Fuel
[ ltr
/100
km]
MIT: EL 00–001 (baseline)
MIT: 2020 (advanced)
SCM '05 (7.7t,18.5t)
TDG cab gap '01 (15/16 min)
TDG cab gap '01 (15/16 mid)
TDG cab gap '01 (15/16 max)
DAF 75 std tyres '01 (13cd)
DAF 75 eco tyres '01 (13ab)
Dick Denby '05 (13.6m)
SCM '01 (0.6 degree crab)
Stan Robinson '05
Dick Denby '05 (Ecolink)
Linear (SCM '05 (7.7t,18.5t))
Linear (MIT: EL 00–001(baseline))Linear (MIT: 2020 (advanced))
Linear (Dick Denby '05 (Ecolink))
Tare weight
GCW 36.3t
2.97/5.4 ltr (aux. + drivechain)
Scania 480hp
Copyright–Silvertip Design 2005
3 2
0.5
1
Figure 5 — Btac: MIT baseline & 2020 target trendlines - different vehicle type colour patches
Figure 6 — Benchmarking and Performance goals
BladeRunner — 2020 "the next transport revolution" Silvertip Design
Page 5 of 11 December, 2005
small payloads and at the other extreme it becomes more and more difficult to improve fuel efficiency further at higher payloads. There would appear to be some optimum configurations to be explored. To help complete the picture other transport modes need to be added.
4 Energy intensity
4.1 Dispelling myths
Globally stakeholders and governments are making strong cases for the superior environmental credentials of rail in comparison to road.
"The Railway Association of Canada has worked diligently to provide incisive and insightful policy and research work in the areas of climate change and sustainability. With the support of freight and passenger/commuter railways the RAC welcomes another opportunity to contribute to this discussion and is pleased to provide a response to the Discussion Paper on Canada’s Contribution to Addressing Climate Change."
Figure 7 — Dispelling myths — RAC [8]
The data provided in the response by the RAC (Figure 7), and clearly intended to help define government policy on such important issues as climate change and pollution, is ambiguous. The David Suzuki Foundation (Table 2) also provides data for the same region, in the same units and for roughly the same period. Here the energy intensity of rail is given as 302 kJ/t.km in 1990 improving to about 280 kJ/t.km by 1999. But according to the RAC these figures are 338 and 249 respectively — 30 higher
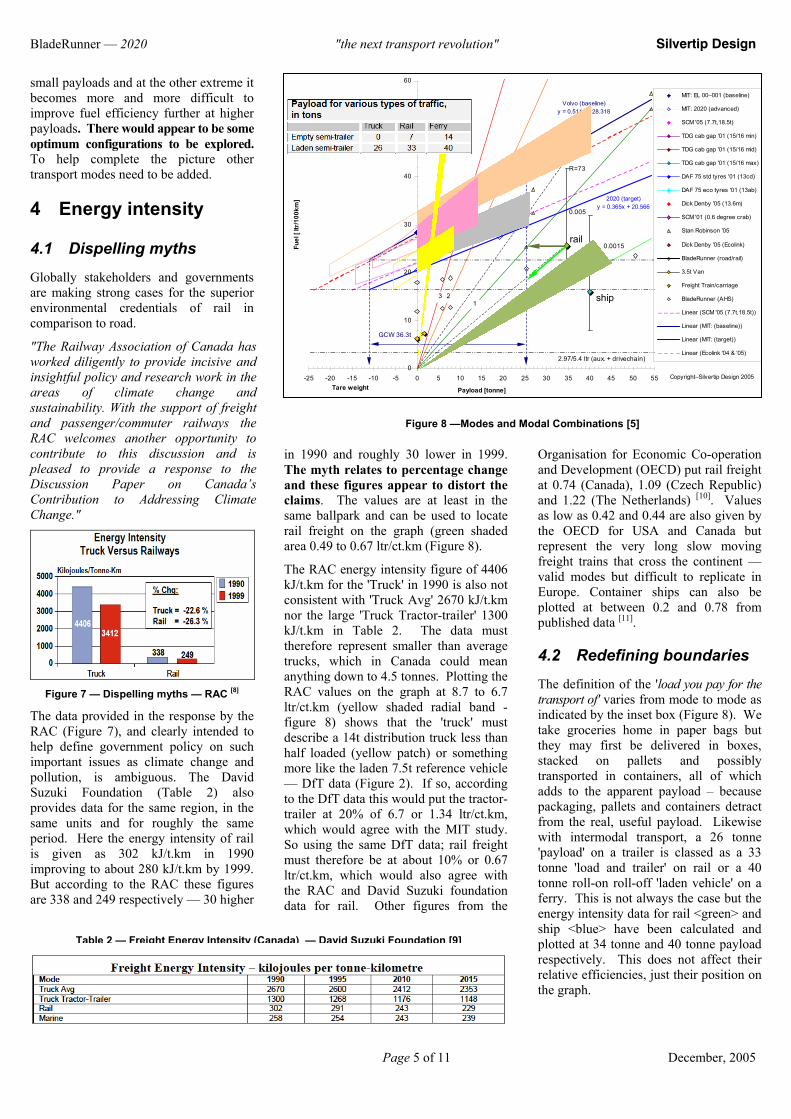
in 1990 and roughly 30 lower in 1999. The myth relates to percentage change and these figures appear to distort the claims. The values are at least in the same ballpark and can be used to locate rail freight on the graph (green shaded area 0.49 to 0.67 ltr/ct.km (Figure 8).
The RAC energy intensity figure of 4406 kJ/t.km for the 'Truck' in 1990 is also not consistent with 'Truck Avg' 2670 kJ/t.km nor the large 'Truck Tractor-trailer' 1300 kJ/t.km in Table 2. The data must therefore represent smaller than average trucks, which in Canada could mean anything down to 4.5 tonnes. Plotting the RAC values on the graph at 8.7 to 6.7 ltr/ct.km (yellow shaded radial band - figure 8) shows that the 'truck' must describe a 14t distribution truck less than half loaded (yellow patch) or something more like the laden 7.5t reference vehicle — DfT data (Figure 2). If so, according to the DfT data this would put the tractor-trailer at 20% of 6.7 or 1.34 ltr/ct.km, which would agree with the MIT study. So using the same DfT data; rail freight must therefore be at about 10% or 0.67 ltr/ct.km, which would also agree with the RAC and David Suzuki foundation data for rail. Other figures from the
Organisation for Economic Co-operation and Development (OECD) put rail freight at 0.74 (Canada), 1.09 (Czech Republic) and 1.22 (The Netherlands) [10]. Values as low as 0.42 and 0.44 are also given by the OECD for USA and Canada but represent the very long slow moving freight trains that cross the continent — valid modes but difficult to replicate in Europe. Container ships can also be plotted at between 0.2 and 0.78 from published data [11].
4.2 Redefining boundaries
The definition of the 'load you pay for the transport of' varies from mode to mode as indicated by the inset box (Figure 8). We take groceries home in paper bags but they may first be delivered in boxes, stacked on pallets and possibly transported in containers, all of which adds to the apparent payload – because packaging, pallets and containers detract from the real, useful payload. Likewise with intermodal transport, a 26 tonne 'payload' on a trailer is classed as a 33 tonne 'load and trailer' on rail or a 40 tonne roll-on roll-off 'laden vehicle' on a ferry. This is not always the case but the energy intensity data for rail <green> and ship <blue> have been calculated and plotted at 34 tonne and 40 tonne payload respectively. This does not affect their relative efficiencies, just their position on the graph.
Table 2 — Freight Energy Intensity (Canada) — David Suzuki Foundation [9]
Figure 8 —Modes and Modal Combinations [5]
Volvo (baseline)y = 0.514x + 28.318
2020 (target)y = 0.365x + 20.566
0
10
20
30
40
50
60
-25 -20 -15 -10 -5 0 5 10 15 20 25 30 35 40 45 50 55
Payload [tonne]
Fuel
[ ltr
/100
km]
MIT: EL 00–001 (baseline)
MIT: 2020 (advanced)
SCM '05 (7.7t,18.5t)
TDG cab gap '01 (15/16 min)
TDG cab gap '01 (15/16 mid)
TDG cab gap '01 (15/16 max)
DAF 75 std tyres '01 (13cd)
DAF 75 eco tyres '01 (13ab)
Dick Denby '05 (13.6m)
SCM '01 (0.6 degree crab)
Stan Robinson '05
Dick Denby '05 (Ecolink)
BladeRunner (road/rail)
3.5t Van
Freight Train/carriage
BladeRunner (AHS)
Linear (SCM '05 (7.7t,18.5t))
Linear (MIT: (baseline))
Linear (MIT: (target))
Linear (Ecolink '04 & '05)
Tare weight
GCW 36.3t
2.97/5.4 ltr (aux. + drivechain)
Rr0.007
R=73
0.005
0.0015
Copyright–Silvertip Design 2005
3 2
0.5
1
rail
ship
BladeRunner — 2020 "the next transport revolution" Silvertip Design
Page 6 of 11 December, 2005
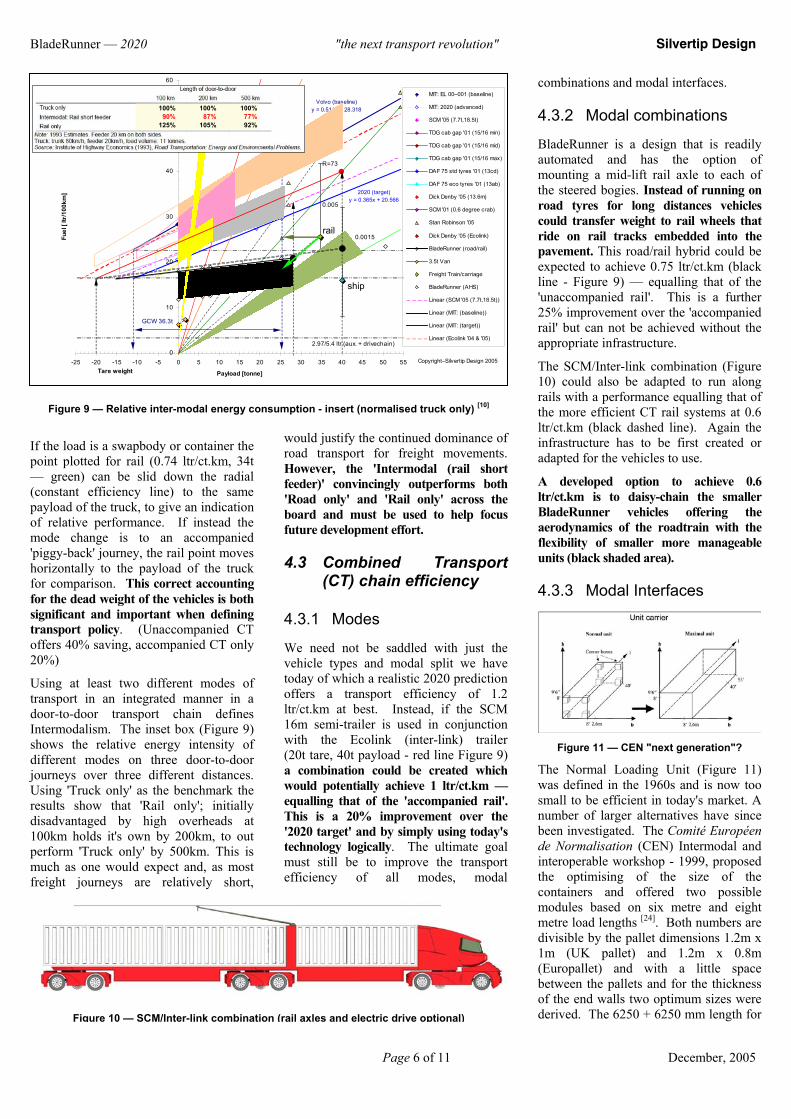
If the load is a swapbody or container the point plotted for rail (0.74 ltr/ct.km, 34t — green) can be slid down the radial (constant efficiency line) to the same payload of the truck, to give an indication of relative performance. If instead the mode change is to an accompanied 'piggy-back' journey, the rail point moves horizontally to the payload of the truck for comparison. This correct accounting for the dead weight of the vehicles is both significant and important when defining transport policy. (Unaccompanied CT offers 40% saving, accompanied CT only 20%)
Using at least two different modes of transport in an integrated manner in a door-to-door transport chain defines Intermodalism. The inset box (Figure 9) shows the relative energy intensity of different modes on three door-to-door journeys over three different distances. Using 'Truck only' as the benchmark the results show that 'Rail only'; initially disadvantaged by high overheads at 100km holds it's own by 200km, to out perform 'Truck only' by 500km. This is much as one would expect and, as most freight journeys are relatively short,
would justify the continued dominance of road transport for freight movements. However, the 'Intermodal (rail short feeder)' convincingly outperforms both 'Road only' and 'Rail only' across the board and must be used to help focus future development effort.
4.3 Combined Transport (CT) chain efficiency
4.3.1 Modes
We need not be saddled with just the vehicle types and modal split we have today of which a realistic 2020 prediction offers a transport efficiency of 1.2 ltr/ct.km at best. Instead, if the SCM 16m semi-trailer is used in conjunction with the Ecolink (inter-link) trailer (20t tare, 40t payload - red line Figure 9) a combination could be created which would potentially achieve 1 ltr/ct.km — equalling that of the 'accompanied rail'. This is a 20% improvement over the '2020 target' and by simply using today's technology logically. The ultimate goal must still be to improve the transport efficiency of all modes, modal
combinations and modal interfaces.
4.3.2 Modal combinations
BladeRunner is a design that is readily automated and has the option of mounting a mid-lift rail axle to each of the steered bogies. Instead of running on road tyres for long distances vehicles could transfer weight to rail wheels that ride on rail tracks embedded into the pavement. This road/rail hybrid could be expected to achieve 0.75 ltr/ct.km (black line - Figure 9) — equalling that of the 'unaccompanied rail'. This is a further 25% improvement over the 'accompanied rail' but can not be achieved without the appropriate infrastructure.
The SCM/Inter-link combination (Figure 10) could also be adapted to run along rails with a performance equalling that of the more efficient CT rail systems at 0.6 ltr/ct.km (black dashed line). Again the infrastructure has to be first created or adapted for the vehicles to use.
A developed option to achieve 0.6 ltr/ct.km is to daisy-chain the smaller BladeRunner vehicles offering the aerodynamics of the roadtrain with the flexibility of smaller more manageable units (black shaded area).
4.3.3 Modal Interfaces
Figure 11 — CEN "next generation"?
The Normal Loading Unit (Figure 11) was defined in the 1960s and is now too small to be efficient in today's market. A number of larger alternatives have since been investigated. The Comité Européen de Normalisation (CEN) Intermodal and interoperable workshop - 1999, proposed the optimising of the size of the containers and offered two possible modules based on six metre and eight metre load lengths [24]. Both numbers are divisible by the pallet dimensions 1.2m x 1m (UK pallet) and 1.2m x 0.8m (Europallet) and with a little space between the pallets and for the thickness of the end walls two optimum sizes were derived. The 6250 + 6250 mm length for
Figure 9 — Relative inter-modal energy consumption - insert (normalised truck only) [10]
Figure 10 — SCM/Inter-link combination (rail axles and electric drive optional)
Volvo (baseline)y = 0.514x + 28.318
2020 (target)y = 0.365x + 20.566
0
10
20
30
40
50
60
-25 -20 -15 -10 -5 0 5 10 15 20 25 30 35 40 45 50 55
Payload [tonne]
Fuel
[ ltr
/100
km]
MIT: EL 00–001 (baseline)
MIT: 2020 (advanced)
SCM '05 (7.7t,18.5t)
TDG cab gap '01 (15/16 min)
TDG cab gap '01 (15/16 mid)
TDG cab gap '01 (15/16 max)
DAF 75 std tyres '01 (13cd)
DAF 75 eco tyres '01 (13ab)
Dick Denby '05 (13.6m)
SCM '01 (0.6 degree crab)
Stan Robinson '05
Dick Denby '05 (Ecolink)
BladeRunner (road/rail)
3.5t Van
Freight Train/carriage
BladeRunner (AHS)
Linear (SCM '05 (7.7t,18.5t))
Linear (MIT: (baseline))
Linear (MIT: (target))
Linear (Ecolink '04 & '05)
Tare weight
GCW 36.3t
2.97/5.4 ltr (aux. + drivechain)
Rr0.007
R=73
0.005
0.0015
Copyright–Silvertip Design 2005
3 2
0.5
1
100% 100% 100%90% 87% 77%
125% 105% 92%
rail
ship

BladeRunner — 2020 "the next transport revolution" Silvertip Design
Page 7 of 11 December, 2005
the road train, together with the 12 500 mm length for a semi-trailer — was “rejected by European economy” as being too small. And the 8300 + 8300 mm length for the road train and 16 600 mm length for a semi-trailer — would not have been acceptable to the public nor the transport policy makers” for being too long. CEN concludes that “given these considerations, the optimum concept from a view of polarisation must be dropped, and a “second best” solution must be approached.”
The need to improve the international loading unit (ILU) was revisited by Europe with EILU long and EILU short but has since been dropped [25][26][27][28]. "However, while drafting 'future' container dimensions, dimensional regulatory constraints were treated as 'soft' restrictions [29] ". This along with the recent clear demonstrations of the improved performance of over-length steered semi-trailers on the European road network and the predictions of 50% increase in container traffic in Europe by 2015, a fresh review of the regulatory limits must now be carried out. Second best is no longer good enough!
A viable alternative is the SCM / Inter-link combination (Figure 10) which could readily carry a full 16.6m (new generation) ILU and a half-sized 8.3m loading unit and together if necessary.
The changeover to the new sizes must be started with some urgency and could be easily founded on the half-sized units first. At 8.3m these units are close to the C782 swapbody which is already a significant part of the CT chain. Then by gradually adapting rail wagons and ships to create space for two units end-to-end, full sized A-series units could be introduced later. In fifteen years time the present smaller series could be phased out, as happened to the 5', 6.8' early on and to a large extent the 30' containers more recently.
Next Generation
The maximum efficiency of any freight vehicle is achieved only when fully loaded. In Europe only 5% or so of general freight runs to 'gross' (maximum payload), most vehicles 'cube-out', that is they are full by volume before they can reach the maximum payload. The sample of 143 transports (Figure 13) shows that these vehicles are actually full in terms of pallet space before volume, so limiting the performance of the fleet. A typical 13.6m semi-trailer has room for 13 pallets (1.2m x 1m) down each side, 26 in all and can carry about 26 tonne of payload. The full unit (100%) therefore can be taken as representing 26 pallets and 26 tonnes — a loading unit optimised for 1 tonne pallets.
For the 35% of vehicles that do not 'gross out' but run out of deck space the pallet loads range from 60% to 100% (600kg to 1000kg per pallet). For these vehicles a 16.5m loading unit (A1650) would provide room for 32 pallets increasing the payload by 23%. Vehicles now just 80% full by weight could be loaded to 98% of their maximum payload and four times as many vehicles could work at their maximum efficiency, leaving only 15% still limited by not enough pallet space.
With an increase in load volume the number of part-laden vehicles may also be expected to increase slightly from say 60% to 65%. For these part-laden vehicles the ratio of pallets to payload gives a load density of between 250kg to 600kg per pallet. The same part-load
PACT - Parallel networks
Figure 12 — Relative emissions of Combined Transport (CT) Chains [15]; Benchmark road ~1.2ltr/ct.km (2020)
4 pallets
load5%
volume35%
part laden60%
load20%
volume15%
part laden65%
— 13.6m— SCM
Maximise efficiencyA1650
Useful spare capacity B82510%
Figure 13 — Utilisation of 13.6m semi-trailer combinations (light) and the SCM (dark), general-cargo-like goods [29]
BladeRunner — 2020 "the next transport revolution" Silvertip Design
Page 8 of 11 December, 2005
consignments would occupy a smaller proportion of the load space on a longer platform and so make more space available for other part loads1. Not only would this improve the likelihood of picking up additional part-loads, promote consolidation, improve back-loading and facilitate composite distribution, but also the 10% of the smallest consignments would be reduced to 50% or less of the load space and so fit into a (B825) half-sized loading unit. Longer load platforms with more spare capacity do not necessarily detract from the fuel efficiency of the vehicle [12]. On the contrary the increased load volume not only improves the transport efficiency of all of the vehicles but also helps reduce the number of trucks on the road at any one time. [7]
UTI Norm: Recommendations [25]
"As road and rail have different investment cycles, European combined transport operators have a paramount interest in stability of current regulations of dimensions of road vehicles." 2 In the long-term we all have a paramount interest in stability of regulations but as the UIRR also state "The market is free to accept or not to accept standards."
"UIRR operators and the International Associations of rail and road operators such as UIC and IRU do not favour a 15 m semi-trailer length."
"Any initiative aimed at standardisation should not result in a restriction of this relative flexibility of combined transport. Restrictions would only make intermodal transport less attractive while road transport would continue to be free, within specific maximum vehicle dimensions, to optimise load lengths, volumes and payloads." [27]
There is a contradiction here that can be resolved in favour of CT chains. A
1 Although not full, only 20% of the 13.6m semi-trailers have room for four or more additional pallets. 2 'Hi-Cube' is currently achieved at the expense of wheel size, chassis section and suspension travel. These are either an inefficient use of materials or a compromise to the ride quality of the vehicle to the detriment of both road and rail design and at a cost to the infrastructure.
polarisation of loading unit dimensions that are economic on the road and cut out the dead length and handling overheads on rail must improve the CT viability. If we do not take this opportunity early enough, investment opportunities will be misplaced.
PACT - study [15]
A study by Pilot Actions for Combined Transport (PACT - Figure 12) also shows the CO2 emissions of road versus Combined Transport (CT) Rail. Taking 1.2 ltr/ct.km as the benchmark for road, at 1.0 ltr/ct.km an SCM/inter-link vehicle could improve the efficiency of road transport leg of a CT journey by 20%, equalling that of the accompanied CT traffic on the railways as demonstrated earlier.
The modular vehicle concept also promotes the use of the more efficient unaccompanied swap body and container CT traffic. With a move towards a new generation of full and half-sized containers and swap-bodies BladeRunner can efficiently move freight around a regional network on roads and adapted branch railways, feeding some of it to the main railway network via gateways. By depositing the loading units in precise lines above the railway track the modal interface can also be optimised.
The vehicles are equally well suited to work on feeder systems for the loading and unloading of container ships. In designated areas BladeRunner can be readily automated to work in unison with the automatic cranes [6].
5 Vehicle - Highway Automation
Opportunities and Deployment Paths
In July 2004 the International Task Force for Vehicle-Highway Automation (ITFVHA) met in Troy, Michigan, USA.
"The overall workshop objective was to create synergies among the various camps engaged in studies of truck automation deployment and related areas, in order to move from concept towards actual deployments of effective and practical systems to exchange information and to explore deployment paths." [31]
The concept of Vehicle-Highway Automation with mixed traffic has
evolved to now focus on two distinct modes of operation.
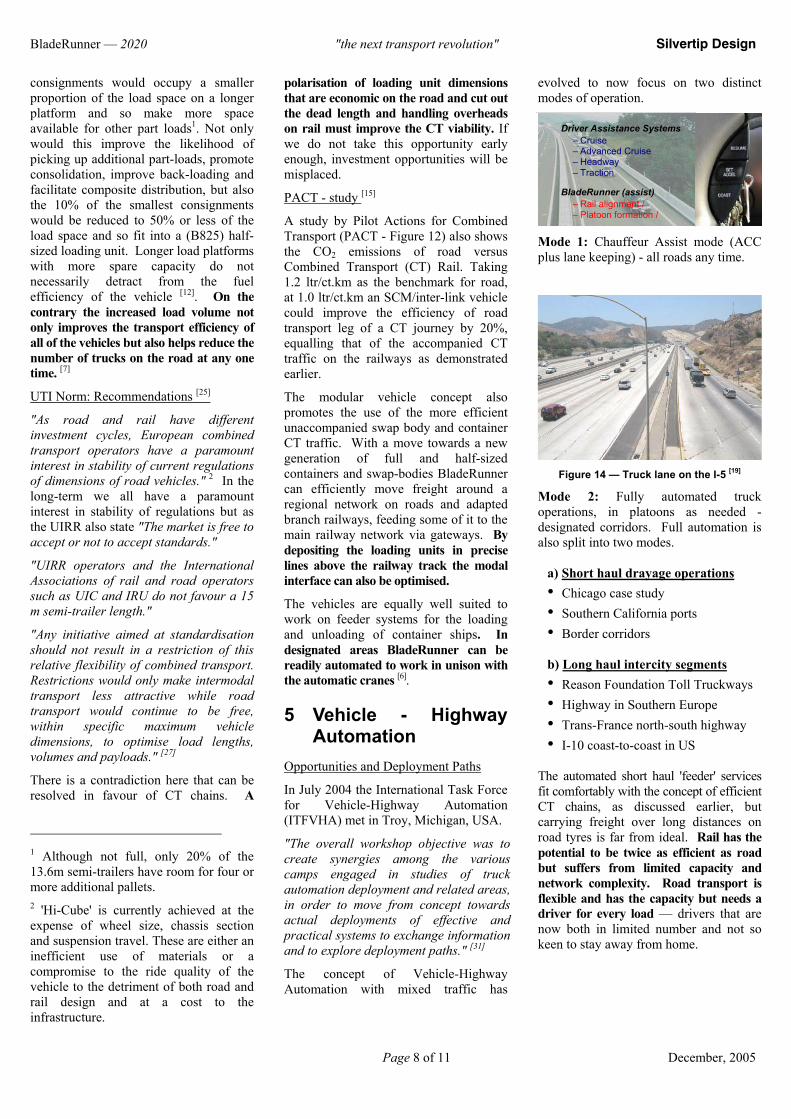
Driver Assistance Systems– Cruise– Advanced Cruise– Headway– Traction
BladeRunner (assist)– Rail alignment /– Platoon formation /
Mode 1: Chauffeur Assist mode (ACC plus lane keeping) - all roads any time.
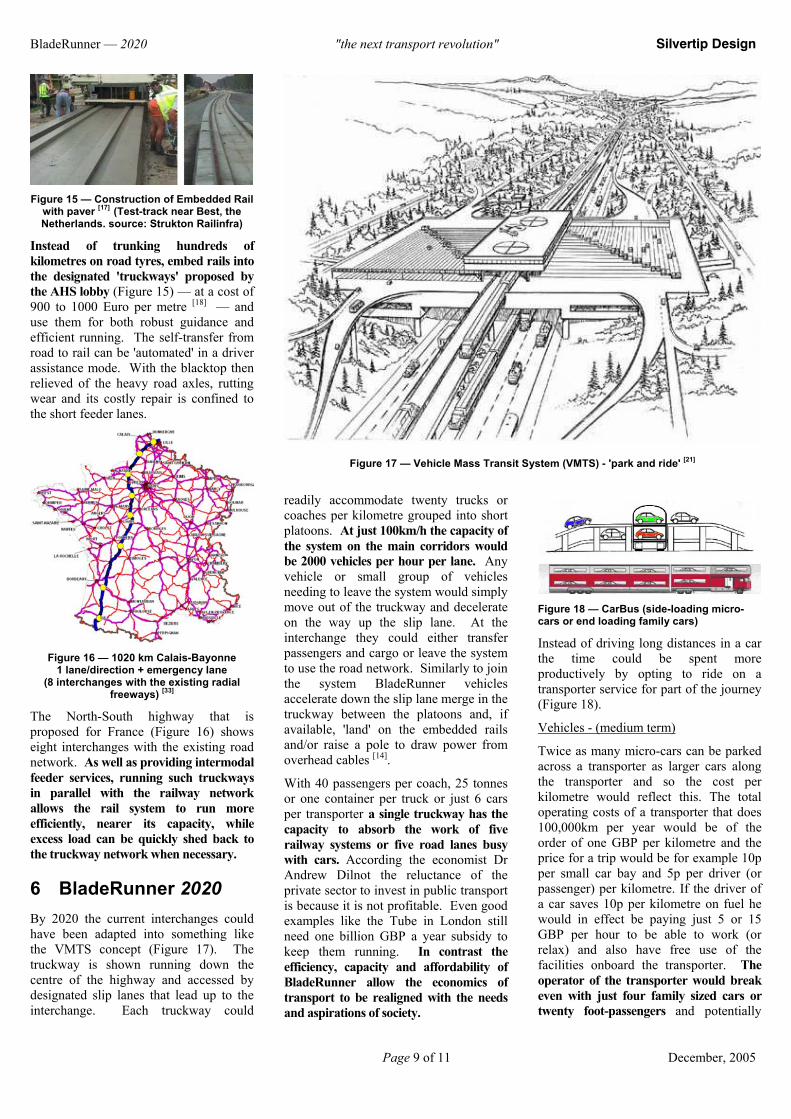
Figure 14 — Truck lane on the I-5 [19]
Mode 2: Fully automated truck operations, in platoons as needed - designated corridors. Full automation is also split into two modes.
a) Short haul drayage operations • Chicago case study • Southern California ports • Border corridors b) Long haul intercity segments • Reason Foundation Toll Truckways • Highway in Southern Europe • Trans-France north-south highway • I-10 coast-to-coast in US
The automated short haul 'feeder' services fit comfortably with the concept of efficient CT chains, as discussed earlier, but carrying freight over long distances on road tyres is far from ideal. Rail has the potential to be twice as efficient as road but suffers from limited capacity and network complexity. Road transport is flexible and has the capacity but needs a driver for every load — drivers that are now both in limited number and not so keen to stay away from home.
BladeRunner — 2020 "the next transport revolution" Silvertip Design
Page 9 of 11 December, 2005
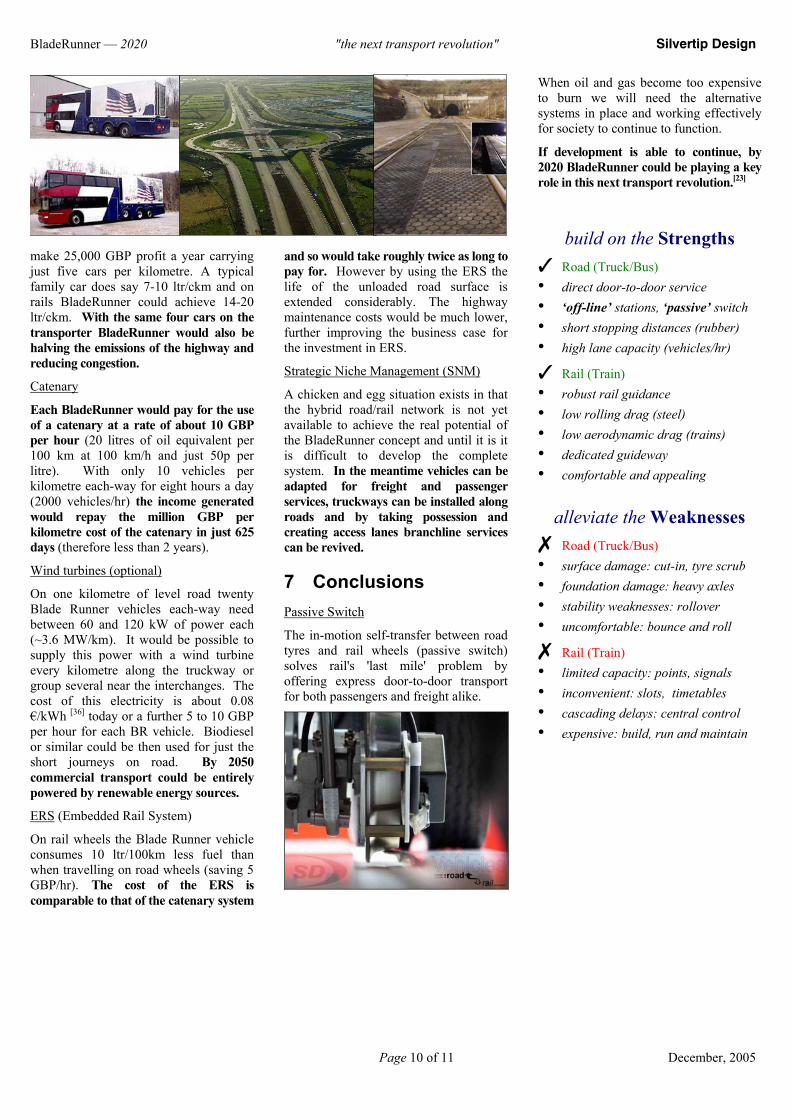
Figure 15 — Construction of Embedded Rail
with paver [17] (Test-track near Best, the Netherlands. source: Strukton Railinfra)
Instead of trunking hundreds of kilometres on road tyres, embed rails into the designated 'truckways' proposed by the AHS lobby (Figure 15) — at a cost of 900 to 1000 Euro per metre [18] — and use them for both robust guidance and efficient running. The self-transfer from road to rail can be 'automated' in a driver assistance mode. With the blacktop then relieved of the heavy road axles, rutting wear and its costly repair is confined to the short feeder lanes.
Figure 16 — 1020 km Calais-Bayonne
1 lane/direction + emergency lane (8 interchanges with the existing radial
freeways) [33]
The North-South highway that is proposed for France (Figure 16) shows eight interchanges with the existing road network. As well as providing intermodal feeder services, running such truckways in parallel with the railway network allows the rail system to run more efficiently, nearer its capacity, while excess load can be quickly shed back to the truckway network when necessary.
6 BladeRunner 2020 By 2020 the current interchanges could have been adapted into something like the VMTS concept (Figure 17). The truckway is shown running down the centre of the highway and accessed by designated slip lanes that lead up to the interchange. Each truckway could
readily accommodate twenty trucks or coaches per kilometre grouped into short platoons. At just 100km/h the capacity of the system on the main corridors would be 2000 vehicles per hour per lane. Any vehicle or small group of vehicles needing to leave the system would simply move out of the truckway and decelerate on the way up the slip lane. At the interchange they could either transfer passengers and cargo or leave the system to use the road network. Similarly to join the system BladeRunner vehicles accelerate down the slip lane merge in the truckway between the platoons and, if available, 'land' on the embedded rails and/or raise a pole to draw power from overhead cables [14].
With 40 passengers per coach, 25 tonnes or one container per truck or just 6 cars per transporter a single truckway has the capacity to absorb the work of five railway systems or five road lanes busy with cars. According the economist Dr Andrew Dilnot the reluctance of the private sector to invest in public transport is because it is not profitable. Even good examples like the Tube in London still need one billion GBP a year subsidy to keep them running. In contrast the efficiency, capacity and affordability of BladeRunner allow the economics of transport to be realigned with the needs and aspirations of society.
Figure 18 — CarBus (side-loading micro-cars or end loading family cars)
Instead of driving long distances in a car the time could be spent more productively by opting to ride on a transporter service for part of the journey (Figure 18).
Vehicles - (medium term)
Twice as many micro-cars can be parked across a transporter as larger cars along the transporter and so the cost per kilometre would reflect this. The total operating costs of a transporter that does 100,000km per year would be of the order of one GBP per kilometre and the price for a trip would be for example 10p per small car bay and 5p per driver (or passenger) per kilometre. If the driver of a car saves 10p per kilometre on fuel he would in effect be paying just 5 or 15 GBP per hour to be able to work (or relax) and also have free use of the facilities onboard the transporter. The operator of the transporter would break even with just four family sized cars or twenty foot-passengers and potentially
Figure 17 — Vehicle Mass Transit System (VMTS) - 'park and ride' [21]
BladeRunner — 2020 "the next transport revolution" Silvertip Design
Page 10 of 11 December, 2005
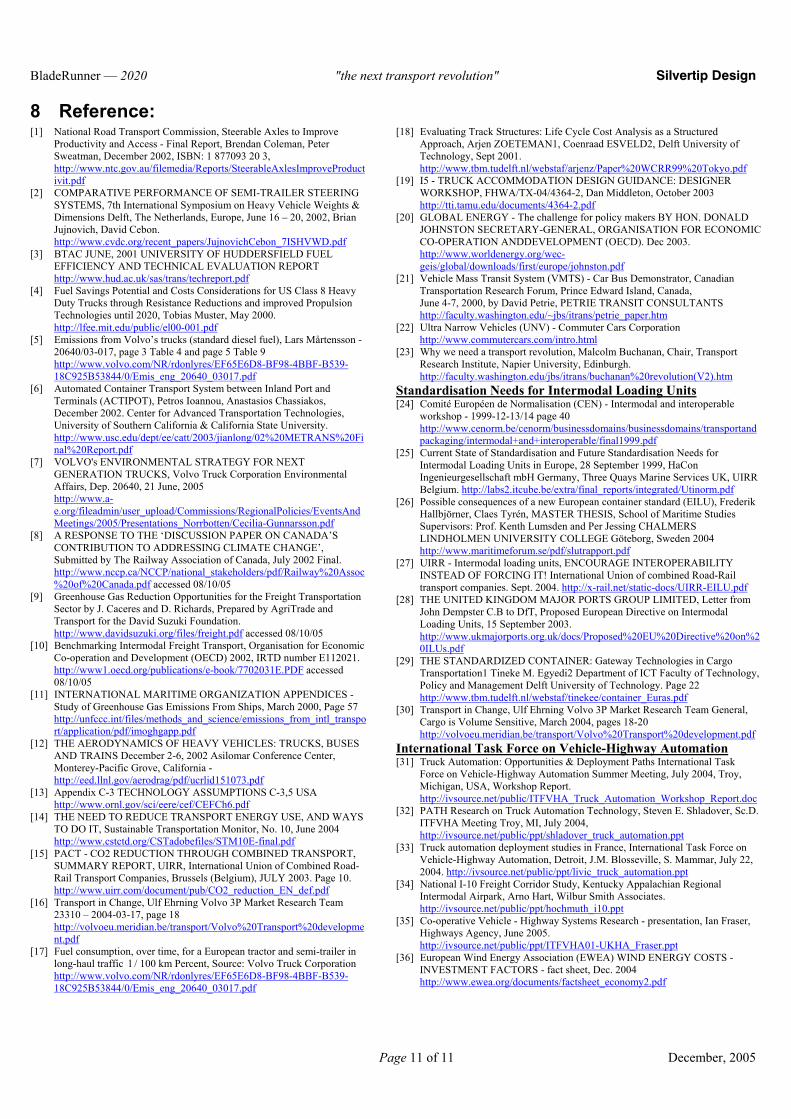
make 25,000 GBP profit a year carrying just five cars per kilometre. A typical family car does say 7-10 ltr/ckm and on rails BladeRunner could achieve 14-20 ltr/ckm. With the same four cars on the transporter BladeRunner would also be halving the emissions of the highway and reducing congestion.
Catenary
Each BladeRunner would pay for the use of a catenary at a rate of about 10 GBP per hour (20 litres of oil equivalent per 100 km at 100 km/h and just 50p per litre). With only 10 vehicles per kilometre each-way for eight hours a day (2000 vehicles/hr) the income generated would repay the million GBP per kilometre cost of the catenary in just 625 days (therefore less than 2 years).
Wind turbines (optional)
On one kilometre of level road twenty Blade Runner vehicles each-way need between 60 and 120 kW of power each (~3.6 MW/km). It would be possible to supply this power with a wind turbine every kilometre along the truckway or group several near the interchanges. The cost of this electricity is about 0.08 €/kWh [36] today or a further 5 to 10 GBP per hour for each BR vehicle. Biodiesel or similar could be then used for just the short journeys on road. By 2050 commercial transport could be entirely powered by renewable energy sources.
ERS (Embedded Rail System)
On rail wheels the Blade Runner vehicle consumes 10 ltr/100km less fuel than when travelling on road wheels (saving 5 GBP/hr). The cost of the ERS is comparable to that of the catenary system
and so would take roughly twice as long to pay for. However by using the ERS the life of the unloaded road surface is extended considerably. The highway maintenance costs would be much lower, further improving the business case for the investment in ERS.
Strategic Niche Management (SNM)
A chicken and egg situation exists in that the hybrid road/rail network is not yet available to achieve the real potential of the BladeRunner concept and until it is it is difficult to develop the complete system. In the meantime vehicles can be adapted for freight and passenger services, truckways can be installed along roads and by taking possession and creating access lanes branchline services can be revived.
7 Conclusions Passive Switch
The in-motion self-transfer between road tyres and rail wheels (passive switch) solves rail's 'last mile' problem by offering express door-to-door transport for both passengers and freight alike.
When oil and gas become too expensive to burn we will need the alternative systems in place and working effectively for society to continue to function.
If development is able to continue, by 2020 BladeRunner could be playing a key role in this next transport revolution.[23]
build on the Strengths
Road (Truck/Bus) • direct door-to-door service • ‘off-line’ stations, ‘passive’ switch • short stopping distances (rubber) • high lane capacity (vehicles/hr)
Rail (Train) • robust rail guidance • low rolling drag (steel) • low aerodynamic drag (trains) • dedicated guideway • comfortable and appealing
alleviate the Weaknesses Road (Truck/Bus)
• surface damage: cut-in, tyre scrub • foundation damage: heavy axles • stability weaknesses: rollover • uncomfortable: bounce and roll
Rail (Train) • limited capacity: points, signals • inconvenient: slots, timetables • cascading delays: central control • expensive: build, run and maintain
BladeRunner — 2020 "the next transport revolution" Silvertip Design
Page 11 of 11 December, 2005
8 Reference: [1] National Road Transport Commission, Steerable Axles to Improve
Productivity and Access - Final Report, Brendan Coleman, Peter Sweatman, December 2002, ISBN: 1 877093 20 3, http://www.ntc.gov.au/filemedia/Reports/SteerableAxlesImproveProductivit.pdf
[2] COMPARATIVE PERFORMANCE OF SEMI-TRAILER STEERING SYSTEMS, 7th International Symposium on Heavy Vehicle Weights & Dimensions Delft, The Netherlands, Europe, June 16 – 20, 2002, Brian Jujnovich, David Cebon. http://www.cvdc.org/recent_papers/JujnovichCebon_7ISHVWD.pdf
[3] BTAC JUNE, 2001 UNIVERSITY OF HUDDERSFIELD FUEL EFFICIENCY AND TECHNICAL EVALUATION REPORT http://www.hud.ac.uk/sas/trans/techreport.pdf
[4] Fuel Savings Potential and Costs Considerations for US Class 8 Heavy Duty Trucks through Resistance Reductions and improved Propulsion Technologies until 2020, Tobias Muster, May 2000. http://lfee.mit.edu/public/el00-001.pdf
[5] Emissions from Volvo’s trucks (standard diesel fuel), Lars Mårtensson - 20640/03-017, page 3 Table 4 and page 5 Table 9 http://www.volvo.com/NR/rdonlyres/EF65E6D8-BF98-4BBF-B539-18C925B53844/0/Emis_eng_20640_03017.pdf
[6] Automated Container Transport System between Inland Port and Terminals (ACTIPOT), Petros Ioannou, Anastasios Chassiakos, December 2002. Center for Advanced Transportation Technologies, University of Southern California & California State University. http://www.usc.edu/dept/ee/catt/2003/jianlong/02%20METRANS%20Final%20Report.pdf
[7] VOLVO's ENVIRONMENTAL STRATEGY FOR NEXT GENERATION TRUCKS, Volvo Truck Corporation Environmental Affairs, Dep. 20640, 21 June, 2005 http://www.a-e.org/fileadmin/user_upload/Commissions/RegionalPolicies/EventsAndMeetings/2005/Presentations_Norrbotten/Cecilia-Gunnarsson.pdf
[8] A RESPONSE TO THE ‘DISCUSSION PAPER ON CANADA’S CONTRIBUTION TO ADDRESSING CLIMATE CHANGE’, Submitted by The Railway Association of Canada, July 2002 Final. http://www.nccp.ca/NCCP/national_stakeholders/pdf/Railway%20Assoc%20of%20Canada.pdf accessed 08/10/05
[9] Greenhouse Gas Reduction Opportunities for the Freight Transportation Sector by J. Caceres and D. Richards, Prepared by AgriTrade and Transport for the David Suzuki Foundation. http://www.davidsuzuki.org/files/freight.pdf accessed 08/10/05
[10] Benchmarking Intermodal Freight Transport, Organisation for Economic Co-operation and Development (OECD) 2002, IRTD number E112021. http://www1.oecd.org/publications/e-book/7702031E.PDF accessed 08/10/05
[11] INTERNATIONAL MARITIME ORGANIZATION APPENDICES - Study of Greenhouse Gas Emissions From Ships, March 2000, Page 57 http://unfccc.int/files/methods_and_science/emissions_from_intl_transport/application/pdf/imoghgapp.pdf
[12] THE AERODYNAMICS OF HEAVY VEHICLES: TRUCKS, BUSES AND TRAINS December 2-6, 2002 Asilomar Conference Center, Monterey-Pacific Grove, California - http://eed.llnl.gov/aerodrag/pdf/ucrlid151073.pdf
[13] Appendix C-3 TECHNOLOGY ASSUMPTIONS C-3,5 USA http://www.ornl.gov/sci/eere/cef/CEFCh6.pdf
[14] THE NEED TO REDUCE TRANSPORT ENERGY USE, AND WAYS TO DO IT, Sustainable Transportation Monitor, No. 10, June 2004 http://www.cstctd.org/CSTadobefiles/STM10E-final.pdf
[15] PACT - CO2 REDUCTION THROUGH COMBINED TRANSPORT, SUMMARY REPORT, UIRR, International Union of Combined Road-Rail Transport Companies, Brussels (Belgium), JULY 2003. Page 10. http://www.uirr.com/document/pub/CO2_reduction_EN_def.pdf
[16] Transport in Change, Ulf Ehrning Volvo 3P Market Research Team 23310 – 2004-03-17, page 18 http://volvoeu.meridian.be/transport/Volvo%20Transport%20development.pdf
[17] Fuel consumption, over time, for a European tractor and semi-trailer in long-haul traffic l / 100 km Percent, Source: Volvo Truck Corporation http://www.volvo.com/NR/rdonlyres/EF65E6D8-BF98-4BBF-B539-18C925B53844/0/Emis_eng_20640_03017.pdf
[18] Evaluating Track Structures: Life Cycle Cost Analysis as a Structured Approach, Arjen ZOETEMAN1, Coenraad ESVELD2, Delft University of Technology, Sept 2001. http://www.tbm.tudelft.nl/webstaf/arjenz/Paper%20WCRR99%20Tokyo.pdf
[19] I5 - TRUCK ACCOMMODATION DESIGN GUIDANCE: DESIGNER WORKSHOP, FHWA/TX-04/4364-2, Dan Middleton, October 2003 http://tti.tamu.edu/documents/4364-2.pdf
[20] GLOBAL ENERGY - The challenge for policy makers BY HON. DONALD JOHNSTON SECRETARY-GENERAL, ORGANISATION FOR ECONOMIC CO-OPERATION ANDDEVELOPMENT (OECD). Dec 2003. http://www.worldenergy.org/wec-geis/global/downloads/first/europe/johnston.pdf
[21] Vehicle Mass Transit System (VMTS) - Car Bus Demonstrator, Canadian Transportation Research Forum, Prince Edward Island, Canada, June 4-7, 2000, by David Petrie, PETRIE TRANSIT CONSULTANTS http://faculty.washington.edu/~jbs/itrans/petrie_paper.htm
[22] Ultra Narrow Vehicles (UNV) - Commuter Cars Corporation http://www.commutercars.com/intro.html
[23] Why we need a transport revolution, Malcolm Buchanan, Chair, Transport Research Institute, Napier University, Edinburgh. http://faculty.washington.edu/jbs/itrans/buchanan%20revolution(V2).htm
Standardisation Needs for Intermodal Loading Units [24] Comité Européen de Normalisation (CEN) - Intermodal and interoperable
workshop - 1999-12-13/14 page 40 http://www.cenorm.be/cenorm/businessdomains/businessdomains/transportandpackaging/intermodal+and+interoperable/final1999.pdf
[25] Current State of Standardisation and Future Standardisation Needs for Intermodal Loading Units in Europe, 28 September 1999, HaCon Ingenieurgesellschaft mbH Germany, Three Quays Marine Services UK, UIRR Belgium. http://labs2.itcube.be/extra/final_reports/integrated/Utinorm.pdf
[26] Possible consequences of a new European container standard (EILU), Frederik Hallbjörner, Claes Tyrén, MASTER THESIS, School of Maritime Studies Supervisors: Prof. Kenth Lumsden and Per Jessing CHALMERS LINDHOLMEN UNIVERSITY COLLEGE Göteborg, Sweden 2004 http://www.maritimeforum.se/pdf/slutrapport.pdf
[27] UIRR - Intermodal loading units, ENCOURAGE INTEROPERABILITY INSTEAD OF FORCING IT! International Union of combined Road-Rail transport companies. Sept. 2004. http://x-rail.net/static-docs/UIRR-EILU.pdf
[28] THE UNITED KINGDOM MAJOR PORTS GROUP LIMITED, Letter from John Dempster C.B to DfT, Proposed European Directive on Intermodal Loading Units, 15 September 2003. http://www.ukmajorports.org.uk/docs/Proposed%20EU%20Directive%20on%20ILUs.pdf
[29] THE STANDARDIZED CONTAINER: Gateway Technologies in Cargo Transportation1 Tineke M. Egyedi2 Department of ICT Faculty of Technology, Policy and Management Delft University of Technology. Page 22 http://www.tbm.tudelft.nl/webstaf/tinekee/container_Euras.pdf
[30] Transport in Change, Ulf Ehrning Volvo 3P Market Research Team General, Cargo is Volume Sensitive, March 2004, pages 18-20 http://volvoeu.meridian.be/transport/Volvo%20Transport%20development.pdf
International Task Force on Vehicle-Highway Automation [31] Truck Automation: Opportunities & Deployment Paths International Task
Force on Vehicle-Highway Automation Summer Meeting, July 2004, Troy, Michigan, USA, Workshop Report. http://ivsource.net/public/ITFVHA_Truck_Automation_Workshop_Report.doc
[32] PATH Research on Truck Automation Technology, Steven E. Shladover, Sc.D. ITFVHA Meeting Troy, MI, July 2004, http://ivsource.net/public/ppt/shladover_truck_automation.ppt
[33] Truck automation deployment studies in France, International Task Force on Vehicle-Highway Automation, Detroit, J.M. Blosseville, S. Mammar, July 22, 2004. http://ivsource.net/public/ppt/livic_truck_automation.ppt
[34] National I-10 Freight Corridor Study, Kentucky Appalachian Regional Intermodal Airpark, Arno Hart, Wilbur Smith Associates. http://ivsource.net/public/ppt/hochmuth_i10.ppt
[35] Co-operative Vehicle - Highway Systems Research - presentation, Ian Fraser, Highways Agency, June 2005. http://ivsource.net/public/ppt/ITFVHA01-UKHA_Fraser.ppt
[36] European Wind Energy Association (EWEA) WIND ENERGY COSTS - INVESTMENT FACTORS - fact sheet, Dec. 2004 http://www.ewea.org/documents/factsheet_economy2.pdf