Embed Size (px)
Citation preview
Global Mid-Year Threat Landscape Report
2018
[2]
White Paper
Contents
Key Findings 3
Foreword 3
Vulnerabilities 4
Windows Threat Landscape at a Glance 7
United States 8
The United Kingdom 9
Germany 10
France 11
Spain 12
Italy 12
Denmark 13
Sweden 14
Romania 15
Australia 16
Middle East 16
Android Threat Landscape at a Glance 17
United States 17
The United Kingdom 18
Germany 18
France 19
Spain 19
Italy 20
Denmark 20
Sweden 21
Romania 21
Australia 22
Takeaways 23
[3]
White Paper
Key Findings The first half of 2018 brought interesting developments in terms of new emerging threats, significant “upgrades” to old threats, and a change in cybercriminal tactics when choosing targets and tools to increase revenue.
n The year-over-year number and complexity of reported vulnerabilities has increased, with security researchers disclosing not just vulnerabilities in software, but also in hardware.
nRansomware is still a steady presence, with new families appearing, and varying ransom notes based on compromised endpoint or data.
nCryptocurrency miners – although not even considered a threat in late 2017 – have now been abused by threat actors and turned into threats that endanger infrastructure and pose serious security risks to organizations.
nFileless malware, usually associated with advanced persistent threats and cyberespionage campaigns, has started being adopted en masse to deliver seemingly benign threats, such as crypto miners.
nAndroid threats have also been focusing on stealth, making money, and on delivering additional components, acting as remote access Trojans on compromised devices. Bitdefender research has revealed the existence of a spyware framework with advanced surveillance capabilities, potentially targeting Israeli victims.
Even adware is now borderline malware, as Bitdefender researchers uncovered a complex six-year operation that blurs the line between adware and spyware to the extent that it’s difficult to tell where one begins and the other ends. Enabled with rootkit-based catabolites and sophisticated persistence mechanisms, adware looks more like spyware than ever.
IoT devices have also been in the spotlight, as we’ve seen the first piece of IoT malware that packs persistency and resiliency features that enable it to remain in control of compromised devices even after reboots. Hide ‘N Seek is one example of an IoT botnet using custom-built peer-to-peer communication, compromising over 32,000 devices.
ForewordThe use of unknown or unpatched software vulnerabilities in advanced attacks is key to threat actors, as it allows them to infiltrate organizations or distribute malware en masse to vulnerable systems. The role of security researchers publicly disclosing found vulnerabilities is to help software vendors avoid being used as a means for weakening security, while ensuring that other vendors don’t repeat the mistakes.
Analysis of publicly disclosed vulnerabilities by mid-2018 shows an increase in number compared to the first half of 2017. While vulnerabilities in popular Microsoft, Apple, and Linux products are those most commonly reported, recent hardware vulnerabilities - such as Specter and Meltdown – have redefined the way hardware vendors and organizations need to look at security.
While most threat landscape reports focus on top threats in the wild, they rarely paint a full picture of threat trends. Cybercriminals often employ new malware or find new methods for compromising victims, so it’s sometime more important to look at the new “tools” that augment their growing arsenal.
Traditionally, Downadup, JavaScript agents, AutorunINF, various Trojan families, and even Sality would easily be found in a top-threat landscape, because most have the sole purpose of spreading and infecting as many victims as possible. Although their occurrence in raw numbers shows they’re still popular, it doesn’t mean that cybercriminals are actively figuring out new ways of using them to compromise targets.
It’s important to examine the bigger picture to recognize not just the emergence of new threats and their evolution in the first half of 2018, but also how threat actors have been using attack techniques normally associated with targeted attacks. Instead of focusing on garden-variety threats that are more of a nuisance and distinguish themselves only through mass infection and not sophistication, this report will focus on threats that have either emerged by mid-2018 or threats that have consistently been “updated” to maximize attackers’ return-on-investment.
Bitdefender telemetry identifies the three major threats by mid-2018 as ransomware, cryptojackers and fileless malware. The most notorious ransomware strain, which emerged in January 2018, is GranCrab. What makes it interesting is that it managed to infect around 50,000 computers either via malicious advertisements that served the Rig Exploit Kit or via email messages. One unique feature of the ransomware is its exorbitant ransom demands -- from $400 to $700,000. GranCrab operators are believed to have worked in conjunction with botnet masters to selectively infect high-profile targets, and customize the ransom note based on the value of the encrypted data for the company. This strategy differs significantly from the en masse approach of past ransomware campaigns, as it further exploits the value of the encrypted data to maximize profit based on the victim’s profile and financial ability.
The cryptocurrency craze of late 2017 that spiked Bitcoin trading prices to almost $20,000 per unit has led to the emergence of alternative cryptocurrency mining methods. CoinHive was the first browser-based JavaScript cryptocurrency miner meant to be used as a legitimate method for website owners to use the computing resources of their visitors – with their express permission – to mine for cryptocurrency. However, the script was later abused by threat actors and embedded into compromised high-traffic websites to illicitly mine for crypto currency.
[4]
White Paper
However, attackers figured that a more viable method for mining for cryptocurrency would be to infect large infrastructures of organizations or industrial control systems. From water utility companies to Docker and other cloud services, cryptojacking has moved from a nuisance to an actual threat, as its delivery methods involved leveraging fileless malware to compromise an organization’s defenses. Cryptojacking is now considered a real threat to organizations, as it can remain stealth for a considerable time, exposes a potentially unknown security gap, and impacts not just consolidation ratios and usability but monthly bills if the victim is a Iaas client with automated provisioning enabled.
Fileless malware, traditionally attributed to advanced persistent threats operated for cyberespionage, has now become a low hanging fruit for threat actors as they’ve started adopting it for delivering cryptocurrency malware within businesses infrastructures. Since it’s an effective method for dodging traditional security solutions, our telemetry has shown that fileless malware reports have increased or decreased in direct relation to cryptojacking reports. The low barrier to entry has turned fileless malware into a real threat for organizations, especially since it’s being used in conjunction with a seemingly benign payload: cryptocurrency miners.
The IoT threat landscape is a matter of concern in terms of security, as by mid-2018 we’ve already seen IoT malware that’s both persistent – ensuring its presence on the infected device – and advanced by using custom-built Peer-to-Peer communication. Bitdefender found the Hide ‘N Seek IoT botnet that affected more than 32,000 smart devices worldwide. The botnet has a significant number of payloads designed to increase the number of smart devices it can compromise and enable data exfiltration. For now, the botnet is undergoing constant redesign and rapid expansion, while employing anti-tampering techniques to prevent its dismantling.
Android malware, also rampant, steadily employs new capabilities designed for espionage and remote surveillance. Bitdefender recently uncovered an Android spyware framework designed for cyber espionage, apparently targeting Israeli users. While seemingly under development, the Android espionage framework suggests threat actors are constantly building new and more sophisticated malware for Android devices.
Vulnerabilities Publicly disclosed vulnerabilities are usually associated with a CVE (Common Vulnerabilities and Exposures) number, a description, and a score. A score over 7 is usually considered of high severity, and vendors quickly rush to push patches.
This informational database helps identify the seriousness and complexity of the vulnerability, contains details on how it’s triggered, and whether mitigations or patches are available to fix it.
The database is publicly accessible; as soon as a new vulnerability is found, security specialists know about it and can take appropriate measures to secure their systems.
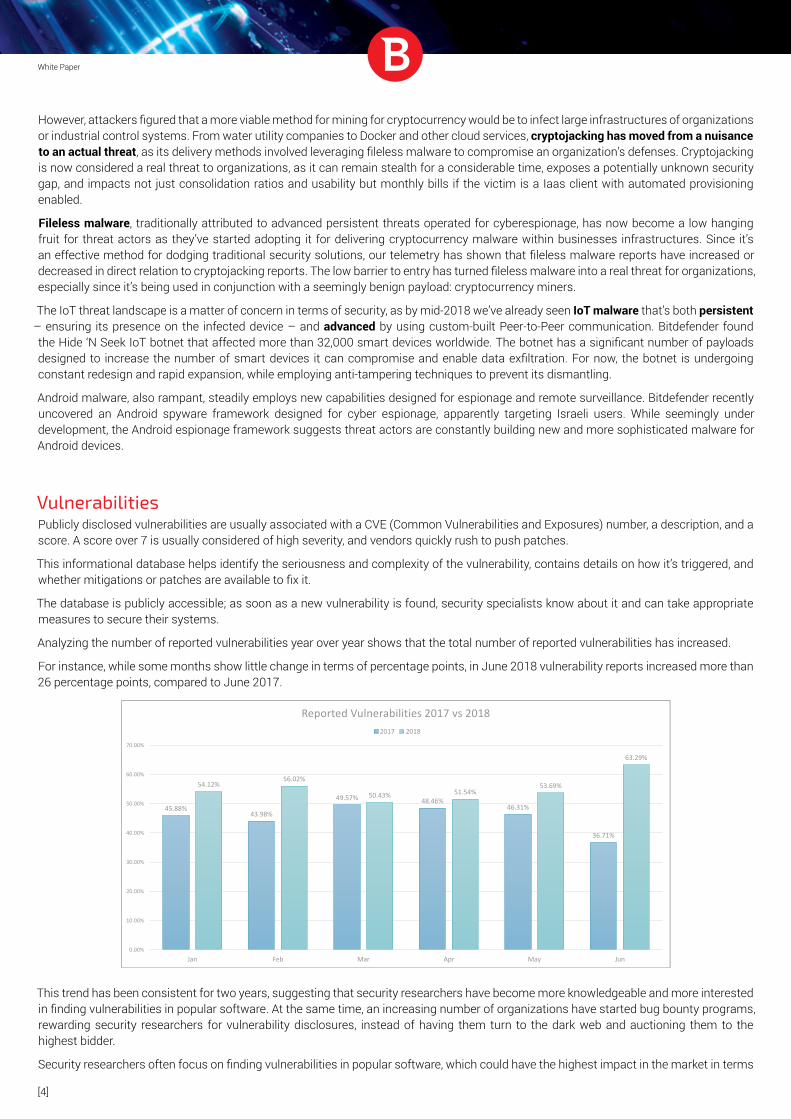
Analyzing the number of reported vulnerabilities year over year shows that the total number of reported vulnerabilities has increased.
For instance, while some months show little change in terms of percentage points, in June 2018 vulnerability reports increased more than 26 percentage points, compared to June 2017.
This trend has been consistent for two years, suggesting that security researchers have become more knowledgeable and more interested in finding vulnerabilities in popular software. At the same time, an increasing number of organizations have started bug bounty programs, rewarding security researchers for vulnerability disclosures, instead of having them turn to the dark web and auctioning them to the highest bidder.
Security researchers often focus on finding vulnerabilities in popular software, which could have the highest impact in the market in terms
45.88%43.98%
49.57% 48.46%46.31%
36.71%
54.12%56.02%
50.43% 51.54%53.69%
63.29%
0.00%
10.00%
20.00%
30.00%
40.00%
50.00%
60.00%
70.00%
Jan Feb Mar Apr May Jun
Reported Vulnerabilities 2017 vs 20182017 2018
[5]
White Paper
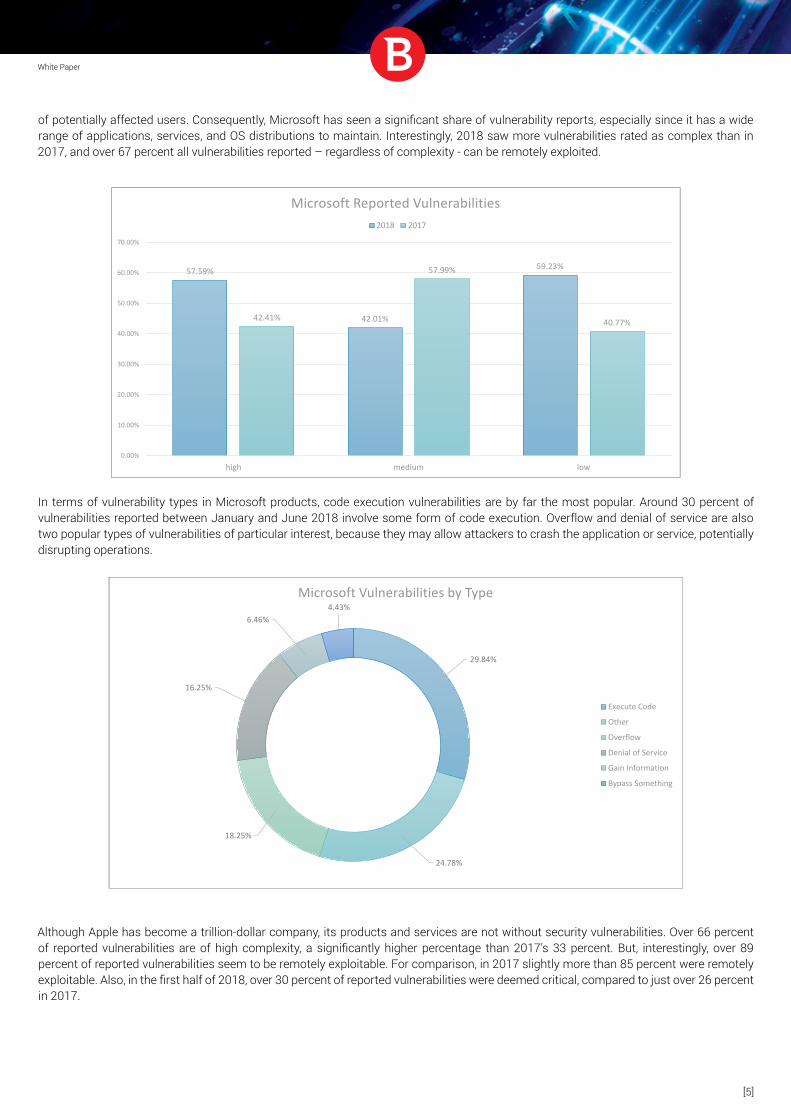
of potentially affected users. Consequently, Microsoft has seen a significant share of vulnerability reports, especially since it has a wide range of applications, services, and OS distributions to maintain. Interestingly, 2018 saw more vulnerabilities rated as complex than in 2017, and over 67 percent all vulnerabilities reported – regardless of complexity - can be remotely exploited.
In terms of vulnerability types in Microsoft products, code execution vulnerabilities are by far the most popular. Around 30 percent of vulnerabilities reported between January and June 2018 involve some form of code execution. Overflow and denial of service are also two popular types of vulnerabilities of particular interest, because they may allow attackers to crash the application or service, potentially disrupting operations.
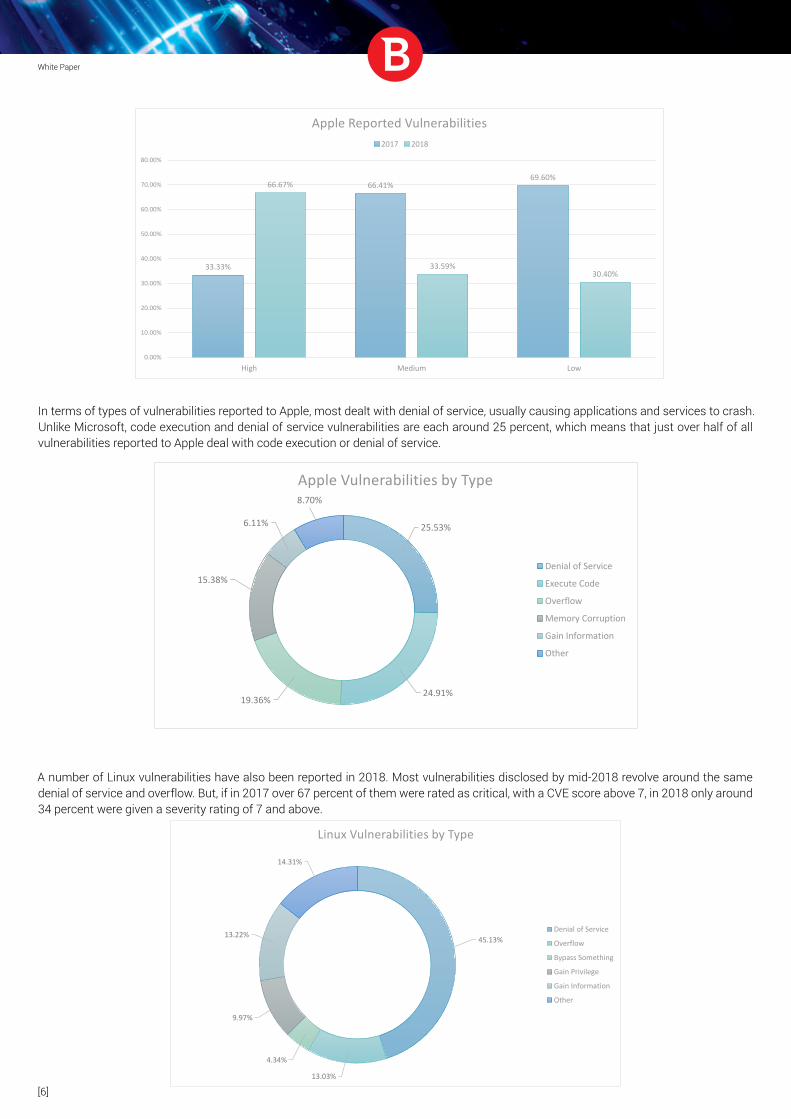
Although Apple has become a trillion-dollar company, its products and services are not without security vulnerabilities. Over 66 percent of reported vulnerabilities are of high complexity, a significantly higher percentage than 2017’s 33 percent. But, interestingly, over 89 percent of reported vulnerabilities seem to be remotely exploitable. For comparison, in 2017 slightly more than 85 percent were remotely exploitable. Also, in the first half of 2018, over 30 percent of reported vulnerabilities were deemed critical, compared to just over 26 percent in 2017.
57.59%
42.01%
59.23%
42.41%
57.99%
40.77%
0.00%
10.00%
20.00%
30.00%
40.00%
50.00%
60.00%
70.00%
high medium low
Microsoft Reported Vulnerabilities2018 2017
29.84%
24.78%
18.25%
16.25%
6.46%4.43%
Microsoft Vulnerabilities by Type
Execute Code
Other
Overflow
Denial of Service
Gain Information
Bypass Something
[6]
White Paper
In terms of types of vulnerabilities reported to Apple, most dealt with denial of service, usually causing applications and services to crash. Unlike Microsoft, code execution and denial of service vulnerabilities are each around 25 percent, which means that just over half of all vulnerabilities reported to Apple deal with code execution or denial of service.
A number of Linux vulnerabilities have also been reported in 2018. Most vulnerabilities disclosed by mid-2018 revolve around the same denial of service and overflow. But, if in 2017 over 67 percent of them were rated as critical, with a CVE score above 7, in 2018 only around 34 percent were given a severity rating of 7 and above.
33.33%
66.41%69.60%
66.67%
33.59%30.40%
0.00%
10.00%
20.00%
30.00%
40.00%
50.00%
60.00%
70.00%
80.00%
High Medium Low
Apple Reported Vulnerabilities2017 2018
25.53%
24.91%19.36%
15.38%
6.11%
8.70%
Apple Vulnerabilities by Type
Denial of Service
Execute Code
Overflow
Memory Corruption
Gain Information
Other
45.13%
13.03%
4.34%
9.97%
13.22%
14.31%
Linux Vulnerabilities by Type
Denial of Service
Overflow
Bypass Something
Gain Privilege
Gain Information
Other
[7]
White Paper
The two major vulnerabilities that have taken the spotlight in the first half of 2018 remain Specter and Meltdown. The two consist of design flaws in processors from leading chip manufacturers that could allow attackers to access sensitive information.
Specter exploits a vulnerability in how a chip guesses what information the system needs to handle next - the process is called speculative execution. If exploited, it enables attackers to trick the processor into starting this process and read the secret data the processor makes available as it tries guesses what action or function the computer will carry out next.
The second flaw, Meltdown, enables threat actors to access sensitive or secret information through the operating system. This type of attack is commonly referred to in the security industry as a side-channel attack, as it enables the attacker to access information being used by a legitimate process or application.
Intel, Arm and AMD CPUs are susceptible to one or more variants of the attack, but the danger is heightened because servers – the backbone of all major cloud services – are also potentially affected. CPU vendors have already issued a series of updates to prevent the vulnerabilities from being exploited, but deployment has reportedly caused performance penalties.
The seriousness of these types of vulnerabilities lies in the sheer number of potentially affected devices as well as their persistence over time. Security experts estimate that full protection can only come from fully replacing vulnerable equipment with equipment containing CPUs fundamentally redesigned to addresses these vulnerabilities. Since this replacement process will likely take years and will be extremely costly, a wide range of devices will potentially remain exposed to these niche attacks.
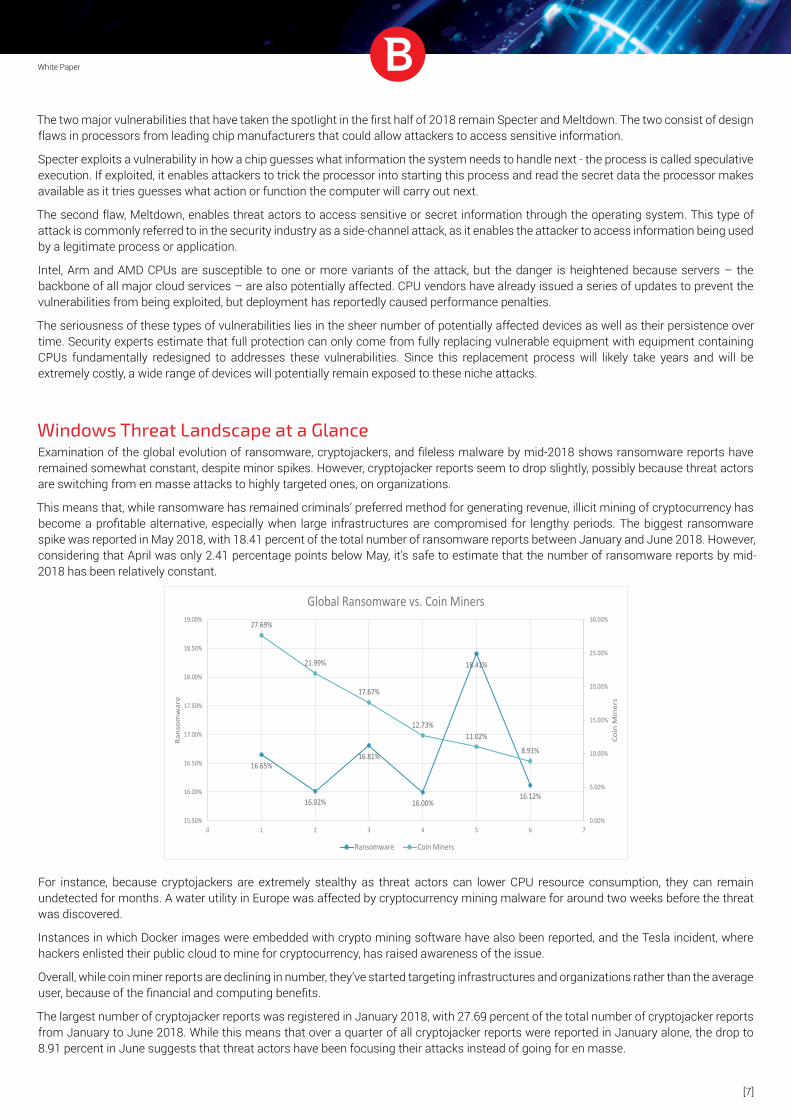
Windows Threat Landscape at a GlanceExamination of the global evolution of ransomware, cryptojackers, and fileless malware by mid-2018 shows ransomware reports have remained somewhat constant, despite minor spikes. However, cryptojacker reports seem to drop slightly, possibly because threat actors are switching from en masse attacks to highly targeted ones, on organizations.
This means that, while ransomware has remained criminals’ preferred method for generating revenue, illicit mining of cryptocurrency has become a profitable alternative, especially when large infrastructures are compromised for lengthy periods. The biggest ransomware spike was reported in May 2018, with 18.41 percent of the total number of ransomware reports between January and June 2018. However, considering that April was only 2.41 percentage points below May, it’s safe to estimate that the number of ransomware reports by mid-2018 has been relatively constant.
For instance, because cryptojackers are extremely stealthy as threat actors can lower CPU resource consumption, they can remain undetected for months. A water utility in Europe was affected by cryptocurrency mining malware for around two weeks before the threat was discovered.
Instances in which Docker images were embedded with crypto mining software have also been reported, and the Tesla incident, where hackers enlisted their public cloud to mine for cryptocurrency, has raised awareness of the issue.
Overall, while coin miner reports are declining in number, they’ve started targeting infrastructures and organizations rather than the average user, because of the financial and computing benefits.
The largest number of cryptojacker reports was registered in January 2018, with 27.69 percent of the total number of cryptojacker reports from January to June 2018. While this means that over a quarter of all cryptojacker reports were reported in January alone, the drop to 8.91 percent in June suggests that threat actors have been focusing their attacks instead of going for en masse.
16.65%
16.02%
16.81%
16.00%
18.41%
16.12%
27.69%
21.99%
17.67%
12.73%11.02%
8.91%
0.00%
5.00%
10.00%
15.00%
20.00%
25.00%
30.00%
15.50%
16.00%
16.50%
17.00%
17.50%
18.00%
18.50%
19.00%
0 1 2 3 4 5 6 7
Coin
Min
ers
Rans
omw
are
Global Ransomware vs. Coin Miners
Ransomware Coin Miners
[8]
White Paper
Comparing coin miner reports with fileless reports reveals an interesting pattern. Considering cryptojackers have been targeting organizations, threat actors have been using the fileless malware to deliver the coin mining payload. With fileless malware becoming a low-hanging fruit for threat actors, using it to deliver cryptocurrency mining software makes sense, as it allows them to dodge detection from traditional security solutions. The statistics above show that fileless malware reports seem correlated to some extent with coin miner reports.
The same cannot be said when comparing ransomware and fileless reports. Ransomware is still a popular choice for making money, as our telemetry shows that it’s been experiencing only minor fluctuations.
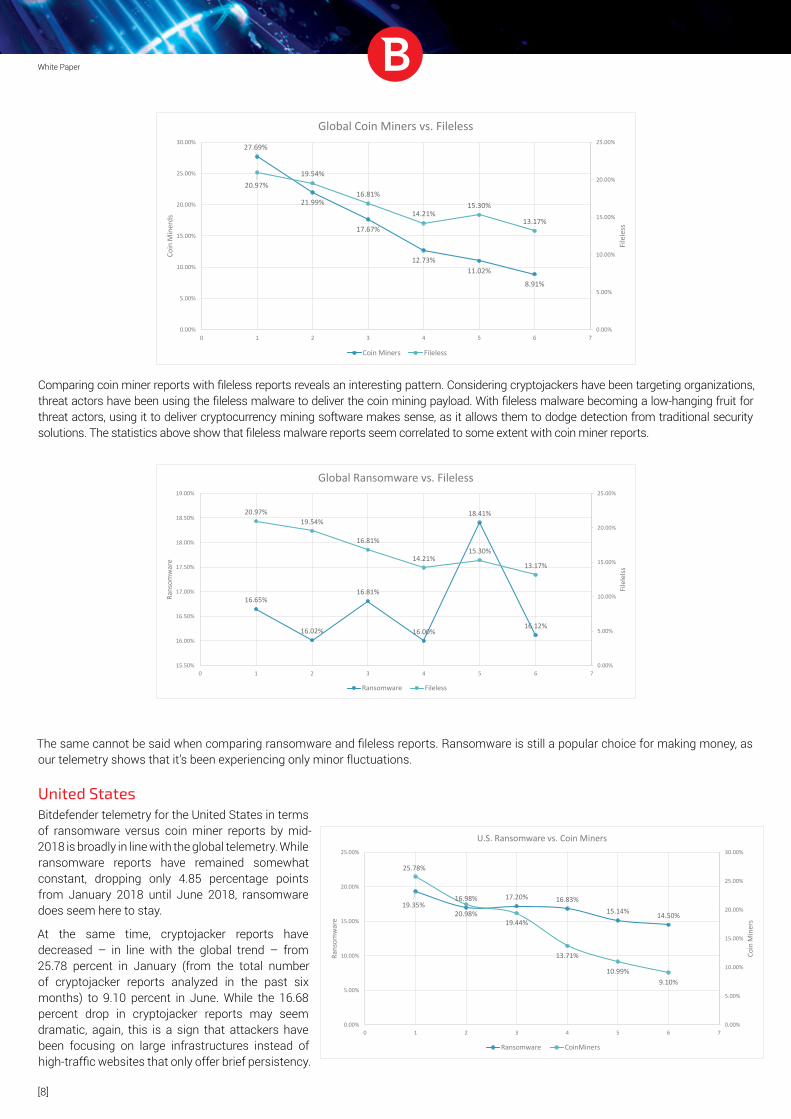
United StatesBitdefender telemetry for the United States in terms of ransomware versus coin miner reports by mid-2018 is broadly in line with the global telemetry. While ransomware reports have remained somewhat constant, dropping only 4.85 percentage points from January 2018 until June 2018, ransomware does seem here to stay.
At the same time, cryptojacker reports have decreased – in line with the global trend – from 25.78 percent in January (from the total number of cryptojacker reports analyzed in the past six months) to 9.10 percent in June. While the 16.68 percent drop in cryptojacker reports may seem dramatic, again, this is a sign that attackers have been focusing on large infrastructures instead of high-traffic websites that only offer brief persistency.
27.69%
21.99%
17.67%
12.73%11.02%
8.91%
20.97%19.54%
16.81%
14.21%15.30%
13.17%
0.00%
5.00%
10.00%
15.00%
20.00%
25.00%
0.00%
5.00%
10.00%
15.00%
20.00%
25.00%
30.00%
0 1 2 3 4 5 6 7
File
less
Coin
Min
erds
Global Coin Miners vs. Fileless
Coin Miners Fileless
16.65%
16.02%
16.81%
16.00%
18.41%
16.12%
20.97%19.54%
16.81%
14.21%15.30%
13.17%
0.00%
5.00%
10.00%
15.00%
20.00%
25.00%
15.50%
16.00%
16.50%
17.00%
17.50%
18.00%
18.50%
19.00%
0 1 2 3 4 5 6 7
File
lelss
Rans
omw
are
Global Ransomware vs. Fileless
Ransomware Fileless
19.35%16.98% 17.20% 16.83%
15.14% 14.50%
25.78%
20.98%19.44%
13.71%
10.99%9.10%
0.00%
5.00%
10.00%
15.00%
20.00%
25.00%
30.00%
0.00%
5.00%
10.00%
15.00%
20.00%
25.00%
0 1 2 3 4 5 6 7
Coin
Min
ers
Rans
omw
are
U.S. Ransomware vs. Coin Miners
Ransomware CoinMiners
[9]
White Paper
Fileless reports in the United States have also been broadly in line with ransomware reports, further supporting the notion that threat actors have been leveraging fileless malware to deliver cryptocurrency mining payloads. The 14.34 percentage-point drop from January to June for fileless malware follows the same descending line seen with coin miners in the previous graph.
Overlapping ransomware and fileless malware reports offers a better understanding of the evolution of these two threats over the first six months of 2018. Both ransomware and fileless malware started in January with almost a fifth of the total number of reports (for each category), but while ransomware only experienced minor fluctuations, fileless malware reports dropped by more than half.
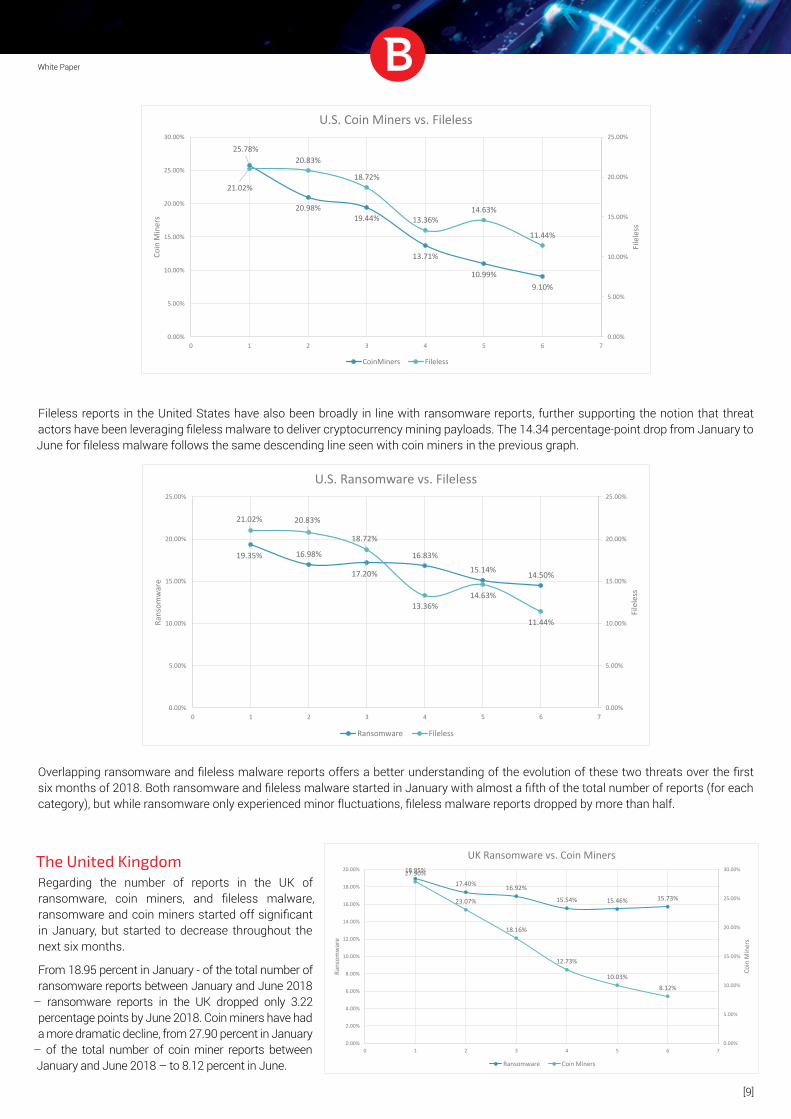
The United KingdomRegarding the number of reports in the UK of ransomware, coin miners, and fileless malware, ransomware and coin miners started off significant in January, but started to decrease throughout the next six months.
From 18.95 percent in January - of the total number of ransomware reports between January and June 2018
– ransomware reports in the UK dropped only 3.22 percentage points by June 2018. Coin miners have had a more dramatic decline, from 27.90 percent in January
– of the total number of coin miner reports between January and June 2018 – to 8.12 percent in June.
25.78%
20.98%19.44%
13.71%
10.99%9.10%
21.02%
20.83%
18.72%
13.36%14.63%
11.44%
0.00%
5.00%
10.00%
15.00%
20.00%
25.00%
0.00%
5.00%
10.00%
15.00%
20.00%
25.00%
30.00%
0 1 2 3 4 5 6 7
File
less
Coin
Min
ers
U.S. Coin Miners vs. Fileless
CoinMiners Fileless
19.35% 16.98%
17.20%
16.83%15.14% 14.50%
21.02% 20.83%
18.72%
13.36%14.63%
11.44%
0.00%
5.00%
10.00%
15.00%
20.00%
25.00%
0.00%
5.00%
10.00%
15.00%
20.00%
25.00%
0 1 2 3 4 5 6 7
File
less
Rans
omw
are
U.S. Ransomware vs. Fileless
Ransomware Fileless
18.95%
17.40% 16.92%
15.54% 15.46% 15.73%
27.90%
23.07%
18.16%
12.73%
10.03%8.12%
0.00%
5.00%
10.00%
15.00%
20.00%
25.00%
30.00%
0.00%
2.00%
4.00%
6.00%
8.00%
10.00%
12.00%
14.00%
16.00%
18.00%
20.00%
0 1 2 3 4 5 6 7
Coin
Min
ers
Rans
omw
are
UK Ransomware vs. Coin Miners
Ransomware Coin Miners
[10]
White Paper
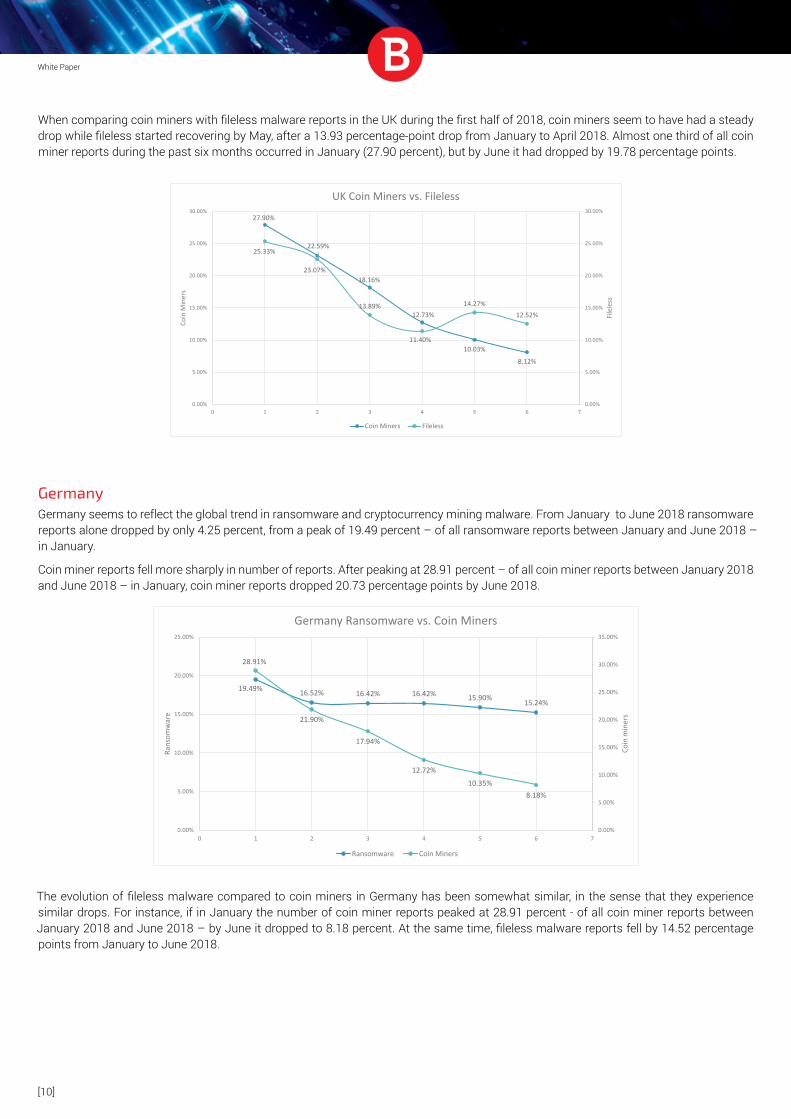
When comparing coin miners with fileless malware reports in the UK during the first half of 2018, coin miners seem to have had a steady drop while fileless started recovering by May, after a 13.93 percentage-point drop from January to April 2018. Almost one third of all coin miner reports during the past six months occurred in January (27.90 percent), but by June it had dropped by 19.78 percentage points.
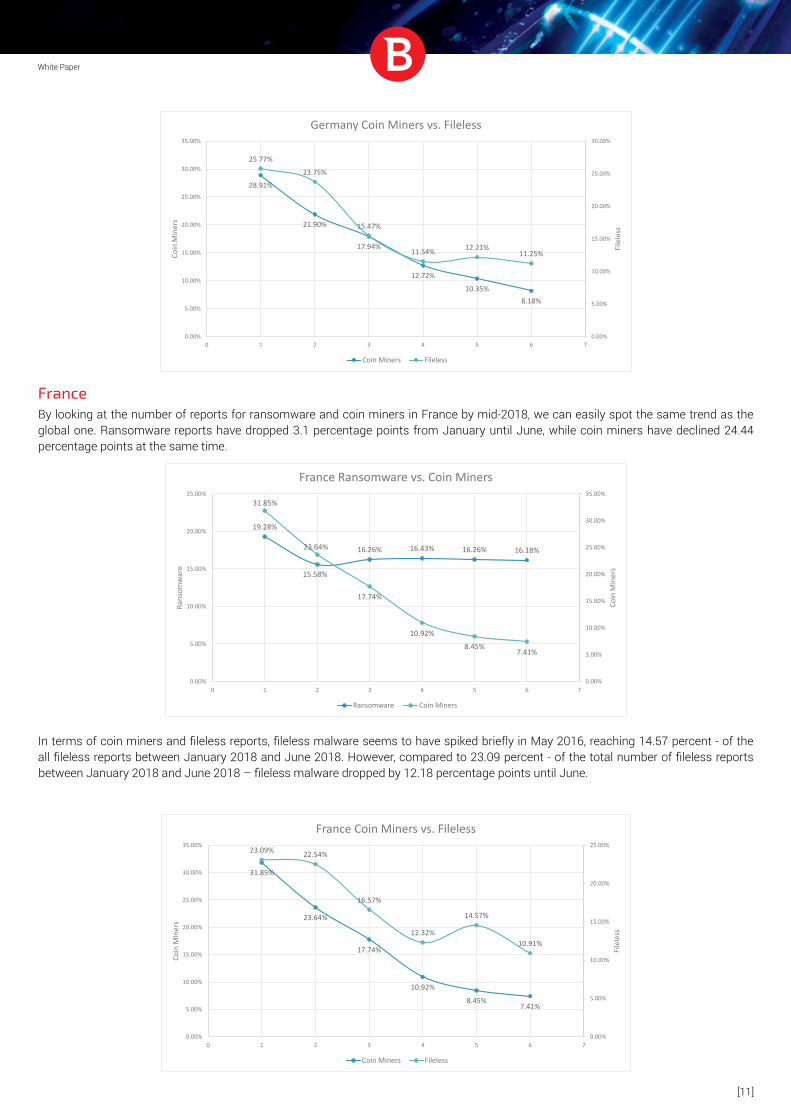
GermanyGermany seems to reflect the global trend in ransomware and cryptocurrency mining malware. From January to June 2018 ransomware reports alone dropped by only 4.25 percent, from a peak of 19.49 percent – of all ransomware reports between January and June 2018 – in January.
Coin miner reports fell more sharply in number of reports. After peaking at 28.91 percent – of all coin miner reports between January 2018 and June 2018 – in January, coin miner reports dropped 20.73 percentage points by June 2018.
The evolution of fileless malware compared to coin miners in Germany has been somewhat similar, in the sense that they experience similar drops. For instance, if in January the number of coin miner reports peaked at 28.91 percent - of all coin miner reports between January 2018 and June 2018 – by June it dropped to 8.18 percent. At the same time, fileless malware reports fell by 14.52 percentage points from January to June 2018.
27.90%
23.07%18.16%
12.73%
10.03%
8.12%
25.33%22.59%
13.89%
11.40%
14.27%12.52%
0.00%
5.00%
10.00%
15.00%
20.00%
25.00%
30.00%
0.00%
5.00%
10.00%
15.00%
20.00%
25.00%
30.00%
0 1 2 3 4 5 6 7
File
less
Coin
Min
ers
UK Coin Miners vs. Fileless
Coin Miners Fileless
19.49% 16.52% 16.42% 16.42% 15.90% 15.24%
28.91%
21.90%
17.94%
12.72%10.35%
8.18%
0.00%
5.00%
10.00%
15.00%
20.00%
25.00%
30.00%
35.00%
0.00%
5.00%
10.00%
15.00%
20.00%
25.00%
0 1 2 3 4 5 6 7
Coin
min
ers
Rans
omw
are
Germany Ransomware vs. Coin Miners
Ransomware Coin Miners
[11]
White Paper
FranceBy looking at the number of reports for ransomware and coin miners in France by mid-2018, we can easily spot the same trend as the global one. Ransomware reports have dropped 3.1 percentage points from January until June, while coin miners have declined 24.44 percentage points at the same time.
In terms of coin miners and fileless reports, fileless malware seems to have spiked briefly in May 2016, reaching 14.57 percent - of the all fileless reports between January 2018 and June 2018. However, compared to 23.09 percent - of the total number of fileless reports between January 2018 and June 2018 – fileless malware dropped by 12.18 percentage points until June.
28.91%
21.90%
17.94%
12.72%
10.35%8.18%
25.77%23.75%
15.47%
11.54% 12.21%11.25%
0.00%
5.00%
10.00%
15.00%
20.00%
25.00%
30.00%
0.00%
5.00%
10.00%
15.00%
20.00%
25.00%
30.00%
35.00%
0 1 2 3 4 5 6 7
File
less
Coin
Min
ers
Germany Coin Miners vs. Fileless
Coin Miners Fileless
19.28%
15.58%
16.26% 16.43% 16.26% 16.18%
31.85%
23.64%
17.74%
10.92%8.45%
7.41%
0.00%
5.00%
10.00%
15.00%
20.00%
25.00%
30.00%
35.00%
0.00%
5.00%
10.00%
15.00%
20.00%
25.00%
0 1 2 3 4 5 6 7
Coin
Min
ers
Rans
omw
are
France Ransomware vs. Coin Miners
Ransomware Coin Miners
31.85%
23.64%
17.74%
10.92%
8.45%7.41%
23.09% 22.54%
16.57%
12.32%
14.57%
10.91%
0.00%
5.00%
10.00%
15.00%
20.00%
25.00%
0.00%
5.00%
10.00%
15.00%
20.00%
25.00%
30.00%
35.00%
0 1 2 3 4 5 6 7
File
less
Coin
MIn
ers
France Coin Miners vs. Fileless
Coin Miners Fileless
[12]
White Paper
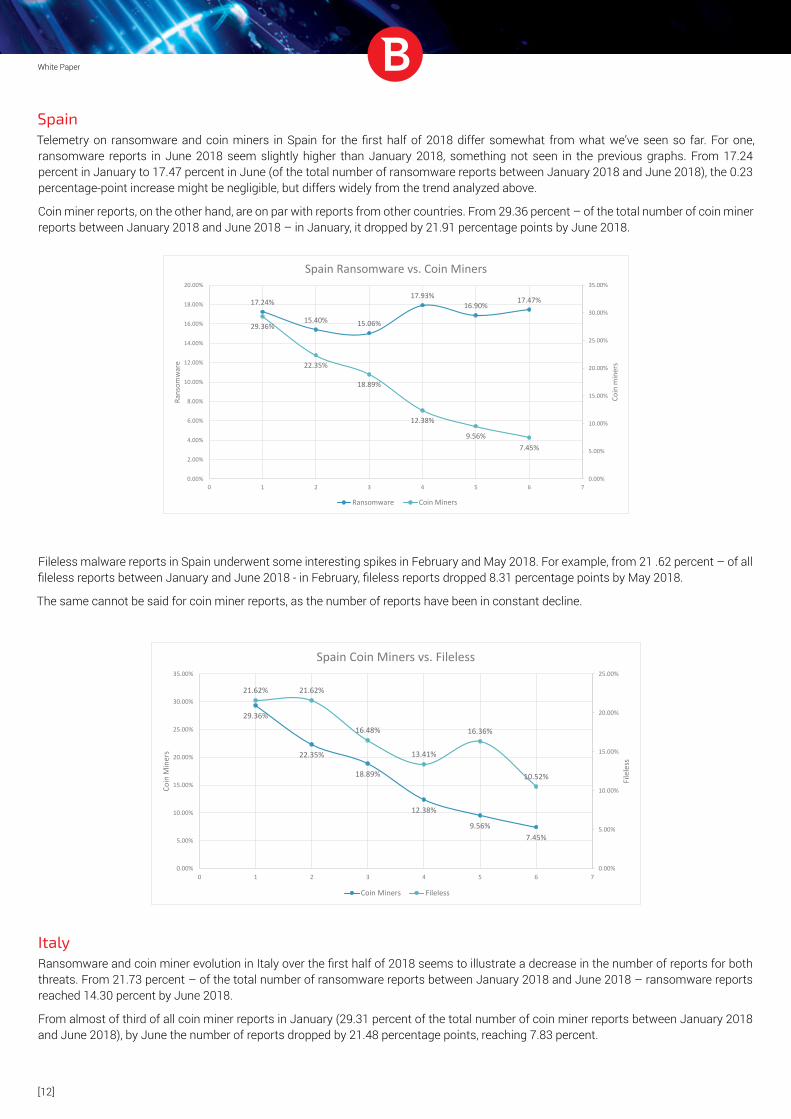
SpainTelemetry on ransomware and coin miners in Spain for the first half of 2018 differ somewhat from what we’ve seen so far. For one, ransomware reports in June 2018 seem slightly higher than January 2018, something not seen in the previous graphs. From 17.24 percent in January to 17.47 percent in June (of the total number of ransomware reports between January 2018 and June 2018), the 0.23 percentage-point increase might be negligible, but differs widely from the trend analyzed above.
Coin miner reports, on the other hand, are on par with reports from other countries. From 29.36 percent – of the total number of coin miner reports between January 2018 and June 2018 – in January, it dropped by 21.91 percentage points by June 2018.
Fileless malware reports in Spain underwent some interesting spikes in February and May 2018. For example, from 21 .62 percent – of all fileless reports between January and June 2018 - in February, fileless reports dropped 8.31 percentage points by May 2018.
The same cannot be said for coin miner reports, as the number of reports have been in constant decline.
ItalyRansomware and coin miner evolution in Italy over the first half of 2018 seems to illustrate a decrease in the number of reports for both threats. From 21.73 percent – of the total number of ransomware reports between January 2018 and June 2018 – ransomware reports reached 14.30 percent by June 2018.
From almost of third of all coin miner reports in January (29.31 percent of the total number of coin miner reports between January 2018 and June 2018), by June the number of reports dropped by 21.48 percentage points, reaching 7.83 percent.
17.24%
15.40% 15.06%
17.93%16.90%
17.47%
29.36%
22.35%
18.89%
12.38%
9.56%7.45%
0.00%
5.00%
10.00%
15.00%
20.00%
25.00%
30.00%
35.00%
0.00%
2.00%
4.00%
6.00%
8.00%
10.00%
12.00%
14.00%
16.00%
18.00%
20.00%
0 1 2 3 4 5 6 7
Coin
min
ers
Rans
omw
are
Spain Ransomware vs. Coin Miners
Ransomware Coin Miners
29.36%
22.35%
18.89%
12.38%
9.56%7.45%
21.62% 21.62%
16.48%
13.41%
16.36%
10.52%
0.00%
5.00%
10.00%
15.00%
20.00%
25.00%
0.00%
5.00%
10.00%
15.00%
20.00%
25.00%
30.00%
35.00%
0 1 2 3 4 5 6 7
File
less
Coin
Min
ers
Spain Coin Miners vs. Fileless
Coin Miners Fileless
[13]
White Paper
The number of fileless malware reports in Italy during the first half of 2018 saw the same drop as coin miner reports. From 21.74 percent – of the total number of fileless malware reports between January 2018 and June 2018 – in January, the number of reports dropped by 11.88 percentage points by June. Worth noting is a small spike in May (15.29 percent).
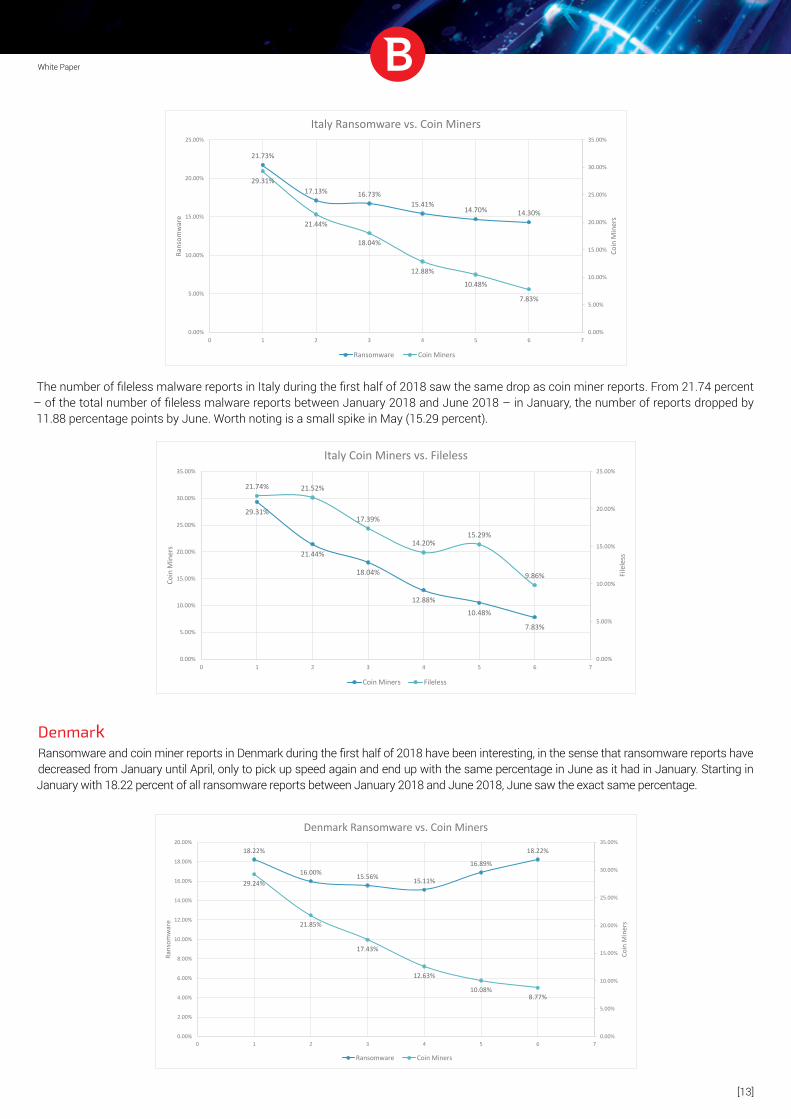
DenmarkRansomware and coin miner reports in Denmark during the first half of 2018 have been interesting, in the sense that ransomware reports have decreased from January until April, only to pick up speed again and end up with the same percentage in June as it had in January. Starting in January with 18.22 percent of all ransomware reports between January 2018 and June 2018, June saw the exact same percentage.
21.73%
17.13% 16.73%15.41%
14.70% 14.30%
29.31%
21.44%
18.04%
12.88%
10.48%
7.83%
0.00%
5.00%
10.00%
15.00%
20.00%
25.00%
30.00%
35.00%
0.00%
5.00%
10.00%
15.00%
20.00%
25.00%
0 1 2 3 4 5 6 7
Coin
Min
ers
Rans
omw
are
Italy Ransomware vs. Coin Miners
Ransomware Coin Miners
18.22%
16.00% 15.56% 15.11%
16.89%
18.22%
29.24%
21.85%
17.43%
12.63%
10.08%8.77%
0.00%
5.00%
10.00%
15.00%
20.00%
25.00%
30.00%
35.00%
0.00%
2.00%
4.00%
6.00%
8.00%
10.00%
12.00%
14.00%
16.00%
18.00%
20.00%
0 1 2 3 4 5 6 7
Coin
Min
ers
Rans
omw
are
Denmark Ransomware vs. Coin Miners
Ransomware Coin Miners
29.31%
21.44%
18.04%
12.88%10.48%
7.83%
21.74% 21.52%
17.39%
14.20%15.29%
9.86%
0.00%
5.00%
10.00%
15.00%
20.00%
25.00%
0.00%
5.00%
10.00%
15.00%
20.00%
25.00%
30.00%
35.00%
0 1 2 3 4 5 6 7
File
less
Coin
Min
ers
Italy Coin Miners vs. Fileless
Coin Miners Fileless

[14]
White Paper
When compared to coin miner reports, ransomware seems to remain the favorite threat targeting Denmark. Coin miners, on the other hand, dropped by 20.47 percentage points from January from June 2018.
The number of fileless malware reports in Denmark have had an interesting development, as over 35 percent of the total number of fileless malware reported between January and June was reported in January alone (35.93 percent). While those reports dropped by 27.16 percentage points by June, it’s worth noting that April experienced the biggest decline compared to January (27.41 percentage points).
SwedenThe evolution of ransomware and coin miners in Sweden during the first six months of 2018 doesn’t seem to indicate drops as steep as other countries. For example, ransomware reports declined by 5.38 percentage points between January and June 2018, while coin miners 15.06 percent during the same time.
Fileless reports in Sweden are also atypical compared to other countries, as the largest drop seems to have occurred between February and March, with 19.31 percentage points from one month to the next. However, the number of fileless reports seem to have leveled off during the following three months. Interestingly, Sweden is amongst the few countries where fileless malware increased from January to February, peaking at 30.34 percent – of the total number of fileless reports during January and June 2018.
29.24%
21.85%
17.43%
12.63%10.08%
8.77%
35.93%
21.48%
11.85%
8.52%
12.22%10.00%
0.00%
5.00%
10.00%
15.00%
20.00%
25.00%
30.00%
35.00%
40.00%
0.00%
5.00%
10.00%
15.00%
20.00%
25.00%
30.00%
35.00%
0 1 2 3 4 5 6 7
File
less
Coin
Min
ers
Denmark Coin Miners vs. Fileless
Coin Miners Fileless
18.98%
19.26%
16.71%15.86% 15.58%
13.60%
24.69%
20.94%
18.90%
15.14%
10.70%9.63%
0.00%
5.00%
10.00%
15.00%
20.00%
25.00%
30.00%
0.00%
5.00%
10.00%
15.00%
20.00%
25.00%
0 1 2 3 4 5 6 7
Coin
Min
ers
Rans
omw
are
Sweden Ransomware vs. Coin Miners
Ransomware Coin Miners
[15]
White Paper
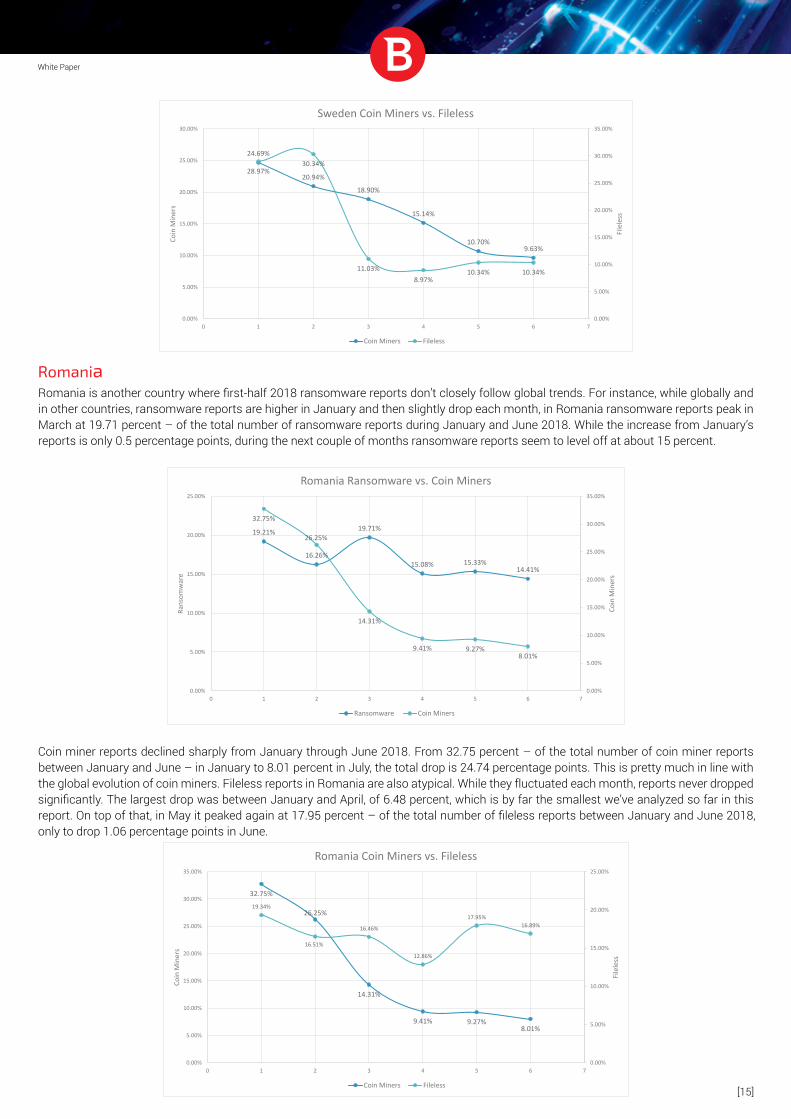
RomaniaRomania is another country where first-half 2018 ransomware reports don’t closely follow global trends. For instance, while globally and in other countries, ransomware reports are higher in January and then slightly drop each month, in Romania ransomware reports peak in March at 19.71 percent – of the total number of ransomware reports during January and June 2018. While the increase from January’s reports is only 0.5 percentage points, during the next couple of months ransomware reports seem to level off at about 15 percent.
Coin miner reports declined sharply from January through June 2018. From 32.75 percent – of the total number of coin miner reports between January and June – in January to 8.01 percent in July, the total drop is 24.74 percentage points. This is pretty much in line with the global evolution of coin miners. Fileless reports in Romania are also atypical. While they fluctuated each month, reports never dropped significantly. The largest drop was between January and April, of 6.48 percent, which is by far the smallest we’ve analyzed so far in this report. On top of that, in May it peaked again at 17.95 percent – of the total number of fileless reports between January and June 2018, only to drop 1.06 percentage points in June.
19.21%
16.26%
19.71%
15.08% 15.33%14.41%
32.75%
26.25%
14.31%
9.41% 9.27%8.01%
0.00%
5.00%
10.00%
15.00%
20.00%
25.00%
30.00%
35.00%
0.00%
5.00%
10.00%
15.00%
20.00%
25.00%
0 1 2 3 4 5 6 7
Coin
Min
ers
Rans
omw
are
Romania Ransomware vs. Coin Miners
Ransomware Coin Miners
24.69%
20.94%
18.90%
15.14%
10.70%9.63%
28.97%30.34%
11.03%8.97%
10.34% 10.34%
0.00%
5.00%
10.00%
15.00%
20.00%
25.00%
30.00%
35.00%
0.00%
5.00%
10.00%
15.00%
20.00%
25.00%
30.00%
0 1 2 3 4 5 6 7
File
less
Coin
Min
ers
Sweden Coin Miners vs. Fileless
Coin Miners Fileless
32.75%
26.25%
14.31%
9.41% 9.27%8.01%
19.34%
16.51%
16.46%
12.86%
17.95%16.89%
0.00%
5.00%
10.00%
15.00%
20.00%
25.00%
0.00%
5.00%
10.00%
15.00%
20.00%
25.00%
30.00%
35.00%
0 1 2 3 4 5 6 7
File
less
Coin
Min
ers
Romania Coin Miners vs. Fileless
Coin Miners Fileless
[16]
White Paper
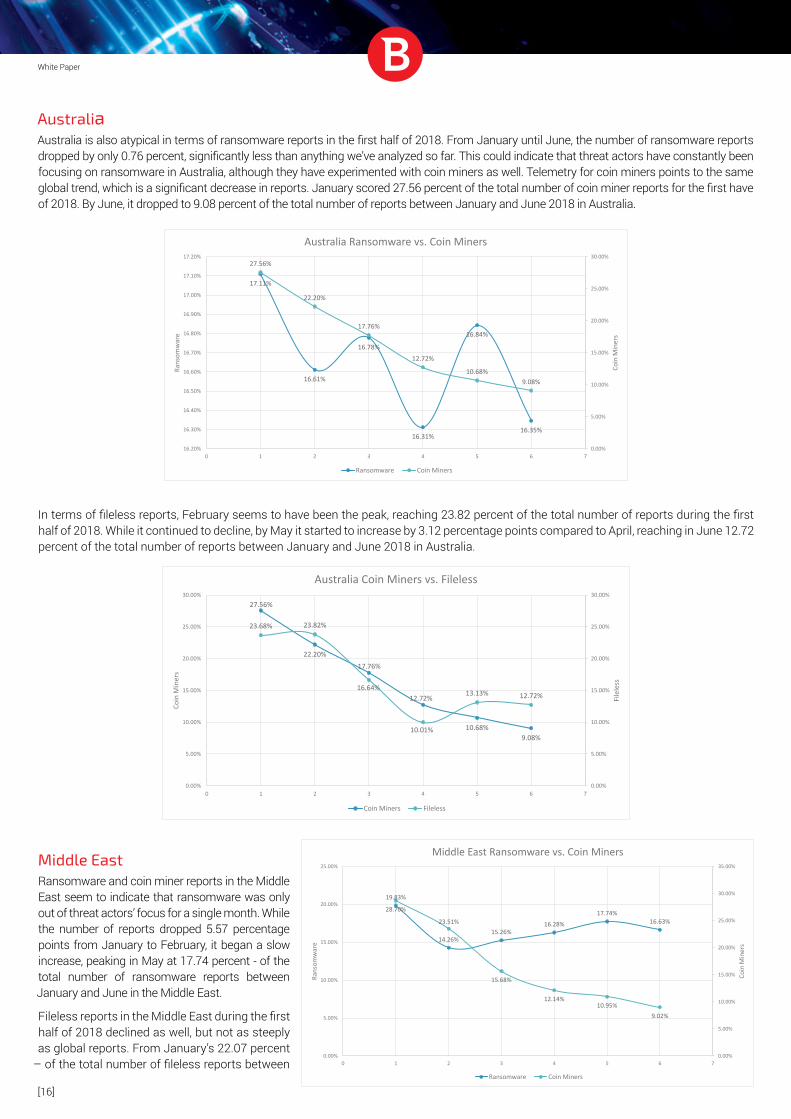
AustraliaAustralia is also atypical in terms of ransomware reports in the first half of 2018. From January until June, the number of ransomware reports dropped by only 0.76 percent, significantly less than anything we’ve analyzed so far. This could indicate that threat actors have constantly been focusing on ransomware in Australia, although they have experimented with coin miners as well. Telemetry for coin miners points to the same global trend, which is a significant decrease in reports. January scored 27.56 percent of the total number of coin miner reports for the first have of 2018. By June, it dropped to 9.08 percent of the total number of reports between January and June 2018 in Australia.
In terms of fileless reports, February seems to have been the peak, reaching 23.82 percent of the total number of reports during the first half of 2018. While it continued to decline, by May it started to increase by 3.12 percentage points compared to April, reaching in June 12.72 percent of the total number of reports between January and June 2018 in Australia.
Middle EastRansomware and coin miner reports in the Middle East seem to indicate that ransomware was only out of threat actors’ focus for a single month. While the number of reports dropped 5.57 percentage points from January to February, it began a slow increase, peaking in May at 17.74 percent - of the total number of ransomware reports between January and June in the Middle East.
Fileless reports in the Middle East during the first half of 2018 declined as well, but not as steeply as global reports. From January’s 22.07 percent
– of the total number of fileless reports between
17.11%
16.61%
16.78%
16.31%
16.84%
16.35%
27.56%
22.20%
17.76%
12.72%
10.68%9.08%
0.00%
5.00%
10.00%
15.00%
20.00%
25.00%
30.00%
16.20%
16.30%
16.40%
16.50%
16.60%
16.70%
16.80%
16.90%
17.00%
17.10%
17.20%
0 1 2 3 4 5 6 7
Coin
Min
ers
Rans
omw
are
Australia Ransomware vs. Coin Miners
Ransomware Coin Miners
27.56%
22.20%17.76%
12.72%
10.68%9.08%
23.68% 23.82%
16.64%
10.01%
13.13% 12.72%
0.00%
5.00%
10.00%
15.00%
20.00%
25.00%
30.00%
0.00%
5.00%
10.00%
15.00%
20.00%
25.00%
30.00%
0 1 2 3 4 5 6 7
File
less
Coin
Min
ers
Australia Coin Miners vs. Fileless
Coin Miners Fileless
19.83%
14.26%15.26%
16.28%17.74%
16.63%
28.70%
23.51%
15.68%
12.14%10.95%
9.02%
0.00%
5.00%
10.00%
15.00%
20.00%
25.00%
30.00%
35.00%
0.00%
5.00%
10.00%
15.00%
20.00%
25.00%
0 1 2 3 4 5 6 7
Coin
Min
ers
Rans
omw
are
Middle East Ransomware vs. Coin Miners
Ransomware Coin Miners
[17]
White Paper
January and June 2018 in the Middle East – fileless reports dropped 7.86 percentage points by April. While reports did increase in May, they dropped to 12.89 percent – of the total number of fileless reports between January and June 2018 in the Middle East – by June.
Android Threat Landscape at a GlanceThe Android threat landscape by mid-2018 feature everything from ransomware to fake apps, SMS-sending malware, hidden ads, and downloaders that pose as legitimate apps to trick victims into installing them.
While most of the Android malware families remained the same, we’ve also identified some advanced Android threats that are indicative of highly skilled entities targeting specific regions or Android devices.
A recent Bitdefender investigation into a new and highly potent Android spyware framework indicates that only a small number of Israeli users may have been targeted by the malware. While the framework does seem to still be in development, as only one sample is available and it hasn’t been obfuscated, it was submitted from Russia.
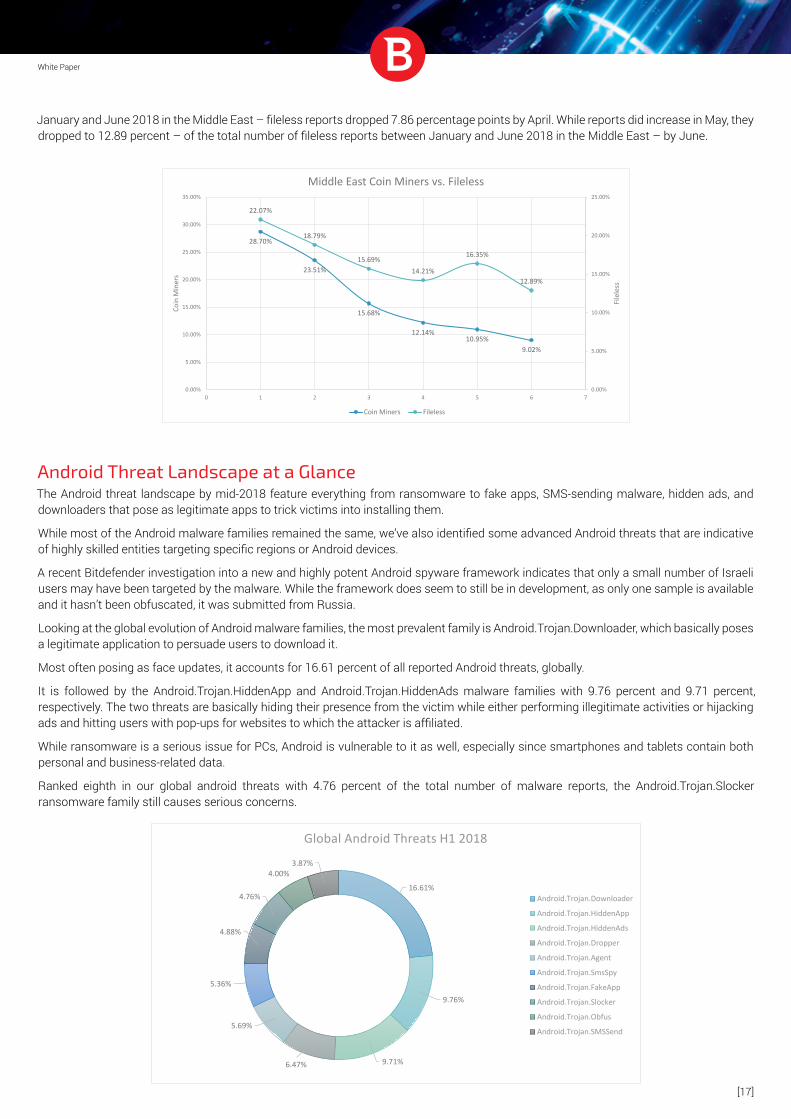
Looking at the global evolution of Android malware families, the most prevalent family is Android.Trojan.Downloader, which basically poses a legitimate application to persuade users to download it.
Most often posing as face updates, it accounts for 16.61 percent of all reported Android threats, globally.
It is followed by the Android.Trojan.HiddenApp and Android.Trojan.HiddenAds malware families with 9.76 percent and 9.71 percent, respectively. The two threats are basically hiding their presence from the victim while either performing illegitimate activities or hijacking ads and hitting users with pop-ups for websites to which the attacker is affiliated.
While ransomware is a serious issue for PCs, Android is vulnerable to it as well, especially since smartphones and tablets contain both personal and business-related data.
Ranked eighth in our global android threats with 4.76 percent of the total number of malware reports, the Android.Trojan.Slocker ransomware family still causes serious concerns.
28.70%
23.51%
15.68%
12.14%10.95%
9.02%
22.07%
18.79%
15.69%14.21%
16.35%
12.89%
0.00%
5.00%
10.00%
15.00%
20.00%
25.00%
0.00%
5.00%
10.00%
15.00%
20.00%
25.00%
30.00%
35.00%
0 1 2 3 4 5 6 7
File
less
Coin
Min
ers
Middle East Coin Miners vs. Fileless
Coin Miners Fileless
16.61%
9.76%
9.71%6.47%
5.69%
5.36%
4.88%
4.76%
4.00%3.87%
Global Android Threats H1 2018
Android.Trojan.Downloader
Android.Trojan.HiddenApp
Android.Trojan.HiddenAds
Android.Trojan.Dropper
Android.Trojan.Agent
Android.Trojan.SmsSpy
Android.Trojan.FakeApp
Android.Trojan.Slocker
Android.Trojan.Obfus
Android.Trojan.SMSSend
[18]
White Paper
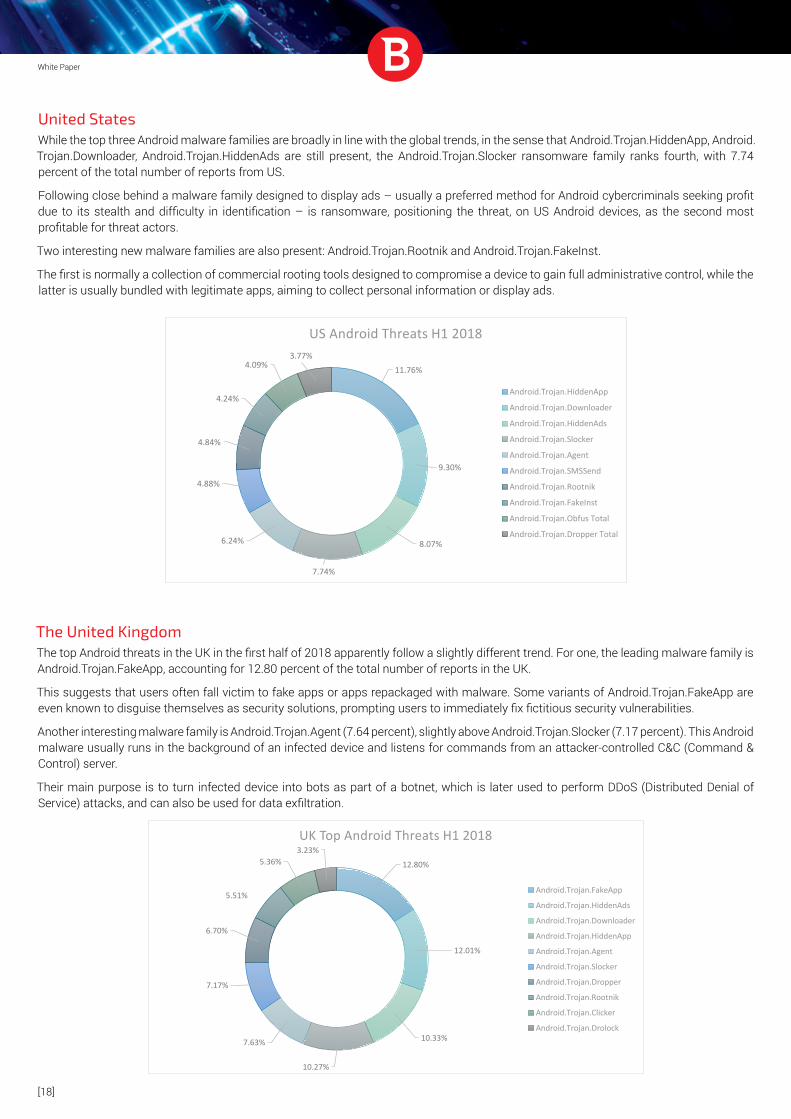
United StatesWhile the top three Android malware families are broadly in line with the global trends, in the sense that Android.Trojan.HiddenApp, Android.Trojan.Downloader, Android.Trojan.HiddenAds are still present, the Android.Trojan.Slocker ransomware family ranks fourth, with 7.74 percent of the total number of reports from US.
Following close behind a malware family designed to display ads – usually a preferred method for Android cybercriminals seeking profit due to its stealth and difficulty in identification – is ransomware, positioning the threat, on US Android devices, as the second most profitable for threat actors.
Two interesting new malware families are also present: Android.Trojan.Rootnik and Android.Trojan.FakeInst.
The first is normally a collection of commercial rooting tools designed to compromise a device to gain full administrative control, while the latter is usually bundled with legitimate apps, aiming to collect personal information or display ads.
The United KingdomThe top Android threats in the UK in the first half of 2018 apparently follow a slightly different trend. For one, the leading malware family is Android.Trojan.FakeApp, accounting for 12.80 percent of the total number of reports in the UK.
This suggests that users often fall victim to fake apps or apps repackaged with malware. Some variants of Android.Trojan.FakeApp are even known to disguise themselves as security solutions, prompting users to immediately fix fictitious security vulnerabilities.
Another interesting malware family is Android.Trojan.Agent (7.64 percent), slightly above Android.Trojan.Slocker (7.17 percent). This Android malware usually runs in the background of an infected device and listens for commands from an attacker-controlled C&C (Command & Control) server.
Their main purpose is to turn infected device into bots as part of a botnet, which is later used to perform DDoS (Distributed Denial of Service) attacks, and can also be used for data exfiltration.
11.76%
9.30%
8.07%
7.74%
6.24%
4.88%
4.84%
4.24%
4.09%3.77%
US Android Threats H1 2018
Android.Trojan.HiddenApp
Android.Trojan.Downloader
Android.Trojan.HiddenAds
Android.Trojan.Slocker
Android.Trojan.Agent
Android.Trojan.SMSSend
Android.Trojan.Rootnik
Android.Trojan.FakeInst
Android.Trojan.Obfus Total
Android.Trojan.Dropper Total
12.80%
12.01%
10.33%
10.27%
7.63%
7.17%
6.70%
5.51%
5.36%3.23%UK Top Android Threats H1 2018
Android.Trojan.FakeApp
Android.Trojan.HiddenAds
Android.Trojan.Downloader
Android.Trojan.HiddenApp
Android.Trojan.Agent
Android.Trojan.Slocker
Android.Trojan.Dropper
Android.Trojan.Rootnik
Android.Trojan.Clicker
Android.Trojan.Drolock
[19]
White Paper
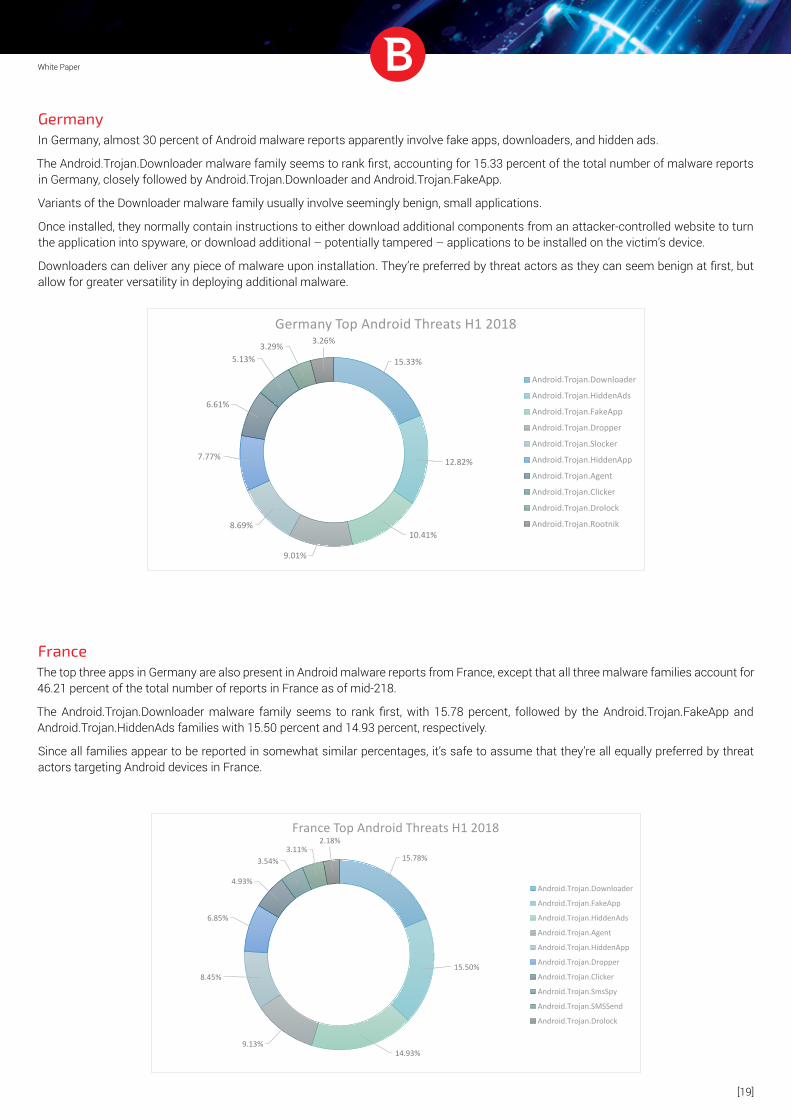
GermanyIn Germany, almost 30 percent of Android malware reports apparently involve fake apps, downloaders, and hidden ads.
The Android.Trojan.Downloader malware family seems to rank first, accounting for 15.33 percent of the total number of malware reports in Germany, closely followed by Android.Trojan.Downloader and Android.Trojan.FakeApp.
Variants of the Downloader malware family usually involve seemingly benign, small applications.
Once installed, they normally contain instructions to either download additional components from an attacker-controlled website to turn the application into spyware, or download additional – potentially tampered – applications to be installed on the victim’s device.
Downloaders can deliver any piece of malware upon installation. They’re preferred by threat actors as they can seem benign at first, but allow for greater versatility in deploying additional malware.
FranceThe top three apps in Germany are also present in Android malware reports from France, except that all three malware families account for 46.21 percent of the total number of reports in France as of mid-218.
The Android.Trojan.Downloader malware family seems to rank first, with 15.78 percent, followed by the Android.Trojan.FakeApp and Android.Trojan.HiddenAds families with 15.50 percent and 14.93 percent, respectively.
Since all families appear to be reported in somewhat similar percentages, it’s safe to assume that they’re all equally preferred by threat actors targeting Android devices in France.
15.33%
12.82%
10.41%
9.01%
8.69%
7.77%
6.61%
5.13%3.29% 3.26%
Germany Top Android Threats H1 2018
Android.Trojan.Downloader
Android.Trojan.HiddenAds
Android.Trojan.FakeApp
Android.Trojan.Dropper
Android.Trojan.Slocker
Android.Trojan.HiddenApp
Android.Trojan.Agent
Android.Trojan.Clicker
Android.Trojan.Drolock
Android.Trojan.Rootnik
15.78%
15.50%
14.93%9.13%
8.45%
6.85%
4.93%
3.54%3.11%
2.18%France Top Android Threats H1 2018
Android.Trojan.Downloader
Android.Trojan.FakeApp
Android.Trojan.HiddenAds
Android.Trojan.Agent
Android.Trojan.HiddenApp
Android.Trojan.Dropper
Android.Trojan.Clicker
Android.Trojan.SmsSpy
Android.Trojan.SMSSend
Android.Trojan.Drolock
[20]
White Paper
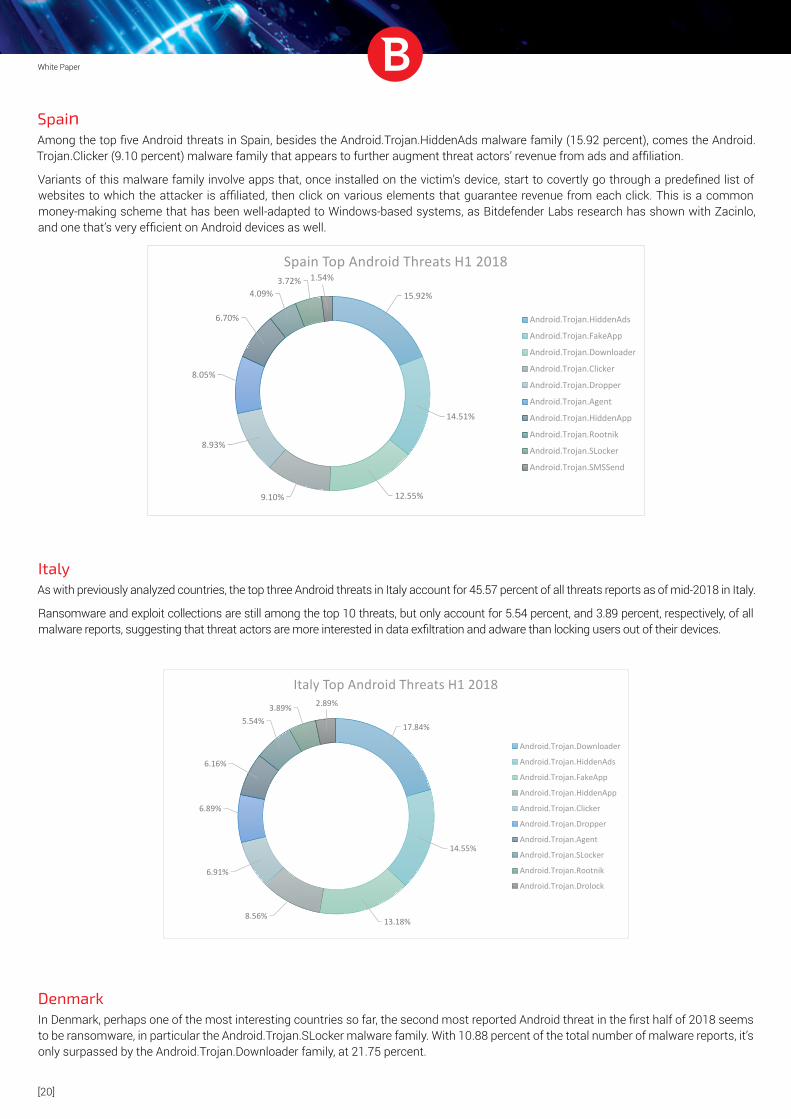
SpainAmong the top five Android threats in Spain, besides the Android.Trojan.HiddenAds malware family (15.92 percent), comes the Android.Trojan.Clicker (9.10 percent) malware family that appears to further augment threat actors’ revenue from ads and affiliation.
Variants of this malware family involve apps that, once installed on the victim’s device, start to covertly go through a predefined list of websites to which the attacker is affiliated, then click on various elements that guarantee revenue from each click. This is a common money-making scheme that has been well-adapted to Windows-based systems, as Bitdefender Labs research has shown with Zacinlo, and one that’s very efficient on Android devices as well.
ItalyAs with previously analyzed countries, the top three Android threats in Italy account for 45.57 percent of all threats reports as of mid-2018 in Italy.
Ransomware and exploit collections are still among the top 10 threats, but only account for 5.54 percent, and 3.89 percent, respectively, of all malware reports, suggesting that threat actors are more interested in data exfiltration and adware than locking users out of their devices.
DenmarkIn Denmark, perhaps one of the most interesting countries so far, the second most reported Android threat in the first half of 2018 seems to be ransomware, in particular the Android.Trojan.SLocker malware family. With 10.88 percent of the total number of malware reports, it’s only surpassed by the Android.Trojan.Downloader family, at 21.75 percent.
15.92%
14.51%
12.55%9.10%
8.93%
8.05%
6.70%
4.09%3.72% 1.54%Spain Top Android Threats H1 2018
Android.Trojan.HiddenAds
Android.Trojan.FakeApp
Android.Trojan.Downloader
Android.Trojan.Clicker
Android.Trojan.Dropper
Android.Trojan.Agent
Android.Trojan.HiddenApp
Android.Trojan.Rootnik
Android.Trojan.SLocker
Android.Trojan.SMSSend
17.84%
14.55%
13.18%8.56%
6.91%
6.89%
6.16%
5.54%3.89% 2.89%
Italy Top Android Threats H1 2018
Android.Trojan.Downloader
Android.Trojan.HiddenAds
Android.Trojan.FakeApp
Android.Trojan.HiddenApp
Android.Trojan.Clicker
Android.Trojan.Dropper
Android.Trojan.Agent
Android.Trojan.SLocker
Android.Trojan.Rootnik
Android.Trojan.Drolock
[21]
White Paper
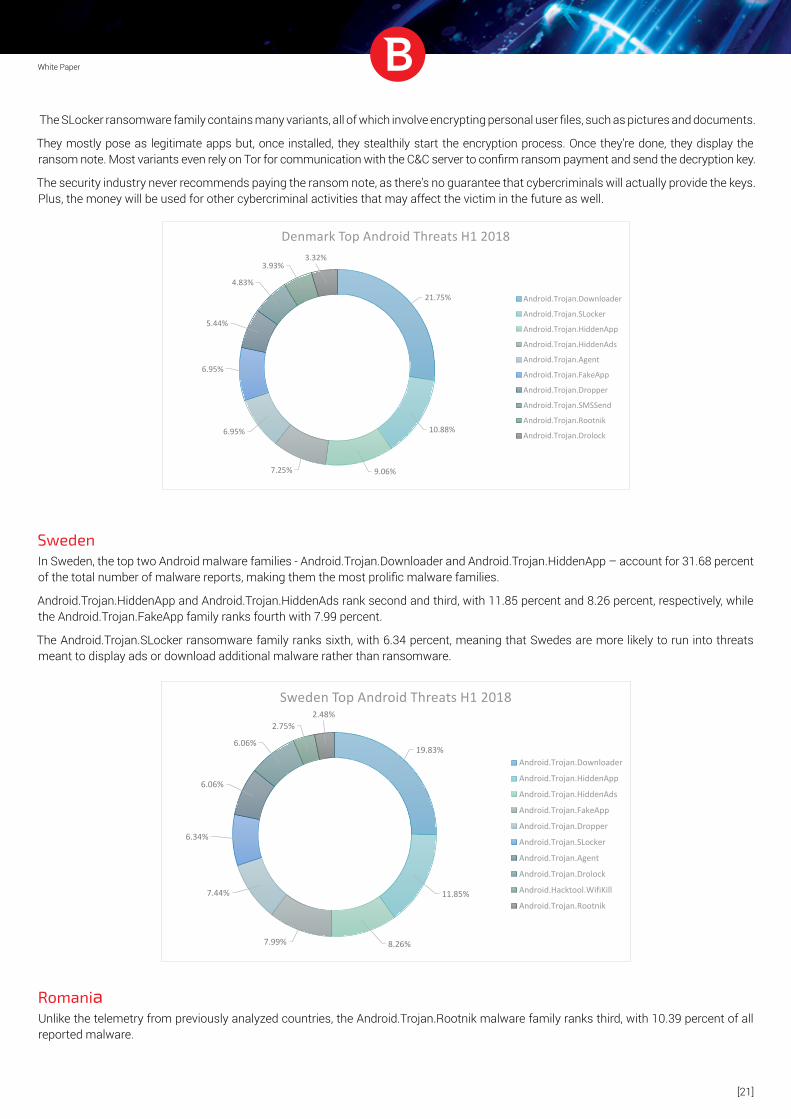
The SLocker ransomware family contains many variants, all of which involve encrypting personal user files, such as pictures and documents.
They mostly pose as legitimate apps but, once installed, they stealthily start the encryption process. Once they’re done, they display the ransom note. Most variants even rely on Tor for communication with the C&C server to confirm ransom payment and send the decryption key.
The security industry never recommends paying the ransom note, as there’s no guarantee that cybercriminals will actually provide the keys. Plus, the money will be used for other cybercriminal activities that may affect the victim in the future as well.
SwedenIn Sweden, the top two Android malware families - Android.Trojan.Downloader and Android.Trojan.HiddenApp – account for 31.68 percent of the total number of malware reports, making them the most prolific malware families.
Android.Trojan.HiddenApp and Android.Trojan.HiddenAds rank second and third, with 11.85 percent and 8.26 percent, respectively, while the Android.Trojan.FakeApp family ranks fourth with 7.99 percent.
The Android.Trojan.SLocker ransomware family ranks sixth, with 6.34 percent, meaning that Swedes are more likely to run into threats meant to display ads or download additional malware rather than ransomware.
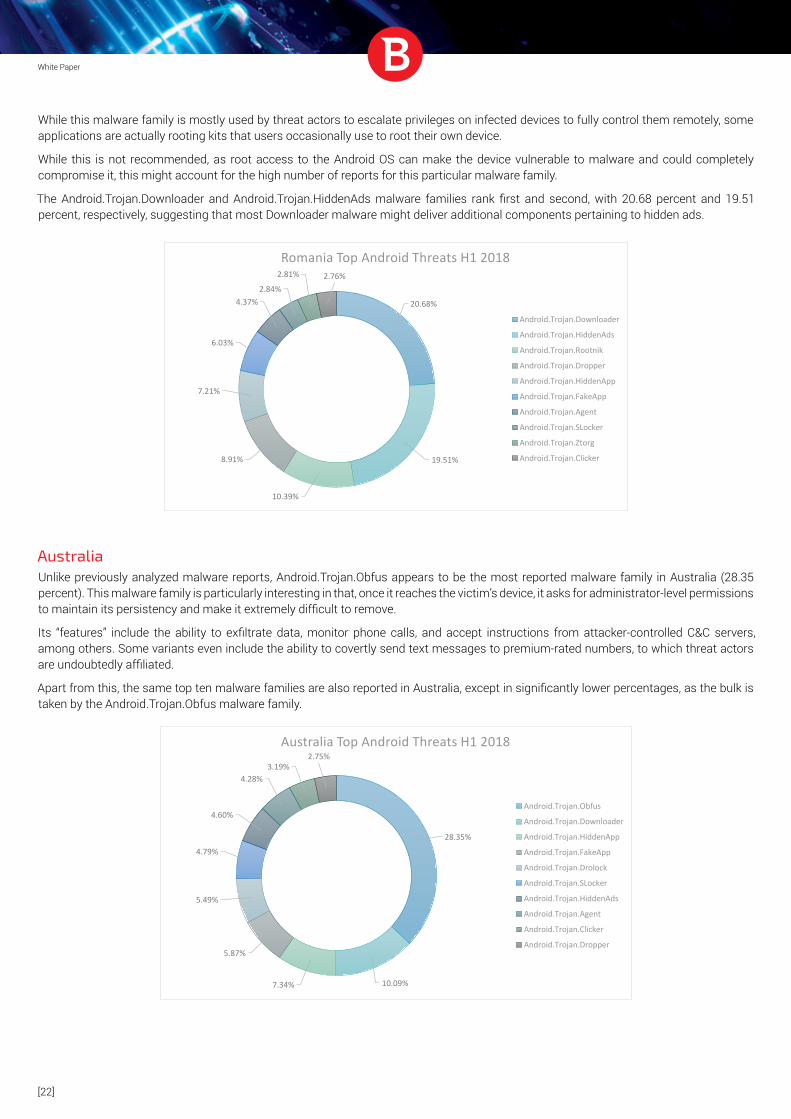
RomaniaUnlike the telemetry from previously analyzed countries, the Android.Trojan.Rootnik malware family ranks third, with 10.39 percent of all reported malware.
21.75%
10.88%
9.06%7.25%
6.95%
6.95%
5.44%
4.83%
3.93%3.32%
Denmark Top Android Threats H1 2018
Android.Trojan.Downloader
Android.Trojan.SLocker
Android.Trojan.HiddenApp
Android.Trojan.HiddenAds
Android.Trojan.Agent
Android.Trojan.FakeApp
Android.Trojan.Dropper
Android.Trojan.SMSSend
Android.Trojan.Rootnik
Android.Trojan.Drolock
19.83%
11.85%
8.26%7.99%
7.44%
6.34%
6.06%
6.06%
2.75%2.48%
Sweden Top Android Threats H1 2018
Android.Trojan.Downloader
Android.Trojan.HiddenApp
Android.Trojan.HiddenAds
Android.Trojan.FakeApp
Android.Trojan.Dropper
Android.Trojan.SLocker
Android.Trojan.Agent
Android.Trojan.Drolock
Android.Hacktool.WifiKill
Android.Trojan.Rootnik
[22]
White Paper
While this malware family is mostly used by threat actors to escalate privileges on infected devices to fully control them remotely, some applications are actually rooting kits that users occasionally use to root their own device.
While this is not recommended, as root access to the Android OS can make the device vulnerable to malware and could completely compromise it, this might account for the high number of reports for this particular malware family.
The Android.Trojan.Downloader and Android.Trojan.HiddenAds malware families rank first and second, with 20.68 percent and 19.51 percent, respectively, suggesting that most Downloader malware might deliver additional components pertaining to hidden ads.
AustraliaUnlike previously analyzed malware reports, Android.Trojan.Obfus appears to be the most reported malware family in Australia (28.35 percent). This malware family is particularly interesting in that, once it reaches the victim’s device, it asks for administrator-level permissions to maintain its persistency and make it extremely difficult to remove.
Its “features” include the ability to exfiltrate data, monitor phone calls, and accept instructions from attacker-controlled C&C servers, among others. Some variants even include the ability to covertly send text messages to premium-rated numbers, to which threat actors are undoubtedly affiliated.
Apart from this, the same top ten malware families are also reported in Australia, except in significantly lower percentages, as the bulk is taken by the Android.Trojan.Obfus malware family.
20.68%
19.51%
10.39%
8.91%
7.21%
6.03%
4.37%2.84%
2.81% 2.76%
Romania Top Android Threats H1 2018
Android.Trojan.Downloader
Android.Trojan.HiddenAds
Android.Trojan.Rootnik
Android.Trojan.Dropper
Android.Trojan.HiddenApp
Android.Trojan.FakeApp
Android.Trojan.Agent
Android.Trojan.SLocker
Android.Trojan.Ztorg
Android.Trojan.Clicker
28.35%
10.09%7.34%
5.87%
5.49%
4.79%
4.60%
4.28%3.19%
2.75%Australia Top Android Threats H1 2018
Android.Trojan.Obfus
Android.Trojan.Downloader
Android.Trojan.HiddenApp
Android.Trojan.FakeApp
Android.Trojan.Drolock
Android.Trojan.SLocker
Android.Trojan.HiddenAds
Android.Trojan.Agent
Android.Trojan.Clicker
Android.Trojan.Dropper
[23]
White Paper
TakeawaysAnalysis of the PC threats and trends for the first half of 2018 leads us to conclude that ransomware, fileless malware, and cryptojackers will not disappear this year. While other, less advanced threats might lead the number of reports in terms of potentially affected victims, this report focuses on trending threats and their evolution as of mid-2018.
Since threat actors and malware developers are never limited to just one operating system, especially in generating revenue, the bulk of Android threats appear to be focused on covertness. Either making money by hijacking ads - constantly nagging users with popups – or by encrypting or exfiltrating data from Android devices, the diverse nature of Android threats once again shows why users are strongly encouraged to stick to official marketplaces.
The best advice when dealing with either PC or Android malware is to install a security solution that can accurately identify and protect against these threats, and exercise at least a minimum of caution when browsing online.
Bitdefender is a global security technology company that provides cutting edge end-to-end cyber security solutions and advanced threat protection to more than 500 million users in more than 150 countries. Since 2001, Bitdefender has consistently produced award-winning business and consumer security technology, and is a provider of choice in both hybrid infrastructure security and endpoint protection. Through R&D, alliances and partnerships, Bitdefender is trusted to be ahead and deliver robust security you can rely on. More information is available at
http://www.bitdefender.com.
© 2018 Bitdefender. All rights reserved. All trademarks, trade names, and products referenced herein are property of their respective owners. FOR MORE INFORMATION VISIT: bitdefender.com/business