Embed Size (px)
Citation preview
BIS-345: Data Analysis for Business
Lab 6: Creating Reports with Parameters and Charts
Overview
Using the AdventureWorks database, you have been requested to create two reports. The first report will use report parameters; the second report will be based on a chart.
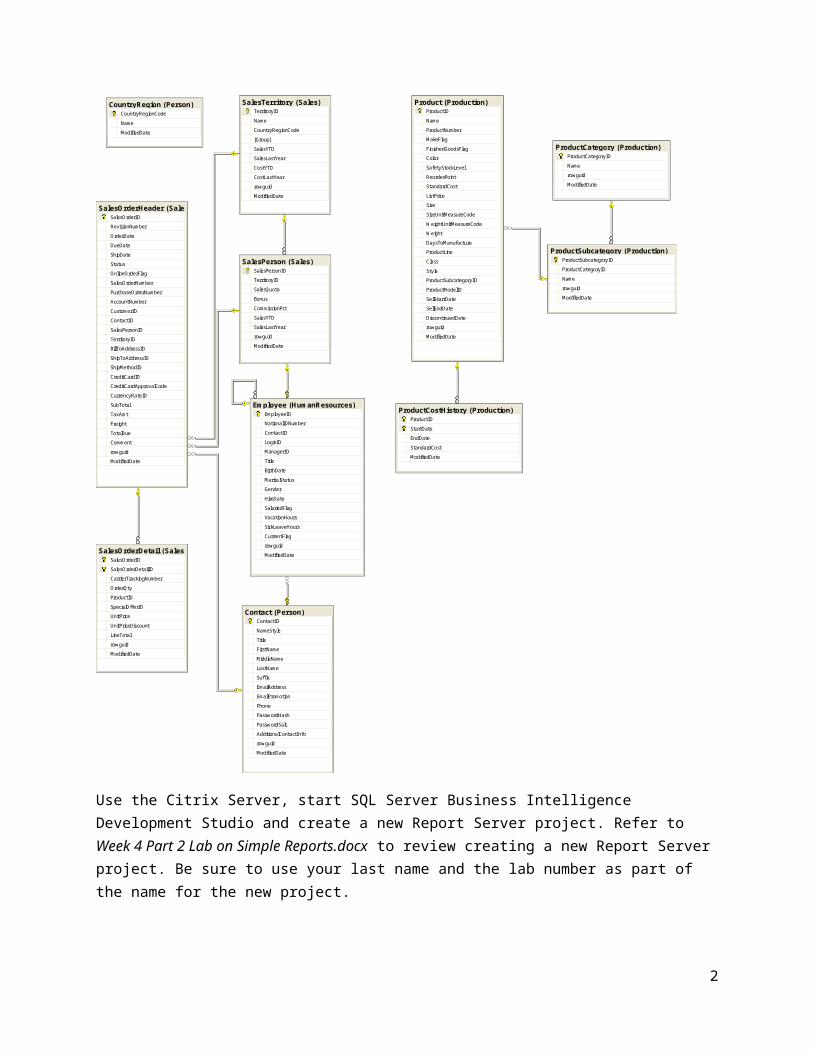
The AdventureWorks database contains many tables; we will be using only some of those tables in this course. Below is an ER diagram showing the tables in the AdventureWorks database that we will be using. NOTE: Not all the relationship lines are drawn between the tables in this diagram. To find relationships between tables, you may have to look for matching field names:
1
Product (Production)ProductIDNameProductNumberMakeFlagFinishedGoodsFlagColorSafetyStockLevelReorderPointStandardCostListPriceSizeSizeUnitMeasureCodeWeightUnitMeasureCodeWeightDaysToManufactureProductLineClassStyleProductSubcategoryIDProductModelIDSellStartDateSellEndDateDiscontinuedDaterowguidModifiedDate
ProductCategory (Production)ProductCategoryIDNamerowguidModifiedDate
ProductSubcategory (Production)ProductSubcategoryIDProductCategoryIDNamerowguidModifiedDate
ProductCostHistory (Production)ProductIDStartDateEndDateStandardCostModifiedDate
SalesOrderHeader (Sales)SalesOrderIDRevisionNumberOrderDateDueDateShipDateStatusOnlineOrderFlagSalesOrderNumberPurchaseOrderNumberAccountNumberCustomerIDContactIDSalesPersonIDTerritoryIDBillToAddressIDShipToAddressIDShipMethodIDCreditCardIDCreditCardApprovalCodeCurrencyRateIDSubTotalTaxAmtFreightTotalDueCommentrowguidModifiedDate
SalesOrderDetail (Sales)SalesOrderIDSalesOrderDetailIDCarrierTrackingNumberOrderQtyProductIDSpecialOfferIDUnitPriceUnitPriceDiscountLineTotalrowguidModifiedDate
SalesPerson (Sales)SalesPersonIDTerritoryIDSalesQuotaBonusCommissionPctSalesYTDSalesLastYearrowguidModifiedDate
SalesTerritory (Sales)TerritoryIDNameCountryRegionCode[Group]SalesYTDSalesLastYearCostYTDCostLastYearrowguidModifiedDate
Contact (Person)ContactIDNameStyleTitleFirstNameMiddleNameLastNameSuffixEmailAddressEmailPromotionPhonePasswordHashPasswordSaltAdditionalContactInforowguidModifiedDate
CountryRegion (Person)CountryRegionCodeNameModifiedDate
Employee (HumanResources)EmployeeIDNationalIDNumberContactIDLoginIDManagerIDTitleBirthDateMaritalStatusGenderHireDateSalariedFlagVacationHoursSickLeaveHoursCurrentFlagrowguidModifiedDate
Use the Citrix Server, start SQL Server Business Intelligence Development Studio and create a new Report Server project. Refer to Week 4 Part 2 Lab on Simple Reports.docx to review creating a new Report Server project. Be sure to use your last name and the lab number as part of the name for the new project.
2
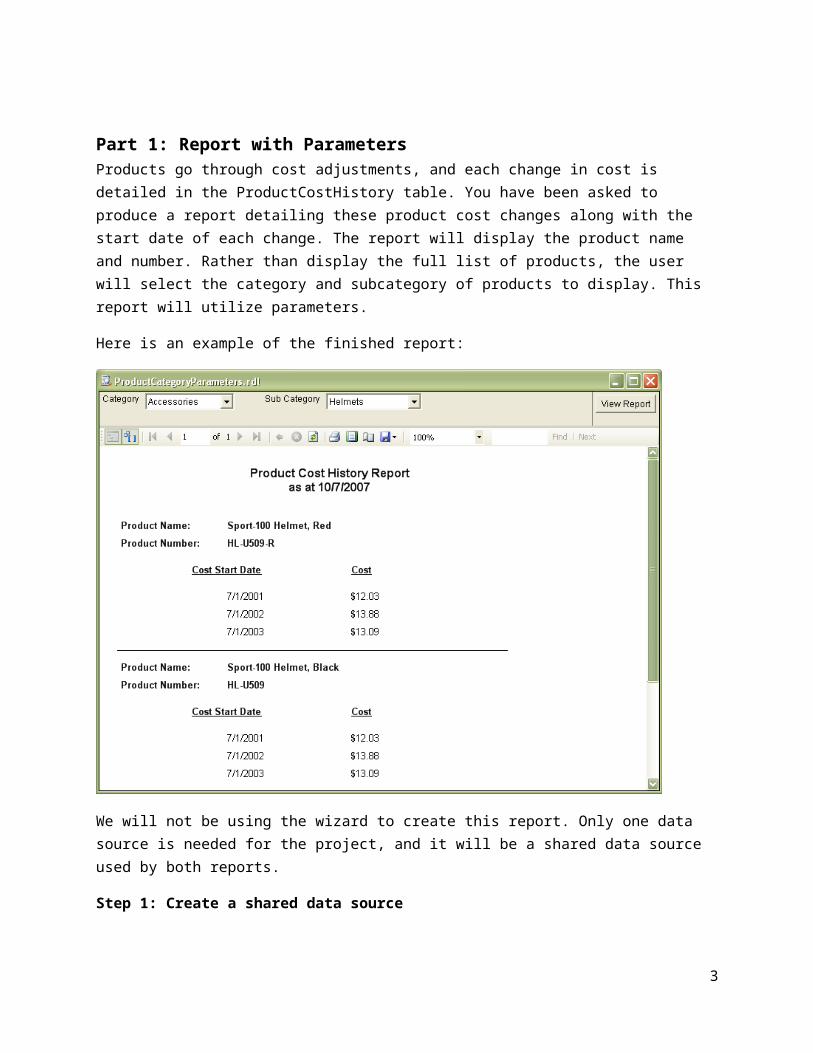
Part 1: Report with ParametersProducts go through cost adjustments, and each change in cost is detailed in the ProductCostHistory table. You have been asked to produce a report detailing these product cost changes along with the start date of each change. The report will display the product name and number. Rather than display the full list of products, the user will select the category and subcategory of products to display. This report will utilize parameters.
Here is an example of the finished report:
We will not be using the wizard to create this report. Only one data source is needed for the project, and it will be a shared data source used by both reports.
Step 1: Create a shared data source
Right-click the Shared Data Source folder in the Solution Explorer and select Add New Data Source. Follow the directions in Part 1: Step 1 detailed in “Week 5 Lab on Reports with Drilldown” if you need to review creating a shared data source. Give your data source the same name as your project.
Step 2: Create a new report
3
Right-click the Reports folder in the Solution Explorer and select Add -> New Item…. Make sure Report is selected; give your new report a name that includes your last name and indicates the lab number and part number. Follow the directions in Part 1: Step 2 detailed in “Week 5 Lab Reports with Drilldown” in the Week 5 iLab tab if you need to review creating a new report.
Step 3: What Datasets do we need?
The report will list product cost details, and it will allow the user to select a particular category and then, from within that category, select a subcategory so that the report only displays the products in that subcategory. To do this, it makes use of both report and SQL parameters. Each report parameter is based on its own dataset, so this report will need three datasets; one to list the categories, one to list the subcategories, and one to list the product details in that subcategory.
The first dataset will contain the category name and category ID.
The second data set will contain the subcategories for a particular category. This dataset will include a parameter based on the category ID. The dataset will be filtered based on the value of this category ID.
The third dataset will contain details from the Product table and the ProductCostHistory table; the product name and number fields are in Product while the start date and standard cost are in ProductCostHistory. This dataset will also use a parameter. Finally, the product rows will be filtered based on a specific subcategory ID.
Step 4: Dataset for Categories
When your new report opens, it should contain the Report Data panel. If it does not, open the Report Data panel using the View menu. Create a new dataset and name it CategoryList. Click on the New button next to datasource and select shared data source:
4
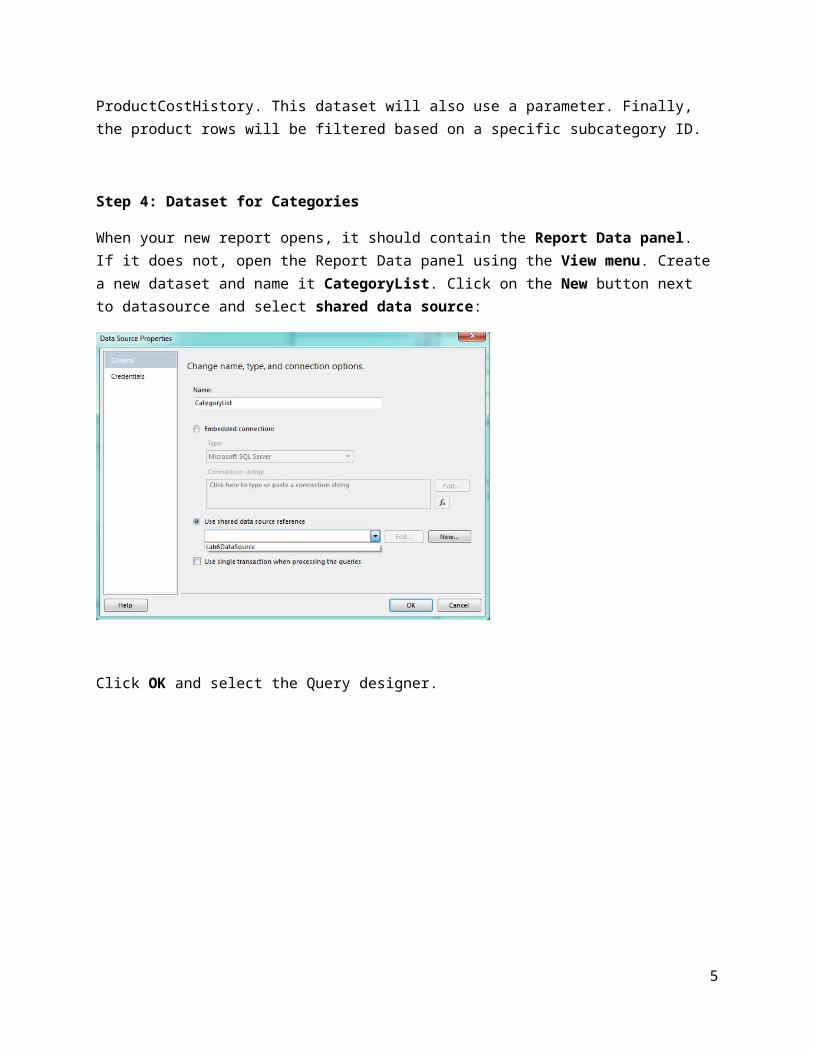
Click OK and select the Query designer.
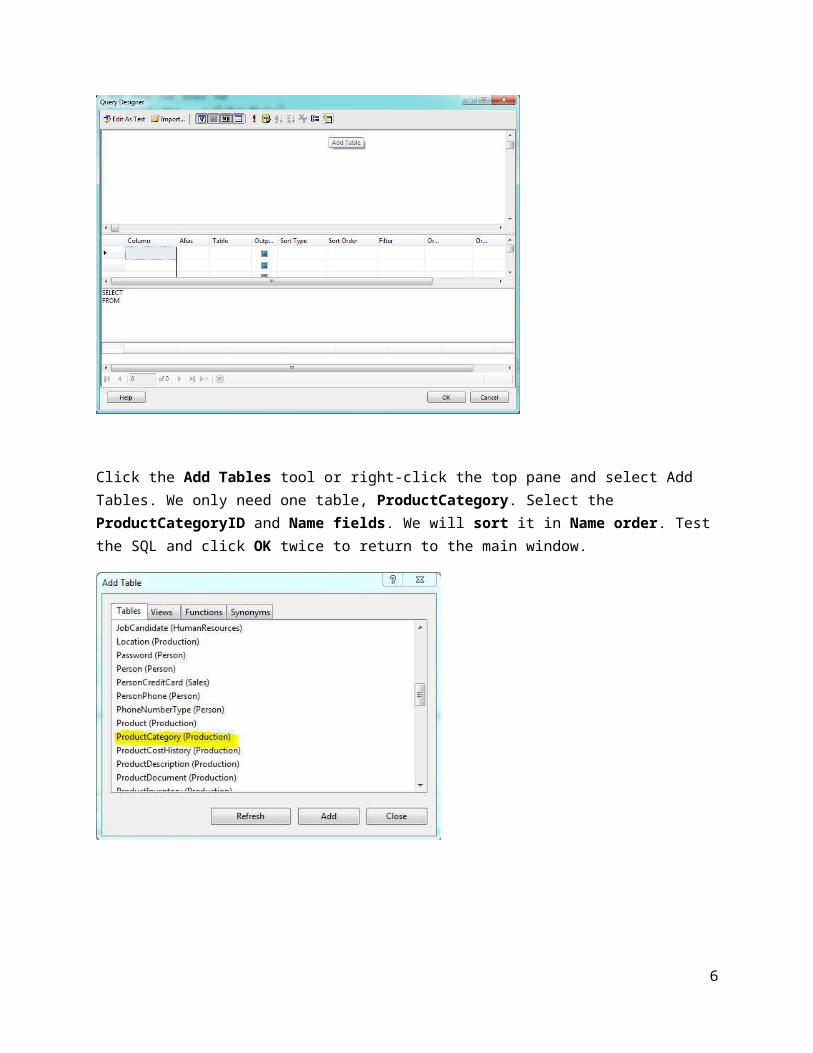
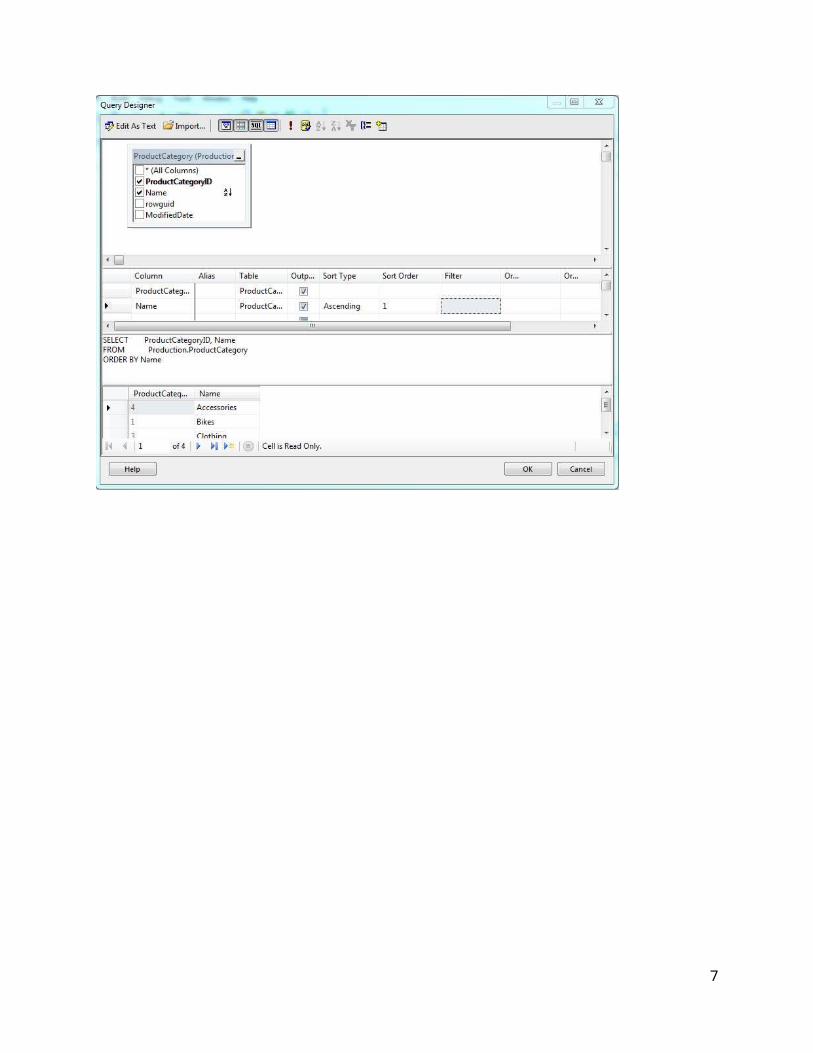
Click the Add Tables tool or right-click the top pane and select Add Tables. We only need one table, ProductCategory. Select the ProductCategoryID and Name fields. We will sort it in Name order. Test the SQL and click OK twice to return to the main window.
5
6
Step 5: Data set for Subcategories
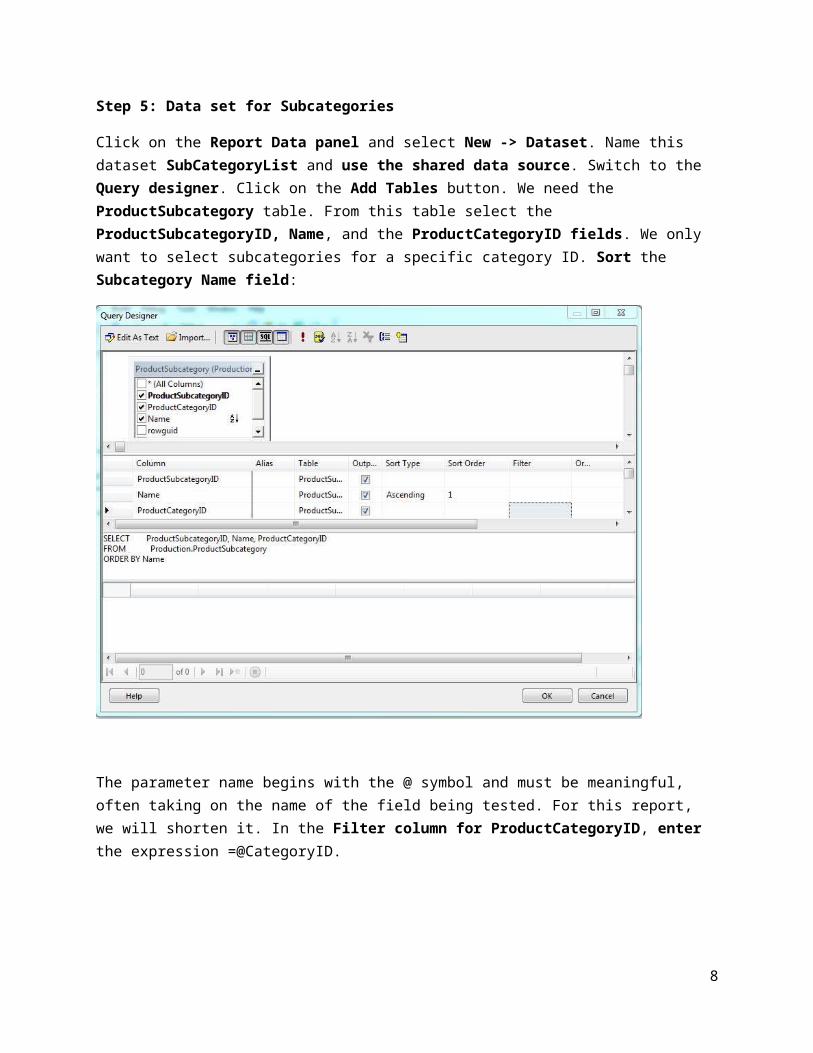
Click on the Report Data panel and select New -> Dataset. Name this dataset SubCategoryList and use the shared data source. Switch to the Query designer. Click on the Add Tables button. We need the ProductSubcategory table. From this table select the ProductSubcategoryID, Name, and the ProductCategoryID fields. We only want to select subcategories for a specific category ID. Sort the Subcategory Name field:
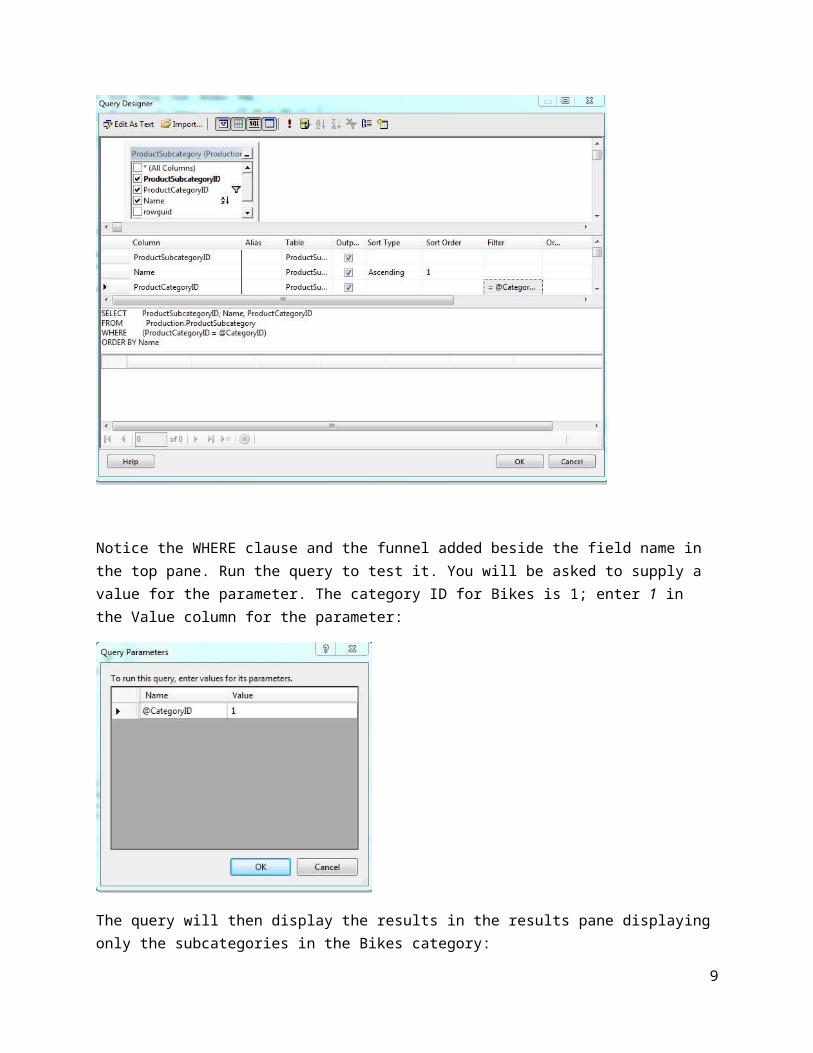
The parameter name begins with the @ symbol and must be meaningful, often taking on the name of the field being tested. For this report, we will shorten it. In the Filter column for ProductCategoryID, enter the expression =@CategoryID.
7
Notice the WHERE clause and the funnel added beside the field name in the top pane. Run the query to test it. You will be asked to supply a value for the parameter. The category ID for Bikes is 1; enter 1 in the Value column for the parameter:
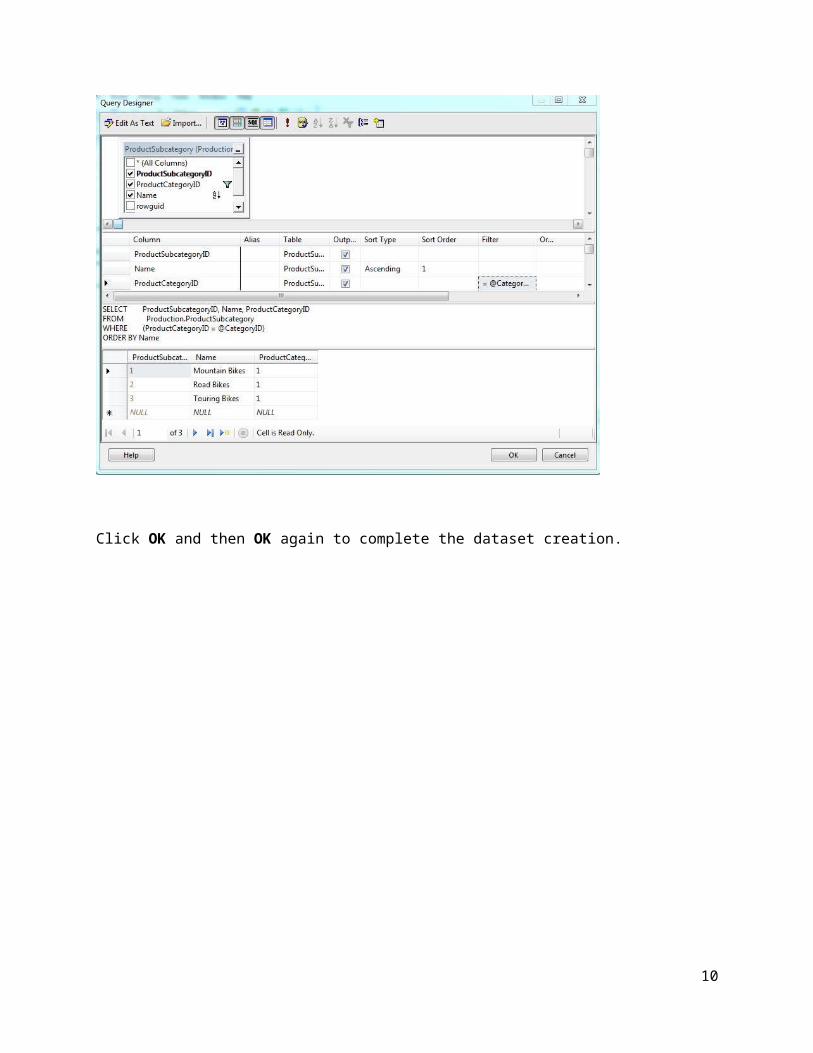
The query will then display the results in the results pane displaying only the subcategories in the Bikes category:
8
Click OK and then OK again to complete the dataset creation.
9
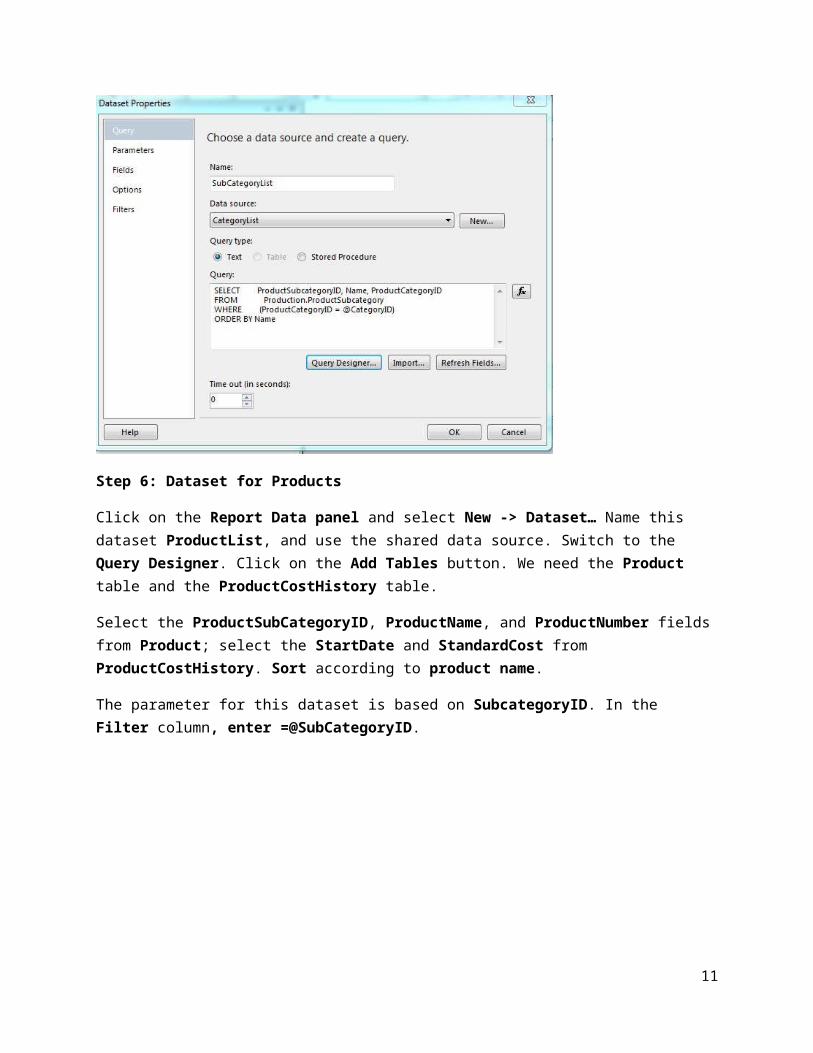
Step 6: Dataset for Products
Click on the Report Data panel and select New -> Dataset… Name this dataset ProductList, and use the shared data source. Switch to the Query Designer. Click on the Add Tables button. We need the Product table and the ProductCostHistory table.
Select the ProductSubCategoryID, ProductName, and ProductNumber fields from Product; select the StartDate and StandardCost from ProductCostHistory. Sort according to product name.
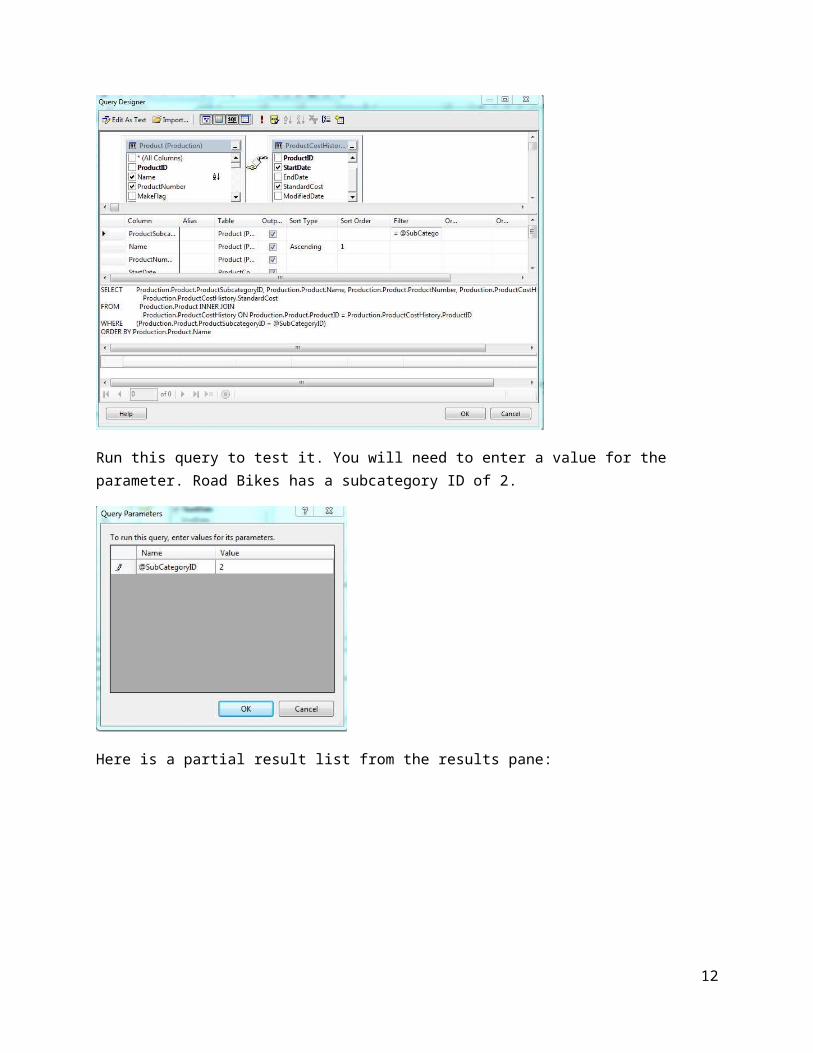
The parameter for this dataset is based on SubcategoryID. In the Filter column, enter =@SubCategoryID.
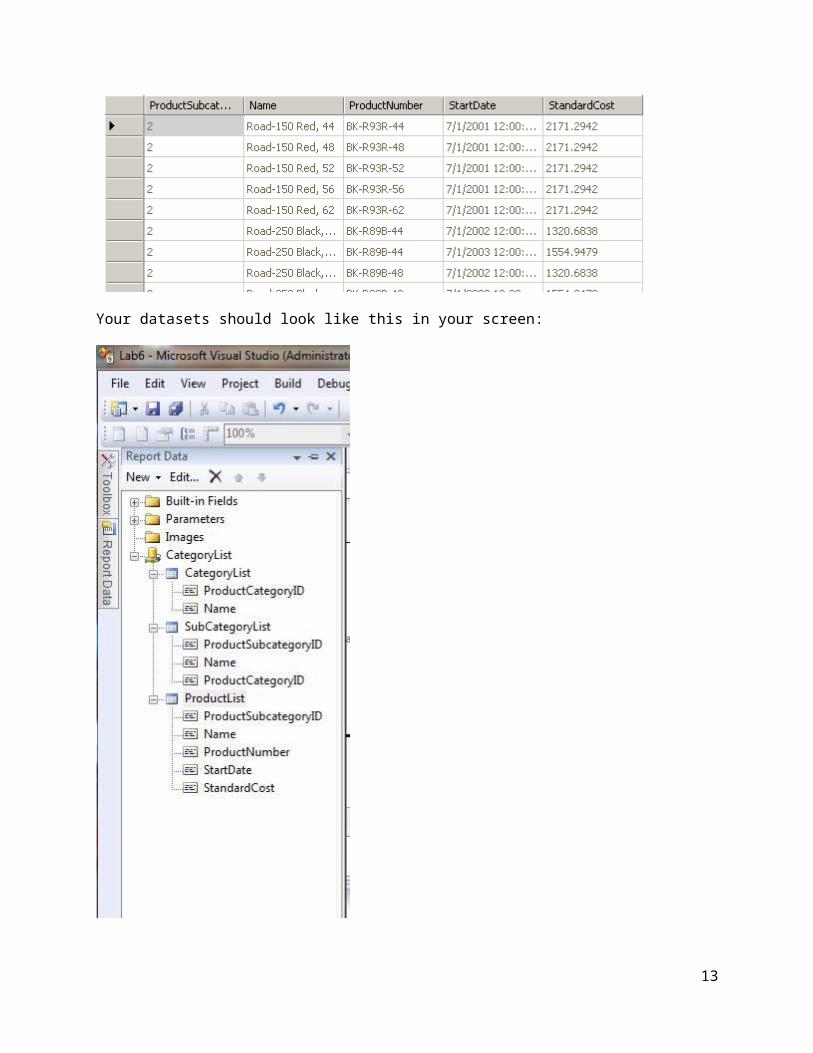
Run this query to test it. You will need to enter a value for the parameter. Road Bikes has a subcategory ID of 2.
10
Here is a partial result list from the results pane:
Your datasets should look like this in your screen:
11
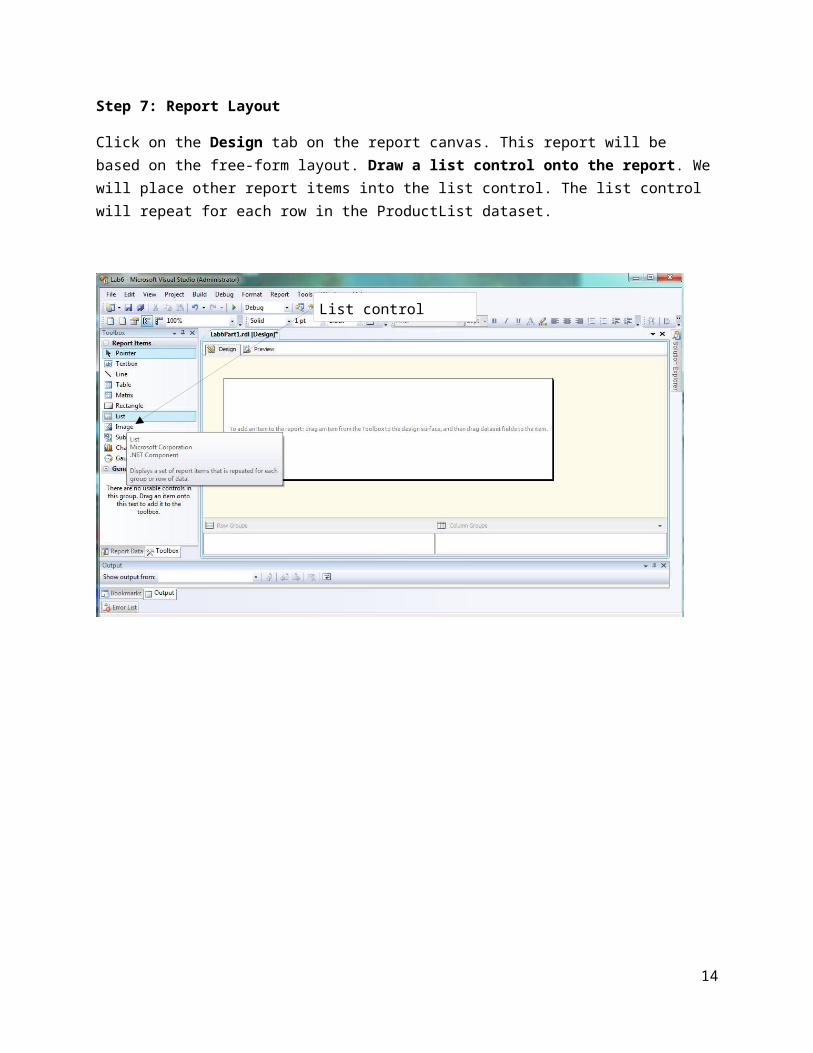
Step 7: Report Layout
Click on the Design tab on the report canvas. This report will be based on the free-form layout. Draw a list control onto the report. We will place other report items into the list control. The list control will repeat for each row in the ProductList dataset.
12
List control
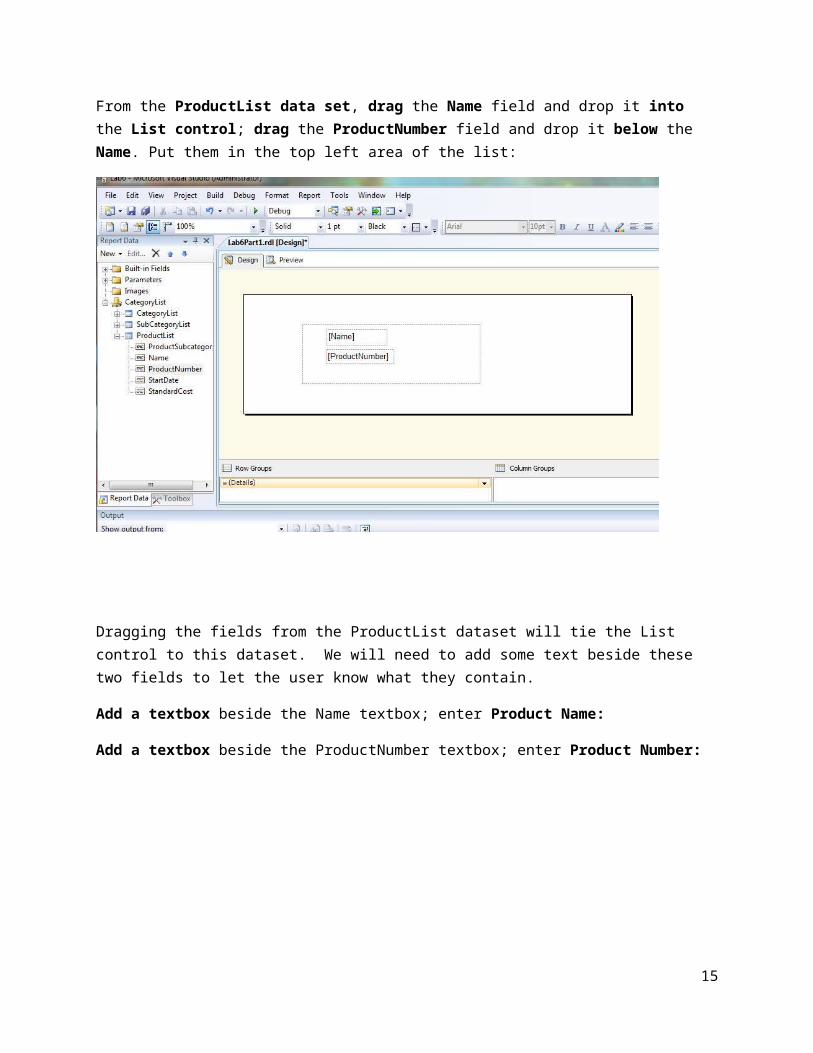
From the ProductList data set, drag the Name field and drop it into the List control; drag the ProductNumber field and drop it below the Name. Put them in the top left area of the list:
Dragging the fields from the ProductList dataset will tie the List control to this dataset. We will need to add some text beside these two fields to let the user know what they contain.
Add a textbox beside the Name textbox; enter Product Name:
Add a textbox beside the ProductNumber textbox; enter Product Number:
13
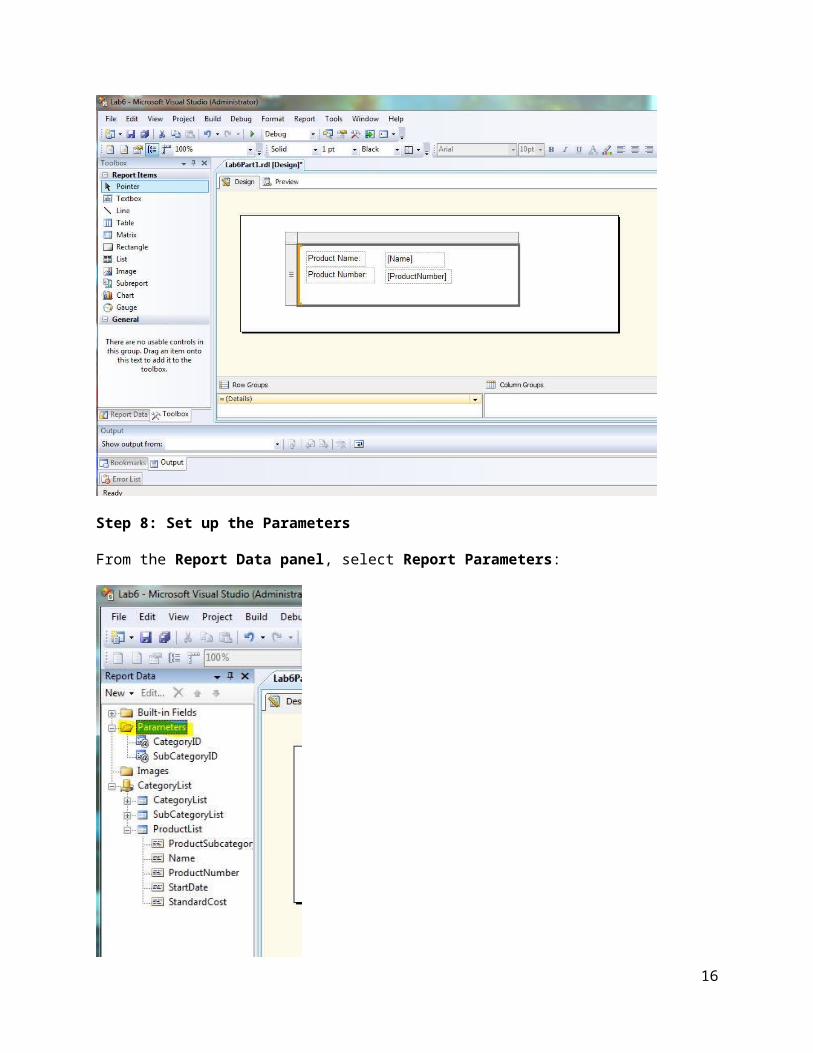
Step 8: Set up the Parameters
From the Report Data panel, select Report Parameters:
14
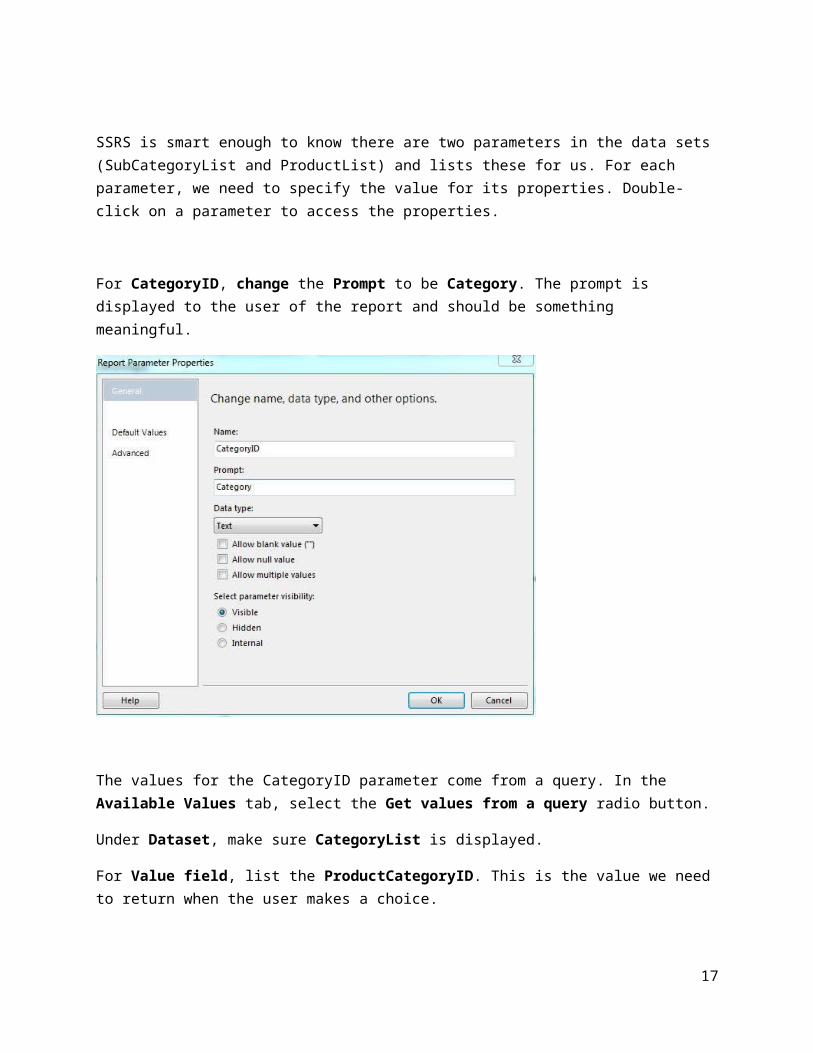
SSRS is smart enough to know there are two parameters in the data sets (SubCategoryList and ProductList) and lists these for us. For each parameter, we need to specify the value for its properties. Double-click on a parameter to access the properties.
For CategoryID, change the Prompt to be Category. The prompt is displayed to the user of the report and should be something meaningful.
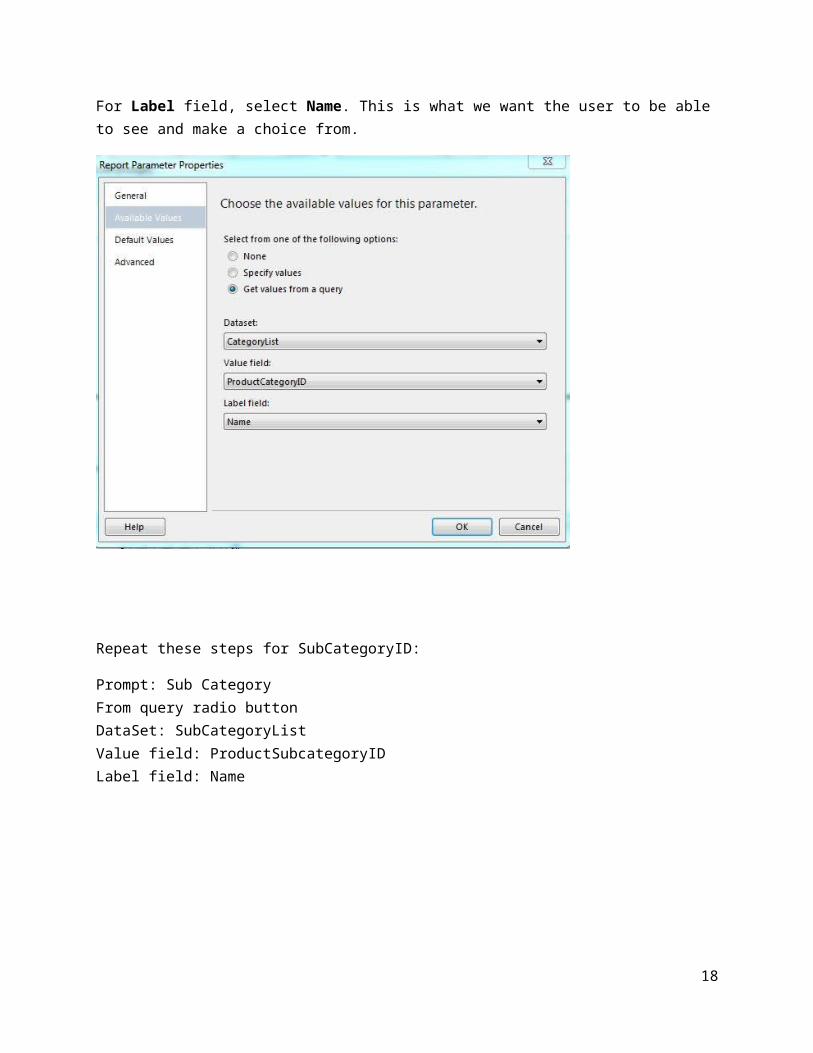
The values for the CategoryID parameter come from a query. In the Available Values tab, select the Get values from a query radio button.
Under Dataset, make sure CategoryList is displayed.
For Value field, list the ProductCategoryID. This is the value we need to return when the user makes a choice.
For Label field, select Name. This is what we want the user to be able to see and make a choice from.
15
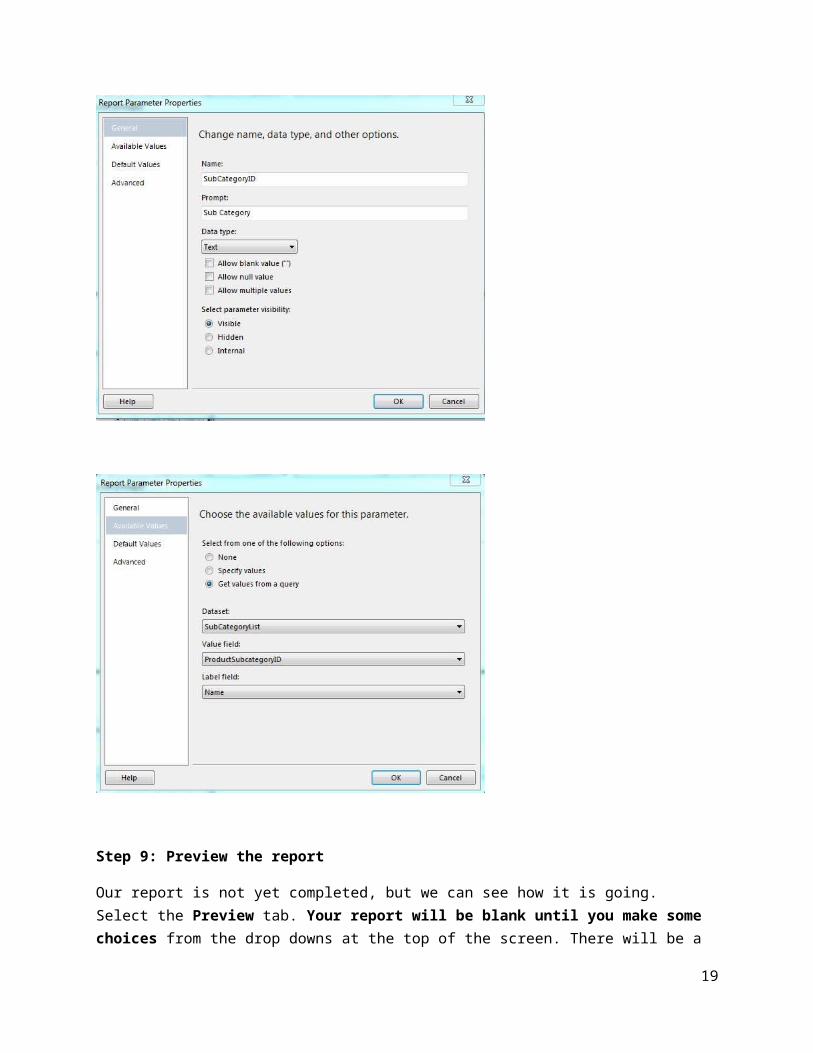
Repeat these steps for SubCategoryID:
Prompt: Sub CategoryFrom query radio buttonDataSet: SubCategoryListValue field: ProductSubcategoryIDLabel field: Name
16
Step 9: Preview the report
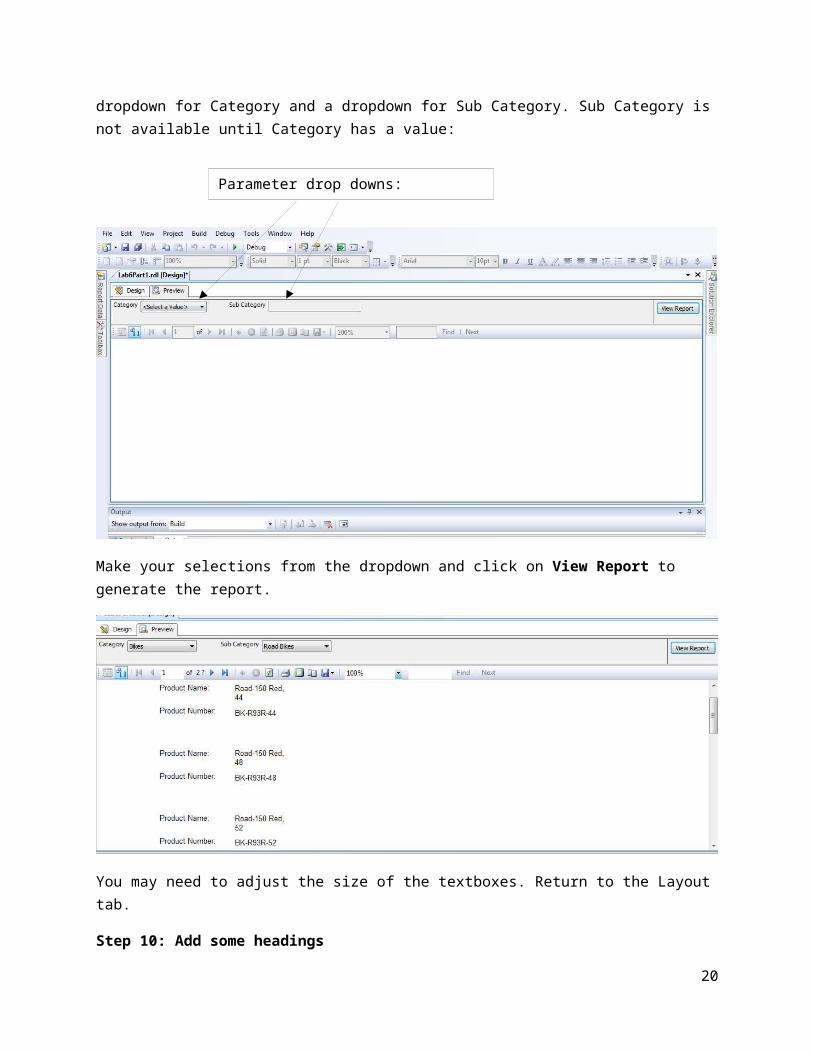
Our report is not yet completed, but we can see how it is going. Select the Preview tab. Your report will be blank until you make some choices from the drop downs at the top of the screen. There will be a dropdown for Category and a dropdown for Sub Category. Sub Category is not available until Category has a value:
17
Make your selections from the dropdown and click on View Report to generate the report.
You may need to adjust the size of the textboxes. Return to the Layout tab.
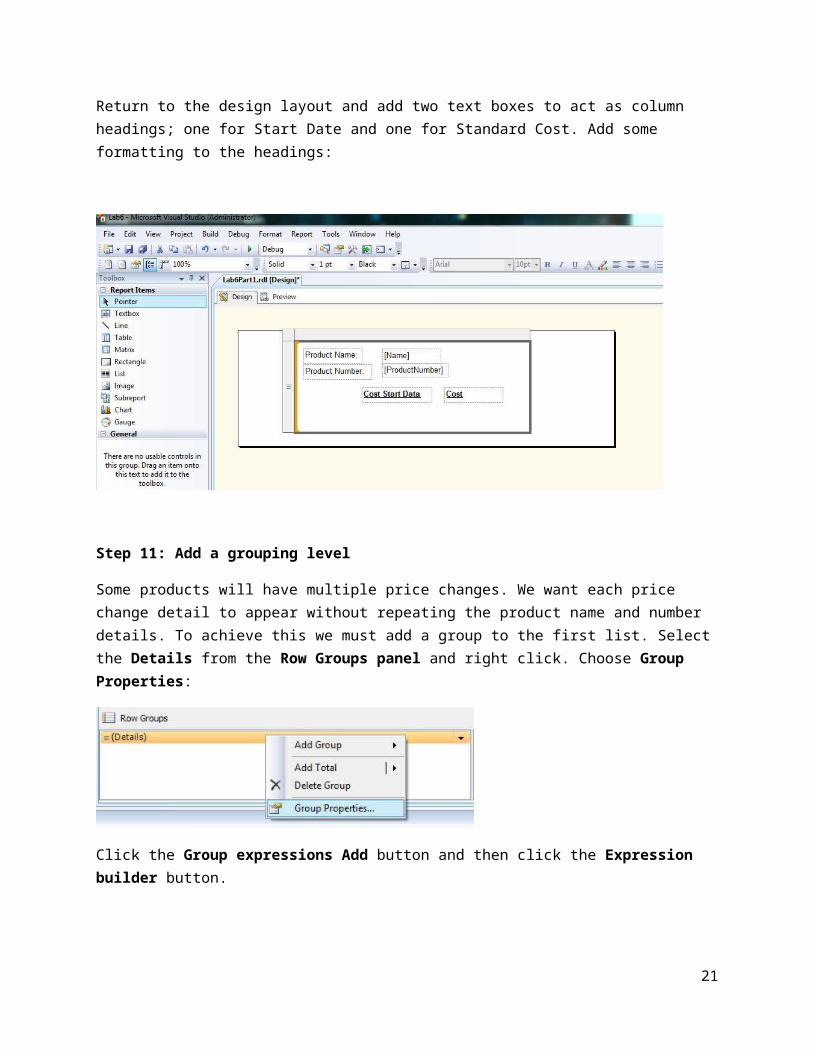
Step 10: Add some headings
Return to the design layout and add two text boxes to act as column headings; one for Start Date and one for Standard Cost. Add some formatting to the headings:
18
Parameter drop downs:
Step 11: Add a grouping level
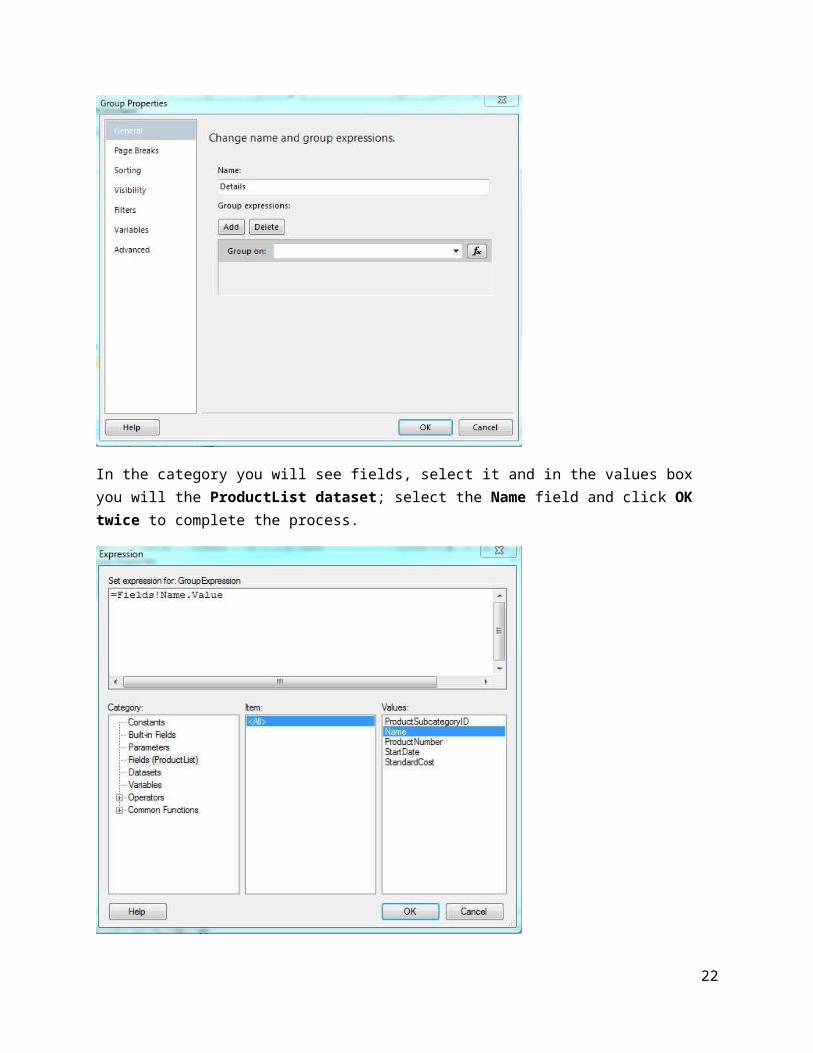
Some products will have multiple price changes. We want each price change detail to appear without repeating the product name and number details. To achieve this we must add a group to the first list. Select the Details from the Row Groups panel and right click. Choose Group Properties:
Click the Group expressions Add button and then click the Expression builder button.
19
In the category you will see fields, select it and in the values box you will the ProductList dataset; select the Name field and click OK twice to complete the process.
20
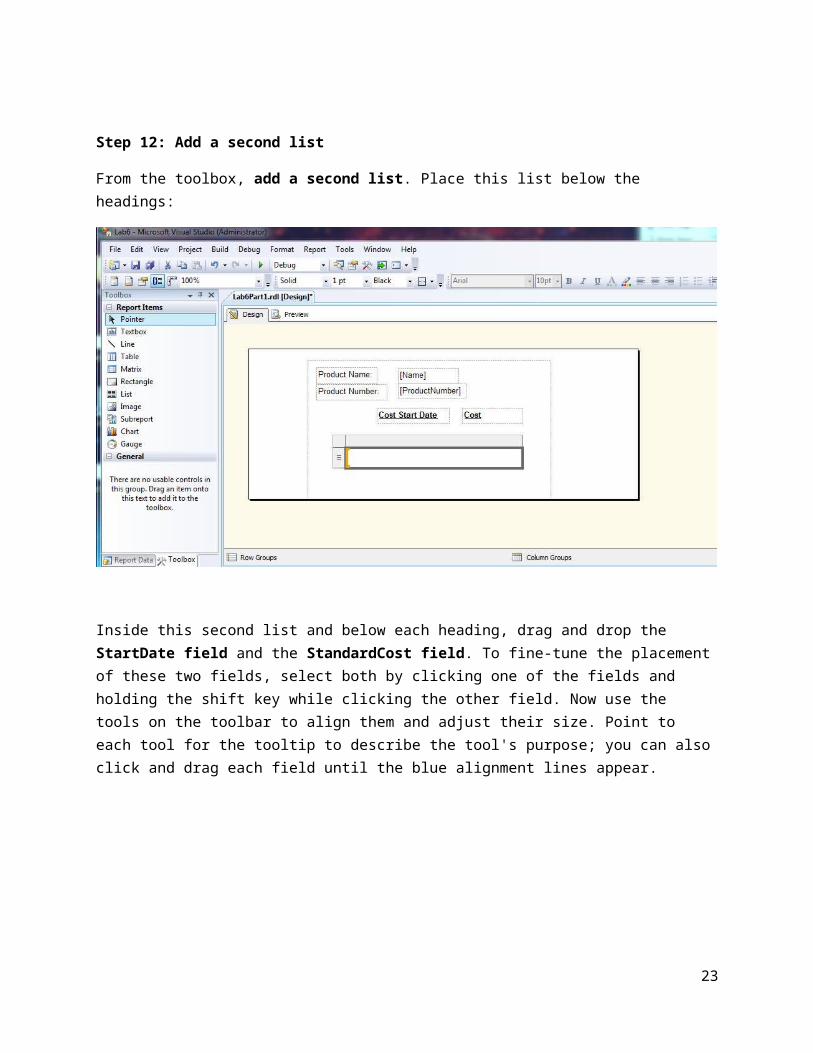
Step 12: Add a second list
From the toolbox, add a second list. Place this list below the headings:
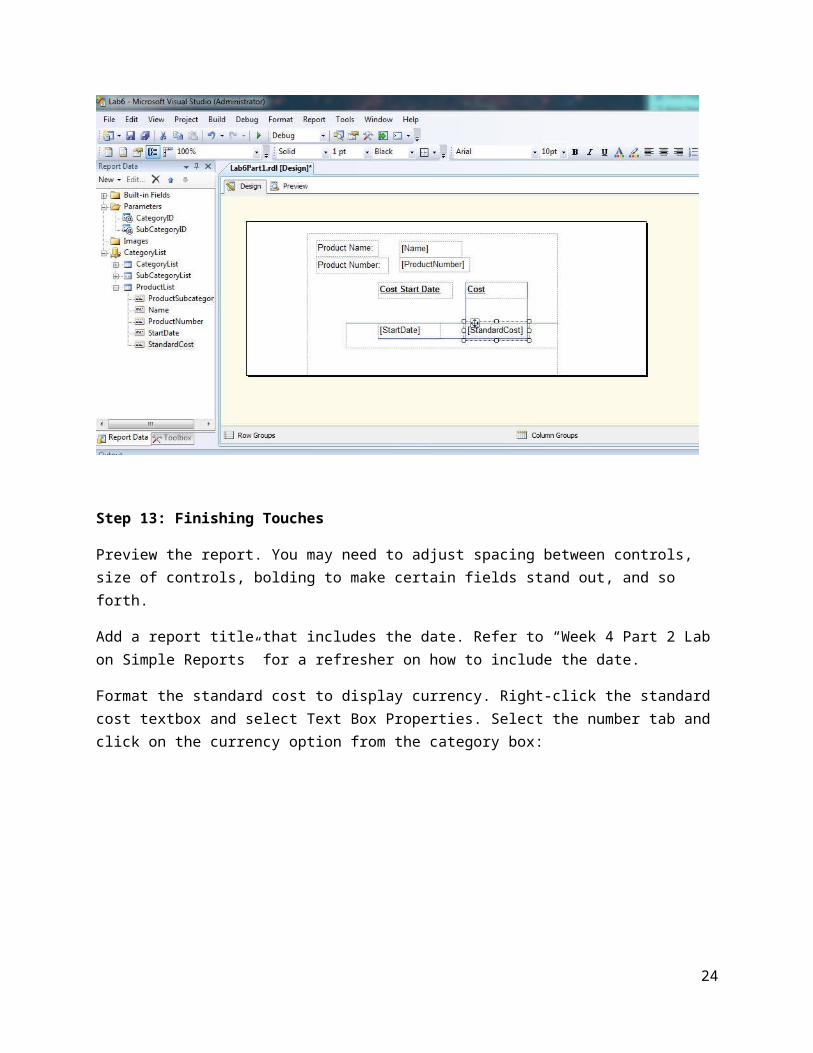
Inside this second list and below each heading, drag and drop the StartDate field and the StandardCost field. To fine-tune the placement of these two fields, select both by clicking one of the fields and holding the shift key while clicking the other field. Now use the tools on the toolbar to align them and adjust their size. Point to each tool for the tooltip to describe the tool's purpose; you can also click and drag each field until the blue alignment lines appear.
21
Step 13: Finishing Touches
Preview the report. You may need to adjust spacing between controls, size of controls, bolding to make certain fields stand out, and so forth.
Add a report title that includes the date. Refer to “Week 4 Part 2 Lab on Simple Reports” for a refresher on how to include the date.
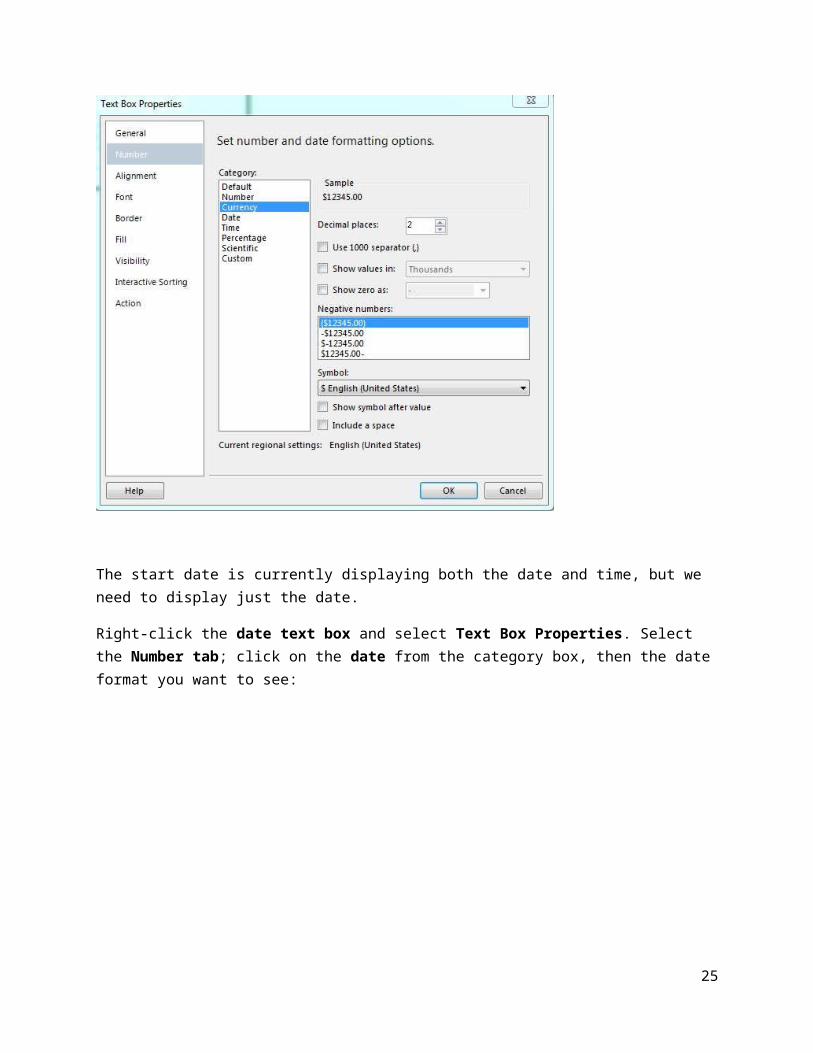
Format the standard cost to display currency. Right-click the standard cost textbox and select Text Box Properties. Select the number tab and click on the currency option from the category box:
22
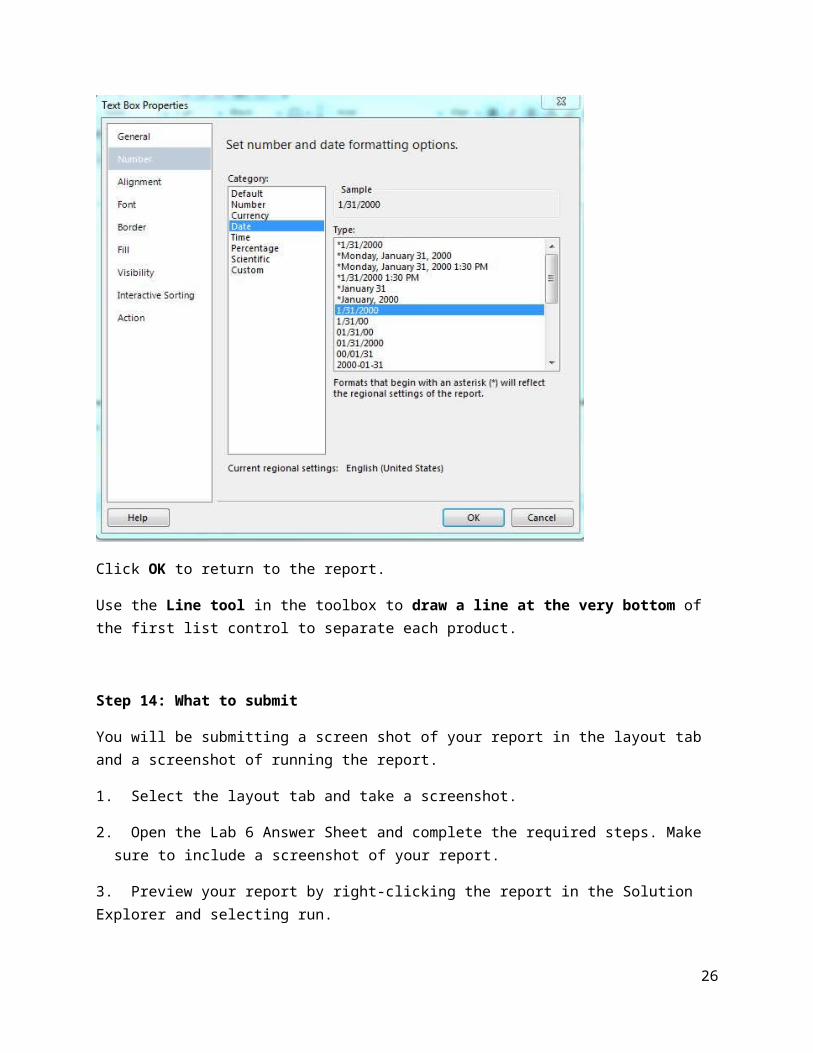
The start date is currently displaying both the date and time, but we need to display just the date.
Right-click the date text box and select Text Box Properties. Select the Number tab; click on the date from the category box, then the date format you want to see:
23
Click OK to return to the report.
Use the Line tool in the toolbox to draw a line at the very bottom of the first list control to separate each product.
Step 14: What to submit
You will be submitting a screen shot of your report in the layout tab and a screenshot of running the report.
1. Select the layout tab and take a screenshot.
2. Open the Lab 6 Answer Sheet and complete the required steps. Make sure to include a screenshot of your report.
3. Preview your report by right-clicking the report in the Solution Explorer and selecting run.
24
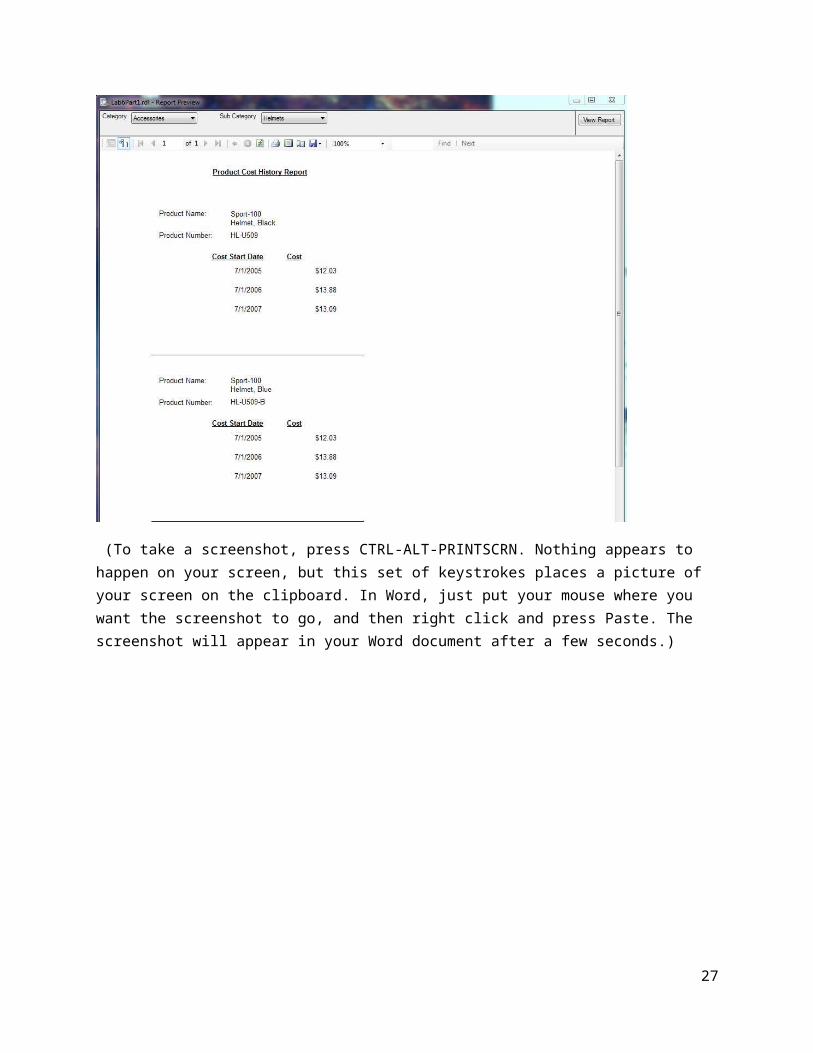
(To take a screenshot, press CTRL-ALT-PRINTSCRN. Nothing appears to happen on your screen, but this set of keystrokes places a picture of your screen on the clipboard. In Word, just put your mouse where you want the screenshot to go, and then right click and press Paste. The screenshot will appear in your Word document after a few seconds.)
25
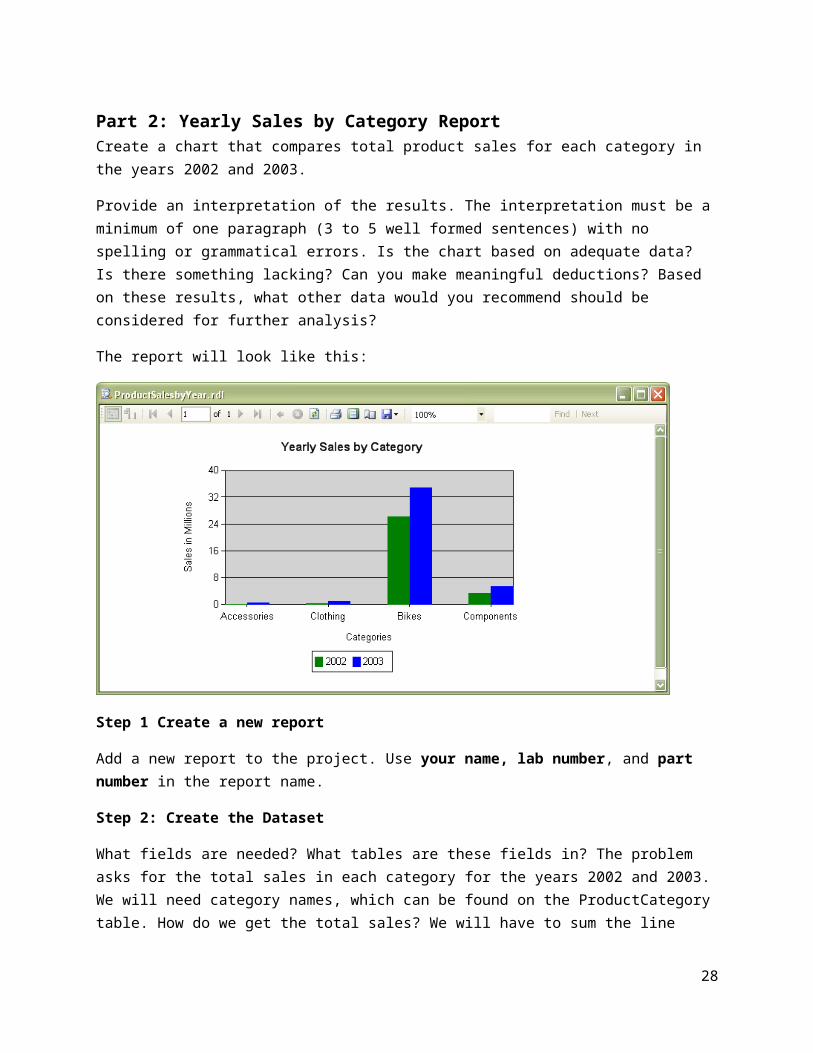
Part 2: Yearly Sales by Category ReportCreate a chart that compares total product sales for each category in the years 2002 and 2003.
Provide an interpretation of the results. The interpretation must be a minimum of one paragraph (3 to 5 well formed sentences) with no spelling or grammatical errors. Is the chart based on adequate data? Is there something lacking? Can you make meaningful deductions? Based on these results, what other data would you recommend should be considered for further analysis?
The report will look like this:
Step 1 Create a new report
Add a new report to the project. Use your name, lab number, and part number in the report name.
Step 2: Create the Dataset
What fields are needed? What tables are these fields in? The problem asks for the total sales in each category for the years 2002 and 2003. We will need category names, which can be found on the ProductCategory table. How do we get the total sales? We will have to sum the line item total for each category and for each year but only return the results for years 2002 and 2003.
The line item total is in the SalesOrderDetail table; the order date will need to be used for the year, and it is in the SalesOrderHeader table.
So there we have three tables: ProductCategory, SalesOrderDetail, and SalesOrderHeader. Can all these tables be joined or do we need extra tables in order to join them? Refer to the partial ER diagram.
Add a new dataset. Give it a name and make sure it is using the shared data source.
26
Switch to the graphical query designer.
Add the tables needed for the query.
NOTE: As you add all of the tables, the query designer will build the join clauses for you, but it may add in a few extra AND statements. These are not necessary, but you can leave them as they are.
Step 3: Add the fields
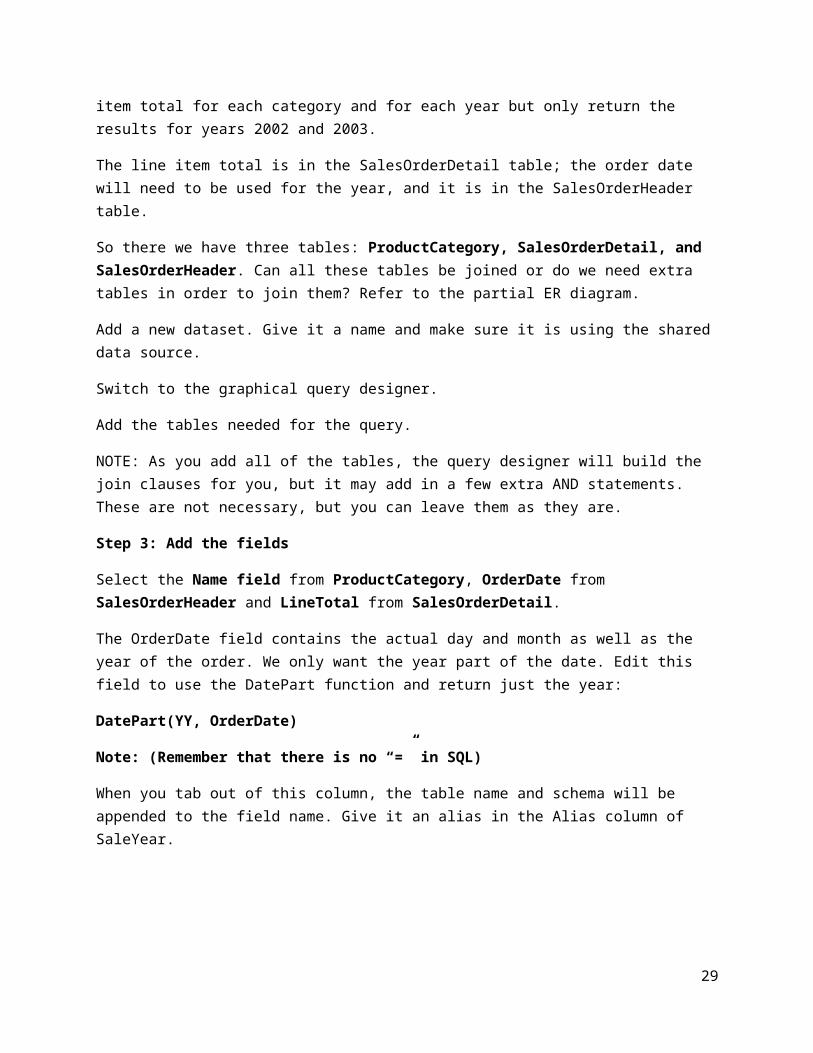
Select the Name field from ProductCategory, OrderDate from SalesOrderHeader and LineTotal from SalesOrderDetail.
The OrderDate field contains the actual day and month as well as the year of the order. We only want the year part of the date. Edit this field to use the DatePart function and return just the year:
DatePart(YY, OrderDate)
Note: (Remember that there is no “=” in SQL)
When you tab out of this column, the table name and schema will be appended to the field name. Give it an alias in the Alias column of SaleYear.
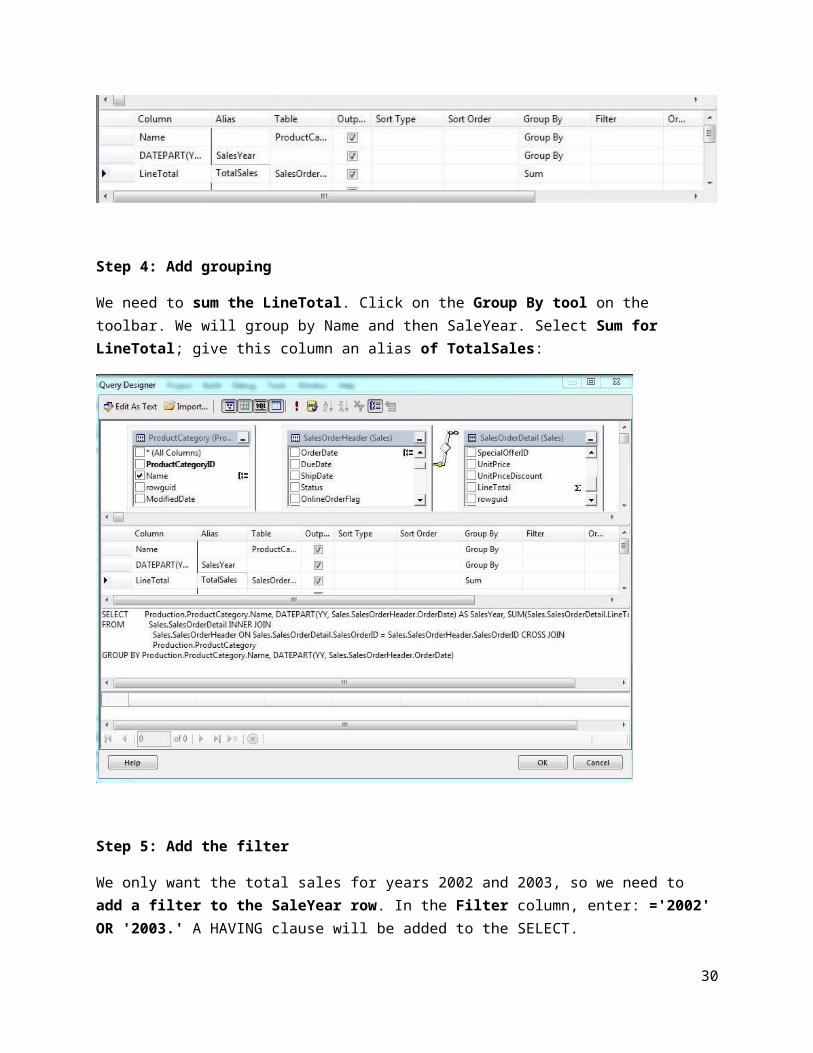
Step 4: Add grouping
We need to sum the LineTotal. Click on the Group By tool on the toolbar. We will group by Name and then SaleYear. Select Sum for LineTotal; give this column an alias of TotalSales:
27
Step 5: Add the filter
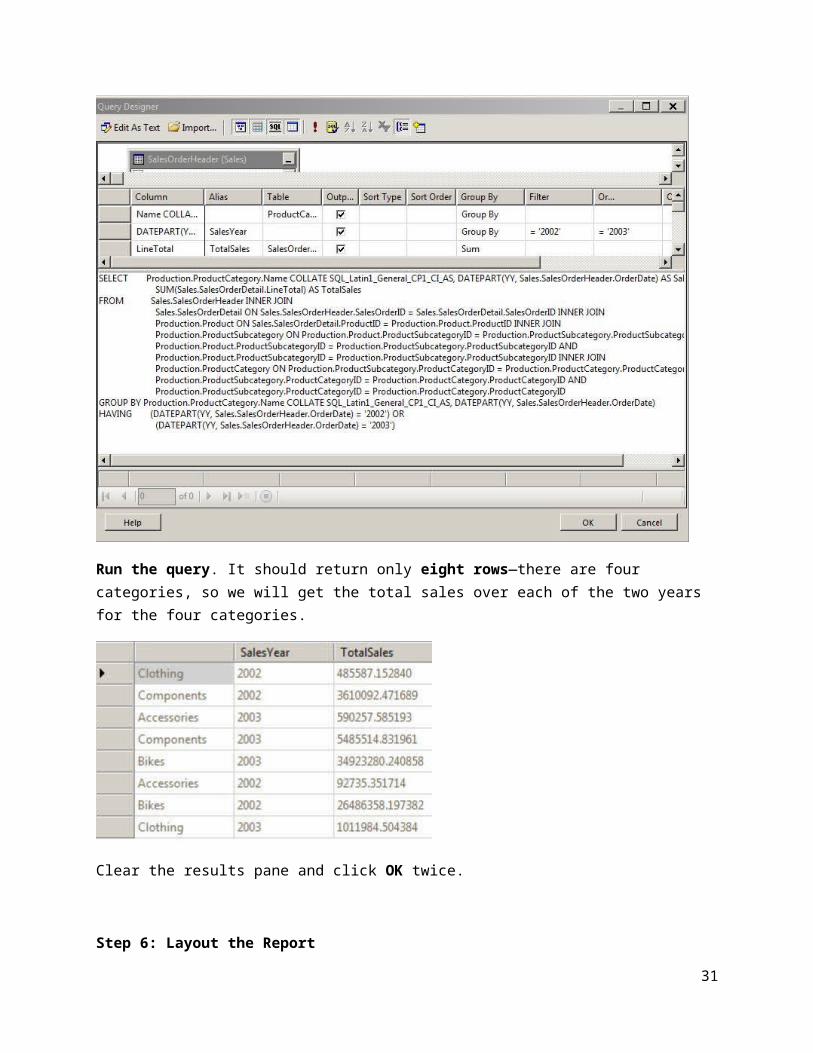
We only want the total sales for years 2002 and 2003, so we need to add a filter to the SaleYear row. In the Filter column, enter: ='2002' OR '2003.' A HAVING clause will be added to the SELECT.
28
Run the query. It should return only eight rows—there are four categories, so we will get the total sales over each of the two years for the four categories.
Clear the results pane and click OK twice.
Step 6: Layout the Report
29
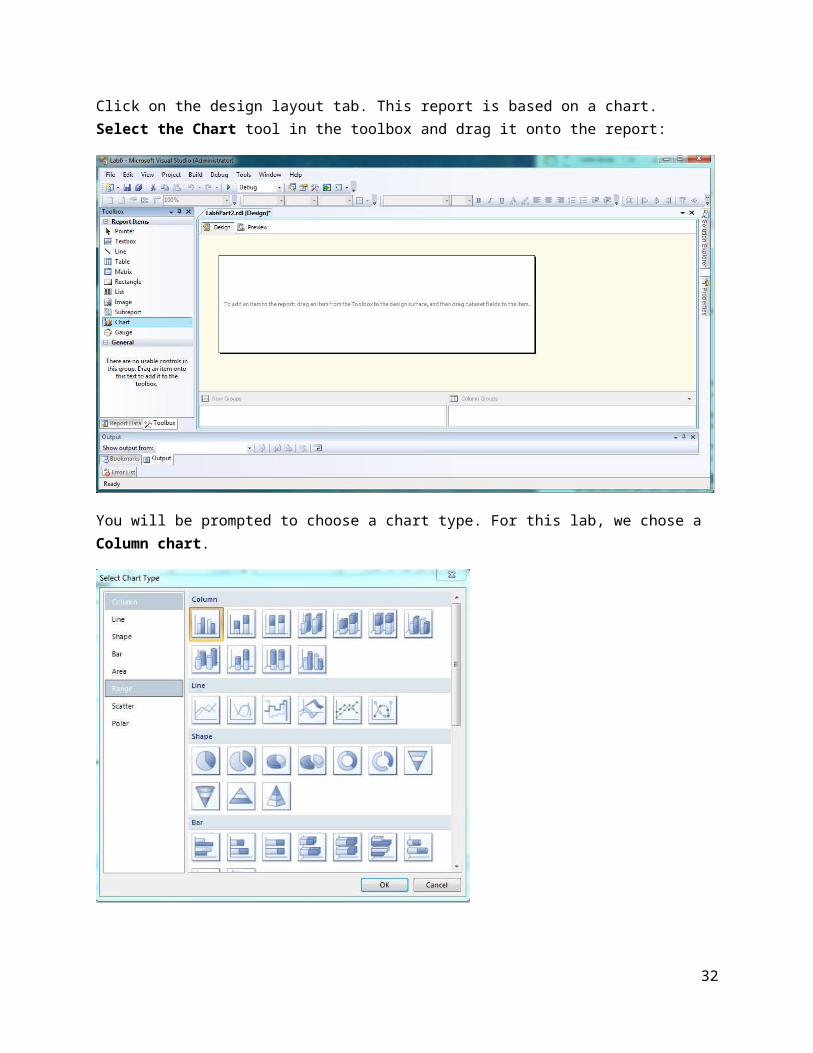
Click on the design layout tab. This report is based on a chart. Select the Chart tool in the toolbox and drag it onto the report:
You will be prompted to choose a chart type. For this lab, we chose a Column chart.
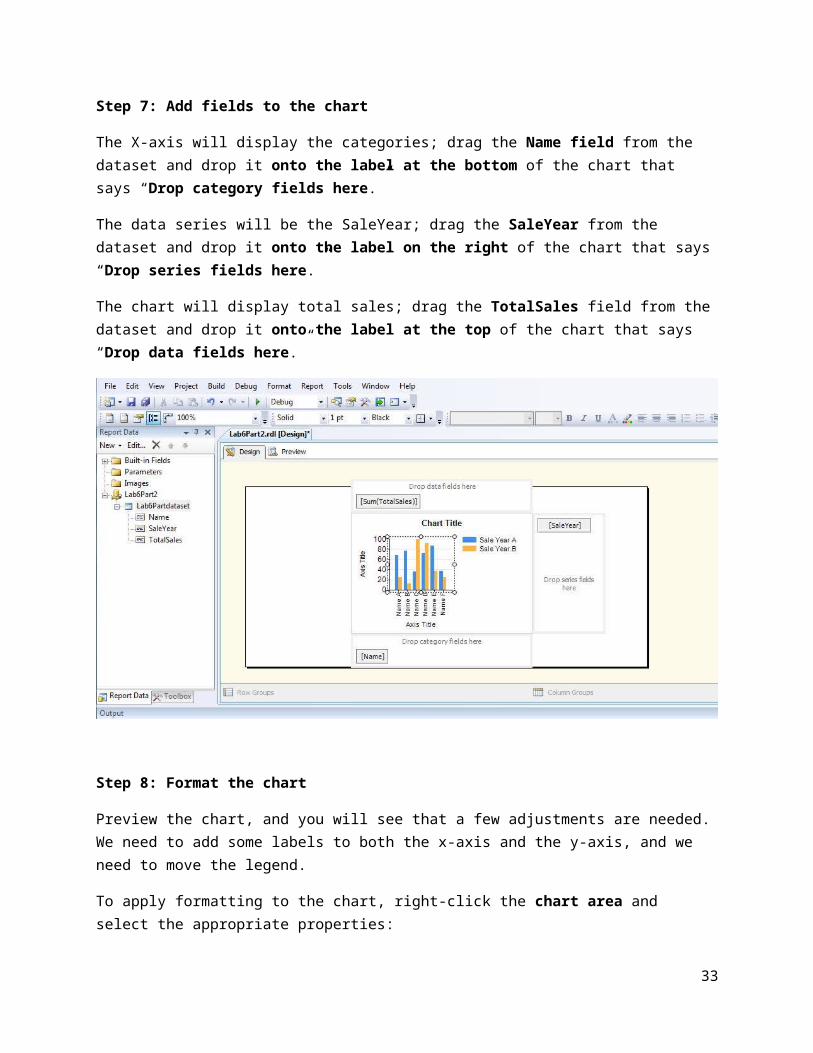
Step 7: Add fields to the chart
30
The X-axis will display the categories; drag the Name field from the dataset and drop it onto the label at the bottom of the chart that says “Drop category fields here.”
The data series will be the SaleYear; drag the SaleYear from the dataset and drop it onto the label on the right of the chart that says “Drop series fields here.”
The chart will display total sales; drag the TotalSales field from the dataset and drop it onto the label at the top of the chart that says “Drop data fields here.”
Step 8: Format the chart
Preview the chart, and you will see that a few adjustments are needed. We need to add some labels to both the x-axis and the y-axis, and we need to move the legend.
To apply formatting to the chart, right-click the chart area and select the appropriate properties:
31
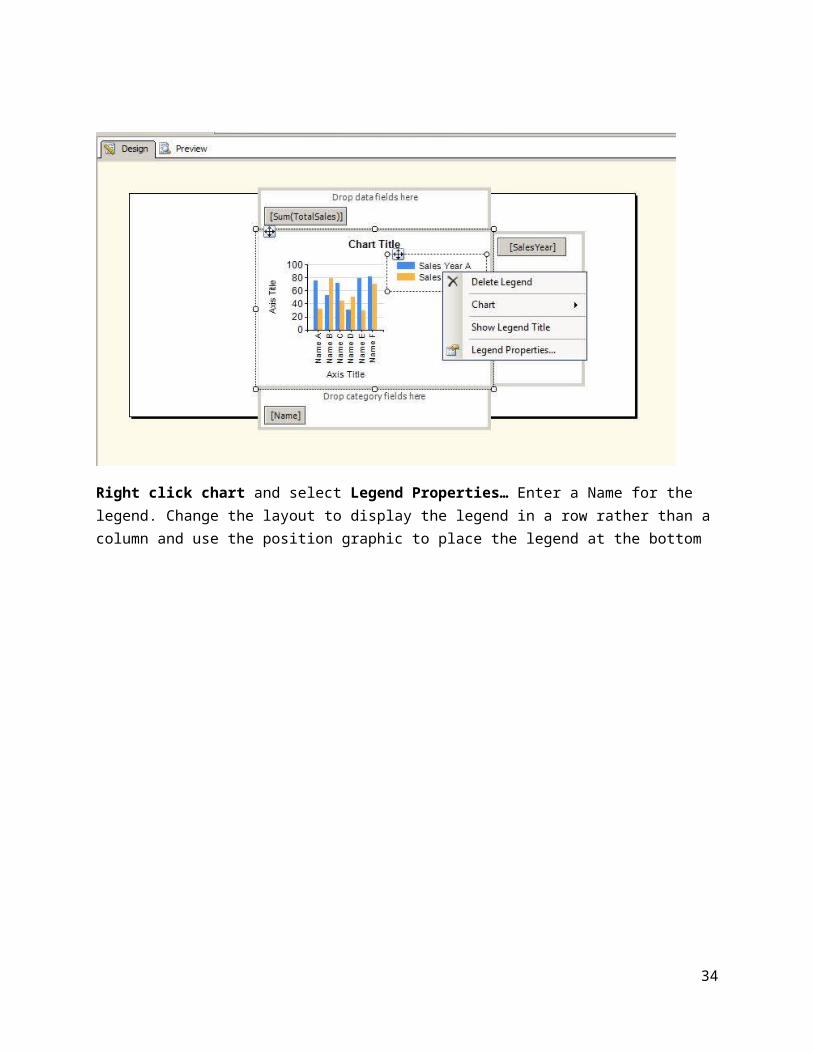
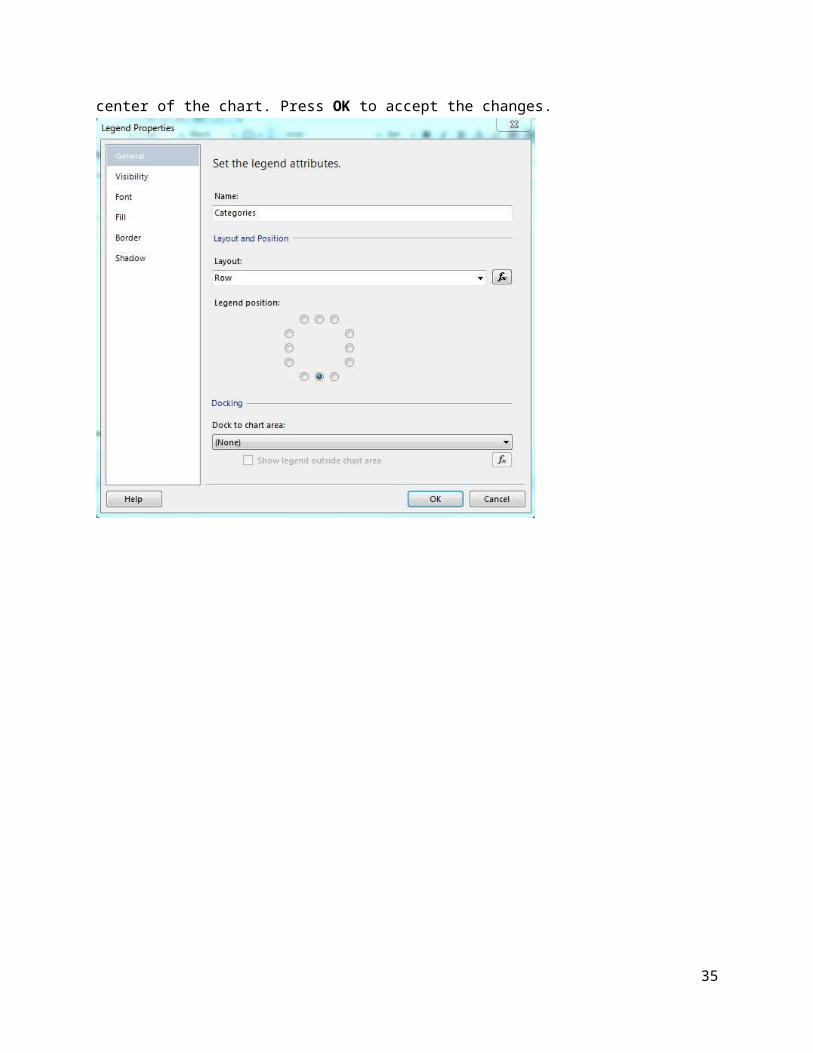
Right click chart and select Legend Properties… Enter a Name for the legend. Change the layout to display the legend in a row rather than a column and use the position graphic to place the legend at the bottom center of the chart. Press OK to accept the changes.
32
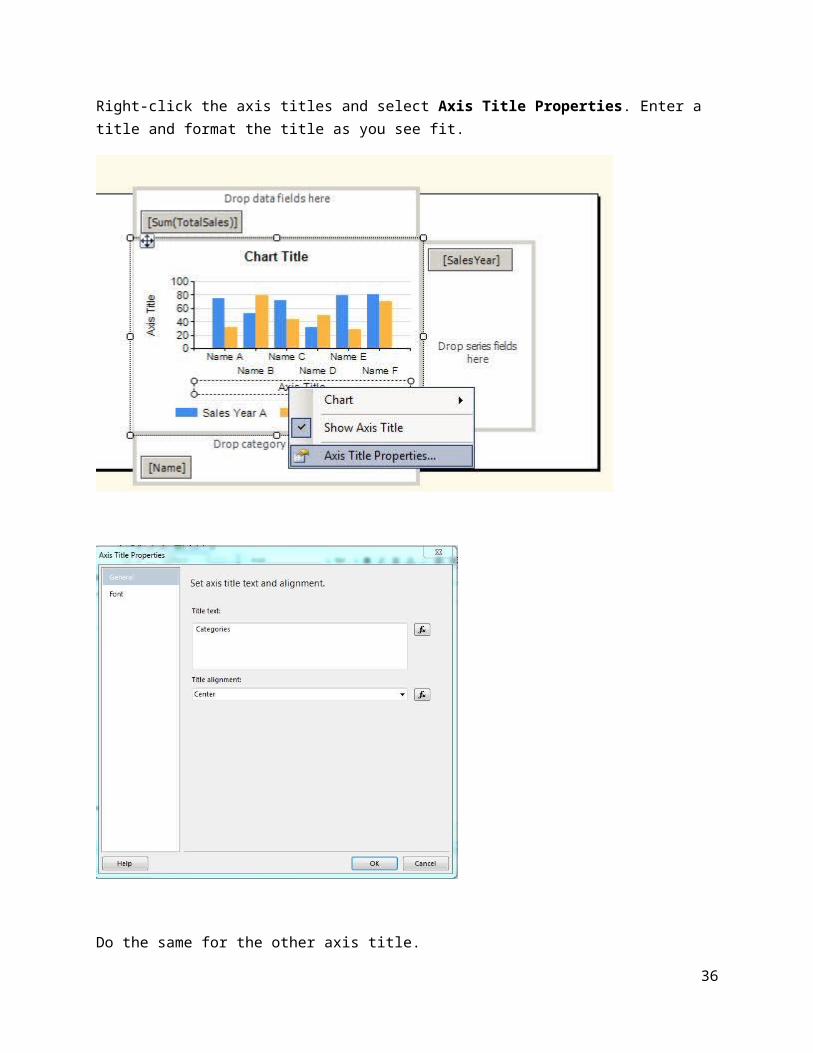
Right-click the axis titles and select Axis Title Properties. Enter a title and format the title as you see fit.
Do the same for the other axis title.
33
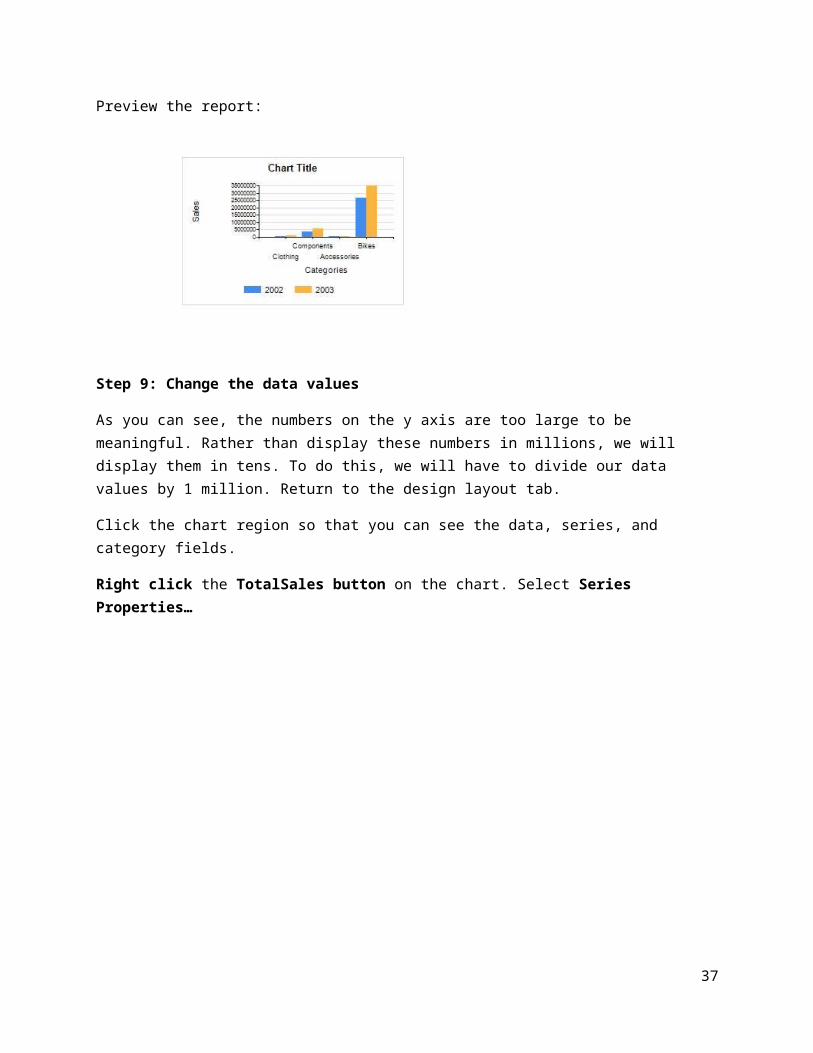
Preview the report:
Step 9: Change the data values
As you can see, the numbers on the y axis are too large to be meaningful. Rather than display these numbers in millions, we will display them in tens. To do this, we will have to divide our data values by 1 million. Return to the design layout tab.
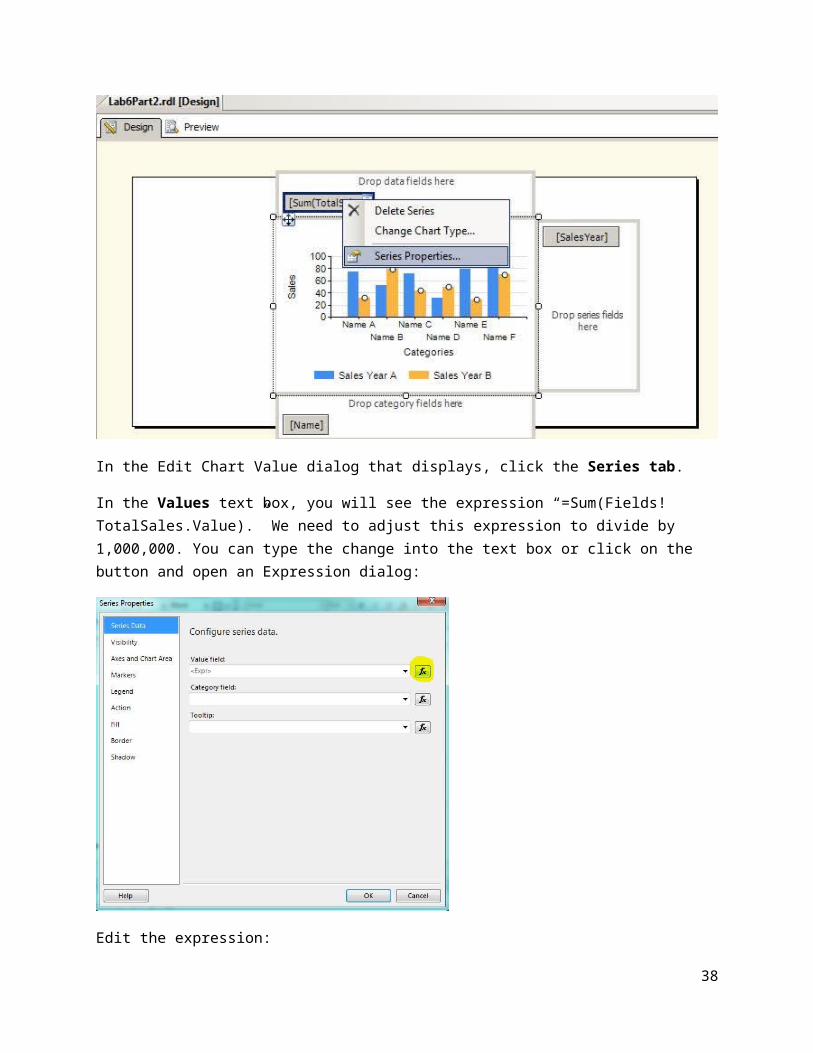
Click the chart region so that you can see the data, series, and category fields.
Right click the TotalSales button on the chart. Select Series Properties…
In the Edit Chart Value dialog that displays, click the Series tab.
34
In the Values text box, you will see the expression “=Sum(Fields!TotalSales.Value).” We need to adjust this expression to divide by 1,000,000. You can type the change into the text box or click on the button and open an Expression dialog:
Edit the expression:
Click OK to return to the Edit Chart Value dialog. Click OK again.
Preview the report and you will see the change to the y axis:
35
We can control the scale of the y axis. We would like to display from 0 to 40 on this axis. Return to the properties for the chart; right click axis and select Axis Properties. On Set axis scale and style, enter 0 for the Minimum and 40 for the Maximum:
Click OK. If 40 is not displaying on the chart, you may need to size your chart to give it a larger area.
36
Step 10: Add a report title
Add an appropriate title above the chart.
Step 11: What to Submit
You will be submitting a screenshot of your report in the layout tab and a screenshot of running the report.
1. Select the layout tab and take a screenshot.
37
2. Open up the Lab 6 Answer Sheet and complete the required steps. Make sure to include a screenshot of your report.
3. Preview your report by right-clicking the report in the Solution Explorer and selecting run.
(To take a screenshot, press CTRL-ALT-PRINTSCRN. Nothing appears to happen on your screen, but this set of keystrokes places a picture of your screen on the clipboard. In Word, place your mouse where you want the screenshot to be placed and then right click and press Paste. The screenshot will appear in your Word document after a few seconds.)
Write your analysis of the results after this screen shot. It must be a minimum of one paragraph (3 to 5 well formed sentences) with no spelling or grammatical errors. Is the chart based on adequate data? Is there something lacking? Can you make meaningful deductions? Based on these results, what other data would you recommend that should be considered for further analysis?
Step 12: Submitting Your Work
You have now completed Lab 6: Parts 1 and 2. Well done! Submit your Word document to the Weekly iLab Dropbox.
38