Embed Size (px)
Citation preview

University of Naples Federico II
Department of Agriculture
Joint international Ph.D. Italy - Chile in
Environmental Resources Sciences
XXVII Cycle (2012-2015)
Biotechnological approaches to increase
drought tolerance and nutritional quality in
tomato
Ph.D. Dissertation
by Sereno Sellitto
TUTOR: COORDINATOR:
Dr. Antonio Di Matteo Prof. Maria A. Rao
CO-TUTOR: Dr. Paula Andrea Cartes Indo

I
Index
1 Introduction pag.1
1.1 The tomato pag.1
1.2 Tomato fruit quality pag.2
1.2.1 Total Soluble Solids pag.3
1.2.2 Firmness pag.4
1.2.3 Ascorbic acid pag.5
1.2.4 Phenolic compounds pag.10
1.2.5 Carotenoids and colours pag.14
1.3 Drought stress pag.19
1.4 Genetic resources and QTLs pag.22
1.5 Aims and scope pag.25
2 Materials and methods pag.26
2.1 Comparisons among commercial processing tomatoes pag.26
2.2 Tomato response to drought stimuli pag.26
2.2.1 Tomato breeding lines pag.26
2.2.2 Trials pag.27
2.3 Morphological and physiological analyses pag.31
2.3.1 Desiccation test pag.32
2.3.2 Relative water content survey pag.33
2.3.3Reliefs on root traits pag.33
2.4 Physical and chemical analyses on fruits and leaves pag.34
2.4.1 Content in soluble solids pag.34
2.4.2 Fruit firmness pag.34
2.4.3 Dry matter pag.34
2.4.4 Specific gravity pag.35
2.4.5 Colorimetric assay pag.35
2.4.6 Assay on hydrogen peroxide content pag.35

II
2.4.7 Assay on ascorbic acid content pag.36
2.4.8 Assay on content in total phenolics pag.37
2.4.9 Assay on flavonoid content pag.37
2.4.10 Analysis of carotenoids by High Performance Liquid Chromatography
(HPLC) pag.38
2.4.11 HPLC with UV detection coupled with electrospray ionization tandem mass
spectrometry (MS/MS) assays pag.39
2.4.12 Assay on the antioxidant activity: ORAC pag.40
2.5 Shelf life pag.41
2.6 Tomato breeding pag.41
2.6.1 Plant material pag.41
2.6.2 MAS based-breeding activities pag.42
2.7 Molecular analysis pag.44
2.7.1 RNA purification pag.45
2.7.2 DNA purification pag.46
2.7.3 Sequencing DNA polymorphic regions for MAS based-breeding pag.47
2.7.4 CAPS analysis pag.48
2.7.5 Microarray analysis pag.49
2.7.5.1 Statistical and bioinformatic analyses pag.50
2.7.5.2 Experimental validation by RT-qPCR pag.51
3 Results pag.53
3.1 Field screening of tomato hybrids for fruit quality pag.54
3.2 Plant response to drought in open field pag.57
3.3 Effects of drought on yield and fruit quality in open field pag.61
3.4 Effects of open field drought on the quality of tomato puree pag.71
3.5 Effects of drought in open field trial on post-harvested fruit quality pag.82
3.6 Root phenotyping in an hydroponic trial pag.93
3.7 Effects of drought in lysimeter trials pag.94

III
3.8 Identification of candidate genes mediating fruit quality and response to drought
pag.98
3.9 Marked assisted selection in tomato for transfer the QTL 9adm to breeding lines
pag.115
3.9.1 Identification of molecular markers targeting wild QTLs located on 9adm
genomic region pag.115
3.9.2 MAS-based selection of hybrid plants F1 progenies originated from the cross
between P011 tomato lines and IL9adm pag.118
3.9.3 MAS-based selection of plants in the F2 progenies originated from the cross
between P011 tomato lines and IL9adm pag.119
3.9.4 MAS-based selection of plants in the BC1F2 progenies originated from the cross
between P011 tomato lenes and IL9adm pag.121
3.9.5 MAS-based selection of plants in the BC2F2 progenies originated from the cross
between P011 tomato lines and IL9adm pag.122
4 Discussion pag.126
5 Conclusions pag.141
6 References pag.142
Appendix: research papers pag.170

1. Introduction
1
1. Introduction
1.1 The tomato
Tomato (Solanum lycopersicum) belongs to the Solanaceae family, also known as the
nightshade family, which contains about 2800 species and includes many
economically important crops, such as potato, pepper and eggplant, as well as
ornamental plants such as Petunia spp. and Nicotiana spp., and medicinal plants, such
as Datura spp., Capsicum spp. and Nicotiana spp. (Foolad, 2007).
Due to their significance in our diet, Solanaceae plants represent one of the three
most economically important groups of plants, besides grasses and legumes, to
humankind (Kumar and Khurana, 2014).
All tomato species are native to a small area of South America, between Ecuador and
Chile, even though they have evolved and are adapted to some of the most diverse
and extreme habitats.
Tomato is used both as a fresh market and processed product, such as paste, juice,
sauce, powder or whole. With worldwide production reaching almost 164 million
tons in 2013, tomato is the seventh most important crop species after maize, rice,
wheat, potatoes, soybeans and cassava. Asia dominates the tomato market with China
ranking first, followed in decreasing order by India, USA, Turkey, Egypt, Iran, Italy,
Brazil and Spain (Fig. 1.1, FAOSTAT 2013, http://faostat.fao.org).
Figure 1.1 – Tomato production (million tonnes). Our elaboration on FAOSTAT data.

1. Introduction
2
In terms of genetic and genomic resources, tomato is a model plant since it exhibits a
reduced genomic size (950 Mb), a short generation time, and routine transformation
technologies. Moreover, it shares with the other Solanaceous plants the same haploid
chromosome number and a high level of conserved genomic organization (Barone et
al., 2009).
Various biological aspects of tomato have been investigated with molecular
biological approaches, and a sequencing of tomato genome was completed and a
highly accurate and well-annotated reference sequence with other findings was
published in May 2012 (Yano et al., 2007; TGC, 2012).
Traditional tomato genetic resources include nine wild and related species.
They are all diploids (2n=2X=24), are similar in chromosome number and structure.
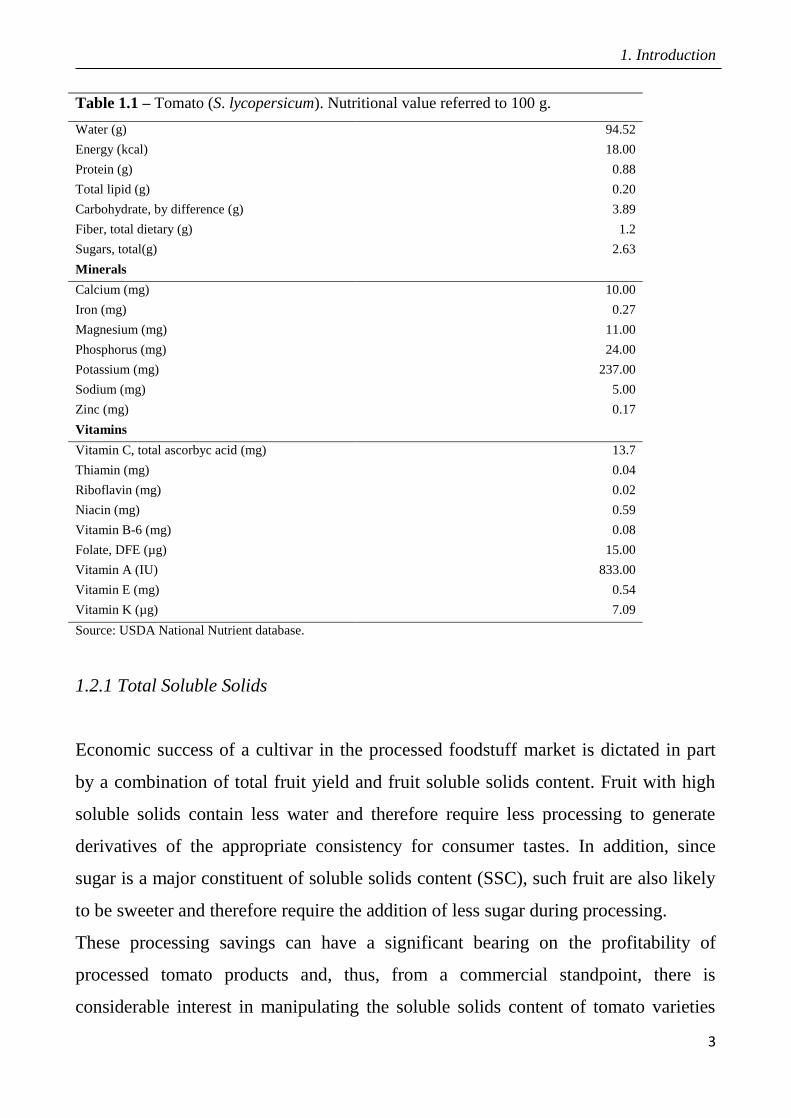
1.2 Tomato fruit quality
Fruit quality attributes can be divided in three different categories, namely chemical-
phisical properties (firmness, pH, total soluble solids), organoleptic properties (taste
and aroma) and nutritious content (Tab. 1.1). The research carried out within this
thesis focus the attention on total soluble solids and firmness and the level of
bioactive compounds such as AsA, phenolics and carotenoids.
1. Introduction
3
Table 1.1 – Tomato (S. lycopersicum). Nutritional value referred to 100 g.
Water (g) 94.52
Energy (kcal) 18.00
Protein (g) 0.88
Total lipid (g) 0.20
Carbohydrate, by difference (g) 3.89
Fiber, total dietary (g) 1.2
Sugars, total(g) 2.63
Minerals
Calcium (mg) 10.00
Iron (mg) 0.27
Magnesium (mg) 11.00
Phosphorus (mg) 24.00
Potassium (mg) 237.00
Sodium (mg) 5.00
Zinc (mg) 0.17
Vitamins
Vitamin C, total ascorbyc acid (mg) 13.7
Thiamin (mg) 0.04
Riboflavin (mg) 0.02
Niacin (mg) 0.59
Vitamin B-6 (mg) 0.08
Folate, DFE (µg) 15.00
Vitamin A (IU) 833.00
Vitamin E (mg) 0.54
Vitamin K (µg) 7.09
Source: USDA National Nutrient database.
1.2.1 Total Soluble Solids
Economic success of a cultivar in the processed foodstuff market is dictated in part
by a combination of total fruit yield and fruit soluble solids content. Fruit with high
soluble solids contain less water and therefore require less processing to generate
derivatives of the appropriate consistency for consumer tastes. In addition, since
sugar is a major constituent of soluble solids content (SSC), such fruit are also likely
to be sweeter and therefore require the addition of less sugar during processing.
These processing savings can have a significant bearing on the profitability of
processed tomato products and, thus, from a commercial standpoint, there is
considerable interest in manipulating the soluble solids content of tomato varieties

1. Introduction
4
(Baxter et al., 2005).
The cultivated variety of tomato, Solanum lycopersicum, has large, red fruit that
predominantly accumulate hexose sugars. In contrast, the wild relative, Solanum
pennellii, has small, green fruit that predominantly accumulate sucrose and have
higher soluble solids content.
In tomato fruit, the dominant soluble metabolites are sugars and organic acids
(Grierson and Kader, 1986; Roessner-Tunali et al., 2003). Their overall content can
be expressed as SSC that is measured by a refractive index called Brix degree.
1.2.2 Firmness
Texture is an important aspect of consumer perception of fresh tomatoes (Causse et
al., 2003; Serrano-Megias and Lopez-Nicolas, 2006). Texture traits include flesh
firmness, mealiness, meltiness, crispness, and juiciness (Harker et al., 1997;
Redgwell and Fischer, 2002; Szczesniak, 2002). Previous research has focused on
creating tomatoes with greater firmness in order to have greater disease resistance
and longer shelf life (Hongsoongnern and Chambers, 2008). The amount of gel and
seeds within locules are unique aspects of tomato perceptions (Chaib et al., 2007).
Firmness to touch was considered an important attribute by the majority of
participants. Oltman and co-authors conducted a series of focus group in order to
know how the tomato consumer choices and they saw that most participants would
only buy tomatoes that were firm (Oltman et al., 2014).
Tomatoes that are not firm are susceptible to chilling injury (Jackman et al., 1990).
Firmness may be used to evaluate a tomato for the extent of its chilling injury, which
consumers may be able to visualize.
A number of works have been published on tomato fruit firmness measurements, and
different instruments for measuring firmness has been illustrated (Batu, 1998).
Instrumental measurements are generally used to evaluate firmness related to the
mechanical properties of fruit tissues. The most widely used measurement of fruit

1. Introduction
5
texture is the Magness–Taylor firmness test, which assesses the maximum force
needed to compress the sample in a specific way (Abbott, 2004). This system was
mainly developed to evaluate commercial quality with respect to the tactile
assessment of fruit firmness by consumers at the time of purchase. Many other types
of destructive or non-destructive mechanical measurements exist, including
compression, puncture, tension, and vibration. Rheological measurements inform
about the mechanical properties of the fruit or of a localized part of the fruit (peel,
pericarp, etc.).
1.2.3 Ascorbic acid
In addition to its roles in cardiovascular function, immune cell development, and iron
utilization, vitamin C (L-ascorbic acid or AsA) serves as a water-soluble antioxidant
in humans (Sies et al., 1995; Levine et al., 1986; Levine et al., 1995).
Despite the fact that most mammals can synthesize L-ascorbic acid (AsA), humans
are an exception as a result of a mutation to L-gulono-1,4-lactone oxidase, the last
enzyme in the animal AsA biosynthetic pathway (Chatterjee, 1973). Because AsA is
water-soluble, it is not stored and is readily excreted from the body. Therefore, AsA
must be obtained regularly from dietary sources. The National Academy of Sciences
has recommended 90 mg/day of the vitamin for adult males and 75 mg/day for adult
females. Although vitamin C can be obtained from the consumption of fresh meat, it
is destroyed by heating and is more typically obtained from plant sources (Gallie,
2013). According to the Centers for Disease Control and Prevention, good sources of
vitamin C include broccoli, tomatoes, leafy greens, apricots and pineapple
(http://www.cdc.gov/nccdphp/dnpa/5ADay/index.htm).
Tomatoes contain moderate amounts of vitamin C, but especially in the summer,
because of the large consumption of fresh fruit provides consumers with significant
AsA intake (Stevens et al., 2006).
The Average ascorbic acid levels found in market-purchased products ranged

1. Introduction
6
beetwen 0.08 and 0.10 g/kg on a wet weight base (Franke et al., 2004; Nagarajan and
Hotchkiss, 1999; Rickman et al., 2007).
AsA is also an essential compound for plants, having a primary role as an antioxidant
preventing oxidative stress as well as playing a role in plant development and
hormone signalling (Pastori et al., 2003), the activation of the cell cycle (Potters et
al., 2002) and possibly cell wall loosening during cell expansion or fruit ripening
(Fry, 1998).
A recent plethora of evidences suggests that it may play a role in protection of plant
against several environmental stresses such as metal action, salinity, weedicides, O3,
UV-B and pathogenesis (Shalata et al., 2001). The endogenous level of AsA is
determined by both de novo AsA biosynthesis and recycling of the oxidized forms of
AsA, monodehydroascorbate (MDA) and dehydroascorbate (DHA) via MDA
reductase and DHA reductase, respectively (Conklin and Barth, 2004).
Plants and animals employ distinct pathways for the synthesis of L-ascorbic acid
(Fig. 1.2).

1. Introduction
7
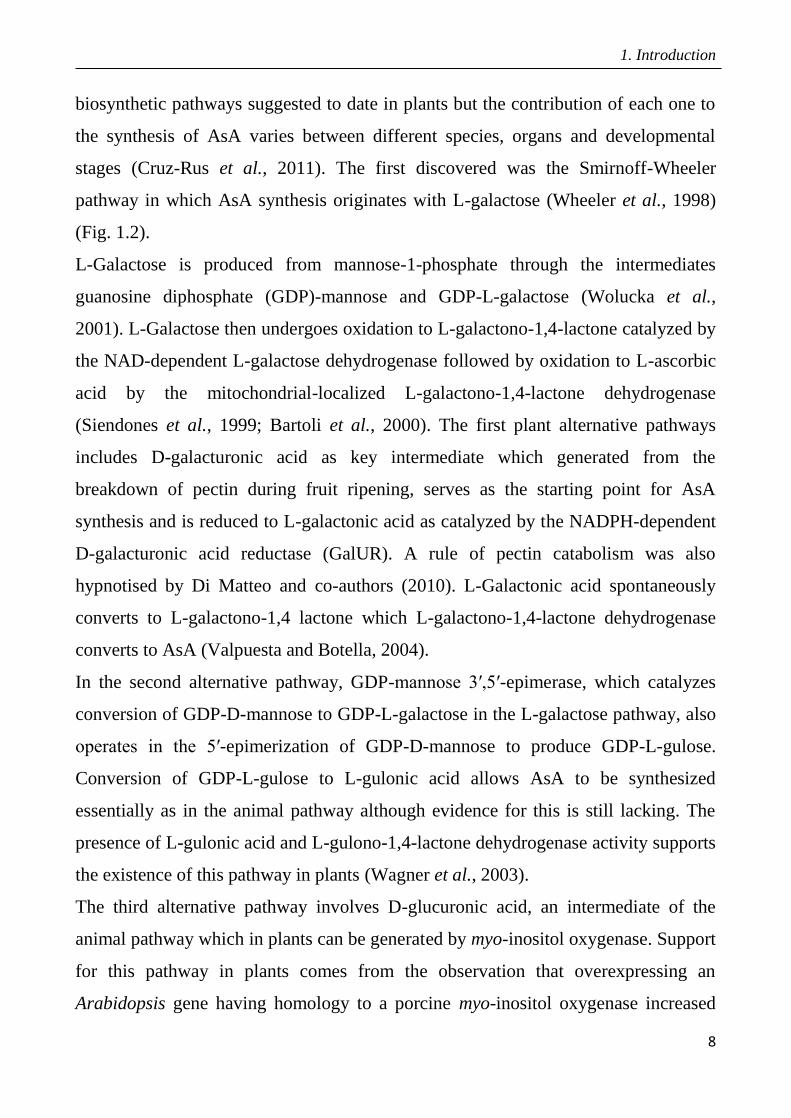
Figure 1.2- Proposed biosynthetic pathways of L-ascorbic acid in animals (reactions 1–8) and plants (reactions 9–24).
Red arrows indicate enzymatic activities of the new pathways leading to L-ascorbic acid biosynthesis [15,19]. Enzymes
catalyzing the numbered reactions are: 1, phosphoglucomutase; 2, UDP-glucose pyrophosphorylase; 3, UDP-glucose
dehydrogenase; 4, glucuronate-1-phosphate uridylyltransferase; 5, glucurono kinase; 6, glucuronate reductase; 7,
aldono-lactonase; 8, gulono-1,4-lactone dehydrogenase; 9, glucose-6-phosphate isomerase; 10, mannose-6-phosphate
isomerase; 11, phosphomannomutase; 12, GDP-mannose pyrophosphorylase (mannose-1-phosphate
guanylyltransferase); 13, GDP-mannose-3’,5’-epimerase; 14, phosphodiesterase; 15, sugar phosphatase; 16, L-galactose
dehydrogenase; 17, L-galactono-1,4-lactone dehydrogenase; 18, methylesterase; 19, D-galacturonate reductase; 20,
aldono-lactonase; 21, phosphodiesterase; 22, sugar phosphatase; 23, L-gulose dehydrogenase; 24, myo-Inositol
oxygenase. Adapted from Valpuesta and Botella (2004).
The AsA pathway in mammals begins with D-glucose and proceeds through D-
glucose-1-P, UDP-glucose, UDP-D-glucuronic acid, UDP-D-glucuronic acid-1-P, D-
glucuronic acid, L-gulonic acid, and finally gulono-1,4-lactone (Fig. 1.2). Gulono-
1,4-lactone oxidase then converts gulono-1,4-lactone into 2-keto-gulono-γ-lactone
which spontaneously converts to AsA (Burns, 1967).
In contrast to this single AsA pathway in mammals, there are at least four
1. Introduction
8
biosynthetic pathways suggested to date in plants but the contribution of each one to
the synthesis of AsA varies between different species, organs and developmental
stages (Cruz-Rus et al., 2011). The first discovered was the Smirnoff-Wheeler
pathway in which AsA synthesis originates with L-galactose (Wheeler et al., 1998)
(Fig. 1.2).
L-Galactose is produced from mannose-1-phosphate through the intermediates
guanosine diphosphate (GDP)-mannose and GDP-L-galactose (Wolucka et al.,
2001). L-Galactose then undergoes oxidation to L-galactono-1,4-lactone catalyzed by
the NAD-dependent L-galactose dehydrogenase followed by oxidation to L-ascorbic
acid by the mitochondrial-localized L-galactono-1,4-lactone dehydrogenase
(Siendones et al., 1999; Bartoli et al., 2000). The first plant alternative pathways
includes D-galacturonic acid as key intermediate which generated from the
breakdown of pectin during fruit ripening, serves as the starting point for AsA
synthesis and is reduced to L-galactonic acid as catalyzed by the NADPH-dependent
D-galacturonic acid reductase (GalUR). A rule of pectin catabolism was also
hypnotised by Di Matteo and co-authors (2010). L-Galactonic acid spontaneously
converts to L-galactono-1,4 lactone which L-galactono-1,4-lactone dehydrogenase
converts to AsA (Valpuesta and Botella, 2004).
In the second alternative pathway, GDP-mannose 3′,5′-epimerase, which catalyzes
conversion of GDP-D-mannose to GDP-L-galactose in the L-galactose pathway, also
operates in the 5′-epimerization of GDP-D-mannose to produce GDP-L-gulose.
Conversion of GDP-L-gulose to L-gulonic acid allows AsA to be synthesized
essentially as in the animal pathway although evidence for this is still lacking. The
presence of L-gulonic acid and L-gulono-1,4-lactone dehydrogenase activity supports
the existence of this pathway in plants (Wagner et al., 2003).
The third alternative pathway involves D-glucuronic acid, an intermediate of the
animal pathway which in plants can be generated by myo-inositol oxygenase. Support
for this pathway in plants comes from the observation that overexpressing an
Arabidopsis gene having homology to a porcine myo-inositol oxygenase increased

1. Introduction
9
AsA content (Lorence et al., 2004).
Although multiple AsA biosynthetic pathways may exist in plants, the observation
that mutants affected in the Smirnoff–Wheeler pathway result in substantial
reductions in AsA content does indicate that the alternative pathways are unable to
compensate for the loss in AsA biosynthetic capacity in Smirnoff–Wheeler pathway
mutants. Thus, these alternative pathways may make only minor contributions to
AsA biosynthesis and strategies focusing on these other pathways may be limited to
increasing AsA in specific organs or at specific developmental stages.
The regulation of ascorbate levels in cells is therefore tightly controlled by the level
of synthesis and recycling as well as degradation (Pallanca and Smirnoff, 2000;
Green and Fry, 2005) and the transport of this molecule within the cell (Horemans et
al., 2000).
The transcription of genes encoding biosynthetic enzymes such as D-galacturonate
reductase and myo-inositol oxygenase and the AsA recycling enzymes MDHAR are
positively correlated with the increase in AsA during plant ripening.
The recent cloning of several genes that regulate AsA synthesis and recycling has
facilitated the generation of transgenic plants with enhanced AsA levels and in some
cases as much as six-fold increases in AsA relative
to wild-type plants have been achieved.
All genes involved in the Smirnoff–Wheeler pathway have been characterised in
Arabidopsis (Wheeler et al., 1998; Conklin et al., 1999; Wolucka and Van Montagu,
2003; Laing et al., 2004, 2007; Dowdle et al., 2007; Linster et al., 2007). Also,
mutations in the D-Man/L-Gal pathway result in a significantly decreased AsA
content, whereas the overexpression of genes in this pathway increases the AsA
levels (Conklin et al., 2000; Gatzek et al., 2002; Wolucka et al., 2003; Dowdle et al.,
2007; Linster et al., 2008). For example, the GDP–D-Man pyrophosphorylase
(VTC1) vtc1-1 mutant displays a decrease in the synthesis of AsA to only one-third
of the amount in wild-type plants (Conklin et al., 2000). Two homologous genes,
VTC2 and VTC5, encode GDP–L-Gal phosphorylase in Arabidopsis (Dowdle et al.,

1. Introduction
10
2007; Linster et al., 2007, 2008) and the double mutant (vtc2/vtc5), which has almost
no GDP–L-Gal phosphorylase activity, displays significantly decreased AsA levels
and impaired growth (Dowdle et al., 2007). The overexpression of the tomato GDP–
Man-3,5-epimerase gene SIGME increases AsA content and enhances tolerance to
salt and cold (Zhang et al., 2011). Two master regulators of this pathway,
Arabidopsis AMR1 (Zhang et al., 2009) and AtERF98 (Zhang et al., 2012) have been
recently reported as well.
In addition to de novo synthesis, AsA recycling also affects the AsA level (Smirnoff
et al., 2001; Chen et al., 2003; Stevens et al., 2008). As the most abundant water-
soluble antioxidant, one of the important roles of AsA is to scavenge reactive oxygen
species (ROS) (Smirnoff and Wheeler, 2000) that are normally generated during
photosynthesis and aerobic metabolism in plants (Conklin and Barth, 2004; Foyer
and Noctor, 2009). During ROS scavenging, AsA is oxidised into
monodehydroascorbate (MDHA) by AsA peroxidase (APX), and MDHA can be
recycled to AsA by monodehydro-ascorbate reductase (MDAR) or disproportionate
to dehydro-ascorbate (DHA) and AsA. The DHA can be recycled to AsA by
dehydroascorbate reductase (DHAR) or hydrolysed to 2,3-diketogulonic acid
(Smirnoff and Wheeler, 2000). The over-expression of wheat DHAR significantly
increased the levels of AsA in tobacco and maize, which indicates that AsA recycling
also plays an important role in the regulation of AsA levels in plants (Chen et al.,
2003). Thus, MDAR and DHAR play important roles in recapturing AsA and
regulating the redox state of plant cells (Chen et al., 2003; Eltayeb et al., 2007;
Stevens et al., 2008).
Beside genes controlling AsA biosynthesis within the Smirnoff-Wheeler pathway, the
overexpression of a myo-inositol oxygenase (MIOX) gene in Arabidopsis thaliana
leads to plants with 2–3-fold increase in foliar AsA content (Lorence et al., 2004).
1.2.4 Phenolic compounds

1. Introduction
11
A number of clinical trials and cohort studies have suggested a role of dietary
polyphenols in the prevention of several major chronic diseases such as
cardiovascular diseases, cancers, diabetes, neurodegenerative diseases, and
osteoporosis (Arts et al., 2005; Scalbert et al., 2005). Plants are the most important
dietary source of phenolic compounds for human.
As a general rule recently proposed by Quideau et al. (2011), the term ‘plant
phenolics’ should be strictly used to refer to secondary natural metabolites arising
biogenetically from the shikimate/phenylpropanoid pathway, which directly provides
phenylpropanoids (Fig. 1.3), or the ‘polyketide’ acetate/malonate pathway, which can
produce simple phenols, or both of them. These pathways produce a bewildering
array of monomeric and polymeric structures (the term ‘polyphenols’ defining those
with more than one phenolic ring) that fulfill a very broad range of physiological
roles in plants.
Figure 1.3 - Schematic of the major branch pathways of (poly)phenol biosynthesis. PAL, phenylalanine ammonia-
lyase; C4H, cinnamate-4-hydroxylase; 4CL, 4-coumaroyl:CoA-ligase; HCT, hydroxycinnamoyl transferase; C3H, p-
coumarate-3-hydroxylase; CHS, chalcone synthase; CHI, chalcone isomerase; ANS, anthocyanidin synthase; DFR,
dihydroflavonol reductase; FS, flavone synthase; FLS, flavonol synthase; F3H, flavanone 3-hydroxylase; IFS,
isoflavone synthase; ANR, anthocyanidin reductase; LAR, leucoanthocyanidin reductase (Cheynier et al., 2013).

1. Introduction
12
It has been estimated that around 8000 different phenolic compounds are synthesized
by plants, via a variety of polymerization, hydroxylation, methylation, glycosylation,
acylation, prenylation, and condensation reactions (Pourcel et al., 2006) and more
than 500 different phenolic compounds are known in foods, from low-molecular-
weight phenolic acids to highly polymerized proanthocyanidins. Several classes of
phenolics have been categorized on the basis of their basic skeletons: C6 (simple
phenols, benzoquinones), C6-C1 (phenolic acids and aldehydes), C6-C2
(acetophenones, phenylacetic acids), C6-C3 (hydroxycinnamic acids, coumarins,
phenylpropanes, chromones), C6-C4 (naphthoquinones), C6-C1-C6 (xanthones), C6-
C2-C6 (stilbenes, anthraquinones), C6-C3-C6 (flavonoids, isoflavonoids,
neoflavonoids), (C6-C3-C6)2,3 (bi-, triflavonoids, proanthocyanidin dimers, trimers),
(C6-C3)2 (lignans, neolignans), (C6-C3)n (lignins), (C6)n (catechol melanins,
phlorotannins), (C6-C3-C6)n (condensed tannins).
Dietary polyphenols belong to four main classes of flavonoids, phenolic acids,
stilbenes, and lignans, that are largely present in a glycosidic form (glycosides of
flavonoids, lignans, and stilbenes) or as esters (phenolic acids esterified to polyols
such as quinic acid).
These compounds are involved in a broad range of physiological and ecological
processes, ranging from recruitment of pollinators and seed dispersers, interactions
with pathogens, nitrogen-fixing bacteria and parasitic roots in the rhizosphere, control
of male fertility, UV-tolerance, antioxidant based defence, auxin transport, and
defence against microbes and grazers (Grotewold, 2006).
However the levels of phenolics differ among cultivars, maturity stages,
technological processes and storage.
The investigations to date indicate that chi gene activity appears to be key to flavonol
accumulation in tomato peel, whilst chs and fls activities are required for the
production of flavonols in flesh tissue. Therefore, it was reasoned that, to achieve
increased flavonol accumulation throughout the tomato fruit, ectopic expression of
three genes encoding the biosynthetic enzymes CHS, CHI and FLS would be

1. Introduction
13
sufficient. Indeed a cross harbouring these three genes accumulates increased levels
of quercetin‐glycosides in peel and kaempferol‐glycosides in flesh. It is also
noteworthy that a similar phenotype can be achieved by crossing tomatoes containing
Lc and C1 transgenes with tomatoes containing the CHI transgene. Accumulation of
phenolic compounds in plant tissues is a distinctive characteristic of plant stress. This
accumulation is due to an increased enzyme activity of phenylalanine ammonia lyase
(PAL), chalcone synthase (CHS), and other enzymes, activity of
phosphoenolpyruvate (PEP)-carboxylase also increases, suggesting a shift from
sucrose production to processes in support of defense and repair.
The control of the production of polyphenols involves a matrix of potentially
overlapping regulatory signals. These include developmental signals, such as during
lignification of new growth or the production of anthocyanins during fruit and flower
development, and environmental signals for protection against abiotic and biotic
stresses. For some polyphenols, such as the flavonoids, there is now an excellent
understanding of the nature of those signals and how the signal transduction pathway
connects through to the activation of the biosynthetic genes. The regulation of
flavonoid production occurs principally through changes in the transcription rate of
the biosynthetic genes. This is achieved through the action of transcriptionfactors
(TFs).
Central to the direct regulation of anthocyanin and proanthocyanidin (PA)
biosynthetic genes are core ‘MBW’ regulation complexes, comprising of specific
members of the R2R3MYB and basic helix-loop-helix (bHLH) TF families in
conjunction with a WD-repeat (WDR; tryptophan-aspartic acid (W-D) dipeptide
repeat) protein. Variant MBW complexes can form from different MYB and bHLH
components, and these can have different target genes and vary in their activation or
repression actions.
Outside of the anthocyanins, PAs and flavonols, there are only a few polyphenol
biosynthetic pathways for which TFs have been characterized. Most notably, the
regulation of lignin biosynthesis has been extensively studied in A. thaliana, and to a

1. Introduction
14
lesser extent the grasses (Gray et al., 2012; Zhao et al., 2011; Cheynier et al., 2013).
Also, it has been demonstrated that ethylene and other hormones can modulate the
intensity and the direction of regulative effects on metabolism and the final level of
phenolics in plant tissues. Several authors reported that the production of phenolic
compounds can be affected by exogenous treatments with ethylene and/or by biotic
and abiotic stresses, and that this effect could be mediated by ethylene responsive
elements (EREs) and MYB factors. Indeed, by using various Arabidopsis mutants, it
has been recently demonstrated that auxin and ethylene regulate flavonol biosynthesis
through MYB12-mediated signalling and that ethylene modulates flavonoid
accumulation in the roots.
The tomato fruit is an important source of phenolics. In general, the level of total
soluble phenols (TSP) has been reported twice higher in the exocarp than in the
mesocarp during all stages of ripening and it normally increases significantly in both
tissues during ripening, more pronouncedly in exocarp (Minoggio et al., 2003;
Kacjan et al., 2011). The TSP content has been reported to reach highest levels
(10.39 mg 100 g FW-1
; Carrillo-Lòpez and Yahia, 2013) in cherry-type. In addition to
the flavonoid naringenin chalcone that accumulates up to 1% dry weight of the
tomato fruit cuticle, various other flavonoids accumulate in tomato fruit such as rutin
(quercetin-3-rutinoside), kaempferol-3-O-rutinoside and a quercetin-trisaccharide.
Quercetin accumulates at level order of 10 μg gFW-1
(Hertog et al., 1993; Crozier et
al., 1997) and its actual concentration vary according to the genotype, the organ, the
developmental stage and the environment.
1.2.5 Carotenoids and colours
Carotenoids are the second most abundant naturally occurring pigments on earth,
with more than 750 members. They range from colorless to yellow, orange, and red,
with variations reflected in many fruits, and vegetables, which contribute to their
economic value as well. The colours of fruits and vegetables depend on conjugated
1. Introduction
15
double bonds and the various functional groups contained in the carotenoid molecule
(Rodriguez-Amaya and Kimura, 2004).
Naturally, most of the carotenoids occur as trans-isomer in plants. However, cis-
isomers may increase due to the isomerization of the trans -isomer of carotenoids
during food processing (Schieber et al., 2005). Heating at 60 °C and 80 °C favored
the isomerization of lycopene (Lee and Chen, 2002). However lycopene is
responsible for red colour while other carotenoids lead to yellow and orange colours.
The rate beetween different carotenoids is an important index in the colour definition
(Khoo et al., 2011).
Oltman and co-workers (2014) showed that one of the most determined attribute for
tomato purchase was colour: in three focus group most people liked dark-red
coloured tomatoes, with only a few people (<20%) mentioning they would not mind a
lighter red, or yellow, or orange colour.
Provitamin A carotenoids play essential roles in animals as precursors for the
synthesis of retinoid, retinol (vitamin A), retinal (main visual pigment), and retinoic
acid (which controls morphogenesis) (Fraser and Bramley, 2004; Krinsky and
Johnson, 2005). In humans, carotenoids also serve as antioxidants and reduce age-
related macular degeneration of the eye, the leading cause of blindness in the elderly
worldwide (Johnson and Krinsky, 2009; Fiedor and Burda, 2014). Lycopene, the
most abundant carotenoid in ripe tomato, has been involved in treating chronic
diseases and lowering risk of cancer and cardiovascular disease (Sandmann et al.,
2006; Ford and Erdman, 2012; Liu et al., 2015).
Chemically, carotenoids are mainly C40 lipophilic isoprenoids and can be divided in
two subgroups: xanthophylls (they present oxigen) and carotenes.
Carotenoids are synthesized in all photosynthetic organisms (bacteria, algae, and
plants), as well as in some non-photosynthetic bacteria and fungi. Carotenoids and
their oxidative and enzymatic cleavage products called apocarotenoids are crucial for
various biological processes in plants, such as assembly of photosystems and light
harvesting antenna complexes for photosynthesis and photoprotection, and regulation

1. Introduction
16
of growth and development (Cazzonelli and Pogson 2010; Ruiz-Sola and Rodrıguez-
Concepciona, 2012; Havaux, 2014; Nisar et al., 2015).
Apocarotenoids are also proposed to serve as signaling molecules and have been
implicated in the interactions of plants with their environment (Walter and Strack,
2011; Cazzonelli, 2011).
Carotenoids are formed and sequestered at very high levels in plastids, mainly
chloroplasts and chromoplasts (Egea et al., 2010). In green chloroplast-containing
tissues, carotenoid biosynthesis mostly takes place in the envelope and the thylakoid
membrane, and xanthophylls are predominantly produced to perform photosynthetic
functions (Deruere et al., 1994; Vishnevetsky et al., 1999; Joyard et al., 2009).
However, specific carotenoid in the form of lycopene crystalloid is accumulated at a
high level in membrane-shaped structures in chromoplast-containing tissues during
tomato fruit ripening accompanied by breakdown of the thylakoid membrane, the
appearance of carotenoid-containing crystalloids, the synthesis of new membranes of
sites of formation of carotenoid crystals, as well as an increase in the number and size
of plastoglobules (Harris and Spurr, 1969; Simkin et al., 2007). ZDS, LCY-B, and
two β-carotene β-hydroxylase proteins were detected in the proteome of pepper
(Capsicum annuum) plastoglobules, while ZDS was identified in the proteome of
tomato chromoplasts (Barsan et al., 2010).
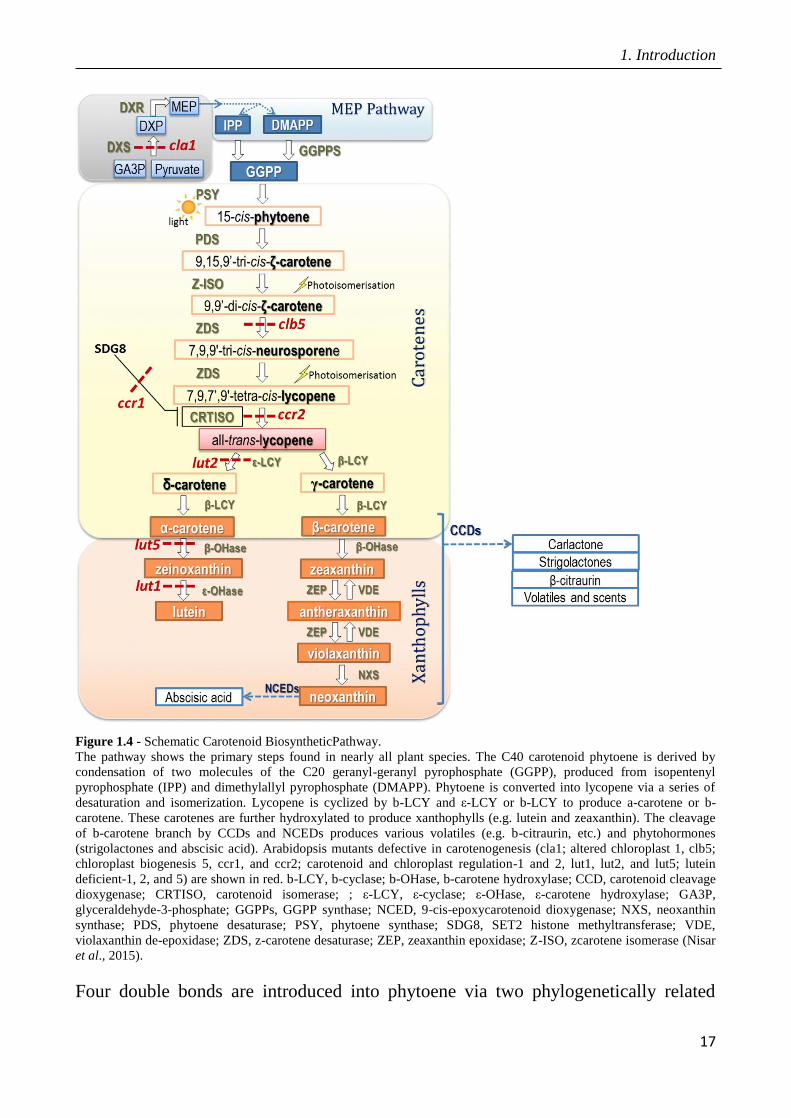
Carotenoid biosynthesis starts with the condensation of two geranyl-geranyl
pyrophosphate (GGPP) molecules by phytoene synthase (PSY) to form phytoene as a
15-cis isomer. There is only one PSY gene in Arabidopsis, while three tissue-specific
isoforms exist in tomato with PSY1, which contributes to carotenoid production in
tomato fruit (Fig. 1.4) (Bramley, 2002; Giorio et al., 2008).
1. Introduction
17
Figure 1.4 - Schematic Carotenoid BiosyntheticPathway.
The pathway shows the primary steps found in nearly all plant species. The C40 carotenoid phytoene is derived by
condensation of two molecules of the C20 geranyl-geranyl pyrophosphate (GGPP), produced from isopentenyl
pyrophosphate (IPP) and dimethylallyl pyrophosphate (DMAPP). Phytoene is converted into lycopene via a series of
desaturation and isomerization. Lycopene is cyclized by b-LCY and ε-LCY or b-LCY to produce a-carotene or b-
carotene. These carotenes are further hydroxylated to produce xanthophylls (e.g. lutein and zeaxanthin). The cleavage
of b-carotene branch by CCDs and NCEDs produces various volatiles (e.g. b-citraurin, etc.) and phytohormones
(strigolactones and abscisic acid). Arabidopsis mutants defective in carotenogenesis (cla1; altered chloroplast 1, clb5;
chloroplast biogenesis 5, ccr1, and ccr2; carotenoid and chloroplast regulation-1 and 2, lut1, lut2, and lut5; lutein
deficient-1, 2, and 5) are shown in red. b-LCY, b-cyclase; b-OHase, b-carotene hydroxylase; CCD, carotenoid cleavage
dioxygenase; CRTISO, carotenoid isomerase; ; ε-LCY, ε-cyclase; ε-OHase, ε-carotene hydroxylase; GA3P,
glyceraldehyde-3-phosphate; GGPPs, GGPP synthase; NCED, 9-cis-epoxycarotenoid dioxygenase; NXS, neoxanthin
synthase; PDS, phytoene desaturase; PSY, phytoene synthase; SDG8, SET2 histone methyltransferase; VDE,
violaxanthin de-epoxidase; ZDS, z-carotene desaturase; ZEP, zeaxanthin epoxidase; Z-ISO, zcarotene isomerase (Nisar
et al., 2015).
Four double bonds are introduced into phytoene via two phylogenetically related

1. Introduction
18
enzymes: phytoene desaturase (PDS) and z-carotene desaturase (ZDS). These
enzymes catalyze two symmetric dehydrogenation reactions converting 15-cis
phytoene to tetra-cis-lycopene. Both of these enzymes are encoded by single-copy
genes in tomato, grape and Arabidopsis. The all-trans isomer of lycopene in higher
plants demonstrates a requirement of specific isomerase enzymes. A carotenoid
isomerase (CRTISO) that is capable of isomerizing cis bonds at 7, 9 and 70, 90
positions has been demonstrated to convert tetra-cislycopene to all-trans-lycopene.
The cyclization of lycopene is a crucial step in carotenoid metabolism and generates
carotenoid diversity distinguished by different cyclic end groups: either the addition
of beta (b-ring) and/or epsilon (ε-type ring). These rings are generated by lycopene b-
cyclase (b-LCY) and lycopene ε-cyclase (ε-LCY), respectively (Cunningham et al.,
1993; Cunningham et al., 1996; Pecker et al., 1996; Ronen et al., 1999).
One route leads to b-carotene, zeaxanthin, violaxanthin, and neoxanthin, providing
precursors for the synthesis of ABA and strigolactones. The alternative pathway leads
to a-carotene and lutein.
Carotenoid accumulation is an outcome of its synthesis and degradation. A metabolic
equilibrium between biosynthesis and catabolism of carotenoids is essential for
maintaining their content and composition in photosynthetic tissues (Beisel et al.,
2010).
Tomato contains a complex mixture of bioactive components, serving as a dietary
source of nutrients, such as a mixture of carotenoids, including lycopene, b-carotene,
and lutein.
Abushita and co-authors (2000) analysed the lycopene content in twelve tomato
cultivars and observed that it ranged between 16-36 μg/100 gr of fresh weight.
Besides their functions as pigments and nutrients, carotenoids are also the precursors
of many important volatile flavor compounds in plants, conferring the sensory
attribute that can be detected by consumers (Vogel et al., 2010).
Some apocarotenoids have commercial value in the food and cosmetic industries as
aromas, flavors, and pigments (Giuliano et al., 2003).

1. Introduction
19
1.3 Drought stress
Drought is defined as “a marked deficiency of rain compared to that usually
occurring at the place and season under consideration” (Walker, 1999.
A distinction between drought and aridity occur: droughts usually last less than five
years (and mostly less than two), whereas persistent dry conditions lasting more than
a decade reflect a shift to aridity. (Alwynne and Beaudoin, 2002).
Among the abiotic constraints, drought is the first responsible that limits the global
productivity of major crops and, thus, it is among a major topics of plant research and
breeding.
A major challenge for current agricultural biotechnology is to satisfy an ever
increasing demand in food production facing a constantly increasing world
population that will reach more than 9 billion in 2050 (Godfray et al., 2010; Tester
and Langridge, 2010). This growing demand for food is paralleled by dramatic losses
of arable land due, among others to increasing severity of soil destruction by abiotic
environmental conditions and human activities. In particular drought and salinity are
the two major environmental constraints that adversely affect plant growth and
development and have a crucial impact on agricultural productivity and yields.
Drought is a consequence of water shortage, it is critical for crop production in large
agronomic areas worldwide and it is usually coped with extensive irrigations.
Although earth is rich in water, most water resources are highly salinized whereas
high quality fresh water that is suitable for irrigation is often extremely limited.
Accordingly, not only drought but also soil salinity becomes increasingly an
agricultural problem due to extensive spreading of agricultural practices as irrigation
(Flowers, 2004 ). These shortages in water suitable for irrigation are predicted to get
even worst as a consequence of global warming and population growth.
Plants develop a range of strategies to avoid or tolerate drought stress.
In the case of stress avoidance, plants maintain high water status either by efficient
water absorption from roots or by reducing evapo-transpiration from aerial parts.

1. Introduction
20
Drought tolerant plants maintain turgor and continue metabolism even at low water
potential, e.g. by protoplasmic tolerance or synthesis of osmoprotectants, osmolytes
or compatible solutes (Turner et al., 2001).
The initial period of drought stress or soil water-deficit induces stomatal closure to
reduce water loss by a process mediated by abscisic acid (ABA) (Leung et al., 1998;
Koornneef et al., 1982; Bartels et al., 1990).
Furthermore, the closed stomata decrease CO2 supply to the mesophyll cells so that
plant photosynthetic activity is also reduced (Barker et al., 2004; Mishra et al., 2012).
Drought tolerance is a polygenic trait that involves a cascade of responses ranging
from physiological changes to transcriptional regulation.
The adaptive mechanisms in response to drought in plants involve reduction in water
loss, reduction in radiation absorption, reduction in evaporation surfaces, and
lowering tissue water potential. Other adaptive mechanisms include maintaining cell
turgor pressure and reduction water loss by the accumulation of compatible solute
molecules such as betaine, proline, sorbitol, and so on (Seki et al., 2007).
Drought stress is not static; it can occur at any time during the crop growth, it can
vary in severity and it frequently occurs in conjunction with other environment
stresses, such as heat and salinity (Wheat, 2010).
Different tissues or organs of the plant will respond differently to drought stress and
the level of stress will fluctuate diurnally, high stress during peak photosynthetic
periods and low stress overnight (Wilkins et al., 2005). The nature of a plant response
will also vary greatly depending on whether the plant is entering stress for the first
time or after several exposures and whether they are recovering from stress after a
rainfall or irrigation event (Barbazuk et al., 2007).
Shinozaki and colleagues (2003) investigated the molecular response to drought by
microarray analyses in Arabidopsis and they classified responsive genes into two
groups. The first group includes genes coding for proteins that most probably
function in abiotic stress tolerance. These include molecules such as chaperones, late
embryogenesis abundant (LEA) proteins, osmotin, antifreeze proteins, mRNA-
1. Introduction
21
binding proteins, key enzymes for osmolyte biosynthesis, water channel proteins,
sugar and proline transporters, detoxification enzymes, and various proteases.
The second group is comprised of regulatory proteins, i.e. protein factors involved in
further regulation of signal transduction and stress-responsive gene expression.
These include various transcription factors (bZIP, WRKY, MYB, and AP2/EREBP),
protein kinases, protein phosphatases, enzymes involved in phospholipid metabolism,
and other signalling molecules such as calmodulin-binding protein. Many
transcription factor genes were stress inducible, suggesting that various
transcriptional regulatory mechanisms may function in regulating drought, cold, or
high salinity stress signal transduction pathways. These transcription factors could
govern expression of stress-inducible genes either cooperatively or independently.
In a recent work on tomato, when comparing differentially expressed genes under
drought stress, prominent genes could be identified in the drought-tolerant line as
compared to the susceptible line. The upregulated genes in the drought-tolerant line
were related to energy, plant hormones, and cation transporters (Sadder et al., 2014).
Orrellana and co-authors (2010) found that an AREB-type transcription factors,
SIAREB1, was correlated with the degree of drought and salt tolerance in transgenic
tomato. Its overexpression resulted in the activation of stress related genes leading to
an improved tolerance (Orellana et al., 2010).
In a study on abiotic tolerance in tomato, the gene SpUSP revealed to play a critical
role, especially in drought tolerance. It was related to an increase in ABA content,
suggesting that SpUSP has a function in regulating stomatal opening and thus
improves drought resistance by ABA (Loukehaich et al., 2012).
In another study where tomatoes underwent to different water stress treatment, an
increase in ascorbate peroxidase (APX) activity was specially noted in fruits at
mature green and breaker stages. SlAPXcyto and SlAPXt transcripts increased under
most water stress treatments in fruits at all development stages.
This increase in SlAPXcyto and SlAPXt transcripts was not correlated with changes
in APX activity, suggested a post-transcription regulation (Murshed et al., 2013).

1. Introduction
22
That being said, a reduction in fruit yield in soluble solids is expected as a
consequence of drought in tomato and this reduction would occur at a different
extend in susceptible and tolerant plants.
1.4 Genetic resources and QTLs
Fruit quality traits are very complex traits controlled by Quantitative Trait Loci
(QTL) including many genetic elements all potentially contributing to the expression
of the trait. QTLs share high “genotype x environment” interaction affecting
expression of the traits through various physiological and metabolic components.
Indeed, fruit quality traits are influenced by varietal differences, the nutritional
regime of plants, stage of ripening at harvest and post-harvest storage conditions. The
term QTL was coined by Gelderman (1975) to denote ‘a region of the genome that is
associated with an effect on a quantitative trait’.
The principles and various methodologies of QTL analysis have been reviewed by
various authors (Gupta, 2002; Mackay, 2004; Flint et al., 2005) However, it must be
stressed that all these methodologies rely on meiotic recombination among markers
and detection of the recombinants in the segregating mapping populations. For such
analyses, large population with accurate genotyping and phenotyping are required
(Keurentjes et al., 2011).
Traditionally, quantitative trait mapping studies in plants and animals involve whole
genome segregating populations, but epistatic interactions in F2 or recombinant
inbred lines (RILs) make it difficult to fully define and characterize individual loci.
Epistatic interactions and morphological traits represent only 5 % of the whole
genome.
Moreover multiple segregating quantitative traits loci (QTL) at the whole-genome
level tend to mask the effects of one another by introducing high variances in
statistical analyses. In sharp contrast, Introgression lines (ILs) ILs are identical for the

1. Introduction
23
entire genome except for a single introgressed region, and therefore all the
phenotypic variation in these lines is associated with the introduced segment.
Specifically, ILs are a set of nearly isogenic lines developed through a succession of
backcrosses, where each line carries a single marker-defined chromosome segment
from a divergent genome (Fig. 1.5; Zamir, 2001).
The principles of the IL approach were first demonstrated in tomato. Solanum
lycopersicum (the domesticated tomato) is one of the 17 core species in the tomato
clade. The small green-fruited desert species Solanum pennellii is a distant relative of
S. lycopersicum, having evolved unique adaptations in terms of morphology, mating
system, chemistry (especially secondary compounds) and responses to biotic/abiotic
stress. Despite these drastic ecological differences, S. pennellii is sexually compatible
and produces fertile hybrids with S. lycopersicum, making it the founding donor
parent of the first IL population used for interspecific QTL identification, cloning,
and plant breeding. Thus, to enhance the progress of tomato breeding, it has been
developed a population of 76 segmental ILs that are composed of marker-defined
genomic regions of the wild species S. pennellii (accession code LA716), substituting
for the homologous intervals of the cultivated variety M82 (S. lycopersicum; the
taxonomic classification of tomato in the genus Solanum is available in (Knapp et al.,
2004). The ILs that represent the entire genome partition the genetic map into 107
bins, which are defined by singular or overlapping segments (Liu et al., 2003).
Consequently, these populations are very effective in identifying and stabilizing
QTLs, because any phenotypic difference between an IL and the recurrent parent is
attributed solely to one or more donor parent genes within the introgressed
chromosomal segment (Lippman et al., 2007). The use of such targeted population
structures increased the identification power for QTL by several times in both plants
and animals (Eshed and Zamir, 1995; Singer et al., 2004).

1. Introduction
24
Figure 1.5 - Development of S. pennellii introgression lines. The ILs have been produced through successive
introgression backcrossing and marker-assisted selection to generate a set of recurrent parent lines with a single
homozygous introgressed segment. Sublines were obtained as the product of backcrossing selected introgressed lines
with M82, so generating smaller introgressed sections. The S. pennelli ILs thus subdivide the tomato genome into
107“bins” (Eshed and Zamir, 1995).

1. Introduction
25
1.5 Aims and scope
This thesis mainly aims at the development of new models of sustainable agriculture
based on crop management procedures with reduced levels of water restitution. To
achieve this general goal the research of this thesis has focused on the development
of new tomato genotypes that can reconcile a reduced yield loss and an increase of
the organoleptic and nutritional quality of food and derivative outcomes.
Specific objectives of this thesis are:
a) to survey the fruit quality variability within the most cultivated tomato hybrids;
b) to identify wild QTLs combining drought tolerance and higher fruit quality;
c) to assess the effects of reduced water restitution regimes in susceptible and
tolerant tomato plants on both the yield, the quality of fresh fruit, the stability
of the quality over post-harvest storage and the quality of the tomato sauce
derivative;
d) to dissect QTLs by transcriptomic approach for the identification of candidate
genes;
e) to develop markers for the QTL pyramiding in advanced tomato breeding lines.

2. Materials and methods
26
2. Materials and methods
2.1 Comparisons among commercial processing tomatoes
In order to understand how commercial processing tomatoes perform in terms of
nutritional quality, a set of cultivated hybrids were analysed.
These tomatoes, chosen for their features of productivity, disease resistance, shape
and colour were kindly provided by different seed companies (Tab. 2.1).
2.2 Tomato response to drought stimuli
2.2.1 Tomato breeding lines
Introgression lines (ILs) selected among the progenies from the initial S. pennellii x
S. lycopersicum hybridization, include a set of single marker-defined introgressed
genomic regions from the wild green-fruited species S. pennellii, native from the dry
Andean plateau (Acc LA0716), in the genomic background of the cultivated S.
Table 2.1 - Hybrid tomatoes cultivated in Eboli over the 2013 growing season. Hybrid Seed company Shape
Gordes Monsanto Round
6803 Heinz Round
5508 Heinz Round
Impact ISI Round
Gong ISI Round
Salsero Esasem Round
Pietrarossa Clause Round
Vulcan Nunhems Round
Perfectpeel (PS1296) Monsanto (Peto seed) Round
Docet Monsanto Elongated
Discovery ISI Elongated
Smart F1 ISI Elongated
Taylor F1 Nunhems Elongated
Dres Clause Elongated
2. Materials and methods
27
lycopersicum inbred variety M82 (Acc LA3475).
The genotypes used in this research were the tomato cv. M82 (Acc LA3475) and the
IL9adm whose seeds were provided by the Tomato Genetics Resource Centre
(TGRC) (http://tgrc.ucdavis.edu/), University of California (Davis, USA). The latter
is a subline selected at the University of Naples, deriving from the IL9-2-5, harboring
in the genomic context of the cv. M82, a homozygous DNA segment around 8 cM-
long from S. pennellii (starting from 28 and ending to 36 cM), located on
chromosome 9.
It was decided to use the IL9adm for this investigation because the parental IL9-2-5
was well-known for carrying a QTL controlling a high content in soluble solids
(Fridman et al., 2004). Moreover, it was shown to be tolerant to drought upon we
carried out experiments dedicated. The M82 represented the control.
2.2.2 Trials
Seeds exploited in all trials that took place during the summer 2013, were sown
directly in the alveolar plateau containing soil and compost and the seedlings were
grown under controlled condition in a suitable growth chamber (22°C with 16 h/8 h
daylight/dark).
Plants of commercial hybrids were transplanted in the field in Eboli (Salerno), where
they were grown in parcels, 20 plants in each one, according to an experimental
design fit a randomized complete block with three replications. The plants were
reared on the basis of local common agricultural practices.
Moreover, two different experiments were carried out in two next years to analyze
the response in terms of fruit yield and quality by both M82 and IL9adm under
controlled conditions of water supplied over the growth cycle. The first year-trial
(2013) was carried out in open field in Acerra (Naples), while the second year-trial
(2014) was arranged in tunnel at the University of Naples Federico II in Portici.

2. Materials and methods
28
For the experiment which took place in Portici, three plants for each of both
genotypes were transplanted in one out of twelve plastic lisymeters 60 centimeter
sized in diameter (Fig. 2.1). Two different level of irrigation regimes were imposed
on the basis of the volume of water lost, referred to the field capacity: restitution of a
volume capable of setting the full field capacity (100%) and half of the same volume
(50%).
The field capacity (FC) was estimated according to Rawl and Brakensiek (1985), as
follow:
FC = 0.3486 – 0.0018 x % sand + 0.0039 x % clay + 0.0228 x % organic matter/0.67
– 0.0738 x bulk density
The water loss was estimated by measuring the reduction of water content in the soil
relatively to the field capacity using the formula below:
{FC-[(FW-DW)/FW]} x (Vol + d) + p
Where FW represents the Fresh Weight of the soil collected 24 hours before the
water supply, DW is the Dry Weight after treating the soil for 24 hours at 105 °C in
the oven, Vol is the Volume of soil in the tank, d represents the soil density and p is
the estimation of water loss within 24 hours.
Water restitution treatments were applied starting since the time when the majority of
the plants showed fruit set on the first inflorescences (Fig. 2.1).

2. Materials and methods
29
In the experiment set up under irrigation controlled condition in open field, plots
containing twenty plants each, were arranged according to a randomized complete
block design with three replicates during the summer 2013 (Fig. 2.2).
Figure 2.1 – Experimental design inherent the trial aimed to study the tomato response to
controlled drought, carried out in the lisymeters in Portici during the growing season 2014.

2. Materials and methods
30
M82
M82
M82
M82
M82
M82
M82
M82
M82
M82
M82
M82
IL9adm
IL9adm
IL9adm
IL9adm
IL9adm
IL9adm
IL9adm
IL9adm
IL9adm
IL9adm
IL9adm
IL9adm
100%
50%
Plants from both M82 and IL9adm genotypes were supplied by two different water
restitution levels, the entire (100%) and half (50%) volume of evapotranspired (ET)
water.
The right volume of irrigation water was calculated upon estimating the daily value
of crop evapotranspiration (ETc). It was assessed upon the determination of the
potential evapotranspiration (ET0) using the FAO standard method based (paper 56)
on the Penman-Monteith (Allen et al., 1998) formula, which asks for measuring a
number of different meteorological parameters, such as wind speed at 2 meters above
the ground surface, the temperature, solar radiation and others, all evaluated as daily
mean values, monitored by a “watch dog” weather Station (Weather Vantage Pro2TM
,
Davis).
It was possible to calculate the ETc by using the equation ETc =k ET0, where k is a
suitable crop coefficient whose value for the tomato crop during the stage of fruit
development and set is estimated to be around 1.
The differential irrigation treatment was set out when the fruit set occurred among the
majority of the plants grown (Fig. 2.3).
Figure 2.2 – Experimental design adopted to study the tomato response to controlled drought, carried out in open field
conditions in Acerra during the growing season 2013.

2. Materials and methods
31
For all the three experiments, fruits were harvested at the red ripe stage. Intact fruit
were used for measuring both the firmness and the content in soluble solids.
Then, five to ten of whole fruits were longitudinally cut, seeds and locular jelly
removed, and flesh frozen by immersion in liquid nitrogen.
Frozen flesh bits were ground through a laboratory WARUING® Commercial
blender. Resulted powder was frozen in liquid nitrogen and stored at -80 °C until
starting the molecular and biochemical analyses.
Total RNA from both M82 and IL9adm genotypes grown under the two water supply
regimes during the two next growing seasons were purified, and a functional genomic
analysis was carried out exploiting the microarray method to detect the set of genes
responsive to drought in two different genetic background.
For that purpose three different biological replicates were taken into account for each
of both genotypes undergoing the two water treatments and fruits were processed
according to method above described before extracting total RNA.
2.3 Morphological and physiological analyses
Figure 2.3 – The differential water restitution started since fruit set stage in Acerra experimental plots (2013). The
volume of irrigation water was calculated upon estimating the ET0 by a “Watch-dog” weather station.

2. Materials and methods
32
In order to compare relevant aerial and hypogeal traits of plants from both M82 and
IL9adm with the main purpose to get a fine morpho-physiological characterization
for them, different assays were conducted.
In particular, on plants grown under water deficit and normal irrigation conditions, a
desiccation test were performed to analyze the water loss rate, while the actual
relative content of water (RWC) was measured in the leaves.
A root screening based on biometrical evaluations, was carried out on 45-day plants
at flowering stage, grown in a hydroponic system.
2.3.1 Desiccation test
Desiccation trials were carried out on a representative number of plants. Water Loss
Rate (WLR) in a short and a long period and Relative Water Content (RWC) were
evaluated. Plants having similar leaf size were selected within each genotype and
used for dehydration treatment; well-watered seedlings of the same genotypes were
collected and used as control. Leaves were collected periodically and Fresh weight
(FW) was immediately recorded (time 0). Then they were placed on dry filter paper
for 24 h at 4°C and the weight (W 24) was measured again. Total dry weight (DW)
was recorded after drying for 24 h at 80° C. The water loss rate for the long period
was measured as described by Suprunova et al. (2004) using the formula:
WLR (g h-1
g-1
DW) = (FW-W24)/(DW X 24).
While for the short period, WLR was calculated for each time point using the
equation:
WLR (g h - 1
g - 1
DW) = [(FTx – F Tx+2) X 60] / [DW X (Tx+2-Tx)].
The time [Tx (min); x=0] at which the blades of fully expanded first leaves were first
weighed was considered as 0 min (T0=0 min). The leaf blades were weighed five
times. The time of each measurement (min) was recorded as time Tx where x = 2, 4, 6
and 8 (every 2 h), 2 indicating the time of the first measurement and 8 indicating the

2. Materials and methods
33
A B
time of the last measurement. Total dry weight (DW) was recorded after drying for
24 h at 80° C.
2.3.2 Relative water content survey
The RWC was measured according to Suprunova et al. (2004) using the formula:
RWC (%) = [(W-DW) / (TW-DW)] x 100
Where, W represents the sample fresh weight, TW is the sample turgid weight after
24 h socked under water and DW is the sample dry weight after 24 h at 80°C in the
oven.
2.3.3 Reliefs on root traits
Three plants for each of both M82 and IL9adm genotypes, were grown in a tank
filled with a mineral nutrient water solution (Fig. 2.4). Plants floated on water surface
due to perlite stones which allow us to extract integral roots. Among the diverse
traits, the length of taproot was measured and first order roots were counted. The root
biomass was also evaluated.
Figure 2.3 – Hydroponic system set up to measure different root traits in both M82 and IL9adm plantlets 15 (A)
(A) and 30 days old (B).

2. Materials and methods
34
2.4 Physical and chemical analyses on fruits and leaves
2.4.1 Content in soluble solids
The mesocarp from ripe fruit was squeezed and the content in soluble solids of the
resulting juice measured on a refractometer ATAGO Model ATC-1.
The contents in soluble solids were expressed on a °Brix scale. For each genotype the
average of 10-20 measures was considered.
2.4.2 Fruit firmness
The firmness value of tomatoes was determined by using a T.R. TURIONI
penetrometer. A probe was applied at as many as possible points on the fruit equator,
the displacement of the compressing probe on the fruit was recorded in terms of
pressure (N mm-2
), and the average of 10-20 measures were used for each genotype.
2.4.3 Dry matter
Most of the results of our analyses were obtained on a dry weight basis. To this
purpose 10 grams (three replicates) of fruit powder were weighed and get dried in the
oven at 85 °C for 24 hours. The dry matter weight was estimated using the formula:
% DM= (C-T)/B-T x 100, where, “T” is the tare, “B” represents the tare + the fresh
weight and “C” the tare + the dry weight.
The tomato humidity was evaluated as difference: % H2O = 100 – DM

2. Materials and methods
35
2.4.4 Specific gravity
The specific gravity was measured by putting tomato fruits in a graduated cylinder
filled with a known level of water. Then we registered the water level variation which
was equal to the tomato volume. The tomato weight was previously measured.
2.4.5 Colorimetric assay
Sauces were produced from mature fruits in collaboration with the Experimental
Station for the Preserved Food (SSICA) located in Angri (Salerno) through exploiting
a pivotal processing system.
Color was checked from the sauces using a Minolta apparatus giving tristimulus
coordinates L*, a*, and b* at SSICA laboratories.
2.4.6 Assay on hydrogen peroxide content
The level of hydrogen peroxide in the fruits, the related processed products and
leaves was measured according to Baptista et al. (2001).
A volume of 0.75 ml of 0.1% w/v TCA was added to 0.25 g of ground sample and
homogenized by using mortar and pestle.
The mix was transferred to a 1.5-ml eppendorf tube and incubated 10 min on ice.
Samples were next centrifuged (15,000 x g for 15 min at 4°C) and an aliquot of 0.5
ml from the supernatant was added to 0.5 ml of 10 mM phosphate buffer (pH 7.0)
and 1.0 ml of 1 M KI.
After a gentle mix, the absorbance was read for 1 min at 405 nm wavelenght using
250 μl of the reaction mixture by a proper spectrophotometer (Victor).
In order to quantify the H2O2 content a calibration curve (R2 > 0.99) was taking into
account using solutions with H2O2 aliquots whose concentrations were known.

2. Materials and methods
36
Results were expressed as μmol H2O2 g-1
fresh weight (FW). The blank probe
consisted of 0.1% w/v TCA in the absence of tissue extract.
2.4.7 Assay on ascorbic acid content
Ascorbic acid (AsA) levels were measured using the procedure described by
Kampfenkel et al. (1995) and modified according to Di Matteo (2010). Frozen tissue
(250 mg) was placed in a 1.5-ml tube with a bead and 200 μL of cold 6%
trichloroacetic acid (TCA) (Sigma), and was homogenized for two times at 50 Hz in
a TissueLyzer (Qiagen) for 1 min. Samples were then incubated on ice for 10 min
and centrifuged for 25 min at 25,000 × g at 4°C. A proper volume of 6% TCA was
added to the supernatant up to a total volume of 500 μl, and samples centrifuged as
above for 10 min.
Two different assays were performed to evaluate the content of both total (tot AsA)
and reduced (AsA) ascorbic acid. The absorbance was read at 525 nm using water as
reference with a UV spectrophotometer (Beckman DU-640).
For determining tot AsA, three different replicates of a volume of 20 μl of each
sample were placed in three corresponding wells in a 96-well plate. To reduce
oxidized form a volume of 20 μl of 5 mM DTT (diluted in 0.4 M Phosphate buffer,
pH 7.4) was added. Samples were incubated for 20 min at 37 °C. A volume of 10 μl
of N-ethyl maleimide (0.5% v/v NEM) was added to the reaction that subsequently
was mixed and kept for 1 min at room temperature. Then 80 μl of color reaction were
added to each sample and an incubation 40 min-long took place at 37 °C.
The coloring solution was obtained by adding 2.75 part of A solution and 1 part of B
solution. The A solution was made of 31% orthophosforic acid (H3PO4), 46% v/v
TCA, 0.6% v/v ferric chloride, while the B solution contained 4% 2,2-dipyridyl
diluted in 70% ethanol.
To ascertain the content of AsA, a volume of 20 μl of sample was examined by three
different replicates. A volume of 20 μl of phosphate buffer (pH 7.4) and 10 μl of
water were added to each sample. Subsequently, 80 μl of color reaction (composed as

2. Materials and methods
37
previously described) were added to samples and incubated for 40 min at 37 °C. Both
total and reduced AsA concentrations were expressed in terms of mg per 100 g of
FW, upon calculating standard curves designed over a dynamic range from 0 and 100
nmol AsA. The equations used for calculating both total and reduced AsA content
were, Y (Abs) = 0.0118x - 0.0222 and Y (Abs) = 0.0115x - 0.023, respectively (R2 >
0.99).
2.4.8 Assay on content in total phenolics
The amount of total phenolic compounds was determined according to Folin-
Ciocalteu’s procedure (Singleton and Rossi, 1965). A volume of 1 ml of 60%
methanol was added to 250 mg of ground tissue in a 1.5 ml-tube containing a bead.
Samples were homogenized twice in a Tissue Lyzer (Qiagen) at 50 Hz for 1 min.
Extracts were next placed on ice for 3 min in the dark and vortexed. The extract was
transferred in a 15 ml tube and a final volume of 5 ml was set by adding 60%
methanol. Samples were centrifuged at 3,000 x g for 5 min. An aliquot of 62.5 l of
the supernatant was mixed to 62.5 μl of Folin-Ciocalteu’s reagent (Sigma), and 250
μl of deionized water and the resulting mix incubated for 6 min.
After addition of 62.5 l of 7.5% sodium carbonate and 500l of deionized water,
samples were incubated for 90 min at room temperature in the dark. Absorbance was
measured at 760 nm. The total phenolics concentration was expressed in terms of μg
of gallic acid equivalents per mg of FW, based on a gallic acid standard curve
designed over a dynamic range from 0 to 125 nmol, by exploiting the equation Y
(Abs) = 0.0234x– 0.0776 (R2 > 0.99).
2.4.9 Assay on flavonoid content

2. Materials and methods
38
Flavonoids were extracted and analyzed as previously described by Zhishen and co-
authors (1999) with slight modifications. In particular, 5 ml of 80% methanol were
added to 0.5 g of fresh, powdered tissue in dark conditions.
The mix was homogenized by using mortar and pestle, transferred to a 15 ml-tube
and undergone to sonification for 20 min. Samples were then vortexed and stored 5
min on ice in the dark.
A volume of 2 ml of the extract were taken and centrifuged for 5 min at 14,000 rpm
in a 4 °C pre-cooled centrifuge.
An aliquot of 100 l was collected and analysed in triplicate. For that goal, a volume
of 400 μl of deionized water and subsequently 30 μl of 5% NaNO2 were added.
Afterwards, the mixture was incubated for 5 min.
Thereafter, a volume of 30 μl of 10% AlCl3 was added and the mixture incubated for
6 min. Finally, a volume of 200 μl of 1 M NaOH and 240 μl of deionized water were
added and the mix absorbance was measured in the Victor spectrophotometer at 490
nm wavelength. Total flavonoid content was expressed as mg of quercetin
equivalents (QE) per 100 g FW, upon creating a suitable set of standard curves (R2 >
0.99) linking the absorbance and the concentrations of quercetin.
2.4.10 Analysis of carotenoids by High Performance Liquid Chromatography
(HPLC)
About 0.1 g of freeze-dried fruit tissue were weighed and homogenized in liquid
nitrogen. A tiny spatula spoon of CaCO3 and the same amount of PVPP were mixed
to the sample. It was extracted with 1 ml of pure acetone and transferred in a 1.5 ml-
tube. It was centrifuged 5 min, 13,000 rpm at 4°C. This operation was repeated once
more with the same volume of acetone and the supernatant was collected and stored
at –20 °C until required. Samples were centrifuged and filtered before the injection in
the HPLC. Carotenoid pigments were analyzed by RP-HPLC using ternary gradient
elution and a Symmetry C18 column (4.6 x 150 mm I.D., 3.5μm) from Waters. The

2. Materials and methods
39
chromatography system was equipped with a Shimadzu LC-10AT VP solvent
delivery system and SPD-M 10° VP photodiode array detector (DAD). The mobile
phase consisted of acetonitrile:methanol:ethyl acetate containing 0.05% triethylamine
flowing at 0.8 ml/min. A gradient was applied from 88:8:4 to 48:26:26 in 25 min, and
back to the initial condition (30 min). Volume injection was 20 μl. Detection was at
the wavelengths of maximum absorption (max plot).
2.4.11 HPLC with UV detection coupled with electrospray ionization tandem mass
spectrometry (MS/MS) assays
An amount of freeze-dried fruit tissue ranging from 0.1 to 0.15 g was ground with
liquid nitrogen. Then, samples were homogenized with 1 ml of 100% methanol and
transferred into a 1.5 ml-tube. After the centrifugation (5 min, 13,000 rpm at 4°C) the
supernatant was poured in an amber eppendorf and the volume recorded. Thereafter,
the supernatant was stored at -20 °C until required (at most for one week).
Samples were previously filtered and then loaded into the HPLC/UV- ESI MS MS
analysis system (Shimadzu Prominence LC-20AD with a detector UV/VIS coupled
with a mass spectrometer Applied Biosystems/MDS Sciex 3200 Qtrap equipped with
a source of ionization for the Electrospray Turbo VTM). Table 2.2 shows the HPLC
gradient imposed in the experiment, while Tab. 2.3 illustrates the source condition.
Table 2.2 - HPLC gradient for phenolic compounds analysis. Time (min.) Conc. A(%) Conc. B(%)
0.10 95 5
10.0 95 5
40.0 5 95
50.0 5 95
55.0 95 5
60.0 95 5
2. Materials and methods
40
2.4.12 Assay on the antioxidant activity: ORAC
With the aim to evaluate the total antioxidant activity extant in tomato tissues, an
assay based on the Oxygen Radical Absorbance Capacity (ORAC) was performed.
Upon weighing and homogenizing 50 mg of freeze-dried tomato fruit, a volume of
500 μl of 80% methanol was added and the mixture incubated for 1 h at room
temperature.
The preparations of reactives were made abiding by the following protocols:
Phosphate buffer pH 7.4
It was composed by two different A and B phosphate salts:
A. 13.064 g/100 ml (0.75 M) K2HPO4
B. 8.999 g/100 ml (0.75 M) NaH2PO4
Fluorescein (87 μM) (Fluorescein sodium salt - Sigma)
A quantity of 1.64 mg of fluorescein was dissolved into a final volume of 50 ml using
phosphate buffer pH 7.4. Then, it was poured in an eppendorf tube wrapped in
aluminium paper at 4 °C.
Trolox standard
A stock solution concentrated 1,000 mg/l was prepared in 95 % ethanol. A series of
dilution were prepared.
A volume amounting to 100 μl of the samples was added into the wells in triplicate
(the same as the blank).
Fluorescein was added in the injector 1 and the reactive AAPH 35 mM was added in
the injector 2.
Table 2.3 - Conditions exploited for the source. Cur gas 20 psi
CAD gas Medium
Gas 1 60 psi
Gas 2 30 psi
Ionization voltage 4500 V (positive polarization) -4500 V (negative polarization)
Temperature 380 °C

2. Materials and methods
41
All the reactives needed to stay at 37 °C for the analysis. The experiment was
designed using the software Gen5.
The Orac activity was referred in terms of trolox equivalent.
2.5 Shelf life
An experiment focused on assessing the quality extent upon harvesting and during
the conservation time, better known as “shelf life”, was carried out exploiting the
mature fruits harvested at the red ripe stage from the open field trial hold in Acerra
experimental plot during the growing season 2013, in order to figure out how a
reduced restitution of irrigation water would affect the fruit quality components.
A number of fruits from both M82 and IL9adm were stored in a glass jar covered
with a transpirant film at 20 °C.
Every week, fruits were carefully weighed with the aim to evaluate the loss in fresh
weight and the set of fruits displaying a low firmness were discarded. Once that the
weight was recorded, fruit were cleaned with a water bleach solution to avoid rots.
2.6 Tomato breeding
2.6.1 Plant material
With the goals to set up new tomato lines getting QTLs (Quantitative Trait Loci)
from the wild S. pennellii capable of ameliorating both drought tolerance and fruit
nutritional quality traits, four different advanced tomato lines, P011_156, P011_58,
P011_85 and P011_77 (Fig. 2.4) were used as parents in a breeding program
involving the IL9adm as source of the wild QTLs.
The above mentioned advanced breeding lines were selected at the University of
Naples “Federico II” because of in agronomic trials carried out over different

2. Materials and methods
42
growing seasons exhibited good agronomic performances. Furthermore, the
mentioned tomato line displayed to be superior in comparison to several commercial
tomato varieties in other important traits, such as amount of lycopene, firmness, yield
and resistance to pathogens.
2.6.2 MAS based-breeding activities
The mentioned advanced tomato breeding lines (TBLs) were used as recurrent
parents (acceptors) in a back-cross breeding (BC) scheme where IL9adm represented
the initial parental donor of the wild QTLs (Fig. 2.5).
Figure 2.4 – Advanced breeding lines exploited as recurrent parents in a back-cross breeding scheme
for transferring dissected superior QTLs from the wild S. pennellii in the tomato genetic background.

2. Materials and methods
43
According to a BC scheme, upon the initial cross IL9adm x TBL, the resulting F1
plant were permitted to come to selfing producing F2 plants. Starting from this F2
generation, the plants of interest containing remarkable QTLs are used to pollinate
cyclically the recurrent parent over the next BC generations with the double aims to
establish in the genetic background of the acceptor line the desired QTLs and to
increasingly reduce the segment of initial wild introgression. To finely map the alien
QTLs within the introgression 9adm and drive the selection of desired genotypes
taking those QTLs through exploiting a MAS (Marker Assisted Selection) approach,
CAPS (Cleaved Amplified Polymorphic Sequences) markers have been developed
spanning the wild introgression at intervals of around 1 cM, being able to give
reliable DNA amplicons differently sized evidencing polymorphism between wild
and cultivated genotypes. In order to detect primer pairs capable of displaying CAPS
polymorphism, PCR amplicons from both the advanced tomato breeding lines and
IL9adm were sequenced, and restriction enzymes discriminating the two different
parental lines were selected, upon identifying either SNP (single nucleotide
Polymorphism)- or chromosomic-based polymorphisms occurring in the restriction
Figure 2.5 – A breeding program based on a back-cross scheme was set off implying the IL9adm as donor parent
for wild dissected superior QTLs and four different advanced tomato breeding lines (P011_58, P011_77,
P011_85 and P011_156) as acceptors for those QTLs.

2. Materials and methods
44
sites. We designed six different primer pairs (Tab. 2.4 and Tab. 2.5) mapping
throughout the 9adm genomic region. These markers were used to identify hybrid F1
genotypes (harbouring alleles from both parents) as well as genotypes belonging to
the different next BC generations getting the wild QTLs. Instead, plants without any
wild introgression were not selected.
Seedlings were transplanted in 20 cm diameter pots and grow up in a cold
greenhouse.
Leaves were collected from one month old plantlets and DNA extracted by using the
“DNA plant mini kit” (Qiagen) according to manufacturer’s instructions. The DNA
was exploited as template for CAPS analyses and detect the plants harbouring the
alien QTLs.
At each BC cycle, flowers of plants from selected recurrent breeding lines were
emasculated at the upcoming flowering stage by removing stamen. Then, the isolated
stigma were artificially pollinated by wiping grain pollen dust collected from donor
genotypes on their surface.
2.7 Molecular analysis
Table 2.4 – List of CAPS markers used in the MAS-breeding capable of distinguishing wild
and cultivated QTLs.
Marker Amplicon length (bp)
M82 IL9adm
TG223 1,200 1,200
TC217592 1,163 1,156
TC238140 1,026 1,036
DB708941 1,344 1,293
TC235285 1,172 1,184
TC227407 1,000 1,000

2. Materials and methods
45
2.7.1 RNA purification
Total RNA was isolated from homogenized powdered tomato flesh fruit stored at -80
°C according to Griffiths and co-workers’ procedure (1999). An amount of 4 g of
frozen powder were added to 12 ml of Extraction Buffer (Solution A) and an equal
volume of phenol/chloroform (Solution B) in an Oakridge tube. Tubes were
vigorously shaken and then centrifuged at 10,000 rpm (15 min at RT). The
supernatant was recovered, added to 15 ml of Solution B in a clean Oakridge tube,
vigorously shaken and the mix centrifuged at 10,000 rpm (15 min at RT). Hence, a
volume of 11 ml of the aqueous phase was transferred to a clean Oakridge tube and
the nucleic acid was precipitated for 1 h at -20°C with the addition of 27.5 ml of ice-
cold pure ethanol and 1.1 ml of 3 M sodium acetate (pH 6.0). RNA was next pelletted
by centrifuging at 10,000 rpm (15 min, 4 °C) and the pellet washed in 70% ethanol.
Upon dissolving the pellets in 2 ml of DEPC-treated water by vortexing the tubes, 2
ml of 2X cetyltrimethylammonium bromide (CTAB) Extraction Buffer (Solution C)
and 4 ml of CTAB Precipitation Buffer (Solution D) were added and the mixture
centrifuged at 12,000 rpm (30 min at RT). The resulting pellet was re-suspended in
400 ml of 1.4 M NaCl and precipitated again at -20 °C (for 1 h to over-night) by the
addition of 1 ml of ice-cold pure ethanol. The samples were then centrifuged at max
speed (10 min, 4 °C), the pellets washed in 500 ml of 70% ethanol, re-dissolved in
400 ml of DEPC-treated water and incubated at 50 °C for 5 min. The RNA was next
extracted twice by adding a volume of 400 ml of phenol/chloroform (Solution B).
Thereafter, the nucleic acid was precipitated in 0.1 volume of 3 M sodium acetate
(pH 6.0) and 3 volumes of ice-cold 100% ethanol at -20 °C (for 1 h to over-night).
The samples were washed with 500 ml of 70% ethanol. The pellet was re-dissolved
in 180 μl of DEPC-treated water and the remaining DNA was eliminated by treating
the specimen with 1 μl of RQ1 DNase (Promega), working in 20 μl of RQ1 DNase
Reaction Buffer (Solution E). The mixture was incubated at 37 °C for 30 min.
The purity of the RNA was determined using a Bio Rad SmartSpec 3000

2. Materials and methods
46
spectrophotometer and integrity was confirmed using the AGILENT 2100 Nano
Bioanalyzer with RNA 6000 nano chip.
RNA Extraction Buffer (Solution A)
6% (w/v) 4-aminosalicylic acid
1% (w/v) 1,5-naphthalenedisulphonic acid
50mM Tris-HCl pH 8.3
5% (w/v) Phenol Solution
Phenol Solution
100 g Phenol crystals
14 ml m-cresol
0.1 g 8-hydroxy-quinoline
30 ml DEPC-treated water
Phenol/Chloroform Solution (Solution B)
500 g Phenol crystals
0.5 g 8-hydroxy-quinoline
500 ml Chloroform
20 ml Iso-amyl alcohol
200 ml 100mM Tris-HCl pH 8.0
2X CTAB Extraction Buffer (Solution C)
1.4 M NaCl
2% (w/v) CTAB
0.1 M Tris-HCl pH 8.0
20 mM EDTA pH 8.0
CTAB Precipitation Buffer (Solution D)
1% CTAB (w/v)
50 mM Tris-HCl pH 8.0
10 mM EDTA pH 8.0
10X RQ1 DNase Reaction Buffer (Solution E)
400 mM Tris-HCl pH 8.0
100 mM MgSO4
10 mM CaCl2
2.7.2 DNA purification

2. Materials and methods
47
DNA extraction was performed starting by leaf tissue samples collected from
seedlings 20-30 day old and frozen in liquid nitrogen, using the commercial kit
DNeasy ® Plant Mini Kit (QIAGEN) according to manufacturer’s instruction.
Briefly, 80-100 mg of powdered tissue were homogenized with 400 l of AP1 lysis
buffer and 4 l of RNase A in a 1.5 ml-microfuge tube. The resulting mixture was
shaken and incubated for 25 min at 65 °C.
At the end of incubation, a volume of 130 l of extraction buffer P3 was mixed to the
initial mixture by pipetting up and down and upon incubating the final mix on ice for
15 min, a centrifugation 7 min-long took place at max speed and RT.
The supernatant was recovered and loaded onto a QIA shredder filtering column and
centrifuged again for 2 min at max speed and RT.
Afterwards, the flow-through were moved into a new 1.5 ml-microfuge tube and the
DNA precipitated by mixing the aqueous phase with 1.5 vol. of Washing buffer I.
The solution was next loaded onto a silica column able to hold the DNA. A
centrifugation 1 min-long taking place at 8,000 x g and RT allowed to clean the DNA
from remaining contaminants. The silica cartridge was next washed twice with 500 l
of Washing buffer II.
Eventually, the DNA was eluted in a final volume of 100 L of elution buffer by
centrifuging the silica cartridge at 8,000 x g and RT and evaluated in terms
concentration and purity by using a spectrophotometer (Implen).
2.7.3 Sequencing DNA polymorphic regions for MAS based-breeding
DNA amplification was carried out by PCR using specific primer pairs designed on
several gene sequences spanned throughout DNA region corresponding to the 9adm
introgression on tomato chromosome 9 and deposited in GenBank and DFCI. PCR
products were purified by the QIAquick PCR Purification Kit (Qiagen) according to
manufacturer’s instructions. Amplified DNA fragments were sequenced using the
BigDye® Terminator Cycle Sequencing Kit v.3.1 based on the Sanger method. Each
2. Materials and methods
48
sequencing reaction took place in a final volume of 10 l using 20 ng of amplified
and purified DNA, 1.5 l of BigDye buffer (containing gligerine and TRIS base), 1
l of 3.3 pmol/l unique primer, 1 l of Ready Reaction 2.5X BigDye and a proper
volume of mQ sterilized water.
Upon an initial DNA denaturation at 95 °C 5 min-long, 35 amplification cycles came
as follow: 95 °C for 30 sec, 50 °C for 10 sec and 60 °C for 4 min with final
temperature decrease to 0 °C. The reactions were carried out into a Verity
thermocycler (Life Technologies)
Thereafter, samples were purified using Big Dye® XTerminator TM Purification Kit
Applied Biosystems. The products of the sequencing reaction were loaded on a
capillary sequencer ABI PRISM 3130 Genetic Analyzer with a length of 36 cm,
using POP-7 Polymer and the sequences were elaborated by the related Sequencing
Analysis v2.0 instrumental software.
The sequence analysis aimed to detect useful polymorphism was performed by the
use of SeqScape v2.1 software (Life Technologies). Finally the detection of
polymorphic restriction sites was made by exploiting the Webcutter tool from the
Internet (http://rna.lundberg.gu.se/cutter2/).
2.7.4 CAPS analysis
An amount of 50 ng of DNA template was amplified by PCR in a final volume of
100 l consisting in 20 l of 5X Reaction buffer, 16 l of 1.25 mM dNTPs, 5 l of
both forward and reverse primers and 0.5 of 5U l-1
Taq DNA polymerase (GO Taq,
Promega).
Upon denaturing DNA at 95 °C for 3 min, 30 amplification cycles were carried out
according to the temperature profile over the time: 95 °C for 1 min, Ta (Tab. 2.5) for
30 sec and 72 °C for 30 sec with a final temperature decrease to 4 °C. The reactions
were carried out into a Verity thermocycler (Life Technologies).

2. Materials and methods
49
Table 2.5 - Details of CAPS marker primer pairs used in the MAS based-breeding program.
Marker Chromosome
SL2.40 Forward Reverse
Ta
(°C)
TG223 2779001-
2781500 GGGTCGTAAACTCGCACATT CTTGCAATCCTGCTTCTTCC
52
TC217592 2837901-
2840400 GAGTCGGAGCAAGACCACTC CGCGGGAATAGAAGTATGGA
50
TC238140 2931165-
2930896 AAGCAGCAGCACTACAAGCA ATTGTGAGGACCGACACACA
55
DB708941 3068101-
3070600 TCCCTAGTGGCAAATCTTGG CGCGGCTATGAGAAATGAAT
55
TC235285 3271995-
3270698 GTAGCATGCCTCAAGCACAA GATGCTGGCCTTGGTACATT
55
TC227407 3350429-
3351298 AGCTCTCCGCGTAAATTCAA ATCGTTTCACGAACGAATCC
55
TC217240 3477087 -
3479900 TGATCCTAGATGGGCTGACC TCCAGGATTCGTCTCTGCTT
57
TC225638 3516931 -
3517854 TGATTTTAGAGCCCCTGTGC TCATGATCTCCATTGCCAAA
55
TC188748 3680901 -
3681807 TTACATACACACGGCAACACA TCTGGGAGAAGGGAGAGAAA
57
TC230608 3714701 -
3717900 GGAACTGCTCAGCCAACTTC TCGTGCCTGTAAAACTGTGC
57
The products from PCR were next digested by exploiting one of the different
restriction enzymes selected whose recognized sites was detected to be polymorphic.
The final reaction volume was 20 l containing the specific restriction enzyme (1 l),
the related 10X buffer (2 l) and 15 l of PCR product. The reaction lasted 2-3 h at
the enzyme optimal temperature.
The products of digestions were run in a 1.0% agarose gel electrophoretic dyed with
the SYBR Safe (Life Technologies) fluorescent color and visualized by the GelDoc
(BioRad) acquisition image.
2.7.5 Microarray analysis

2. Materials and methods
50
Chip TomatoArray1.0 was synthesized on CombiMatrix platform at University of
Verona. This chip had 90k silicon electrodes that support 20,200 DNA probes
synthesized in situ with 4 replicates, each randomly scattered in the array to evaluate
variability of the experiment. Each probe was composed of oligonucleotides, made
up of 30-35 nucleotides, designed to be specific for the different Tentative Consensus
(TC) tomato sequences from TIGR (The Institute for Genomic Research) S.
lycopersicum Gene Index Release 11.0 (2006). As negative controls, 9 probes
provided by CombiMatrix were exploited.
Three replicates of hybridization were done for both M82 and IL9adm in the two
experimental conditions of complete and half restitution of water lost, adding up a
total of twelve hybridizations. In particular, each biological replication exploited total
RNA isolated from fruits that came from a single plant. After hybridization and
washing, the microarray platform was dipped in imaging solution, covered with
glassy LifterSlip™, and then scanned using a ScanArray 4000XL (Perkin Elmer) and
the accompanying acquisition software (ScanArray Express Microarray Analysis
System v4.0). The resulting TIFF images were processed to extract raw data using
the CombiMatrix Microarray Imager Software v5.8.0. Signal probe medians and
standard deviations were imported into the SPSS software (IBM), and normalization
was achieved by correcting each probe median based on the ratio between the median
of the array and the average median of arrays. Following normalization and quality
control, data were log2 transformed. Finally, probe signals with a variability
coefficient higher then 0.5 as well as spikes and factory probes were filtered out.
Also, probes with signal intensities in the upper most and lower most 10% of values
were eliminated.
2.7.5.1 Statistical and bioinformatic analyses

2. Materials and methods
51
The signal differentially expressed between the two experimental condition of full
and partial water restitution in each genotype, were identified by using a Student’s t-
test built in TMEV (TIGR Multiple Experiment Viewer, Saeed et al., 2003) software
(version 4.4.0). In particular to compare transcriptional profile showed by each
genotype in both water regimes, a significance threshold of P< 0.05 was chosen
coupled with a 1,000 re-sampling based-bootstrap (Tusher et al., 2001).
Tentative Consensus sequences that showed a different expression profile were
utilized as input in Blast2GO bioinformatic tool (Conesa et al., 2005) in order to get
an automatic high-throughput annotation, gene ontology mapping and categorization
of TCs.
To analyze the co-regulation among signals differentially expressed a hierarchical
clustering was generated by using the CoExpression software, using a Pearson
correlation with a threshold of 95%.
2.7.5.2 Experimental validation by RT-qPCR
TC expression profiles of genes considered to be key in controlling the major steps
for AsA accumulation in tomato fruit (GDP-mannose pyrophosphorolase, Vtc2,
Modehydroascorbate reductase and Dehydroascorbate reductase) in response to
drought stress were validated by real-time quantitative RT-PCR (Tab 2.6) in a
7900HT Fast Real-Time PCR System (Applied Biosystems).
Amplification was performed in 12.5-μL reaction volume starting from the cDNA
synthesized from total RNA using the SuperScript III H-Reverse Transcriptase (Life
Technologies) in a Power SYBR® Green PCR Master Mix (Applied Biosystems).
Relative quantification was achieved by the ΔΔCt method (Livak et al. 2001). Primer
pairs were designated using Primer Express software (v 2.0).
Primer pairs were validated using a standard curve over a suitable dilution range
(R2>0.98 with a slope close to -3.3). For each TCs three biological replicates for

2. Materials and methods
52
treatments were considered and for each experiment three technical replicates were
performed.
As calibrator was used M82 at 100% water treatment and as internal control
endogenous gene Elongation Factor 1 (EF1).
PCR primers were designed using the Primer3 Plus software available at
http://www.bioinformatics.nl/cgi-bin/primer3plus/primer3plus.cgi/.
Sequences for RT-qPCR primers were retrieved from the Universal Probe Library
Assay Design Center (http://www.roche-applied-science.com) if available, or
alternatively designed ad hoc by using Primer express software version 3.0 (Applied
Biosystems). Sequences were processed by ABI PRISM SeqScape software.

3. Results
53
3 Results
3.1 Field screening of tomato hybrids for fruit quality
Hybrid tomatoes expressed an average level of total soluble solids of 4.43 ± 0.19
(mean ± standard error) °Brix, ranging between 4.05 ± 0.05 for Gordes and 4.70 ±
0.11 for Perfect Peel (Fig. 3.1). The post hoc Duncan’s test revealed five
homogeneous subgroups. In particular, the subgroup with the highest fruit SSC mean
includes Perfect Peel, Heinz 6803, Discovery, Docet, Gong, Pietrarossa, Smart,
Salsero and Dres whereas the subgroup with the lowest SSC mean level includes
5508, Gong, Gordes, Impact, Taylor and Vulcan.
Figure 3.1 - Fruit Soluble Solids Content in 14 tomato hybrids. Same letters stand for differences statistically not
significant at Duncan’s post hoc test (P<0.05).
Fruit firmness in the tomato hybrids is reported in the Figure 3.2. The average fruit
firmness was 31.12 ± 3.47 N ∙ mm-2
, with Heinz 6803 performing the highest
firmness (36.35 ± 0.91 N ∙ mm-2
). The Duncan’s post hoc test allowed hybrids to be
a a,b a,b,c a,b,c,d a,b,c,d a,b,c,d,e b,c,d,e b,c,d,e b,c,d,e
c,d,e d,e d,e d,e e
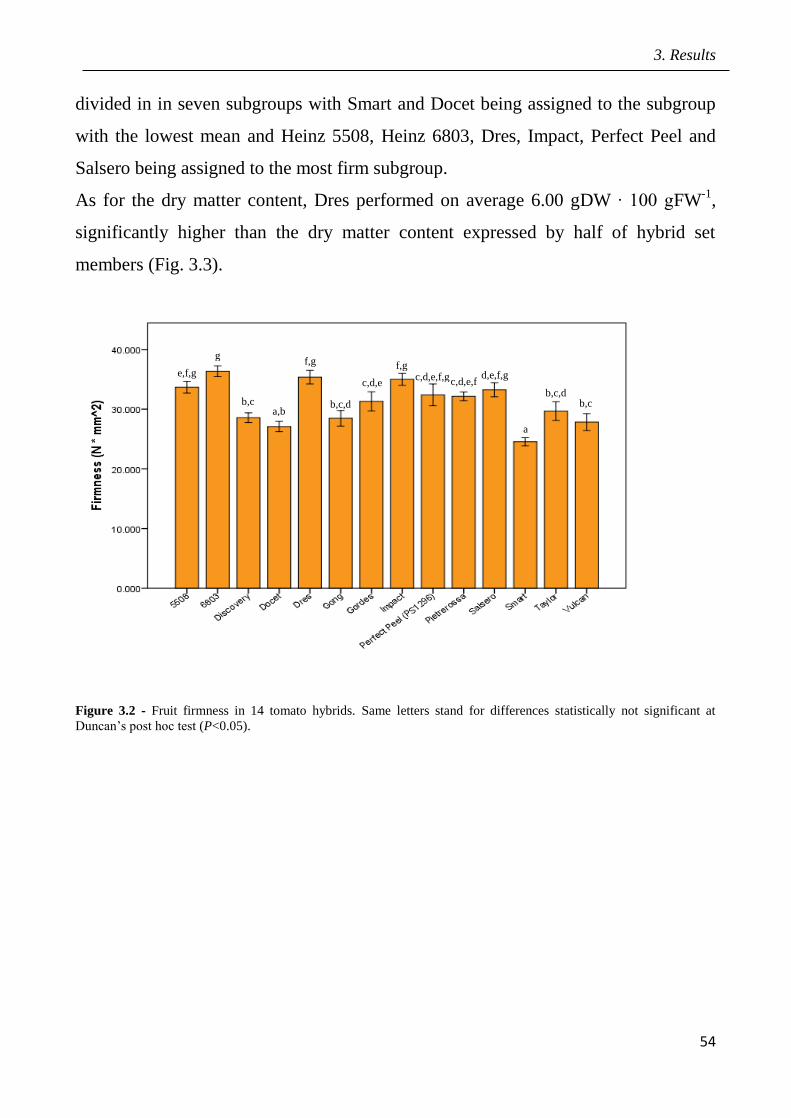
3. Results
54
divided in in seven subgroups with Smart and Docet being assigned to the subgroup
with the lowest mean and Heinz 5508, Heinz 6803, Dres, Impact, Perfect Peel and
Salsero being assigned to the most firm subgroup.
As for the dry matter content, Dres performed on average 6.00 gDW ∙ 100 gFW-1
,
significantly higher than the dry matter content expressed by half of hybrid set
members (Fig. 3.3).
Figure 3.2 - Fruit firmness in 14 tomato hybrids. Same letters stand for differences statistically not significant at
Duncan’s post hoc test (P<0.05).
a
a,b b,c b,c b,c,d
b,c,d c,d,e c,d,e,f c,d,e,f,g d,e,f,g e,f,g
f,g f,g g

3. Results
55
Figure 3.3 - Dry weight in 14 tomato hybrids. Same letters stand for differences statistically not significant at Duncan’s
post hoc test (P<0.05).
Details on fruit levels of analysed antioxidants within the hybrid set are reported in
the Table 3.1. In terms of total ascorbic acid, Vulcan and Pietrarossa showed the
highest concentrations with 35.4 ± 1.05 and 35.31 ± 2.69 mg ∙ 100 g-1
on a fresh
weight basis, respectively. The average fruit content in phenolics ranged from 8.50
mg of gallic acid equivalent ∙ 100g FW-1
of Taylor to 38.33 mg of gallic acid
equivalent ∙ 100g FW-1
in Heinz 6803 (Tab. 3.1).
A low variability was observed among hybrids in terms of flavonoids and carotenoids
content. In fact, the flavonoid concentration ranged beetwen 6.83 ± 0.62 mg of
Pietrarossa and 5.72 ± 0.07 mg of Quercetin Equivalent (QE) 100 g FW-1
for Dres.
As for the carotenoid content in the hybrids, Discovery performed with the highest
average level (83.04 ± 2.96 μg ∙100 g FW-1
). For both traits, the fruit levels in
flavonoids and those in carotenoids, significant differences among hybrids were not
observed at Duncan’s post hoc test (Tab 3.1).
a a a
a a, a a
b
a,b a,b
a,b a,b a,b
a,b

3. Results
56
In order to describe performances of the tomato hybrids in terms of all the quality-
related variables, the Principal Component Analysis was used to extract four
components explaining about 88% of the overall variability. Components 1 and 2 and
components 3 and 4 are plotted each one against the other in Figure 3.4. The
component 1 mainly accounted for the variability in the level of total AsA and
flavonoids. The component 2 mainly described variability in firmness, dry weight
and the content of phenolic compounds. The component 3 was associated to the fruit
level of phenolic compounds and carotenoids, while the component 4 accounted for
the SSC. The fruit shape well discriminate genotypes in the bidimensional space
component 1/2.
Within the round shaped tomatoes, Perfect Peel performed higher scores particularly
for components 1, 2 and 4. On the other hand, Docet had more equilibrate scores on
all four components within the group of elongated hybrids.
Table 3.1 - Levels of antioxidant compounds in tomato fruit harvested from hybrids grown in the
field trial at Eboli over the 2013 growing season.
Tot AsA
(mg ∙ 100 g FW-1
)
Phenolics
(mg GAE ∙ 100 g FW-1
)
Flavonoids
(mg QE ∙ 100g FW
-1)
Carotenoids
(μg ∙ g FW
-1)
Genotype Mean SE Mean SE Mean SE Mean SE
Heinz5508 27.70a,b
1.39 27.67b,c
4.05 6.44a 0.55 58.66
a 6.52
Heinz6803 29.13a,b,c
1.14 38.33c 1.86 6.52
a 0.18 79.69
a 0.17
Discovery 25.24a,b
2.06 27.33b,c
2.67 5.79a 0.17 83.04
a 2.96
Docet 27.45a,b
2.55 28.50b,c
2.50 5.99a 0.65 63.57
a 1.50
Dres 27.60a,b
1.73 27.50b,c
0.50 5.72a 0.07 60.07
a 10.91
Gong 28.81a,b,c
2.25 22.00b 4.73 6.16
a 0.15 63.54
a 12.64
Gordes 27.90a,b
0.17 23.50b 7.50 6.48
a 0.24 64.06
a 7.21
Impact 31.55b,c
2.13 29.33b,c
2.60 6.07a 0.05 66.10
a 6.93
PerfectPeel 31.09b,c
2.58 33.00b,c
6.11 6.56a 0.22 67.17
a 3.54
Pietrarossa 35.31c 2.69 30.00
b,c 3.51 6.83
a 0.62 64.70
a 1.98
Salsero 24.93a,b
2.19 28.66b,c
4.91 6.24a 0.37 73.63
a 4.71
Smart 29.12a,b,c
1.20 20.33b 1.86 6.71
a 0.23 60.07
a 13.98
Taylor 22.57a 0.44 8.50
a 2.50 5.94
a 0.52 60.50
a 1.89
Vulcan 35.40c 1.04 26.00
c 3.21 6.04
a 0.37 58.87
a 7.47

3. Results
57
Figure 3.4 – Graphical representation of fruit quality-related performances of 14 field-grown hybrids based on the
Principal Component Analysis. The component 1 was associated to the level of total AsA and flavonoids, the
component 2 to firmness, dry weight and the content of phenolic compounds, the component 3 to the fruit level of
phenolic compounds and carotenoids, while the component 4 to SSC.
3.2 Plant response to drought in open field
In the framework of a research activity carried out in the Laboratory of Functional
Genomics and Breeding at the University of Naples Federico II since the 2012 the
introgression 9-2-5 from the wild Solanum pennellii has been dissected and stabilized
in a number of sub-ILs in order to fine-map overlapping QTLs. Within this set of
sub-ILs, the IL9adm harbouring an homozygous wild introgression of ca 9 cM from
the marker TG223 to the marker TC227407 (details on molecular marker used in this
thesis will be given in the section 3.3), was selected based on preliminary results
indicating an higher drought tolerance. Therefore, in order to prove a differential
physiological response to drought in the IL9adm controlled by the wild introgression,
the IL9adm was compared in its performances to the parental line M82 in a filed trial.
This trial was carried out in the 2003 at Acerra (Naples, Southern Italy) and involved
two different water treatments, the one providing plants with all the evapotranspired
water (namely 100%) and the other one with the 50% of that volume (namely 50%).
The figure 3.5 illustrates changes in the relative water content (RWC) in leaves from
M82 and IL9adm at 100% and 50% water restitution treatments. Although no

3. Results
58
significant effects of the genotypes were observed (Tab 3.2), the ANOVA revealed a
statistical significant reduction (from 89 % to 79 % and from 88 % to 84 % in M82
and IL9adm respectively) in leaf RWC due to 50% reduction of the water restitution
(Tab. 3.2). The different response of M82 and IL9adm to a reduced water restitution
in terms of RWC is confirmed by a significant interaction “Genotype x Water
restitution” (Tab. 3.2).
Figure 3.5 – Leaf Relative water content in M82 and IL9adm grown under two different water level restitutions. The
RWC was evaluated two weeks before fruit harvesting.
Table 3.2 - ANOVA statistics for leaf RWC in M82 and IL9adm grown under two
different water level restitutions.
Source of variability F P
Genotype 3.79 0.09
Water restitution 39.91 3.3 ∙ 10-4
Genotype x water restitution 7.36 0.03
In order to confirm the higher drought tolerance of the IL9adm and investigate on
leaf physiological mechanisms supporting its differential drought response, plants
from the field trial in Acerra were used to estimate the loss of water over the time

3. Results
59
from young 10 cm-long shout detached from the mother plant (Fig. 3.6). The water
loss rate (WLR) was evaluated after 2 h, from 2 to 4 h, from 4 to 6 h and from 6 to 24
h and expressed as g water ∙ h-1
∙ g-1
DW. IL9adm showed a lower WLR in both water
treatments over all time points with the exception of the last two time points for the
50% water treatment. As for the 100% treatment, after 2 h a WLR of 0.33 ± 0.001 g ∙
h-1
∙ g-1
DW was recorded for IL9adm which subsequently decreased up to 0.08 ±
0.004 from 6 to 24 h. On the other hand, the IL9adm grown with a 50% water
treatment performed a WLR ranging from 0.27 ± 0.03 to 0.07 ± 0.001. The ANOVA
test confirmed that the WLR was significantly affected both by the genotype, the
water treatment and decreased along with time points (Tab. 3.3).
Figure 3.6 – Shoot water loss rate (WLR) in M82 and IL9adm plants grown under two different water restitution levels.

3. Results
60
Table 3.3 - ANOVA statistics for water loss rate (WLR) in M82 and IL9adm plants grown under
two different water restitution levels.
Source of variability df F P
Genotype 1 42.46 6.5 ∙ 10-7
Water restitution 1 44.17 4.7 ∙ 10-7
Time point 3 337.49 6.2 ∙ 10-21
Genotype x water restitution 1 3.45 0.07
Genotype x time point 3 3.30 0.04
Water restitution x time point 3 2.50 0.08
The differential amplitude of response in leaves of M82 and IL9adm to a reduced
water restitution regime was also confirmed by analysing the leaf hydrogen peroxide
level (Fig. 3.7). In particular, the reduction of the water restitution increased the leaf
level of H2O2 and the increase was far higher in M82 than IL9adm.The ANOVA test
allowed to identify the genotypes, the water treatment and the interaction genotype x
water treatment as significant source of variation (Tab 3.4).
Figure 3.7 – Leaf hydrogen peroxide level in M82 and IL9adm grown under two different water restitution levels.

3. Results
61
Table 3.4 – ANOVA statistics to evaluate effects of genotype and water restituion levels on leaf
hydrogen peroxide.
Source of variability F P
Genotype 5.40 0.07
Water restitution 20.59 0.01
Genotype x water restitution 9.46 0.03
3.3 - Effects of drought on yield and fruit quality in open field
Yield performances for both M82 and IL9adm plants undergone to 100% and 50%
water treatments are reported in Table 3.5. In particular, performances are expressed
as marketable yield, total yield, scrap fruit, unripe fruit, % of unripe out of scrap fruit,
soluble solids in marketable yield and soluble solids in total yield.
IL9adm performed a marketable yield of 1.90 kg ∙ plant-1
under 100% water
restitution treatment, very close to that performed by M82, 2.11 kg ∙ plant-1
. By
contrast, when the 50% of water restitution treatment was applied the marketable
yield decreased up to 1.19 ± 0.15 kg ∙ plant-1
and 1.32 ± 0.004 kg ∙ plant
-1 in M82 and
IL9adm, respectively. According to the ANOVA (Tab. 3.6), the genotype was a
significant source of variability for total yield, scrap fruit, unripe tomatoes and total
yield of soluble solids. The latter was significantly affected by the water treatment.
The marketable yield was not significantly affected by the genotype, but it reduced
significantly when the lower water treatment was applied.
Only the unripe/scrap ratio showed a significant interaction “genotype x water
treatment”.

3. Results
62
Table 3.5 - Mean and standard error (SE) for yield parameters recorded on M82 and IL9adm grown
under two different water restitution levels (100% and 50%) in Acerra over the 2013 growing
season. M82 IL9adm
100% 50% 100% 50%
Mean SE Mean SE Mean SE Mean SE
Marketable yield
(kg ∙ plant-1
) 2.11 0.17 1.19 0.15
1.90 0.19 1.32 0.004
Total yield
(kg ∙ plant-1
) 2.55 0.12 1.53 0.15
2.90 0.14 1.81 0.004
Total scrap
(kg ∙ plant-1
) 0.44 0.07 0.33 0.01
1.00 0.25 0.49 0.002
Unripe
(kg ∙ plant-1
) 0.28 0.06 0.09 0.02
0.86 0.25 0.36 0.007
Unripe out of Scrap
(%) 62.46 5.32 28.16 6.33
84.68 4.52 73.23 1.46
Marketable yield in SS
(g ∙ plant-1
) 96.67 5.01 66.45 4.17
107.04 6.29 88.83 5.88
Total yield in SS
(g ∙ plant-1
) 117.97 4.12 82.26 4.59
163.89 3.77 119.49 5.29
Table 3.6 – ANOVA statistics to evaluate effects of genotype and water restitution levels on yield
features.
Source of variability Dependent variable F P
Genotype Marketable yield 0.09 0.77
Total yield 6.82 0.03
Scrap 7.77 0.02
Unripe 10.98 0.01
Unripe/Scrap 49.78 1.0 ∙ 10
-4
Marketable yield of soluble solids 1.02 0.34
Total yield of soluble solids 22.39 1.0 ∙ 10
-3
Water restitution Marketable yield 25.79 1.0 ∙ 10-3
Total yield 76.09 2.3 ∙ 10
-5
Scrap 5.707 0.04
Unripe 7.133 0.03
Unripe/Scrap 23.014 1.0 ∙ 10
-3
Marketable yield of soluble solids 10.461 0.01
Total yield of soluble solids 41.598 1.9 ∙ 10
-4
Genotype x water restitution Marketable yield 1.274 0.29
Total yield 0.071 0.78
Scrap 2.355 0.16
Unripe 1.511 0.25
Unripe/Scrap 5.742 0.04
Marketable yield of soluble solids 0.458 0.52
Total yield of soluble solids 0.337 0.58

3. Results
63
The effect of drought in both M82 and IL9adm on yield performances was
comparatively expressed as Blum indexes that is the percentage loss of the specific
yield parameter (Fig. 3.8). The Student's t test coupled with 2000 bootstrapping re-
sampling confirmed significant differences (P<0.05) between M82 and IL9adm for
all the considered yield parameters except for the “unripe fruit”. In particular, the
reduced water restitution decreased the marketable yield of 49.45 ± 0.23 % in M82
and of 30.68 ± 0.23 % in IL9adm with a significant higher reduction of scrap in the
drought tolerant genotype.
Figure 3.8 - Blum indexes for yield parameters. * statistically significant difference between M82 and IL9adm at
Student's t test coupled with 2000 bootstrapping re-sampling.
Main chemico-phisycal properties of tomato fruits and their statistics are summarized
in table 3.7 and table 3.8.
The specific gravity was not significantly affected by both the genotype and the water
restitution level although it was higher in IL9adm in the 50% treatment.
On the other hand the SSC was significantly higher in the tolerant genotype and, as
we could expect, it was affected by the water restitution level (P<0.05; Tab. 3.8).

3. Results
64
Finally, the firmness was significantly increased in the 50% water restitution
treatment (Tab. 3.8).
Table 3.7 – Fruit chemico-phisycal properties in M82 and IL9adm growen at two different water
restitution levels in the field at Acerra over the 2013 growing season.
Variabiles
M82
IL9adm
100% 50%
100% 50%
Mean SE Mean SE
Mean SE Mean SE
Specific gravity
(g ∙ ml-1
) 0.98 6.0 ∙ 10
-3 0.98 1.0 ∙ 10
-3
0.97 0.01 0.99 3.0 ∙ 10
-3
Soluble solids content
(°Brix) 4.82 0.14 5.44 0.05
5.50 0.20 6.15 0.15
Firmness (N ∙ mm-2) 31.09 0.90 34.35 0.73
28.28 1.43 33.92 0.89
Table 3.8 – ANOVA statistics for specific gravity, soluble solid content (SSC) and firmness.
Source of variability Dependent variable F P
Genotype Specific gravity 0.26 0.62
SSC 22.37 1.2 ∙ 10
-3
Firmness 2.51 0.15
Water restitution Specific gravity 4.44 0.07
SSC 18.93 2.0 ∙ 10
-3
Firmness 18.87 2.0 ∙ 10
-3
Genotype x water restitution Specific gravity 0.45 0.52
SSC 0.01 0.91
Firmness 1.36 0.28
As for the content in antioxidants, the level of AsA in fruit at red ripe stage is
reported in the table 3.9. According to the ANOVA test, the only source of
significant variation was the genotype an igher level f AsA in red ripe fruit from the
tolerant IL9adm (Tab. 3.10).
Table 3.9 - Mean and standard error AsA content (mg ∙ 100g DW-1
) at red ripe stage (RR).
M82 IL9adm
100% 50% 100% 50%
Mean SE Mean SE Mean SE Mean SE
516.55 12.01 547.34 18.57 588.90 19.62 556.88 12.45

3. Results
65
Table 3.10 – ANOVA statistics to evaluate effects of genotype and water restitution levels on
the level of AsA at red ripe stage (RR).
Source of variability F P
Genotype 5.59 0.05
Water restitution 1.1 ∙ 10-3
0.97
Genotype x water restitution 3.29 0.11
As for phenolics, the level recorded in fresh red ripe fruit and relevant statistics are
summarized in the Table 3.11 and Table 3.12. Due to the high variability was
observed, both genotype and water restitution level were not significant source of
variation according to ANOVA test.
Table 3.11 – Mean and standard error for the level of total phenolics (mg GAE ∙ 100g DW-1
) at
red ripe stage (RR).
M82
IL9adm
100%
50%
100%
50%
Mean SE Mean SE Mean SE Mean SE
620.15 108.35
617.60 96.81 532.18 74.40
498.67 6.90
Analysis of the total level of flavonoids in red ripe fruit revealed an average content
of 138.08 ± 9.56 and 129.33 ± 7.37 mg of quercetin equivalents (QE) per 100 g DW-1
in M82 and IL9adm, respectively, when a complete restitution of lost water (100%)
was operated (Tab. 3.13). Neverthless, the total flavonoids concentration was not
significantly affected by the genotype, the water treatment and their interaction (Tab.
3.14).
Table 3.12 – Effects of genotype and water restitution levels on total phenolic compounds at red
ripe stage (RR) atANOVA test.
Source of variability F P
Genotype 1.60 0.24
Water restitution 0.05 0.83
Genotype x water restitution 0.04 0.85

3. Results
66
Table 3.13 - Mean and standard error of of total flavonoids (mg QE ∙ 100 g DW-1
) at
red ripe stage (RR).
M82
IL9adm
100%
50%
100%
50%
Mean SE Mean SE Mean SE Mean SE
138.08 9.56
129.30 10.56 129.33 7.37
114.73 12.08
Table 3.14 – ANOVA statistics to evaluate effects of genotype and water restitution levels
on fruit total flavonoid concentration at red ripe stage (RR).
Source of variability F P
Genotype 1.35 0.28
Water restitution 1.35 0.28
Genotype x water restitution 0.08 0.78
In order to gain a separation of individual molecules of the phenolics pool, an
HPLC/UV - ESI MS MS approach and most abundant fractions are reported in table
3.15 while their ANOVA statistics are summerized in table 3.16.
The most rapresentative flavonoid was the rutin, ranging between 133.06 ± 16.71 of
IL9adm 100% WR and 209.04 ± 24.75 μg g DW-1
. On the other hand, phenolic acids
were mostly represented by chlorogenic acid and, at a far lower extend, by caffeic
acid (Tab. 3.15). With the exception of chlorogenic acid, rutin, quercetin and caffeic
acid significantly increased their levels in response to a lower water restitution rate
(Tab. 3.16).
Table 3.15 - Tomato phenolic compounds detected by HPLC/UV- ESI MS MS analysis in
M82 and IL9adm red ripe fruit under two water restitution level. M82 IL9adm
100%
50%
100%
50%
Mean SE Mean SE Mean SE Mean SE
Rutin
(μg g DW-1
) 163.41 14.33 208.24 29.03 133.05 16.71 209.04 24.75
Quercetin
(μg g DW-1
) 0.77 0.16 1.42 0.14 1.01 0.07 1.79 0.12
Caffeic acid
(μg g DW-1
) 0.24 0.03 0.31 0.05 0.28 0.03 0.40 0.03
Chlorogenic
acid
(μg g DW-1
)
15.76 2.45 12.14 0.84 15.72 2.32 17.92 1.33
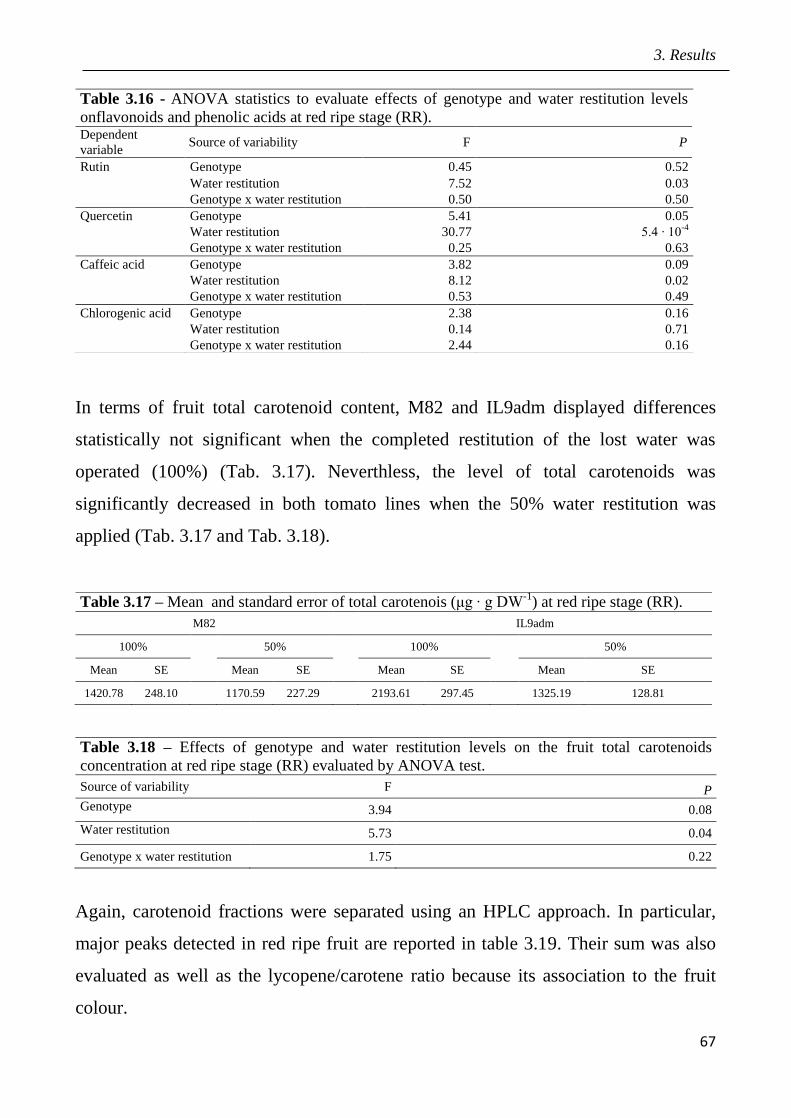
3. Results
67
In terms of fruit total carotenoid content, M82 and IL9adm displayed differences
statistically not significant when the completed restitution of the lost water was
operated (100%) (Tab. 3.17). Neverthless, the level of total carotenoids was
significantly decreased in both tomato lines when the 50% water restitution was
applied (Tab. 3.17 and Tab. 3.18).
Table 3.18 – Effects of genotype and water restitution levels on the fruit total carotenoids
concentration at red ripe stage (RR) evaluated by ANOVA test.
Source of variability F P
Genotype 3.94 0.08
Water restitution 5.73 0.04
Genotype x water restitution 1.75 0.22
Again, carotenoid fractions were separated using an HPLC approach. In particular,
major peaks detected in red ripe fruit are reported in table 3.19. Their sum was also
evaluated as well as the lycopene/carotene ratio because its association to the fruit
colour.
Table 3.16 - ANOVA statistics to evaluate effects of genotype and water restitution levels
onflavonoids and phenolic acids at red ripe stage (RR). Dependent
variable Source of variability F P
Rutin Genotype 0.45 0.52
Water restitution 7.52 0.03
Genotype x water restitution 0.50 0.50
Quercetin Genotype 5.41 0.05
Water restitution 30.77 5.4 ∙ 10
-4
Genotype x water restitution 0.25 0.63
Caffeic acid Genotype 3.82 0.09
Water restitution 8.12 0.02
Genotype x water restitution 0.53 0.49
Chlorogenic acid Genotype 2.38 0.16
Water restitution 0.14 0.71
Genotype x water restitution 2.44 0.16
Table 3.17 – Mean and standard error of total carotenois (μg ∙ g DW-1
) at red ripe stage (RR).
M82 IL9adm
100%
50%
100%
50%
Mean SE Mean SE Mean SE Mean SE
1420.78 248.10 1170.59 227.29 2193.61 297.45 1325.19 128.81
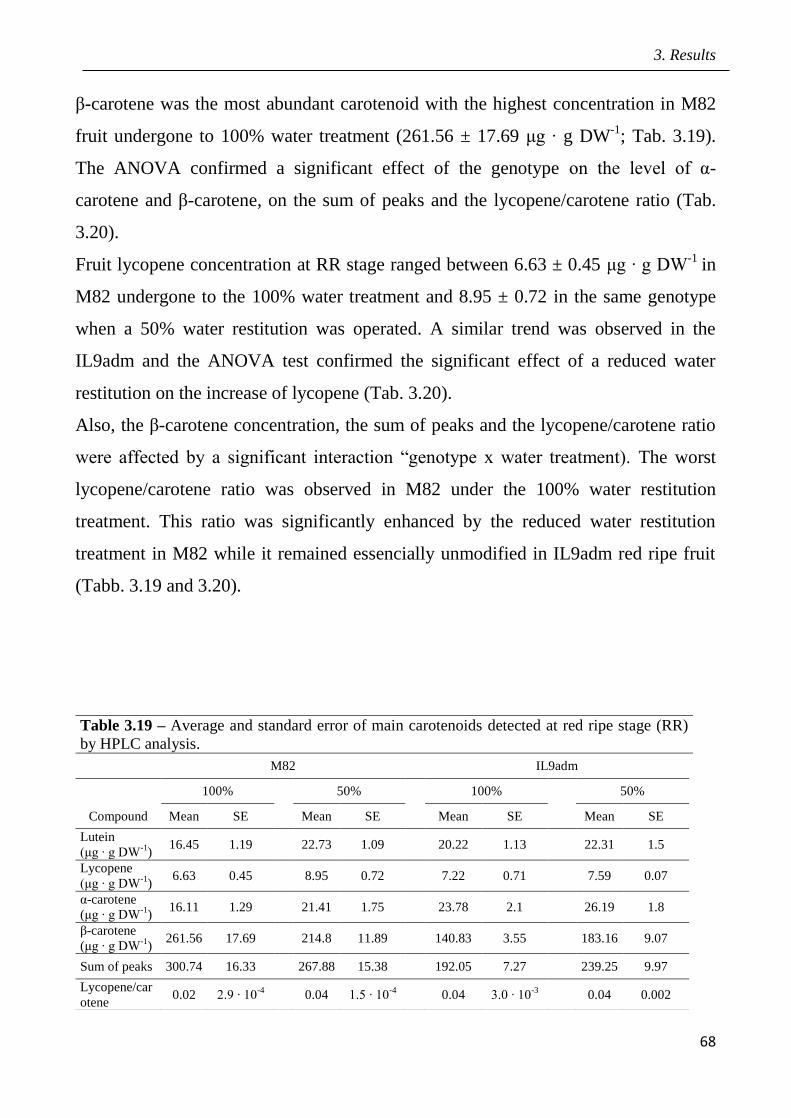
3. Results
68
β-carotene was the most abundant carotenoid with the highest concentration in M82
fruit undergone to 100% water treatment (261.56 ± 17.69 μg ∙ g DW-1
; Tab. 3.19).
The ANOVA confirmed a significant effect of the genotype on the level of α-
carotene and β-carotene, on the sum of peaks and the lycopene/carotene ratio (Tab.
3.20).
Fruit lycopene concentration at RR stage ranged between 6.63 ± 0.45 μg ∙ g DW-1
in
M82 undergone to the 100% water treatment and 8.95 ± 0.72 in the same genotype
when a 50% water restitution was operated. A similar trend was observed in the
IL9adm and the ANOVA test confirmed the significant effect of a reduced water
restitution on the increase of lycopene (Tab. 3.20).
Also, the β-carotene concentration, the sum of peaks and the lycopene/carotene ratio
were affected by a significant interaction “genotype x water treatment). The worst
lycopene/carotene ratio was observed in M82 under the 100% water restitution
treatment. This ratio was significantly enhanced by the reduced water restitution
treatment in M82 while it remained essencially unmodified in IL9adm red ripe fruit
(Tabb. 3.19 and 3.20).
Table 3.19 – Average and standard error of main carotenoids detected at red ripe stage (RR)
by HPLC analysis.
M82 IL9adm
100%
50%
100%
50%
Compound Mean SE Mean SE Mean SE Mean SE
Lutein
(μg ∙ g DW-1
) 16.45 1.19 22.73 1.09 20.22 1.13 22.31 1.5
Lycopene
(μg ∙ g DW-1
) 6.63 0.45 8.95 0.72 7.22 0.71 7.59 0.07
α-carotene
(μg ∙ g DW-1
) 16.11 1.29 21.41 1.75 23.78 2.1 26.19 1.8
β-carotene
(μg ∙ g DW-1
) 261.56 17.69 214.8 11.89 140.83 3.55 183.16 9.07
Sum of peaks 300.74 16.33 267.88 15.38 192.05 7.27 239.25 9.97
Lycopene/car
otene 0.02 2.9 ∙ 10
-4 0.04 1.5 ∙ 10
-4 0.04 3.0 ∙ 10
-3 0.04 0.002
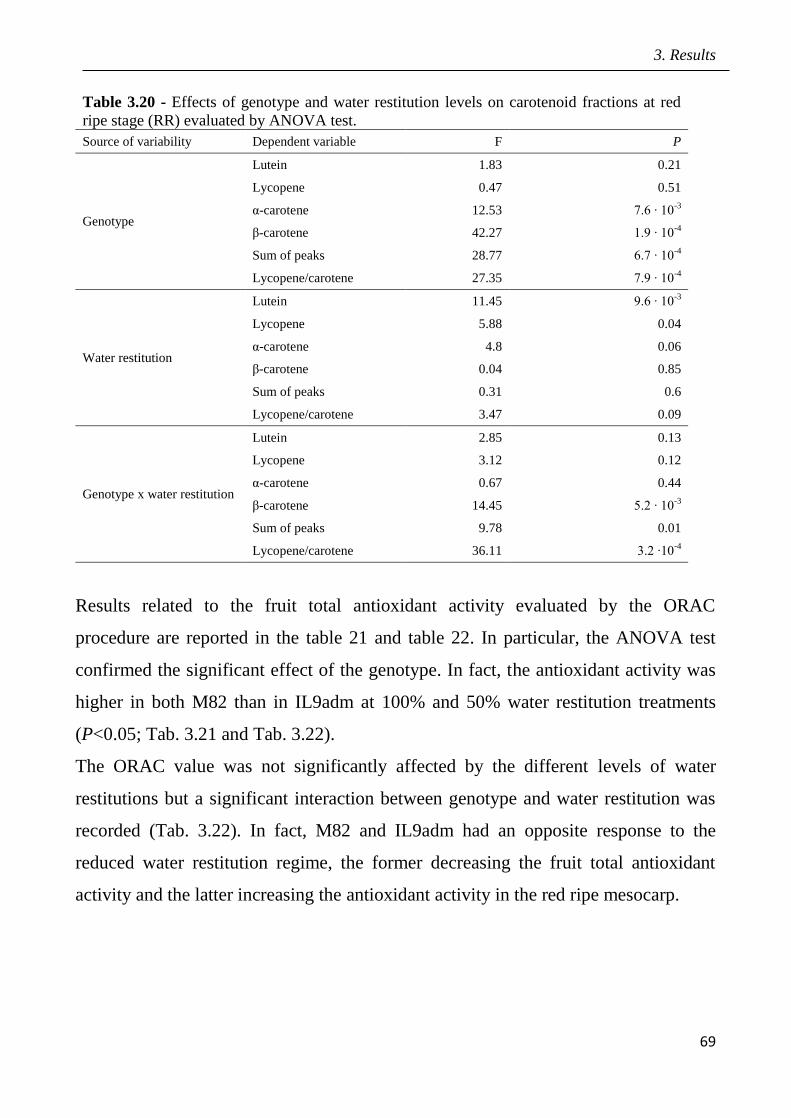
3. Results
69
Table 3.20 - Effects of genotype and water restitution levels on carotenoid fractions at red
ripe stage (RR) evaluated by ANOVA test.
Source of variability Dependent variable F P
Genotype
Lutein 1.83 0.21
Lycopene 0.47 0.51
α-carotene 12.53 7.6 ∙ 10-3
β-carotene 42.27 1.9 ∙ 10-4
Sum of peaks 28.77 6.7 ∙ 10-4
Lycopene/carotene 27.35 7.9 ∙ 10-4
Water restitution
Lutein 11.45 9.6 ∙ 10-3
Lycopene 5.88 0.04
α-carotene 4.8 0.06
β-carotene 0.04 0.85
Sum of peaks 0.31 0.6
Lycopene/carotene 3.47 0.09
Genotype x water restitution
Lutein 2.85 0.13
Lycopene 3.12 0.12
α-carotene 0.67 0.44
β-carotene 14.45 5.2 ∙ 10-3
Sum of peaks 9.78 0.01
Lycopene/carotene 36.11 3.2 ∙10-4
Results related to the fruit total antioxidant activity evaluated by the ORAC
procedure are reported in the table 21 and table 22. In particular, the ANOVA test
confirmed the significant effect of the genotype. In fact, the antioxidant activity was
higher in both M82 than in IL9adm at 100% and 50% water restitution treatments
(P<0.05; Tab. 3.21 and Tab. 3.22).
The ORAC value was not significantly affected by the different levels of water
restitutions but a significant interaction between genotype and water restitution was
recorded (Tab. 3.22). In fact, M82 and IL9adm had an opposite response to the
reduced water restitution regime, the former decreasing the fruit total antioxidant
activity and the latter increasing the antioxidant activity in the red ripe mesocarp.

3. Results
70
Table 3.21 – Mean and standard error of fruit total antioxidant activity (μmol TE g DW-1) in M82
and IL9adm under two water restitution levels at red ripe stage (RR).
M82 IL9adm
100% 50% 100% 50%
Mean SE Mean SE Mean SE Mean SE
1048.48 28.91 907.26 54.11 381.10 33.163 616.41 86.84
Table 3.22 – ANOVA statistics to evaluate effects of genotype and water restitution levels on fruit
total antioxidant activity at red ripe stage (RR).
Source of variability F P
Genotype 74.02 2.5 ∙ 10-5
Water restitution 0.71 0.42
Genotype x water restitution 11.43 0.01
Table 3.23 reported the fruit level of H2O2 at red ripe stage. Its average concentration
significantly increased, irrespective of the genotype, at a reduced water restitution
level (Tab. 3.24). Neighter the genotype nor the interaction between genotype and
water treatment significantly affected the level of hydrogen peroxide in the fruit.
Table 3.24 – ANOVA statistics to evaluate effects of genotype and water restitution levels on
hydrogen peroxide amount at red ripe stage (RR).
Source of variability F P
Genotype 0.02 0.88
Water restitution 18.24 3.7 ∙ 10-3
Genotype x water restitution 0.90 0.37
Table 3.23 – Mean and standard error of hydrogen peroxide amount (nmol ∙ g DW-1
) in M82 and
IL9adm under two water restitution levels at red ripe stage (RR).
M82 IL9adm
100%
50% 100%
50%
Mean SE Mean SE Mean SE Mean SE
0.35 0.16
1.28 0.22 0.55 0.15
1.14 0.13

3. Results
71
3.4 Effects of open field drought on the quality of tomato puree
Tomatoes harvested from the open field trial in Acerra across the 2013 growing
season were delivered to the SSICA, in Angri, where they underwent processing to
puree by mean of a scaled processing facility. Table 3.25 summarize some yield
parameters and quality indexes of resulting sauces.
The genotype significantly affected the industrial yield that was higher for IL9adm
than M82 and as we could aspect, the 50 % water restitution treatment significantly
reduced the yield in both the genotypes. The discarded peel was significantly affected
by the genotype and the water restitution and its highest value was 2.60% recorded
for IL9adm in the 50% water treatment.
The component “L” of the colour was affected by the genotype wherease the
component “a” was significantly affected by the genotype and the water restitution.
Components “a”, “b” and “L” had a significant interaction between genotype and
water treatment (Tab. 3.26).
They all concurred to discriminate genotypes and water treatments (Fig. 3.9).The
juice Ph was not affectd by any of considered source of variation (Tab. 3.26).
Table 3.25 – Tomato sauce quality and yield processing parameters from fruit of M82 and
IL9adm grown at two different water restitution levels.
M82
IL9adm
100% 50%
100% 50%
Mean SE Mean SE
Mean SE Mean SE
Pre-consumer waste (%) 1.30 0.01 3.60 0.01 1.20 0.05 2.90 0.02
Discarded peel (%) 2.00 0.03 1.50 0.01 1.60 0.02 2.60 0.03
Industrial yield (%) 96.70 0.51 93.90 0.42 97.20 0.63 94.50 0.84
Colour Hunter Lab 2°C a/L 2.23 0.03 2.24 0.04 2.170 0.03 2.19 0.05
Colour Hunter Lab 2°C L 25.12 0.12 24.92 0.08 25.74 0.21 26.13 0.25
Colour Hunter Lab 2°C a 31.18 0.15 30.69 0.09 30.34 0.34 31.26 0.33
Colour Hunter Lab 2°C b 13.96 0.20 13.73 0.03 13.98 0.22 14.26 0.07
Juice pH 4.11 0.03 4.18 0.04 4.13 0.03 4.230 0.03
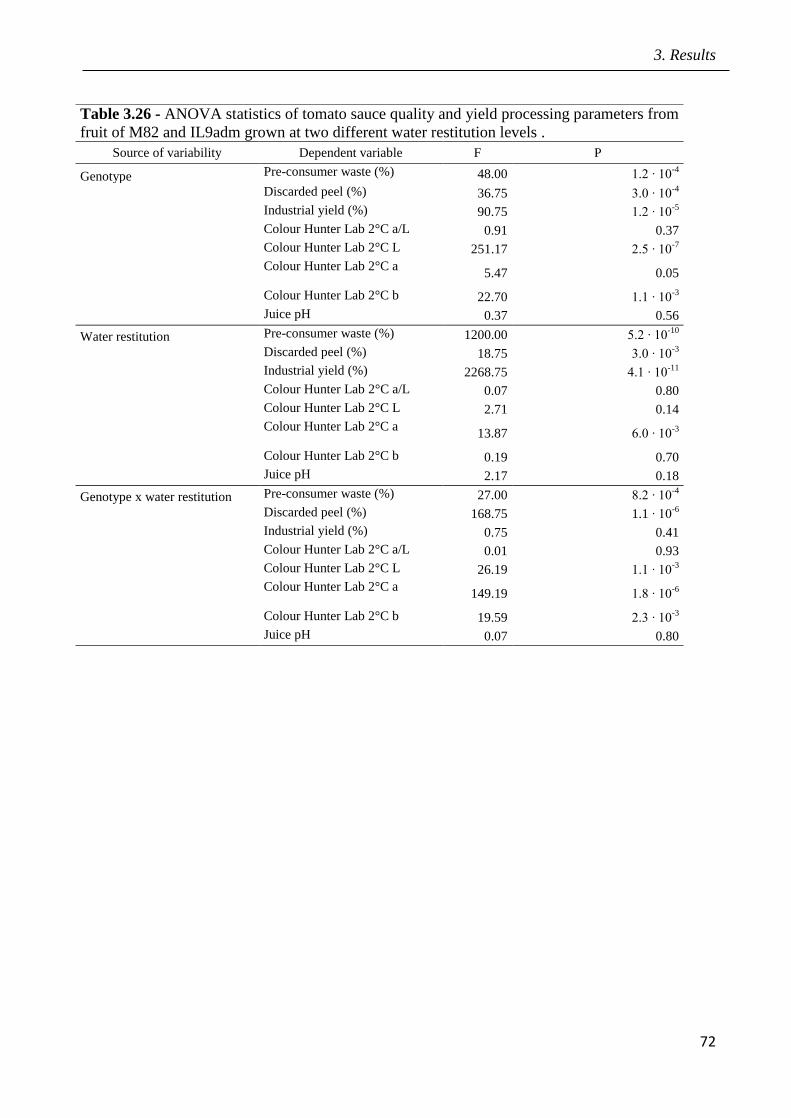
3. Results
72
Table 3.26 - ANOVA statistics of tomato sauce quality and yield processing parameters from
fruit of M82 and IL9adm grown at two different water restitution levels .
Source of variability Dependent variable F P
Genotype Pre-consumer waste (%) 48.00 1.2 ∙ 10-4
Discarded peel (%) 36.75 3.0 ∙ 10-4
Industrial yield (%) 90.75 1.2 ∙ 10-5
Colour Hunter Lab 2°C a/L 0.91 0.37
Colour Hunter Lab 2°C L 251.17 2.5 ∙ 10-7
Colour Hunter Lab 2°C a 5.47 0.05
Colour Hunter Lab 2°C b 22.70 1.1 ∙ 10-3
Juice pH 0.37 0.56
Water restitution Pre-consumer waste (%) 1200.00 5.2 ∙ 10-10
Discarded peel (%) 18.75 3.0 ∙ 10-3
Industrial yield (%) 2268.75 4.1 ∙ 10-11
Colour Hunter Lab 2°C a/L 0.07 0.80
Colour Hunter Lab 2°C L 2.71 0.14
Colour Hunter Lab 2°C a 13.87 6.0 ∙ 10
-3
Colour Hunter Lab 2°C b 0.19 0.70
Juice pH 2.17 0.18
Genotype x water restitution Pre-consumer waste (%) 27.00 8.2 ∙ 10-4
Discarded peel (%) 168.75 1.1 ∙ 10-6
Industrial yield (%) 0.75 0.41
Colour Hunter Lab 2°C a/L 0.01 0.93
Colour Hunter Lab 2°C L 26.19 1.1 ∙ 10-3
Colour Hunter Lab 2°C a 149.19 1.8 ∙ 10
-6
Colour Hunter Lab 2°C b 19.59 2.3 ∙ 10-3
Juice pH 0.07 0.80
3. Results
73
Figure 3.9 – Three dimension graph showing colour features of tomato sauces got from the processing of M82 and
IL9adm grown under two different water level restitutions.
As for the level antioxidants, the genotype did not affect the concentration of AsA
wherease the water treatment did (Tab. 3.27 and Tab. 3.28). Specifically, a dramatic
decrease of AsA was observed upon processing and the extend of the decay was
significantly affected by the water treatment. In particular, the reduced water
restitution (50%) was associated to a lower decay of AsA (Tab. 3.27).
Table 3.27 - Mean and standard error AsA content (mg ∙ 100g DW-1
) in tomato sauce (PP) and its
variation upon processing compared to fresh red ripe stage (Δ PP (%)).
M82 IL9adm
100% 50% 100% 50%
Mean SE Mean SE Mean SE Mean SE
PP 241.85 4.65 369.08 26.56 249.91 5.44 330.49 12.03
Δ PP
(%) -53.18 0.90 -32.57 4.85
-57.56 0.92 -40.65 2.16

3. Results
74
Table 3.28 – ANOVA statistics to evaluate effects of genotype and water restitution levels on AsA
concentration in tomato sauce (PP) and its variation upon processing (Δ PP (%)).
Source of variability Dependent variable F P
Genotype PP 0.71 0.43
Δ PP (%) 3.56 0.11
Water restitution
PP (%) 32.99 1.0 ∙ 10
-3
Δ PP (%) 32.23 1.0 ∙ 10-3
Genotype x water restitution PP 1.66 0.24
Δ PP (%) 0.31 0.59
As for the level of total phenolics, a significant effect of the genotype and the water
treatment was detected by the ANOVA test (Tab. 3.29 and Tab. 3.30). Processing
modified the level of total phenolics in the puree compared to the red ripe fruit and
the variation was significantly affected by the genotype, the water treatment and the
interaction between them. In fact, in M82 the processing reduced the total level of
phenolics and the decay was larger in the 50% water treatment than in 100%. On the
other hand, the puree from IL9adm had a slite increase in the total level of phenolics
when the 100% water restitution treatment occurred wherease it remained unchanged
when the 50% water treatment was imposed (Tab. 3.29 and Tab. 3.30).
Table 3.29 – Mean and standard error of phenolic compounds (mg GAE ∙ 100g DW-1
) in tomato
sauce (PP) and its variation upon processing (Δ PP (%)).
M82
IL9adm
100%
50%
100%
50%
Mean SE Mean SE Mean SE Mean SE
PP 553.84 6.83
446.74 6.27 589.50 8.36
493.95 5.03
Δ PP (%) -10.69 1.10
-27.67 1.02 10.77 1.57
-0.95 1.01
3. Results
75
The level of total flavonoids in tomato puree is summarized in Table 3.31 and Table
3.32. The ANOVA test underlined that the level of total flavonoids was significantly
affected by the genotype, the water treatment and the interaction between these
sources of variation. In particular, the level of total flavonoids was higher in IL9adm
fruit at 100% water treatment but it remained essentially unchanged in M82 when the
reduced water restitution treatment was imposed wherease it dramatically lowered in
IL9adm. Also, processing caused the level of total flavonoids to decay and again the
extend of this decay was significantly affected by the genotype, the water treatment
and the intereaction between the genotype and the water restitution with the lowest
decay occurring in IL9adm treated with 100% water restitution and the highest decay
occurring in IL9adm challenged with 50% water restitution.
Table 3.31 - Mean and standard error of of total flavonoids (mg QE ∙ 100 g DW
-1) in tomato sauce
(PP) and its variation upon processing (Δ PP (%)).
M82 IL9adm
100%
50% 100%
50%
Mean SE Mean SE Mean SE Mean SE
PP 84.10 0.68
82.41 0.63 100.12 0.83
62.60 0.51
Δ PP (%) -39.09 0.49
-36.27 0.49 -22.58 0.65
-45.44 0.44
Table 3.30 – ANOVA statistics to evaluate effects of genotype and water restitution levels on
total phenolic compounds and in tomato sauce (PP) and its variation upon processing (Δ PP (%)).
Source of variability F P
Genotype PP 37.89 2.7 ∙ 10-4
Δ PP (%) 405.04 3.9 ∙ 10-8
Water restitution PP 226.59 3.7 ∙ 10-7
Δ PP 143.61 2.2 ∙ 10-6
Genotype x water restitution PP 0.74 0.42
Δ PP (%) 4.82 0.06

3. Results
76
Table 3.32 – ANOVA statistics to evaluate effects of genotype and water restitution levels on
total flavonoid levels in tomato sauce (PP) and its variation upon processing (Δ PP (%)).
Source of variability F P
Genotype PP 7.93 0.02
Δ PP (%) 49.32 1.1 ∙ 10
-4
Water restitution PP 849.18 2.0 ∙ 10-9
Δ PP (%) 368.19 5.6 ∙ 10
-8
Genotype x water restitution PP 708.61 4.2 ∙ 10-9
Δ PP (%) 604.69 7.9 ∙ 10
-9
An HPLC/UV - ESI MS MS analysis was carried out in order to quantify individual
phenolic fractions in the tomato puree and evaluate variations in their content
occurring as a consequence of the processing. Again, the most representative
flavonoids were the rutin and quercetin and the most abundant phenolic acids were
chlorogenic acid and caffeic acid (Tab. 3.33). For all of them, the absolute level was
significantly affected by the genotype (with the exception of caffeic acid), the water
treatment and the interaction between the genotype and the water treatment (Tab.
3.34). In general, the level of all four fractions increased massively upon processing
in the range 31.05% to 65.57% for rutin, 8.83% to 100.45% for quercetin, 362.45%
to 710.55% for caffeic acid nd 112.01% to 150.41% for chlorogenic acid and these
increases were significantly affected by the genotype, the water treatment and the
interaction between them.
Table 3.33 - Phenolic compounds in M82 and IL9adm under two water conditions in tomato sauce (PP)
and its variation upon processing (Δ PP (%)) detected by an HPLC/UV- ESI MS MS approach.
M82 IL9adm
100%
50%
100%
50%
Mean SE Mean SE Mean SE Mean SE
Rutin
(μg g DW-1
)
PP 251.53 0.06
344.77 0.06
174.36 0.06
322.56 0.06
Δ PP (%) 53.92 0.04
65.57 0.03
31.05 0.04
54.31 0.03
Quercetin (μg g
DW-1
)
PP 1.40 0.06
2.85 0.06
1.74 0.06
1.94 0.06
Δ PP (%) 81.56 7.47
100.45 4.06
73.05 5.73
8.83 3.23
Caffeic acid (μg g
DW-1
)
PP 1.94 0.06
2.07 0.06
2.30 0.06
1.86 0.06
Δ PP (%) 699.85 23.85
562.19 18.43
710.55 20.38
362.45 14.32
Chlorogenic acid
(μg g DW-1
)
PP 38.42 0.06
30.40 0.06
38.07 0.06
38.00 0.06
Δ PP (%) 143.83 0.37
150.41 0.48
142.13 0.37
112.01 0.32
3. Results
77
As for the content of total carotenoids (Tab. 3.35), its variation was significantly
affected by the genotype, the water restitution treatment and the interaction between
them. Same sources of significant variation affected variability in the effect of
processing. In general, the processing increased the level of total carotenoids with the
exception of IL9adm treated with the 100% water restitution whose puree showed a
reduction in the level of total carotenoids (Δ PP equal to -35.57%) when compared to
the level observed in the red ripe fruit.
Table 3.35 – Mean and standard error of total carotenois (μg ∙ g DW-1
) in tomato sauce (PP) and
its variation upon processing (Δ PP (%)).
M82 IL9adm
100%
50%
100%
50%
Mean SE Mean SE Mean SE Mean SE
PP 1660.64 0.06 1650.39 0.06 1413.45 0.06 1975.95 0.06
Δ PP (%) 16.88 3.3 ∙ 10-3 40.99 0.01 -35.57 3.3 ∙ 10
-3 49.11 0.003
Table 3.34 - ANOVA statistics to evaluate effects of genotype and water restitution levels on
flavonoids and phenolic acids fractions in tomato sauce (PP) and its variation upon processing (Δ
PP (%)).
Dependent variable Source of variability F P
Rutin
PP
Genotype 740634.20 3.7 ∙ 10-21
Water restitution 4372310.17 3.1 ∙ 10-24
Genotype x water restitution 226601.55 4.2 ∙ 10-19
Δ PP
Genotype 249872.15 2.9 ∙ 10-19
Water restitution 261218.09 2.4 ∙ 10-19
Genotype x water restitution 28927.59 1.6 ∙ 10-15
Quercetin
PP
Genotype 24.13 1.2 ∙ 10-3
Water restitution 203.33 5.7 ∙ 10-7
Genotype x water restitution 116.53 4.8 ∙ 10-6
Δ PP
Genotype 86.79 1.4 ∙ 10-5
Water restitution 17.78 2.9 ∙ 10-3
Genotype x water restitution 59.79 5.6 ∙ 10-5
Caffeic acid
PP
Genotype 1.69 0.23
Water restitution 6.46 0.03
Genotype x water restitution 24.33 1.1 ∙ 10-5
Δ PP
Genotype 23.36 1.3 ∙ 10-3
Water restitution 154.29 1.6 ∙ 10-6
Genotype x water restitution 28.96 6.6 ∙ 10-4
Chlorogenic acid
PP
Genotype 3925.92 4.7 ∙ 10-12
Water restitution 4906.52 1.9 ∙ 10-12
Genotype x water restitution 4739.63 2.2 ∙ 10-12
Δ PP
Genotype 2683.60 2.1 ∙ 10-11
Water restitution 925.31 1.5 ∙ 10-9
Genotype x water restitution 2248.24 4.3 ∙ 10-11
3. Results
78
Table 3.36 – ANOVA statistics to evaluate effects of genotype and water restitution levels on the
total carotenoids content in tomato sauce (PP) and its variation upon processing (Δ PP (%)).
Source of variability Dependent variable F P
Genotype PP 460608.43 2.4 ∙ 10-20
Δ PP (%) 29481666.67 1.4 ∙ 10-27
Water restitution PP 22874204.42 4.0 ∙ 10-27
Δ PP 177496326.00 1.1 ∙ 10-30
Genotype x water restitution PP 24603726.82 3.0 ∙ 10-27
Δ PP (%) 55024816.67 1.2 ∙ 10-28
An HPLC strategy was applied in order to separate individual carotenoid peaks. In
particular, major peaks detected tomato puree are reported in table 3.37. Their sum
was also evaluated as well as the lycopene/carotene ratio.
β-carotene was the most abundant carotenoid with the highest expression in M82
when the lost water was fully reintegrated (100%). Its level was significantly affected
by the genotype, the water treatment and the interaction between them. Same applied
for the level of lutein, lycopene, α-carotene, the sum of all detected carotenoid peaks
wherease the lycopene/carotene ratio only changed according to the genotype effect
(Tab. 3.38). Also, the processing affected changes (Δ PP) in the level of lutein,
lycopene, α-carotene, β-carotene, the sum of all detected carotenoid peaks and the
lycopene/carotene ratio and all these effects were significantly mediated by the
genotype, the water treatment and their interaction.

3. Results
79
Table 3.37 – Mean and standard error of carotenoid fractions in tomato sauce (PP) and its variation
upon processing (Δ PP (%)).
M82 IL9adm
100%
50%
100%
50%
Compound
Mean SE Mean SE Mean SE Mean SE
Lutein
(μg ∙ g DW-1
) PP 7.52 0.06 6.45 0.06 6.44 0.06 4.35 0.06
Δ PP -54.31 0.35 -71.64 0.25 -68.15 0.29 -80.52 0.26
Lycopene
(μg ∙ g DW-1
) PP 7.23 0.06 6.57 0.06 6.96 0.06 5.19 0.06
Δ PP 9.16 0.87 -26.58 0.65 -3.60 0.80 -31.65 0.76
α-carotene
(μg ∙ g DW-1
) PP 26.76 0.06 16.78 0.06 25.48 0.06 14.53 0.06
Δ PP 66.14 0.36 -21.62 0.27 7.15 0.24 -44.53 0.22
β-carotene
(μg ∙ g DW-1
) PP 192.42 0.06 184.28 0.06 161.01 0.06 122.42 0.06
Δ PP -26.43 0.02 -14.21 0.03 14.32 0.04 -33.16 0.03
Sum of peaks PP 233.93 0.23 214.07 0.23 199.89 0.23 146.48 0.23
Δ PP -22.21 0.08 -20.09 0.09 4.08 0.12 -38.77 0.10
Lycopene/caroten
e PP 0.03 2.5 ∙ 10
-4 0.03 0 0.04 2.9 ∙ 10
-4 0.04 3.4 ∙ 10
-4
Δ PP 38.42 1.03 -13.52 0.71 -14.60 0.66 4.07 1.07
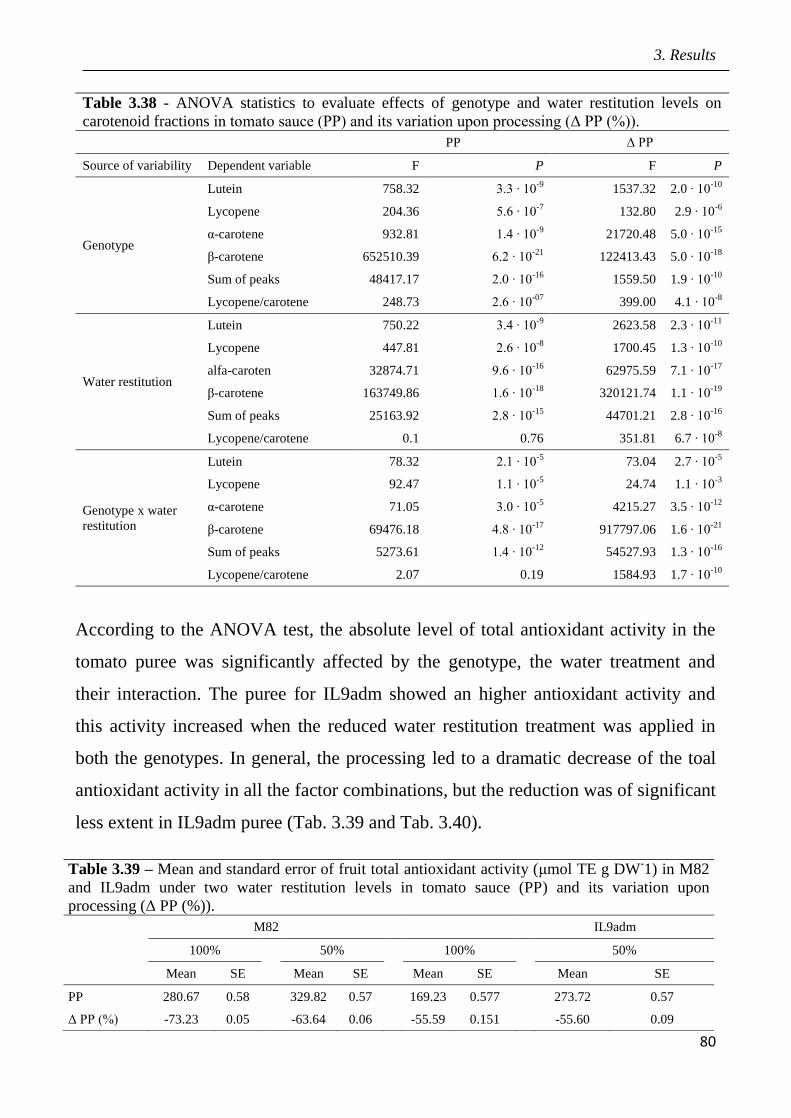
3. Results
80
Table 3.38 - ANOVA statistics to evaluate effects of genotype and water restitution levels on
carotenoid fractions in tomato sauce (PP) and its variation upon processing (Δ PP (%)).
PP Δ PP
Source of variability Dependent variable F P F P
Genotype
Lutein 758.32 3.3 ∙ 10-9
1537.32 2.0 ∙ 10-10
Lycopene 204.36 5.6 ∙ 10-7
132.80 2.9 ∙ 10-6
α-carotene 932.81 1.4 ∙ 10-9
21720.48 5.0 ∙ 10-15
β-carotene 652510.39 6.2 ∙ 10-21
122413.43 5.0 ∙ 10-18
Sum of peaks 48417.17 2.0 ∙ 10-16
1559.50 1.9 ∙ 10-10
Lycopene/carotene 248.73 2.6 ∙ 10-07
399.00 4.1 ∙ 10-8
Water restitution
Lutein 750.22 3.4 ∙ 10-9
2623.58 2.3 ∙ 10-11
Lycopene 447.81 2.6 ∙ 10-8
1700.45 1.3 ∙ 10-10
alfa-caroten 32874.71 9.6 ∙ 10-16
62975.59 7.1 ∙ 10-17
β-carotene 163749.86 1.6 ∙ 10-18
320121.74 1.1 ∙ 10-19
Sum of peaks 25163.92 2.8 ∙ 10-15
44701.21 2.8 ∙ 10-16
Lycopene/carotene 0.1 0.76 351.81 6.7 ∙ 10-8
Genotype x water
restitution
Lutein 78.32 2.1 ∙ 10-5
73.04 2.7 ∙ 10-5
Lycopene 92.47 1.1 ∙ 10-5
24.74 1.1 ∙ 10-3
α-carotene 71.05 3.0 ∙ 10-5
4215.27 3.5 ∙ 10-12
β-carotene 69476.18 4.8 ∙ 10-17
917797.06 1.6 ∙ 10-21
Sum of peaks 5273.61 1.4 ∙ 10-12
54527.93 1.3 ∙ 10-16
Lycopene/carotene 2.07 0.19 1584.93 1.7 ∙ 10-10
According to the ANOVA test, the absolute level of total antioxidant activity in the
tomato puree was significantly affected by the genotype, the water treatment and
their interaction. The puree for IL9adm showed an higher antioxidant activity and
this activity increased when the reduced water restitution treatment was applied in
both the genotypes. In general, the processing led to a dramatic decrease of the toal
antioxidant activity in all the factor combinations, but the reduction was of significant
less extent in IL9adm puree (Tab. 3.39 and Tab. 3.40).
Table 3.39 – Mean and standard error of fruit total antioxidant activity (μmol TE g DW-1) in M82
and IL9adm under two water restitution levels in tomato sauce (PP) and its variation upon
processing (Δ PP (%)).
M82 IL9adm
100%
50%
100%
50%
Mean SE Mean SE Mean SE Mean SE
PP 280.67 0.58 329.82 0.57 169.23 0.577 273.72 0.57
Δ PP (%) -73.23 0.05 -63.64 0.06 -55.59 0.151 -55.60 0.09

3. Results
81
Table 3.40 – ANOVA statistics to evaluate effects of genotype and water restitution levels on fruit
total antioxidant activity in tomato sauce (PP) and its variation upon processing (Δ PP (%)).
Source of variability Dependent variable F P
Genotype PP 21052.85 5.6 ∙ 10-15
Δ PP (%) 17005.29 1.3 ∙ 10
-14
Water restitution PP 17704.87 1.1 ∙ 10-14
Δ PP (%) 2367.21 3.5 ∙ 10
-11
Genotype x water restitution PP 2296.82 3.9 ∙ 10-11
Δ PP (%) 2367.21 3.5 ∙ 10
-11
The level of H2O2 in tomato puree from M82 and IL9adm grown at 100% and 50%
water restitution treatments and relative ANOVA statistics are reported in Table 3.41
and Table 3.42, respectively. Overall, the absolute level of H2O2 did not change
significantly according to genotype and water treatment. Neverthless, it increased
massively upon the processing and these increases were significantly affected by the
genotype, the water restitution level and their interaction. In particular, the highest
increase in hydrogen peroxide was observed in M82 under 100% water restitution
and the lowest increase in puree from M82 under the 50% water restitution treatment.
Table 3.41 – Mean and standard error of hydrogen peroxide concentration (nmol ∙ g DW-1
) in M82
and IL9adm under two water restitution levels in tomato sauce (PP) and its variation upon
processing (Δ PP (%)).
M82 IL9adm
100%
50% 100%
50%
Mean SE Mean SE Mean SE Mean SE
PP 2.17 0.11
2.39 0.11 1.95 0.33
2.48 0.20
Δ PP (%) 512.96 30.22
87.45 8.76 255.14 60.49
118.13 17.28

3. Results
82
Table 3.42 – ANOVA statistics to evaluate effects of genotype and water restitution levels on
hydrogen peroxide concentration in tomato sauce (PP) and its variation upon processing (Δ PP (%)).
Source of variability F P
Genotype PP 0.11 0.74
Δ PP 10.43 0.01
Water restitution PP 3.23 0.11
Δ PP (%) 63.96 4.4 ∙ 10
-5
Genotype x water restitution PP 0.55 0.48
Δ PP (%) 16.82 3.4 ∙ 10
-3
3.5 Effects of drought in open field trial on post-harvested fruit quality
The susceptible variety M82 and the IL9adm performed differential decay of fruit
firmness over 53 days of post harvest (Fig. 3.10) and the decay was affected by the
water restitution treatment. As a general remark, the decay significantly increased
with the length of post harvest time (Tab. 3.48) and was significantly higher at the
50% water restitution treatment. Nevertheless, the % of firm fruit had a significant
interaction “genotype x time” meaning that the two tomato lines performed
differently depending on the length of the post harvest period. Also, the % of firm
fruit had a significant interaction “genotype x water restitution”, explaining the
contrasting behaviour of the two tomato lines when the two water restitution
treatment were individually considered.
Moreover we measured the loss of fruit weight during the 53 days of post harvest
(Fig. 3.11 and Tab. 3.44). Although the fruit weight showed a steady decrease over
the post harvest, significant effects of the two genotypes and of the two water
treatments were not revealed by an ANOVA approach (Tab. 3.44).

3. Results
83
Figure 3.10 – Decay of firm fruit (%) in M82 and IL9adm grown under two different water restitution levels over a
post harvest of 53 days.
Table 3.43 – ANOVA statistics to evaluate effects of genotype, water restituion levels and time
on fruit firmness in M82 and IL9adm across 53 days of post harvest (53 dph).
Source of variability df F P
Genotype 1 10.75 1.6 ∙ 10-3
Water restitution 1 7420.00 6.7 ∙ 10-68
Time 7 6540.44 8.5 ∙ 10-89
Genotype x time 7 3.22 5.4 ∙ 10-3
Genotype x water restitution 1 266.81 1.1 ∙ 10-17
Water restitution x time 7 1309.92 1.5 ∙ 10-15

3. Results
84
Figure 3.11 - Fruit weight variation (%) of M82 and IL9adm grown under two different water restitution levels, across
53 days post harvest.
Table 3.44 – ANOVA statistics to evaluate effects of genotype, water restituion levels and time
on fruit weight of M82 and IL9adm, across 53 days of post harvest (53 dph).
Source of variability df F P
Genotype 1 2.52 0.11
Water restitution 1 0.35 0.55
Time 6 158.29 1.2 ∙ 10-15
Genotype x water restitution 1 0.012 0.73
Genotype x time 6 0.68 0.66
Water restitution x time 6 0.59 0.74
As for the fruit antioxidant content, 53 days after harvesting tomato fruit had a level
of AsA in the mesocarp significantly affected by the genotype, the water restitution
level and the interaction between the two main factors. Same was for the relative
variation compared to the AsA concentration at harvesting in the flesh of red ripe
fruit (Tab. 3.45 and Tab. 3.46). In particular, fruit from the variety M82 treated with
50% water restitution showed a 68% increase in AsA concentration compared to the
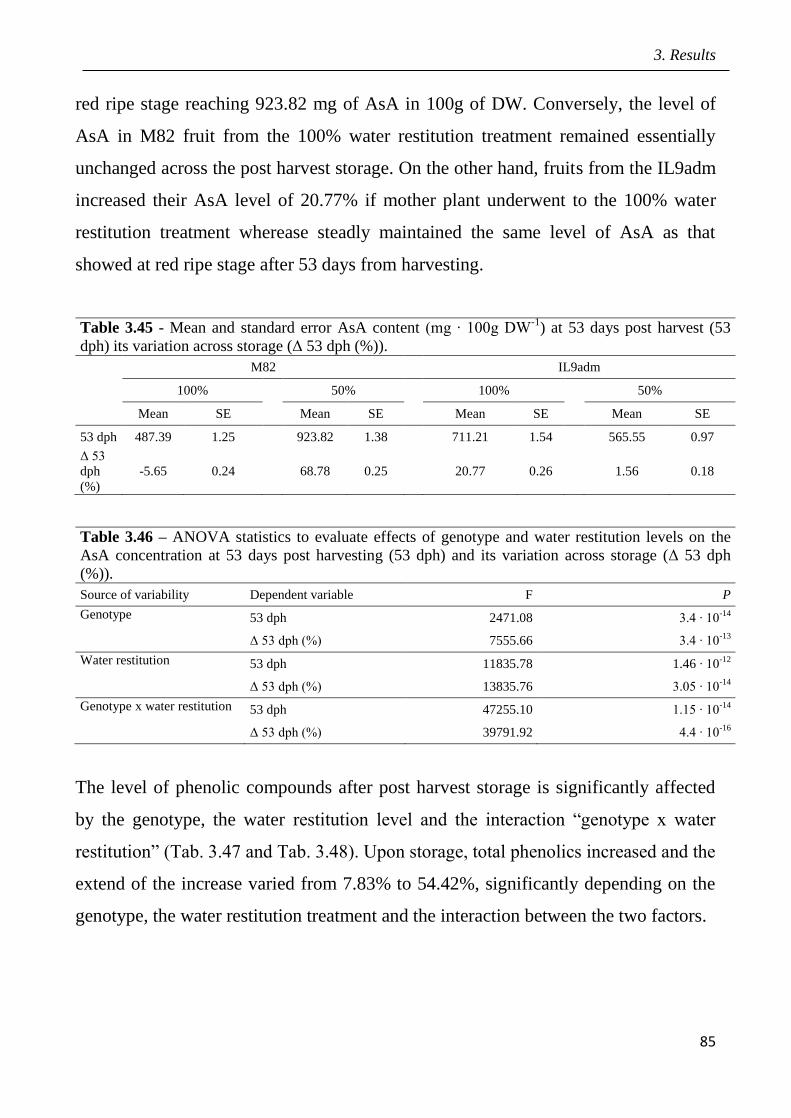
3. Results
85
red ripe stage reaching 923.82 mg of AsA in 100g of DW. Conversely, the level of
AsA in M82 fruit from the 100% water restitution treatment remained essentially
unchanged across the post harvest storage. On the other hand, fruits from the IL9adm
increased their AsA level of 20.77% if mother plant underwent to the 100% water
restitution treatment wherease steadly maintained the same level of AsA as that
showed at red ripe stage after 53 days from harvesting.
Table 3.45 - Mean and standard error AsA content (mg ∙ 100g DW-1
) at 53 days post harvest (53
dph) its variation across storage (Δ 53 dph (%)).
M82 IL9adm
100% 50% 100% 50%
Mean SE Mean SE Mean SE Mean SE
53 dph 487.39 1.25 923.82 1.38 711.21 1.54 565.55 0.97
Δ 53
dph
(%)
-5.65 0.24 68.78 0.25
20.77 0.26 1.56 0.18
Table 3.46 – ANOVA statistics to evaluate effects of genotype and water restitution levels on the
AsA concentration at 53 days post harvesting (53 dph) and its variation across storage (Δ 53 dph
(%)).
Source of variability Dependent variable F P
Genotype 53 dph 2471.08 3.4 ∙ 10-14
Δ 53 dph (%) 7555.66 3.4 ∙ 10-13
Water restitution 53 dph 11835.78 1.46 ∙ 10-12
Δ 53 dph (%) 13835.76 3.05 ∙ 10-14
Genotype x water restitution 53 dph 47255.10 1.15 ∙ 10-14
Δ 53 dph (%) 39791.92 4.4 ∙ 10-16
The level of phenolic compounds after post harvest storage is significantly affected
by the genotype, the water restitution level and the interaction “genotype x water
restitution” (Tab. 3.47 and Tab. 3.48). Upon storage, total phenolics increased and the
extend of the increase varied from 7.83% to 54.42%, significantly depending on the
genotype, the water restitution treatment and the interaction between the two factors.

3. Results
86
Table 3.47 – Mean and standard error of total phenolics (mg GAE ∙ 100g DW-1
) at 53 days post
harvest (53 dph) and its variation across storage (Δ 53 dph).
M82
IL9adm
100%
50%
100%
50%
Mean SE Mean SE Mean SE Mean SE
53 dph 757.92 0.03
811.73 13.84 821.82 15.91
537.70 9.99
Δ 53 dph (%) 22.22 0.07
31.43 2.24 54.42 2.99
7.83 2.00
The level of total flavonoids in the tomato flesh after 53 days of storage varied
significantly according to the water restitution treatments (Tab. 3.49 and Tab. 3.50).
Nevertheless, the response to the 50% reduction of the water restitution was different
in the two genotypes (the interaction “genotype x water treatment” was significant;
Tab. 3.49 and Tab. 3.50). In fact, the 50% treatment increased the fruit level of total
flavonoids after post harvest storage in M82 and had the opposite effect in IL9adm.
Compared to the level of total flavonoids in the flesh of red ripe fruit at harvesting,
the level of total flavonoids upon storage changed significantly according to the
genotype, the water treatment and the interaction between them.
Table 3.49 - Mean and standard error of total flavonoids (mg QE ∙ 100 g DW-1
) at 53 days post
harvest (53 dph) and its variation across storage (Δ 53 dph (%)).
M82 IL9adm
100%
50% 100%
50%
Mean SE Mean SE Mean SE Mean SE
53 dph 129.30 1.25
148.97 1.38 165.26 1.54
115.61 0.98
Δ 53 dph (%) -6.36 0.90
15.21 1.06 27.78 1.19
0.76 0.85
Table 3.48 – ANOVA statistics to evaluate effects of genotype and water restitution levels on
total phenolics at 53 days post harvest (53 dph) and its variation across storage (Δ 53 dph (%)).
Source of variability F P
Genotype 53 dph 81.09 1.8 ∙ 10-5
Δ 53 dph (%) 4.12 0.08
Water restitution 53 dph 97.42 9.4 ∙ 10-6
Δ 53 dph (%) 77.74 2.2 ∙ 10-5
Genotype x water restitution 53 dph 209.73 5.1 ∙ 10-7
Δ 53 dph (%) 173.33 1.1 ∙ 10-6

3. Results
87
Table 3.50 – ANOVA statistics to evaluate effects of genotype and water restitution levels on the
total flavonoid level at 53 days post harvest (53 dph) and its variation across storage (Δ 53 dph
(%)).
Source of variability F P
Genotype 53 dph 0.99 0.35
Δ 53 dph (%) 94.83 1.0 ∙ 10
-5
Water restitution 53 dph 132.58 2.9 ∙ 10-6
Δ 53 dph (%) 7.26 0.03
Genotype x water
restitution 53 dph 708.89 4.2 ∙ 10
-9
Δ 53 dph (%) 577.67 9.5 ∙ 10
-9
An HPLC/UV - ESI MS MS approach allowed to quantify within the pericarp of fruit
stored for 53 days, among most representative fractions, the flavonoids rutin and
quercetin and two phenolic acids, caffeic acid and chlorogenic acid (Tab. 3.51).
Analysis was carried out in order to know the phenolic compound composition.
Specifically, the level of rutin, upon storage, was significantly affected by the
genotype, the water restitution and the interaction between factors. It increased when
the 50% water restitution treatment was applied and the increase was higher in
IL9adm than M82. Also, the 53 day-storage decreased the level of rutin in all
genotype x water restitution combinations except for IL9adm treated with 50% water
restitution where the rutin level increased of 48.28% compared to the red-ripe stage.
Moreover, the level of quercetin was not genotype-dependent and was significantly
affected only by the water treatment. With the exception of tomato fruit from M82
plants undergone to 100% water restitution, the pericarp concentration of quercetin
decreased upon post harvest storage from 31.35 to 43.81% (Tab. 3.51 and Tab. 3.52).
As for phenolic acids, the level of chlorogenic acid at 53 days after harvesting was
significantly affected by the genotype, the water treatment and the interaction
between fixed factors (Tab. 3.52). In particular, it increased at 50% water treatment
and underwent to a reduction from 60.43 to 82.26% upon storage when compared to
the red ripe fruit.

3. Results
88
Table 3.51 - Phenolic compounds in M82 and IL9adm under two water conditions at 53 days post
harvesting (53 dph) and its variation across storage (Δ 53 dph (%)) detected by HPLC/UV-ESI MS MS.
M82 IL9adm
100%
50%
100%
50%
Mean SE Mean SE Mean SE Mean SE
Rutin
(μg g DW-1
) 53dph 155.00 0.06 176.85 0.06 113.61 0.06 309.96 0.06
Δ 53 dph (%) -5.14 0.04 -15.07 0.03 -14.61 0.04 48.28 0.03
Quercetin
(μg g DW-1
) 53dph 0.81 0.06 0.98 0.06 0.66 0.06 1.00 0.06
Δ 53 dph (%) 5.36 7.47 -31.35 4.06 -34.55 5.73 -43.81 3.23
Caffeic acid
(μg g DW-1
) 53dph 0.04 0.01 0.06 0.01 0.05 0.01 0.05 0.01
Δ 53 dph (%) -84.52 2.39 -81.92 1.84 -82.38 2.04 -87.89 1.43
Chlorogenic
acid
(μg g DW-1
)
53dph 2.79 0.06 3.75 0.06 4.92 0.06 7.09 0.06
Δ 53 dph (%) -82.26 0.37 -69.11 0.48 -68.68 0.37 -60.43 0.32
Table 3.52 - ANOVA statistics to evaluate effects of genotype and water restitution levels on
phenolic fractions at 53 days post harvesting (53 dph) and its variation across storage (Δ 53 dph
(%)). Dependent
variable Source of variability F P
Rutin 53dph Genotype 630925.40 7.1 ∙ 10-21
Water restitution 3570582.46 6.9 ∙ 10-24
Genotype x water restitution 2283794.94 4.1 ∙ 10-23
Δ 53 dph Genotype 622737.40 7.4 ∙ 10-21
Water restitution 601393.00 8.5 ∙ 10
-21
Genotype x water restitution 1136937.84 6.7 ∙ 10
-22
Quercetin 53dph Genotype 1.23 0.30
Water restitution 19.17 2.4 ∙ 10-3
Genotype x water restitution 2.50 0.15
Δ 53 dph Genotype 23.74 1.2 ∙ 10
-3
Water restitution 18.29 2.7 ∙ 10-3
Genotype x water restitution 6.52 0.03
Caffeic acid 53 dph Genotype 0.16 0.70
Water restitution 2.46 0.16
Genotype x water restitution 3.07 0.12
Δ 53 dph Genotype 0.96 0.36
Water restitution 0.55 0.48
Genotype x water restitution 4.30 0.07
Chlorogenic acid 53dph Genotype 2243.23 4.4∙ 10-11
Water restitution 731.81 3.7 ∙ 10-9
Genotype x water restitution 110.20 5.9 ∙ 10-6
Δ 53 dph Genotype 827.09 2.3 ∙ 10-9
Water restitution 764.92 3.1 ∙ 10-9
Genotype x water restitution 40.13 2.2 ∙ 10-4
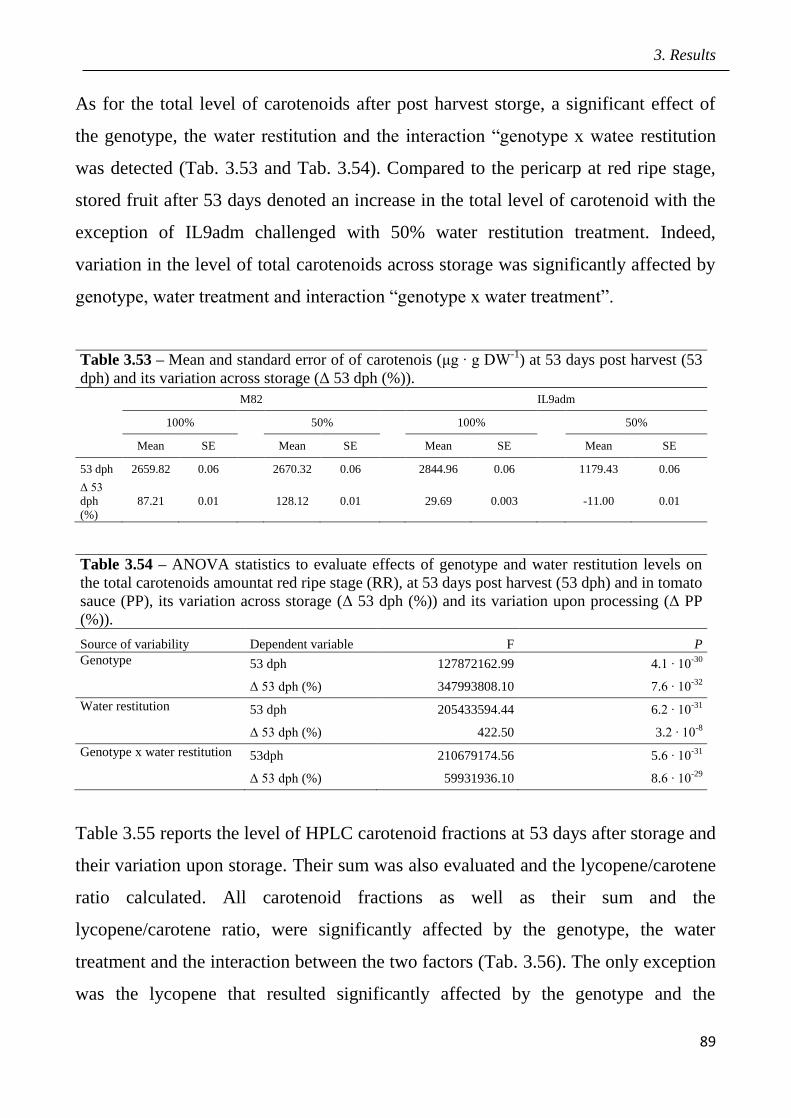
3. Results
89
As for the total level of carotenoids after post harvest storge, a significant effect of
the genotype, the water restitution and the interaction “genotype x watee restitution
was detected (Tab. 3.53 and Tab. 3.54). Compared to the pericarp at red ripe stage,
stored fruit after 53 days denoted an increase in the total level of carotenoid with the
exception of IL9adm challenged with 50% water restitution treatment. Indeed,
variation in the level of total carotenoids across storage was significantly affected by
genotype, water treatment and interaction “genotype x water treatment”.
Table 3.53 – Mean and standard error of of carotenois (μg ∙ g DW-1
) at 53 days post harvest (53
dph) and its variation across storage (Δ 53 dph (%)).
M82 IL9adm
100%
50%
100%
50%
Mean SE Mean SE Mean SE Mean SE
53 dph 2659.82 0.06 2670.32 0.06 2844.96 0.06 1179.43 0.06
Δ 53
dph
(%)
87.21 0.01
128.12 0.01
29.69 0.003
-11.00 0.01
Table 3.54 – ANOVA statistics to evaluate effects of genotype and water restitution levels on
the total carotenoids amountat red ripe stage (RR), at 53 days post harvest (53 dph) and in tomato
sauce (PP), its variation across storage (Δ 53 dph (%)) and its variation upon processing (Δ PP
(%)).
Source of variability Dependent variable F P
Genotype 53 dph 127872162.99 4.1 ∙ 10-30
Δ 53 dph (%) 347993808.10 7.6 ∙ 10-32
Water restitution 53 dph 205433594.44 6.2 ∙ 10-31
Δ 53 dph (%) 422.50 3.2 ∙ 10-8
Genotype x water restitution 53dph 210679174.56 5.6 ∙ 10-31
Δ 53 dph (%) 59931936.10 8.6 ∙ 10-29
Table 3.55 reports the level of HPLC carotenoid fractions at 53 days after storage and
their variation upon storage. Their sum was also evaluated and the lycopene/carotene
ratio calculated. All carotenoid fractions as well as their sum and the
lycopene/carotene ratio, were significantly affected by the genotype, the water
treatment and the interaction between the two factors (Tab. 3.56). The only exception
was the lycopene that resulted significantly affected by the genotype and the
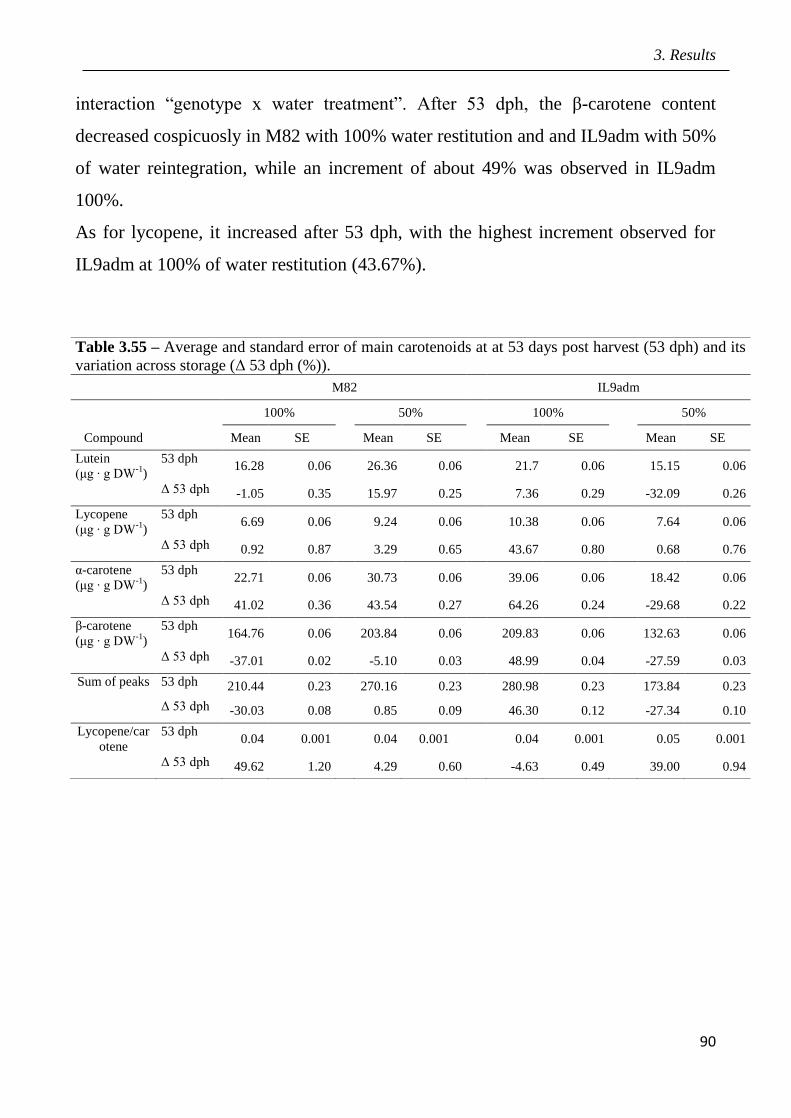
3. Results
90
interaction “genotype x water treatment”. After 53 dph, the β-carotene content
decreased cospicuosly in M82 with 100% water restitution and and IL9adm with 50%
of water reintegration, while an increment of about 49% was observed in IL9adm
100%.
As for lycopene, it increased after 53 dph, with the highest increment observed for
IL9adm at 100% of water restitution (43.67%).
Table 3.55 – Average and standard error of main carotenoids at at 53 days post harvest (53 dph) and its
variation across storage (Δ 53 dph (%)).
M82 IL9adm
100%
50%
100%
50%
Compound
Mean SE Mean SE Mean SE Mean SE
Lutein
(μg ∙ g DW-1
)
53 dph 16.28 0.06 26.36 0.06 21.7 0.06 15.15 0.06
Δ 53 dph -1.05 0.35 15.97 0.25 7.36 0.29 -32.09 0.26
Lycopene
(μg ∙ g DW-1
)
53 dph 6.69 0.06 9.24 0.06 10.38 0.06 7.64 0.06
Δ 53 dph 0.92 0.87 3.29 0.65 43.67 0.80 0.68 0.76
α-carotene
(μg ∙ g DW-1
)
53 dph 22.71 0.06 30.73 0.06 39.06 0.06 18.42 0.06
Δ 53 dph 41.02 0.36 43.54 0.27 64.26 0.24 -29.68 0.22
β-carotene
(μg ∙ g DW-1
)
53 dph 164.76 0.06 203.84 0.06 209.83 0.06 132.63 0.06
Δ 53 dph -37.01 0.02 -5.10 0.03 48.99 0.04 -27.59 0.03
Sum of peaks 53 dph 210.44 0.23 270.16 0.23 280.98 0.23 173.84 0.23
Δ 53 dph -30.03 0.08 0.85 0.09 46.30 0.12 -27.34 0.10
Lycopene/car
otene
53 dph 0.04 0.001 0.04 0.001 0.04 0.001 0.05 0.001
Δ 53 dph 49.62 1.20 4.29 0.60 -4.63 0.49 39.00 0.94

3. Results
91
Table 3.56 - ANOVA statistics to evaluate effects of genotype and water restitution levels on HPLC
carotenoid fractionss at 53 days post harvest (53 dph) and its variation across storage (Δ 53 dph (%)).
53 dph Δ 53 dph
Source of variability Dependent variable F P F P
Genotype
Lutein 2504.66 2.8 ∙ 10-11
4676.21 2.3 ∙ 10-12
Lycopene 328.14 8.9 ∙ 10-8
673.38 5.2 ∙ 10-9
α-carotene 1224.45 4.9 ∙ 10-10
8090.92 2.6 ∙ 10-13
β-carotene 51224.78 1.6 ∙ 10-16
1038782.35 9.6 ∙ 10-22
Sum of peaks 3115.56 1.2 ∙ 10-11
62447.15 7.4 ∙ 10-17
Lycopene/carotene 1000.05 1.1 ∙ 10-9
130.48 3.1 ∙ 10-6
Water restitution
Lutein 933.43 1.4 ∙ 10-9
1496.83 2.2 ∙ 10-10
Lycopene 2.62 0.14 689.50 4.8 ∙ 10-9
α-carotene 11971.24 5.4 ∙ 10-14
27070.43 2.1 ∙ 10-15
β-carotene 108996.33 7.9 ∙ 10-18
513892.34 1.6 ∙ 10-20
Sum of peaks 10538.27 9.1 ∙ 10-14
49283.32 1.9 ∙ 10-16
Lycopene/carotene 535.53 1.3 ∙ 10-8
0.98 3.5 ∙ 10-1
Genotype x water
restitution
Lutein 20736.15 6.0 ∙ 10-15
9484.65 1.4 ∙ 10-13
Lycopene 2098.04 5.7 ∙ 10-11
859.23 2.0 ∙ 10-9
α-carotene 61607.06 7.8 ∙ 10-17
30137.48 1.4 ∙ 10-15
β-carotene 1014148.4 1.1 ∙ 10-21
3030245.32 1.3 ∙ 10-23
Sum of peaks 130512.74 3.9 ∙ 10-18
294415.79 1.5 ∙ 10-19
Lycopene/carotene 90.28 1.2 ∙ 10-5
2704.50 2.1 ∙ 10-11
In order to comprehensively evaluate the overall level of antioxidants, the total
antioxidant activity was estimated by the ORAC procedure (Tab. 3.57 and Tab 3.58).
The post harvest storage led to a significant decrease of the antioxidant activity and
this reduction operated at a far less extent in IL9adm fruit when plants were
reintegrated with all the evapotranspired water 100% treatment). In general, the total
antioxidant activity varied significantly with the genotype, the water treatment and
the interaction between the two independent variables although the exent of the mean
difference was relatively low.

3. Results
92
Table 3.57 – Mean and standard error of fruit total antioxidant activity (μmol TE g DW-1) in
M82 and IL9adm under two water restitution levels at 53 days post harvest (53 dph) and its
variation across storage (Δ 53 dph (%)).
M82 IL9adm
100%
50%
100%
50%
Mean SE Mean SE Mean SE Mean SE
53 dph 319.38 0.58 365.89 0.58 364.64 0.577 366.50 0.57
Δ 53 dph (%) -69.54 0.05 -51.63 0.05 -1.57 0.055 -23.83 0.05
Table 3.58 – ANOVA statistics to evaluate effects of genotype and water restitution levels on
fruit total antioxidant activity at 53 days post harvest (53 dph) and its variation across storage
(Δ 53 dph (%)).
Source of variability Dependent variable F P
Genotype 53 dph 1578.20 1.7 ∙ 10-10
Δ 53 dph (%) 756156.98 3.4 ∙ 10
-21
Water restitution 53dph 1754.75 1.1 ∙ 10-10
Δ 53 dph (%) 1568.00 1.8 ∙ 10
-10
Genotype x water restitution 53dph 1495.08 1.2 ∙ 10-10
Δ 53 dph (%) 133040.31 3.5 ∙ 10
-18
Upon storage, the level of pericarp hydrogen peroxide showed a massive increase
with increments accounting for genotype, water restitution and interaction significant
effects (Tab. 3.59 and Tab. 3.60). Also, pericarp samples from plant treated with 50%
water restitution showed an increase only in M82 whose absolute levels were higher
than IL9adm.
Table 3.59 – Mean and standard error of hydrogen peroxide concentration (nmol ∙ g DW-1
) in M82
and IL9adm under two water restitution levels at 53 days post harvest (53 dph) and its variation
across storage (Δ 53 dph (%)).
M82 IL9adm
100%
50% 100%
50%
Mean SE Mean SE Mean SE Mean SE
53 dph 2.71 0.01
2.79 0.01 2.42 0.01
2.32 0.01
Δ 53 dph (%) 664.17 1.63
118.52 0.45 341.46 1.05
103.96 0.51

3. Results
93
Table 3.60 – ANOVA statistics to evaluate effects of genotype and water restitution levels on fruit
hydrogen peroxide level at 53 days post harvest (53 dph) and its variation across storage (Δ 53 dph
(%)).
Source of variability Dependent variable F P
Genotype 53 dph 4335.80 3.1 ∙ 10-12
Δ 53 dph (%) 26952.72 2.1 ∙ 10
-15
Water restitution 53 dph 5.71 0.04
Δ 53 dph (%) 145325.71 2.5 ∙ 10
-18
Genotype x water restitution 53 dph 257.71 2.3 ∙ 10-7
Δ 53 dph (%) 22500.44 4.4 ∙ 10
-15
3.6 – Root phenotyping in an hydroponic trial
In order to research morphological and physiological mechanism leading to an higher
drought tolerance in IL9adm a comparative study of the root system was carried out
in hydroponic culturing. The figure 3.12 displays the number, the weight and the
linear development of adventicious roots, the weight and the length of the taproot and
the aboveground fresh mass.
The ANOVA test (Tab. 3.61) showed a significant higher taproot weight in IL9adm
plants than M82.

3. Results
94
Figure 3.12 – Root features of M82 and IL9adm grown in an hydroponic system.
Table 3.61 – ANOVA statistics to evaluate effects of the genotype on M82 and IL9adm root
morphology in an hydroponic system. Source of
variability Dependent variable F P
Genotype Adventicious roots (No.) 0.60 0.48
Adventicious root weight (g) 0.37 0.57
Adventicious roots length (cm) 0.02 0.90
Tap root weight (g) 19.92 0.01
Tap root length (cm) 0.28 0.62
Aboveground fresh weight (g) 1.51 0.29
3.7 Effects of drought in lysimeter trials
In order to evaluate the drought effects on M82 and IL9adm fruits in more finely
controlled conditions, plants were grown in lysimeters where water treatments (100%
and 50% water restitutions) were applied under a plastic tunnel and fruits were
colleted at harvesting. Yield performaces were express in terms of marketable yield,
total tield, scrap fruit, marketable fruit in terms of soluble solids and total yield in
terms of soluble solids (Tab. 3.62). According to the ANOVA test, the genotype was

3. Results
95
significant source of variation only for scrap fruit wherease the water treatments
significantly affected the marketable yield, the total yield and the total yielded
soluble solids (Tab. 3.63). Therefore, when the yield performances were considered
in terms of percent of reduction at 50% water treatment compared to 100% (Blum
index; Fig. 3.13), scrap fruit, total yielded soluble solids and marketable yielded
soluble solids significantly differentiated the response in M82 and IL9adm.
Table 3.62 – Mean value and standard error (SE) of yield features performances in M82 and IL9adm
grown under two different water restitution levels (100% and 50%) in lysimeters.
M82
IL9adm
100%
50%
100%
50%
Mean SE
Mean SE
Mean SE
Mean SE
Marketable
yield (kg ∙
plant-1
)
0.62 0.01
2.68 0.10
0.63 0.11
0.34 0.10
Total yield (kg ∙
plant-1
) 0.72 0.04
3.36 0.07
0.82 0.12
0.57 0.01
Scrap (kg ∙
plant-1
) 0.012 0.002
0.02 0.007
0.09 0.04
0.15 0.008
Marketable
yield in SS (g ∙
plant-1
)
42.09 2.44
28.51 5.99
47.51 8.52
31.22 6.90
Total yield in
SS (g ∙ plant-1
) 48.22 0.41
31.73 3.93
62.16 11.54
52.00 5.06
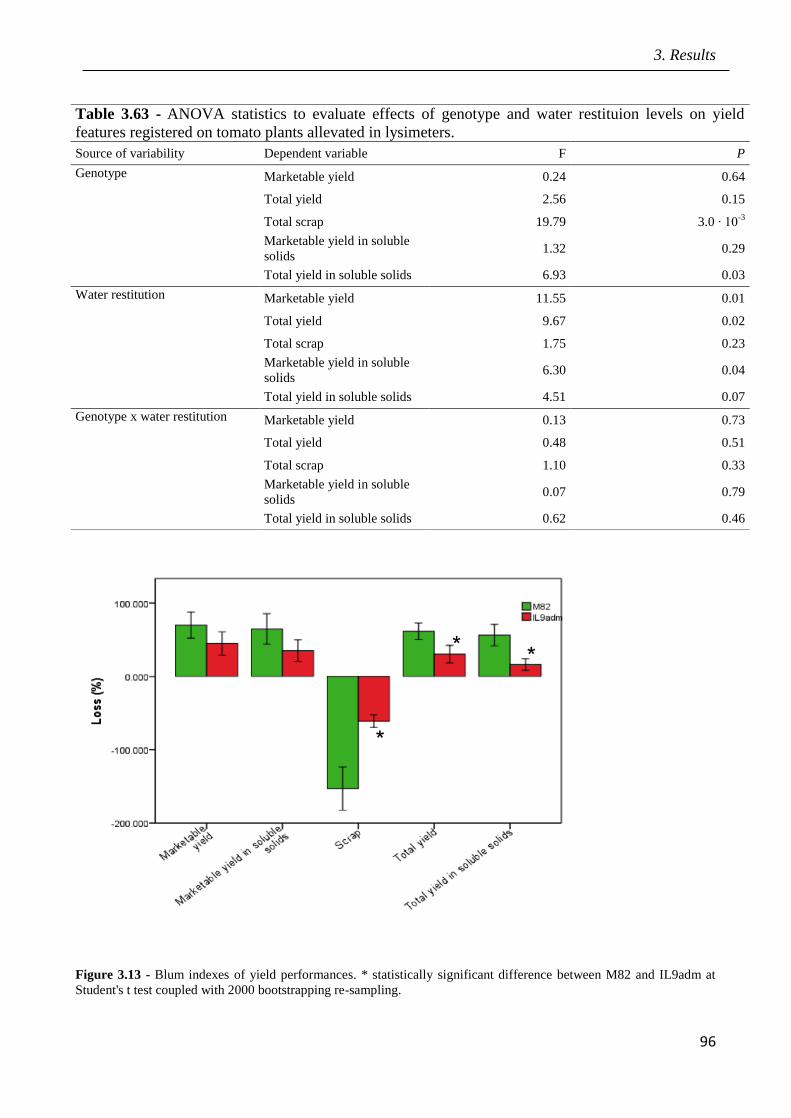
3. Results
96
Figure 3.13 - Blum indexes of yield performances. * statistically significant difference between M82 and IL9adm at
Student's t test coupled with 2000 bootstrapping re-sampling.
Table 3.63 - ANOVA statistics to evaluate effects of genotype and water restituion levels on yield
features registered on tomato plants allevated in lysimeters.
Source of variability Dependent variable F P
Genotype Marketable yield 0.24 0.64
Total yield 2.56 0.15
Total scrap 19.79 3.0 ∙ 10-3
Marketable yield in soluble
solids 1.32 0.29
Total yield in soluble solids 6.93 0.03
Water restitution Marketable yield 11.55 0.01
Total yield 9.67 0.02
Total scrap 1.75 0.23
Marketable yield in soluble
solids 6.30 0.04
Total yield in soluble solids 4.51 0.07
Genotype x water restitution Marketable yield 0.13 0.73
Total yield 0.48 0.51
Total scrap 1.10 0.33
Marketable yield in soluble
solids 0.07 0.79
Total yield in soluble solids 0.62 0.46

3. Results
97
The fruit soluble solid content (SSC) increased from 6.65 ± 0.29 °Brix to 7.64 ± 0.21
°Brix in M82 when a 50% reduction of the water reintegration was applied.
Conversely, higher levels of fruit SSC were achieved in the more tolerant IL9adm
ranging from 7.56 ± 0.13 °Brix to 9.19 ± 0.67 °Brix at 100% and 50% water
treatment, respectively (Tab. 3.64) The ANOVA test highlighted a significant effect
of the genotype and the water restitution on SSC (Tab. 3.65).
On average, the firmness was 25.65 ± 2.26 and 31.16 ± 2.20 N ∙ mm-2
for M82 and
IL9adm, respectively. A 50% reduction in water reintegration caused contrasting
effects on firmness in M82 and IL9adm and all observed effects resulted not
significant at the ANOVA test (Tab. 3.65).
Table 3.64 – Mean and standard error of soluble solid content (SSC) and firmness of M82 and IL9adm
fruits grown under two different water restituion levels.
M82
IL9adm
100% 50%
100%
50%
Mean SE
Mean SE
Mean SE
Mean SE
SSC (°Brix) 6.65 0.29
7.64 0.21
7.56 0.13
9.19 0.67
Firmness (N ∙ mm-2
) 25.65 2.26
30.35 2.08
31.16 2.20
26.82 2.36
Table 3.65 - ANOVA statistics to evaluate effects of genotype and water restituion levels on soluble
solid content (SSC) and firmness.
Source of variability Dependent variable F P
Genotype SSC 17.00 4.4 ∙ 10-3
Firmness 0.27 0.62
Water restitution SSC 19.28 3.1 ∙ 10-3
Firmness 0.01 0.93
Genotype x water restitution SSC 1.16 0.32
Firmness 5.62 0.05
Table 3.66 summarizes the fruit level of total AsA, total carotenoids and total
phenolics detected in M82 and IL9adm grown under 100% and 50% water restitution
treatments. The 50% reduction in water reintegration caused a significant increase of
total AsA only in IL9adm.
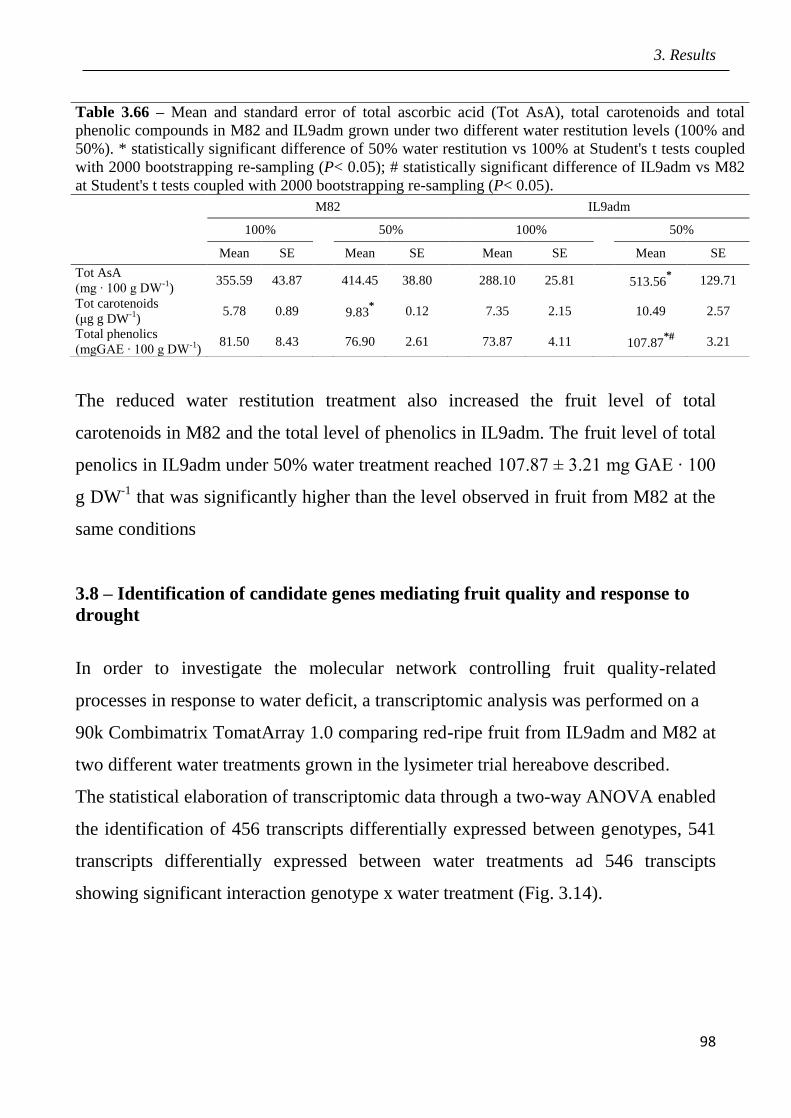
3. Results
98
The reduced water restitution treatment also increased the fruit level of total
carotenoids in M82 and the total level of phenolics in IL9adm. The fruit level of total
penolics in IL9adm under 50% water treatment reached 107.87 ± 3.21 mg GAE ∙ 100
g DW-1
that was significantly higher than the level observed in fruit from M82 at the
same conditions
3.8 – Identification of candidate genes mediating fruit quality and response to
drought
In order to investigate the molecular network controlling fruit quality-related
processes in response to water deficit, a transcriptomic analysis was performed on a
90k Combimatrix TomatArray 1.0 comparing red-ripe fruit from IL9adm and M82 at
two different water treatments grown in the lysimeter trial hereabove described.
The statistical elaboration of transcriptomic data through a two-way ANOVA enabled
the identification of 456 transcripts differentially expressed between genotypes, 541
transcripts differentially expressed between water treatments ad 546 transcipts
showing significant interaction genotype x water treatment (Fig. 3.14).
Table 3.66 – Mean and standard error of total ascorbic acid (Tot AsA), total carotenoids and total
phenolic compounds in M82 and IL9adm grown under two different water restitution levels (100% and
50%). * statistically significant difference of 50% water restitution vs 100% at Student's t tests coupled
with 2000 bootstrapping re-sampling (P< 0.05); # statistically significant difference of IL9adm vs M82
at Student's t tests coupled with 2000 bootstrapping re-sampling (P< 0.05).
M82
IL9adm
100% 50%
100%
50%
Mean SE Mean SE
Mean SE
Mean SE
Tot AsA
(mg ∙ 100 g DW-1
) 355.59 43.87 414.45 38.80
288.10 25.81
513.56
* 129.71
Tot carotenoids
(μg g DW-1
) 5.78 0.89 9.83
* 0.12
7.35 2.15
10.49 2.57
Total phenolics
(mgGAE ∙ 100 g DW-1
) 81.50 8.43 76.90 2.61
73.87 4.11
107.87
*# 3.21
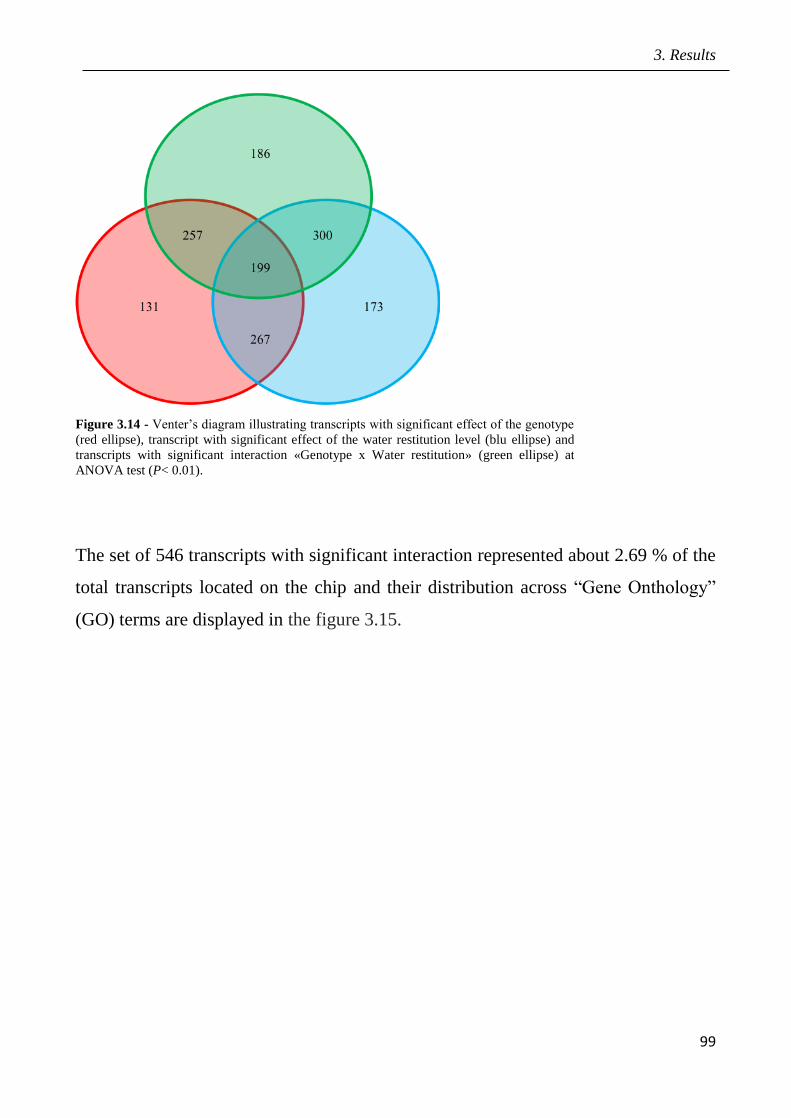
3. Results
99
The set of 546 transcripts with significant interaction represented about 2.69 % of the
total transcripts located on the chip and their distribution across “Gene Onthology”
(GO) terms are displayed in the figure 3.15.
Figure 3.14 - Venter’s diagram illustrating transcripts with significant effect of the genotype
(red ellipse), transcript with significant effect of the water restitution level (blu ellipse) and
transcripts with significant interaction «Genotype x Water restitution» (green ellipse) at
ANOVA test (P< 0.01).

3. Results
100
Figure 3.15 - Distribution of 546 transcripts with significant interaction «Genotype x Water treatment» over GO terms
computed by using Blast2GO software suite.
The enrichment analysis of the 546 differentially expressed genes was performed by
using the software AgriGO (http://bioinfo.cau.edu.cn/agriGO/analysis.php) against
the Solyc gene models (www.solgenomics.org) represented on the microarray slide
and returned no enriched GO categories. Figure 3.16 illustrates the comparative
distribution (expressed as percentage) of GO annotations in the set of 546 transcripts
with significant interaction «Genotype x Water treatment» and in the overall list of
GO annotations represented on the microarray slide.

3. Results
101
Figure 3.16 - Comparative distribution of gene models over GO annotations in the set of 546 transcripts with
significant interaction «Genotype x Water treatment» (input list) and in the overall list of gene models represented on
the microarray slide (Background/Reference) as computed by AgriGO singular enrichment analysis (SEA -
http://bioinfo.cau.edu.cn/agriGO/analysis.php).
The set of 546 transcripts with significant interaction were mapped on metabolic
pathways by using the Solcyc server
(http://solcyc.solgenomics.net/overviewsWeb/celOv.shtml) and candidate tanscripts
controlling fruit quality traits and their modulation in response to drought were
selected (Fig. 3.17, 3.18, 3.19, 3.20, 3.21, 3.22 and Tab. 3.67).
In particular, an ADP-glucose pyrophoshorylase was mapped to the starch
biosynthesis pathway while an alpha-amylase and an hexokinase gene were mapped
to the starch degradative pathway (Fig. 3.17).

3. Results
102
Figure 3.17 - Schematic representation of transcripts with significant interaction «Genotype x Water treatment»
mapped on the starch biosynthetic and degradative pathways by the Omics Data Analysis available at the Solcyc server
(http://solcyc.solgenomics.net/overviewsWeb/celOv.shtml).
As for pectin and cellulose metabolism, potentially involved in mediating mainly the
fruit firmness, a glycosyltransferase gene was mapped on the pectin biosynthesis
pathway, a polygalacturonase gene to the pectin catabolism and two cellulose
synthase genes and an endoglucanase gene were mapped to the cellulose metabolism
(Fig. 3.18).

3. Results
103
Figure 3.18 - Schematic representation of transcripts with significant interaction «Genotype x Water treatment»
mapped on the pectin and cellulose metabolic pathways by the Omics Data Analysis available at the Solcyc server
(http://solcyc.solgenomics.net/overviewsWeb/celOv.shtml).
A cytosine-specific methyltransferase gene and two 1-aminocyclopropane-1-
carboxylate oxidase genes were mapped to the ethylene biosynthetic pathway that
may act as master regulator mechanism in mediating the fruit response to drought
(Fig 3.19).
Figure 3.19 - Schematic representation of transcripts with significant interaction «Genotype x Water treatment»
mapped on the ethylene pathways by the Omics Data Analysis available at the Solcyc server
(http://solcyc.solgenomics.net/overviewsWeb/celOv.shtml).

3. Results
104
Although no genes within the set of 546 transcripts with significant interaction were
mapped to the carotenoids pathway, a 3-ketoacyl-CoA thiolase, a 3-hydroxy-3-
methylglutaryl coenzyme A synthase and a diphosphomevalonate decarboxylase
genes were mapped to the mevalonate pathway that is involved in synthesizing
precursors committed to the carotenoids pathway (Fig 3.20).
Figure 3.20 - Schematic representation of transcripts with significant interaction «Genotype x Water treatment»
mapped on the mevalonate pathways by the Omics Data Analysis available at the Solcyc server
(http://solcyc.solgenomics.net/overviewsWeb/celOv.shtml).
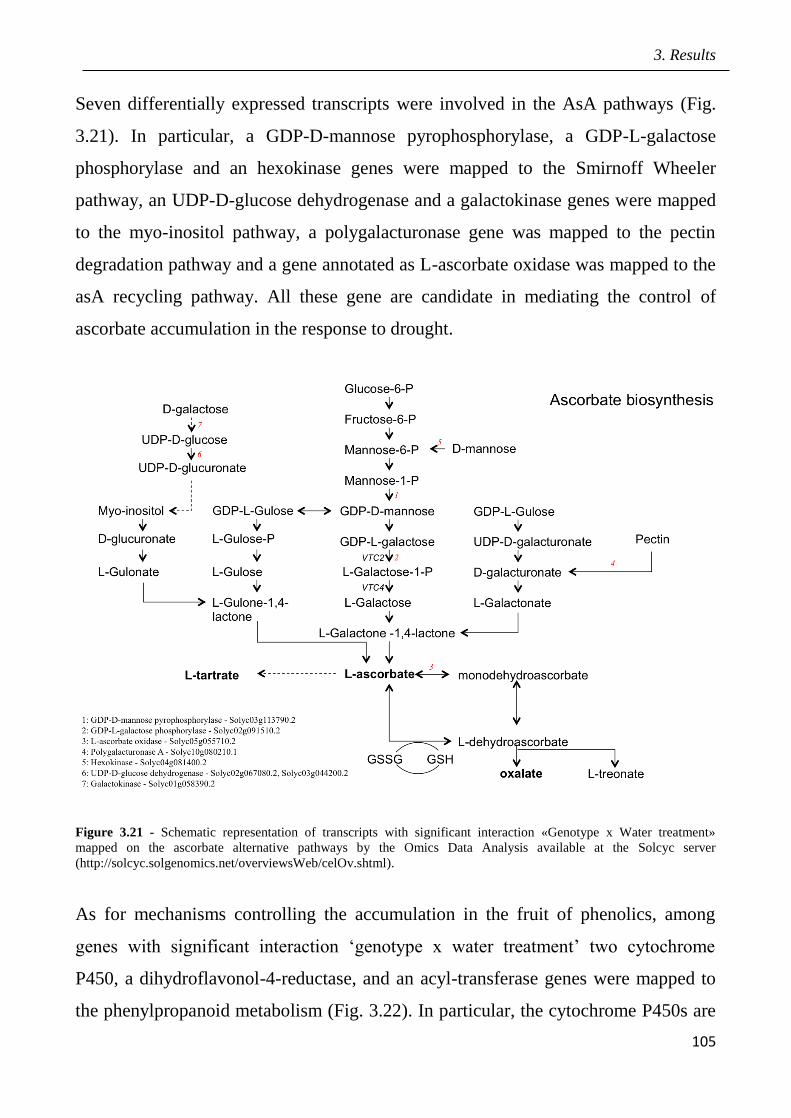
3. Results
105
Seven differentially expressed transcripts were involved in the AsA pathways (Fig.
3.21). In particular, a GDP-D-mannose pyrophosphorylase, a GDP-L-galactose
phosphorylase and an hexokinase genes were mapped to the Smirnoff Wheeler
pathway, an UDP-D-glucose dehydrogenase and a galactokinase genes were mapped
to the myo-inositol pathway, a polygalacturonase gene was mapped to the pectin
degradation pathway and a gene annotated as L-ascorbate oxidase was mapped to the
asA recycling pathway. All these gene are candidate in mediating the control of
ascorbate accumulation in the response to drought.
Figure 3.21 - Schematic representation of transcripts with significant interaction «Genotype x Water treatment»
mapped on the ascorbate alternative pathways by the Omics Data Analysis available at the Solcyc server
(http://solcyc.solgenomics.net/overviewsWeb/celOv.shtml).
As for mechanisms controlling the accumulation in the fruit of phenolics, among
genes with significant interaction ‘genotype x water treatment’ two cytochrome
P450, a dihydroflavonol-4-reductase, and an acyl-transferase genes were mapped to
the phenylpropanoid metabolism (Fig. 3.22). In particular, the cytochrome P450s are

3. Results
106
involved in the synthesis of the luteolin from the apigenin, in the synthesis of trans
dihydroquercetin and in the formation of the flavanone eriodictyol from the
naringenin (Fig. 3.22).
Figure 3. 22 - Schematic representation of transcripts with significant interaction «Genotype x Water treatment»
mapped on the phenylpropanoid metabolic pathways by the Omics Data Analysis available at the Solcyc server
(http://solcyc.solgenomics.net/overviewsWeb/celOv.shtml).
All candidate genes presumably involved in controlling fruit quality in response to
drought were selected from the 546 transcripts with significant interaction are
reported in (Tab. 3.67). The expression level of candidate genes listed in Table 3.67
were validated by RTq-PCR and the fold change of the transcript abundance is
reportred in the same table.

3. Results
107
Table 3.67 - Annotation details of selected candidate gene in the microarray experiment showing significant interaction “Genotype x Water treatment” at
the ANOVA test (P< 0.01). Change in the transcript levels are reported according to RTq-PCR validation.
Gene model Functional descritpion Solcyc pathway Chromosome assignment
Fold change (FC) expression compared to M82 100%
(mean ± standard error)
M82 50% IL9adm 100% IL9adm 50%
Solyc01g058390.2.1 Galactokinase galactose degradation II; UDP-galactose biosynthesis (salvage pathway from galactose using
UDP-glucose) SL2.40ch01 1.35 ± 0.27 0.53 ± 0.05 0.31 ± 0.05
Solyc02g091510.2.1 GDP-L-galactose
phosphorylase 2 ascorbate biosynthesis I (L-galactose pathway) SL2.40ch02 -1.61 ± 0.17 -0.17 ± 0.27 -0.31 ± 0.07
Solyc03g044200.2.1 Alcohol dehydrogenase
formaldehyde oxidation II (glutathione-dependent); galactose degradation II; glycine betaine biosynthesis II (Gram-positive bacteria); isoleucine degradation II; leucine degradation III;
oxidative ethanol degradation I; phenylalanine degradation III; phenylethanol biosynthesis; UDP-
D-xylose biosynthesis
SL2.40ch03 1.07 ± 0.09 -0.03 ± 0.05 -0.35 ± 0.14
Solyc03g113790.2.1 Mannose-1-phosphate guanyltransferase
ascorbate biosynthesis I (L-galactose pathway); colanic acid building blocks biosynthesis; GDP-
mannose biosynthesis I; GDP-mannose biosynthesis II; GDP-mannose metabolism; glycogen
biosynthesis I (from ADP-D-Glucose); starch biosynthesis
SL2.40ch03 -1.35 ± 0.23 -0.45 ± 0.19 -0.15 ± 0.24
Solyc03g114810.2.1 Glycosyltransferase homogalacturonan biosynthesis SL2.40ch03 1.55 ± 0.24 -0.05 ± 0.1 -0.68 ± 0.00
Solyc04g009850.2.1
1-aminocyclopropane-1-
carboxylate oxidase-like
protein
ethylene biosynthesis from methionine SL2.40ch04 -1.31 ± 0.15 -0.31 ± 0.2 0.12 ± 0.46
Solyc04g071800.2.1 Cytochrome P450 flavonol biosynthesis; leucodelphinidin biosynthesis; leucopelargonidin and leucocyanidin
biosynthesis; luteolin biosynthesis; syringetin biosynthesis SL2.40ch04 -1.62 ± 0.14 0.04 ± 0.19 0.15 ± 0.28
Solyc04g081400.2.1 Hexokinase 1 GDP-glucose biosynthesis; GDP-mannose metabolism; glycolysis III; mannitol degradation II; starch degradation; sucrose degradation I; sucrose degradation III
SL2.40ch04 1.38 ± 0.22 0.27 ± 0.18 0.10 ± 0.01
Solyc05g007070.2.1 Alpha amylase 2 starch degradation SL2.40ch05 1.45 ± 0.07 -0.06 ± 0.12 -0.39 ± 0.17
Solyc05g055710.2.1 Ascorbate oxidase ascorbate glutathione cycle SL2.40ch05 2.09 ± 0.05 -0.22 ± 0.27 0.00 ± 0.17
Solyc06g068440.2.1 Cinnamoyl-CoA reductase capsiconiate biosynthesis; leucodelphinidin biosynthesis; leucopelargonidin and leucocyanidin
biosynthesis; phenylpropanoid biosynthesis SL2.40ch06 -1.79 ± 0.07 -0.88 ± 0.31 -0.29 ± 0.41
Solyc08g067070.2.1 Cytosine-specific
methyltransferase methionine degradation I (to homocysteine) SL2.40ch08 1.42 ± 0.1 -0.14 ± 0.11 -0.25 ± 0.29
Solyc09g010020.2.1 1-aminocyclopropane-1-
carboxylate oxidase ethylene biosynthesis from methionine SL2.40ch09 1.02 ± 0.13 0.31 ± 0.1 -0.03 ± 0.22
Solyc09g092270.2.1 Hydroxycinnamoyl-CoA
transferase
chlorogenic acid biosynthesis I; chlorogenic acid biosynthesis II; phenylpropanoid biosynthesis;
simple coumarins biosynthesis SL2.40ch09 2.88 ± 0.22 -0.02 ± 0.08 -0.32 ± 0.35
Solyc10g080210.1.1 Polygalacturonase A homogalacturonan degradation SL2.40ch10 1.55 ± 0.06 0.82 ± 0.25 0.61 ± 0.07
Solyc11g007020.1.1 Diphosphomevalonate
decarboxylase-like protein mevalonate pathway SL2.40ch11 -2.24 ± 0.23 -0.55 ± 0.18 -0.30 ± 0.4
Solyc11g040340.1.1 Endoglucanase 1 cellulose biosynthesis SL2.40ch11 -2.01 ± 0.19 -0.16 ± 0.13 -0.21 ± 0.07
Solyc12g015770.1.1 Cellulose synthase cellulose biosynthesis SL2.40ch12 -1.45 ± 0.07 -0.33 ± 0.21 -0.03 ± 0.27
Solyc12g042480.1.1 Cytochrome P450 flavonol biosynthesis; leucodelphinidin biosynthesis; leucopelargonidin and leucocyanidin biosynthesis; luteolin biosynthesis
SL2.40ch12 1.71 ± 0.18 -0.37 ± 0.09 -0.12 ± 0.05
Solyc12g056580.1.1 Cellulose synthase cellulose biosynthesis SL2.40ch12 0.85 ± 0.1 -0.03 ± 0.03 -0.03 ± 0.1
3. Results
108
As for the set of 544 transcripts with significant effect of the “water restitution”
treatment, the enrichment analysis did not result in any over-represented GO
category. The comparative distribution (expressed as percentage) of gene models
over GO annotations in the set of 544 transcripts with significant effect of the water
treatment and of the overall list of gene models represented on the microarray slide is
displayed in the Figure 3.23.
Also, differentially expressed transcripts were mapped to metabolic pathways and
candidate genes for fruit quality traits are listed in the Table 3.68. Among 17 selected
genes, 4 were mapped to the ethylene metabolism, 3 were mapped to the cellulose
biosynthesis, 1 to the mevalonate pathway, 2 to the phenylpropanoid metabolism and
7 to the AsA metabolism.

3. Results
109
Figure 3.23 - Comparative distribution of gene models over GO annotations in the set of 544 transcripts with
significant «Water treatment» (input list) effect and in the overall list of gene models represented on the microarray
slide (Background/Reference) as computed by AgriGO singular enrichment analysis (SEA -
http://bioinfo.cau.edu.cn/agriGO/analysis.php).

3. Results
110
Table 3.68 - Annotation details of selected candidate gene in the microarray experiment showing a significant effect of the “water treatment” at the ANOVA
test (P< 0.01). Change in the transcript levels are reported according to RTq-PCR validation.
Gene model Functional descritpion Solcyc pathway Chromosome assignment
Fold change (FC) expression compared to M82 100%
(mean ± standard error)
M82 50% IL9adm 100% IL9adm 50%
Solyc08g067070.2 Cytosine-specific
methyltransferase methionine degradation I (to homocysteine) SL2.40ch08 1.42 ± 0.1 -0.14 ± 0.11 -0.25 ± 0.15
Solyc12g100330.1 Cytosine-specific
methyltransferase methionine degradation I (to homocysteine) SL2.40ch12 0.89 ± 0.11 -0.2 ± 0.08 0.11 ± 0.15
Solyc02g071380.2 1-aminocyclopropane-1-carboxylate oxidase 3
leucodelphinidin biosynthesis; leucopelargonidin and leucocyanidin biosynthesis SL2.40ch02 0.92 ± 0.2 -0.31 ± 0.19 0.47 ± 0.2
Solyc07g049550.2 1-aminocyclopropane-1-
carboxylate oxidase ethylene biosynthesis from methionine; flavonol biosynthesis; syringetin biosynthesis SL2.40ch07 1.38 ± 0.14 -0.65 ± 0.22 -0.52 ± 0.02
Solyc11g040340.1 Endoglucanase 1 cellulose biosynthesis SL2.40ch11 -2.01 ± 0.19 -0.16 ± 0.13 -0.21 ± 0.04
Solyc12g056580.1 Cellulose synthase cellulose biosynthesis SL2.40ch12 0.85 ± 0.1 -0.03 ± 0.03 -0.03 ± 0.05
Solyc08g061100.2 Cellulose synthase cellulose biosynthesis SL2.40ch08 1.47 ± 0.23 -0.21 ± 0.2 0.09 ± 0.08
Solyc08g080170.2 3-hydroxy-3-methylglutaryl
coenzyme A synthase mevalonate pathway SL2.40ch08 1.09 ± 0.09 0.02 ± 0.02 0.27 ± 0.03
Solyc09g092270.2 HXXXD-type acyl-transferase chlorogenic acid biosynthesis I; chlorogenic acid biosynthesis II; phenylpropanoid biosynthesis; simple coumarins biosynthesis
SL2.40ch09 2.88 ± 0.22 -0.02 ± 0.08 -0.32 ± 0.18
Solyc12g042480.1 Cytochrome P450 flavonol biosynthesis; leucodelphinidin biosynthesis; leucopelargonidin and leucocyanidin
biosynthesis; luteolin biosynthesis; syringetin biosynthesis SL2.40ch12 1.71 ± 0.18 -0.37 ± 0.09 -0.12 ± 0.03
Solyc02g067080.2 UDP-D-glucose dehydrogenase colanic acid building blocks biosynthesis; galactose degradation II; UDP-D-xylose biosynthesis SL2.40ch02 -2.49 ± 0.23 -0.01 ± 0.14 -0.66 ± 0.04
Solyc02g091510.2 GDP-L-galactose
phosphorylase ascorbate biosynthesis I (L-galactose pathway) SL2.40ch02 -1.61 ± 0.17 -0.17 ± 0.27 -0.3 ± 0.04
Solyc03g096050.2 GDP-L-galactose phosphorylase
ethylene biosynthesis from methionine; leucodelphinidin biosynthesis; leucopelargonidin and leucocyanidin biosynthesis
SL2.40ch03 -3.71 ± 0.01 0.17 ± 0.29 -0.4 ± 0.46
Solyc05g055710.2 L-ascorbate oxidase homolog ascorbate glutathione cycle SL2.40ch05 2.09 ± 0.05 -0.22 ± 0.27 0.00 ± 0.08
Solyc07g052230.2 L-ascorbate oxidase ascorbate glutathione cycle SL2.40ch07 1.14 ± 0.22 0.09 ± 0.22 0.39 ± 0.12
Solyc11g008860.1 L-ascorbate oxidase ascorbate glutathione cycle SL2.40ch11 -1.6 ± 0.08 -0.34 ± 0.08 -0.92 ± 0.05
Solyc12g094620.1 Catalase oxidative ethanol degradation III; removal of superoxide radicals SL2.40ch12 -1.47 ± 0.11 -0.59 ± 0.07 -0.68 ± 0.07

3. Results
111
Concerning the set of 456 transcripts with significant effect of the “genotype”, again,
the enrichment analysis did not result in any over-represented GO category. The
comparative distribution (expressed as percentage) of gene models over GO
annotations in the set of genes significantly affected in their expression by the
genotype and of the overall list of gene models represented on the microarray slide is
displayed in the Figure 3.24. Mapping transcripts differentially expressed in IL9adm
pericarp vs M82 allowed the selection of candidate genes potentially involved in
controlling fruit quality (Tab. 3.69). In particular, 2 genes were mapped to the
cellulose biosynthesis, 2 were mapped to the starch metabolism, 2 were mapped to
the pectin metabolism, 4 to the ethylene metabolism, 2 to the AsA metabolism, 2 to
the mevalonate pathway and 3 to the phenylpropanoid pathway. Change in the
expression of candidate transcripts were validated by RT-qPCR (Tab. 3.69).
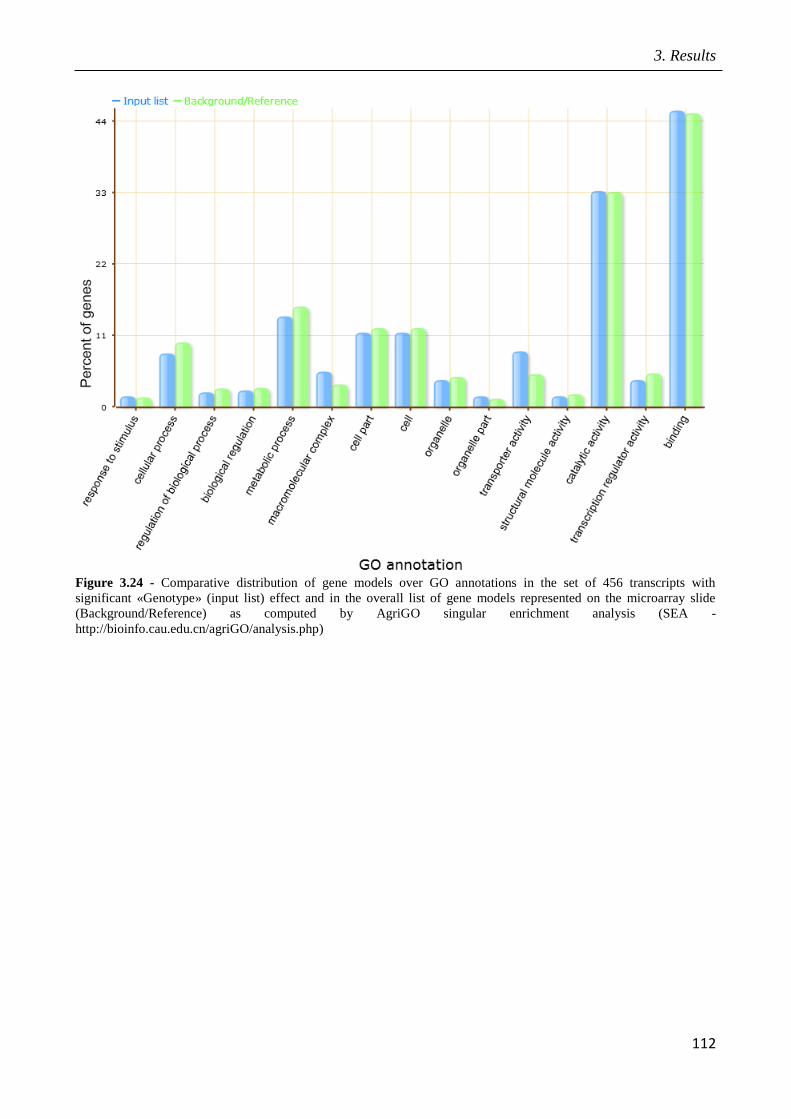
3. Results
112
Figure 3.24 - Comparative distribution of gene models over GO annotations in the set of 456 transcripts with
significant «Genotype» (input list) effect and in the overall list of gene models represented on the microarray slide
(Background/Reference) as computed by AgriGO singular enrichment analysis (SEA -
http://bioinfo.cau.edu.cn/agriGO/analysis.php)

3. Results
113
Table 3.69 - Annotation details of selected candidate genes in the microarray experiment showing a significant “Genotype” effect at the ANOVA test (P<
0.01). Change in the transcript levels are reported according to RTq-PCR validation.
Gene model Functional descritpion Solcyc pathway Chromosome assignment
Fold change (FC) expression compared to M82 100%
(mean ± standard error)
M82 50% IL9adm 100% IL9adm 50%
Solyc01g079180.2 pectinesterase homogalacturonan degradation SL2.40ch01 1.31 ± 0.17 1 ± 0.01 -0.15 ± 0.09
Solyc02g067080.2 UDP-D-glucose dehydrogenase colanic acid building blocks biosynthesis; galactose degradation II; UDP-D-xylose
biosynthesis SL2.40ch02 -2.46 ± 0.23 1.00 ± 0.01 -0.63 ± 0.08
Solyc02g071040.2 starch synthase IV precursor starch biosynthesis SL2.40ch02 1.24 ± 0.37 0.93 ± 0.01 -0.17 ± 0.03
Solyc03g096050.2 1-aminocyclopropane-1-carboxylate oxidase 1 ethylene biosynthesis from methionine; leucodelphinidin biosynthesis;
leucopelargonidin and leucocyanidin biosynthesis SL2.40ch03 -3.66 ± 0.01 1.02 ± 0.02 -0.35 ± 0.91
Solyc03g114810.2 Glycosyltransferase homogalacturonan biosynthesis SL2.40ch03 1.58 ± 0.24 1.00 ± 0.01 -0.65 ± 0.00
Solyc04g009860.2 1-aminocyclopropane-1-carboxylate oxidase ethylene biosynthesis from methionine SL2.40ch04 1.01 ± 0.11 0.96 ± 0.00 -0.18 ± 0.17
Solyc04g071800.2 CYP92B3 flavonol biosynthesis; leucodelphinidin biosynthesis; leucopelargonidin and leucocyanidin biosynthesis; luteolin biosynthesis; syringetin biosynthesis SL2.40ch04 -1.62 ± 0.14 1.00 ± 0.01 0.15 ± 0.28
Solyc05g007070.2 alpha-amylase starch degradation SL2.40ch05 1.48 ± 0.07 1.00 ± 0.01 -0.36 ± 0.17
Solyc05g055710.2 L-ascorbate oxidase ascorbate glutathione cycle SL2.40ch05 2.13 ± 0.05 0.98 ± 0.03 0.04 ± 0.17
Solyc07g049550.2 1-aminocyclopropane-1-carboxylate oxidase ethylene biosynthesis from methionine; flavonol biosynthesis; syringetin biosynthesis SL2.40ch07 1.42 ± 0.14 0.94 ± 0.02 -0.48 ± 0.05
Solyc08g061100.2 Cellulose synthase cellulose biosynthesis SL2.40ch08 1.48 ± 0.23 0.98 ± 0.02 0.09 ± 0.16
Solyc08g067070.2 Cytosine-specific methyltransferase methionine degradation I (to homocysteine) SL2.40ch08 1.44 ± 0.1 0.99 ± 0.01 -0.22 ± 0.29
Solyc08g080170.2 3-hydroxy-3-methylglutaryl coenzyme A
synthase mevalonate pathway
SL2.40ch08 1.09 ± 0.09 1.00 ± 0.00 0.27 ± 0.06
Solyc09g092270.2 HXXXD-type acyl-transferase family protein chlorogenic acid biosynthesis I; chlorogenic acid biosynthesis II; phenylpropanoid
biosynthesis; simple coumarins biosynthesis SL2.40ch09 2.96 ± 0.22 1.01 ± 0.01 -0.23 ± 0.35
Solyc10g086180.1 Phenylalanine ammonia-lyase flavonol biosynthesis; suberin biosynthesis SL2.40ch10 1.2 ± 0.09 0.91 ± 0.05 -0.69 ± 0.33
Solyc11g010850.1 1-deoxy-D-xylulose-5-phosphate synthase methylerythritol phosphate pathway; pyridoxal 5'-phosphate biosynthesis SL2.40ch11 2.33 ± 0.09 0.98 ± 0.02 -0.16 ± 0.08
Solyc11g040340.1 Endoglucanase 1 cellulose biosynthesis SL2.40ch11 -2.00 ± 0.19 0.99 ± 0.01 -0.21 ± 0.07
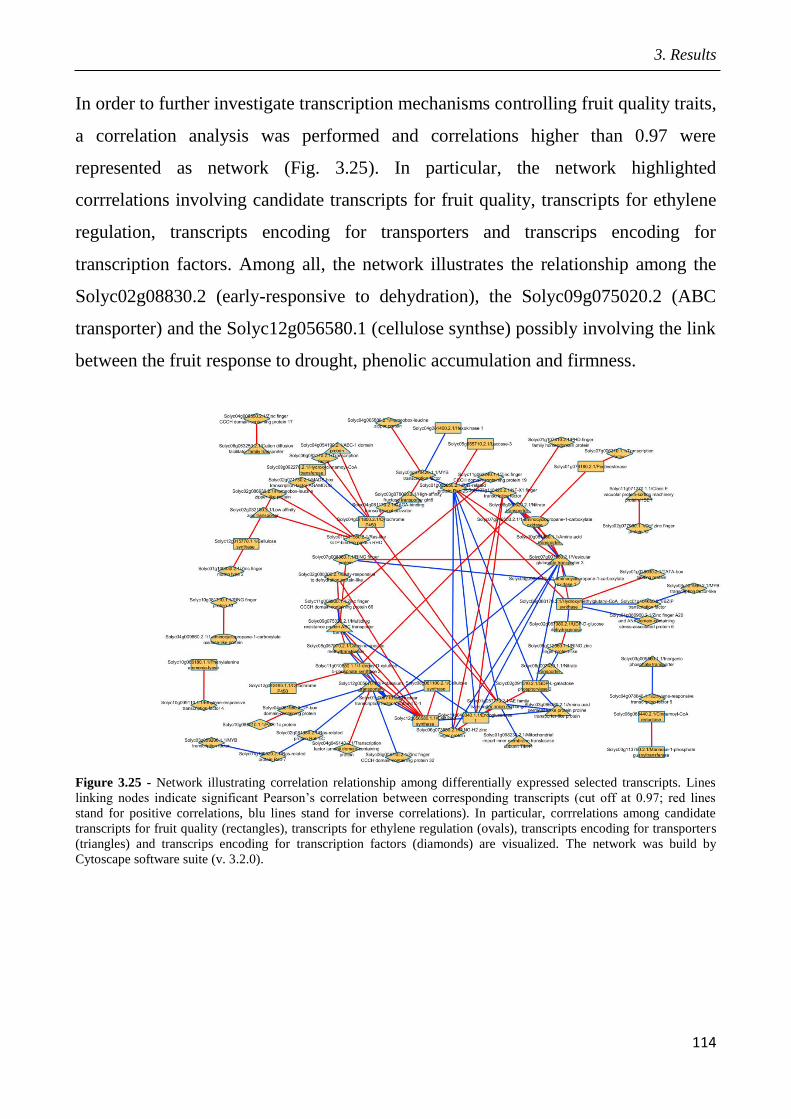
3. Results
114
In order to further investigate transcription mechanisms controlling fruit quality traits,
a correlation analysis was performed and correlations higher than 0.97 were
represented as network (Fig. 3.25). In particular, the network highlighted
corrrelations involving candidate transcripts for fruit quality, transcripts for ethylene
regulation, transcripts encoding for transporters and transcrips encoding for
transcription factors. Among all, the network illustrates the relationship among the
Solyc02g08830.2 (early-responsive to dehydration), the Solyc09g075020.2 (ABC
transporter) and the Solyc12g056580.1 (cellulose synthse) possibly involving the link
between the fruit response to drought, phenolic accumulation and firmness.
Figure 3.25 - Network illustrating correlation relationship among differentially expressed selected transcripts. Lines
linking nodes indicate significant Pearson’s correlation between corresponding transcripts (cut off at 0.97; red lines
stand for positive correlations, blu lines stand for inverse correlations). In particular, corrrelations among candidate
transcripts for fruit quality (rectangles), transcripts for ethylene regulation (ovals), transcripts encoding for transporters
(triangles) and transcrips encoding for transcription factors (diamonds) are visualized. The network was build by
Cytoscape software suite (v. 3.2.0).
3. Results
115
3.9 Marked assisted selection in tomato for transfer the QTL9adm to breeding
lines
The introgression line IL9adm from S. pennellii is well-known to be not only more
tolerant to drought, but also for displaying finer qualitative traits related to fruit
production, in comparison to the parental M82 tomato line.
Data from the trials we carried out in open field, showed that the IL9adm exhibited
higher content in both soluble solids, and total AsA content than M82, when the
plants were supplied with both the complete and partial volume of consumed water
during the fruit set and ripining stage.
Those phenotypic evidences proved as wild QTLs from IL9adm would enhance the
ability to produce larger amount of soluble solids and total AsA in tomato lines if
they were transferred in those lines.
For that reason, we decided to use a set of several advanced tomato breeding lines,
P011_58, P011_77, P011_85 and P011_156, selected for their higher agronomic
performances as well as high both quantitative and qualitative fruit productions in
comparison to M82, as parental male materials (♂) to cross to the IL9adm, used as
female (♀), in order to get on a MAS-based backcross breeding program heading to
set the wild and dissected QTLs from IL9adm in the recipient genomic background of
P011 tomato lines.
3.9.1 Identification of molecular markers targeting wild QTLs located on 9adm
genomic region
Upon selecting the set of DNA sequences within the genomic regions associated with
9adm introgression, each of them was amplified by PCR and the corresponding DNA
amplicons were sequenced from M82 and the set of tomato P011 tomato lines as well
as from IL9adm and the wild parental species S. pennellii (Sp).
By aligning the set of wild and cultivated DNA amplified fragments, different
molecular polymorphisms, such as SNPs, DNA deletions and insertions, were

3. Results
116
identified to be placed on restriction sites. Enzymes capable of cutting diversely
whether targeting either a wild or the corresponding cultivated restriction site, were
next detected. The set of resulting CAPS molecular markers (TG223, TC238140,
DB708941, TC235285, TC227407) able to evidence polymorphism between wild and
cultivated QTLs are listed and detailed in Tab. 3.70.
The theoretical patterns predicted in silico for each of the set of CAPS markers were
confirmed in vitro upon PCR and digestion of the selected amplicons with the proper
restriction enzyme and the resulting electrophoretic profiles are displayed in Fig.
3.26. In fact, upon running the products of digestion of each of amplicons through an
agarose electrophoretic gel, it was assessed how:
i) TG223 amplicon generated two different DNA fragments, the bigger (the
corresponding band evidencing a 750 bp-fragment in the gel pic) from M82 and the
P011 tomato lines, slighty heavier than the DNA fragment (whose band was
associated to a near 700 bp-fragment in the gel pic) from both Sp and IL9adm (Fig.
3.26A),
ii) TC238140 originated two different DNA fragments (whose molecular weights
were about 400 and 600 bp according to the bands in the gel pic) from M82 and the
P011 tomato lines, and three fragments (the associated bands weighed roughly 420,
500 and 100 bp in the gel pics) from both Sp and IL9adm (Fig. 3.26B),
Table 3.70 – List of CAPS markers detected among DNA sequences included in the chromosomic
region 9adm. The set of CAPS markers were used in the MAS-based breeding due to their ability to
distinguish wild and cultivated alleles and QTLs.
Marker
Amplicon length
(bp) Restriction
enzyme
Incubation
Temperature (°C)
Cultivated
allele
fragments
Wild
allele
fragments M82 IL9adm
TG223 1,200 1,200 Tru1 I 65 700 750
TC238140 1,026 1,036 Hind III 37 420+600 420+511+105
DB708941 1,344 1,293 Bspe I 37 1344 865+428
TC235285 1,172 1,184 Msc1 37 1,093+73 697+414+73
TC227407 1,000 1,000 Pst I 37 700+300 1,000
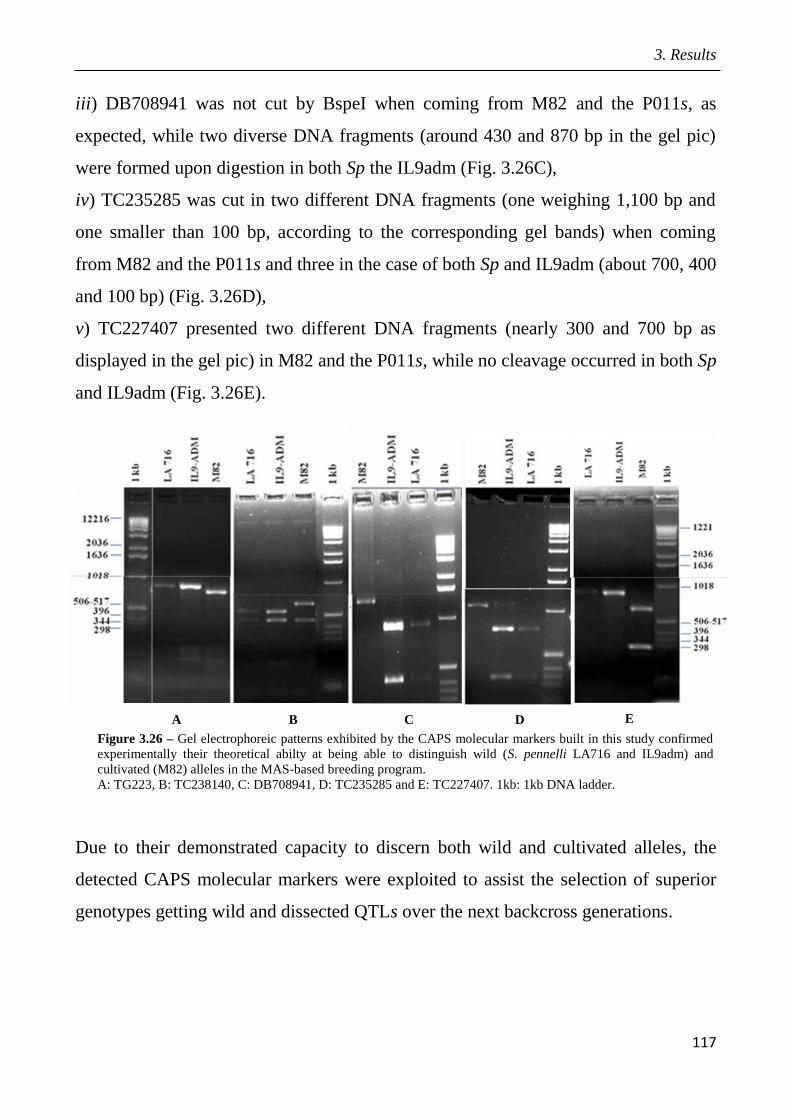
3. Results
117
Figure 3.26 – Gel electrophoreic patterns exhibited by the CAPS molecular markers built in this study confirmed
experimentally their theoretical abilty at being able to distinguish wild (S. pennelli LA716 and IL9adm) and
cultivated (M82) alleles in the MAS-based breeding program.
A: TG223, B: TC238140, C: DB708941, D: TC235285 and E: TC227407. 1kb: 1kb DNA ladder.
A B C D E
iii) DB708941 was not cut by BspeI when coming from M82 and the P011s, as
expected, while two diverse DNA fragments (around 430 and 870 bp in the gel pic)
were formed upon digestion in both Sp the IL9adm (Fig. 3.26C),
iv) TC235285 was cut in two different DNA fragments (one weighing 1,100 bp and
one smaller than 100 bp, according to the corresponding gel bands) when coming
from M82 and the P011s and three in the case of both Sp and IL9adm (about 700, 400
and 100 bp) (Fig. 3.26D),
v) TC227407 presented two different DNA fragments (nearly 300 and 700 bp as
displayed in the gel pic) in M82 and the P011s, while no cleavage occurred in both Sp
and IL9adm (Fig. 3.26E).
Due to their demonstrated capacity to discern both wild and cultivated alleles, the
detected CAPS molecular markers were exploited to assist the selection of superior
genotypes getting wild and dissected QTLs over the next backcross generations.
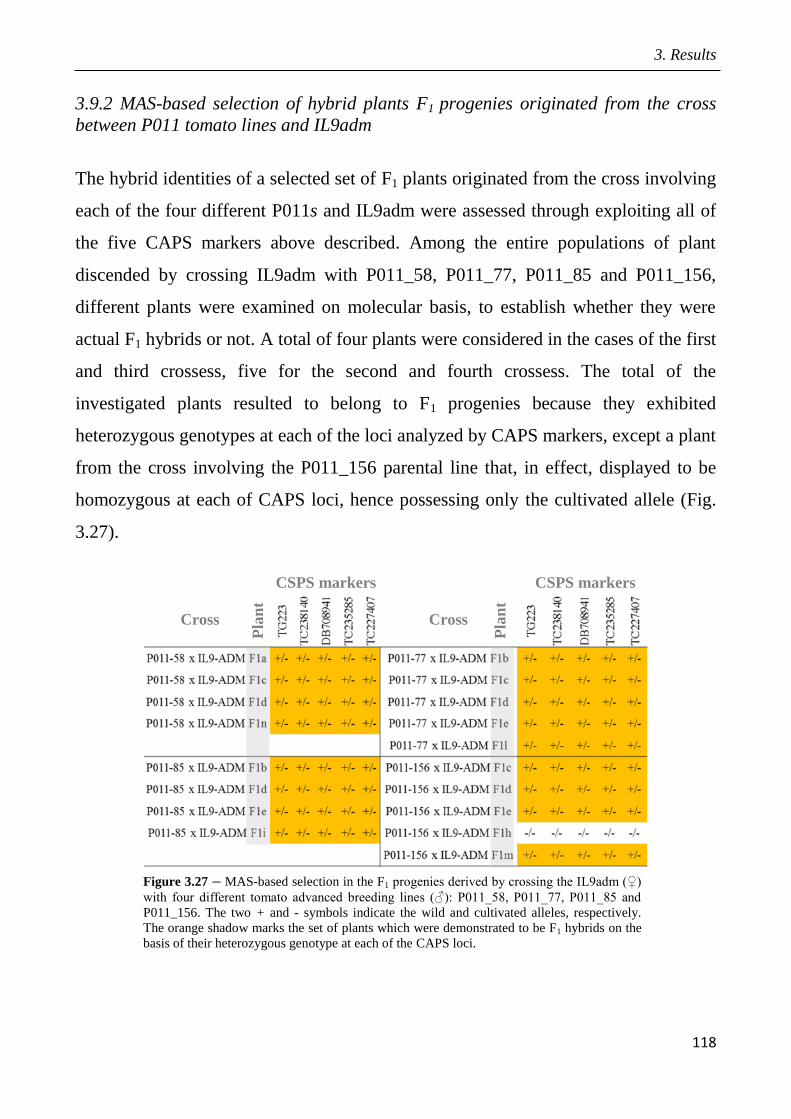
3. Results
118
CSPS markers CSPS markers
Cross Cross
Pla
nt
Pla
nt
Figure 3.27 – MAS-based selection in the F1 progenies derived by crossing the IL9adm (♀)
with four different tomato advanced breeding lines (♂): P011_58, P011_77, P011_85 and
P011_156. The two + and - symbols indicate the wild and cultivated alleles, respectively.
The orange shadow marks the set of plants which were demonstrated to be F1 hybrids on the
basis of their heterozygous genotype at each of the CAPS loci.
3.9.2 MAS-based selection of hybrid plants F1 progenies originated from the cross
between P011 tomato lines and IL9adm
The hybrid identities of a selected set of F1 plants originated from the cross involving
each of the four different P011s and IL9adm were assessed through exploiting all of
the five CAPS markers above described. Among the entire populations of plant
discended by crossing IL9adm with P011_58, P011_77, P011_85 and P011_156,
different plants were examined on molecular basis, to establish whether they were
actual F1 hybrids or not. A total of four plants were considered in the cases of the first
and third crossess, five for the second and fourth crossess. The total of the
investigated plants resulted to belong to F1 progenies because they exhibited
heterozygous genotypes at each of the loci analyzed by CAPS markers, except a plant
from the cross involving the P011_156 parental line that, in effect, displayed to be
homozygous at each of CAPS loci, hence possessing only the cultivated allele (Fig.
3.27).
3. Results
119
3.9.3 MAS-based selection of plants in the F2 progenies originated from the cross
between P011 tomato lines and IL9adm
Once F1 plants were detected by using the set of CAPS markers, they were permitted
to self in order to get four different F2 progenies each deriving from one of the P011
recurrent parental line. The entire population of F2 plants were analyzed by mean of
the five CAPS markers, with the purpose to detect the group of plants harboring the
integral 9adm introgression in homozygous condition, the group of plants lacking the
9adm introgression or any part of it, and the group of plants displaying possible
recombinations occurring on the 9adm introgression. In Fig. 3.28 are indicated the
genotypes assessed at the each of the five different CAPS loci for each F2 plant.
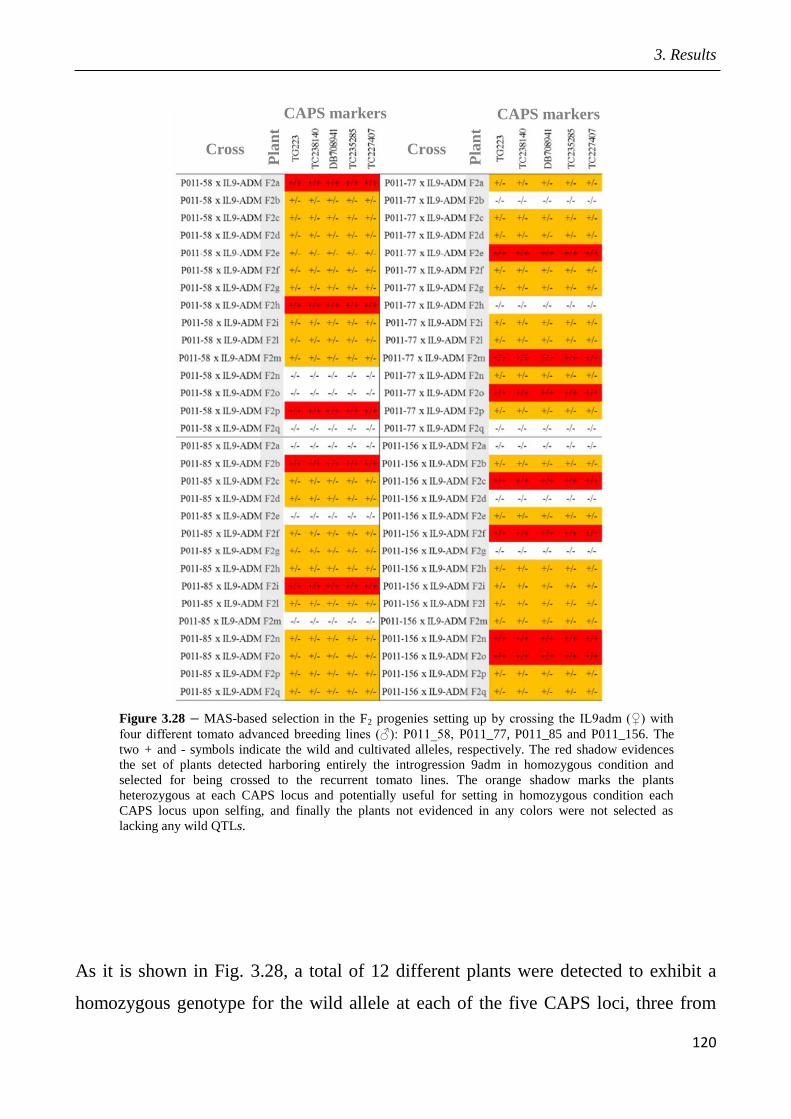
3. Results
120
CAPS markers CAPS markers
Cross Cross
Pla
nt
Pla
nt
Figure 3.28 – MAS-based selection in the F2 progenies setting up by crossing the IL9adm (♀) with
four different tomato advanced breeding lines (♂): P011_58, P011_77, P011_85 and P011_156. The
two + and - symbols indicate the wild and cultivated alleles, respectively. The red shadow evidences
the set of plants detected harboring entirely the introgression 9adm in homozygous condition and
selected for being crossed to the recurrent tomato lines. The orange shadow marks the plants
heterozygous at each CAPS locus and potentially useful for setting in homozygous condition each
CAPS locus upon selfing, and finally the plants not evidenced in any colors were not selected as
lacking any wild QTLs.
As it is shown in Fig. 3.28, a total of 12 different plants were detected to exhibit a
homozygous genotype for the wild allele at each of the five CAPS loci, three from
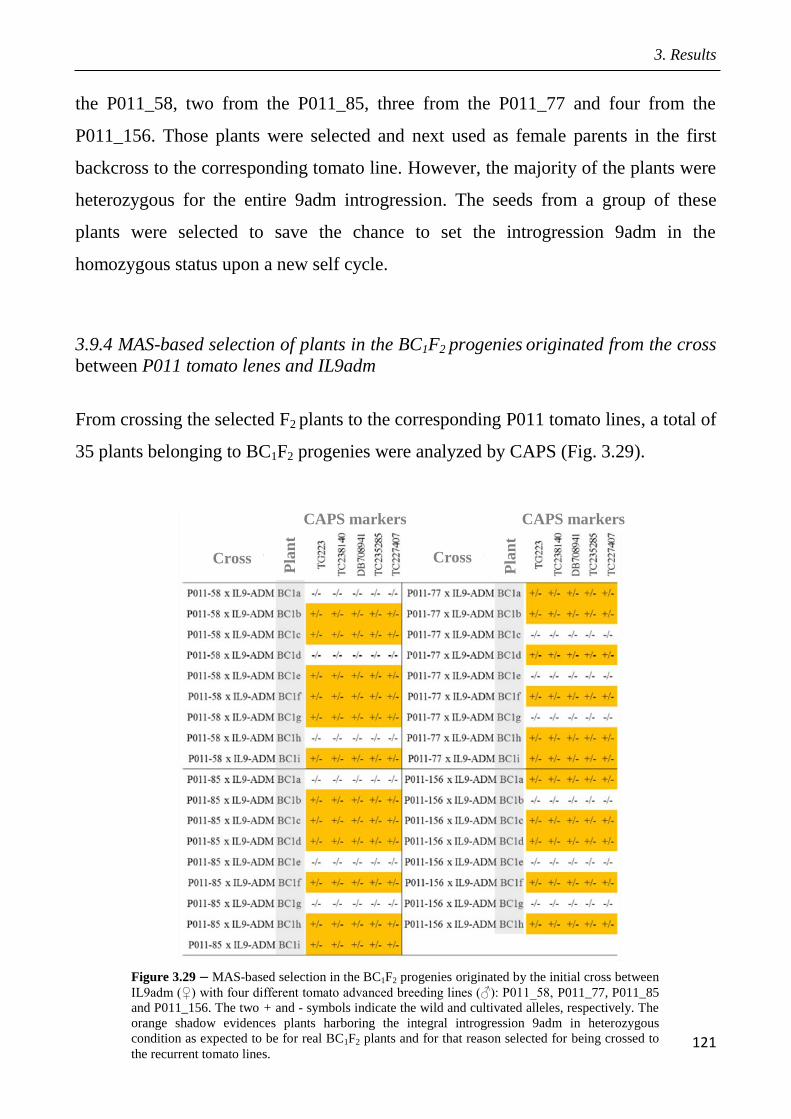
3. Results
121
CAPS markers
Cross Cross
Pla
nt
Pla
nt
Figure 3.29 – MAS-based selection in the BC1F2 progenies originated by the initial cross between
IL9adm (♀) with four different tomato advanced breeding lines (♂): P011_58, P011_77, P011_85
and P011_156. The two + and - symbols indicate the wild and cultivated alleles, respectively. The
orange shadow evidences plants harboring the integral introgression 9adm in heterozygous
condition as expected to be for real BC1F2 plants and for that reason selected for being crossed to
the recurrent tomato lines.
CAPS markers
the P011_58, two from the P011_85, three from the P011_77 and four from the
P011_156. Those plants were selected and next used as female parents in the first
backcross to the corresponding tomato line. However, the majority of the plants were
heterozygous for the entire 9adm introgression. The seeds from a group of these
plants were selected to save the chance to set the introgression 9adm in the
homozygous status upon a new self cycle.
3.9.4 MAS-based selection of plants in the BC1F2 progenies originated from the cross
between P011 tomato lenes and IL9adm
From crossing the selected F2 plants to the corresponding P011 tomato lines, a total of
35 plants belonging to BC1F2 progenies were analyzed by CAPS (Fig. 3.29).

3. Results
122
Six plants originated from each of the tomato lines, P011_58, P011_77, P011_85 and
P011_156, were selected in the corresponding BC1F2 populations due to their
heterozygous condition at each of the CAPS locus located on the 9adm genomic
region, revealing their possess of wild QTLs, and further crossed to the proper P011
line in order to get the BC2F2 progenies.
3.9.5 MAS-based selection of plants in the BC2F2 progenies originated from the cross
between P011 tomato lines and IL9adm
Upon crossing plants picked up in the BC1F2 population back to the four different
recipient parental tomato lines, a total of 52 plants belonging to BC2F2 progenies,
thirteen from each of the P011 lines, were analyzed by mean of CAPS markers (Fig.
3.30).

3. Results
123
Cross Cross
Pla
nt
Pla
nt
CAPS markers CAPS markers
Figure 3.30 – MAS-based selection in the BC2F2 progenies from the initial cross between IL9adm (♀) with four different
tomato advanced breeding lines (♂): P011_58, P011_77, P011_85 and P011_156. The two + and - symbols indicate the wild
and cultivated alleles, respectively. The orange shadow evidences plants harboring the integral introgression 9adm in
homozygous condition and for that reason selected for being next crossed to the recurrent tomato lines. Several plants
displayed recombination between wild and cultivated alleles along the 9adm genomic region, as shown by the orange
shadow covering partially the different CAPS loci.
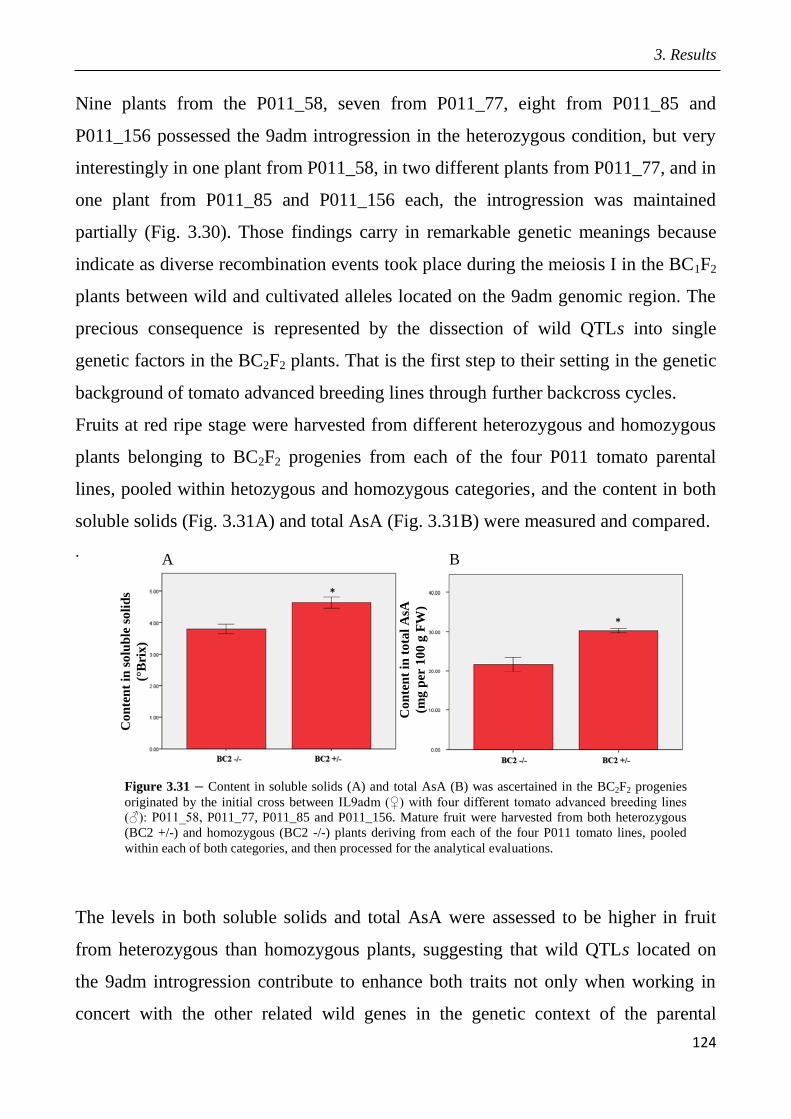
3. Results
124
A B
Figure 3.31 – Content in soluble solids (A) and total AsA (B) was ascertained in the BC2F2 progenies
originated by the initial cross between IL9adm (♀) with four different tomato advanced breeding lines
(♂): P011_58, P011_77, P011_85 and P011_156. Mature fruit were harvested from both heterozygous
(BC2 +/-) and homozygous (BC2 -/-) plants deriving from each of the four P011 tomato lines, pooled
within each of both categories, and then processed for the analytical evaluations.
Co
nte
nt
in t
ota
l A
sA
(mg
per
10
0 g
FW
)
Co
nte
nt
in s
olu
ble
so
lid
s
(°B
rix
)
Nine plants from the P011_58, seven from P011_77, eight from P011_85 and
P011_156 possessed the 9adm introgression in the heterozygous condition, but very
interestingly in one plant from P011_58, in two different plants from P011_77, and in
one plant from P011_85 and P011_156 each, the introgression was maintained
partially (Fig. 3.30). Those findings carry in remarkable genetic meanings because
indicate as diverse recombination events took place during the meiosis I in the BC1F2
plants between wild and cultivated alleles located on the 9adm genomic region. The
precious consequence is represented by the dissection of wild QTLs into single
genetic factors in the BC2F2 plants. That is the first step to their setting in the genetic
background of tomato advanced breeding lines through further backcross cycles.
Fruits at red ripe stage were harvested from different heterozygous and homozygous
plants belonging to BC2F2 progenies from each of the four P011 tomato parental
lines, pooled within hetozygous and homozygous categories, and the content in both
soluble solids (Fig. 3.31A) and total AsA (Fig. 3.31B) were measured and compared.
.
The levels in both soluble solids and total AsA were assessed to be higher in fruit
from heterozygous than homozygous plants, suggesting that wild QTLs located on
the 9adm introgression contribute to enhance both traits not only when working in
concert with the other related wild genes in the genetic context of the parental

3. Results
125
IL9adm introgression line, but also when dissectected and taken away from the
original 9adm introgression. Those findings seem to be suggesting as robust
improvement in the fruit content of both soluble solids and total AsA and perhaps in
other important traits associated with both quantitative and qualitative production in
tomato, are strongly supposed to be dragged upon the backcross breeding program
will be coming to harbor in next future.

4. Discussion
126
4 Discussion
An initial objective of the project was to identify the variability in the tomato
processing fruit quality. In a recent past the food company choices pointed at an
higher content of soluble solids and at a good firmness. These two features are still
very important because on one hand an increase in soluble solids of just 1%
represents ~20% increase in yield of certain processed products (Foolad et al., 2007)
and on the other hand softening considerably influences post-harvest performance
like transportation and storage (Brummel and Harpster, 2001).
Among others, components of the tomato nutritional quality are the biomolecules
(carotenoids, vitamins, and phenols) with antioxidant properties present in fruits,
leading to the beneficial role of tomato intake in human diseases. Several studies
showed a role of tomato fruits in the healing and prevention of some illnesses. Their
consumption is associated with a reduced risk of cancer, inflammation, and chronic
noncommunicable diseases including cardiovascular diseases such as hypertension,
coronary heart disease, diabetes, and obesity (Zu et al., 2014; Wilkinson and Chodak,
2003; Cohen, 2002).
Consumers are more sensible than in the past about the role of fruits and vegetables
in the human health and some authors refer to tomato as a functional food (Canene-
Adams et al., 2005)
Therefore, currently the nutritional quality of the fruit constitutes one of the major
objectives of tomato breeding.
Within this context we set out a first open field trial with the aim of assessing the
phytochemical content of commercial tomato hybrids.
Regarding the soluble solid content, hybrids ranged between 4.05 and 4.70 °Brix.
These results match those observed in earlier studies: Kavitha and co-authors
reported a range between 3.7 and 5.2 °Brix in commercial varieties and hybrids
(2013).

4. Discussion
127
In reviewing the literature, only few data were found allowing the comparison
between hybrids and commercial and introgression lines. As a consequence we
thought to compare antioxidant values of our hybrids to either introgression lines or
commercial hybrids.
The choise to show the composition of tomatoes on a fresh matter basis (FW) was
taken because in this trial it is essential to consider the nutritional value. The dry
matter content of microconstituents is more pertinent when comparisons of the effect
of the mode of colture on the composition plant are made (as we made for the next
trials we are going to show).
We found great variability in terms of total phenolic compounds. The range was 8.50-
38 mg GAE ∙ 100 g FW-1
. Other authors registered values significantly lower, 1.89-
3.08 mg 100 g FW-1
in eleven cultivars or 2.24-3.75 mg 100 g FW in twelve tomato
advanced breeding lines and six open pollinated cultivars (Kacjan Marsic et al., 2011;
Frusciante et al., 2007). Carillo-Lopez and Yahia (2013) recorded an average value of
about 50 mg GAE ∙ 100 g FW-1
with the highest amount in the exocarp.
Di Matteo and co-workers (2013) found 44.39 mg GAE ∙ 100 g FW-1
in the
homozygote tomato Red Setter, while Rigano et al. (2014) recorded an amount of
about 9 and 14 mg GAE ∙ 100 g FW-1
in two tomato lines.
The flavonoid content observed in our study (5.72 - 6.71 mg QE ∙ 100 g FW
-1) was
very similar to the amount found by Davilla-Avina et al. (2012) in a cultivar grown in
greenhouse, but 2 folds higher than Frusciante et al. (2007).
Di Matteo et al. (2013) registered a flavonoid amount slightly higher than ours in a
homozygote line, while Rigano et al. (2014) observed an amount about 2 times lower
in two tomato introgression lines.
Among the water-soluble antioxidants than we analyzed, Ascorbic acid (AsA)
showed results in line with common commercial varieties (about 20 mg ∙ 100 g FW-1
)
(Gould, 1992). However the AsA amount in our Hybrid trial was higher than some
cultivars presented by Caris-Veyrat and co-workers (2004). Sacco et al. (2012)
recorded an high value of AsA in two ILs (35 - 40 mg ∙ 100 g FW-1
) when they were

4. Discussion
128
grown in greenhouse, while when they were allevated in open field, values were
similar to the ours.
Shifting our attention on lipid-soluble bioactive compounds, we analyzed the level of
carotenoids in the commercial hybrids. The average value we found, was equal to
65.98 ± 7.66 μg ∙ g FW
-1. As mentioned in literature review, the relative contribution
of lipid-soluble antioxidants to the total antioxidant activity in tomato fruits is much
lower than the contribution from water-soluble antioxidants (Frary et al., 2010).
Rigano et al. (2014) registered a range between 70.15 and 130.56 μg ∙ g FW
-1 in an
introgression line, while great genotypic variation was observed for total carotenoids
among tomato cultivars, hybrids, cherry tomatoes and wild species in the paper by
Kavitha and co-workers (2013).
The results of Duncan test analysis conducted on our tomatoes didn’t show any
significant variability among our hybrids in terms of total carotenoids.
We used a pricipal component analysis (PCA) to discriminte plants based on the
overall fruit qualities. However, the PCA didn’t show a sharp difference among
Hybrids. Only Perfect Peel performed higher with respect to the components one and
two who explayned AsA, flavonoids, dry weight and phenolic compounds.
One interesting finding from the PCA was the relation observed between the shape
and the fruit quality given the discrimination effectively operated by fruit shape on
compents one and two.
This result is in keeping with a previous study by Kacjan Marsic et al. (2011) where a
significant effect of the shape was observed among fruit quality traits.
The general result of this study indicates a narrow variability in terms of nutritional
quality in the tomato commercial hybrids.
According to this evidence, wild germoplasm (i.e. introgression lines) could be a
precious resource to enhance the nutritional quality variability. These lines could be
used as a valuable resource to improve several important traits, such as fruit yield,
nutritional value and tolerance to enviromental stresses of tomato cultivars when wild
QTLs are transferred and fixed in the tomato genetic background. Marker assisted

4. Discussion
129
breeding may help in identifying backcross populations with higher content in
antioxidants and more tolerant to abiotic stresses (Kavitha et al., 2013). Among these,
drought has a major impact on plant growth and development, limiting crop
production throughout the world. Soils too dry for crop production cover 28% of the
earth’s land (Bray, 2004). Moreover challenge for current agricultural biotechnology
is to satisfy an ever increasing demand in food production facing a constantly
increasing world population that will reach more than 9 billion in 2050 (Godfray et
al., 2010; Tester and Langridge, 2010).
According to these evidences, we selected the introgression line 9adm which was
shown to have some interesting features, in terms of fruit quality and drought
tolerance, in previous studies carried out in our laboratory.
Consiquently the second question of our research aimed to determine the effect of
water shortage on tomato fruit quality and yield in the domesticated genotype M82
and in the above mentioned IL9adm. The latter harbors a segment of about seven
centimorgans derived from the wild tomato related species Solanum pennellii. Two
trials were designed either in open field or in more environmental controlled
conditions, in tunnel. In both the experiments M82 and IL9adm were grown applying
two different water regimes: full water restitution (100% WR) and half water
restitution (50% WR).
Once tomatoes reached the red ripe (RR) stage, their antioxidant content was analized
on fresh tomato, upon trasformation in tomato sauce (PP) and after 53 days post
harvest (53 dph).
To check the water depletion effects on plants from the open field trial, leaves were
analyzed. First of all, we measured the hydrogen peroxide (H2O2) amount, cosidered
one of the most important oxidative indicator of stress. H2O2 was found to be
significantly higher in M82 under the 50% WR condition. Under stress condition,
plants develop abscisic acid (ABA) and once it is imported into guard cells this
triggers the production of reactive oxygen species (ROS) such as H2O2 (Jarzyniak and
Jasinski, 2014). The H2O2 content was also measured in fruits at RR stage. The
4. Discussion
130
results confirmed a significant effect of the water restitution. From the microarray
analysis we observed that the gene Solyc12g094620.1 (a catalase) was more down-
regulated under stress condition. A less amount of catalase could emphasize the H2O2
action. Then the relative water content (RWC) analysis was carried out in order to
clarify if the less water supply in the soil corresponded to a decrease in the leaf water
content. It showed a significant effect of the water restitution. Stressed leaves got
more water and data are in agreement with Sacco et al. (2013). Beside the RWC, we
carried out an analysis of water loss rate (WLR). IL9adm lost significantly less water
than M82 across several time points. Therefore, we concluded that IL9adm was much
effective in controlling leaf water loss and this might contribute to its higher
tolerance. These differential behaves can be compared to results published by Liu and
co-workers (2015). They studied the drought stress in transgenic tomato lines
carrying drought tolerant genes and within the control. They discovered that
transgenic plant had lower WLR and higher RWC (Liu et al., 2015). It has been
reported that solutes like carbohydrates, play an important roles in enhancing plant
tolerance to a wide range of environmental stresses (Chen et al., 2007). The solute
accumulation mantein cellular osmotic adjustment and membrane integrity and may
also enhance the water retantion capacity of plant under stress condition. The higher
RWC and lower WLR we found in IL9adm could be explained by the significant
higher content of soluble solids (SSC) in IL9adm, constituted in majority by sucrose
and other carbohydrates. Altough our observations on the SSC were limited to fruit
we suggest that a differential attitude to control osmotic adjustment might contribute
to the higher tolerance in IL9adm. The tolerant plant had higher SSC than M82 in
both open-field or tunnel trials. According to Helyes et al. (2012) and Barbagallo et
al. (2013) the SSC increased when the 50% WR was applied. An increased synthesis
of sugar and polyol compounds is triggered by various abiotic stresses. However,
accumulated sugars may differ among plant species and nature of abiotic stressors
(Zhuo et al., 2013; Folgado et al., 2014; Moyankova et al., 2014).
As reported in the chapter two, the genotype IL9adm is a subline of the parental line
4. Discussion
131
IL9-2-5, a tomato line of the cultivated species, Solanum lycopersium, carrying a 9
cM introgression from the wild species, Solanum pennellii. IL9-2-5 produces fruit
with high soluble solids content (Brix), an important determinant of fruit quality for
processing. Two quantitative trait loci relating to fruit soluble solids content have
been identified within the introgressed segment. One of these QTLs, the, the Brix-9-
2-5, has been shown to encode a fruit apoplastic invertase (Lin5) with altered kinetic
properties (Fridman et al., 2002; Baxter et al., 2005). In our study, we proved that the
gene Lin5, involved in an higher fruit SSC, is outside of the introgressed wild
segment in IL9adm. In the same time, IL9adm showed always an higher amount of
SSC than M82 and consequently it could suggest that other genes might be involved
in the higher fruit SSC accumulation.
The current study found that the restitution of only the half the evapotranspirated
water significantly affects the total yield per plant and the marketable yield per plant.
The 50% WR led to an important reduction of yield in our trials, but IL9adm showed
a significant less loss with respect to M82.
In previous study on tomatoes, the drought stress condition negatively affected the
total yield which was less than half than that produced under full irrigation. The loss
in marketable yield was statistically significant too (Barbagallo et al., 2013). The
same evidences were confirmed by Helyes et al. (2012) evaluating the effect of
different water level irrigations on processing tomatoes. The number of marketable
fruits per plant was reduced as soil water tension during fruit development and
maturation growth stages increased, mainly since many small green fruits aborted or
did not enlarge under drier conditions (Marouelli and Silva, 2007).
Taken together, the above mentioned results of our study suggest that the genotype
IL9adm is more tolerant than the genotype M82 in condition of half water supply.
These results are in line with the fact that IL9adm harbors a shoot-specific QTL (PW
9-2-5) derived from its parental subline, the plant IL9-2-5. This QTL accounts for an
altered growth habit resulting in increases in plant weight, yield and Brix units.
Investigating the drought effect on M82 and IL9-2-5, Rigano et al. (2014) observed a
4. Discussion
132
better response to water deprivation in IL9-2-5. The latter genotype maintained an
higher percentage of fruit weight and an aboveground biomass (Rigano et al. 2014).
Althogh we didn’t find any significant difference in terms of aboveground mass, an
higher tap root was noticed in IL9adm in the hydroponic trial aiming to compare
some biometric measures in our two genotypes. The difference was statistically
significant and point out the contribution of root morphology to the higher drought
tolerance in IL9adm. Further work is required to establish this.
Studying novel loci regulating interspecific variation in root morphology and cellular
development in tomato, Ron and co-authors (2013) discovered that a number of S.
pennellii loci provided a long root phenotype compared with the corresponding loci
in M82.
If we focus our attention on antioxidant content in tomato berries, we can observe
that while the ascorbic acid (AsA) content was not significantly affected by the water
restitution in the open field trial, it was shown to be significantly higher in IL9adm
50% WR in the lysimeter trial and this increase was associatd to changes in the
expression of a number of AsA biosynthetic genes. It is generally assumed that plant
tolerance to environmental stresses is positively correlated with AsA content
(Knörzer et al. 1996; Tambussi et al. 2000). Neverthless reviewing the literature,
discordant results emerged.
Barbagallo et al. (2013) found an AsA content significantly greater in tomatoes
grown under very limited soil water conditions, while Helyes et al. (2012) measured
significantly higher content of AsA with optimum water supply conditions. Dumas et
al. (2013) reported that vitamin C production is promoted by water limitation in
processing tomato, although the extent of this effect may be cultivar-dependent.
Another study revealed that ascorbate content decreased in tomato fruits that were
shaded during ripening (Gautier et al., 2008).
The transcriptomic analysis of fruit pericarp allowed the identification of a number of
candidate genes for controlling differently the fruit level of AsA in the two genotypes
in response to drought. Among transcripts with significant interaction “genotype x
4. Discussion
133
water treatment”, a GDP-L-galactose phosphorylase gene and a mannose-1-
phosphate guanyltransferase gene were significantly downregulated in M82 under
50% of water restitution thus negatively correlating the AsA accumulation. These
results support the hypothesys that the Smirnoff-Wheel pathway might not contribute
to the increase in AsA fruit level in drought challenged plants. Similarly, the increase
in the transcript level of an ascorbate oxidase gene may lead to an higher rate of AsA
usage that may not explain the increase in AsA in M82 treated with 50% water
restitution. On the other hand, the fact that the transcription level of two UDP-D-
glucose dehydrogenase and of an galactokinase gene correlated with the fruit AsA
level point out the involvement of the L-gulonate pathway in controlling the AsA
level in response to drought. Also, a polygalacturonase gene showed a transcription
level correlating to the level of AsA supporting the hypothesis that the alternative D-
galacturonate pathway may give its contribution to the AsA pool in response to
drought.
A differential effect of storage on AsA was observed. While AsA in M82 100%
slightly decreased, the storage led to a great enhancement in the 50% WR (+ 68%). In
IL9adm after 53 days post harvest (53 dph), the increase was observed in the 100 %
WR condition (+ 20%), instead.
Vinha et al. (2013) investigated the effect of a 15 day storage at different
temperatures on antioxidants in several cultivars. They discovered an increase in
AsA, but its value was cultivar dependent.
Conversely the vitamin C showed a decay of about 45% after 12 days of storage
(Moneruzzaman et al., 2009). A possible explation of the AsA variation during the
storage is that ripening phenomen are still in action during the post harvest and it may
lead to a change in the antioxidant composition (Valverde et al., 2011).
As aspected, the processing led to a significant decrease of AsA in both the genotypes
and treatments. Vitamin C losses during food processing are likely to be due to a
combination of (endogenous) enzymatic activity (e.g., ascorbic acid oxidase) and heat
treatment (Lopez-Sanchez et al., 2015).

4. Discussion
134
Abuscita et al. observed that Just 45% of the initial content of ascorbic acid was
retained in the final tomato paste using an hot break processing, the same of our study
(Abushita et al., 2000).
Phenolic compounds ranged between 498 and 620 mg GAE ∙ 100g DW-1
in tomatoes
from the open field trial.
A slight decrease was caused by the 50% WR, but the ANOVA didn’t show any
significant effect of the genotype or of water restitution. Under tunnel no variation
occurred in M82, while there was a significant increase in IL9adm. A moderate
reduction in therms of total phenolics compounds was also displayd by Helyes et al.
(2012) while an increase was led by drought conditions in the experiment by
Barbagallo et al. (2013). In addition, the analysis of gene expression allowed to
correlate the expression of a phenylalanine ammonia-lyase gene, a key function in
controlling phenolics biosynthesis, with an aminocyclopropane-1-carboxylate oxidase
gene, thus highlighting the role of ethylene and fruit ripening in controlling the
accumulation of phenolics in response to stress.
In general phenolics rised during the storage according to Davila-Avina et al. (2012),
but in contrast with Vinha et al. (2013).
The processing led to a decay of phenolics, but it didn’t happen in IL9adm which
showed almost no variations in the WR 50% and an increase (10%) in 100% WR.
Conflicting results for total phenolics, flavonoids, and the total hydrophilic
antioxidant activities of processed tomato samples (Capanoglu et al., 2008) were
found in the current literature.
Some studies indicate that a considerable loss of hydrophilic antioxidants is caused
by the processing approach. In experiments conducted by Chang et al. (2006), two
tomato varieties showed that the total phenolic content increased by 13% and 50% in
two different heating treatments respectively, when compared to the corresponding
levels in fresh tomatoes (Chang et al., 2006).
Among the phenolic acids, the chlorogenic acid was the major compound, while the
most abundant flavonoid and phenolic compound in general, was the rutin according

4. Discussion
135
to Martinex-Huelamo et al. (2015). Taken individually, all the phenolic compounds
increased upon the transformation, in our experience. Rutin was more than twice
higher in the tomato sauce than in the raw tomato while chlorogenic acid and caffeic
acid showed a slight decrease (Martinex-Huelamo et al., 2015).
We registered a general increase in quercetin (on average + 66%). Processing into the
end product can increase the content of free quercetin by up to 30%, a change that
may be brought about by enzymatic hydrolysis of quercetin conjugates (Stewart et
al., 2000). Opposite evidences were found by Crozier et al. (1997) who studied the
effect of cooking on the quercetin content of onions and tomatoes. With both
vegetables, boiling reduced the quercetin content by 80%, microwave cooking by
65%, and frying by 30% (Crozier et al., 1997).
Despite the storage led to an increase in total phenolic compounds, a decrease for
each of the phenolic compounds was observed except for the rutin in IL9adm 50%
WR and M82 WR 100%. The increase in Folin-Ciocalteau reactive products can be
explained by the formation of Maillard reaction products (MRPs) as a consequence of
nonenzymatic browning. It is known that intermediate as well as final MRPs
melanoidins exert antioxidant activity (Lee et al., 1992). Rutin was shown to be
stable in an experiment of dried tomato storage at 4 °C (Giovannelli and Paradiso,
2002).
The total carotenoid content rised under the 50 % WR and this result is consistent
with earlier studies (Barbagallo et al., 2013). The total level of carotenoid in red ripe
fruit was unaffected by the genotype. As for the lysimeter trial, a great enhancement
of carotenoids was observed in M82 in the 50% WR condition with a significant
effect of the water treatment. In agreement with this result, the microarray analysis
displayd an over-expression of the gene Solyc08g080170.2 that is annotated as 3-
hydroxy-3-methylglutaryl coenzyme A synthase and wasmapped tothe mevalonate
pathway which synthesizes isoprenoids that are precursors of carotenoids.
Except for IL9adm 50% the storage led to an increase in total carotenoids.
Abushita et al. (2000) reported a decay of total carotenoids upon hot break processing

4. Discussion
136
from 1430 to 1318 μg ∙ g DW-1
, but with no significant change in the individual
carotenoid composition.
Lycopene is by far the most studied antioxidant compund in tomato for its ability of
prevention in prostate cancer (Mucci et al., 2014). Despite the pre-dominance of
dietary all-trans-lycopene, cis-isomers account for 58-73% of total lycopene in
human serum. Very recently Cooperstone and co-workers (2015) observed that all-
trans-lycopene accounted for 90% of total lycopene in their tomato juice. Nevertless
they found that cys-lycopene was by far the more bioavailable in a clinical study in
human (Cooperstone et al., 2015).
In our study we found a maximum lycopene content of 8.65 μg ∙ g DW-1
in M82 50%
WR consistent with a range of 1.86-14.62 of mg per 100 g of FW previously reported
(Frusciante et al., 2007). The drought stress led to a significant enhancement of this
compound in the open field trial and this corroborates the increase of total
carotenoids observed in the tunnel trial.
A decrease in its content was observed in tomato sauces, except for M82 100% WR.
Page et al., (2012) discovered that upon an hot break, tomato sauce from M82 lost
about 20% of lycopene, while IL9adm lost about 35% of its lycopene content.
Takeoka and co-workers (2001) reported no consistent changes in lycopene levels as
the fresh tomatoes were processed into hot break juice.
In the current study, in general after 53 dph lycopene increased (of 43 % in IL9adm).
The present findings mirror those of the previous study by Davila Avina et al. (2012).
To measure the total antioxidant activity we used the ORAC assay that revealed a
very slight reduction in M82 when stressed, but contrary to this, it was twice higher
in IL9adm 50% WR. The latter result was in agreement with Barbagallo et al. (2013)
who observed that the antioxidant activity was positively affected by water shortage.
The antioxidant activity in tomato has been mainly associated to ascorbic acid (28 -
38%) and phenolics (60 - 70%).
Both the storage and the processing led to a decrease in the antioxidant activity.
4. Discussion
137
A breeding program was primed in 2012 aiming to transfer useful dissected wild
QTLs from S. pennellii (Sp) into four different tomato advanced breeding lines,
P011_58, P011_77, P011_85 and P011_156 (P011s afterwards) selected at the
University of Naples “Federico II” because of their superior agronomic
performances.
Among the 76 different introgression lines (ILs) produced by the initial S. pennellii x
S. lycopersicum cv. M82 hybridization and harboring as many as isolated and
dispersed DNA introgression bits from Sp, collectively covering the entire tomato
genome (Eshed et al. 1992), the IL9-2-5, possessing a 9 cM-long wild DNA insertion
(Fridman et al. 2002), is renowned for possessing several QTLs able to confer
elevated traits in relation to fruit quality, such as the content in soluble solids (Eshed
and Zamir 1995, Baxter et al. 2005) and total AsA (Stevens et al. 2007, Stevens et al.
2008).
In fact, two different major genes controlling the level of soluble solids were mapped
on the 9-2-5 introgression, a Lin5 gene encoding for a fruit apoplastic invertase
(Fridman et al. 2000) with enhanced kinetic activity favoring at last, the
accumulation of both simple sugars and organic acids in the mature fruits (Baxter et
al. 2005), and a PW9-2-5 gene determining a high level of photoassimilates via an
increased shoot mass (Fridman et al. 2002) and a QTL ruling the AsA content,
involving three different DNA regions located on 9-2-5 region, of which one about
0.1 cM-long containing a gene encoding for the the Monodehydroascorbate
reductase (MDHAR), an enzyme working in the recycling path of AsA (Stevens et
al. 2008).
Different sub-lines were selected from the parental IL9-2-5 carrying in a reduced
piece of the original 9-2-5 introgression, to explore the chance to dissect the group of
Sp QTLs located on it and separately transfer them into the tomato genome (Stevens
et al. 2008).

4. Discussion
138
In this study, we used the IL9adm, a IL9-2-5 sub-line selected at the Department of
Agriculture of the University of Naples “Federico II”, for inserting wild QTLs in the
genetic background of each of the four tomato P011s.
The IL9adm differs from the parental IL9-2-5 due to lacking a chromosomal
proximal fragment of the introgression, where the Lin5 gene was mapped (Friedman
et al. 2004, Stevens et al. 2008). In fact, PCR-based molecular analysis carried out by
means of CAPS markers which we built on the basis of the tomato whole genome
sequence (TWGS) SL2.40 blueprint, capable of integrally marking the 9-2-5
introgression (Tab. 3.36), evidenced as several CAPS loci (TC217240, TC225638,
TC188748 and TC230608) were homozygous for the wild allele in the IL9-2-5, but
homozygous for the alternative cultivated allele in the IL9adm.
In particular, the Lin5 gene has been mapped slightly internal in the 9-2-5
introgression than the TC217240 locus, that allowed us to delimitate the wild
fragment absent in the IL9adm to around 2-3 cM, starting from the centromeric
border.
In spite of being missing of Lin5 gene, the IL9adm showed higher content in soluble
solids than the parental tomato M82 line, suggesting as the PW9-2-5 gene could also
take relevantly part in driving the accumulation of both simple sugars and organic
acids in the mesocarp of mature fruits, even though previous study has appointed
Lin5 as the more remarkable gene in promoting those processes (Baxter et al. 2005).
Furthermore, a set of different genes involved in the carbohydrate metabolism, such
as those affecting sugar transport and breakdown, starch metabolism and glycolysis,
and therefore potentially able to affect the level of soluble solids in mature fruits,
have been mapped to 9-2-5 introgression (Causse et al. 2004).
The unchanged ability exhibited by IL9adm to produce soluble solids could hence
hint the involvement of one or more of those genes in the promotion of biosynthesis
and accumulation of soluble solids.
For the reasons above deployed, we found exploiting the IL9adm, source of useful Sp
genes, a powerful breeding approach, in order to couple the promotion of the

4. Discussion
139
accumulation of soluble solids (PW9-2-5) and total AsA (MDHAR) in fruit mesocarp
in the P011s tomato lines, but in the same time reducing the extent of wild and
unwanted chromatin inserted into those lines.
We therefore have been aiming to: 1) transferring the integral 9adm introgression
from the M82 genetic background conferring not appreciable agronomic
performances into the P011 genetic background, proved to be superior for many
different agronomic traits, 2) dissecting the Sp 9adm chromatin to be inseterted as
single and isolated QTLs into the P011 genetic background.
We set off a backcross-based breeding program, by setting on the initial hybridization
between IL9adm and each of the four P011s. The F1 plants were permitted to go self-
pollinated, then the F2 plants were crossed back to each of the corresponding recipient
P011 parental line and plants belonging to BC1F2 progenies were again crossed back
to the same tomato parental line to get plants in the BC2F2, current step of the
breeding program.
By using the set of CAPS markers mapping on 9adm genomic region, built and tuned
in this study, evidencing polymorphism between the wild and cultivated alleles, we
have been able to properly drive the selection of desired genotypes over the next
generations of the breeding program.
To date, we selected a total of 32 different plants belonging to the BC2F2 progenies
resulted to be heterozygous for the wild and cultivated alleles at CAPS loci.
We selected not only plants possessing the entire wild introgression in the P011
genetic background, that indicates a positive pursuit of goal 1, but also plants from
each of the four backcross paths in which only a bit of the initial 9adm introgression
was held, indicating as several recombination events happened in the mother cells at
meiosis I in the BC1F2 plants between wild and cultivated 9adm chromatin, gaining
the noteworthy goal 2 to promote the dissection of wild QTLs into single genetic
factors. That represents the first step to get stable isogenic lines from P011s,
possessing the desired Sp alleles of PW9-2-5 and MDHAR and other interesting genes
isolated.
4. Discussion
140
The analyses about the content in soluble solids and total AsA carried out on
heterozygous and homozygous plants in BC2F2, revealed higher content of both in the
fruit mesocarp from the former genotypes in comparison to the latter genotypes,
prompting that the improved expression of fruit content of both soluble solids and
total AsA and perhaps other important quality traits, would be drown upon coming to
an end in the backcross breeding program.
5. Conclusion
141
5 Conclusion
This study was carried out to identify genomic regions involved in the control of fruit
quality traits in tomato, headed to select new genotypes fitting the increasingly high
public demand for a sustainable agriculture asking for limited levels of energy inputs,
such as mainly the water supply.
To gain this objective, we compared several commercial hybrid tomatoes for
evaluating their nutritional quality-related traits with the purpose to study the narrow
genetic variability underlying tomato fruit quality and identify, among others,
cultivated hybrids meeting the high-yielding expectation and superior fruit quality.
We studied the contribution to drought tolerance and fruit quality by wild QTLs from
the tomato relative S. pennellii when two different water regimes were imposed, in
both open field and tunnel. This allowed us to examinate the plant physiological
response under a low water supply and how it affected the fruit quality behaviour in a
susceptible and in a more tolerant genomic background.
Through a transcriptome analysis, we identified candidate genes which were involved
in mediating the plant response to drought and the effect on the level of soluble solids
and firmness and on the biosynthesis of carotenoids, phenols and AsA, thus in the
fruit quality.
We developed a breeding program to transfer wild dissected QTLs controlling quality
traits, such as the content in soluble solids and AsA into advanced breeding tomato
lines selected for displaying high agronomic performances.

6. References
142
6 References
Abbott J.A. 2004. Textural quality assessment for fresh fruits and vegetables. Quality
of Fresh and Processed Foods. Volume 542. Edited by Atherton JG, Rudich J. pp
265-279
Abushita AA, Daood HG, Biacs PA. 2000. Change in Carotenoids and Antioxidant
Vitamins in Tomato as a Function of Varietal and Technological Factors. Journal of
Agricultural and Food Chemistry, 48:2075-2081
Allen RG, Pereira LS, Raes D, Smith M. 1998. Crop evapotranspiration - Guidelines
for computing crop water requirements. FAO Irrigation and Drainage Paper. n. 56,
FAO, Rome
Arts ICW, Hollman PCH. 2005. Polyphenols and disease risk in epidemiologic
studies. American Journal of Clinical Nutrition, 81:317-325
Baker NR and Rosenqvist E. 2004. Applications of chlorophyll fluorescence can
improve crop production strategies: an examination of future possibilities. Journal of
Experimental Botany, 55:1607-1621
Baptista C, Belgacem N, Duarte AP. 2004. The effect of surfactants on kraft pulping
of Pinus pinaster. Appita Journal, 57:35-39
Barbagallo RN, Di Silvestro I, Patanè C. 2012. Yield, physicochemical traits,
antioxidant pattern, polyphenol oxidase activity and total visual quality of field-
grown processing tomato cv. Brigade as affected by water stress in Mediterranean
climate. Journal of the Science of Food and Agriculture, 93:1449-1457

6. References
143
Barbazuk WB, Emrich SJ, Chen HD, Li L, Schnable PS. 2007. SNP discovery via
454 transcriptome sequencing. The Plant Journal, 51:910-918
Barone A, Di Matteo A, Carputo D, Frusciante L. 2009. High-throughput genomics
enhances tomato breeding efficiency. Current Genomics, 10:1-9
Barsan C, Sanchez-Bel P, Rombaldi C, Egea I, Rossignol M, Kuntz M, Zouine M,
Latché A, Bouzayen M, Pech JC. 2010. Characteristics of the tomato chromoplast
proteome revealed by proteomic analysis. Journal of Experimental Botany, 61:2413-
2431
Bartels D, Scheneider K, Terstappen G, Piatkowski D, Salamini F. 1990. Molecular
cloning of abscisic acid-modulation genes which are induced during desiccation of
the resurrection plant Craterostigma plantagineum. Planta, 181:27-34
Bartoli CG, Pastori GM, Foyer CH. 2000. Ascorbate biosynthesis in mitochondria is
linked to the electron transport chain between complexes III and IV. Plant
Physiology, 123:335-343
Batu A. 1998. Some Factors Affeting on Determination and Measurement of Tomato
Firmness. Journal of Agriculture and Forestry, 22:411-418
Baxter CJ, Carrari F, Bauke A, Overy S, Hill SA, Quick PW, Fernie AR, Sweetlove
LJ. 2005. Fruit carbohydrate metabolism in an introgression line of tomato with
increased fruit soluble solids. Plant and Cell Physiology, 46:425-437
Beaudoin AB. 2002. Géographie Physique et Quaternaire, 56:229-246
Beisel KG, Jahnke S, Hofmann D, Koppchen S, Schurr U, Matsubara S. 2010.

6. References
144
Continuous turnover of carotenes and chlorophyll a in mature leaves of Arabidopsis
revealed by 14CO2 pulse-chase labeling. Plant Physiology, 152:2188-2199
Bramley PM. 2002. Regulation of carotenoid formation during tomato fruit ripening
and development. Journal of Experimental Botany, 53:2107-2113
Bray EA. 2004. Genes commonly regulated by water-deficit stress in Arabidopsis
thaliana. Journal of Experimental Botany, 55:2331-2341
Brummell DA and Harpster MH. 2001. Cell wall metabolism in fruit softening and
quality and its manipulation in transgenic plants. Plant Molecular Biology, 47:311-
340
Burns JJ. 1967. Ascorbic Acid. In Metabolic Pathways. Edited by Greenberg DM.
Academic Press, New York, USA, pp 394-411
Canene-Adams K, Campbell JK, Zaripheh S, Jeffery EH, Erdman JW Jr. 2005. The
tomato as a functional food. The Journal of Nutrition, 135:1226-1230
Capanoglu E, Beekwilder J, Boyacioglu D, De Vosbc RCH, Hallcd RD. 2010.The
Effect of Industrial Food Processing on Potentially Health-Beneficial Tomato
Antioxidants. Critical Reviews in Food Science and Nutrition, 50:919-930
Carrillo-Lopez A and Yahia E. 2013. HPLC-DAD-ESI-MS analysis of phenolic
compounds during ripening in exocarp and mesocarp of tomato fruit. Journal of Food
Science, 78:1839-1844
Causse M, Buret M, Robini K, Verschave P. 2003. Inheritance of nutritional and
sensory quality traits in fresh market tomato and relation to consumer preferences.
6. References
145
Journal of Food Science, 68:2342-2350
Causse M, Duffe P, Gomez MC, Buret M, Damidaux R, Zamir D, Gur A, Chevalier
C, Lemaire-Chamley M, Rothan C. 2004. A genetic map of candidate genes and
QTLs involved in tomato fruit size and composition. Journal of Experimental Botany,
55:1671-1685
Cazzonelli CI and Pogson BJ. 2010. Source to sink: regulation of carotenoid
biosynthesis in plants. Trends in Plant Science, 15:266-274
Cazzonelli CI. 2011. Carotenoids in nature: insights from plants and beyond.
Functional Plant Biology, 38:833-847
Chaib J, Devaux MF, Grotte MG, Robini K, Causse M, Lahaye M, Marty I. 2007.
Physiological relationships among physical, sensory and morphological attributes of
texture in tomato fruits. Journal of Experimental Botany, 58:1915-1925
Chang CH, Lin HY, Chang CY, Liu YC. 2006. Comparisons on the antioxidant
properties of fresh, freeze-dried and hot-air-dried tomatoes. Journal of Food
Engineering, 77:478-485
Chatterjee IB. 1973. Evolution and the biosynthesis of ascorbic acid. Science,
182:1271-1272
Chen Z, Young TE, Ling J, Chang SC, Gallie DR. 2003. Increasing vitamin C
content of plants through enhanced ascorbate recycling. Proceedings of the National
Academy of Science of the United States of America, 100:3525-3530
Cheynier V, Comte G, Davies KM, Lattanzio V, Martens S. 2013. Plant phenolics:

6. References
146
Recent advances on their biosynthesis, genetics and ecophysiology. Plant Physiology
and Biochemistry, 72:1-20
Cohen LA. 2002. Nutrition and prostate cancer: a review. Annals of New York
Academy of Science, 963:148-155
Conesa A, Götz S, García-Gómez JM, Terol J, Talón M, Robles M. 2005. Blast2GO:
a universal tool for annotation, visualization and analysis in functional genomics
research. Bioinformatics, 21:3674-3676
Conklin PL, Barth C. 2004. Ascorbic acid, a familiar small molecule intertwined in
the response of plants to ozone, pathogens, and the onset of senescence. Plant, cell
and Environment, 27:959-970
Conklin PL, Norris SR, Wheeler GL, Williams EH, Smirnoff N, Last RL. 1999.
Genetic evidence for the role of GDP-mannose in plant ascorbic acid (vitamin C)
biosynthesis. Proceedings of the National Academy of Science of the United States of
America, 96:4198-4203
Conklin PL, Saracco SA, Norris SR, Last RL. 2000. Identification of acid-deficient
Arabidopsis thaliana mutants. Genetics, 154:847-856
Cooperstone JL, Ralston RA, Riedl KM, Haufe TC, Schweiggert RM, King SA,
Timmers CD, Francis DM, Lesinski GB, Clinton SK, Schwartz J. 2015. Enhanced
Bioavailability of Lycopene When Consumed as cis-isomers From Tangerine
Compared to Red Tomato Juice, a Randomized, Cross-over Clinical Trial. Molecular
Nutrition and Food Research, 0:1-12
Crozier A, Jensen E, Lean MEJ, McDonald MS. 1997. Quantitative analysis of

6. References
147
flavonoids by reversed-phase high performance liquid chromatography. Journal of
Chromatography A, 761:315-321
Crozier A, Lean MEJ, McDonald MS, Black C. 1997. Quantitative analysis of the
flavonoid content of commercial tomatoes, onions, lettuce and celery. Journal of
Agricultural and Food Chemistry, 45:590-595
Cruz-Rus E, Amaya I, Sanchez-Sevilla JF, Botella MA, Valpuesta V. 2011.
Regulation of L-ascorbic acid content in strawberry fruits. Journal of Experimental
Botany, 62:4191-4201
Cunningham FX, Chamovitz D, Misawa N, Gantt E, Hirschberg J. 1993. Cloning and
functional expression in Escherichia coli of a cyanobacterial gene for lycopene
cyclase, the enzyme that catalyzes the biosynthesis of b-carotene. FEBS Letters,
328:130-138
Cunningham FX, Pogson B, Sun ZR, McDonald KA, Della Penna D, Gantt E. 1996.
Functional analysis of the beta and epsilon lycopene cyclase enzymes of Arabidopsis
reveals a mechanism for control of cyclic carotenoid formation. Plant Cell, 8:1613-
1626
Dávila-Aviña JE, Villa-Rodríguez JA, Villegas-Ochoa MA, Tortoledo-Ortiz O,
Olivas GI, Ayala-Zavala JF, González-Aguilar GA. 2014. Effect of edible coatings
on bioactive compounds and antioxidant capacity of tomatoes at different maturity
stages. Journal of Food Science and Technology, 51:2706-2712
Deruere J, Bouvier F, Steppuhn J, Klein A, Camara B, Kuntz M. 1994. Structure and
expression of two plant genes encoding chromoplast-specific proteins: occurrence of
partially spliced transcripts. Biochemical and Biophysical Research Communication,

6. References
148
199:1144-1150
Dewanto V, Wu X, Adom KK, Liu RH. 2002. Thermal processing enhances the
nutritional value of tomatoes by increasing total antioxidant activity. Journal of
Agricultural and Food Chemistry, 50:3010-3014
Di Matteo A, Ruggieri V, Sacco A, Rigano MM, Carriero F, Bolger A, Fernie AR,
Frusciante L, Barone A. 2013. Identification of candidate genes for phenolics
accumulation in tomato fruit. Plant Science, 205-206:87-96
Di Matteo A, Sacco A, Anacleria M, Pezzotti M, Delledonne M, Ferrarini A,
Frusciante L, Barone A. 2010. The ascorbic acid content of tomato fruits is associated
with the expression of genes involved in pectin degradation. BMC Plant Biology,
10:163
Dowdle J, Ishikawa T, Gatzek S, Rolinski S, Smirnoff N. 2007. Two genes in
Arabidopsis thaliana encoding GDP-L-galactose phosphorylase are required for
ascorbate biosynthesis and seedling viability. The Plant Journal, 52:673-689
Dumas Y, Dadomo M, Di Lucca G, Grolier P. 2003. Effects of environmental factors
and agricultural techniques on antioxidant content of tomatoes. Journal of the Science
of Food and Agriculture, 83:369-382
Egea I, Barsan C, Bian W, Purgatto E, Latché A, Chervin C, Bouzayen M, Pech JC.
2010. Chromoplast differentiation: current status and perspectives. Plant and Cell
Physiology, 51:1601-1611
Eltayeb AE, Kawano N, Badawi GH, Kaminaka H, Sanekata T, Shibahara T, Inanaga
S, Tanaka K. 2007. Overexpression of monodehydroascorbate reductase in transgenic

6. References
149
tobacco confers enhanced tolerance to ozone, salt and polyethylene glycol stresses.
Planta, 225:255-1264
Eshed Y and Zamir D. 1995 An introgression line population of Lycopersicon
pennellii in the cultivated tomato enables the identification and fine mapping of
yield-associated QTL. Genetics, 141:1147-1162
Eshed Y, Abu-Abied M, Saranga Y, Zamir D, 1992. Lycopersicon esculentum lines
containing small overlapping introgressions from L. pennelli. Theoretical and
Applied Genetics, 83:1027-1034
Fiedor J and Burda K. 2014. Potential role of carotenoids as antioxidants in human
health and disease. Nutrients, 6:466-488
Flint J, Valder W, Shifman S, Mott R. 2005. Strategies for mapping and cloning
quantitative trait genes in rodents. Nature Reviews Genetics, 6:271-286
Flowers TJ. 2004. Improving crop salt tolerance. Journal of Experimental Botany,
55:307-319
Folgado R, Sergeant K, Renaut J, Swennen R, Hausman JF, Panis B. 2014. Changes
in sugar content and proteome of potato in response to cold and dehydration stress
and their implications for cryopreservation. Journal of Proteomics, 98:99-111
Foolad MR. 2007. Genome mapping and molecular breeding of tomato. International
Journal of Plant Genomics, 2007:1-52
Ford NA and Erdman JW Jr. 2012. Are lycopene metabolites metabolically active?
Acta Biochimica Polonica, 59:1-4

6. References
150
Foyer CH and Noctor G. 2009. Redox regulation in photosynthetic organisms:
signaling, acclimation, and practical implications. Antioxidants and Redox Signaling,
11:861-905
Franke AA, Custer LJ, Arakaki C and Murphy SP. 2004. Vitamin C and flavonoid
levels of fruits and vegetables consumed in Hawaii. Journal of Food Composition
and Analysis, 17:1-35
Frary A, Gol D, Keles D, Okmen B, Pınar H, Sıgva HO, Yemenicioglu A, Doganlar
S. 2010. Salt tolerance in Solanum pennellii: antioxidant response and related QTL.
BMC Plant Biology, 10:58
Fraser PD and Bramley PM. 2004. The biosynthesis and nutritional uses of
carotenoids. Progress in Lipid Research, 43:228-265
Fridman E, Carrari F, Liu YS, Fernie AR, Zamir D. 2004. Zooming in on a
quantitative trait for tomato yield using interspecific introgressions. Science,
305:1786-1789
Fridman, E., Liu, Y.S., Carmel-Goren, L., Gur, A., Shoresh, M., Pleban, T., Eshed,
Y. and Zamir, D. 2002. Two tightly linked QTLs modify tomato sugar content via
different physiological pathways. Mol. Genet. Genomics 266:821-826
Fry SC. 1998. Oxidative scission of plant cell wall polysaccharides by ascorbate-
induced hydroxyl radicals. Biochemical Journal, 332:507-515
Gallie Daniel R. 2013. Increasing Vitamin C Content in Plant Foods to Improve Their
Nutritional Value-Successes and Challenges. Nutrients, 5:3424-3446

6. References
151
Gatzek S, Wheeler GL, Smirnoff N. 2002. Antisense suppression of l-galactose
dehydrogenase in Arabidopsis thaliana provides evidence for its role in ascorbate
synthesis and reveals light modulated l-galactose synthesis. The Plant Journal,
30:541-553
Gautier H, Diakou-Verdin V, Benard C, Reich M, Buret M, Bourgaud F. 2008. How
does tomato quality (sugar, acid, and nutritional quality) vary with ripening stage,
temperature, and irradiance? Journal of Agricultural and Food Chemistry, 56:1241-
1250
Gelderman H. 1975. Investigations on inheritance of quantitative characters in
animals by gene markers. Theoretical and Applied Genetics, 46:319-330
Giorio G, Stigliani, AL, D’Ambrosio C. 2008. Phytoene synthase genes in tomato
(Solanum lycopersicum L.) - new data on the structures, the deduced amino acid
sequences and the expression patterns. FEBS Journal, 275:527-535
Giovannelli G and Paradiso A. 2002. Stability of Dried and Intermediate Moisture
Tomato Pulp during Storage. Journal of Agricultural and Food Chemistry, 50:7277-
7281
Giuliano G, Bartley GE, Scolnik PA. 1993. Regulation of carotenoid biosynthesis
during tomato development. The Plant Cell, 5:379-387
Godfray HC, Beddington JR, Crute IR, Haddad L, Lawrence D, Muir JF, Pretty J,
Robinson S, Thomas SM, Toulmin C. 2010. Food security: the challenge of feeding 9
billion people. Science, 327:812-818

6. References
152
Gould WA. 1992. Composition of tomatoes. In Tomato Production, Processing &
Technology, 3rd
Edition, Edited by Gould WA. Elsevier, Baltimore, MD, USA. pp
433-447
Gray J, Caparros-Ruiz D, Grotewold E. 2012. Grass phenylpropanoids: regulate
before using! Plant Science, 184:112-120
Green MA, Fry SC. 2005. Vitamin C degradation in plant cells via enzymatic
hydrolysis of 4-Ooxalyl- L-threonate. Nature, 433:83-87
Grierson D and Kader AA. 1986. Fruit ripening and quality. In The Tomato Crop. A
Scientific Basis for Improvement. Edited by Atherton JG, Rudich J. Kluwer
Academic Publishers, Dordrecht, NL. pp 241-280
Griffiths A, Barry C, Alpuche-Solis AG, Grierson D. 1999. Ethylene and
developmental signals regulate expression of lipoxygenase genes during tomato fruit
ripening. Journal of Experimental Botany, 50:793-798
Grotewold E. 2006. The genetics and biochemistry of floral pigments. Annual Review
of Plant Biology, 57:761-780
Gupta PK. 2002. Molecular markers and QTL analysis in crop plants. Current
Science, 83:113-114
Harker FR, Redgwell RJ, Hallett IC, Murray SH, Carter G. 1997. Texture of fresh
fruit. Horticultural Reviews, 20:121-224
Harris WM and Spurr AR. 1969. Chromoplasts of tomato fruit. II. The red tomato.
American Journal of Botany, 56:380-389
6. References
153
Havaux M. 2014. Carotenoid oxidation products as stress signals in plants. The Plant
Journal, 79:597-606
Helyes L, Lugasi A, Pék Z. 2012. Effect of irrigation on processing tomato yield and
antioxidant components. Turkish Journal of Agriculture and Forestry, 36:702-709
Hertog MGL, Feskens EJM, Hollman PCH, Katan MB, Kromhout D. 1993. Dietary
antioxidant flavonoids and the risk of coronary heart disease; the Zutphen elderly
study. Lancet, 342:1007-1011
Hongsoongnern P, Chambers E. 2008. A lexicon for texture and flavor characteristics
of fresh and processed tomatoes. Journal of Sensory Studies, 23:583-599
Horemans N, Foyer CH, Asard H. 2000. Transport and action of ascorbate at the
plant plasma membrane. Trends in Plant Science, 5:263-267
Jackman RL, Marangoni AG, Stanley DW. 1990. Measurement of tomato fruit
firmness. Hort Science, 25:781-783
Jarzyniak KM and Jasinski M. 2014. Membrane transporters and drought resistance -
a complex issue. Frontiers in Plant Science, 5:687
Johnson EJ and Krinsky NI. 2009. Carotenoids and coronary heart disease. In
Carotenoids. Volume 5. Edited by Britton G, Liaaen-Jensen S, Pfander H. Birkhauser
Verlag, Basel, SW. pp 287-300
Joyard J, Ferro M, Masselon C, Seigneurin-Berny D, Salvi D, Garin J, Rolland N.
2009. Chloroplast proteomics and the compartmentation of plastidial isoprenoid

6. References
154
biosynthetic pathways. Molecular Plant, 2:1154-1180
Kacjan-Maršić N, Gašperlin L, Abram V, Budič M, Vidrih R. 2011. Quality
parameters and total phenolic content in tomato fruits regarding cultivar and
microclimatic conditions. Turkish Journal of Agriculture and Forestry, 35:185-194
Kampfenkel K, Van Montagu M, Inze D. 1995. Effects of iron excess on Nicotiana
plumbaginifolia plants (implications to oxidative Stress). Plant Physiology, 107:725-
735
Kavitha P, Shivashankara KS, Rao VK, Sadashiva AT, Ravishankarc KV, Sathishd
GJ. 2014. Genotypic variability for antioxidantand quality parameters among tomato
cultivars, hybrids, cherry tomatoes and wild species. Journal of the Science of Food
and Agriculture, 94:993-999
Keurentjes JJB, Willems G, van Eeuwijk F, Nordborg M, Koornneef M. 2011. A
comparison of population type used for QTL mapping in Arabidopsis thaliana. Plant
Genetic Resources, 9:185-188
Khoo HE, Prasad KN, Kong KW, Jiang Y, Ismail A. 2011. Carotenoids and their
isomers: color pigments in fruits and vegetables. Molecules, 16:1710-1738
Knapp S, Bohs L, Nee M, Spooner DM. 2004. Solanaceae-a model for linking
genomics with biodiversity. Comparative and Functional Genomics, 5:285-291
Knörzer OC, Durner J, Böger P. 1996. Alterations in the antioxidative system of
suspension-cultured soybean cells (Glycine max) inducedby oxidative stress. Plant
Physiology, 97:388-396

6. References
155
Koornneef M, Jorna ML, Derswan DLCB, Karssen CM. 1982. The isolation
ofabscisic acid (ABA) deficient mutants by selection of induced revertants in non
germinating gibberellin sensitive lines of Arabidopsis thaliana (L.) Heynh.
Theoretical and Applied Genetics, 61:385-393
Krinsky NI and Johnson EJ. 2005. Carotenoid actions and their relation to health and
disease. Molecular Aspects of Medicine, 26:459-516
Kumar R and Khurana A. 2014. Functional genomics of tomato: Opportunities and
challenges in post-genome NGS era. Journal of Biosciences, 39:917-929
Kwon SY, Choi SM, Ahn YO, Lee HS, Lee HB, Park YM, Kwak SS. 2003.
Enhanced stresstolerance of transgenic tobacco plants expressing a human
dehydroascorbate reductase gene. Journal of Plant Physiology, 160:347-353
Laing WA, Bulley S, Wright M, Cooney J, Jensen D, Barraclough D, MacRae E.
2004. A highly specific L-galactose-1-phosphate phosphatase on the path to ascorbate
biosynthesis. Proceedings of the National Academy of Science of the United States of
America, 101:16976-16981
Laing WA, Wright MA, Cooney J, Bulley SM. 2007. The missing step if the L-
galactose pathway of ascorbate biosynthesis in plants, an L-galactose
guanyltransferase, increases leaf ascorbate content. Proceedings of the National
Academy of Science of the United States of America, 104:9534-9539
Lee HS. 1992. Antioxidative activity of browning reaction products isolated from
storage-aged orange juice. Journal of Agricultural and Food Chemistry, 40:550-552
Lee MT, Chen BH. 2002. Stability of lycopene during heating and illumination in a

6. References
156
model system. Food Chemistry, 78:425-432
Leung J and Giraudat J. 1998. Abscisic acid signal transduction. Annual Review of
Plant Physiology and Plant Molecular Biology, 49:199-222
Levine M, Cantilena CC, Dhariwal KR. 1995. Determination of optimal vitamin C
requirements in humans. American Journal of Clinical Nutrition, 62:1347-1356
Levine M. 1986. New concepts in the biology and biochemistry of ascorbic acid. New
England Journal of Medicine, 314:892-902
Linster CL, Adler LN, Webb K, Christensen KC, Brenner C, Clarke SG. 2008. A
second GDP-L-galactose phosphorylase in Arabidopsis en route to vitamin C. The
Journal of Biological Chemistry, 283:18483-18492
Linster CL, Gomez TA, Christensen KC, Adler LN, Young BD, Brenner C, Clarke
SG. 2007. Arabidopsis VTC2 encodes a GDP-L-galactose phosphorylase, the last
unknown enzyme in the Smirnoff-Wheeler pathway to ascorbic acid in plants. The
Journal of Biological Chemistry, 282:18879-18885
Liu H, Yu C, Li H, Ouyang B, Wang T, Zhang J, Wang X, Ye Z. 2015.
Overexpression of ShDHN, a dehydrin gene from Solanum habrochaites enhances
tolerance to multiple abiotic stresses in tomato. Plant Science, 231:198-211
Liu L, Shao Z, Zhang M, Wang Q. 2015. Regulation of Carotenoid Metabolism in
Tomato. Molecular Plant, 8:28-39
Liu YS, Gur A, Ronen G, Causse M, Damidaux R, Buret M, Hirschberg J, Zamir D.
2003. There is more to fruit colour than candidate carotenoid genes. Plant

6. References
157
Biotechnology Journal, 1:195-207
Lopez-Sanchez P, de Vos RCH, Jonker HH, Mumm R, Hall RD, Bialek L, Leenman
R, Strassburg K, Vreeken R, Hankemeier T, Schumm S, van Duynhoven J. 2015.
Comprehensive metabolomics to evaluate the impact of industrial processing on the
phytochemical composition of vegetable purees. Food Chemistry, 168:348-355
Lorence A, Chevone BI, Mendes P, Nessler CL. 2004. Myo-Inositol oxygenase offers
a possible entry point into plant ascorbate biosynthesis. Plant Physiology, 134:1200-
1205
Loukehaich R, Wang T, Ouyang B, Ziaf K, Li H, Zhang J, Lu Y, Ye Z. 2012. SpUSP,
an annexin-interacting universal stress protein, enhances drought tolerance in tomato.
Journal of Experimental Botany, 63:5593-5606
Mackay TFC. 2004 The genetic architecture of quantitative traits: lessons from
Drosophila. Current Opinion in Genetics and Development, 14:253-257
Marouelli WA and Silva WLC. 2007. Water tension thresholds for processing
tomatoes under drip irrigation in Central Brazil. Irrigation Science, 25:411-418
Martínez-Huélamo M, Tulipani S, Estruch R, Escribano E, Illán M, Corella D, RM.
Lamuela-Raventós. 2015. The tomato sauce making process affects the
bioaccessibility and bioavailability of tomato phenolics: A pharmacokinetic study.
Food Chemistry, 173:864-872
Minoggio M, Bramati L, Simonetti P, Gardana C, Lemoli L, Santangelo E, Mauri PL,
Spigno P, Soressi GP, Pietta PG. 2003. Polyphenol pattern and antioxidant activity of
different tomato lines and cultivars. Annals of Nutrition and Metabolism, 47:64-69
6. References
158
Mishraa KB, Iannacone R, Petrozza A, Mishraa A, Armentano N, La Vecchia G,
Trtílek M, Cellini F, Nedbal L. 2012. Engineered drought tolerance in tomato plants
is reflected in chlorophyll fluorescence emission. Plant Science, 182:79-86
Moneruzzaman KM, Hossain ABMS, Sani W, Saifuddin M, Alenazi M. 2009. Effect
of harvesting and storage conditions on the post harvest quality of tomato
(Lycopersicon esculentum Mill) cv. Roma. Australian Journal of Crop Science,
3:113-121
Moyankova D, Mladenov P, Berkov S, Peshev D, Georgieva D, Djilianov D. 2014.
Metabolic profiling of the resurrection plant Haberlea rhodopensis during desiccation
and recovery. Physiologia Plantarum, 152:675-687
Murshed R, Lopez-Lauri F, Sallanon H. 2013. Effect of water stress on antioxidant
systems and oxidative parameters in fruits of tomato (Solanum lycopersicon L, cv.
Micro-tom). Physiology and Molecular Biology of Plants, 19:363-378
Nagarajan N and Hotchkiss JH. 1999. In vitro inhibition of N-nitrosomorpholine
formation by fresh and processed tomatoes. Journal of Food Science, 64:964-967
Nisar N, Li L, Lu S, Khin NK, Pogson BJ. 2015. Carotenoid Metabolism in Plants.
Molecular Plant, 8:68-82
Odriozola-Serrano I, Soliva-Fortuny R, Hernandez-Jover T, Martin-Belloso O. 2009.
Carotenoid and phenolic profile of tomato juices processed by high intensity pulsed
electric fields compared with conventional thermal treatments. Food Chemistry,
112:258−266

6. References
159
Oltman AE, Jervis SM, Drake MA. 2014. Consumer Attitudes and Preferences for
Fresh Market Tomatoes. Journal of Food Science, 79:2091-2097
Orellana S, Yañez M, Espinoza A, Verdugo I, González E, Ruiz-Lara S, Casaretto
JA. 2010. The transcription factor SIAREB1 confers drought, salt stress tolerance and
regulates biotic and abiotic stress-related genes in tomato. Plant, Cell and
Environment, 33:2191-2208
Page D, Van Stratum E, Degrou A, Renard CMGC. 2012. Kinetics of Temperature
Increase During Tomato Processing Modulate the Bioaccessibility of Lycopene.
Food Chemistry, 135:2462-2469
Pallanca JE, Smirnoff N. 2000. The control of ascorbic acid synthesis and turnover in
pea seedlings. Journal of Experimental Botany, 51:669-674
Pastori GM, Kiddle G, Antoniw J, Bernard S, Veljovic-Jovanovic S, Verrier PJ,
Noctor G, Foyer CH. 2003. Leaf vitamin C contents modulate plant defense
transcripts and regulate genes that control development through hormone signaling.
Plant Cell, 15:939-951
Pecker I, Gabbay R, Cunningham FXJ, Hirschberg J. 1996. Cloning and
characterization of the cDNA for lycopene b-cyclase from tomato reveals decrease in
its expression during fruit ripening. Plant Molecular Biology, 30:807-819
Potters G, De Gara L, Asard H, Horemans N. 2002. Ascorbate and glutathione:
guardians of the cell cycle, partners in crime? Plant Physiology and Biochemistry.
40:537-548
Pourcel L, Routaboul JM, Cheynier V, Lepiniec L, Debeaujon I. 2006. Flavonoid
6. References
160
oxidation in plants: from biochemical properties to physiological functions. Trends in
Plant Science, 8:29-36
Quideau S, Deffieux D, Douat-Casassus C, Pouységu L. 2011. Plant polyphenols:
chemical properties, biological activities, and synthesis. Angew Chemie International
Edition, 50:586-621
Rawls WJ and Brakensiek DL. 1985. Prediction of soil water properties for
hydrologic modeling. Edited by Jones EB, Ward TJ. American Society of Civil
Engineers, New York, USA. pp 293-299
Redgwell RJ, Fischer M. 2002. Fruit texture, cell wall metabolism and consumer
perceptions. Fruit Quality And its Biological Basis. Edited by Knee M. Blackwell,
Oxford, UK. pp 46-88
Rickman JC, Barrett DM, Bruhn CM. 2007. Nutritional comparison of fresh, frozen
and canned fruits and vegetables. Part 1. Vitamins C and B and phenolic compounds.
Journal of the Science of Food and Agriculture, 87:930-944
Rigano MM, Arena C, Di Matteo A, Sellitto S, Frusciante L, Barone A. 2014. Eco-
physiological response to water stress of droughttolerant and drought-sensitive
tomato genotypes. Plant Biosystems,
http://dx.doi.org/10.1080/11263504.2014.989286
Rigano MM, Raiola A, Tenore GC, Monti DM, Del Giudice R, Frusciante L, Barone
A. 2014. Quantitative Trait Loci Pyramiding Can Improve the Nutritional Potential of
Tomato (Solanum lycopersicum) Fruits. Journal of Agricultural and Food Chemistry,
62:11519-11527

6. References
161
Rodriguez-Amaya DB, Kimura M. 2004. HarvestPlus Handbook for Carotenoid
Analysis. Edited by HarvestPlus Technical Monograph, Series 2; International Food
Policy Research Institute and International Center for Tropical Agriculture,
Washington, DC, USA
Roessner-Tunali U, Hegemann B, Lytovchenko A, Carrari F, Bruedigam C, Granot
D, Fernie A. 2003. Metabolic profiling of transgenic tomato plants overexpressing
hexokinase reveals that the influence of hexose phosphorylation diminishes during
fruit development. Plant Physiology, 133:84-99
Ron M, Dorrity MW, de Lucas M, Toal T, Hernandez RI, Little SA, Maloof JN,
Kliebenstein DJ, Brady SM. 2013. Identification of Novel Loci Regulating
Interspecific Variation in Root Morphology and Cellular Development in Tomato.
Plant Physiology, 162:755-768
Ronen G, Cohen M, Zamir D, Hirschberg J. 1999. Regulation of carotenoid
biosynthesis during tomato fruit development: expression of the gene for lycopene
epsilon-cyclase is downregulated during ripening and is elevated in the mutant delta.
The Plant Journal, 7:341-351
Ruiz-Sola MA and Rodrìguez-Concepciòn M. 2012. Carotenoid biosynthesis in
Arabidopsis: a colorful pathway. Arabidopsis Book
Sacco A, Di Matteo A, Lombardi N, Trotta N, Punzo B, Mari A, Barone A. 2013.
Quantitative trait loci pyramiding for fruit quality traits in tomato. Molecular
Breeding, 31:217-222
Sacco A, Greco B, Di Matteo A, De Stefano R, Barone A. 2013. Evaluation of
Tomato Genetic Resources for Response to Water Deficit. American Journal of Plant

6. References
162
Sciences, 4:131-145
Sadder M, Alsadon A, Wahb-Allah M. 2014. Transcriptomic analysis of tomato lines
reveals putative stress-specific biomarkers. Turkish Journal of Agriculture and
Forestry, 38:700-715
Saeed AI, Sharov V, White J, Li J, Liang W, Bhagabati N, Braisted J, Klapa M,
Currier T, Thiagarajan M. 2003. TM4: a free, open-source system for microarray data
management and analysis. Biotechniques, 34:374-378
Sandmann G, Romer S, Fraser PD. 2006. Understanding carotenoid metabolism as a
necessity for genetic engineering of crop plants. Metabolic Engineering, 8:291-302
Scalbert A, Manach C, Morand C, Remesy C, Jimenez L. 2005. Dietary polyphenols
and the prevention of diseases. Critical Reviews in Food Science and Nutrition,
45:287-306
Schieber A, Carle R. 2005. Occurrence of carotenoid cis-isomers in food:
technological, analytical and nutritional implications. Trends in Food Science and
Technology, 16:416-422
Seki M, Umezawa T, Urano K, Shinozaki K. 2007. Regulatory metabolic networks in
drought stress responses. Current Opinion in Plant Biology, 10:296-302
Serrano-Megias M, Lopez-Nicolas JM. 2006. Application of agglomerative
hierarchical clustering to identify consumer tomato preferences: influence of
physicochemical and sensory characteristics on consumer response. Journal of the
Science of Food and Agriculture, 86:493-499
6. References
163
Shalata A, Neumann PM. 2001. Exogenous ascorbic acid (vitamin C) increases
resistance of salt stress and reduces lipid peroxidation. Journal of Experimental
Botany, 52:2207-2211
Shinozaki K, Yamaguchi-Shinozaki K, Seki M. 2003. Regulatory network of gene
expression in the drought and cold stress responses. Current Opinion in Plant
Biology, 6:410-4177
Siendones E, González-Reyes JA, Santos-Ocaña C, Navas P, Córdoba F. 1999.
Biosynthesis of ascorbic acid in kidney bean. L-Galactono-γ-lactone dehydrogenase
is an intrinsic protein located at the mitochondrial inner membrane. Plant Physiology,
120:907-912
Sies H, Stahl W. 1995. Vitamins E and C, β-carotene, and other carotenoids as
antioxidants. American Journal of Clinical Nutrition, 62:1315-1321
Simkin AJ, Gaffe J, Alcaraz JP, Carde JP, Bramley PM, Fraser PD, Kuntz M. 2007.
Fibrillin influence on plastid ultrastructure and pigment content in tomato fruit.
Phytochemistry, 68:1545-1556
Singer JB, Hill AE, Burrage LC, Olszens KR, Song J, Justice M, O’Brien WE, Conti
DV, Witte JS, Lander ES. 2004. Genetic dissection of complex traits with
chromosome substitution strains of mice. Science, 304:445-448
Singleton V., Rossi JA. 1965. Colorimetry of total phenolics with phosphomolybdic-
phosphotungstic acid reagents. American Journal of Enology and Viticulture, 16:144-
158.

6. References
164
Smirnoff N and Wheeler GL. 2000. Ascorbic acid in plants: biosynthesis and
function. Critical Reviews in Biochemestry and Molecular Biology, 35:291-314
Smirnoff N, Conklin PL, Loewus FA. 2001. Biosynthesis of ascorbic acid in plants: a
renaissance. Annual Review of Plant Physiology and Plant Molecular Biology,
52:437-467
Stevens R, Buret M, Duffe P, Garchery C, Baldet P, Rothan C,Causse M. 2007.
Candidate genes and quantitative trait loci affecting fruit ascorbic acid content in
three tomato populations. Plant Physiology, 143:1943-1953
Stevens R, Buret M, Garchery C, Carretero Y, Causse M. 2006. Technique for rapid,
small-scale analysis of vitamin C levels in fruit and application to a tomato mutant
collection. Journal of Agricultural and Food Chemistry, 54:6159-6165
Stevens R, Page D, Gouble B, Garchery C, Zamir D, Causse M. 2008. Tomato fruit
ascorbic acid content is linked with monodehydroascorbate reductase activity and
tolerance to chilling stress. Plant, Cell and Environment, 31:1086-1096
Stewart AJ, Bozonnet S, Mullen W, Jenkins GI, Lean MEJ, Crozier A. 2000.
Occurrence of flavonols in tomatoes and tomato-based products. Journal of
Agricultural and Food Chemistry, 48:2663-2669
Suprunova T, Krugmn T, Fahima T, Chen G, Shams I, Korol A, Nevo E. 2004.
Differential expression of dehydrin genes in wild barley, Hordeum spontaneum,
associated with resistance to water deficit. Plant, Cell and Environment, 27:1297-
1308

6. References
165
Szczesniak AS. 2002. Texture is a sensory property. Food Quality and Preference,
13:215-225
Takeoka GR, Dao L, Flessa S, Gillespie DM, Jewell WT, Huebner B, Bertow D,
Ebeler SE. 2001. Processing Effects on Lycopene Content and Antioxidant Activity
of Tomatoes. Journal of Agricultural and Food Chemistry, 49:3713-3717
Tambussi EA, Bartoli CG, Beltrano J, Guiamet JJ, Araus JL. 2000. Oxidative damage
to thylakoid proteins in water-stressed leaves of wheat (Triticum aestivum). Plant
Physiology, 108:398-404
Tester M and Langridge P. 2010. Breeding technologies to increase crop production
in a changing world. Science, 327:818-822
TGC. 2012. The tomato genome sequence provides insights into fleshy fruit
evolution. Nature, 485:635-641
Toor RK and Savage GP. Antioxidant Activities in Different Fractions of Tomato.
2005. Food Research International, 38:487-494
Turner NC, Wright GC, Siddique KHM. 2001. Adaptation of grain legumes (pulses)
to water limited environments. Advances in Agronomy, 71:193-231
Tusher VG, Tibshirani R, Chu G. 2001. Significance analysis of microarrays applied
to the ionizing radiation response. Proceedings of the National Academy of Science of
the United States of America, 98:5116-5121
Valpuesta V, Botella MA. 2004. Biosynthesis of L-ascorbic acid in plants: New
pathways for an old antioxidant. Trends in Plant Science, 9:573-577

6. References
166
Valverde VG, González IN, AlonsoJG, Periago MJ. 2011. Antioxidant Bioactive
Compounds in Selected Industrial Processing and Fresh Consumption Tomato
Cultivars. Food and Bioprocess Technology, 6:391-402
Vinha AF, Barreira SVP, Castro A, Costa A, Oliveira MPP. 2013. Influence of the
Storage Conditions on the Physicochemical Properties, Antioxidant Activity and
Microbial Flora of Different Tomato (Lycopersicon esculentum L.) Cultivars. Journal
of Agricultural Science, 5:2
Vishnevetsky M, Ovadis M, Vainstein A. 1999. Carotenoid sequestration in plants:
the role of carotenoid-associated proteins. Trends in Plant Science, 4:232-235
Vogel JT, Tieman DM, Sims CA, Odabasi AZ, Clark DG, Klee, HJ. 2010.
Carotenoid content impacts flavor acceptability in tomato (Solanum lycopersicum).
Journal of the Science of Food and Agricultural, 90:2233-2240
Wagner C, Sefkow M, Kopka J. 2003. Construction and application of a mass
spectral and retention time index database generated from plant GC/EI-TOF-MS
metabolite profile. Phytochemistry, 62:887-900
Walker PMB. 1999. Chambers Dictionary of Science and Technology. Chambers
Harrap, Edinburgh. p. 1325
Walter MH and Strack D. 2011. Carotenoids and their cleavage products:
biosynthesis and functions. Natural Product Reports, 28:663-692
Wheat CW. 2010. Rapidly developing functional genomics in ecological model
systems via 454 transcriptome sequencing. Genetica, 138:433-451
6. References
167
Wheeler GL, Jones MA, Smirnoff N. 1998. The biosynthetic pathway of vitamin C in
higher plants. Nature, 393:365-369
Wilkins TA, Arpat AB. 2005. The cotton fiber transcriptome. Physiologia Plantarum,
124:295-300
Wilkinson S and Chodak GW. 2003. Critical review of complementary therapies for
prostate cancer. Journal of Clinical Oncology, 21:2199-2110
Wolucka BA and Van Montagu M. 2003. GDP-mannose 3’,5’-epimerase forms
GDP-L-gulose, a putative intermediate for the de novo biosynthesis of vitamin C in
plants. The Journal of Biological Chemistry, 278:47483-47490
Wolucka BA, Persiau G, van Doorsselaere J, Davey MW, Demol H, Vandekerckhove
J, van Montagu M, Zabeau M, Boerjan W. 2001. Partial purification and
identification of GDP-mannose 3′,5′-epimerase of Arabidopsis thaliana, a key
enzyme of the plant vitamin C pathway. Proceedings of the National Academy of
Sciences of the United of States of America, 98:14843-1484
Yano K, Aoki K, Shibata D. 2007. Genomic databases for tomato. Plant
Biotechnology, 24:17-25
Zamir D. 2001. Improving plant breeding with exotic genetic libraries. Nature
Reviews Genetics, 2:983-989
Zhang C, Liu J, Zhang Y, Cai X, Gong P, Zhang J, Wang T, Li H, Ye Z. 2011.
Overexpression of SlGMEs leads to ascorbate accumulation with enhanced oxidative
stress, cold, and salt tolerance in tomato. Plant Cell Reports, 30:389-398
6. References
168
Zhang WY, Lorence A, Gruszewski HA, Chevone B, Nessler CL. 2009. AMR1, an
Arabidopsis gene that coordinately and negatively regulates the D-mannose/L-
galactose ascorbic acid biosynthetic pathway. Plant Physiology, 150:942-950
Zhang Z, Wang J, Zhang R, Huang R. 2012. The ethylene response factor AtERF98
enhances tolerance to salt through the transcriptional activation of ascorbic acid
synthesis in Arabidopsis. The Plant Journal, 71:273-287
Zhao Q, Dixon RA. 2011. Transcriptional networks for lignin biosynthesis: more
complex than we thought? Trends in Plant Science, 4:227-233
Zhishen J, Mengcheng T, Jianming W. 1999. The determination of flavonoid contents
in mulberry and their scavenging effects on superoxide radicals. Food Chemistry,
64:555−559
Zhuo C, Wang T, Lu S, Zhao Y, Li X, Guo Z. 2013. A cold esponsive galactinol
synthase gene from Medicago falcata (MfGolS1) is induced by myo-inositol and
confers multiple tolerances to abiotic stresses. Physiologia Plantarum, 149:67-78
Zu K, Mucci L, Rosner BA, Clinton SK. 2014. Dietary Lycopene, Angiogenesis, and
Prostate Cancer: a Prospective Study in the Prostate-Specific Antigen Era. Journal of
the national cancer institute, 35:2154-2155
169
Acknowledgements
I would like to thank prof. Maria A. Rao for her precious work in coordinating the
PhD course and for her kindness.
Many thanks to prof. Luigi Frusciante to introducing me to the interesting world of
the Tomato Breeding.
Thanks again to Antonio Di Matteo who supervised my work and helped me in all I
needed.
Thanks to my co-tutor Paula Cartes who hosted me in Chile.
I’m grateful to all members of “Genopom” building especially Adriana and Marco
for their advices.
A proper thanks to the food company Attianese SpA, our partner in the project.
Thanks to the guys of the chilean trip for the carefree times I’ll never forget.
A kiss to Rosanna for her patience in some periods and to my family too.

170
Appendix:
Research papers
Current Medicinal Chemistry, 2012, 19, 109-117 109
0929-8673/12 $58.00+.00 © 2012 Bentham Science Publishers
Nutraceuticals for Protection and Healing of Gastrointestinal Mucosa
M. Romano*,1, P. Vitaglione
2, S. Sellitto
2 and G. D’Argenio
3
1Dipartimento Medico Chirurgico di Internistica Clinica e Sperimentale and C.I.R.A.N.A.D., Seconda Università di Napoli;
2Dipartimento di Scienze degli Alimenti Università Federico II, Napoli;
3Dipartimento di Medicina Clinica e Sperimentale,
Università Federico II and Istituto di Biochimica delle Proteine, C.N.R., Napoli, Italy
Abstract: Natural medicinal products have been used for millennia for the treatment of several ailments. Although many have been
superseded by conventional pharmaceutical approaches, there is currently a resurgence in the interest in natural products by the general
public and the use of complementary and alternative medicine is increasing rapidly in developed countries. Also, pharmaceutical
industries are more and more interested in examining their potential as sources of novel medicinal compounds which may act as growth
factor or show immunomodulatory or anti-microbial activity. The subgroup of natural bioactive compounds that bridge the gap between
food products and drugs are termed nutraceuticals or functional foods. In contrast with most standard medicinal compounds,
nutraceuticals are generally used to prevent rather than to treat disease. Many of the claims for such products are supported by very
limited scientific evidence. However, there has recently been a great interest at evaluating the mechanism by which natural products exert
their beneficial effects in the gastrointestinal tract. In particular, a major area of interest is for the use of biologically active chemical
components of plants, i.e. phytochemicals, in a number of gastrointestinal disorders. While the major focus of phytochemical research
has been on cancer prevention, several products of plant origin are being used and/or under study for a variety of other gastrointestinal
problems. In this review we discuss the scientific evidence supporting the potential use of nutraceuticals as agents capable to prevent or
accelerate healing of gastrointestinal mucosal damage, with a focus on polyphenol extracts obtained from apple.
Keywords: Apple polyphenols, gastric protection, intestinal protection, antioxidants, nutraceuticals, phytochemicals.
INTRODUCTION
The term “Nutraceutical” was firstly coined by DeFelice, chairman of the Foundation for Innovation in Medicine (FIM) [1, 2], and was later defined by Health Canada as, " A product isolated or purified from foods that is generally sold in medicinal forms not usually associated with food… is demonstrated to have a physiological benefit or provide protection against chronic disease." [3]. Nutraceuticals include a variety of dietary supplements (mineral, vitamin and antioxidant supplements) but also probiotics, herbs, essential oils, fortified foods and drinks.
For their ancient use among population as natural remedy against several diseases, phytochemicals, i.e. plant components with activities towards animal biochemistry and metabolism, are being widely studied for their ability to provide health benefits and to justify their use as nutraceuticals [4]. Phytochemicals are reported to exert several biological activities: i) participating as substrates and as cofactors or inhibitors of enzymes in biochemical reactions; ii) influencing absorption and stability of nutrients as well as scavenging and eliminating toxic compounds along the gastrointestinal tract (GIT); iii) being selective growth factors and fermentation substrates for beneficial oral and gastrointestinal bacteria as well as inhibitors of deleterious intestinal bacteria [4]. In the body phytochemicals may act at both systemic level (in organs outside the GIT) or inside the gastrointestinal tract, also if they are bound to insoluble dietary fibre [5]. In the case of benefits at systemic level (if any) phytochemicals effects are mediated by their bioavailability and/or by the activity of metabolites and biotransformation products. For long time these effects and the underlying mechanisms have been supposed on the basis of in vitro studies on cell or tissue culture performed using high concentrations of the compounds that in vivo, by oral exposure, could never occur. Unfortunately, in many cases, the effects found in vitro were also transferred to the food containing the bioactive compound, without considering the low amounts achievable by dietary intake and the bioavailability issue. A clear example is the case of resveratrol, which was demonstrated to have several biological effects in vitro at concentrations of 1-100 M [6], that is unlikely to be obtained in vivo by consuming moderate amount of red wine (containing
*Address correspondence to this author at the Dipartimento Medico Chirurgico di
Internistica Clinica e Sperimentale, II Policlinico, Edificio 3, IV piano, Via Pansini 5,
80131 Napoli, Italy; Tel/Fax: ++390815666714; E-mail: [email protected]
resveratrol at 0-10 ppm) due to the rapid metabolism and urinary excretion of the molecule [7].
On the other hand poor attention was paid to the potential role of phytochemicals inside the GI tract where bioavailability is not an issue for their bioactivity. In the mouth, stomach and upper intestine, it is possible the definition of efficacy dosages of individual phytochemicals for specific effect. In Table 1 the results obtained by human and animal long term intervention studies published during the last 10 years and dealing with the effects of polyphenols inside the GIT were summarized. The Table highlights the dosage, the source, the target and the main outcomes of the studies.
Curcumin was the polyphenol majorly studied in humans in the last years. Due to its ascertained ability to inhibit NF- B activation [9] curcumin has been proposed as potential therapeutic agent against several non communicable chronic diseases having an inflammatory origin such as neurodegenerative diseases (Alzheimer’s and Parkinson’s disease, multiple sclerosis, epilepsy), CVD, diabetes, obesity, allergies and certain types of cancer [10]. Anyway results from intervention studies are still not conclusive. As regards treatment of colon cancer no effect was found in the study performed by [11] administering to patients 4 g/d curcumin in capsules per 4 months. The authors reported some systemic effects of curcumin but no direct effect on mucosa [11]. Similarly no effect was found by treatment with soy isoflavones in the study by [12] and in eradication of Helicobacter pylori in patients with chronic gastritis treated with curcumin [13]. On the contrary amelioration of intestinal mucosa inflammation was shown with low dose of curcumin (1.1 g/d) in patients with inflammatory bowel diseases [14] and, similarly, a big study on 87 patients with resected colon cancer or polyps showed that a mixture of flavonoids, although not effective in reducing colon cancer, reduced neoplasia [15].
These features highlight the actual general assumption (derived from evidences in animals) that in the case of GIT cancers and diseases, phytochemicals may better function as pathology preventive but curative agent. In fact, in the animal studies using accelerated model of pathologies, as Apc
Min/+ mice, which
spontaneously develop multiple intestinal polyps within a few weeks of birth, the inclusion in the diet or in drinking water of curcumin or EGCG just after weaning was demonstrated to retard or reduce tumorogenesis at polyphenol dosage that was absolutely affordable by humans with diet [16-18]. Moreover animal studies

110 Current Medicinal Chemistry, 2012 Vol. 19, No. 1 Romano et al.
Table 1. Effects of Food Bioactive Polyphenols Inside the Gastrointestinal Tract (GIT)
Subjects
(n)
Phenolic compound
and source
Dose and experiment
conditions Target Results Major findings Reference
20
Colorectal cancer
patients
Pure resveratrol
in capsules
2.2 – 4.4 mmol/d
x 8 days Colon cancer Tumor cell proliferation is 5% reduced
Resveratrol (0.5-1.0 g/d)
produces levels in the human GIT sufficient to elicit
anticarcinogenic effects.
[8]
87
Patients with resected
colon cancer
or polyps
Mixture of flavonoids in tablets
(apigenin and EGCG)
40 mg/d
x 2-5 years
Colorectal cancer
No significant effect in cancer and polyp recurrence rates
Significantly reduced recurrence rate for neoplasia in treated subjects
Sustained long-term treatment with a flavonoid mixture
could reduce the recurrence rate of neoplasia in patients with resected colon cancer.
[15]
15
colorectal
cancer patients
Curcuminoids in
capsules
Curcuminoids
from 0.5 to 4 g/d
x 4 months
Colorectal
cancer
No partial responses to treatment.
Reduction (by ~60%) of inducible PGE2
production in blood 1 h after higher dose
Systemic pharmacological
properties with 4g curcuminoids / die
[11]
36
Chronic gastritis H.
pylori+ patients
Curcumin tablets
vs
Antibiotics
Curcumin
120 mg/d
x 4 weeks
H. pylori
infection
Bacteria eradication:
1/17 pts with curcumin
15/19 pts with antibiotics
It is unlikely that curcumin
alone has antibactericidal
effect on H. pylori.
[13]
5 with proctitis
5 with Crohn’s
Curcumin
in capsules
1.1-1.7 g/d x 1 month
1.1 g/d x 3 months
Inflammatory bowel disease
Amelioration of proctitis
Reduction of Crohn’s Disease Activity Index
Curcumin at dosage of 1.1 g/d can improve inflammatory
bowel disease [14]
150
Patients with adenomatos
polyps
Soy-drink powder
Isoflavones
83 mg/d
vs
3 mg/d (control)
x 12 months
Colorectal
epithelial cell proliferation
In colon: cell proliferation and number
of crypt labeled nuclei
In cecum/colon: proliferation count.
No effect on proliferation distribution and crypt height
Soy isoflavones has no effect
on some markers of colorectal cancer
[12]
35
ApcMin/+
mice
Curcumin
Curcumin
150-300-750 mg/kg pd Vs Control diet
x 8 weeks
Intestinal tumorogenesis
Curcumin 300 mg/kg pd prevented/retarded adenoma formation
Curcumin is efficacy at a dose that in humans would be of
1.6 g per 70 kg person [16]
141
ApcMin/+
mice
Pure
EGCG
Caffeine
EGCG 0.02-0.32%
Vs Caffeine 0.044%
Vs control
in drinking water
x 6-7 weeks
Intestinal
tumorogenesis
EGCG decreases small intestinal
tumorogenesis in a dose-dependent manner
In small intestinal tumors increases levels of E-cadherin and decreases several
trascriptor factors of oncogenic genes
Caffeine has no effect
EGCG inhibits intestinal
tumorigenesis in ApcMin/+ mice [17]
27
ApcMin/+
mice
EGCG or ECG
EGCG or ECG 0.01%
Vs vehicle
in drinking water
x 2 months
Intestinal
tumorogenesis
Only EGCG
reduces the size and number of tumors and the total number of polyps and tumor
load compared with controls.
suppresses bFGF in tissue
EGCG may suppress intestinal
tumorigenesis in vivo by
reducing bFGF expression and
angiogenesis
[18]
78
piglets
Apple pomace diet
(AP)
Red-wine pomace
diet (RWP)
Vs
Control diet (CD)
Total polyphenols
ingestion (mg/d):
AP 26.0 – 110
RWP 57.2 – 242
CD 16.9 – 71.5
x 4 weeks
Morphology
of GI tract
Villus length of jejunum and ileum in:
CD decrease after weaning
AP and RWP never decrease
Villus breadth of jejeum in:
CD increase by 73%
AP and RWP increase by 10%
Peyer’s patches area:
CD increase
AP and RWP no effect
RWP inhibitory effect on
the jejunum villi growth
AP and RWP
stimulating effect on crypt size in piglet colon
can reduce the GALT activation via the Peyer’s
patches in the ileum.
[19]
32
rats
Apple polyphenol
extracts (APE) in drinking water
10 mL APE 10-4 M/d
(phenols 0.9 mg/kg)
x 10 days before indomethacin
treatment
Injury of
gastric mucosa
APE pretreatment decreased the extent of
macroscopic and microscopic injury vs control.
APE prevents indomethacin
injury on gastric mucosa in rats.
[20]
98
ApcMin/+
mice Wild type mice
Apple polyphenol extracts (APE) in
drinking water
APE
8 μM catechin eq/kg b.w.
Vs water
x 12 weeks
+ Western Diet (WD)
+ Balanced Diet (BD)
Familial adenomatous
polyposis
(FAP)
APE:
prevents cachexia in ApcMin/+ WD
reduces polyp number and eliminates
high-grade dysplasia in ApcMin/+ mice
influences polyp growth
has antioxidant and anti-lipoperoxidation properties
protects against DNA hypomethylation
APE is a candidate chemopreventive agent for
clolorectal cancer,
particularly for high risk
populations (such as FAP) eating a WD
[22]

Nutraceuticals and the GI Tract Current Medicinal Chemistry, 2012 Vol. 19, No. 1 111
demonstrated, accordingly with epidemiological evidences, that mixture of phytochemicals, as found in natural products, may function even better than single pure compounds, due to synergisms among individual molecules and/or nutrients which can lead to modification of GIT morphology, as found by [19] in piglets administered with apple or red wine pomace. This fact together with biochemical and epigenetic activities of compounds in the GI environment and mucosa can explain the ability of phytochemicals to counteract dietary chemical toxics or the detrimental long term effect of nutritionally imbalanced diet, as demonstrated in studies relative to stomach [20, 21] and colorectal [22] mucosa protection by apple polyphenols (APE), respectively.
In this framework and starting from the ancient proverb that “an apple a day takes the doctor away”, in this review scientific evidence supporting the potential use of nutraceuticals as agents capable to prevent or accelerate healing of gastrointestinal mucosal damage will be discussed majorly focusing on apple polyphenols.
NUTRACEUTICALS IN THE PROTECTION AND HEA-
LING OF GASTRIC MUCOSA DAMAGE
In the stomach there is a massive production of reactive oxygen species (ROS), their concentration being 1000-fold higher than that in other tissues or plasma [23]. Generation of ROS contributes to exogenous injury to the gastric mucosa, including damage brought about by ethanol or nonsteroidal anti-inflammatory drugs (NSAIDs) [24,25]. Moreover, ROS play a major role in the multistep process leading to the development of gastric cancer [26].
Naturally occurring anti-oxidants exert protective biochemical effects in a number of biological experimental systems and are known to scavenge oxygen and nitrogen free radicals breaking lipid chain peroxidation reaction. In particular, phenolic compounds, which are widely distributed in vegetable foods, are considered to play an important role in the prevention of oxidative damage in living systems [27]. Beside their action as radical scavengers, phenolic compounds also have several indirect effects, in fact they are able to inhibit lipoxygenase [28], to reduce platelet aggregation [29] and to reduce the bioavailability of food carcinogens [30]. Certain flavonoids or compounds with flavonoid-like properties have anti-ulcer activity and prevent gastric mucosal lesions brought about by a number of ulcerogens [31-33]. This effect has been related to their ability to inhibit lipid peroxidation, to scavenge ROS, and/or to modulate leukocyte function [34,35]. Singh and colleagues [36] demonstrated that melatonin and -carotene were protective against indomethacin-induced gastric injury in the rat and that this effect was mediated by scavenging of oxygen-derived free radicals. Similarly, Alarcon de la Lastra et al. [31] showed that extra-virgin olive oil-enriched diets prevented indomethacin-induced gastric damage in rats. Finally, the synthetic flavonoid mecianadol has been shown to prevent ethanol- and aspirin-induced gastric injury in the rat [37].
A long list of phytochemicals has been demonstrated to exert gastroprotective effects in in vivo experimental model.
Aloe vera, a medicine since before Roman times, contains several potentially bioactive compounds, including salycilates, lupeol, campestrol, -sitosterol, -linolenic acid, aloctinA, and anthraquinones. Acemannan, a component of Aloe vera, has been reported to prevent stress-induced gastric ulceration in the rats [38]. In vivo and in vitro studies have provided evidence that the wound healing properties of Aloe vera depend on its ability to stimulate collagen synthesis and fibroblast activity, thus enhancing the remodeling phase of the ulcer healing process [39,40].
Curcumin, the yellow pigment of turmeric (Curcuma longa), a widely used spice in Indian and Thai cuisine, has been shown to improve endoscopic healing of peptic ulcers as well as symptoms of patients with non-ulcer dyspepsia [41]. A new zinc(II)-curcumin
complex has been demonstrated to prevent cold-restraint stress-induced gastric ulcers in mice and this gastroprotective effect was associated to increased mRNA expression of HSP70 and attenuation of increased iNOS mRNA expression in the mucosa [42] (ok). Also, curcumin prevents indomethacin-induced gastric ulcerations in the rat and this effect is mediated by preventing peroxidase inactivation and by enhancing ROS scavenging [43].
The Bael (Aegle marmelos) tree grows in tropical and subtropical countries. Luvangetin, a pyranocoumarin isolated from the seed of Aegle marmelos, has been shown to protect rodents gastric mucosa in multiple model of gastric culceration through a nonidentified prostaglandin-independent pathway [44].
Garlic derivatives are commonly used by the public for a variety of condition including hypercholesterolemia. Also, ingestion of garlic results in the formation of diallyl disulphide from its organosulphur constituents, thus causing an increase in the tissue activities of phase II detoxification enzymes quinine reductase and glutathione transferase [45]. Garlic oil has been shown capable of preventing ethanol-induced gastric injury in rats and this protective effect has been attributed to its anti-oxidant activity [46]. Infact, garlic oil decreased lipid peroxidation and ameliorated the decrease in anti-oxidant enzyme levels brought about by ethanol [46].
Several other plant-derived extracts are of potential interest in the protection of gastric mucosa against axogenous injury. Often these extracts derive from sources such as South America folklore products. One example is provided by Dragon’s blood (i.e. Sangre de grado). This viscous red tree sap is used by indigenous cultures of the Amazon river basin because of its healing properties. Sangre de grado derives from several Croton species and is used orally for gastritis and gastric ulcer [47]. In particular, sangre de grado was able to accelerate the healing of acetic acid-induced gastric ulcers in rats, reducing myeloperoxidase activity, ulcer size and bacterial content of the ulcer. Also, sangre de grado attenuated the ulcer-induced overexpression of proinflammatory genes such as TNF- , iNOS, IL-1 , IL-6, and COX2 [47].
Natural honey and Nigella sativa have been in use as a natural remedy for over thousand years in various part of the world. In particular, honey has been used to advantage as a topical preparation for wound healing due to its capacity to stimulate tissue growth, enhance re-epithelization and minimize scar formation [48]. These effects are ascribed to honey’s acidity, hydrogen peroxide content, osmotic effect, antioxidant and immuno-stimulatory effect [48]. A study by Bukhari and coworkers has recently shown that both natural honey and Nigella sativa seeds were equally effective in healing gastric ulcers induced by acetylsalicylic acid in rats at the macroscopic and microscopic level [49]. Phytomedicines have shown great promise in the treatment of several intractable infectious diseases, including opportunistic AIDS infections. In particular, honey can inhibit the growth of H. pylori, the main etiologic agent of gastritis, peptic ulcer and gastric adenocarcinoma [50], thus raising the possibility of using honey orally for the treatment of H. pylori infection.
In the past few years, we have been interested in evaluating the potential gastroprotective effect of a polyphenolic extract obtained from a variety of apple (i.e. Annurca Apple) tipycal of Southern Italy. We have shown that this apple polyphenol extract (APE), rich in catechin and epicatechin, is able to prevent ROS- or indomethacin-induced injury to gastric epithelial cells in vitro [19]. Also, APE is able to prevent indomethacin- or aspirin-induced injury to the rat stomach in vivo both macroscopically and at the histological level [19,20]. This effect is associated with a significant increase in the intracellular anti-oxidant activity and to a decrease in drug-induced lipid peroxidation as assessed by determination of malondialdheyde, thus suggesting that the APE protective effect is mainly contributed by its anti-oxidant activity. Moreover, APE

112 Current Medicinal Chemistry, 2012 Vol. 19, No. 1 Romano et al.
counteracted the increased expression both at the mRNA and protein level, of COX-2 and HB-EGF, observed following administration of a damaging dose of aspirin [20]. More interestingly, the gastroprotective effect exerted by APE was not associated to a decrease in gastric acid secretion [20] (Fig. 1). This has potential clinical relevance, because prolonged acid suppression, which is the currently adopted method to prevent gastric damage induced by NSAIDs or aspirin, has been reported to be associated with increased susceptibility to infections, spontaneous hip fracture and formation of gastric polyps mainly in the fundus of the stomach [51-53].
Cordyceps sinensis (Cordyceps caterpillar mushroom) is a traditional Chinese medicine and health food used to support many organ systems. It is commercially produced in a liquid medium or on a solid (grain/potato) phase. Marchbank et al. have recently demonstrated that Cordyceps sinensis extract is able to prevent indomethacin –induced injury to the rat stomach, the results being similar to those obtained with the potent gastroprotective agent EGF [54].
Fermentation is a commonly used process in the standard food industry as well as in the bioactive food field. Fermentation of food products has many effects including partial degradation of protein constituents which, as well as aiding absorption from the gut, may also influence its biological activity. Recently, Fitzgerald et al. have demonstrated that a commercial fish protein hydrolysate preparation significantly prevents indomethacin-induced gastric injury in the rat and accelerates epithelial cell migration and proliferation (i.e. the main events leading to gastrointestinal mucosal repair) [55].
In conclusion, the use of food bioactive compounds to reduce drug-induced gastric injury is a reliable approach well acceptable by the general public and that can be particularly effective for stomach disorders, as food bioactive compounds are present in the stomach at the same concentration as in the original foods without uncertainties related to the bioavailability and biotransformation. In particular, the use of NSAID, including low-dose aspirin, continues to be associated with an unacceptable risk for GI ulceration and
bleeding. The most effective strategy to reduce NSAID-associated gastric toxicity consists of the use of anti-secretory agents, such as H2-receptor antagonists or proton pump inhibitors (PPI). In particular, the use of NSAID combined with PPI has been adopted widely in clinical practice and it is estimated that PPI use could significantly reduce the rate of endoscopic NSAID-related ulcers. However, prolonged use of PPI is costly and might carry some risk (51-53). That dietary polyphenols, such as those extracted from apple, are able to prevent NSAID injury to the stomach without altering gastric homeostasis, indicates that there might be low cost, effective and safe means of addressing the issue of the prevention of NSAID gastropathy.
ROLE OF NUTRACEUTICALS IN THE LOWER GAS-
TROINTESTINAL TRACT
Foods contain complex mixtures of components [56]; to understand their impact on human health, their nature, origin, amount in the diet, bioavailability and microbial metabolization in the colon need to be investigated. In this respect, gaining understanding of the metabolization pathways of polyphenols and dietary fibre by the microbiota and the kind of bioactive metabolites that are formed during this process is of great interest. Moreover, the effects of such metabolites on the composition of the microbiota itself might be investigated to prepare new strategies that could be an important tool for future therapeutic approaches.
Several studies in the past decade have supported evidence for an alternative approach to the treatment of inflammatory bowel disease (IBD) via manipulation of the resident enteric microflora. This may be achieved with pre- and pro-biotics, and with exogenous butyrate. Increasing appreciation of the pivotal role of the enteric microflora in the maintenance of a healthy gut, and in the pathogenesis of IBD, [57,58] has supported the interest in this area. IBD, mainly ulcerative colitis (UC) and Crohn's disease (CD), is a chronic relapsing disorder associated with uncontrolled inflammation within the gastrointestinal tract [59], which has been shown to predispose to the development of colorectal cancer later in life [60]. Recently, it has been estimated that IBD affects
Fig. (1). Effects of APE or esomeprazole, a proton pump inhibitor, on gastric mucosal damage induced by aspirin (panel A) and on gastric acid secretion
(panel B) in rats. APE or esomeprazole were equally effective in preventing aspirin-induced gastric damage (panel A). This was at the expenses of profound
acid inhibition with esomeprazole, whereas the protective dose of APE did not alter gastric acid secretion (panel B).
ControlEsomeprazole
APEA B80
Mic
rosc
opic
Inde
x (%
)
*
0
20
40
60
*
0
25
50
H+
conc
entra
tion
outp
ut
(mE
q/h)

Nutraceuticals and the GI Tract Current Medicinal Chemistry, 2012 Vol. 19, No. 1 113
approximately one million people in USA alone [61]. An underlying factor in the development of these conditions appears to be a dysregulated immune response to the host microbiota in genetically susceptible individuals [62]. Whilst CD and UC both fall under the collective term IBD, these conditions can be quite distinct, with different pathogenesis, underlying inflammatory profiles, symptoms and treatment strategies. CD is predominantly a Th1-driven immune response, characterised initially by increased interleukin (IL)-12 expression, followed by interferon (IFN)- and tumour necrosis factor (TNF)- [63]. CD can occur in any region of the gastrointestinal tract and is characterised by transmural, granulomatous inflammation. In contrast, UC is believed to be a Th2 immune response, leading to increased production of proinflammatory cytokines. UC is restricted to the colon and generally begins in the rectum and spreads proximally, dependent upon disease severity [63]. To further complicate IBD diagnosis, approximately 10% of IBD patients present with symptoms that cannot be categorized as typical of UC or CD. These conditions are referred to as indeterminate colitis, and may develop into UC or CD as the disease progresses [59]. Whilst the aetiology of IBD is not well understood, environmental, genetic and immunological factors appear to play a role in the development of both diseases [64].
As the intestinal microbiota has been linked to the pathogenesis of IBD, probiotic treatment is a consequent choice for therapeutic intervention. An alternative is via the administration of prebiotics. Prebiotics are indigested dietary fibres producing: short-chain fatty acids, including butyrate, propionate and acetate in the colon as a consequence of fermentation by luminal bacteria. Short-chain fatty acids are readily absorbed by the intestinal mucosa and are an important source of substrate for metabolism of colonocytes; they are trophic to the intestinal mucosa, stimulate water and sodium absorption in the colon, and induce enzymes that promote mucosal restitution [65,66]. A direct anti-inflammatory role for butyrate, the most extensively studied of the short-chain fatty acids, has been suggested [67]; butyrate enemas have been shown to be of benefit in the management of ulcerative colitis [68] and in animal models of colon inflammation. Germinated barley foodstuff (GBF), a dietary component high in glutamine-rich protein and hemi-cellulose-rich dietary fibre, has demonstrated prebiotic characteristics in the DSS model of rat colitis, as it decreased the incidence of bloody diarrhoea and mucosal injury [69]. In animal and human studies, ingestion of resistant fibre has resulted in an increase in the population of Bifidobacillus and Lactobacillus in the colon and an increase in faecal butyrate concentration; GBF has been shown to attenuate inflammation in dextran sodium sulphate, trinitrobenzene sulfonic acid (TNBS) and HLA transgenic animal models of colitis [70-73]. Improvement in clinical and endoscopic indices has been reported in a pilot study of 10 patients with active ulcerative colitis with 4 weeks of treatment with GBF that was well tolerated and did not show significant adverse events [74]. Furthermore, the fibre also contributes to increase stool consistency due to its high avidity for water and possibly its adsorption of luminal bile salts [72,75]. An open-label, parallel-group, randomized study of another fibre, Platago ovata seeds, also reported equal efficacy to mesalazine in maintaining remission in patients with ulcerative colitis [76]. GBF was also shown to display a greater capacity to reduce the symptoms of DSS colitis than a probiotic mixture of lactobacilli and C. butyricum [77]. More recently, it was reported that a mixture of long-chain inulin and oligosaccharide was able to reduce macroscopic scores and inflammatory histological scores in the colon [78]. Oligosaccharides are other prebiotics which have shown a capacity to reduce DSS colitis in rats [79]. There is definitive evidence from animal models that prebiotic supplementation of the diet may provide a therapeutic option in the treatment of IBD. The rationale behind prebiotic use is to elevate the endogenous numbers of beneficial bacterial strains including lactobacillus and bifidobacterium [80]. This increase leads to the beneficial effects
seen by probiotic administration, including an increase in short chain fatty acids production, particularly butyrate, which can provide fuel for colonocytes, production of anti-bacterial substances, and decreased luminal pH [62]. Our previous study [81] demonstrated that serum and tissue transglutaminase (TG) activity correlate with the severity of inflammation in the TNBS-model of colitis; moreover butyrate stimulates TG activity in several cultured cell lines [82]. Based on these evidences, we treated TNBS rats with butyrate, mesalamine, or butyrate in combination with mesalamine enemas, obtaining an improvement of histology more marked in the presence of butyrate that also increases TG activity in the colon. Further evidences have shown that different isoforms of TG play a key role in tissue healing in UC [83] (Fig. 2).
Fig. (2). Role of different transglutaminases in the colon: in the normal
colon, Keratinocyte transglutaminase (TGk) contribute to intracellular tight
junction formation while tissue transglutaminase (tTG) is preferentially
localised within the cell cytosol. In the presence of pathogens, TGk is
downregulated allowing cell separation and antigens to penetrate and
perpetrate the mucosal damage. At that stage, tTG is upregulated and
massively released in the inflamed area together with the circulating
transglutaminase factor XIIIa; they promote cross linking of proteins in the
extracellular matrix (ECM) initiating the healing process.
The research involving the use of prebiotics to treat IBD is not currently as extensive as that regarding probiotic therapy. Probiotics are provided in processed foods or in dietary supplements as live bacteria. Yogurt is the most common probiotic-carrying food; however, cheese, fermented and unfermented milks, juices, smoothies, cereal, nutrition bars, and infant/toddler formula all are vehicles for probiotic delivery. The main probiotic supplements on the market utilize lactobacilli, streptococci and bifidobacteria, which are normal constituents of the human gastrointestinal microflora. However, studies are also investigating potential probiotic roles of other microbes such as yeast (Saccharomyces boulardii), which are not normally found in the gastrointestinal tract [84,85]. Probiotic microorganisms do not act exclusively in the large intestine by affecting the intestinal flora but also affect other organs, either by modulating immunological parameters, intestinal permeability and bacterial translocation, or by providing bioactive metabolites [86]. As the microbial environment has been shown to play a role in the development of IBD, targeting of the microbiota presents an option for therapeutic intervention [87]. One potential method to manipulate the intestinal microbiota in an attempt to reduce the inflammatory response is via the administration of probiotics. Probiotics have been used in the treatment of a number
Down-regulation of TGk
tTG release
Normal mucosa
Early mucosal damage
SystemicFactor XIIIa
Matrix remodeling
114 Current Medicinal Chemistry, 2012 Vol. 19, No. 1 Romano et al.
of inflammatory conditions including arthritis [88], atopic eczema [89], pouchitis [90], radiationinduced [91], and NSAID-induced enteropathy [92], chemotherapy-induced mucositis [93], ulcerative colitis [94], Crohn's disease [95], antibiotic-induced diarrhoea [96] and experimental colitis [97]. The mode of action of probiotics is complex and not completely understood; there have been a large number of known probiotic species, most of which show differing mechanisms of action. However there are a number of common mechanisms present in a wide variety of probiotic strains. One such mechanism is adherence to the intestinal mucosal surface which prevents colonisation of pathogenic bacteria through a form of competition between the two species [98]. Evidence for this mode of action has been shown in numerous in vitro model systems for example, pre-incubation with Lactobacillus rhamnosus GG (LGG) has been shown to prevent the adherence of B. vulgatus to mouse epithelial IEC-6 cells [99]. A further common mode of action is via stimulation of the intestinal immune system. Probiotics are believed to be involved in the modulation of cytokine levels by inhibiting production of pro inflammatory cytokines (including TNF- and IL-1 ) and promoting production of anti-inflammatory cytokines (including IL-10) [99]. Probiotics are also believed to function via the modulation of cell proliferation and apoptosis [100]. The increase in epithelial cell proliferation is believed to be due to the ability of probiotic strains to produce short chain fatty acids via the fermentation of polysaccharides. The antiapoptotic effects of probiotics have been shown in human and mouse colon cells by the activation of the anti-apoptotic Akt pathway and by the inhibition of the proapoptotic p38/MAPK pathway [101]. Therefore, probiotics have the potential to be beneficial in the treatment of IBD due to their capacity to prevent the colonisation of pathogenic bacteria [98], reduce inflammatory cytokine expression [99], enhance epithelial cell proliferation [100], inhibit apoptosis [101] and provide metabolic energy for colonocytes [98].
A number of clinical trials have focused on the use of probiotics in IBD, however, there is a deficiency of large, randomised, double-blind, placebo-controlled clinical trials investigating the efficacy of candidate probiotic species or combinations thereof. One promising study involving the use of probiotics in IBD treatment was in the setting of pouchitis, an inflammatory condition which often arises following surgical resection as a treatment for UC. The study involved patients deemed to be in clinical remission from pouchitis following surgical resection for UC. Patients received daily treatment with probiotics or placebo and were periodically assessed for signs of relapse. Only 15% of treated patients showed signs of relapse compared to 100% of the placebo group [90]. This study indicated that probiotics have the potential to prevent inflammatory conditions in humans. Based on the results from studies in both animal models and clinical trials, there is evidence that a number of probiotic species assist in the reduction of inflammation and intestinal damage whilst others have no effect, depending on the disease setting. For probiotics to become a legitimate therapeutic option for the treatment of IBD there needs to be more focus on the determination of which probiotic strains have the greatest efficacy in a specific disease setting and whether these candidate probiotics are more effective alone, or in conjunction with other pro- or prebiotics. Moreover more consideration of possible adverse side effects and knowledge of the effect of the probiotics on immune regulation in the intestinal mucosa is claimed. An important point is the time that the species remains in the gastrointestinal tract, as this will determine the frequency and dose requirements [102]. It may also be the case that our genetic profile may predispose our responsiveness to probiotic treatment, as is the case with chemotherapy [103]. Identification of these “probiotic respon-siveness genes” may lead to screening to determine whether a patient will be responsive to probiotic therapy, and to which probiotics they would respond more efficiently.
There is currently a growing interest in the use of natural bioactive products by the general public, with many healthy
subjects and patients taking them for the prevention and treatment of multiple conditions, including gastrointestinal disorders. The gastroprotective effect of a polyphenolic extract (APE) obtained from a variety of apple prompted us to test the possibility that APE may be effective in the treatment of experimental colitis. In TNBS rats APE reduced macroscopic and microscopic disase activity and reduced the expression of pro-inflammatory cytochine [104]. As the long lasting inflammation has been shown to predispose to the development of colorectal cancer, the chemopreventive effect of APE in intestinal polyps formation in ApcMin/+ Mice [22] warrants future investigations for APE in IBD. Furthermore, in a recent article, Shapiro et al. [105], suggest that the addition of polyphenols to artificial nutritional formulas would improve the outcome of patients with IBD and acute pancreatitis in need of enteral or parenteral nutrition.
Zinc carnosine (ZnC), is a health food product claimed to possess health-promoting and gastrointestinal supportive activity. A recent study [106] demonstrated that ZnC stimulated cell migration and proliferation, and that oral ZnC decreased gastric and small intestinal injury in animals. No significant increase in gut permeability was seen in volunteers treated with indomethacin when ZnC was co-administered.
Pharmacological options to reduce problems related to gastrointestinal symptoms including cramps, diarrhoea, nausea, and bleeding are limited, particularly in competitive athletics. One product that is attracting great interest is bovine colostrum. Colostrum is the first milk produced after birth and is particularly rich in immunoglobulins, antimicrobial peptides and other bioactive molecules including growth factors [107]. Some studies suggest it may be of value in eliminating infection and stimulating growth of the neonatal gastrointestinal tract [108,109]. Its value in the prevention and treatment of adult gastrointestinal injury has now been suggested [110]. Using a combination of a clinical trial and in vitro experiments, this study has shown that bovine colostrum reduces the exercise-induced increase in gut permeability, possibly through mechanisms including reducing temperature-induced apoptosis and induction of heat shock protein.
CONCLUSIONS
Many healthy subjects and patients are taking potentially bioactive products for the prevention and treatment of multiple conditions, including gastrointestinal disorders. This forms the basis of a world-wide, multi-million dollar major commercial industry. While the scientific validity of the use of a number of these products is lacking, in the past few years much effort has been made to provide solid knowledge of the mechanisms underlying the beneficial effects of nutraceuticals. Scientifically rigorous research is warranted in order to identify novel compounds to be used alone or in combination with standard drugs in gastrointestinal disorders. Also, future research should be aimed at further increasing the efficacy of a promising nutraceutical, trying to use it as a chemical template for combinatorial synthesis. Finally, researchers in this area should focus on the understanding of the mocecular action of each nutraceutical and test the possible synergistic effects with other nutraceuticals and or derivatives, food components, or conventional drug. However, one must keep in mind that just because isolated compounds start from a natural food, they are not necessarily safe and natural and, therefore strict quality control and regulatory issues are mandatory. Future clinical studies are necessary to determine whether these compounds will be as interesting as preventive or therapeutic agents as they are in pre-clinical studies.
REFERENCES
[1] Anonymous. The nutraceutical initiative: a proposal for economic and
regulatory reform (white paper), Foundation for Innovative Medicine, New York, NY, USA, 1991.

Nutraceuticals and the GI Tract Current Medicinal Chemistry, 2012 Vol. 19, No. 1 115
[2] DeFelice, S.L. The nutraceutical revolution: its impact on food industry
R&D. Trends Food Sci. Technol., 1995, 6, 59-61. [3] Health Canada, 1998. Nutraceuticals / Functional Foods and Health Claims
on Foods: Policy Paper. http://www.hc-sc.gc.ca/fn-an/label-etiquet/claims-reclam/nutra-funct_foods-nutra-fonct_aliment-eng.php#1 (Accessed June 22,
2011). [4] Dillard, C.J.; German, J.B. Phytochemicals: nutraceuticals and human health.
J Sci Food Agric 2000, 80, 1744-1756
[5] Vitaglione, P., Napolitano, A., Fogliano, V. Cereal dietary fibre: a natural functional ingredient to deliver phenolic compounds into the gut. Trends in
Food Science and Technology 2008, 19 , 451-463 [6] Baur J.A.; Sinclair D.A. Therapeutic potential of resveratrol: the in vivo
evidence. Nat Rev Drug Discov, 2006, 5:493-506. [7] Vitaglione, P.; Sforza, S.; Galaverna, G.; Ghidini, C.; Caporaso, N.; Vescovi,
P.P.; Fogliano, V.; Marchelli, R. Bioavailability of trans-resveratrol from red wine in humans. Mol.Nutr. Food Res. 2005, 49, 495-504
[8] Patel, K.R.; Brown, V.A.; Jones, D.J.; Britton, R.G.; Hemingway, D.; Miller, A.S.; West, K.P.; Booth, T.D.; Perloff, M.; Crowell, J.A.; Brenner, D.E.;
Steward, W.P.; Gescher, A.J.; Brown, K. Clinical pharmacology of resveratrol and its metabolites in colorectal cancer patients. Cancer Res.,
2010, 70, 7392-9.
[9] Singh, S.; Aggarwal, B.B. Activation of transcription factor NF-kappa B is suppressed by curcumin (diferuloylmethane). J Biol Chem. 1995, 270, 4995-
5000. [10] Pari, L.; Tewas, D.; Eckel, J. Role of curcumin in health and disease. Arch
Physiol Biochem. 2008, 114, 127-149. [11] Sharma, R.A.; Euden, S.A.; Platton, S.L.; Cooke D.N.; Shafayat, A.; Hewitt,
H.R.; Marczylo, T.H.; Morgan, B.; Hemingway, D.; Plummer, S.M.; Pirmohamed, M.; Gescher, A.J.; Steward, W.P. Phase I clinical trial of oral
curcumin: biomarkers of systemic activity and compliance. Clin. Cancer.
Res., 2004, 10, 6847-54.
[12] Adams, K.F.; Lampe, P.D.; Newton, K.M.; Ylvisaker, J.T.; Feld, A.; Myerson, D.; Emerson, S.S.; White, E.; Potter, J.D.; Lampe, J.W. Soy
protein containing isoflavones does not decrease colorectal epithelial cell
proliferation in a randomized controlled trial. Am. J. Clin. Nutr., 2005, 82, 620-6.
[13] Koosirirat, C.; Linpisarn, S.; Changsom, D.; Chawansuntati, K.; Wipasa, J. Investigation of the anti-inflammatory effect of Curcuma longa in
Helicobacter pylori-infected patients. Int. Immunopharmacol., 2010, 10, 815-8.
[14] Holt, P.R.; Katz, S.; Kirshoff, R. Curcumin therapy in inflammatory bowel disease: a pilot study. Dig. Dis. Sci., 2005, 50, 2191-3.
[15] Hoensch, H.; Groh, B.; Edler, L.; Kirch, W. Prospective cohort comparison of flavonoid treatment in patients with resected colorectal cancer to prevent
recurrence. World J. Gastroenterol., 2008, 14, 2187-93. [16] Perkins, S.; Verschoyle, R,D,; Hill, K.; Parveen, I.; Threadgill, M.D.;
Sharma, R.A.; Williams, M.L.; Steward, W.P.; Gescher, A.J.
Chemopreventive efficacy and pharmacokinetics of curcumin in the min/+ mouse, a model of familial adenomatous polyposis. Cancer Epidemiol.
Biomarkers Prev., 2002, 11, 535-40. [17] Ju, J.; Hong, J.; Zhou, J.N.; Pan, Z.; Bose, M.; Liao, J.; Yang, G.Y.; Liu,
Y.Y.; Hou, Z.; Lin, Y.; Ma, J.; Shih, W.J.; Carothers, A.M.; Yang, C.S. Inhibition of intestinal tumorigenesis in Apcmin/+ mice by (-)-
epigallocatechin-3-gallate, the major catechin in green tea. Cancer Res., 2005, 65, 10623-31.
[18] Sukhthankar, M.; Yamaguchi, K.; Lee, S.H.; McEntee, M.F.; Eling, T.E.; Hara, Y.; Baek, S. J. A green tea component suppresses posttranslational
expression of basic fibroblast growth factor in colorectal cancer.
Gastroenterology, 2008, 134, 1972-80. [19] Sehm, J.; Lindermayer, H.; Dummer, C.; Treutter, D.; Pfaffl, M.W. The
influence of polyphenol rich apple pomace or red-wine pomace diet on the gut morphology in weaning piglets. J. Anim. Physiol. Anim. Nutr. (Berl),
2007, 91, 289-96. [20] Graziani, G.; D'Argenio, G.; Tuccillo, C.; Loguercio, C.; Ritieni, A.;
Morisco, F.; Del Vecchio Blanco, C.; Fogliano, V.; Romano, M. Apple polyphenol extracts prevent damage to human gastric epithelial cells in vitro
and to rat gastric mucosa in vivo. Gut, 2005, 54, 193-200. [21] D'Argenio, G.; Mazzone, G.; Tuccillo, C.; Grandone, I.; Gravina, A.G.;
Graziani, G.; Fogliano, V.; Romano, M. Apple polyphenol extracts prevent aspirin-induced damage to the rat gastric mucosa. Br J Nutr., 2008, 100,
1228-36.
[22] Fini, L.; Piazzi, G.; Daoud, Y.; Selgrad, M.; Maegawa, S.; Garcia, M.; Fogliano, V.; Romano, M.; Graziani, G.; Vitaglione, P.; Carmack, S.W.;
Gasbarrini, A.; Genta, R.M.; Issa, J.P.; Boland, C.R.; Ricciardiello, L. Chemoprevention of Intestinal Polyps in ApcMin/+ Mice Fed with Western
or Balanced Diets by Drinking Annurca Apple Polyphenol Extract. Cancer
Prev. Res. (Phila), 2011, 4, 907-15.
[23] Hiraishi, H.; Terano, A.; Sugimoto, T.; Harada, T.; Razandi, M.; Ivey K.J. Protective role of intracellular superoxide dismutase against extracellular
oxidants in cultured rat gastric cells. J Clin Invest, 1994, 93, 331-8. [24] Mizui, T.; Sato, H.; Hirose, F. ; Doteuchi, M. Effect of antiperoxidative
drugs on gastric damage induced by ethanol in rats. Life Sci, 1987, 41, 755-63.
[25] Pihan, G.; Regillo, C.; Szabo, S. Free radicals and lipid peroxidation in
ethanol- or aspirin-induced gastric mucosal injury. Dig Dis Sci, 1987, 32, 1395-401.
[26] Oliveira, C.P.; Kassab, P.; Lopasso, F.P.; Souza, H.P.; Janiszewski, M.; Laurindo, F.R.; Iriya, K.; Laudanna. A.A. Protective effect of ascorbic acid
in experimental gastric cancer: reduction of oxidative stress. World J
Gastroenterol, 2003, 9, 446-8.
[27] de Groot, H.; Rauen, U. Tissue injury by reactive oxygen species and the
protective effects of flavonoids. Fundam Clin Pharmacol, 1998, 12, 249-55. [28] Laughton, M.J.; Evans, P.J.; Moroney, M.A.; Hoult, J.R.; Halliwell, B.
Inhibition of mammalian 5-lipoxygenase and cyclo-oxygenase by flavonoids and phenolic dietary additives. Relationship to antioxidant activity and to
iron ion-reducing ability. Biochem Pharmacol, 1991, 42, 1673-81. [29] Ferro-Luzzi, A.; Ghiselli, A. Protective aspects of the Mediterranean diet.
Adv Exp Med Biol, 1993, 348, 137-44. [30] Stavric, B. Antimutagens and anticarcinogens in foods. Food Chem Toxicol,
1994, 32, 79-90. [31] Alarcon de la Lastra. C., Barranco, M.D.; Martin, M.J.; Herrerias, J.;
Motilva, V. Extra-virgin olive oil-enriched diets reduce indomethacin-induced gastric oxidative damage in rats. Dig Dis Sci, 2002, 47, 2783-90.
[32] Martin, M.J.; La-Casa, C.; Alarcon-de-la-Lastra, C.; Cabeza, J.; Villegas, I.;
Motilva, V. Anti-oxidant mechanisms involved in gastroprotective effects of quercetin. Z Naturforsch [C], 1998, 53, 82-8.
[33] Mirossay, L.; Kohut, A.; Mojzis, J. Effect of malotilate on ethanol-induced gastric mucosal damage in capsaicin-pretreated rats. Physiol Res, 1999, 48,
375-381. [34] Suzuki, Y. ; Ishihara, M. ; Segami, T. ; Ito, M. Anti-ulcer effects of
antioxidants, quercetin, alpha-tocopherol, nifedipine and tetracycline in rats. Jpn J Pharmacol, 1998, 78, 435-41.
[35] Osakabe, N.; Sanbongi, C.; Yamagishi, M.; Takizawa, T.; Osawa, T. Effects of polyphenol substances derived from Theobroma cacao on gastric mucosal
lesion induced by ethanol. Biosci Biotechnol Biochem, 1998, 62,1535-8. [36] Singh, P.; Bhargava, VK.; Garg, SK. Effect of melatonin and beta-carotene
on indomethacin induced gastric mucosal injury. Indian J Physiol
Pharmacol, 2002, 46, 229-34. [37] Konturek, S.J.; Kitler, M.E.; Brzozowski, T.; Radecki, T. Gastric protection
by meciadanol. A new synthetic flavonoid inhibiting histidine decarboxylase. Dig Dis Sci, 1986, 31, 847-853.
[38] Galal, E.E.; Kandil, A.; Hegazy, R. Aloe vera and gastrogenic ulceration. J
Drug Res, 1975, 7, 73-76.
[39] Chithra. P.; Sajithlal, G.B.; Chandrakasan, G. Influence of aloe vera on th eglycosaminoglycans in the matrix of healing dermal wounds in rats. J
Ethnopharmacol, 1998, 59, 179-186. [40] Chithra, P.; Sajithlal, G.B.; Chandrakasan G. Influence of Aloe vera on
collagen turnover in healing of dermal wounds in rats. Indian J Exp
Biol,1998, 3, 896-901.
[41] Prucksunand, C.; Indrasukhsri, B.; Leethochawalit, M.; Hungspreugs, K.
Phase II clinical trial on effect of the long turmeric (Curcuma longa Linn) on healing of peptic ulcer. Southeast Asian J Trop Med Public Health, 2001, 32,
208-215. [42] MeiX, Xu D.; Xu, S.; Zheng, Y.; Xu, S. Gastroprotective and anti-depressant
effects of a new zinc(II)-curcumin complex in rodent models of gastric ulcer and depression induced by stress. Pharmacol Biochem Behav, 2011, 99, 66-
74. [43] Chattopadhyay, I.; Bandyopadhyay, U.; Biswas, K.; Maity, P.; Banerjee,
R.K. Indomethacin inactivates gastric peroxidase to induce reactive-oxygen-mediated gastric mucosal injury and curcumin protects it by preventing
peroxidase inactivation and scavenging reactive oxygen. Free Radic Biol
Med, 2006, 240, 1398-1408. [44] Goel, R.K.; Maiti, R.N.; Manickam, M.; Ray, AB. Antiulcer activity of
naturally occurring pyrano-coumarin and isocoumarins and their effect on prostanoid synthesis using human colonic mucosa. Indian J Exp Biol, 1997,
35, 1080-1083. [45] Munday, R.; Munday, C.M. Low doses of diallyl disulfide, a compound
derived from garlic, increase tissue activities of quinine reductase and glutathione transferase in the gastrointestinal tract of the rat. Nutr Cancer,
1999, 34, 42-48. [46] Khosia, P.; Karan, R.S.; Bhargava, V.K. Effect of garlic oil on ethanol
induced gastric ulcers in rats. Phytother Res, 2004, 18, 87-91. [47] Miller, M.J.; MacNaughton, W.K.; Zhang, X.J.; Thompson, J.H.;
Charbonnet, R.M.; Bobrowski, P.; Lao, J.; Trentacosti, A.M.; Sandoval, M.
Treatment of gastric ulcers and diarrhea with the Amazonian herbal medicine sangre de grado. Am J Physiol Gastrointest Liver Physiol 2000, 279, G192-
200. [48] Al Waili, N.; Salom, K.; Al-Ghamdi, A.A. Honey for wound healing, ulcers,
and burns; data supporting its use in clinical practice. ScientificWorldJournal, 2011, 5, 766-787.
[49] Bukhari, M.H.; Khalil, J.; Qamar, S.; Qamar, Z.; Zahid, M.; Ansari, N.; Bakhshi, I.M. Comparative gastroprotective effects of natural honey, Nigella
sativa and cimetidine against acetylsalicylic acid induced gastric ulcer in albino rats. J Coll Physicians Surg Pak, 2011, 21, 151-156.
[50] Ndip, R.N.; Malange Tarkang, A.E.; Echakachi C.M.; Malongue, A.; Akoachere, J-FTK; Ndip, L.M.; Luma, H.N. In vitro antimicrobial activity of
selected honeys on clinical isolates of Helicobacter pylori. African Health
Sciences, 2007, 7, 228-231.

116 Current Medicinal Chemistry, 2012 Vol. 19, No. 1 Romano et al.
[51] Laheij, R.J.; Sturkenboom, M.C.; Hassing, R.J.; Dieleman, J.; Stricker, B.H.;
Jansen, J.B. Risk of community-acquired pneumonia and use of gastric acid-suppressive drugs. JAMA, 2004, 292, 1955-60.
[52] Yang, Y.X.; Lewis, J.D.; Epstein, S.; Metz, D.C. Long-term proton pump inhibitor therapy and risk of hip fracture. JAMA, 2006, 296, 2947-53.
[53] Garcia Rodriguez, L.A.; Lagergren, J.; Lindblad, M. Gastric acid suppression and risk of oesophageal and gastric adenocarcinoma: a nested case control
study in the UK. Gut, 2006, 55, 1538-44.
[54] Marchbank, T.; Ojobo, E.; Playford, C.J.; Playford, R.J. Reparative properties of the traditional Chinese medicine Cordycepsis sinensis (Chinese
caterpillar mushroom) using HT29 cell culure and rat gastric damage models of injury. Br J Nutr, 2011,105, 1303-1310.
[55] Fitzgerald, A.J.; Ray, P.S.; Marchbank, T.; Taylor, G.W.; Ghosh, S.; Ritz, B.W.; Playford, R.J. Reparative properties of a commercial fish protein
hydrolysate preparation. Gut, 2005, 54:775-781. [56] D'Archivio, M.; Filesi, C.; Di Benedetto, R.; Gargiulo, R.; Giovannini, C.;
Masella, R. Polyphenols, dietary sources and bioavailability. Ann Ist Super
Sanita 2007, 43, 348-361.
[57] Linskens, R.K.; Huijsdens, X.W.; Savelkoul, P.H.; Vandernbroucke-Grauls, C.M; Meuwissen, S.G. The bacterial flora in inflammatory bowel disease:
current insights in pathogenesis and the influence of antibiotics and
probiotics. Scand J Gastroenterol Suppl 2001, 234, 29–40. [58] Schultz, M.; Sartor, R.B. Probiotics and inflammatory bowel disease. Am J
Gastroenterol 2000, 95, S19–21. [59] Hanauer, S.B. Inflammatory bowel disease: epidemiology, pathogenesis, and
therapeutic opportunities. Inflamm Bowel Dis 2006,12 (Suppl 1), S3–S9. [60] Itzkowitz, S.H.; Harpaz, N. Diagnosis and management of dysplasia in
patients with inflammatory bowel diseases. Gastroenterology 2004,126, 1634–1648.
[61] Bamias, G.; Nyce, M.R.; De La Rue, S.A. ; Cominelli, F. New concepts in the pathophysiology of inflammatory bowel disease. Ann Intern Med 2005,
143, 895–904. [62] Sartor, R.B. Therapeutic manipulation of the enteric microflora in
inflammatory bowel diseases: antibiotics, probiotics, and prebiotics.
Gastroenterology 2004, 126, 1620–1633. [63] Papadakis, K.A.; Targan, S.R. Role of cytokines in the pathogenesis of
inflammatory bowel disease. Ann Rev Med 2000, 51, 289–298. [64] Danese, S.; Sans, M.; Fiocchi, C. Inflammatory bowel disease: the role of
environmental factors. Autoimmun Rev 2004, 3, 394–400. [65] Chapman, M.A. The role of the colonic flora in maintaining a healthy large
bowel mucosa. Ann R Coll Surg Engl 2001, 83, 75–80. [66] D’Angenio, G.; Mazzacca, G. Short chain fatty acids in the human colon:
relationship to inflammatory bowel disease and colon cancer. Adv Exp Med
Biol 1999, 472, 149–158.
[67] Segain, J.P.; Raingeard de la Bletierre, D.; Bourreille, A. Butyrate inhibits
inflammatory responses through NF-kB inhibition: implications for Crohn’s disease. Gut 2000, 47, 397–403.
[68] Scheppach, W.; Christl, S.U.; Bartram, H.P.; Richter, F.; Kasper, H.; Effects of short-chain fatty acids on the inflamed colonic mucosa. Scand J
Gastroenterol Suppl 1997,222, 53–57. [69] Kanauchi, O.; Nakamura, T.; Agata, K.; Mitsuyama, K.; Iwanaga; T.J.
Effects of germinated barley foodstuff on dextran sulfate sodium-induced colitis in rats. J Gastroenterol 1998, Apr, 33(2),179-88.
[70] Fukuda, M.; Kanauchi, O.; Araki Y. Prebiotic treatment of experimental colitis with germinated barley foodstuff: a comparison with probiotic or
antibiotic treatment. Int J Mol Med 2002, 9, 65–70. [71] Araki, Y.; Andoh, A.; Koyama, S. Effects of germinated foodstuff on
microflora and short chain fatty acid production and dextran sodium sulfate-
induced colitis in rats. Biosci Biotechnol Biochem 2000, 64, 1794–800. [72] Kanauchi, O.; Iwanaga, T.; Mitsuyama, K. Germinated barley foodstuff
feeding. A novel neutraceutical strategy for ulcerative colitis. Digestion 2001, 63, 60–67.
[73] Kanauchi, O.; Andoh, A.; Iwanaga, T. Germinated barley foodstuffs attenuate colonic mucosal damage and mucosal nuclear factor kappa B
activity in a spontaneous colitis model. J Gastroenterol Hepatol 1999, 14, 1173–1179.
[74] Mitsuyama, K.; Saiki, T.; Kanauchi, O. Treatment of ulcerative colitis with germinated barley foodstuff feeding: a pilot study. Aliment Pharmacol Ther
1998, 12, 1225–1230. [75] Araki, Y.; Andoh, A.; Fujiyama, Y. Germinated barley foodstuff exhibits
different adsorption properties for hydrophilic versus hydrophobic bile acids.
Digestion 2001, 64, 248–254. [76] Fernandez-Banares, F.; Hinojosa, J.; Sanchez-Lombrana, J.L. Randomised
clinical trial of Plantago ovata seeds (dietary fiber) compared with mesalamine in maintaining remissionin ulcerative colitis. Spanish Group for
the Study of Crohn’s Disease and Ulcerative Colitis. Am J Gastroenterol 1999, 94, 427–33.
[77] Fukuda, M.; Kanauchi, O.; Araki, Y.; Andoh, A.; Mitsuyama, K.; Takagi, K.; Toyonaga, A.; Sata, M.; Fujiyama, Y.; Fukuoka, M.; Matsumoto, Y.; Bamba,
T. Prebiotic treatment of experimental colitis with germinated barley foodstuff: a comparison with probiotic or antibiotic treatment. Int J Mol Med
2002, 9, 65–70. [78] Hoentjen, F.; Welling, G.W.; Harmsen, H.J.; Zhang, X.; Snart, J.; Tannock,
G.W.; Lien, K.; Churchill, T.A.; Lupicki, M.; Dieleman, L.A. Reduction of
colitis by prebiotics in HLA-B27 transgenic rats is associated with microflora
changes and immunomodulation. Inflamm Bowel Dis 2005, 11, 977–985. [79] Rumi, G.; Tsubouchi, R.; Okayama, M.; Kato, S.; Mozsik, G.; Takeuchi, K.
Protective effect of lactulose on dextran sulfate sodium-induced colonic inflammation in rats. Dig Dis Sci 2004, 49, 1466–1472.
[80] Roberfroid, M.B. Prebiotics and synbiotics: concepts and nutritional properties. Brit J Nutr 1998, 80, S197–S202.
[81] D'Argenio, G.; Sorrentini, I.; Cosenza, V.; Gatto, A.; Iovino, P.; D'Armiento,
F.P.; Baldassarre, F.; Mazzacca, G. Serum and tissue transglutaminase correlates with the severity of inflammation in induced colitis in the rat.
Scand J Gastroenterol 1992, 27(2),111-114. [82] Birckbichler, P.J.; Orr, G.R.; Patterson, M.K.Jr.; Conway, E.; Carter, H.A.;
Maxwell, M.D. Enhanced transglutaminase activity in transformed human lung fibroblast cells after exposure to sodium butyrate. Biochim Biophys Acta
1983, 763(1), 27-34. [83] D'Argenio, G.; Calvani, M.; Della Valle, N.; Cosenza, V.; Di Matteo, G.;
Giorgio, P.; Margarucci, S.; Petillo, O.; Jori, F.P.; Galderisi, U.; Peluso, G. Differential expression of multiple transglutaminases in human colon:
impaired keratinocyte transglutaminase expression in ulcerative colitis. Gut 2005 , 54(4), 496-502.
[84] Penner, R.; Fedorak R.N.; Madsen, K.L. Probiotics and nutraceuticals: non-
medicinal reatments of gastrointestinal diseases. Curr Opin Pharmacol 2005,
5,596–603.
[85] Michail, S.; Sylvester, F.; Fuchs, G.; Issenman, R. NASPGHAN Nutrition Report Committee. Clinical efficacy of probiotics: review of the evidence
with focus on children. J Pediatr Gastroenterol Nutr 2006, 43, 550–557. [86] de Brese, M.; Schrezenmeir, J. Probiotics, prebiotics, and synbiotics. Adv
biochem Engin Biotechnol 2008, 111, 1–66. [87] Fedorak, R.N.; Madsen, K.L. Probiotics and the management of
inflammatory bowel disease. Inflamm Bowel Dis 2004, 10, 286–299. [88] Baharav, E.; Mor, F.; Halpern, M.; Weinberger, A.; Lactobacillus GG
bacteria ameliorate arthritis in Lewis rats. J Nutr 2004, 134, 1964–1969. [89] Isolauri, E.; Arvola, T.; Sutas, Y.; Moilanen, E.; Salminen, S. Probiotics in
the management of atopic eczema. Clin Exp Allergy 2000, 30, 1604–1610.
[90] Gionchetti, P.; Rizzello, F.; Venturi, A.; Brigidi, P.; Matteuzzi, D.; Bazzocchi, G.; Poggioli, G.; Miglioli, M.; Campieri, M. Oral bacteriotherapy
as maintenance treatment in patients with chronic pouchitis: a double-blind, placebo-controlled trial. Gastroenterology 2000, 119, 305–309
[91] Demirer, S.; Aydintug, S.; Aslim, B.; Kepenekci, I.; Sengul, N.; Evirgen, O.; Gerceker, D.; Andrieu, M.N.; Ulusoy, C.; Karahuseyinoglu, S. Effects of
probiotics on radiation-induced intestinal injury in rats. Nutrition 2006, 22, 179–186.
[92] Kamil, R.; Butler, R.; Geier, M.S.; Howarth, G. Lactobacillus GG but not Bifidobacterium BB12 increases severity of Indomathacin-induced intestinal
ulceration in rats. Gastroenterology 2005,128, A604-A604. [93] Tooley, K.L.; Howarth, G.S.; Lymn, K.A.; Lawrence, A.; Butler, R.N. Oral
ingestion of Streptococcus thermophilus diminishes severity of small
intestinal mucositis in methotrexate treated rats. Cancer Biol Ther 2006, 5, 593–600.
[94] Rembacken, B.J.; Snelling, A.M.; Hawkey, P.M.; Chalmers, D.M.; Axon, A.T. Non-pathogenic Escherichia coli versus mesalazine for the treatment of
ulcerative colitis: a randomised trial. Lancet 1999, 354, 635–639. [95] Prantera, C.; Scribano, M.L.; Falasco, G.; Andreoli, A.; Luzi, C.
Ineffectiveness of probiotics in preventing recurrence after curative resection for Crohn's disease: a randomised controlled trial with Lactobacillus GG. Gut
2002, 51, 405–409. [96] Kim, H.J.; Camilleri, M.; McKinzie, S.; Lempke, M.B.; Burton, D.D.;
Thomforde, G.M.; Zinsmeister, A.R.; A randomized controlled trial of a
probiotic, VSL#3, on gut transit and symptoms in diarrhoeapredominant irritable bowel syndrome. Aliment Pharmacol Ther 2003, 17, 895–904.
[97] Madsen, K.L.; Doyle, J.S.; Jewell, L.D.; Tavernini, M.M.; Fedorak, R.N. Lactobacillus species prevents colitis in interleukin 10 gene-deficient mice.
Gastroenterology 1999, 116, 1107–1114. [98] Guarner, F.; Malagelada, J.R. Gut flora in health and disease. Lancet 2003,
361, 512–519. [99] Dieleman, L.A.; Goerres, M.S.; Arends, A.; Sprengers, D.; Torrice, C.;
Hoentjen, F.; Grenther, W.B.; Sartor, R.B. Lactobacillus GG prevents recurrence of colitis in HLA-B27 transgenic rats after antibiotic treatment.
Gut 2003, 52, 370–376. [100] Ichikawa, H.; Kuroiwa, T.; Inagaki, A.; Shineha, R.; Nishihira, T.; Satomi,
S.; Sakata, T. Probiotic bacteria stimulate gut epithelial cell proliferation in
rat. Dig Dis Sci 1999, 44, 2119–2123. [101] Yan, F.; Polk, D.B. Probiotic bacterium prevents cytokine-induced apoptosis
in intestinal epithelial cells. J Biol Chem 2002, 277, 50959–50965. [102] Shanahan, F.; Probiotics in inflammatory bowel disease—therapeutic
rationale and role. Adv Drug Deliv Rev 2004, 56, 809–818. [103] Kihara, C.; Tsunoda, T.; Tanaka, T.; Yamana, H.; Furukawa, Y.; Ono, K.;
Kitahara, O.; Zembutsu, H.; Yanagawa, R.; Hirata, K.; Takagi, T.; Nakamura, Y. Prediction of sensitivity of esophageal tumors to adjuvant
chemotherapy by cDNA microarray analysis of gene-expression profiles. Cancer Res 2001, 61, 6474–6479.
[104] Mazzone, G.; Tuccillo, C.; Ribecco, M,T.; Graziani, G.; Zagaria, R.; Fogliano, V.; Caporaso, N.; Romano, M.; D’Argenio, G. Apple poyphenol
extracts prevent TNBS-induced colitis in rats. Gastroenterology 2010, 138,
suppl.1, pp.S-414.

Nutraceuticals and the GI Tract Current Medicinal Chemistry, 2012 Vol. 19, No. 1 117
[105] Shapiro, H.; Singer, P.; Halpern, Z.; Bruck, R. Polyphenols in the treatment
of inflammatory bowel disease and acute pancreatitis Gut 2007,56, 426–435. [106] Mahmood, A.; FitzGerald, A.J.; Marchbank, T.; Ntatsaki, E.; Murray, D.;
Ghosh, S.; Playford, R.J. Zinc carnosine, a health food supplement that stabilises small bowel integrity and stimulates gut repair processes. Gut,
2007, 56, 168-175. [107] Playford, R.J.; Macdonald, C.E.; Johnson, W.S.; Colostrum and milk-derived
growth factors for the treatment of gastrointestinal disorders. Am J Clin Nutr
2000, 72, 5–14.
[108] Xanthou, M.; Bines, J.; Walker, W.A. Human milk and intestinal host
defence in newborns: an update. Adv Paediatr 1995, 42, 171–200. [109] Xu, R.J. Development of the newborn GI tract and its relation to
colostrum/milk intake: a review. Reprod Fertil Dev 1996, 8, 35–48. [110] Marchbank, T.; Davison, G.; Oakes, J.R.; Ghatei, M. A.; Patterson, M.;
Moyer, M.P.; Playford, R.J. The nutriceutical, bovine colostrum, truncates the increase in gut ermeability caused by heavy exercise in athletes. Am J
Physiol 2011, 300, G466-84.
Received: August 11, 2011 Revised: November 11, 2011 Accepted: November 14, 2011

Human bioavailability of flavanols and phenolic acids from cocoa-nut creamsenriched with free or microencapsulated cocoa polyphenols
Paola Vitaglione1*, Roberta Barone Lumaga1, Rosalia Ferracane1, Sereno Sellitto1, Jose Ramon Morello2,Jordi Reguant Miranda2, Eyal Shimoni3 and Vincenzo Fogliano1
1Department of Food Science, University of Naples, via Universita 100, Parco Gussone Ed. 84, Portici 80055, NA, Italy2La Morella Nuts, Reus, 43206 Tarragona, Spain3Technion – Israel Institute of Technology, Faculty of Biotechnology and Food Enginerring, IL-32000 Haifa, Israel
(Submitted 18 April 2012 – Final revision received 27 July 2012 – Accepted 1 August 2012 – First published online 10 October 2012)
Abstract
Human bioavailability of cocoa flavanols and phenolic acids from a cocoa-nut cream (CC) and from CC enriched with a 1·5 % (w/w) cocoa
polyphenol extract in free form (FPC) or encapsulated with a gastric-resistant high-amylose maize starch (EPC), was studied. In a random-
ised cross-over protocol, with 1-week wash-out in between, twelve healthy volunteers had three portions/d of each cream, providing
approximately 190mmol/d of total flavanols and 12mmol/d of total phenolic acids with CC and 385 and 28mmol/d with both FPC
and EPC, respectively. Blood, urine and faecal samples were analysed by HPLC/MS/MS. Serum (epi)catechin was absent at baseline
and after CC consumption, while 22·1 (SEM 2·62) and 1·59 (SEM 0·22) nmol (P , 0·05) were found after FPC and EPC, respectively.
The EPC increased faecal excretion of total flavanols compared to FPC (151·0 (SEM 54·6) v. 28·0 (SEM 14·0) nmol; P , 0·05). Within 6 h
after consumption, serum phenolic acid content was 50-fold higher than (epi)catechin; no difference between CC and FPC was observed,
but a significant reduction after EPC (1954 (SEM 236·3) and 1459 (SEM 137·6) v. 726·8 (SEM 73·4) nmol, P , 0·05) was recorded. Short-term
phenolic acid urinary excretions were significantly higher after FPC than CC and EPC, the values being 11·4 (SEM 5·1) v. 3·1 (SEM 1·7) and
0·9 (SEM 0·5)mmol, respectively. Faecal phenolic acids were approximately 60-fold reduced after FPC (8·1 (SEM 0·13) nmol) and EPC
(14·7 (SEM 2·7) nmol) consumption compared to CC (641·4 (SEM 99·1) nmol) consumption. The data demonstrated that: (i) (epi)catechin
was absorbed from CC; (ii) cocoa polyphenols’ consumption increased circulating phenolic acids; and (iii) encapsulated ingredient
increased flavanol delivering into the gut. Further studies should evaluate whether encapsulated cocoa polyphenols may be a functional
prebiotic ingredient.
Key words: Bioavailability: Cocoa polyphenols: Encapsulation: Functional food
Epidemiological studies associate cocoa and chocolate
consumption to a reduced risk of CVD, and attribute this
effect to their polyphenol moiety(1,2). Cocoa polyphenols
include a sub-class of flavonoids, namely flavan-3-ols, occur-
ring as monomers, mainly epicatechin and catechin, oligomers
(procyanidins B1, B2 and C1) and polymers (up to ten units),
known as procyanidins(3–5). Monomers account for 5–10 %
of total cocoa flavanols, while oligomers and polymers consti-
tute $90 %(6). They are the major cocoa polyphenols, being
estimated to be more than 3 g/100 g cocoa powder, while
cocoa phenolic acids and flavonols are 100 times less abun-
dant, estimated at 62 mg and 30 mg/100 g, respectively(7).
Small amounts of gallocatechin and epigallocatechin have
also been quantified in cocoa(5). The abundance of flavanols
compared to the other polyphenols has justified the major
scientific interest shown up till now in the bioavailability of
these compounds. All in all, bioavailability studies demon-
strated that, whereas monomers are readily absorbed in the
stomach and small intestine, the absorption of dimeric procya-
nidins in human subjects is very limited(8,9). Indeed, polymeric
procyanidins mainly reach the colon, where they are largely
metabolised by the local micro-organisms to produce several
phenolic acids(10–12). Once formed, they are absorbed, further
metabolised in the liver and excreted in urine(8,13,14). Thus,
the general consensus is that cocoa flavanol bioavailability
is dependent on the ingested dose, the glucuronidated,
sulphated and methylated metabolites being the most abun-
dant compounds within 6 h after consumption, while phenolic
acids (in the free forms or further metabolised by the liver)
predominate later on. These in vivo studies were mainly
*Corresponding author: P. Vitaglione, email [email protected]
Abbreviations: CC, control cream; EPC, cream enriched with 1·5 % (w/w) of the encapsulated cocoa polyphenol extract; FPC, cream enriched with 1·5 %
(w/w) of the free cocoa polyphenol extract; HACS, high-amylose maize starch.
British Journal of Nutrition (2013), 109, 1832–1843 doi:10.1017/S0007114512003881q The Authors 2012
British
Journal
ofNutrition

performed using chocolate or cocoa, consumed alone and/or
with milk, and often highlighted some differences in bioacces-
sibility and biotransformation of cocoa polyphenols, depending
on the composition of the dietary matrices such as the presence
of proteins that generally retard polyphenol absorption as
well as the fat content that may modulate relative absorp-
tion of individual compounds and/or metabolites(8,15–21).
In some cases, the effects of cocoa or chocolate con-
sumption were reported, a few hours after intake, on some
markers of cardiovascular function (such as NO synthesis,
flow-mediated vasodilation and peripheral arterial tonometry
responses) and associated with the increased amount of
catechin phase I/II metabolites in the blood(22). However,
the biological effects of flavanol-3-ol-conjugated metabolites
have been mostly studied in vitro using concentrations that
not always have physiological relevance; thus, the in vivo
bioactivity of these compounds is still a highly debated
matter(23). On the other hand, the potential role of other
classes of cocoa polyphenols, such as phenolic acids, in exert-
ing short-term bioactive effects has never been explored,
despite a growing interest in phenolic acids formed from the
catabolism of flavanols by colon microflora emerging in the
scientific literature(23).
The knowledge of the relationship between the physiologi-
cal response to foods and their composition is fundamental
to formulate new ingredients and foods having a nutritional
advantage, compared to the existing ones(24). In general,
due to the extensive metabolism and rapid excretion of
cocoa flavanols, increasing their intake without increasing
overall energy intakes may be nutritionally advantageous.
Enrichment of cocoa-containing foods (e.g. chocolate bars,
creams or drinks) with flavanol-rich extracts obtained from
different cocoa bean fractions may be a reliable appropriate
solution(25). Unfortunately, catechin and procyanidin enrich-
ment over a certain level may impart an undesired bitter
and astringent taste to the final product. Encapsulation of
cocoa polyphenol extract may overcome this limitation. In
fact, during the last 10 years, this technology has rapidly
enlarged its application in the food industry, thus allowing
food addition with several bioactive compounds, guaranteeing
their protection during food processing, tailoring their release
over time and/or at particular sites and masking unwanted
tastes and flavours of core materials(26–28).
In this framework, the objectives of the present study
were to evaluate human bioavailability of cocoa flavanols
and phenolic acids upon consumption of nut creams contain-
ing 20 % of cocoa (CC) and to evaluate whether, and to what
extent, cocoa-nut cream enrichment with a cocoa polyphenol
extract in free (FPC) or in encapsulated (EPC) form influenced
this issue. For this purpose, nut creams were developed
and produced. A total of twelve healthy volunteers partici-
pated in the study, consumed the creams in a randomised
manner and blood, urine and faeces were collected at specific
time points over 24 h. Biological samples were analysed by
HPLC/MS/MS to monitor free native flavanol-3-ols (monomers
and dimers) and several phenolic acids (both present in
cocoa-nut creams as well as known to originate from cocoa
flavanols and flavonols).
Materials and methods
Chemicals and reagents
All chemicals and reagents were of analytical grade. Methanol,
water, acetonitrile and hexane were from Merck; only for
cream chemical characterisation, water was obtained from a
MilliQ water purification system (Millipore Corporation).
Ethyl acetate, glacial acetic acid and HCl were from Clean
Consult International; formic acid (98 % purity), butylated
hydroxytoluene and salts used for PBS preparation were
obtained from Sigma. All analytical standards, 5-caffeoylquinic
acid (95 %, chlorogenic acid), trans-4-hydroxy-3-methoxycin-
namic acid (99 %, ferulic acid), 3,4-dihydroxybenzoic acid
($97 %, protocatechuic acid), 4-hydroxybenzoic acid (99 %,
p-hydroxybenzoic acid), 3,4-dihydroxycinnamic acid ($98 %,
caffeic acid), 4-hydroxyphenylacetic acid (98 %), 3-(4-hydro-
xyphenyl)propionic acid (98 %), 4-hydroxy-3-methoxybenzoic
acid (97 %, vanillic acid), naringenin (98 %) and quercetin
($98 %) were purchased from Sigma. (þ)-Catechin ($99 %),
(2)-epicatechin ($97 %), procyanidin B1 and B2 ($90 %),
apigenin ($99 %), luteolin ($97 %) and kaempferol ($99 %)
were obtained from Fluka.
Preparation of free and encapsulated cocoa polyphenolextract
Polyphenol extract from cocoa nibs was produced by
La Morella Nut, according to the procedure described
by Ortega et al.(25). It was partly microencapsulated by
KARMAT using a technological process based on the for-
mation of nanocomplexes with a high-amylose maize starch
(HACS) as coating agent of cocoa polyphenols and on their
aggregation in microcomplexes. In particular, the following
steps were performed: (1) solubilisation of the coating
material in an alkaline solution (pH 12) kept at high tempera-
ture (808C) and stirred continuously; (2) chilling this material
up to 308C; (3) addition, under stirring, of the cocoa extract
up to 10 % of HACS (w/w); (4) pressurisation into an homoge-
nator together with an acid solution until a pH of approxi-
mately 5 is reached and, finally, spray-drying using 2008C as
inlet temperature, approximately 1008C outlet temperature
and a flow rate of 10 l/h to obtain fine particles.
The final ingredient contained cocoa polyphenol extract–
HACS in a 1:9 (w/w) ratio.
Preparation of cocoa-nut creams
Once the polyphenol-rich ingredients were obtained, a nut
cream containing 20 % (w/w) cocoa (control cream, CC) and
ten prototypes of polyphenol-enriched cocoa-nut creams
containing free or encapsulated polyphenols ranging from
0·5 to 2·5 % (w/w) were prepared by a pilot-scale apparatus
located at La Morella Nuts. The CC was prepared by the
sequential addition of individual ingredients through contin-
ued mixing, in order to obtain a well-mixed and refined
cream (particle sizes about 30mm). To this basic cream, the
free or encapsulated polyphenol extract was slowly added
and mixed gently to homogenously disperse the ingredients.
Cocoa polyphenol bioavailability from creams 1833
British
Journal
ofNutrition
Once the homogeneous products were obtained, creams were
immediately packaged in 33-g portions and labelled with
alpha-numeric codes.
Sensory analysis of creams
To establish what was the maximum enrichment of the creams
achievable with the polyphenol-rich ingredients, a sensory
analysis of the ten cream prototypes was performed. A total
of thirty untrained subjects, selected among students and
staff of the Department of Food Science at the University of
Naples based on medical status, absence of allergies and
habitual consumption of nut/chocolate creams and spreads,
were enrolled to participate in the study. The selected subjects
were healthy, of both sexes (fifteen male and fifteen female),
between 25 and 35 years of age and were of normal weight
(BMI 22 (SEM 2) kg/m2). A total of ten prototype formulations,
prepared as described earlier, were compared to CC: they con-
tained 0·5, 1, 1·5, 2 and 2·5 % of the cocoa polyphenol extract,
in free or encapsulated form. At different days for each test,
and always at least 2 h after having breakfast, three types of
creams were tested in blinded and randomised manner.
Approximately 10 g of each cream, placed in transparent
small cups, were provided to subjects together with a glass
of room temperature water and a slice of white bread for
palate cleansing between sample testing. The panelists were
asked to taste and to assign a score to their hedonic of the
following sensory attributes: sweetness, bitterness, creami-
ness, fatness, granularity and overall palatability. Ratings
were based on a nine-point hedonic scale (0 ¼ extremely
dislike, 9 ¼ extremely like).
Composition of the cocoa-nut creams
The composition of CC, FPC and EPC is summarised in Table 1,
reporting for each parameter the mean of three measures
obtained by triplicate analysis and SEM. Water, lipids, proteins
and carbohydrates were determined by official methods of
analysis (AOAC 9321.04, AOAC 963.15, AOAC 939.02, AOAC
980.13, respectively), while flavanols (monomers, oligomers
and polymers) as well as phenolic acids and flavonols were
measured according to the method described by Ortega
et al. (25) with slight modifications. Briefly, approximately 3 g
of sample were weighted and fat was removed by using
3 ml of hexane. Polyphenols were extracted from the defatted
pellet using a total volume of 9 ml (3 £ 3 ml) acetone–water
(1:1) solution. After addition of extraction solvent to the
pellet, the whole mixture was sonicated for 10 min at 48C to
improve the polyphenols’ extraction efficiency and obtain a
recovery of 98 % of polyphenols from the encapsulated ingre-
dient (as found in preliminary experiments whose data are not
shown). All acetone/water phases were collected and acetone
removal by rotary evaporator was followed by freeze-drying
of resulting aqueous solutions. Finally, approximately 10 mg
of dried extracts were suspended in 2 ml of a methanol–
water (1:1) solution and 20ml of this suspension were injected
in to a HPLC system (Shimadzu LC-10A Series) equipped with
two pumps (LC-10AD), a controller (SCL-10A) and a diode-
array detector (SPD-M10A). Chromatography separation was
carried out with a Prodigy 5mm ODS-3 100 A column, size
250 £ 4·60 mm C18 column, purchased from Phenomenex,
with a mobile phase flow rate of 0·8 ml/min, consisting
of acidified water with 0·2 % of formic acid (phase A) and
an acetonitrile–methanol solution in the ratio 60:40 (v/v,
phase B). The elution gradient was set as follows: time
0 ¼ 20 % B; 0–6 min 30 % B; 6–16 min 40 % B; 16–24 min
50 % B; 24–32 min 98 % B; 32–35 min 98 % B; 35–40 min
20 % B; and 40–45 min 20 % B. Catechin, epicatechin, pro-
cyanidin B2, p-hydroxybenzoic acid, vanillic acid, apigenin,
naringenin, quercetin arabinoside, luteolin glucoside, quer-
cetin glucoside and kampferol-rutinoside were detected at
280 nm; protocatechuic acid at 254 nm; and chlorogenic acid,
Table 1. Composition of experimental creams (per 100 g)
(Mean values with their standard errors (n 3))
CC FPC EPC
Mean SEM Mean SEM Mean SEM
Water (g) 1·5 0·1 1·5 0·1 1·3 0·2Protein (g) 7·9 0·3 7·8 0·6 6·7 0·5Carbohydrates (g) 49·7 2·1 50·0 1·8 57·3* 2·8
Dietary fibre 40·0 3·0 40·1 2·6 47·2* 2·0Lipids (g) 40·9 2·9 40·8 3·1 34·8 1·9Total flavanols (mmol) 190·0 2·2 385·1† 5·3 385·3† 4·9
Monomers‡ 176·0 2·1 336·8† 5·0 337·0† 4·4Dimers§ 14·0 0·1 48·3† 0·3 48·3† 0·5
Total phenolic acids (mmol)k 12·0 0·9 28·1† 1·0 27·9† 0·2Total flavonols (mmol){ 9·2 0·0 12·9† 0·1 13·0† 0·4
CC, control cream; FPC, cream enriched with 1·5 % (w/w) of the free cocoa polyphenol extract;EPC, cream enriched with 1·5 % (w/w) of the encapsulated cocoa polyphenol extract.
* Mean values were significantly different from that of FPC (P,0·05; Bonferroni test).† Mean values were significantly different from that of CC (P,0·05; Bonferroni test).‡ Catechin and epicatechin.§ Procyanidin B1 and B2.kp-Hydroxybenzoic acid, vanillic acid, protocatechuic acid, chlorogenic acid and caffeic acid.{Apigenin, naringenin, quercetin arabinoside, luteolin glucoside, quercetin glucoside, kampferol-rutinoside
and rutin.
P. Vitaglione et al.1834
British
Journal
ofNutrition

caffeic acid and rutin at 330 nm. The peak area was integrated
by means of Class-VP software (version 7.3) obtained from
Shimadzu. Each compound was quantified using specific
calibration curves obtained with the reference standard com-
pounds, as reported previously; for glycosides, the calibration
curves of the respective aglycones were used.
Bioavailability study
Study design. The present study was a single-blind study,
and had a randomised, cross-over design with three arms.
The present study was conducted according to the
guidelines laid down in the Declaration of Helsinki, and all
procedures involving subjects were approved by the Ethics
Committee of ‘Federico II’ University of Naples (Ethic
Approval Number 37/10). Written informed consent was
obtained from all subjects before entering into the study.
A total of twelve healthy volunteers (four males/eight
females, mean age 24 (SEM 3) years, BMI 23·1 (SEM 1·5) kg/m2)
were selected among the students of the Agricultural Faculty,
University of Naples. Subjects reporting symptoms of gastro-
intestinal disorders (including frequent diarrhoea episodes or
constipation), having metabolic diseases (diabetes, metabolic
syndrome, etc.), taking non-steroidal anti-inflammatory drugs
or having undergone controlled dietary regimens over the
last 6 months were considered ineligible for the present
study. The selected volunteers signed a written informed con-
sent before starting the study. The experimental design is
schematised in Fig. 2. For the 3 d before and over each experi-
ment day, subjects were asked to follow a polyphenol-
free diet. It consisted, in exclusion of the habitual diet, of all
polyphenol-rich foods and beverages such as fruits, vege-
tables, chocolate, tea, coffee, wine, beer, supplements,
herbal extracts and wholegrain-based foods. Consumption of
non-steroidal anti-inflammatory drugs and antibiotics was
also avoided during 1 week and 1 month before treatments,
respectively. On the experiment day, after fasting for 12 h,
the subjects reached the laboratory at 08.00 hours and were
randomised to receive one of the three experimental creams,
which was consumed within 15 min together with three
slices of toasted bread and a glass of room temperature
water. They left the research centre 6 h later and were allowed
to have lunch (within 14.45 hours) and dinner (within 22.00
hours), including, in both occasions, another cream portion.
Each subject was invited to consume lunch and dinner
during the three experimental sessions, always constituting
the same foods, so that no influence of dietary pattern on
bioavailability of compounds in the three treatments might
occur. In particular, they were invited to choose among the
following foods: rice or pasta with butter and cheese or with
tuna, meat or fish or bread with ham and/or cheese. After
24 h, subjects returned to consume their own habitual diet
for a 1-week wash-out period. After this week, the experimen-
tal design was repeated. In particular, subjects again followed
a 3-d polyphenol-free diet and were randomised for another
treatment.
Thus, all subjects participated in the three experi-
mental sessions (one for each type of cream) with a 1-week
interval between each other, and on each test day, they
consumed three portions (99 g) of the test cream they were
randomised for.
Sample collection. At fasting conditions and at 30 min,
1, 2, 4 and 6 h after breakfast consumption, blood samples
were drawn. Then, 24 h urine was collected over 0–2, 2–4,
4–6, 6–8, 8–10, 10–24 h time intervals, after ingestion of
the first cream portion, and the volume was measured. The
10 ml samples of urine collected before breakfast and at
each time interval were stored for analysis. The day after the
experiment, participants returned to the laboratory after fast-
ing for 12 h and their blood samples were taken (24 h from
the first cream consumption), while the faecal sample was col-
lected on the experiment day. No subject was constipated or
had diarrhoea episodes over the study period; thus, faecal
samples were always collected from each volunteer.
Biological sample treatment, storage and analysis. Blood
samples were collected in a Vacutainer tube for gel separation,
and immediately centrifuged at 4000 rpm for 10 min at 48C.
Urine samples were immediately treated with 0·005 % of buty-
lated hydroxytoluene. Faeces were diluted in the ratio 1:10
(w/v) in PBS (10 mM) containing 0·005 % of butylated hydroxy-
toluene, vortexed and centrifuged at 4000 rpm for 15 min
at 48C. Serum, urine and faecal supernatants were stored
at 2408C until the analysis. Procyanidins, metabolites and
phenolic acids were extracted by 1·5 ml of ethyl acetate from
500ml of serum and 1·5 ml of urine and faecal suspensions
(twice and for three times, respectively). The collected super-
natants were dried under nitrogen flow and the dry extracts
were dissolved in 50ml methanol–water (70:30); 30ml were
injected into HPLC/MS/MS apparatus. Each sample was
extracted in duplicates. Quantitative determination of total
extracted analytics was performed using a HPLC system
consisting of two micropumps by Perkin Elmer Series
200, coupled with an API 3000 Triple Quadrupole mass spec-
trometer (Applied Biosystem Sciex). Elution was achieved
with a Phenomenex Luna 3m C18(2) 100 A (50 £ 2·00 mm)
column and by using the following mobile phases:
A ¼ water–acetonitrile–formic acid 94·9:5:0·1 (by vol.) and
B ¼ acetonitrile–formic acid 99·9:0·1 (v/v); the flow rate was
200ml/min. The linear gradient for chromatographic sepa-
ration was: 0–1 min, 4–40 % B; 1–3 min, 40–100 % B;
3–5 min, 100 % B; and 6–10 min, 4 % B. Selected compounds
in the native form were detected and quantified through ele-
ctrospray ionisation MS/MS analysis. After ionisation in negative
mode, transitions of parent and product ions specific for each
compound were tracked in multiple reaction monitoring
mode. For each compound, all MS parameters (declustering
potential, focusing potential, collision energy, collision cell
exit potential), set as previously described(12,29) and then opti-
mised through direct infusion experiments, are reported in
Table 2, together with limits of detection and quantification.
When analytical standards were not available, compounds
were identified comparing molecular weight and fragmenta-
tion patterns with those reported in the literature(12,29). Epigal-
locatechin was quantified using the calibration curve built
with epicatechin; hippuric, dihydroferulic and hydroxyben-
zoic acids were quantified using the calibration curve built
Cocoa polyphenol bioavailability from creams 1835
British
Journal
ofNutrition

with ferulic acid; and dihydroxyphenyl-g-valerolactone was
quantified using the calibration curve built with hydroxy-
phenylacetic acid.
Statistical analysis
Statistical analysis was performed using the statistical package
SPSS for Windows (version 15; SPSS Inc.). The results from
HPLC/MS/MS analysis were analysed and expressed as the
absolute changes from the baseline to reduce possible effects
of inter-subject fasting variability. The AUC for each com-
pound from baseline to 6 h after first cream portion consump-
tion in the case of serum samples and to 0–6 and 6–24 h for
urine samples were estimated using the linear trapezoidal rule.
As data were normally distributed and presented homo-
geneous variance (Levene test), they were analysed by one-
way ANOVA for repeated measures; the subjective time
curves for all measured compounds were compared and
tested for the effect of treatment and of time as factors. For
all tests, following a significant main effect in the ANOVA, indi-
vidual means were compared using the Bonferroni test
(P , 0·05). Results were considered significant at P , 0·05.
All values were reported as means with their standard errors.
Results
Sensory analysis of creams
The products enriched with 2 and 2·5 % (w/w) of polyphenol
extracts obtained an overall acceptability score of 4·6 (SEM 1·3)
and 4·6 (SEM 1·1) (2·0 % polyphenols) and 4·12 (SEM 1·0) and
4·2 (SEM 1·2) (2·5 % polyphenols) for free cocoa polyphenol
and encapsulated extract, respectively. These low scores,
compared to the one attributed to the CC (7·5 (SEM 1·3)), were
conditioned by the bitterness perception for the creams
enriched with 2·0 and 2·5 % of the free extract (3·5 (SEM 1·2)
and 2·9 (SEM 1·3), respectively) and the granularity for those
containing the same amounts of encapsulated extract (3·7
(SEM 1·2) and 3·0 (SEM 1·3), respectively). The 1·5 %-enriched
creams obtained a mean score for total acceptability of
approximately 6·5 (6·4 (SEM 1·3) and 6·6 (SEM 1·2), when con-
tained free cocoa polyphenol or encapsulated cocoa poly-
phenol extract, respectively), while hedonic for bitterness was
even scored slightly higher for EPC (6·0 (SEM 0·3)) than for
FPC (4·8 (SEM 0·2)) and, on the contrary, granularity being
scored 5·0 (SEM 0·2) and 6·3 (SEM 0·3), respectively (Fig. 1).
Thus, 1·5 %-enriched creams were selected as the final
products to be tested in the bioavailability study and will be
Table 2. MS parameters, negative ions and transition product ions analysed by HPLC/MS/MS
CXP
Compound M–H Product ions DP FP CE 1 2 LOD (ng/ml) LOQ (ng/ml)
Procyanidin B2 577 289; 425; 407 245 2300 235; 225; 231 27 2·5 5·0(Epi)catechin 289 245 240 2300 221 27 5·0 10·0EGC*† 305 179 240 2375 230 27 – –Protocatechuic acid 153 109 245 2400 221 210 0·5 1·0Vanillic acid 167 152; 108; 123 245 2250 222; 226 29 211 2·5 5·0Ferulic acid 192·8 133·9; 177·9 235 2250 222; 217 210 0·5 1·0Chlorogenic acid 353 191 235 2250 221 28 0·5 1·0Caffeic acid 179 135 249 2350 235 28 0·5 1·0Hippuric acid*‡ 178 134; 77 245 2350 220 27 – –Homovanillic acid 180·8 136·7; 122 250 2350 210; 218 27 25·0 100·0Hydroxybenzoic acid*‡ 137 93 250 2350 225 27 – –Coumaric acid 163 119·1 240 2350 223 25 2·5 5·0Di-HCA 181·1 109; 137 250 2300 225; 214 29 25 50Di-HFA*‡ 195 136 240 2350 220 26 – –DHPA 167 123·1 230 2250 211 27 0·5 1·0HPA 151 107; 78·9 235 2250 216; 225 27 3·0 5·0HPP 164·9 121; 105·9; 76·7 225 2250 210; 220; 210 27 25·0 100·0DHPV*§ 207 163; 122 235 2350 225 27 – –
CXP, collision cell exit potential; DP, declustering potential; FP, focusing potential; CE, collision energy; LOD, limit of detection; LOQ, limit of quantification; EGC, epigallocate-chin; Di-HCA, dihydrocaffeic acid; Di-HFA, dihydroferulic acid; DHPA, 3,4-dihydroxyphenylacetic acid; HPA, 4-hydroxyphenylacetic acid; HPP, 3-(4-hydroxyphenyl)propionicacid; DHPV, 5-(30,40-dihydroxyphenyl)-g-valerolactone.
* Identified based on molecular weight and specific fragmentation patterns, as reported by Fogliano et al.(12) and Urpi-Sarda et al.(29).† Reference calibration curve was epicatechin.‡ Reference calibration curve was ferulic acid.§ Reference calibration curve was HPA.
0
3
6
9Sweetness
Bitterness
Creaminess
Fatness
Granularity
Overallpalatability
Fig. 1. Hedonic profile of control cream ( ), and experimental creams
enriched with 1·5 % of free (FP, ) and encapsulated (EP, ) cocoa poly-
phenol extract. Values are mean scores (n 30) anchored by 0 (extremely
disliking) to 9 (extremely liking).
P. Vitaglione et al.1836
British
Journal
ofNutrition

here-after indicated as FPC (the one containing 1·5 % free
cocoa polyphenol extract) and EPC (the one containing
1·5 % encapsulated cocoa polyphenol extract).
Bioavailability study
Serum. Fig. 3 shows the mean serum concentration–time
curves of total flavanols and phenolic acids found in subjects
following consumption of experimental cocoa-nut creams.
None of monitored flavanols (i.e. (epi)catechin, epigallo-
catechin and procyanidin B1) was found in serum at baseline.
Only (epi)catechin was found in serum of subjects after
consumption of FPC and EPC, while it was absent after
CC consumption. In particular, (epi)catechin reached a con-
centration peak (Cmax ¼ 4·1 (SEM 2·3) nmol/l) 1 h after FPC
consumption and it slowly returned to baseline value at 6 h
post-consumption. After EPC consumption, the increase of
serum (epi)catechin from baseline was significantly lower
(Cmax ¼ 0·9 (SEM 0·6) nmol/l) than after FPC and was found
only within the first hour after consumption. Accordingly,
AUC0–6 of (epi)catechin after FPC was 13·9-fold higher
than that found after EPC (7·4 (SEM 4·4) v. 0·5 (SEM 0·3)
nmol/l £ h, respectively; P,0·05).
Serum concentration of total phenolic acids at baseline was
always about 135·2 (SEM 19·1) nmol/l, without the differences
among treatments; after consumption of the creams, it was
always higher than baseline. At 30 min after FPC consumption,
serum phenolic acid concentration was higher than that
found after EPC and CC (198·3 (SEM 101·0) v. 37·2 (SEM 17·2)
and 24·8 (SEM 5·2) nmol/l, respectively), while the latter
cream guaranteed a much higher concentration of phenolic
acids (approximately 150 nmol/l) at both 6 and 24 h after con-
sumption compared to the cocoa polyphenol-enriched creams
(approximately 25 nmol/l).
The phenolic acids retrieved in serum samples and the
relative amounts are reported in Table 3.
No significant difference was recorded in serum total phe-
nolic acid concentrations following CC and FPC consumption,
while a significantly lower amount was found after EPC
consumption (726·8 (SEM 73·44) v. 1954·26 (SEM 236·33) and
1459·37 (SEM 137·63) nmol, respectively).
Urine. Fig. 4 shows the mean urinary excretion–time
curves of total catechins and phenolic acids found in subjects
following consumption of experimental cocoa-nut creams.
(Epi)catechins and procyanidins were never found in the
urine of subjects at baseline, while they were retrieved after
consumption of all the creams. In particular, within 4 h from
CC consumption, their total concentration reached a plateau
value that was maintained for up to 8 h, returned to baseline
value at 10 h and was again higher than baseline at 24 h.
After FPC consumption, only one concentration peak within
the 2 h from consumption was found, while after EPC,
catechin and procyanidin excretion was always negligible.
However, only EPC always elicited a lower excretion of
total flavanols than CC and FPC, while urinary excretion of
total flavanols after FPC was significantly reduced compared
to that after CC, only after the consumption of the second
cream portion (AUC6–24 being 9·1 (SEM 6·3) and 62·0
(SEM 42·0) nmol/l £ h, respectively).
According to serum data, the concentration of phenolic
acids that were retrieved from baseline urine samples
(approximately 25·3 (SEM 2·0)mmol/l, with no differences
between treatments) and after cream consumption was
approximately 1000-fold higher than that of total flavanols.
Moreover, EPC elicited the lowest excretion, both over the
first 6 h and over the 24 h after consumption, while a signifi-
cantly higher excretion of phenolic acids following FPC than
CC consumption was recorded only within 6 h after consump-
tion (see Table 4). Apart from those found in serum samples,
urinary phenolic acids also comprised of ferulic acid, dihydro-
ferulic acid, protocatechuic acid, coumaric acid, caffeic acid
and dihydrocaffeic acid.
Faeces. Flavanols were never found in faeces collected at
baseline, and their amount after consumption of EPC (150·97
(SEM 54·65) nmol) was higher than after consumption of FPC
(27·98 (SEM 13·97) nmol) and CC (4·27 (SEM 4·52) nmol) (Table 5).
Table 3. Amount (nmol) of serum-free native flavanols and phenolic acids over the time intervals 0–6 h follow-ing consumption of the three cocoa creams
(Mean values with their standard errors (n 12))
CC FPC EPC
Mean SEM Mean SEM Mean SEM
Flavanols (nmol)(Epi)catechin ND 22·07* 2·62 1·59*† 0·22
Phenolic acids (nmol)Vanillic acid 32·57 2·29 7·53* 0·86 15·31*† 1·51Chlorogenic acid 5·48 0·67 13·93* 1·59 4·19* 0·53Hippuric acid 1386 196·1 994·7* 90·89 318·7*† 42·32Hydroxybenzoic acid 480·2 32·64 318·8* 27·64 332·9*† 24·13DHPV 16·87 0·82 115·2* 15·36 29·18*† 2·47HPA 16·78 1·82 3·04* 0·43 5·63* 0·67HPP 15·82 2·01 6·12* 0·87 20·92* 1·81
Total 1954 236·3 1459 137·6 726·8*† 73·44
CC, control cream; FPC, cream enriched with 1·5 % (w/w) of the free cocoa polyphenol extract; EPC, cream enriched with 1·5 %(w/w) of the encapsulated cocoa polyphenol extract; ND, not determined; DHPV, 5-(30,40-dihydroxyphenyl)-g-valerolactone;HPA, 4-hydroxyphenylacetic acid; HPP, 3-(4-hydroxyphenyl) propionic acid.
* Mean values were significantly different from that of CC (P,0·05; Bonferroni test).† Mean values were significantly different from that of FPC (P,0·05; Bonferroni test).
Cocoa polyphenol bioavailability from creams 1837
British
Journal
ofNutrition

Table 4. Amount (nmol) of parental flavanols and phenolic acids excreted in urine collected over the time intervals 0–6 and 6–24 h following consump-tion of the three nut-cocoa creams
(Mean values with their standard errors (n 12))
CC FPC EPC
0–6 h 6–24 h 0–6 h 6–24 h 0–6 h 6–24 h
Mean SEM Mean SEM Mean SEM Mean SEM Mean SEM Mean SEM
Flavanols (nmol)(Epi)catechin 5·26 3·72 11·75 7·16 4·82 3·41 2·16* 1·53EGC 0·02 0·01 0·50 0·35 0·19 0·14 2·00† 1·42
Procyanidin 0·39 0·24 1·17 0·82 0·85 0·47 1·83 1·29 2·73 1·80Total 5·68 3·97 13·42 8·33 5·67 3·88 4·00 2·82 0·19 0·14 4·73 3·22Phenolic acids (nmol)
Protocatechuic acid 42·0 15·2 420·4 139·3 22·9 9·0 548·2 180·0 9·6* 4·2 693·7 252·2Ferulic acid 15·2 5·3 1340·4 533·6 67·9* 38·2 91·6 51·2 19·1 9·2 1024·1 315·9Vanillic acid 6·3 2·9 338·4 110·4 34·4* 11·2 452·2 192·5 16·3 10·2 195·9 84·1Caffeic acid 1·4 0·6 99·0 29·7 2·5 0·9 74·3 18·7 0·5 0·3 21·3 7·7Coumaric acid 1·2 0·6 23·9 13·0 3·1 1·4 34·4 12·4 1·4 0·4 38·5 12·4Chlorogenic acid 0·1 0·0 1·9 0·5 0·2 0·0 1·4 0·6 0·4 0·2 2·9 0·9Hippuric acid 2279 1411 98 571 45 317 8562* 3854 44 321 20 004 341·0*† 241·1 4128 2919Homovanillic acid 515·8 160·7 48 861 17 674 2023* 802·9 48 489 16 071 223·4 156·4 32 110 7995DHPA 122·1 72·7 6205 2881 199·5 73·6 10 911 3986 117·2 48·6 3467 1139Di-HCA 40·6 14·5 2106 896·2 94·6 31·3 2417 749·1 34·4† 11·5 1915 566·3Hydroxybenzoic acid 22·2 12·3 470·7 156·2 31·1 19·8 269·0 189·2 42·4 19·5 1202 536·6Di-HFA 10·1 4·5 449·7 318·0 302·1* 177·0 313·7 163·3 60·7*† 34·3 104·9 51·2HPP 3·4 2·1 30·2 10·4 1·1 0·6 3·3* 1·5 0·1 0·0 2·2* 1·6HPA 2·6 1·2 87·6 42·5 64·2* 37·7 78·0 40·0 24·3* 10·5 11·4 7·2DHPV 0·3 0·1 9·2 3·0 0·4 0·2 3·1 1·4 0·9 0·3 3·2 1·5
Total 3062 1703 159 015 68 124 11 409* 5058 108 007 41 661 891·7*† 546·7 44 921 13 890
CC, control cream; FPC, cream enriched with 1·5 % (w/w) of the free cocoa polyphenol extract; EPC, cream enriched with 1·5 % (w/w) of the encapsulated cocoa polyphenolextract; EGC, epigallocatechin; DHPA, 3,4-dihydroxyphenylacetic acid; Di-HCA, dihydrocaffeic acid; Di-HFA, dihydroferulic acid; HPP, 3-(4-hydroxyphenyl)propionic acid;HPA, 4-hydroxyphenylacetic acid; DHPV, dihydroxyphenyl-g-valerolactone.
* Mean values were significantly different from that of CC (P,0·05; Bonferroni test).† Mean values were significantly different from that of FPC (P,0·05; Bonferroni test).
Table 5. Amount (nmol) of parental flavanols and phenolic acids excreted in faeces col-lected the day after consumption of the three nut-cocoa creams
(Mean values with their standard errors (n 12))
CC FPC EPC
Mean SEM Mean SEM Mean SEM
Flavanols (nmol)(Epi)catechin ND 10·25 5·13 31·54 12·44EGC 4·27 4·52 ND 0·52 0·30
Procyanidin ND 17·73* 8·84 118·9*† 41·91Total 4·27 4·52 27·98 13·97 151·0*† 54·65Phenolic acids (nmol)
Ferulic acid 42·58 6·33 ND NDPCA 25·13 6·31 4·69* 0·00 9·65* 0·11Vanillic acid 8·46 1·91 ND NDCoumaric acid 8·01 1·25 ND 4·56 2·34Caffeic acid 1·67 0·00 2·67* 0·00 NDChlorogenic acid 0·86 0·43 0·05* 0·01 0·04 0·00Homovanillic acid 322·2 0·00 ND NDDi-HCA 141·3 38·61 ND NDDi-HFA 37·75 27·94 ND NDHPP 53·44 16·28 ND NDDHPV ND 0·70 0·12 0·41 0·23
Total 641·4 99·07 8·11* 0·13 14·66* 2·68
CC, control cream; FPC, cream enriched with 1·5 % (w/w) of the free cocoa polyphenol extract; EPC,cream enriched with 1·5 % (w/w) of the encapsulated cocoa polyphenol extract; ND, not determined;EGC, epigallocatechin; PCA, protocatechuic acid; Di-HCA, dihydrocaffeic acid; Di-HFA, dihydroferulicacid; HPP, 3-(4-hydroxyphenyl)propionic acid; DHPV, dihydroxyphenyl-g-valerolactone.
* Mean values were significantly different from that of CC (P,0·05; Bonferroni test).† Mean values were significantly different from that of FPC (P,0·05; Bonferroni test).
P. Vitaglione et al.1838
British
Journal
ofNutrition

On the contrary, the amount of phenolic acids retrieved in faeces
at 24h following CC consumption (641·43 (SEM 99·07) nmol)
was the only one to be higher than that found at baseline
(1767·64 (SEM 594·27) nmol, without differences among treat-
ments) and after FPC (8·11 (SEM 0·13) nmol) and EPC (14·66
(SEM 2·68) nmol) consumption.
The bioavailability data have been summarised in Table 6 to
gain the complete picture of the distribution of the ingested
bioactive compounds.
Discussion
Enrichment of foods with catechin and epicatechin can be
difficult due to their bitter taste and astringency in the mouth.
Encapsulating flavanols with a coating material inaccessible
by salivary enzymes, such as HACS, can overcome this
problem. The cocoa-nut cream enriched with microencapsu-
lated cocoa flavanols (EPC) used in the present study showed
a slightly higher hedonic for bitterness than the cream added
with the ingredient in the free form (FCP; see Fig. 1).
Testing the bioavailability of the encapsulated bioactive
compounds from enriched foods is fundamental to foresee
their in vivo bioactivity. To our knowledge, the present study
is the first study evaluating cocoa flavanol and phenolic
acid bioavailability from cocoa-nut creams in human subjects.
The study was designed to follow the fate of parental
and free cocoa polyphenols after the consumption of one
portion of three cocoa-nut creams (33 g) differing in amount
(CC v. FPC) and form (FPC v. EPC) of contained cocoa
polyphenols and of a total of 99 g cream (three portions)
distributed throughout the day (one portion at each daily
meal, i.e. at breakfast, lunch and dinner; see Fig. 2). Thus,
the comparison between CC and FPC allowed us to evaluate
the effect of dose on bioavailability of free parental flavanols
and of phenolic acids contained in the creams, while com-
parison between FPC and EPC allowed us to investigate the
effect of microencapsulation of the bioactive compounds.
Data indicated that flavanol absorption at 6 h after the
consumption of cocoa-nut creams was dose-dependent,
as previously reported after cocoa and chocolate consump-
tion(8,15–20). In fact, as summarised in Table 6, after con-
sumption of one CC portion, flavanols were not detected
in the bloodstream, while consumption of FPC, containing
an almost doubled amount of free monomers, determined
(epi)catechin presence in the serum. The time-course values
of (epi)catechin concentration in serum and urine following
FPC consumption (Figs. 3(a) and 4(a)) demonstrated a rapid
absorption (tmax ¼ 1 h) and excretion (within 2 h) upon
consumption. The rapid absorption and serum clearance of
parental (epi)catechin after cocoa-nut cream (tmax at 1 h and
absence of compounds at 6 h) was consistent with literature
data on the bioavailability of epicatechin from cocoa and cho-
colate, thus confirming the occurrence of gastric absorption
and a rapid plasma clearance (within 6 h from consumption)
of compounds(30–32). This feature was corroborated by data
obtained after consumption of EPC, which elicited a 10-fold
lower amount of serum (epi)catechin than FPC. In fact, as
about 50 % (195·3mmol of a total 385·3mmol/100 g of cream) Table
6.
Sum
mary
of
bio
availa
bili
tyof
cocoa
poly
phenols
from
the
thre
ecocoa-n
ut
cre
am
s‡
CC
FP
CE
PC
Tota
lflavanols
Tota
lphenolic
acid
sT
ota
lpoly
phenols
Tota
lflavanols
Tota
lphenolic
acid
sT
ota
lpoly
phenols
Tota
lflavanols
Tota
lphenolic
acid
sT
ota
lpoly
phenols
Blo
od
0–
6h
(mm
ol)
0·0
00
1·9
77
1·9
77
0·0
22*
1·4
59
1·4
81
0·0
02
0·7
44*†
0·7
45*†
%D
ose
one
port
ion
0·0
00
49
·42·8
08
0·0
20
15
·61·0
43
0·0
01
7·9
0·5
25
Urine
0–
6h
(mm
ol)
0·0
06
3·0
62
3·0
68
0·0
06
11
·41*
11·4
1*
0·0
00
0·8
92*†
0·8
92*†
%D
ose
one
port
ion
0·0
10
76
·64·3
58
0·0
05
121
·88·0
33
0·0
00
9·5
0·6
28
6–
24
h(m
mol)
0·0
13
159·0
159·0
30·0
04
108
·0108·0
0·0
05
44·9
244·9
30
–24
h(m
mol)
0·0
19
162·1
162·1
0·0
10
119
·4119·4
0·0
05
45·8
1*†
45·8
2*†
%D
ose
thre
eport
ions
0·0
11
1351
76·7
50·0
03
425
·028·0
10·0
015
163·0
10·7
5F
aeces
0–
24
h(m
mol)
0·0
04
0·6
41
0·6
46
0·0
28
0·0
08*
0·0
36*
0·1
51†
0·0
15*
0·1
34*
%D
ose
thre
eport
ions
0·0
02
5·3
0·3
06
0·0
08
0·0
30·0
08
0·0
45
0·0
50·0
31
CC
,contr
olcre
am
;F
PC
,cre
am
enriched
with
1·5
%(w
/w)
of
the
free
cocoa
poly
phenolextr
act;
EP
C,
cre
am
enriched
with
1·5
%(w
/w)
of
the
encapsula
ted
cocoa
poly
phenolextr
act.
*V
alu
es
were
sig
nifi
cantly
diff
ere
nt
from
that
of
CC
(P,
0·0
5;
Bonfe
rronite
st)
.†
Valu
es
were
sig
nifi
cantly
diff
ere
nt
from
that
of
FP
C(P,
0·0
5;
Bonfe
rronite
st)
.‡
Subje
cts
ingeste
don
thre
ediffe
rent
occasio
ns
thre
eport
ions
(33
geach)/
dof
CC
(pro
vid
ing
ato
tal
of
appro
xim
ate
ly190m
mol/d
flavanols
and
acid
s12m
mol/d
tota
lphenolic
),F
PC
(pro
vid
ing
ato
tal
of
385m
mol/d
flavanols
and
28m
mol/d
tota
lphenolic
acid
s)
or
EP
C(p
rovid
ing
ato
talof
385m
mol/d
flavanols
and
28m
mol/d
tota
lphenolic
acid
s).
Cocoa polyphenol bioavailability from creams 1839
British
Journal
ofNutrition

of cocoa flavanols in EPC were encapsulated by a coating
material resistant to gastric digestion (HACS), their gastric
absorption was reduced compared to FPC(33). Moreover, we
hypothesised that the higher amount of dietary fibre in EPC
(þ7·2 %, due to the HACS coating) might slow gastric empty-
ing rate(34), thus blunting free epicatechin absorption com-
pared to CC. A slower arrival of total flavanols (the half
deriving from cocoa as in CC plus the half encapsulated) in
the intestine after consumption of EPC might have also
caused an increased formation of conjugated metabolites at
the level of intestinal mucosa or liver, as a consequence of a
lower amount of substrate per unitary time than after ingestion
of CC and FPC. This hypothesis justified the missed detection
in urine of the monitored cocoa native and free flavanols and
the much lower procyanidin concentrations found after
EPC consumption compared to CC and FPC consumption
Polyphenol-freediet
BloodUrine
Faeces
BloodUrine
Urine BloodFaeces
–3 d 0 0·5 1 2 4 6 8 10 12 24 h
Nutcream
Nutcream
Nutcream
Fig. 2. Study design. Each subject followed the time schedule for each type of cocoa-nut cream by a cross-over randomised design. After a 1-week wash-out
period during which subjects returned to their habitual diet, they switched to the 3-d polyphenol-free diet and were randomised for another treatment. A total of
three portions (33 g each) of the cocoa-nut cream were consumed upon each treatment.
**
*
* *†*
*† * †0
1
2
3
4
5
6
7(a)
(b)
Ser
um
(ep
i)ca
tech
in (
nm
ol/l
)
Time (h)
*
*
*
*
**
*†*
*
*†
*
*
*†
*
0
50
100
150
200
250
300
350
0 2 4 6 8 10 12 14 16 18 20 22 24
0 2 4 6 8 10 12 14 16 18 20 22 24
Ser
um
ph
eno
lic a
cid
s (n
mo
l/l)
Time (h)
Fig. 3. Serum concentration–time curves of (a) (epi)catechin and (b) total phenolic acids over 24 h following consumption of the three types of cream (CC, control
cream; FPC, free cocoa polyphenol cream; EPC, encapsulated cocoa polyphenol cream). (a) , FPC; , EPC. (b) , FPC; , EPC; , CC. Values are
means, with their standard errors represented by vertical bars (n 12). * Mean values were significantly different from that of time 0 (P,0·05; Bonferroni test).
† Mean values were significantly different from that of CC (P,0·05; Bonferroni test).
P. Vitaglione et al.1840
British
Journal
ofNutrition
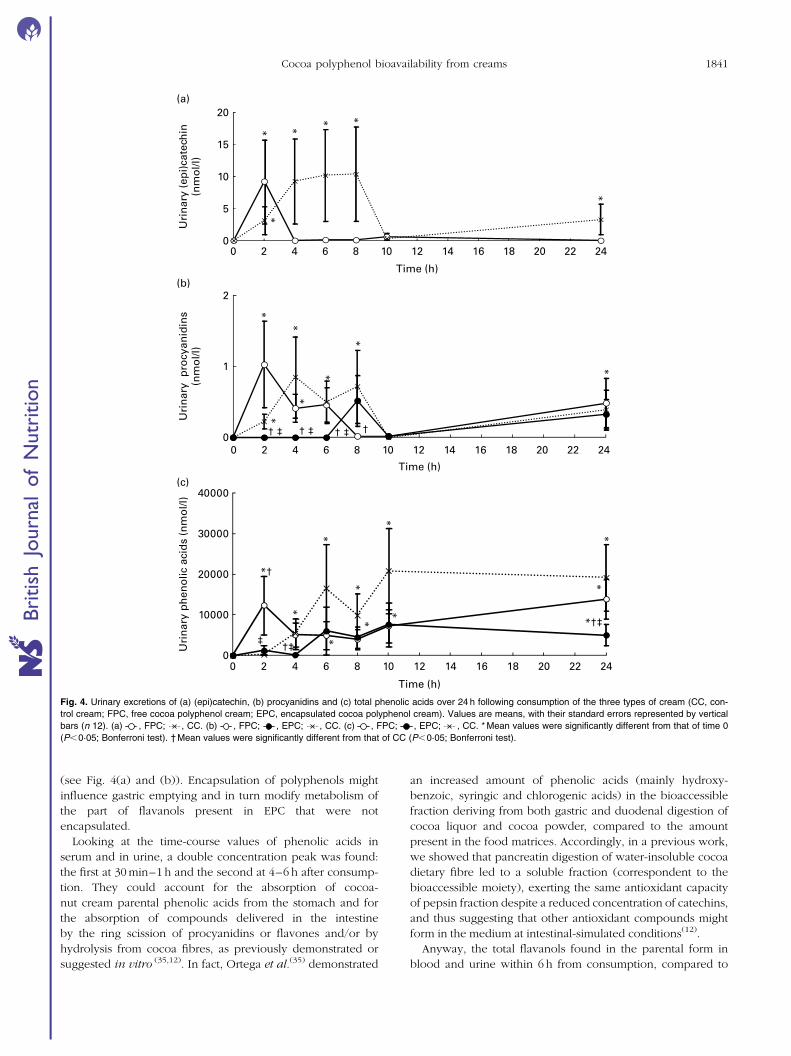
(see Fig. 4(a) and (b)). Encapsulation of polyphenols might
influence gastric emptying and in turn modify metabolism of
the part of flavanols present in EPC that were not
encapsulated.
Looking at the time-course values of phenolic acids in
serum and in urine, a double concentration peak was found:
the first at 30 min–1 h and the second at 4–6 h after consump-
tion. They could account for the absorption of cocoa-
nut cream parental phenolic acids from the stomach and for
the absorption of compounds delivered in the intestine
by the ring scission of procyanidins or flavones and/or by
hydrolysis from cocoa fibres, as previously demonstrated or
suggested in vitro (35,12). In fact, Ortega et al.(35) demonstrated
an increased amount of phenolic acids (mainly hydroxy-
benzoic, syringic and chlorogenic acids) in the bioaccessible
fraction deriving from both gastric and duodenal digestion of
cocoa liquor and cocoa powder, compared to the amount
present in the food matrices. Accordingly, in a previous work,
we showed that pancreatin digestion of water-insoluble cocoa
dietary fibre led to a soluble fraction (correspondent to the
bioaccessible moiety), exerting the same antioxidant capacity
of pepsin fraction despite a reduced concentration of catechins,
and thus suggesting that other antioxidant compounds might
form in the medium at intestinal-simulated conditions(12).
Anyway, the total flavanols found in the parental form in
blood and urine within 6 h from consumption, compared to
* ** *
*
*
0
5
10
15
20(a)
(b)
(c)
Uri
nar
y (e
pi)
cate
chin
(nm
ol/l
)
Time (h)
**
*
*
*
*
*
† ‡ † ‡ † ‡ †0
1
2
0 2 4 6 8 10 12 14 16 18 20 22 24
0 2 4 6 8 10 12 14 16 18 20 22 24
Uri
nar
y p
rocy
anid
ins
(nm
ol/l
)
Time (h)
0 2 4 6 8 10 12 14 16 18 20 22 24
Time (h)
‡
*†
†‡
*†‡
*
*
**
*
*
*
**
0
10000
20000
30000
40000
Uri
nar
y p
hen
olic
aci
ds
(nm
ol/l
)
Fig. 4. Urinary excretions of (a) (epi)catechin, (b) procyanidins and (c) total phenolic acids over 24 h following consumption of the three types of cream (CC, con-
trol cream; FPC, free cocoa polyphenol cream; EPC, encapsulated cocoa polyphenol cream). Values are means, with their standard errors represented by vertical
bars (n 12). (a) , FPC; , CC. (b) , FPC; , EPC; , CC. (c) , FPC; , EPC; , CC. * Mean values were significantly different from that of time 0
(P,0·05; Bonferroni test). † Mean values were significantly different from that of CC (P,0·05; Bonferroni test).
Cocoa polyphenol bioavailability from creams 1841
British
Journal
ofNutrition

the dose ingested, were 0·010 % after CC, 0·025 % after FPC
and 0·002 % after EPC. Percentages below 0·1 % of the
ingested dose for native free flavanols were expected, as it
is known that flavanols are mainly metabolised by the liver
and intestine. In fact, authors reporting plasma concentration,
of flavanols from 257 nmol/l up to 6–12mmol/l, 1–2 h after
consumption of 40–100 g of commercial cocoa or high-flava-
nol cocoa or chocolate, always analysed samples after treat-
ment with glucuronidase, thus summing both free and
metabolised compounds(9,18,19,30,32,36). As we did not perform
glucuronidase treatment on samples, we measured the com-
pounds present in biological samples in the free form. Only
in the study by Schroeter et al.(22), both parent compounds
and their metabolite concentrations in plasma at 2 h after
high-flavanol cocoa consumption were shown to be approxi-
mately 300 and 1400 nM, respectively. Thus, in that case, after
ingestion of 604mmol of flavanol monomers in cocoa, a con-
centration ratio between epicatechins and glucuronides of 1:4
could be calculated. Indeed, in the present study, after con-
sumption of cocoa-nut creams containing 190–385mmol of
total flavanols and 12–28mmol of phenolic acids per 100 g
of cream, serum maximum concentration of (epi)catechin
ranged between 0 and 4 nM, while concentration of total
phenolic acids was between 100 and 200 nM within 2 h after
consumption (see Fig. 3(b)). Thus, within 2 h after consump-
tion of cocoa-nut creams, the concentration ratio between
(epi)catechin and phenolic acids in serum was 1:50, much
higher than that achievable for glucuronidated products.
Phenolic acids in serum, over a time-window shortly
following cocoa or chocolate consumption, have never been
evaluated in previous studies. Rios et al.(13) quantified
phenolic acids in urine collected over 0–48 h after cocoa con-
sumption. They reported that among the eleven aromatic
acids retrieved (3,4-dihydroxyphenylpropionic acid, m-hydro-
xyphenylpropionic, ferulic acid, 3,4-dihydroxyphenylacetic
acid, m-hydroxyphenylacetic acid, phenylacetic acid, vani-
llic acid, m-hydroxybenzoic acid, p-hydroxybenzoic acid,
p-hydroxyhippuric acid and hippuric acid) only vanillic acid
showed a peak excretion shortly after chocolate consumption
(0–3 h), probably deriving from oxidation of vanillin present
in the chocolate, while the other phenolic acids increased
starting from 6 h after consumption. However, Urpi-Sarda
et al.(37) successively showed that, although phenolic acids
were most abundant in urine collected after 6 h from con-
sumption, concentrations higher than baseline values were
retrieved in the 0–6 h time interval for 3,4-dihydroxyphenyl-
acetic acid, five hydroxybenzoic acids and two hydroxy-
cinnamic acids; moreover, they found that when the cocoa
beverage was prepared with milk, compared to water, vanillic
acid was more abundant and majorly excreted over the first
6 h after consumption(37).
The different matrices tested (chocolate by Rios et al.(13);
Urpi-Sarda et al.(37) cocoa beverage prepared with water or
milk and cocoa-nut creams in the present study) might
account for the different results obtained by the studies. How-
ever, looking at 0–6 h urinary excretion of phenolic acids
following CC and FPC consumption, the present data indi-
cated a dose-dependence from ingested flavanol monomers
and phenolic acids excreted. This feature was reinforced by
the data recorded after EPC consumption: when cocoa
polyphenols were partly encapsulated, phenolic acids were
markedly reduced over 0–6 h time intervals, while an
increased rate of excretion after 6 h was recorded. These
results suggested that flavanols, other than cocoa dietary
fibres, might contribute to the phenolic acid formation in the
short term and confirmed the major role of gut microflora
on phenolic acid formation in the long term(8,10–14). In fact,
the higher amount of flavanols in the faeces collected after
consumption of EPC, than in those after FPC, together with
an equivalent amount of phenolic acids indicated that the
encapsulation allowed the delivery of bioactive compounds
in the lower gut and the successive metabolism by local micro-
flora (see Figs. 3(b) and 4(b), 24 h time point).
Despite the fact that FPC caused the highest phenolic acid
excretion over the first 6 h after consumption, the amount of
phenolic acids excreted in 24-h urine following its consump-
tion did not differ by that recorded after CC, both being
consistent with that observed by Rios et al.(13) after consump-
tion of 80 g chocolate. It may be possible that a different con-
centration ratio of monomers (not absorbed and/or degraded
in the upper gastro-intestinal tract) and oligomers plus poly-
mers (naturally reaching the gut) in the gut after consumption
of the three creams might differently influence microflora
metabolism and absorption of metabolites over the 24 h.
All in all, the present data demonstrated that parental cocoa
flavanols are absorbed by cocoa-nut creams in a dose-depen-
dent manner and phenolic acids are the major metabolites in
the short term, being at a concentration ratio of 50:1 v. (epi)-
catechin. Encapsulation of cocoa polyphenols with HACS
caused a reduced 24-h bioavailability of these compounds.
On the other hand, encapsulation effectively masked bitter
taste and allowed delivering of flavanol monomers into the
gut. From the nutritional point of view, encapsulated cocoa
polyphenols may be considered as a functional prebiotic
ingredient, as evidenced in a recent human study(38). Further
studies should be performed to test this hypothesis and to
evaluate the in vivo efficacy of this ingredient towards specific
pathologies and functions.
Acknowledgements
The present research was conducted in the frame of NANOF-
OODS project funded by the European Commission (Project
no: 222006). There are no conflicts of interest. The authors’ con-
tributions are as follows: P. V. and V. F. designed the research;
P. V., R. B. L. and V. F. wrote the paper; P. V., R. F., R. B. L. and
S. S. conducted the sensory and bioavailability study; Jose
Ramon Morello, Jordi Reguant Miranda and E. S. developed
the creams; P. V., R. F. and R. B. L. analysed the data; P. V.
and V. F. had the primary responsibility for the final content.
All authors read and approved the final manuscript.
References
1. Keen CL, Holt RR, Oteiza PI, et al. (2005) Cocoa antioxidantsand cardiovascular health. Am J Clin Nutr 81, 298–303.
P. Vitaglione et al.1842
British
Journal
ofNutrition

2. Buijsse B, Feskens EJ, Kok FJ, et al. (2006) Cocoa intake,blood pressure, and cardiovascular mortality: the ZutphenElderly Study. Arch Intern Med 166, 411–417.
3. Santos-Buelga C & Scalbert A (2000) Proanthocyanidins andtannin-like compounds: nature, occurrence, dietary intakeand effects on nutrition and health. J Sci Food Agric 80,1094–1117.
4. Cooper KA, Campos-Gimenez E, Jimenez Alvarez D, et al.(2008) Predictive relationship between polyphenol andnonfat cocoa solids content of chocolate. J Agric FoodChem 56, 260–265.
5. Wollgast J & Anklam E (2000) Review on polyphenols inTheobroma cacao: changes in composition during the man-ufacture of chocolate and methodology for identification andquantification. Food Res Int 33, 423–447.
6. Gu L, House SE, Wu X, et al. (2006) Procyanidin and cate-chin contents and antioxidant capacity of cocoa and choco-late products. J Agric Food Chem 54, 4057–4061.
7. INRA polyphenols database. http://www.phenol-explorer.eu/8. Urpi-Sarda M, Monagas M, Khan N, et al. (2009) Epicatechin,
procyanidins, and phenolic microbial metabolites aftercocoa intake in humans and rats. Anal Bioanal Chem 394,1545–1556.
9. Holt RR, Lazarus SA, Sullards MC, et al. (2002) Procyanidindimer B2 [epicatechin-(4b-8)-epicatechin] in human plasmaafter the consumption of a flavanol-rich cocoa. Am J ClinNutr 76, 798–804.
10. Appeldoorn MM, Vincken JP, Aura AM, et al. (2009) Procya-nidin dimers are metabolized by human microbiota with2-(3,4-dihydroxyphenyl)acetic acid and 5-(3,4-dihydroxy-phenyl)-g-valerolactone as the major metabolites. J AgricFood Chem 57, 1084–1092.
11. Stoupi S, Williamson G, Drynan JW, et al. (2010) A compari-son of the in vitro biotransformation of (2)-epicatechin andprocyanidin B2 by human faecal microbiota. Mol Nutr FoodRes 54, 747–759.
12. Fogliano V, Corollaro ML, Vitaglione P, et al. (2011) In vitrobioaccessibility and gut biotransformation of polyphenolspresent in the water-insoluble cocoa fraction. Mol NutrFood Res 55, Suppl. 1, S44–S55.
13. Rios LY, Gonthier MP, Remesy C, et al. (2003) Chocolateintake increases urinary excretion of polyphenol-derivedphenolic acids in healthy human subjects. Am J Clin Nutr77, 912–918.
14. Gonthier MP, Donovan JL, Texier O, et al. (2003) Metabolismof dietary procyanidins in rats. Free Radical Biol Med 35,837–844.
15. Serafini M, Bugianesi R, Maiani G, et al. (2003) Plasma anti-oxidants from chocolate. Nature 424, 1013.
16. Neilson AP & Ferruzzi MG (2011) Influence of formulationand processing on absorption and metabolism of flavan-3-ols from tea and cocoa. Annu Rev Food Sci Technol 2,125–151.
17. Schroeter H, Holt RR, Orozco TJ, et al. (2003) Nutrition: milkand absorption of dietary flavanols. Nature 426, 787–788.
18. Keogh JB, McInerney J & Clifton PM (2007) The effect ofmilk protein on the bioavailability of cocoa polyphenols.J Food Sci 72, S230–S233.
19. Roura E, Andres-Lacueva C, Estruch R, et al. (2007) Milk doesnot affect the bioavailability of cocoa powder flavonoid inhealthy human. Ann Nutr Metab 51, 493–498.
20. Roura E, Andres-Lacueva C, Estruch R, et al. (2008)The effects of milk as a food matrix for polyphenols on
the excretion profile of cocoa (2)-epicatechin metabolitesin healthy human subjects. Br J Nutr 100, 846–851.
21. Mullen W, Borges G, Donovan JL, et al. (2009) Milkdecreases urinary excretion but not plasma pharmacoki-netics of cocoa flavan-3-ol metabolites in humans. Am JClin Nutr 89, 1784–1791.
22. Schroeter H, Heiss C, Balzer J, et al. (2006) (2)-Epicatechinmediates beneficial effects of flavanol-rich cocoa on vascularfunction in humans. Proc Natl Acad Sci U S A 103,1024–1029.
23. Monagas M, Urpi-Sarda M, Sanchez-Patan F, et al. (2010)Insights into the metabolism and microbial biotransform-ation of dietary flavan-3-ols and the bioactivity of theirmetabolites. Food Funct 1, 233–253.
24. Fogliano V & Vitaglione P (2005) Functional foods: planningand development. Mol Nutr Food Res 49, 256–262.
25. Ortega N, Romero MP, Macia A, et al. (2008) Obtention andcharacterization of phenolic extracts from different cocoasources. J Agric Food Chem 56, 9621–9627.
26. Zhongxiang F & Bhesh B (2010) Encapsulation of polyphe-nols – a review. Trends Food Sci Technol 21, 510–523.
27. Lucas-Abellan C, Fortea I, Gabaldon JA, et al. (2008) Encap-sulation of quercetin and myricetin in cyclodextrins at acidicpH. J Agric Food Chem 56, 255–259.
28. Dube ANg K, Nicolazzo JA & Larson I (2010) Effective useof reducing agents and nanoparticle encapsulation in stabi-lizing catechins in alkaline solution. Food Chem 122,662–667.
29. Urpi-Sarda M, Monagas M, Khan N, et al. (2009) Targetedmetabolic profiling of phenolics in urine and plasmaafter regular consumption of cocoa by liquid chromato-graphy–tandem mass spectrometry. J Chromatogr A 1216,7258–7267.
30. Richelle M, Tavazzi I, Enslen M, et al. (1999) Plasma kineticsin man of epicatechin from black chocolate. Eur J Clin Nutr53, 22–26.
31. Rein D, Paglieroni TG, Wun T, et al. (2000) Cocoa inhibitsplatelet activation and function. Am J Clin Nutr 72, 30–35.
32. Wang JF, Schramm DD, Holt RR, et al. (2000) A dose–response effect from chocolate consumption on plasmaepicatechin and oxidative damage. J Nutr 130, 2115–2119.
33. Anschutz M, Garbacz G, Kosch O, et al. (2009) Characteriz-ation of the behavior of alginate-based microcapsules in vitroand in vivo. Int J Clin Pharmacol Ther 47, 556–563.
34. Ray TK, Mansell KM, Knight LC, et al. (1983) Long-termeffects of dietary fibre on glucose tolerance and gastric emp-tying in noninsulin-dependent diabetic patients. Am J ClinNutr 37, 376–381.
35. Ortega N, Reguant J, Romero MP, et al. (2009) Effect of fatcontent on the digestibility and bioaccessibility of cocoapolyphenol by an in vitro digestion model. J Agric FoodChem 57, 5743–5749.
36. Baba S, Osakabe N, Yasuda A, et al. (2000) Bioavailability of(2)-epicatechin upon intake of chocolate and cocoa inhuman volunteers. Free Radic Res 33, 635–641.
37. Urpi-Sarda M, Llorach R, Khan N, et al. (2010) Effect of milkon the urinary excretion of microbial phenolic acids aftercocoa powder consumption in humans. J Agric Food Chem58, 4706–4711.
38. Tzounis X, Rodriguez-Mateos A, Vulevic J, et al. (2010)Prebiotic evaluation of cocoa-derived flavanols in healthyhumans by using a randomized, controlled, double-blind,crossover intervention study. Am J Clin Nutr 93, 62–72.
Cocoa polyphenol bioavailability from creams 1843
British
Journal
ofNutrition

This article was downloaded by: [151.75.17.223]On: 12 January 2015, At: 07:25Publisher: Taylor & FrancisInforma Ltd Registered in England and Wales Registered Number: 1072954 Registered office: Mortimer House,37-41 Mortimer Street, London W1T 3JH, UK
Click for updates
Plant Biosystems - An International Journal Dealingwith all Aspects of Plant Biology: Official Journal of theSocieta Botanica ItalianaPublication details, including instructions for authors and subscription information:http://www.tandfonline.com/loi/tplb20
Eco-physiological response to water stress of drought-tolerant and drought-sensitive tomato genotypesM. M. Riganoa, C. Arenab, A. Di Matteoa, S. Sellittoa, L. Frusciantea & A. Baronea
a Department of Agricultural Sciences, University of Naples “Federico II”, Via Università100, Portici80055, Naples, Italyb Department of Biology, University of Naples “Federico II”, Via Cinthia 21, 80126Naples,ItalyAccepted author version posted online: 10 Dec 2014.Published online: 13 Dec 2014.
To cite this article: M. M. Rigano, C. Arena, A. Di Matteo, S. Sellitto, L. Frusciante & A. Barone (2014): Eco-physiological response to water stress of drought-tolerant and drought-sensitive tomato genotypes, Plant Biosystems -An International Journal Dealing with all Aspects of Plant Biology: Official Journal of the Societa Botanica Italiana, DOI:10.1080/11263504.2014.989286
To link to this article: http://dx.doi.org/10.1080/11263504.2014.989286
PLEASE SCROLL DOWN FOR ARTICLE
Taylor & Francis makes every effort to ensure the accuracy of all the information (the “Content”) containedin the publications on our platform. However, Taylor & Francis, our agents, and our licensors make norepresentations or warranties whatsoever as to the accuracy, completeness, or suitability for any purpose of theContent. Any opinions and views expressed in this publication are the opinions and views of the authors, andare not the views of or endorsed by Taylor & Francis. The accuracy of the Content should not be relied upon andshould be independently verified with primary sources of information. Taylor and Francis shall not be liable forany losses, actions, claims, proceedings, demands, costs, expenses, damages, and other liabilities whatsoeveror howsoever caused arising directly or indirectly in connection with, in relation to or arising out of the use ofthe Content.
This article may be used for research, teaching, and private study purposes. Any substantial or systematicreproduction, redistribution, reselling, loan, sub-licensing, systematic supply, or distribution in anyform to anyone is expressly forbidden. Terms & Conditions of access and use can be found at http://www.tandfonline.com/page/terms-and-conditions

ORIGINAL ARTICLE
Eco-physiological response to water stress of drought-tolerant anddrought-sensitive tomato genotypes
M. M. RIGANO1,*, C. ARENA2,*, A. DI MATTEO1, S. SELLITTO1, L. FRUSCIANTE1, &
A. BARONE1
1Department of Agricultural Sciences, University of Naples “Federico II”, Via Universita 100, Portici 80055, Naples, Italy and2Department of Biology, University of Naples “Federico II”, Via Cinthia 21, 80126 Naples, Italy
AbstractWater stress is an increasing environmental constraint affecting tomato growth and yield in Mediterranean areas. Solanumpennellii is a wild tomato species that exhibits a higher water use efficiency compared with cultivated S. lycopersicum.In particular, a cultivated line carrying a small S. pennellii region on chromosome 9 (IL 9-2-5) was identified as more tolerantto water deficit. In this work, the tolerant (IL 9-2-5) and the susceptible (M82) genotypes were subjected to three differentwater regimes: irrigation with 100% (V1), 50% (V2) and 25% (V3) field capacity. To evaluate the physiological response ofIL 9-2-5 and M82 to water deficit, leaf functional traits, plant biomass production and maximal PSII photochemicalefficiency were measured together with photosynthetic pigments and phenolic compounds. The higher tolerance to waterdeficiency of IL 9-2-5 was associated with the development of a better antioxidant system, especially in treatment V3.In addition, IL 9-2-5 had higher values of sclerophylly and leaf dry matter content thus confirming that the tolerance of IL 9-2-5 can be attributed to traits related to leaf morphology and physiology. In future, identification of polymorphisms in key-genes controlling these traits can guide breeding efforts aimed at improving susceptible genotypes.
Keywords: Functional leaf traits, phenolics, photochemical efficiency, tomato introgression lines, water stress
Introduction
Drought leading to water stress is an environmental
constraint in hot and dry climate (e.g. Mediterranean
environments) affecting crop growth and yield, and
reducing agricultural productivity. In a near future,
losses of crop yields due to this abiotic stress may be
amplified due to the threats of climate changes
emerging from global warming as well as due to the
growing scarcity of fresh water available for irrigation
caused by urbanization and depletion of aquifers.
The ultimate goal is to develop crop plants with
improved water use efficiency in order to minimize
drought-induced losses of yield and permit the use of
cultivable land with limited water supplies (Vitale
et al. 2011; Mishra et al. 2012).
Plants develop a range of mechanisms for dealing
with low water availability that include: (1) stress
escape by completing their life cycle before severe
water deficit occurs; (2) stress avoidance by enhan-
cing their capacity to absorb water and conserve it
thanks to a large root system, a reduced leaf area and
limited transpiration; (3) stress tolerance by improv-
ing osmotic adjustment ability and increasing cell
wall elasticity; (4) stress resistance by altering
metabolic pathways so that the plant can survive
under severe stress conditions (e.g. increased
antioxidant metabolism) (Xu et al. 2010; Clayes &
Inze 2013; Lawlor 2013). Exposure to water deficit
often increases the production of reactive oxygen
species and, as a consequence, promotes the
concentration of antioxidant compounds as well as
the activity of some antioxidant enzymes (ascorbate
peroxidase, catalase and superoxide dismutase)
(Garg & Manchanda 2009; Sanchez-Rodriguez
et al. 2011; Barbagallo et al. 2012). In particular,
phenolic compounds can act to detoxify free radicals
(Sanchez-Rodriguez et al. 2011). In addition, caro-
tenoids can reduce and eliminate the reactive oxygen
damage, serve as precursors of ABA synthesis and
q 2014 Societa Botanica Italiana
Correspondence: A. Barone, Department of Agricultural Sciences, University of Naples “Federico II”, Via Universita 100, Portici 80055, Naples, Italy.
Tel: þ39 081 2539491. Fax: þ39 081 2539486. Email: [email protected]
Plant Biosystems, 2014http://dx.doi.org/10.1080/11263504.2014.989286
Dow
nloa
ded
by [
151.
75.1
7.22
3] a
t 07:
25 1
2 Ja
nuar
y 20
15
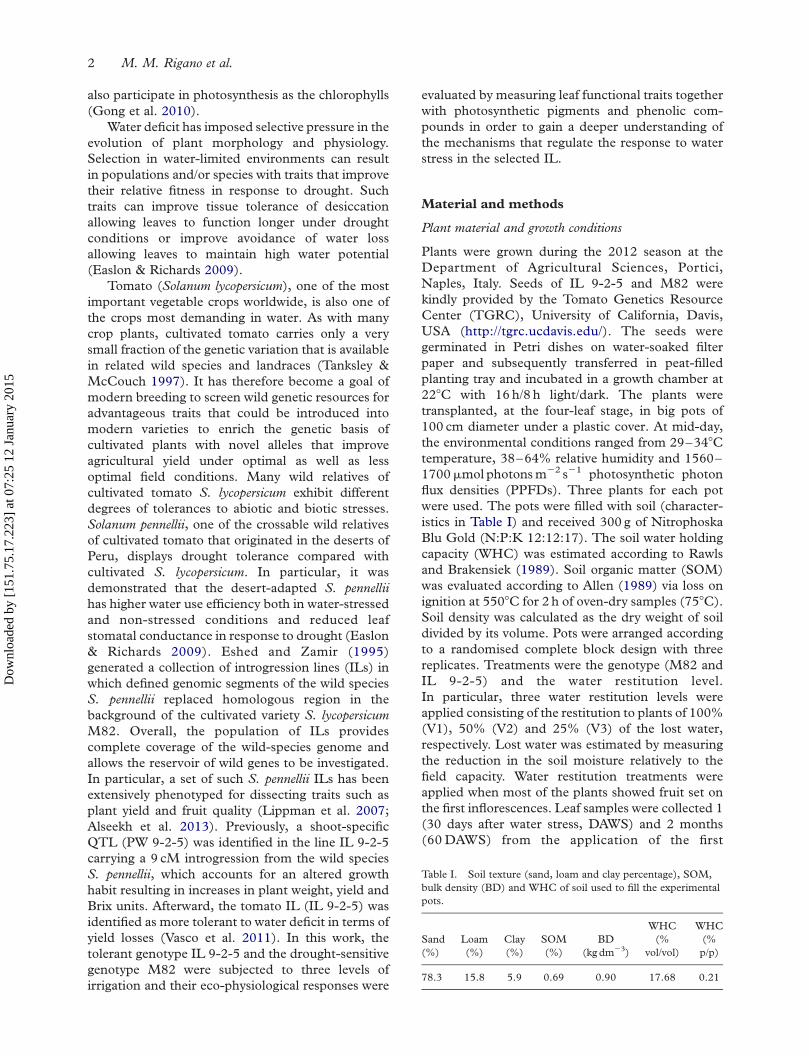
also participate in photosynthesis as the chlorophylls
(Gong et al. 2010).
Water deficit has imposed selective pressure in the
evolution of plant morphology and physiology.
Selection in water-limited environments can result
in populations and/or species with traits that improve
their relative fitness in response to drought. Such
traits can improve tissue tolerance of desiccation
allowing leaves to function longer under drought
conditions or improve avoidance of water loss
allowing leaves to maintain high water potential
(Easlon & Richards 2009).
Tomato (Solanum lycopersicum), one of the most
important vegetable crops worldwide, is also one of
the crops most demanding in water. As with many
crop plants, cultivated tomato carries only a very
small fraction of the genetic variation that is available
in related wild species and landraces (Tanksley &
McCouch 1997). It has therefore become a goal of
modern breeding to screen wild genetic resources for
advantageous traits that could be introduced into
modern varieties to enrich the genetic basis of
cultivated plants with novel alleles that improve
agricultural yield under optimal as well as less
optimal field conditions. Many wild relatives of
cultivated tomato S. lycopersicum exhibit different
degrees of tolerances to abiotic and biotic stresses.
Solanum pennellii, one of the crossable wild relatives
of cultivated tomato that originated in the deserts of
Peru, displays drought tolerance compared with
cultivated S. lycopersicum. In particular, it was
demonstrated that the desert-adapted S. pennellii
has higher water use efficiency both in water-stressed
and non-stressed conditions and reduced leaf
stomatal conductance in response to drought (Easlon
& Richards 2009). Eshed and Zamir (1995)
generated a collection of introgression lines (ILs) in
which defined genomic segments of the wild species
S. pennellii replaced homologous region in the
background of the cultivated variety S. lycopersicum
M82. Overall, the population of ILs provides
complete coverage of the wild-species genome and
allows the reservoir of wild genes to be investigated.
In particular, a set of such S. pennellii ILs has been
extensively phenotyped for dissecting traits such as
plant yield and fruit quality (Lippman et al. 2007;
Alseekh et al. 2013). Previously, a shoot-specific
QTL (PW 9-2-5) was identified in the line IL 9-2-5
carrying a 9 cM introgression from the wild species
S. pennellii, which accounts for an altered growth
habit resulting in increases in plant weight, yield and
Brix units. Afterward, the tomato IL (IL 9-2-5) was
identified as more tolerant to water deficit in terms of
yield losses (Vasco et al. 2011). In this work, the
tolerant genotype IL 9-2-5 and the drought-sensitive
genotype M82 were subjected to three levels of
irrigation and their eco-physiological responses were
evaluated by measuring leaf functional traits together
with photosynthetic pigments and phenolic com-
pounds in order to gain a deeper understanding of
the mechanisms that regulate the response to water
stress in the selected IL.
Material and methods
Plant material and growth conditions
Plants were grown during the 2012 season at the
Department of Agricultural Sciences, Portici,
Naples, Italy. Seeds of IL 9-2-5 and M82 were
kindly provided by the Tomato Genetics Resource
Center (TGRC), University of California, Davis,
USA (http://tgrc.ucdavis.edu/). The seeds were
germinated in Petri dishes on water-soaked filter
paper and subsequently transferred in peat-filled
planting tray and incubated in a growth chamber at
228C with 16 h/8 h light/dark. The plants were
transplanted, at the four-leaf stage, in big pots of
100 cm diameter under a plastic cover. At mid-day,
the environmental conditions ranged from 29–348Ctemperature, 38–64% relative humidity and 1560–
1700mmol photonsm22 s21 photosynthetic photon
flux densities (PPFDs). Three plants for each pot
were used. The pots were filled with soil (character-
istics in Table I) and received 300 g of Nitrophoska
Blu Gold (N:P:K 12:12:17). The soil water holding
capacity (WHC) was estimated according to Rawls
and Brakensiek (1989). Soil organic matter (SOM)
was evaluated according to Allen (1989) via loss on
ignition at 5508C for 2 h of oven-dry samples (758C).
Soil density was calculated as the dry weight of soil
divided by its volume. Pots were arranged according
to a randomised complete block design with three
replicates. Treatments were the genotype (M82 and
IL 9-2-5) and the water restitution level.
In particular, three water restitution levels were
applied consisting of the restitution to plants of 100%
(V1), 50% (V2) and 25% (V3) of the lost water,
respectively. Lost water was estimated by measuring
the reduction in the soil moisture relatively to the
field capacity. Water restitution treatments were
applied when most of the plants showed fruit set on
the first inflorescences. Leaf samples were collected 1
(30 days after water stress, DAWS) and 2 months
(60DAWS) from the application of the first
Table I. Soil texture (sand, loam and clay percentage), SOM,
bulk density (BD) and WHC of soil used to fill the experimental
pots.
Sand
(%)
Loam
(%)
Clay
(%)
SOM
(%)
BD
(kgdm23)
WHC
(%
vol/vol)
WHC
(%
p/p)
78.3 15.8 5.9 0.69 0.90 17.68 0.21
2 M. M. Rigano et al.
Dow
nloa
ded
by [
151.
75.1
7.22
3] a
t 07:
25 1
2 Ja
nuar
y 20
15
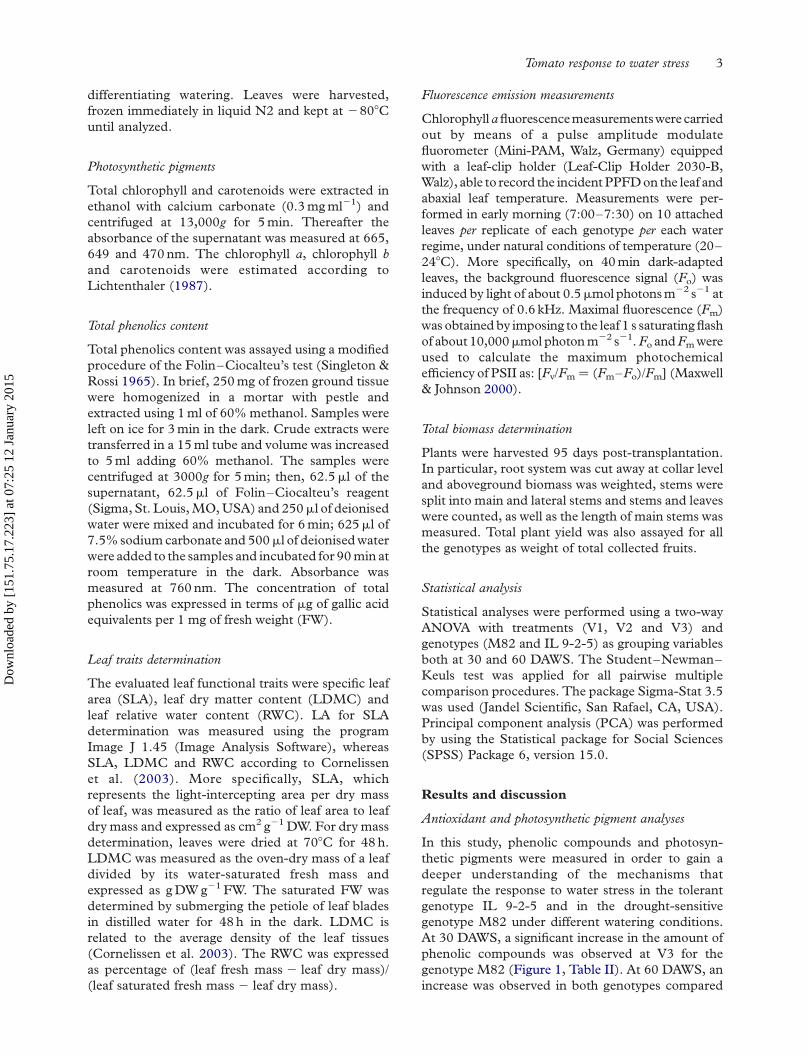
differentiating watering. Leaves were harvested,
frozen immediately in liquid N2 and kept at 2808Cuntil analyzed.
Photosynthetic pigments
Total chlorophyll and carotenoids were extracted in
ethanol with calcium carbonate (0.3mgml21) and
centrifuged at 13,000g for 5min. Thereafter the
absorbance of the supernatant was measured at 665,
649 and 470 nm. The chlorophyll a, chlorophyll b
and carotenoids were estimated according to
Lichtenthaler (1987).
Total phenolics content
Total phenolics content was assayed using a modified
procedure of the Folin–Ciocalteu’s test (Singleton &
Rossi 1965). In brief, 250mg of frozen ground tissue
were homogenized in a mortar with pestle and
extracted using 1ml of 60% methanol. Samples were
left on ice for 3min in the dark. Crude extracts were
transferred in a 15ml tube and volume was increased
to 5ml adding 60% methanol. The samples were
centrifuged at 3000g for 5min; then, 62.5ml of thesupernatant, 62.5ml of Folin–Ciocalteu’s reagent
(Sigma, St. Louis,MO,USA) and 250ml of deionisedwater were mixed and incubated for 6min; 625ml of7.5% sodiumcarbonate and 500ml of deionisedwaterwere added to the samples and incubated for 90min at
room temperature in the dark. Absorbance was
measured at 760 nm. The concentration of total
phenolics was expressed in terms of mg of gallic acid
equivalents per 1 mg of fresh weight (FW).
Leaf traits determination
The evaluated leaf functional traits were specific leaf
area (SLA), leaf dry matter content (LDMC) and
leaf relative water content (RWC). LA for SLA
determination was measured using the program
Image J 1.45 (Image Analysis Software), whereas
SLA, LDMC and RWC according to Cornelissen
et al. (2003). More specifically, SLA, which
represents the light-intercepting area per dry mass
of leaf, was measured as the ratio of leaf area to leaf
dry mass and expressed as cm2 g21DW. For dry mass
determination, leaves were dried at 708C for 48 h.
LDMC was measured as the oven-dry mass of a leaf
divided by its water-saturated fresh mass and
expressed as gDWg21 FW. The saturated FW was
determined by submerging the petiole of leaf blades
in distilled water for 48 h in the dark. LDMC is
related to the average density of the leaf tissues
(Cornelissen et al. 2003). The RWC was expressed
as percentage of (leaf fresh mass 2 leaf dry mass)/
(leaf saturated fresh mass 2 leaf dry mass).
Fluorescence emission measurements
Chlorophyllafluorescencemeasurementswerecarried
out by means of a pulse amplitude modulate
fluorometer (Mini-PAM, Walz, Germany) equipped
with a leaf-clip holder (Leaf-Clip Holder 2030-B,
Walz), able to record the incidentPPFDon the leaf and
abaxial leaf temperature. Measurements were per-
formed in early morning (7:00–7:30) on 10 attached
leaves per replicate of each genotype per each water
regime, under natural conditions of temperature (20–
248C). More specifically, on 40min dark-adapted
leaves, the background fluorescence signal (Fo) was
induced by light of about 0.5mmolphotonsm22 s21 at
the frequency of 0.6 kHz. Maximal fluorescence (Fm)
was obtainedby imposing to the leaf 1 s saturatingflash
of about 10,000mmol photonm22 s21.Fo andFmwere
used to calculate the maximum photochemical
efficiency of PSII as: [Fv/Fm ¼ (Fm–Fo)/Fm] (Maxwell
& Johnson 2000).
Total biomass determination
Plants were harvested 95 days post-transplantation.
In particular, root system was cut away at collar level
and aboveground biomass was weighted, stems were
split into main and lateral stems and stems and leaves
were counted, as well as the length of main stems was
measured. Total plant yield was also assayed for all
the genotypes as weight of total collected fruits.
Statistical analysis
Statistical analyses were performed using a two-way
ANOVA with treatments (V1, V2 and V3) and
genotypes (M82 and IL 9-2-5) as grouping variables
both at 30 and 60 DAWS. The Student–Newman–
Keuls test was applied for all pairwise multiple
comparison procedures. The package Sigma-Stat 3.5
was used (Jandel Scientific, San Rafael, CA, USA).
Principal component analysis (PCA) was performed
by using the Statistical package for Social Sciences
(SPSS) Package 6, version 15.0.
Results and discussion
Antioxidant and photosynthetic pigment analyses
In this study, phenolic compounds and photosyn-
thetic pigments were measured in order to gain a
deeper understanding of the mechanisms that
regulate the response to water stress in the tolerant
genotype IL 9-2-5 and in the drought-sensitive
genotype M82 under different watering conditions.
At 30 DAWS, a significant increase in the amount of
phenolic compounds was observed at V3 for the
genotype M82 (Figure 1, Table II). At 60 DAWS, an
increase was observed in both genotypes compared
Tomato response to water stress 3
Dow
nloa
ded
by [
151.
75.1
7.22
3] a
t 07:
25 1
2 Ja
nuar
y 20
15

with the first sampling (Figure 1). In the second
sampling, only in IL 9-2-5 a significant increase of
total phenolics was measured in treatment V3
compared with treatments V2 and V1 (Figure 1,
Table III). The general increase observed moving
from 30 to 60 DAWS may be due to the establish-
ment of multiple stresses on the plant. In fact,
although in the treatment V1 the water is not a
limiting factor, the condition of high temperature
and irradiance are exacerbated with the progress of
the summer season. Hence, the increase of total
phenolics could be a defensive response of the plant
to protect the photosystems from the excessive
radiation and to mitigate the limited water avail-
ability (Ennajeh et al. 2009). The different behavior
of M82 and IL 9-2-5 at 60 DAWS is in agreement
with the studies from Sanchez-Rodriguez et al.
(2011) who demonstrated that polyphenols play a
significant role in water-stress tolerance in tomato
and that moderate water stress can induce shikimate
pathway in tolerant tomato cultivars.
As for the photosynthetic pigments, at 30 DAWS
no significant differences in pigment concentrations
were found between watering treatments for both
genotypes (Figure 2, Table II). The genotype IL 9-2-
5 did have a significant higher chlorophyll a and b
concentration regardless of treatments (Table II).
At 60 DAWS, for IL 9-2-5 genotype there was a
significant increase in the concentration of chlor-
ophyll a, chlorophyll b and carotenoids in plants
subjected to V3 treatment compared with plants of
V1 and V2 treatments whereas in M82 an opposite
trend was found, thus evidencing a significant
interaction between treatments and genotype
(Table III). Reduction in leaf pigments induced by
drought is considered to be an oxidative stress
indicator, which might be attributed to pigment
photo-oxidation, chlorophyll degradation and/or
chlorophyll synthesis deficiency (Sanchez-Rodriguez
et al. 2012). In particular, reduction of chlorophyll
concentrations is identified as a drought response
mechanism in order to minimize the light absorption
by chloroplasts. Accordingly, the decrease in chlor-
ophyll content and carotenoids in M82 and the
increase in IL 9-2-5 at 60 DAWS demonstrate that
both genotypes perceived the water stress but
responded to it in opposite ways, thus confirming
the higher tolerance of IL 9-2-5 to water deficiency.
Functional leaf traits
The different water treatments and the extent of the
stress affected significantly the leaf functional traits,
namely SLA, LDMC and RWC (Figure 3).
In response to prolonged water stress conditions,
the SLA decrease at 60 DAWS compared with 30
DAWS was evident for both tomato genotypes, and
more specifically it was of 33% for M82 and 35% for
IL 9-2-5. At 30 DAWS, no statistical difference has
been observed in SLA of M82 and IL 9-2-5 among
different water regimes as well as no interaction
between genotype and treatments was evidenced
(Table II). After 60 DAWS, IL 9-2-5 showed a
significant reduction of SLA in treatments V2 and V3
compared with V1 (Figure 3B) whereas in M82 an
increase of SLA was observed in V3 thus a significant
interaction between genotype and treatments was
observed (Table III). This result may be ascribed to
the development of new generation leaves in both
genotypes, which in response to limiting water supply
have reduced the leaf expansion to avoid water loss
by transpiration and increased the leaf hardness and
rigidity (sclerophylly) to control leaf dehydration.
Also in this framework, even if in the treatment V1
the water is not a limiting factor, the increasing
temperature and irradiance with the progress of the
Figure 1. Total phenolics content in the leaves of two genotypes M82 and IL 9-2-5 in response to different water regimes V1, V2 and V3
following 30 (A) and 60 (B) DAWS. Mean (^SE) values are shown. Within each genotype, values marked with different letters indicate
significant difference among treatments (Student–Newman–Keuls test, p , 0.05).
4 M. M. Rigano et al.
Dow
nloa
ded
by [
151.
75.1
7.22
3] a
t 07:
25 1
2 Ja
nuar
y 20
15

Table
II.
Summary
oftw
o-w
ayANOVA
statisticsforco
mparisonofeffectsofthreedifferentwatertreatm
ents
onthetw
otomato
gen
otypes:M
82andIL
9-2-5
at30DAWSinco
ming.
Treatm
ent
Gen
otype
T£G
Residual
DF
MS
FP
DF
MS
FP
DF
MS
FP
DF
MS
Phen
olics
21.19
9.04
2£1023
10.03
0.20
0.66
20.16
1.20
0.33
16
0.13
Chla
263.29
1.36
0.29
1372.91
7.98
0.01
222.52
0.48
0.63
16
46.76
Chlb
220.52
1.65
0.22
1278.13
22.31
,0.001
22.31
0.19
0.83
16
12.47
Car
24.80
1.04
0.38
17.45
1.62
0.22
20.23
0.05
0.95
16
4.61
SLA
2476.80
0.38
0.69
1756.15
0.60
0.44
21038.08
0.83
0.44
41
1253.03
LDM
C2
1.27£1024
0.22
0.81
18.61£1023
14.62
,0.001
21.33£1024
0.23
0.80
41
5.89£1024
RW
C2
156.38
0.86
0.43
1750.12
4.14
0.05
262.93
0.35
0.71
41
181.39
Fv/F
m2
5.42£1023
4.32
0.02
14.68£1025
0.037
0.85
21.28£1023
1.02
0.37
41
1.25£1023
Notes:Treatm
ents:V1,V2,V3;gen
otypes:M
82,IL
9-2-5.T
£G:interactionsbetweentreatm
ents(T
)andgen
otype(G
).SLA,specificleafarea;LDM
C,leafdry
matter
content;RW
C,relativewater
content;Fv/F
m,maxim
alPSII
photoch
emicalefficien
cy.
Table
III.
Summary
oftw
o-w
ayANOVA
statisticsforco
mparisonofeffectsofthreedifferentwatertreatm
ents
onthetw
otomato
gen
otypes:M
82andIL
9-2-5
at60DAWSinco
ming.
Treatm
ent
Gen
otype
T£G
Residual
DF
MS
FP
DF
MS
FP
DF
MS
FP
DF
MS
Phen
olics
21.24
7.11
0.01
10.26
1.48
0.25
20.35
1.99
0.18
12
0.18
Chla
2151.94
2.48
0.13
1496.92
8.11
0.02
21557.28
25.41
,0.001
12
61.28
Chlb
29.55
0.47
0.64
1213.72
10.44
0.01
2250.10
12.21
1£1023
12
20.48
Car
217.33
1.73
0.22
17.12
0.71
0.41
2132.07
13.19
,0.001
12
10.02
SLA
2189.35
0.30
0.75
1189.35
0.30
0.75
26709.45
10.44
,0.001
42
642.76
LDM
C2
1.89£1023
1.62
0.21
10.02
20.81
,0.001
24.55£1024
0.39
0.68
42
116£1023
RW
C2
151.20
2.54
0.09
1222.89
3.74
0.06
2193.32
3.24
0.05
42
59.61
Fv/F
m2
1.84£1023
2.67
0.08
13.67£1024
0.53
0.47
28.08£1025
0.12
0.89
42
6.90£1024
Notes:Treatm
ents:V1,V2,V3;gen
otypes:M
82,IL
9-2-5.T
£G:interactionsbetweentreatm
ents(T
)andgen
otype(G
).SLA,specificleafarea;LDM
C,leafdry
matter
content;RW
C,relative
water
content;Fv/F
m,maxim
alPSII
photoch
emicalefficien
cy.
Tomato response to water stress 5
Dow
nloa
ded
by [
151.
75.1
7.22
3] a
t 07:
25 1
2 Ja
nuar
y 20
15

summer season may have triggered the formation of
new leaves with small SLA. It is well known that the
reduction of leaf area as well as the developing of
mechanic tissues represents a useful way to cope with
environmental harsh conditions, such as high
irradiance, temperature and water stress, that may
limit plant productivity (Hunt & Cornelissen 1997;
Gulıas et al. 2003; Poorter & Bongers 2006).
As expected, the LDMC showed an opposite
trend compared with SLA (Figure 3(C),(D)). The
comparison between the two genotypes demon-
strated that IL 9-2-5 showed a significant higher
LDMC compared with M82 in all tested water
conditions at both 30 and 60 DAWS (Tables II and
III). In particular, at 30 DAWS no significant
difference was detected in both genotypes in
response to different water regimes. At 60 DAWS,
LDMC increased significantly (around 30%) in both
tomato genotypes, although IL 9-2-5 maintained a
higher value compared with M82. Since this
parameter can be considered an index of tissue
density (Poorter & Bongers 2006), its augment in
response to prolonged water stress conditions could
indicate the development of a strategy to cope with
water stress that implicates the reduction of growth
rate and the increase of leaf longevity in order to
retain nutrients, as observed by other authors
(Poorter & De Jong 1999; Ryser & Urbas 2000).
Moreover, due to the higher LDMC observed in IL
9-2-5 under V3 treatment, it could be hypothesized
that this genotype under limiting water supply
allocates most new photosynthates towards the
production of sclerenchymatic tissues in order to
avoid leaf dehydration, rather than toward the
growth.
The water status of leaves in response to different
water treatments and their duration is indicated by
RWC (Figure 3(E),(F)). At 30 DAWS, no statistical
differences were evident in both tomato genotypes
among different water regimes. Conversely, at 60
Figure 2. Chlorophyll a (A, B), chlorophyll b (C, D) and carotenoid content (E, F) in the leaves of two genotypes M82 and IL 9-2-5 in
response to different water regimes V1, V2 and V3 following 30 and 60 DAWS.Mean (^SE) values are shown. Within each genotype, values
marked with different letters indicate significant difference among treatments (Student–Newman–Keuls test, p , 0.05).
6 M. M. Rigano et al.
Dow
nloa
ded
by [
151.
75.1
7.22
3] a
t 07:
25 1
2 Ja
nuar
y 20
15

DAWS the genotype IL 9-2-5 showed a reduction of
23% of RWC in the treatment V3 compared with V2
and V1 whereas in M82 RWC values remained
comparable to those observed at 30 DAWS. This
result evidenced that under prolonged water stress
conditions, leaves of IL 9-2-5 are more vulnerable to
dehydration compared with the M82 genotype,
despite its higher LDMC. The interaction between
genotype and treatments was significant only at 60
DAWS (Table III).
Maximal PSII photochemical efficiency
In both tomato genotypes at 60 DAWS, no difference
in maximal PSII photochemical efficiency (Fv/Fm)
was detected independently of different water
treatments (Figure 4). The values of Fv/Fm ratio
were comparable for all water regimes and next to
0.8, which is considered the threshold value for
plants in healthy status. This indicates that the
photochemical apparatus of tomato does not lose its
functionality in light conversion to reaction centers
even under prolonged periods of limited water supply
(Maxwell & Johnson 2000). This result can be
considered important since it is well known that
water scarcity represents one of the most severe
constraints to tomato cultivation (Sanchez-Rodriguez
et al. 2011).
Plant biomass production
Regardless of the higher biomass accumulation in IL
9-2-5 previously demonstrated (Fridman et al.
2000), here we confirm that IL 9-2-5 expresses a
different response to water deprivation compared
with M82 since it retains a higher proportion of its
aboveground biomass under water stress (Table IV).
In fact, the percentage of aboveground biomass in IL
9-2-5 was higher than M82 at both V2 and V3 and
both the water restitution levels and the genotypes
significantly affected the reduction in aboveground
biomass (Table V). In addition, IL 9-2-5 maintained
Figure 3. SLA (A, B), LDMC (C, D) and leaf relative water content RWC (E, F) in the leaves of two genotypesM82 and IL 9-2-5 in response
to different water regimes V1, V2 and V3 following 30 and 60 DAWS. Mean (^SE) values are shown. Within each genotype, values marked
with different letters indicate significant difference among treatments (Student–Newman–Keuls test, p , 0.05).
Tomato response to water stress 7
Dow
nloa
ded
by [
151.
75.1
7.22
3] a
t 07:
25 1
2 Ja
nuar
y 20
15
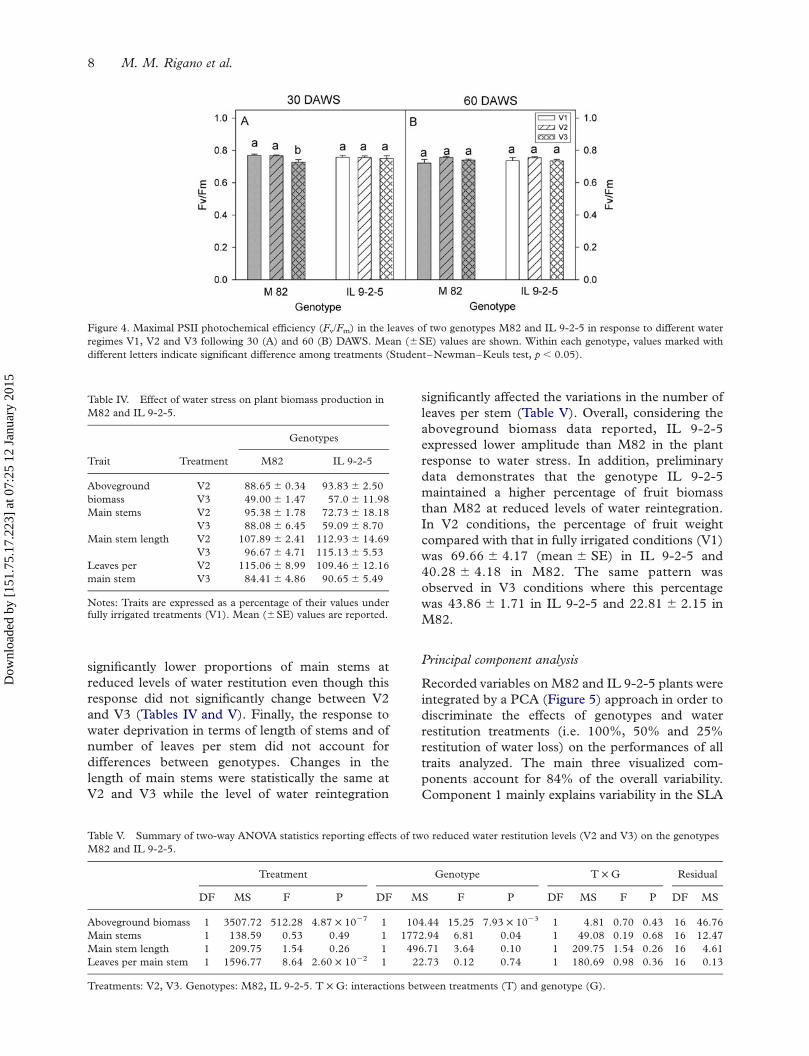
significantly lower proportions of main stems at
reduced levels of water restitution even though this
response did not significantly change between V2
and V3 (Tables IV and V). Finally, the response to
water deprivation in terms of length of stems and of
number of leaves per stem did not account for
differences between genotypes. Changes in the
length of main stems were statistically the same at
V2 and V3 while the level of water reintegration
significantly affected the variations in the number of
leaves per stem (Table V). Overall, considering the
aboveground biomass data reported, IL 9-2-5
expressed lower amplitude than M82 in the plant
response to water stress. In addition, preliminary
data demonstrates that the genotype IL 9-2-5
maintained a higher percentage of fruit biomass
than M82 at reduced levels of water reintegration.
In V2 conditions, the percentage of fruit weight
compared with that in fully irrigated conditions (V1)
was 69.66 ^ 4.17 (mean ^ SE) in IL 9-2-5 and
40.28 ^ 4.18 in M82. The same pattern was
observed in V3 conditions where this percentage
was 43.86 ^ 1.71 in IL 9-2-5 and 22.81 ^ 2.15 in
M82.
Principal component analysis
Recorded variables on M82 and IL 9-2-5 plants were
integrated by a PCA (Figure 5) approach in order to
discriminate the effects of genotypes and water
restitution treatments (i.e. 100%, 50% and 25%
restitution of water loss) on the performances of all
traits analyzed. The main three visualized com-
ponents account for 84% of the overall variability.
Component 1 mainly explains variability in the SLA
Table IV. Effect of water stress on plant biomass production in
M82 and IL 9-2-5.
Genotypes
Trait Treatment M82 IL 9-2-5
Aboveground
biomass
V2 88.65^ 0.34 93.83^ 2.50
V3 49.00^ 1.47 57.0^ 11.98
Main stems V2 95.38^ 1.78 72.73^ 18.18
V3 88.08^ 6.45 59.09^ 8.70
Main stem length V2 107.89^ 2.41 112.93^ 14.69
V3 96.67^ 4.71 115.13^ 5.53
Leaves per
main stem
V2 115.06^ 8.99 109.46^ 12.16
V3 84.41^ 4.86 90.65^ 5.49
Notes: Traits are expressed as a percentage of their values underfully irrigated treatments (V1). Mean (^SE) values are reported.
Table V. Summary of two-way ANOVA statistics reporting effects of two reduced water restitution levels (V2 and V3) on the genotypes
M82 and IL 9-2-5.
Treatment Genotype T £ G Residual
DF MS F P DF MS F P DF MS F P DF MS
Aboveground biomass 1 3507.72 512.28 4.87 £ 1027 1 104.44 15.25 7.93 £ 1023 1 4.81 0.70 0.43 16 46.76
Main stems 1 138.59 0.53 0.49 1 1772.94 6.81 0.04 1 49.08 0.19 0.68 16 12.47
Main stem length 1 209.75 1.54 0.26 1 496.71 3.64 0.10 1 209.75 1.54 0.26 16 4.61
Leaves per main stem 1 1596.77 8.64 2.60 £ 1022 1 22.73 0.12 0.74 1 180.69 0.98 0.36 16 0.13
Treatments: V2, V3. Genotypes: M82, IL 9-2-5. T £ G: interactions between treatments (T) and genotype (G).
Figure 4. Maximal PSII photochemical efficiency (Fv/Fm) in the leaves of two genotypes M82 and IL 9-2-5 in response to different water
regimes V1, V2 and V3 following 30 (A) and 60 (B) DAWS. Mean (^SE) values are shown. Within each genotype, values marked with
different letters indicate significant difference among treatments (Student–Newman–Keuls test, p , 0.05).
8 M. M. Rigano et al.
Dow
nloa
ded
by [
151.
75.1
7.22
3] a
t 07:
25 1
2 Ja
nuar
y 20
15

(30 and 60 DAWS), LDMC (30 and 60 DAWS),
RWC (30 and 60 DAWS), chlorophyll a and b leaf
contents (30 and 60 DAWS), leaf level of carotenoids
(60 DAWS) and length of main stems. Component 2
mainly explains variability in the Fv/Fm (60 DAWS),
leaf level of total phenolics (30 and 60 DAWS), green
FWand number of main stems. Finally, component 3
mainly explains variability in the Fv/Fm (30 DAWS),
the level of carotenoids in leaves (30 DAWS) and the
number of leaves per main stem. The PCA output
shows an evident separation between the tolerant
genotype IL 9-2-5 and the susceptible genotype M82
that is mainly attributable to the component 1.
In addition, in case of the tolerant genotype IL 9-2-5
the response to the three different water regimes can
be mainly explained by the component 2. This allows
us to point out at the latter traits as effective
components of the complex response of IL 9-2-5 to
limited water supply.
Conclusion
In this paper, we provided evidences that the IL 9-2-
5 performs better than the genotype M82 to reduced
water regimes. In particular, we demonstrated that
both genotypes perceived the water stress since they
react to it by modifying the photosynthetic pigment
content in leaves; however, they react in a contrasting
way evidencing a higher tolerance of IL 9-2-5 to
water deprivation. We showed that the main factors
responsible for this better response generally include
a more efficient antioxidant system joined with the
modification of functional leaf traits associated with
an increase of leaf mechanical resistance (namely
sclerophylly and LDMC). In addition, we showed
that IL 9-2-5 subjected to the water regime V2
(irrigation with 50% field capacity) maintained a
higher percentage of fruit weight and aboveground
biomass compared with M82 suggesting that IL 9-2-
5 could be cultivated in semi-arid environments with
reduced losses of yield. Future studies will be
required to evaluate if the cultivation of the genotype
IL 9-2-5 under the regime V2 can, not only permit
the use of marginal lands or cultivation with a more
sustainable use of water, but also promote the quality
and the nutritional properties of the tomato fruits.
Finally, due to the information deriving from the
complete sequencing of the tomato genome (Sato
et al. 2012) the identification of candidate genes
controlling the physiological and morphological
traits analyzed is underway by exploring those
mapping in the introgression region 9-2-5. Identifi-
cation of polymorphisms in key-genes controlling
these traits can guide in future the breeding efforts
aimed at improving susceptible genotypes.
Acknowledgements
The authors are grateful to Tomato Genetics
Resource Centre (TGRC), University of California,
Davis, USA, for providing seeds used in the
experiment and to Giuseppe Di Ruocco for the
help in the experimental work.
Funding
This work was funded by the MIUR – PON02
R&C 2007-2013 PON02_00395_3082360 Geno
POM-pro (D.D. n. 814/Ric.) and by the MIUR –
GenoPOM (2006-2010, DM17732).
Note
* These authors contributed equally to this work.
References
Allen SE. 1989. Chemical analysis of ecological materials. Oxford:
Blackwell Scientific Publication.
Alseekh S, Ofner I, Pleban T, Tripodi P, Di Dato F, Cammareri M,
et al. 2013. Resolution by recombination: Breaking up
Solanum pennellii introgressions. Trends Plant Sci. 18(10):
536–538.
Barbagallo RN, Di Silvestro I, Patane C. 2012. Yield,
physicochemical traits, antioxidant pattern, polyphenol oxidase
activity and total visual quality of field-grown processing
Figure 5. Discrimination of the overall response of M82 and IL 9-
2-5 plants to reduced water supply (i.e. 100%, 50% and 25%
restitution of water loss) by PCA. Component 1 (REGR factor
score 1): SLA (30 and 60 DAWS), LDMC (30 and 60 DAWS),
RWC (30 and 60 DAWS), chlorophyll a and b leaf contents (30
and 60 DAWS), leaf level of carotenoids (60 DAWS) and length of
main stems. Component 2 (REGR factor score 2): Fv/Fm (60
DAWS), leaf level of total phenols (30 and 60 DAWS), green FW
and number of main stems. Component 3 (REGR factor score 3):
Fv/Fm (30 DAWS), level of carotenoids in leaves (30 DAWS) and
number of leaves per main stem.
Tomato response to water stress 9
Dow
nloa
ded
by [
151.
75.1
7.22
3] a
t 07:
25 1
2 Ja
nuar
y 20
15

tomato cv. Brigade as affected by water stress in Mediterranean
climate. J Sci Food Agric. 93: 1449–1457.
Clayes H, Inze D. 2013. The agony of choice: How plants balance
growth and survival under water-limiting conditions. Plant
Physiol. 162: 1768–1779.
Cornelissen J, Lavorel S, Garnier E, Dıaz S, Buchmann N,
Gurvich D, et al. 2003. Handbook of protocols for
standardised and easy measurements of plant functional traits
worldwide. Austral J Bot. 51: 335–380.
Easlon HM, Richards JH. 2009. Drought response in self-
compatible species of tomato (solanaceae). Am J Bot. 96:
605–611.
Ennajeh M, Vadel AM, Khemira H. 2009. Osmoregulation and
osmoprotecion in the leaf cells of two olive cultivars subjected
to severe water deficit. Acta Physiol Plant 31: 711–721.
Eshed Y, Zamir D. 1995. An introgression line population of
Lycopersicon pennellii in the cultivated tomato enables the
identification and fine mapping of yield-associated QTL.
Genetics 141: 1147–1162.
Fridman E, Pleban T, Zamir D. 2000. A recombination hotspot
delimits a wild-species quantitative trait locus for tomato sugar
content to 484 bp within an invertase gene. Proc Natl Acad Sci
USA 97(9): 4718–4723.
Garg N, Manchanda G. 2009. ROS generation in plants: Boon or
bane? Plant Biosyst. 143(1): 81–96.
Gong P, Zhang J, Li H, Yang C, Zhang C, Zhang X, et al. 2010.
Transcriptional profiles of drought-responsive genes in
modulating signal transduction and biochemical pathways in
tomato. J Exp Bot. 61(13): 3563–3575.
Gulıas J, Flexas J, Mus M, Cifre J, Lefi E, Medrano H. 2003.
Relationship between maximum leaf photosyntesis, nitrogen
content and specific leaf area in balearic and non-endemic
Mediterranean species. Ann Bot. 92: 215–222.
Hunt R, Cornelissen JHC. 1997. Components of relative growth
rate and their interrelations in 59 temperate plant species. New
Phytol. 135: 395–417.
Lawlor DW. 2013. Genetic engineering to improve plant
performance under drought: Physiological evaluation of
achievements, limitations and possibilities. J Exp Bot. 64:
83–108.
Lichtenthaler HL. 1987. Chlorophylls and carotenoids: Pigments
of photosynthetic biomembranes. Methods Enzymol. 148:
350–382.
Lippman ZB, Semel Y, Zamir D. 2007. An integrated view of
quantitative trait variation using tomato interspecific introgres-
sion lines. Curr Opin Genet Dev. 17(6): 545–552.
Maxwell K, Johnson GN. 2000. Chlorophyll fuorescence – A
practical guide. J. Exp. Bot. 51: 659–668.
Mishra KB, Iannacone R, Petrozza A,Mishra A, ArmentanoN, La
Vecchia G, et al. 2012. Engineered drought tolerance in tomato
plants is reflected in chlorophyll fluorescence emission. Plant
Sci. 182: 79–86.
Poorter L, Bongers F. 2006. Leaf traits are good predictors of plant
performance across 53 rain forest species. Ecology 87:
1733–1743.
Poorter H, De Jong R. 1999. A comparison of specific leaf area,
chemical composition and leaf construction costs of field plants
from 15 habitats differing in productivity. New Phytol. 143:
163–176.
RawlsWJ, BrakensiekDL. 1989. Estimation of soil water retention
and hydraulic properties. In: Morel-Seytoux HJ, editor.
Unsaturated flow in hydrologic modeling: Theory and practice.
Dordrecht: Kluwer Academic. pp. 275–300.
Ryser P, Urbas P. 2000. Ecological significance of leaf life span
among Central European grass species. Oikos 91: 41–50.
Sanchez-Rodriguez E, del Mar Rubio-Wilhelmi M, Blasco B,
Leyva R, Romero L, Ruiz JM. 2012. Antioxidant response
resides in the shoot in reciprocal grafts of drought-tolerant and
drought-sensitive cultivars in tomato under water stress. Plant
Sci. 188–189: 86–96.
Sanchez-Rodriguez E, Moreno DA, Ferreres F, del Mar Rubio-
Wilhelmi M, Ruiz JM. 2011. Differential responses of five
cherry tomato varieties to water stress: Changes on phenolic
metabolites and related enzymes. Phytochemistry 72:
723–729.
Sato S, Tabata S, Hirakawa H, Asamizu E, Shirasawa K, Isobe S,
et al. 2012. The tomato genome sequence provides insights
into fleshy fruit evolution. Nature 485: 635–641.
Singleton VL, Rossi JA. 1965. Colorimetry of total phenolics with
phosphomolybdic-phosphotungstic acid reagents. Am J Enol
Viticult. 16: 144–158.
Tanksley SD, McCouch SR. 1997. Seed banks and molecular
maps: Unlocking genetic potential from the wild. Science 277:
1063–1066.
Vasco M, De Stefano R, Di Matteo A, Punzo B, Molisso M, Lotti
C, et al. 2011. Candidate genes controlling fruit quality in a
tomato introgression line tolerant to water deficit. Joint
Meeting AGI-SIBV-SIGA, 19–22 September 2011, Cittadella
di Assisi (Italy); pp. 6A.48.
Vitale L, Arena C, Carillo P, Di Tommasi P, Mesolella B, Nacca F,
et al 2011. Gas exchange and leaf metabolism of irrigated
maize at different growth stages. Plant Biosyst. 145(2):
485–494.
Xu Z, Zhou G, Shimizu H. 2010. Plant response to drought and
rewatering. Plant Signal Behav. 5: 649–654.
10 M. M. Rigano et al.
Dow
nloa
ded
by [
151.
75.1
7.22
3] a
t 07:
25 1
2 Ja
nuar
y 20
15