Embed Size (px)
Citation preview
UNIVERSITY OF NAPLES FEDERICO II
Department of Chemical, Materials and Production Engineering
PhD Thesis in
Innovative Technologies for Materials, Sensors and Imaging
28th cycle
Sol-gel synthesis of inorganic and hybrid transition
metal oxides based materials
Luciana Minieri
Tutor: Coordinator:
Prof. Antonio Aronne Prof. Antonio Cassinese
May 2016

1
CONTENTS
INTRODUCTION p. 3
PUBLICATIONS p. 16 CHAPTER 1: SOL−GEL
1.1 Sol-Gel Technology p. 19
1.2 Sol-gel Chemistry p. 21
1.3 Role of organic ligands p. 26
1.4 Role of surfactant agent p. 29
CHAPTER 2: EXPERIMENTAL SECTION
2.1 ZrO2-acetylacetonate (HSGZ) p. 31
2.2 Nb2O5•SiO2 and Ru/RuO2@Nb2O5∙SiO2 p. 35
CHAPTER 3: RESULTS AND DISCUSSION - PART 1
3.1 ZrO2-acac hybrid material p. 43
3.2 Thermal and structural characterization p. 43
3.3 Technological applications p. 53
3.3.1 Long-Term Application p. 60
RESULTS AND DISCUSSION - PART 2A
3.4 Nb2O5•SiO2 mixed oxides p. 63
3.5 Structural and morphological characterization p. 64
3.6 Catalytic activity: methyl oleate epoxidation p. 68
RESULTS AND DISCUSSION - PART 2B
3.7 Ru/RuO2@Nb2O5•SiO2 (RNS) bifuctional mixed oxides p. 71
3.8 Thermal, structural and morphological characterization p. 71
3.9 Catalytic activity: Levulinic Acid (LA) hydrogenation p. 81

2
CONCLUSION p. 87
REFERENCES p. 90
3
INTRODUCTION
Nowadays, nanomaterials have received much attention because of their potential
applications in various fields. Among them, electrochemical energy storage/conversion
device and catalysis have attracted a lot of interest.
Nanomaterials employed as catalysts can be synthesized by either top-down or bottom-
up methods.
Among top-down methods, coprecipitation, impregnation and grafting should be
mentioned, in which the active phase is dispersed on the surface of an inert support. In
these synthesis procedures the support and the active phase are synthetized separately,
making difficult to avoid the segregation of the latter, especially at high content.
Compared with such methods, the sol-gel (bottom-up approach) exhibits many
advantages, such as the high control of purity and composition of the final product, the
low temperature process, fine tuning of microstructure as well as textural properties of the
final material.
The research activity of this PhD project was focused on the preparation by sol-gel
synthesis of two important classes of porous materials containing transition-metal oxides:
hybrid organic-inorganic and inorganic materials. These materials act as heterogeneous
catalysts in several reaction of industrial interest. Thermal, structural and morphological
analysis will be also performed in order to optimize the characteristics of these solids in
view of their use in technological applications.
ZrO2-based organic-inorganic hybrid materials
In the last years, among possible applications of doped and defective transition-metal
oxides, advanced oxidation processes (AOPs) have been widely used for the wastewaters
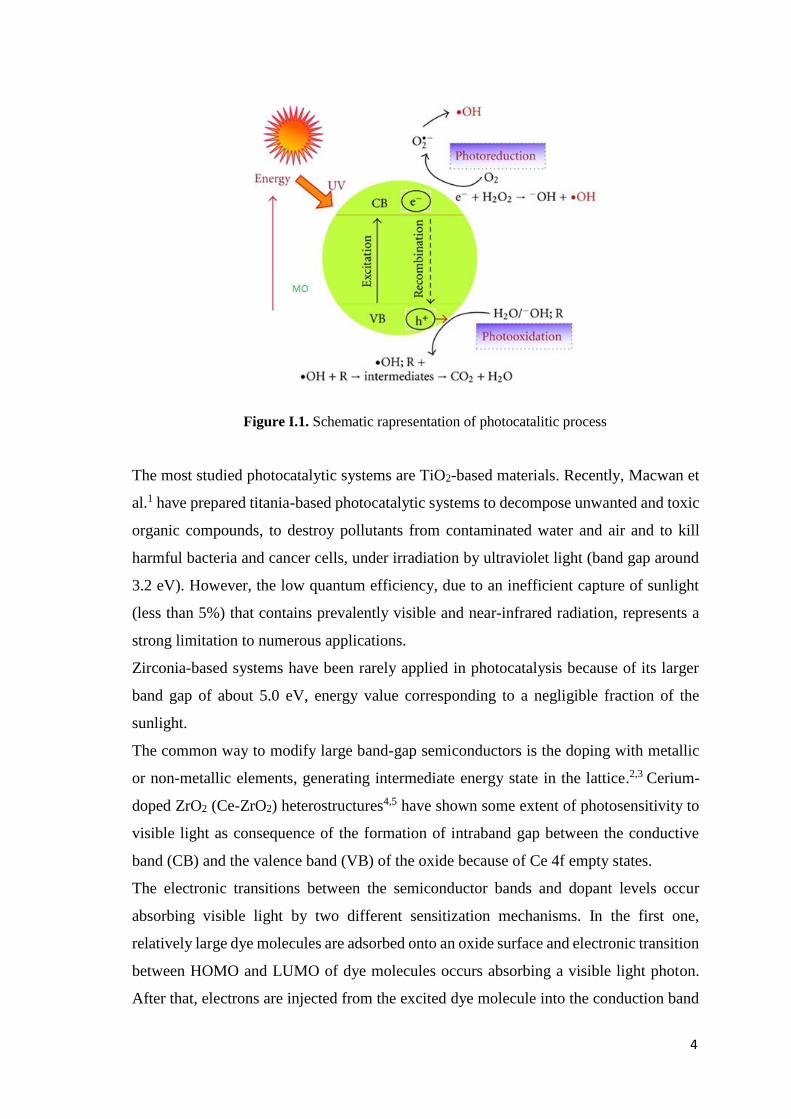
treatment. The prototypical mechanism involves catalyst photoexcitation and subsequent
formation of ‘Reactive Oxygen Species’ (ROS) that act as oxidant agents.
4
Figure I.1. Schematic rapresentation of photocatalitic process
The most studied photocatalytic systems are TiO2-based materials. Recently, Macwan et
al.1 have prepared titania-based photocatalytic systems to decompose unwanted and toxic
organic compounds, to destroy pollutants from contaminated water and air and to kill
harmful bacteria and cancer cells, under irradiation by ultraviolet light (band gap around
3.2 eV). However, the low quantum efficiency, due to an inefficient capture of sunlight
(less than 5%) that contains prevalently visible and near-infrared radiation, represents a
strong limitation to numerous applications.
Zirconia-based systems have been rarely applied in photocatalysis because of its larger
band gap of about 5.0 eV, energy value corresponding to a negligible fraction of the
sunlight.
The common way to modify large band-gap semiconductors is the doping with metallic
or non-metallic elements, generating intermediate energy state in the lattice.2,3 Cerium-
doped ZrO2 (Ce-ZrO2) heterostructures4,5 have shown some extent of photosensitivity to
visible light as consequence of the formation of intraband gap between the conductive
band (CB) and the valence band (VB) of the oxide because of Ce 4f empty states.
The electronic transitions between the semiconductor bands and dopant levels occur
absorbing visible light by two different sensitization mechanisms. In the first one,
relatively large dye molecules are adsorbed onto an oxide surface and electronic transition
between HOMO and LUMO of dye molecules occurs absorbing a visible light photon.
After that, electrons are injected from the excited dye molecule into the conduction band
5
of the semiconductor. This first mechanism has been extensively studied in common dye-
sensitized solar cells.6-8 In the second mechanism, relatively small organic molecules
(dopant) adsorbed on the oxide surface form a charge transfer (CT) complex that absorbs
in the visible region at energy lower than either the chelating molecules or the oxide
particles. In this case, direct injection of an electron from the ground state of the molecule
into the conduction band of the oxide occurs without the involvement of any excited
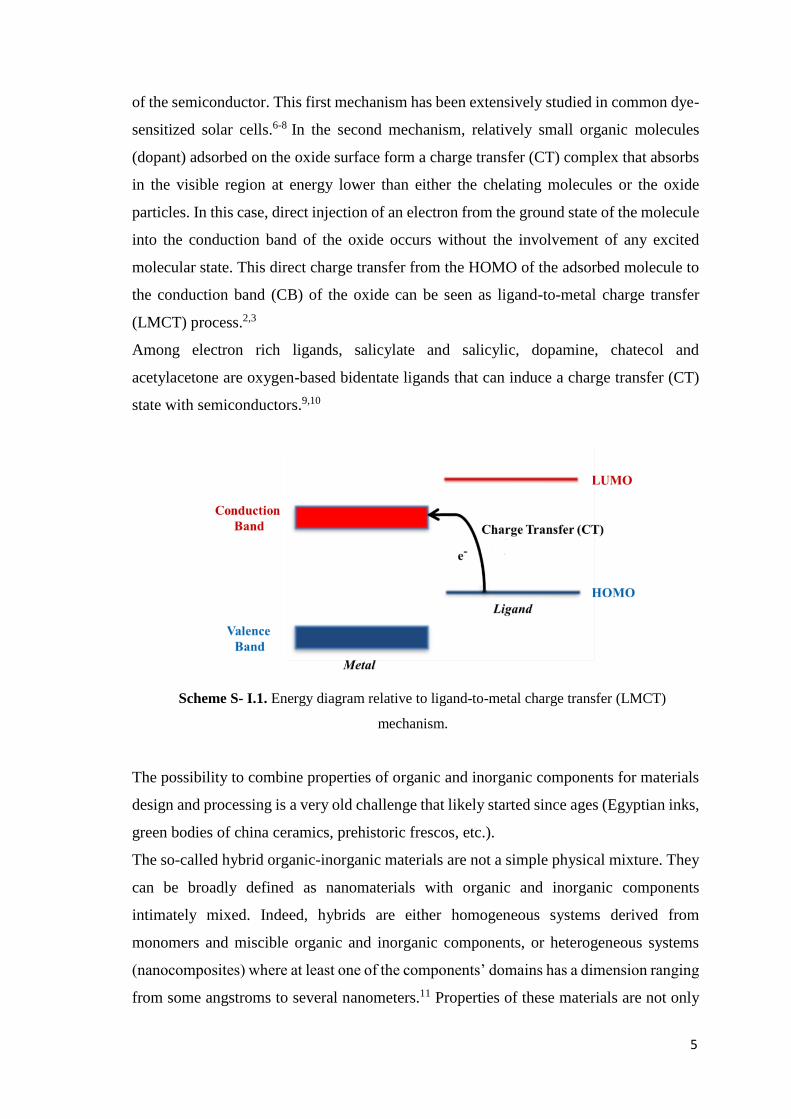
molecular state. This direct charge transfer from the HOMO of the adsorbed molecule to
the conduction band (CB) of the oxide can be seen as ligand-to-metal charge transfer
(LMCT) process.2,3
Among electron rich ligands, salicylate and salicylic, dopamine, chatecol and
acetylacetone are oxygen-based bidentate ligands that can induce a charge transfer (CT)
state with semiconductors.9,10
Scheme S- I.1. Energy diagram relative to ligand-to-metal charge transfer (LMCT)
mechanism.
The possibility to combine properties of organic and inorganic components for materials
design and processing is a very old challenge that likely started since ages (Egyptian inks,
green bodies of china ceramics, prehistoric frescos, etc.).
The so-called hybrid organic-inorganic materials are not a simple physical mixture. They
can be broadly defined as nanomaterials with organic and inorganic components
intimately mixed. Indeed, hybrids are either homogeneous systems derived from
monomers and miscible organic and inorganic components, or heterogeneous systems
(nanocomposites) where at least one of the components’ domains has a dimension ranging
from some angstroms to several nanometers.11 Properties of these materials are not only
6
the sum of the individual contributions of both phases, but the role of the inner interfaces
could be predominant. However, the concept of ‘‘hybrid organic-inorganic’’
nanomaterials exploded only in the eighties with the expansion of soft inorganic chemistry
processes and its development is one of the big achievements of sol-gel science. Indeed,
the mild synthetic conditions offered by the sol-gel process (metal alkoxide precursors,
organic solvents, low processing temperatures, processing versatility of the colloidal
state) allow the mixing of inorganic and organic components at the nanometric scale.12
Since then, the study of so-called functional hybrid nanocomposites became a field of
investigation in rapid growth yielding innovative advanced materials with high added
value.
These materials being at the interface of organic and inorganic realms are highly versatile
offering a wide range of possibilities to elaborate tailor-made materials in terms of
processing and chemical and physical properties.13 They can be divided into two distinct
classes based on the nature of the interface.11
Class I, organic and inorganic components are embedded and only weak bonds (hydrogen
or van der Waals bonds) give the cohesion to the whole structure.
Class II materials, the two phases are linked together through strong chemical bonds
(covalent or iono-covalent bonds).
Organic-inorganic hybrids can be applied in many areas of materials chemistry because
they are simple to process and are amenable to design on the molecular scale. The most
important advantage offered by these materials is the possibility of combining the
mechanical, thermal, and structural stability of a rigid inorganic framework together with
the high reactivity of the organic component. Hybrid materials have already found
numerous applications such as: smart membranes, new catalysts and sensors, new
generation of photovoltaic and fuel cells, smart microelectronic, micro-optical and
photonic components and systems, or intelligent therapeutic vectors that combine
targeting, imaging, therapy and controlled release properties.14
In the 2011 Chem. Soc. Rev. themed issue devoted to hybrid materials,15 the preparation
methods, the properties and the applications of hybrid organic-inorganic materials have
been extensively reviewed.
Recently, many researchers have prepared hybrid zirconia-based materials by sol-gel.
Acetylacetone (2,4-pentanedione, Hacac) is often used in the sol-gel procedure to control
the reactivity of the zirconium precursors, such as zirconium(IV) propoxide (Zr(OPr)4).
7
The influence of β-diketones, including Hacac, on the hydrolysis of zirconium alkoxides
has been widely studied.11,16-24
In 2012 Georgieva et al.25 have synthesized hybrid zirconia materials modified with
Hacac by sol-gel route. They have demonstrated that modifying agents like Hacac and
nitric acid decrease the optical band gap of the sol-gel zirconia from about 5 eV to about
3 eV.
Despite numerous investigations, however, the chemistry and structure of Zr(IV)-
acetylacetonate (Zr(IV)-acac) complexes in zirconia gels and during gelation are not well
understood. As a matter of fact, doping the solution of precursors with Hacac, a clearly
visible change from transparent to yellow-brown color occurs. This color is caused by the
Zr(IV)-acac complex formation during hydrolysis in the liquid (sol) state, which exhibits
strong absorption in the UV region and low-intensity absorption in the visible spectral
region.26
Therefore, the experimental conditions and the precursors determine the characteristics of
the hybrid zirconia gel-derived. The formation of chemical homogeneous gels depends on
the sol stabilization. Two mechanisms have been proposed to explain this stabilization. A
first mechanism is based on the hypothesis that the kinetic control is exerted by the
modifying chelating ligand on hydrolysis and polycondensation reactions of zirconium
alkoxide. According to this mechanism, chelating ligands block the Zr4+ coordination sites
decreasing the rate of hydrolysis and polycondensation.11,16,19,20
A more recent interpretation has been suggested by Kessler et al.,22 and supported by
papers recently published.23,24 According to this interpretation, chelating ligands, on the
contrary, increase the rate of hydrolysis and polycondensation giving nanoparticles,
formed by oxo-clusters (core) containing acac ligands on the surface (shell), that exhibit
a typical structure of micelles. The stabilization of sol is obtained as a consequence of the
interfacial activity of these micelles.22 Therefore, it is very important to choose a suitable
Hacac/Zr molar ratio (ρ) value. Using an appropriate ρ value, the formation of a
homogeneous gel at room temperature, occurs. On the contrary, when the Hacac is not
used, the instantaneous precipitation of a particulate gel occurs. It should be emphasized
that when ρ is equal to 4 the formation of Zirconium(IV) 2,4-pentanedionate, Zr(acac)4,
occurs. This is the more stable Zr-acetylacetonate complex at room temperature, as it
contains fully saturated eight-coordinate Zr4+ in a square antiprismatic structure.27,28
It has recently been shown by Weiss et al.24 that in this complex the interfacial activity of
acac ligands is not sufficient to prevent the hydrolysis and polycondensations.
8
Consequently, when the Hacac is used to control the reactivity of a zirconium alkoxide,
the ρ value must be properly optimized according to the chemical species that are present
in the reaction medium and, in any case, it must be far from the Zr(acac)4 stoichiometric
one.29
Aronne et al.30 have synthetized a class II ZrO2-acac hybrid material in which Hacac was
used in the sol-gel synthesis with a suitable Hacac/Zr molar ratio (ρ) value in order to
control the reactivity of the zirconium precursor, zirconium(IV) propoxide (Zr(OPr)4).
Acac ligands are strongly anchored to the zirconium oxo-oligomeric clusters forming the
wet gel, even after the hydrolysis step.
This material was tested in removal and degradation of phenantrene, polycyclic aromatic
hydrocarbon (PAH). This class of materials exhibits high stability and low water solubility
due to the delocalization of π-electrons, leading to their accumulation in food chains, so
threatening human health and environment quality. In addition, they are present in air,
soil and waters; therefore, the removal of PAHs and the development of effective
strategies to remediate polluted sites is a current focus of research in the environmental
science. In the last decades many attempts have been made to remove PAHs from the
environment.
Photocatalysis by either solar energy or artificial light has emerged as one of the most
attractive strategies for their degradation.
With the aim to implement the potentiality of the hybrid Zr-based systems, part of my
research activity was devoted to the preparation of ZrO2-acac gel-derived (HSGZ)
material according to the synthesis procedure used by Aronne et al.30 In these conditions,
a highly homogeneous porous material in which the functionalities are extended to whole
bulk material at the atomic scale, was obtained. In order to better understand the high
stability of this complex, a detailed thermal and structural characterization was
investigated, by different performing techniques.
In addition, this material was tested in the oxidative degradation of four different phenoxy
herbicides (2-methyl-4-chlorophenoxyacetic acid (MCPA), 4-(4-chloro-2-
methylphenoxy)butanoic acid (MCPB), 4-chlorophenoxyacetic acid (4-CPA) and 2,4-
dichlorophenoxyacetic acid (2,4 D)) and a two-steps kinetic model has been proposed to
evaluate their removal.
Finally, in order to clarify the mechanism of action of this catalyst, the physic-chemical
properties were investigated by using suitable spectroscopic techniques, such as electron
paramagnetic resonance (EPR). The promising results about the striking capability of this
9
material to catalyze oxidative degradation reactions in absence of light and without any
thermal pretreatment are later reported.
Niobium-based inorganic mixed oxides
Nb2O5-SiO2 materials
Niobium based materials synthesized by the sol-gel method have attracted great interest
for their potential applications such as heterogeneous acid catalysts31-33 especially when a
high acidity and water tolerance are needed (e.g. epoxidation, esterification, dehydration
and hydrolysis reactions),34-36 supports for biomolecule immobilization37 and energetic
materials. 38
Niobium pentoxide (also known as niobic acid when fully hydrated) represents the most
studied oxide of niobium. It has a crystalline nature and a low surface area; therefore,
when it is employed for catalytic purposes, it must be supported on suitable supports in
order to obtain a final material characterized by a high specific surface area.
Therefore, the crystallization behavior of the niobium pentoxide supported both on
siloxane matrix39,40 and on silica-alumina41 has attracted interest. In fact, different
niobium surface species (isolated or bulk) can be formed depending on the nature and
properties of the support material as well as niobium precursors, niobium content and
synthesis method.
The suitable choice of molecular precursors with a comparable hydrolysis rate is of critical
importance to obtain on homogeneous gel. Tetraethoxysilane (TEOS), or alkil-
alkoxysilane and niobium (V) ethoxide, Nb(OC2H5)5, or niobium chloride, NbCl5, are the
most used as silicon and niobium source, respectively.
Niobium ions (Nb5+) in aqueous environment, undergo rapid hydrolysis giving rise to a
precipitate of hydrated niobium pentoxide, Nb2O5∙nH2O. To prevent this phenomenon,
the use of chelating agents, such as ethylenediaminetetracetic, citric and malic acids, 2,4-
pentanedione, acetylacetone or organic epoxides, represents a value strategy.38,42,43
The complex chemical behavior of niobium ions makes possible to obtain materials with
different structural characteristics using slight differences in the synthesis procedure.
Francisco and Gushikem31 prepared Nb2O5-SiO2 composites using TEOS and NbCl5 as
molecular precursor of silicon and niobium, respectively. The synthesis procedure
employed, require both the TEOS prehydrolysis and a suitable amount of HCl to obtain
10
gelation. In addition, they have operated under a N2 atmosphere at high temperature to
have a slow solvents evaporation.
Drake et al.34 synthesized Nb2O5-SiO2 mixed oxides using niobium ethoxide as niobium
source. In this case, TEOS prehydrolysis is employed to have a homogenous gel, too. The
complete removal of solvents is obtained under vacuum for 24 h. These authors showed
that the structure of the gels at low Nb2O5 contents (∼ 3.0 and 7.5 % at.) did not give Nb–
O–Nb bonds but all niobium is uniformly distributed throughout the siloxane network.
These bonds were found only in the gel with a higher amount of Nb2O5 (∼ 30 % at.)
showing that the structure of this sample is phase separated on the atomic scale containing
domains of Nb2O5 and SiO2.
Carniti et al.44 produced Nb2O5-SiO2 systems using the method proposed by Drake et al.
with the addition of a defined amount of tetrapropylammonium hydroxide ((C3H7)4-OH,
TPAOH, 20 mass % in water) to obtain a complete gelation.
In the last years, Aronne et al.40 also synthesized Nb2O5-SiO2 mixed oxides by sol-gel
route. They obtained homogeneous gels operating in air at room temperature using TEOS
and NbCl5 as silicon and niobium source, respectively, without addition of complexing
agents. The procedure employed is innovative with respect to the ones previously reported
in the lack of TEOS prehydrolysis and the absence of specific agent adopted to speed up
the gelation. In addition, the hydrochloride acid (HCl) is employed because it acts both as
catalyst and as complexing agent of the Nb5+ ion allowing to obtain transparent chemical
gels at room temperature with high niobium dispersion.
The experimental data carried out by Aronne et al.40 showed that the different niobium
loading did not affect significantly the gelation time but strongly influenced the
microstructure of the gel-derived samples. Actually, the progressive increase of niobium
content favors the self-condensation of niobium oxo oligomers with respect to the cross-
condensation. Specifically, increasing the niobium content (∼ 20 % at.), the formation of
niobia and silica nanodomains will be favored in the gel structure. In contrast, for
materials containing a lower amount of niobium (∼ 2.5 % at.), the cross-condensation
prevails producing a homogeneous dispersion of niobium in the siloxane matrix.
Therefore, the degree of niobium dispersion is strongly influenced by the Nb/Si ratio. This
ratio influences the niobium coordination in the matrix and the tendency towards
crystallization as well.
11
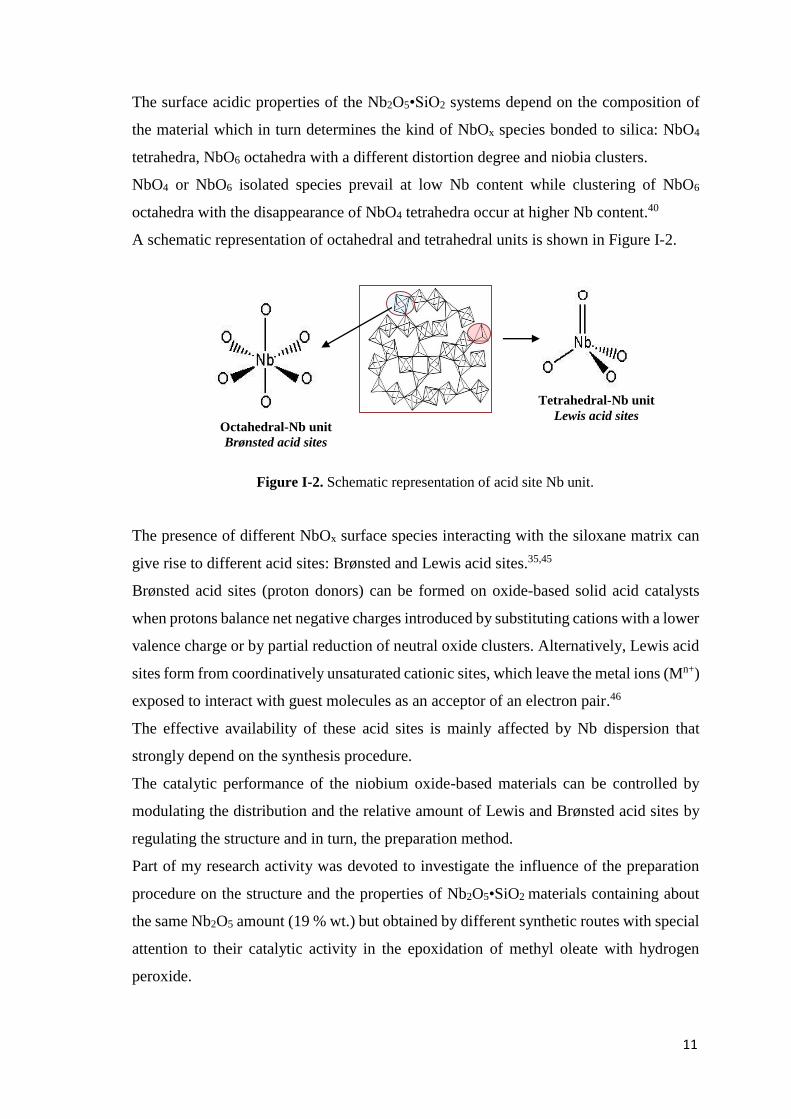
The surface acidic properties of the Nb2O5•SiO2 systems depend on the composition of
the material which in turn determines the kind of NbOx species bonded to silica: NbO4
tetrahedra, NbO6 octahedra with a different distortion degree and niobia clusters.
NbO4 or NbO6 isolated species prevail at low Nb content while clustering of NbO6
octahedra with the disappearance of NbO4 tetrahedra occur at higher Nb content.40
A schematic representation of octahedral and tetrahedral units is shown in Figure I-2.
Figure I-2. Schematic representation of acid site Nb unit.
The presence of different NbOx surface species interacting with the siloxane matrix can
give rise to different acid sites: Brønsted and Lewis acid sites.35,45
Brønsted acid sites (proton donors) can be formed on oxide-based solid acid catalysts
when protons balance net negative charges introduced by substituting cations with a lower
valence charge or by partial reduction of neutral oxide clusters. Alternatively, Lewis acid
sites form from coordinatively unsaturated cationic sites, which leave the metal ions (Mn+)
exposed to interact with guest molecules as an acceptor of an electron pair.46
The effective availability of these acid sites is mainly affected by Nb dispersion that
strongly depend on the synthesis procedure.
The catalytic performance of the niobium oxide-based materials can be controlled by
modulating the distribution and the relative amount of Lewis and Brønsted acid sites by
regulating the structure and in turn, the preparation method.
Part of my research activity was devoted to investigate the influence of the preparation
procedure on the structure and the properties of Nb2O5•SiO2 materials containing about
the same Nb2O5 amount (19 % wt.) but obtained by different synthetic routes with special
attention to their catalytic activity in the epoxidation of methyl oleate with hydrogen
peroxide.
Octahedral-Nb unit
Brønsted acid sites
Tetrahedral-Nb unit
Lewis acid sites
12
Ru/RuO2@Nb2O5-SiO2 materials
Nowadays, increasing energy demands coupled with decreasing reserves of fossil
resources (non-renewable) has led to increasing interest in the use of biomass based raw
materials as an energy source.47
Biomass is an inexpensive, renewable, and abundant source of carbon which can be
converted to liquid, solid and gaseous fuels and fine chemicals. Biomass-based platform
molecules are important bridges linking biomass raw materials and target products.
Therefore, utilization of biomass to produce valuable biofuels and feedstock chemicals is
one of the promising alternatives to the current petroleum-based chemical industrial
technologies.48,49 The development of simple, efficient and cost-effective processes for
the preparation of platform molecules and their further conversion to fuels and chemicals
are crucial to the improvement of the competitiveness of biomass resources relative to
fossil resources.
Lignocellulosic biomass is the most abundant class of biomass consisting of three main
components: cellulose, hemicellulose and lignin.50
Cellulose can be converted into glucose by chemical or enzymatic hydrolysis and can be
used to produce ethanol, platform chemicals, such as levulinic acid (LA) and 5-
hydroxymethylfurfural (HMF), and liquid fuels.
Hemicellulose is an amorphous polymer consisting of C5 and C6 sugars. It is more
reactive than cellulose, is easier to remove from lignocellulosic biomass, and is typically
associated with the production of xylitol, furfural, and furfural derivatives.
The final component of lignocellulosic biomass is lignin, an amorphous polymer rich in
aromatic monomers.51
One of the main challenges in converting lignocellulosic biomass is producing chemicals
or fuels at high selectivity and yields at economical costs.
Single-step methods, like pyrolysis, rely on high temperatures to deconstruct the
lignocellulosic biomass and lead to lower costs due to the lack of pretreatment steps,
excluding drying and size reduction. Additional costs are required, however, for the
downstream separations.
To control the reactivity and improve selectivity, two-step processing methods are
typically employed. These methods first fractionate the lignocellulosic biomass into its
main components (hemicellulose, cellulose and lignin) which allows for processing each
fraction at different conditions to achieve high yields of target products. The highly
functionalized and reactive molecules (mainly C6 and C5 sugars) are processed at mild
13
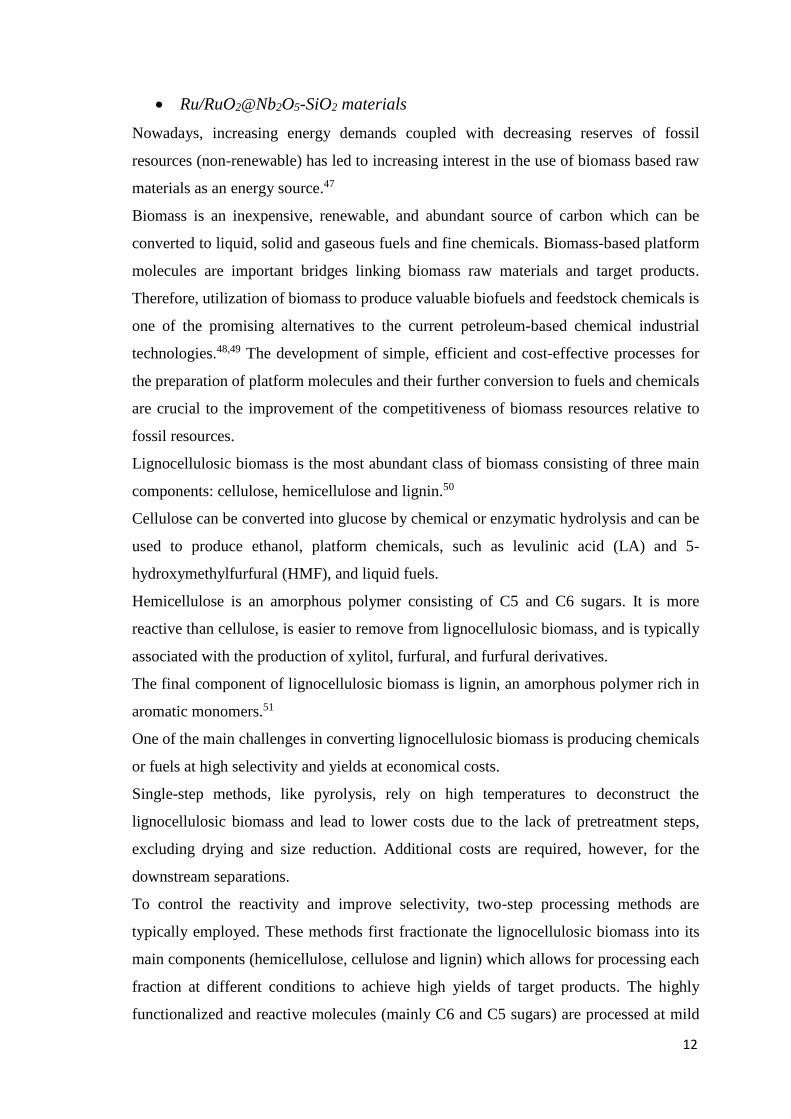
conditions to obtain intermediate molecules (Scheme S- I.2), which are less reactive than
the original sugars and therefore, more stable, yet they have enough functionality to be
used as building blocks to produce a variety of chemicals and fuels depending on the
necessities of the market.51
Scheme S-I.2. Fractionation of lignocellulosic biomass and reaction pathways to produce
GVL from hemicellulose and cellulose.
According to the U.S. Department of Energy, in 2004, one of the most promising building
blocks is levulinic acid (LA). It can be produced (in combination with formic acid) from
cellulose, starch, or C6 sugars by acid hydrolysis through 5-hydroxymethylfurfural (5-
HMF) as an intermediate, and from hemicellulose in a 3 step process through furfural and
furfuryl alcohol as intermediates (Scheme S-I.2) at low cost.
Additionally, furfuryl alcohol and LA can be esterified with ethanol to produce ethyl
levulinate. The ethyl levulinate and LA can then be hydrogenated to γ-valerolactone
(GVL) which has excellent properties as solvent and is a precursor for high value
chemicals and fuels. Being able to upgrade both the cellulose and hemicellulose to LA
and then to GVL improves the economics of converting biomass, leading researchers to
find more uses for these chemicals and more efficient processing methods. Recently, the
transformation of LA into GVL has extensively studied and heterogeneous Ru-based
14
catalysts resulted active and selective for this reaction especially under aqueous phase
conditions.52-58 Although very high conversion and selectivity was found using activated
carbon supported ruthenium (Ru/C) catalysts, they suffer from continuous deactivation
during recycling. To overcome this inconvenient different supports have been explored
such as Al2O3 together with acid co-catalysts52, Al2O352-54, hydroxyapatite55, TiO2
53,56,
ZrO257, Zr-SiO2
49, SiO253, and a few layer of grapheme58 even if the deactivation of
catalyst seems to be still an unresolved problem especially for reaction occurring in an
upflow packed bed reactor53. Two deactivation modes were proposed: the irreversible one,
related to the sintering of the metal nanoparticles, and the reversible one the source of
which appears still unclear53.
To date, most used procedures to synthesize these catalysts are wet impregnation and the
sol-gel route.49,59-61
Jansat et al.59 have prepared RuO2@SiO2 materials using hybrid mesostructured silica
matrix functionalized with phosphonate groups to foster anchoring of the metal precursor
inside the pores of the matrix. These materials were synthesized by more
impregnation/hydrogenation cycles. Zhang et al.60 have prepared nanoparticulate (NP)
RuO2 loaded into a commercial mesoporous silica. Lo et al.61 have synthesized various
SiO2 : RuO2 ratios by a wet chemical method using a preformed mesoporous silica matrix
as template for metal precursor. More recently, Kuwahara et al.49 have dispersed and
stabilized ruthenium nanoparticle (NP) in Zr-containing spherical mesoporous silicas.
Particularly, the supported Ru NP catalyst was synthesized by a conventional
impregnation method and a following reduction treatment in a flow of H2. Then, the
support was dispersed in aqueous solution containing the metal source. To facilitate the
incorporation of the Ru(III) ions into the support, vacuum conditions was applied. These
are only some examples of RuO2@SiO2 nanomaterials synthesized by wet routes.
An alternative synthetic approach succeeds in the preparation of Ru/RuO2@SiO2
nanocomposites via a co-synthesis sol-gel process, leading to the simultaneous formation
of the matrix and metal-ion doping. Matsura et al.62 have produced Ru/SiO2 and
RuO2/SiO2 hybrid nanomaterials with size-controlled ruthenium nanoparticles as
elemental bricks. This route takes advantage of the organometallic approach and the use
of a bifunctional ligand as metal precursor and a stabilizer for the synthesis of ruthenium
nanoparticles. Tristany et al.63 have synthesized a composite ruthenium-containing silica
nanomaterials starting from amine stabilized-ruthenium nanoparticles as elemental bricks.
15
Therefore, bifunctional ligands act both as nanoparticle stabilizers and as sol-gel
promoters.
However, both these methods are complicated, need a strictly controlled atmosphere,
present several reaction steps with unknown yields, are energy/time consuming and use
toxic or pollutant reactants. Therefore, it is of great significance to develop efficient and
inexpensive supported metal catalysts, which can achieve the selective conversion of LA
to GVL under mild conditions and the subsequent conversion of GVL.
Part of my research activity was focused on the preparation of new ruthenium-based
bifuctional catalyst, which can realize the transformation of LA to GVL in one-pot.
Ru/RuO2@Nb2O5•SiO2 mixed oxide was obtained by an innovative sol-gel route wholly
performed at room temperature and characterized by both easy handling of precursors and
the lack of toxic or pollutant reactants.
The mixed oxide matrix (Nb2O5•SiO2) containing a nominal amount of Nb2O5 equal to
10.2 % wt., was selected in order to realize a material that can acts as bifunctional catalyst
exhibiting both acidic and redox functionalities. Furthermore, the choice of the acidic
Nb2O5-SiO2 matrix offers the possibility to modulate the strength of the different acid
sites exhibiting both strong Brønsted acid sites and Lewis acid sites of moderate
strength35,36. Therefore, this system should exhibit both acidic and redox functionalities
in order to favor both the hydrogenation and the acid catalyzed steps in one-pot.
Ru/RuO2@Nb2O5-SiO2 nanomaterials were characterized by structural and
morphological analysis and were tested in the hydrogenation of LA to GVL when this
reaction was carried out under mild conditions and in aqueous environment in a fed batch
reactor.
The key factors controlling the catalyst efficiency are the selectivity, reproducibility and
longtime stability. These characteristics are satisfied only if the synthesis procedure
allows obtaining homogeneous dispersion, efficient immobilization of the active phase
inside the host matrix and high surface area. Here, the surface area and the morphological
characteristics of materials were controlled adding different amounts of a nonionic
surfactant (polyethylene glycol hexadecyl ether, Brij-C10) directly in the starting solution
of precursors. In this way, the surfactant can act both as pore-directing agent and as
oxygen-rich complexing agent of the metallic species. This approach can elegantly reduce
the number of processing steps and the operating cost. The influence of Brij-C10
incorporation on porous structure, size and dispersion of ruthenium nanoparticles were
investigated in detail.
16
PUBLICATIONS
Publications included in this PhD thesis
Papers
1. Muñoz-García, A. B.; Sannino, F.; Vitiello, G.; Pirozzi, D.; Minieri, L.; Aronne,
A.; Pernice, P.; Pavone, M.; D'Errico, G., Origin and Electronic Features of
Reactive Oxygen Species at Hybrid Zirconia-Acetylacetonate Interfaces, ACS
Applied Materials & Interfaces, 2015, 7, 21662-21667.
2. Sannino, F.; Pernice, P.; Minieri, L.; Camandona, G. A.; Aronne, A.; Pirozzi, D.;
Oxidative Degradation of Different Chlorinated Phenoxyalkanoic Acid
Herbicides by a Hybrid ZrO2 Gel-Derived Catalyst without Light Irradiation, ACS
Appl. Mater. Interfaces, 2015, 7, 256-263.
3. Turco R.; Aronne A.; Carniti P., Gervasini A.; Minieri L.; Pernice P.; Tesser R.;
Vitiello R.; Di Serio M., Influence of preparation methods and structure of
niobium oxide-based catalysts in the epoxidation reaction, Catalysis Today, 2015,
294, 99-103.
4. Minieri, L.; Esposito, S.; Russo, V.; Bonelli, B.; Di Serio, M.; Aronne, A.;
Silvestri, B., Sol-Gel Synthesis of Ru/RuO2@Nb2O5-SiO2 Nanomaterials as
Effective and Reusable Bifunctional Catalysts in the Aqueous-Phase
Hydrogenation of Levulinic Acid, submitted on ACS catalysis.
Conferences
5. Minieri, L.; Turco, R.; Gervasini, A.; Carniti, P.; Pernice, P.; Aronne, A.;
Esposito, S.; Di Serio, M., Preparation of niobium-silicon mixed oxides
nanocomposites as catalyst for epoxidation reaction, IX Workshop Sol-Gel,
Parma, Italy, 17-18 June 2014.
6. Minieri, L.; Sannino, F.; Pernice, P.; Pirozzi, D.; Imparato, C.; D'Errico, G.;
Vitiello, G.; Aronne, A., Hybrid ZrO2-acetylacetonate gel-derived material as
catalyst for pullutants removal, VI Workshop Nazionale AICIng, Rome, Italy, 22-
23 June 2015.
17
Publication not included in this PhD thesis
Papers
7. Sannino F.; Pernice P.; Imparato C.; Aronne A.; D'Errico G.; Minieri L.; Perfetti
M.; Pirozzi D., Hybrid TiO2–acetylacetonate amorphous gel derived material with
stably adsorbed superoxide radical active in oxidative degradation of organic
pollutants, RSC Advances, 2015, 5, 93831-93839.
8. Pirozzi, D.; Abagnale, M.; Minieri, L.; Pernice, P.; Aronne, A., In-situ modified
sol-gel process for the development of a monolith continuous microreactor for
enzymatic green reactions, submitted on Chem. Ing. J.
Conferences
9. Aronne, A.; Sannino, F.; Pirozzi, D.; D’errico, G.; Vitiello, G.; Minieri, L.;
Pernice, P., Synthesis of hybrid ZrO2-acetylacetonate gel-derived catalyst for
oxidative degradation of organic pollutants, IX Workshop Sol-Gel, Parma, Italy,
17-18 June 2014.
10. Turco, R.; Di Serio, M.; Tesser, R.; Minieri, L.; Pernice, P.; Aronne, A.,
Methylesters epoxidation catalyzed by novel niobium oxide based materials, VI
Workshop Nazionale AICIng, Rome, Italy, 22-23 June 2015.
11. Russo, V.; Minieri, L.; Tesser, R.; Aronne, A.; Di Serio, M., Ru-based catalysts
for γ-valerolactone synthesis, XIX Congresso Divisione Chimica Industriale,
Salerno, Italy, 14-16 September 2015.

18
CHAPTER 1
SOL-GEL
19
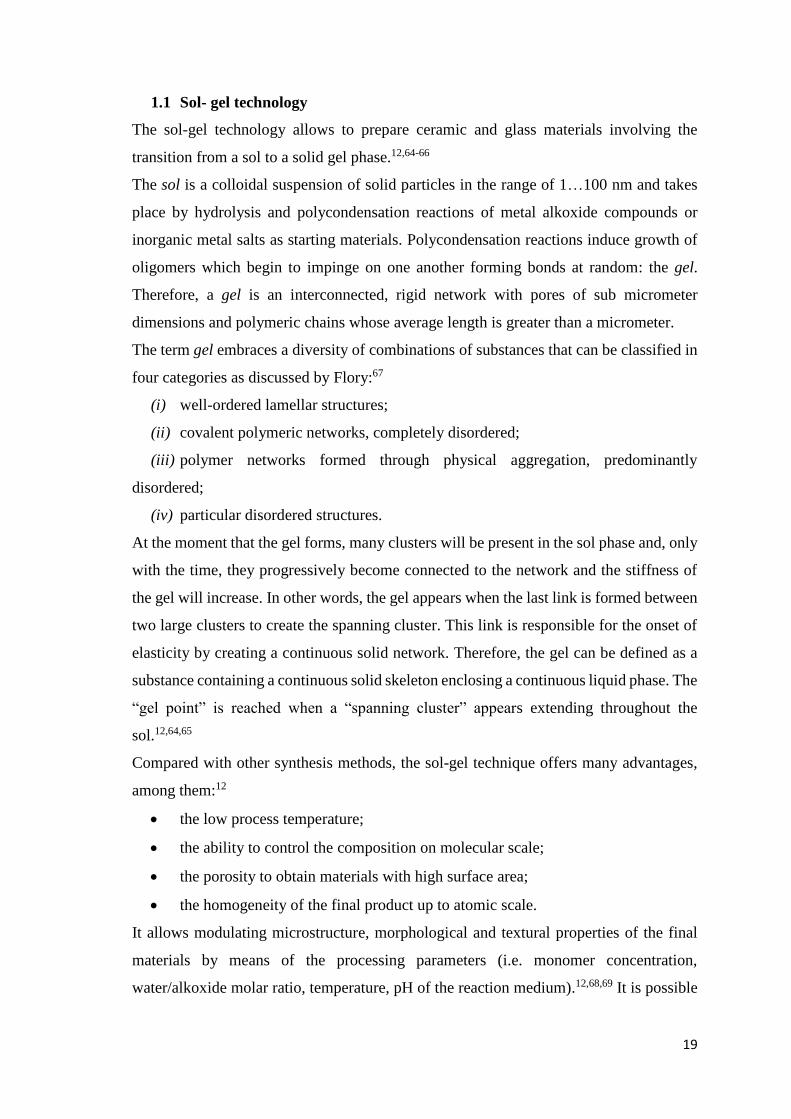
1.1 Sol- gel technology
The sol-gel technology allows to prepare ceramic and glass materials involving the
transition from a sol to a solid gel phase.12,64-66
The sol is a colloidal suspension of solid particles in the range of 1…100 nm and takes
place by hydrolysis and polycondensation reactions of metal alkoxide compounds or
inorganic metal salts as starting materials. Polycondensation reactions induce growth of
oligomers which begin to impinge on one another forming bonds at random: the gel.
Therefore, a gel is an interconnected, rigid network with pores of sub micrometer
dimensions and polymeric chains whose average length is greater than a micrometer.
The term gel embraces a diversity of combinations of substances that can be classified in
four categories as discussed by Flory:67
(i) well-ordered lamellar structures;
(ii) covalent polymeric networks, completely disordered;
(iii) polymer networks formed through physical aggregation, predominantly
disordered;
(iv) particular disordered structures.
At the moment that the gel forms, many clusters will be present in the sol phase and, only
with the time, they progressively become connected to the network and the stiffness of
the gel will increase. In other words, the gel appears when the last link is formed between
two large clusters to create the spanning cluster. This link is responsible for the onset of
elasticity by creating a continuous solid network. Therefore, the gel can be defined as a
substance containing a continuous solid skeleton enclosing a continuous liquid phase. The
“gel point” is reached when a “spanning cluster” appears extending throughout the
sol.12,64,65
Compared with other synthesis methods, the sol-gel technique offers many advantages,
among them:12
the low process temperature;
the ability to control the composition on molecular scale;
the porosity to obtain materials with high surface area;
the homogeneity of the final product up to atomic scale.
It allows modulating microstructure, morphological and textural properties of the final
materials by means of the processing parameters (i.e. monomer concentration,
water/alkoxide molar ratio, temperature, pH of the reaction medium).12,68,69 It is possible
20
to synthesize complex composition materials, to form higher purity products through the
use of high purity reagents, and to provide coatings over complex geometries.12,64,65
Moreover, the sol-gel process is a versatile wet chemical process to make ceramic and
glass materials not only as bulk samples but also in a wide variety of forms: ultra-fine or
spherical shaped powders, thin film coatings, ceramic fibres, microporous inorganic
membranes, monolithics, or extremely porous aerogels. Thin films can be produced by
spin-coating or dip-coating.
When the sol is cast into a mold, a wet gel will form. By suitable treatment, the wet gel
can be converted in lot of forms:
xerogel (dried gels), obtained to evaporation of the liquid in a wet gel under
normal conditions giving a volume 5 to 10 times smaller of the original gel volume;
aerogel materials, with a highly porous and extremely low density, produced by
removal of the solvent in a wet gel under supercritical condition, in autoclave;
dense ceramic or glass materials, generated by successive thermal treatments;
ceramic fibers, drawn adjusting the viscosity of the sol into a suitable viscosity
range;
ultra-fine and uniform ceramic powders, formed by precipitation, spray pyrolysis,
or emulsion techniques.
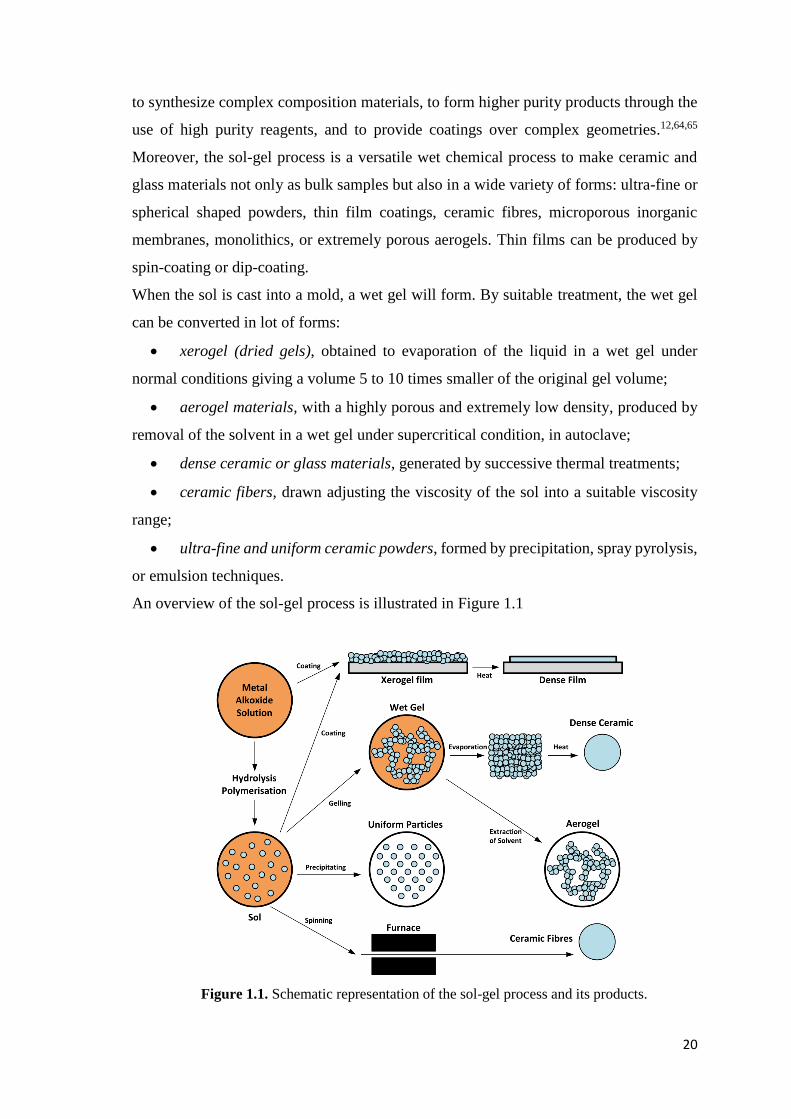
An overview of the sol-gel process is illustrated in Figure 1.1
Figure 1.1. Schematic representation of the sol-gel process and its products.
21
For mixed-oxides this synthesis procedure allows obtaining materials characterized by a
high dispersion of the minor component in the matrix of the major phase on both
molecular and nanometer scale.31,34,37,39,40
1.2 Sol-gel chemistry
Metallic alkoxides are the starting reagents more commonly used. Their general formula
is the following: Mx(OR)y, where M represents the element with valence y and R is the
alkoxide group. These alkoxides must exhibit useful properties to control the chemical
synthesis of oxides as:
1. easy to purify, a lot of alkoxides can be distilled in order to obtain highly pure
products;
2. wide variety of R, it is possible to choice R among a large number of alkylic groups
in order to obtain the required reactivity during hydrolysis and polycondensation
reactions;
3. wide variety of mixed alkoxides, as a further tool to control the stoichiometry and
the homogeneity of the final products.
For multi-component systems, the choice of the molecular precursors plays a key role in
the synthesis procedure. Actually, in order to obtain homogeneous sols, suitable
molecular precursors with comparable hydrolysis rates should be used. In this way, cross-
linking between clusters of different components with similar size will take place
allowing gelation instead of precipitation and/or co-precipitation. In the former case, gels
formed by permanent covalent bonds (chemical gels) are obtained; while in the latter,
particulate gels, i.e. gels where temporary o reversible bonds connect the clusters, can be
achieve (physical gels).40
The sol-gel transition involves two key steps, hydrolysis and polycondensation.
Generally, hydrolysis takes place by the addition of small amounts of water. Moreover,
when the precursors are insoluble in water, non-aqueous solvents such as alcohols, are
added in reaction medium to form a homogeneous solution.
In the hydrolysis reaction, the alkoxide groups (OR) are replaced stepwise by hydroxyl
groups (OH) by nucleophilic substitution (SN):70
M(OR)n + H
2O = M(OH)(OR)
n-1 + ROH (1.1)
22
The hydrolysis rate is determined by many factors. Indeed, it is facilitated by the increase
of the charge density on the metal, of the number of metal ions bridged by an hydroxo-
ligand (M-OH) or oxo-ones (M=O), and of the number of hydrogens contained in the
ligand.71,72
Conversely, hydrolysis is inhibited when the number of hydroxo-ligands coordinating M
increases. Therefore, in these conditions, the reverse reaction occurs. The temperature,
the pH, the different amount of solvent, the water/metal alkoxide molar ratio (r values)
could influence the hydrolysis reaction, too.
Due to high oxygen electronegativity compared to metal, the M-OR bonds are highly
polarized giving fast hydrolysis rate. Therefore, by increasing the number of OR groups
(hard-π donors), the stabilization of the highest oxidation state of M occurs making it
more susceptible to nucleophilic attack. On the contrary, the hydrolysis rate of non-metal-
oxygen bonds (e. g., in silicon alkoxides, Si(OR)4) is slower. In fact, the lower
electronegativity difference between the non-metal and the oxygen originates a lower
partial positive charge on the non-metal decreasing its electrophilic character. This effect
makes the non-metal more stable toward hydrolysis, condensation and other nucleophilic
reactions. The control of hydrolysis rate is very important when multi-component systems
(mixed oxides) are prepared. In fact, the choice of molecular precursors with comparable
hydrolysis rates plays a key role in obtaining of homogeneous sols in which cross-linking
are preferred to self-ones.
Many solutions can be adopted with the aim to obtain cross-linking, such as:
modifying the hydrolysis rate of the more reactive precursor via inhibitors;
using double alkoxides, with precise stoichiometry;
changing the hydrolysis rate of the slower precursor by a catalyzed pre-hydrolysis
(acid or basic).
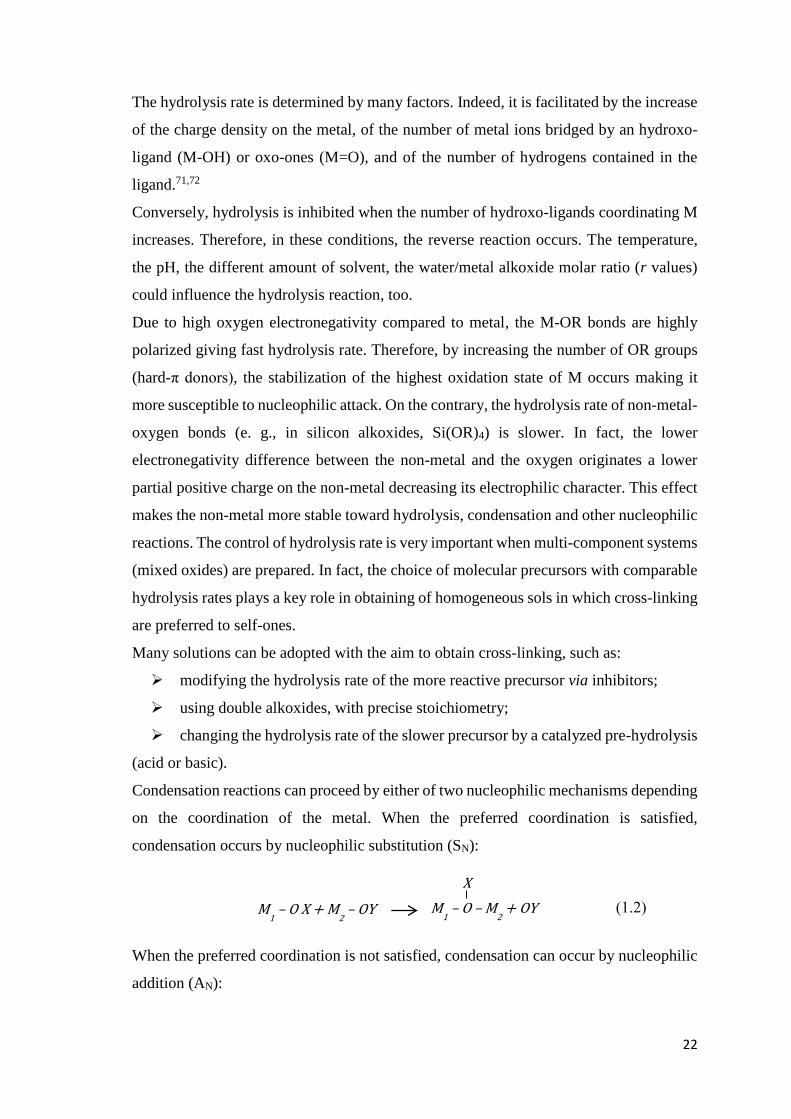
Condensation reactions can proceed by either of two nucleophilic mechanisms depending
on the coordination of the metal. When the preferred coordination is satisfied,
condensation occurs by nucleophilic substitution (SN):
When the preferred coordination is not satisfied, condensation can occur by nucleophilic
addition (AN):
M1 – O X + M
2 – OY M
1 – O – M
2 + OY
X
(1.2)
23
with an attendant increase in the coordination number of M2 occurs. Both reactions,
require that the coordination of oxygen increase from 2 to 3. Moreover, the creation of
the additional bond involves a lone pair electron on oxygen and the bond formed may or
not be equivalent to the other two bond.
According to the “partial charge model” (two atoms combine to form a charge transfer so
that each atom acquires a partial positive or negative charge), three different predominant
species can be obtained with suitable characteristics:
in the high-pH/high-z domain, oxo-ligands contained in oxy-ions [MON](2N-z)- (N
is the coordination number and z is the oxidation state) are good nucleophiles but poor
leaving groups. In these conditions, condensation occurs by addition when at least one of
the reactant species is coordinatively unsatured (maximum N value is less than the z one).
In the low-pH/low-z domain, aquo-ligands in aquo-ions [M(OH2)N]z+ are good
leaving groups but poor nucleophiles. Condensation does not occur since no attacking
group is present.
At intermediate pH and z values, hydroxo-ions [M(OH)N](N-z)- contain both good
nucleophiles (O or OH) and good leaving groups (H2O or OH). In these conditions,
condensation occurs as soon as one OH is present in the coordination sphere of M.
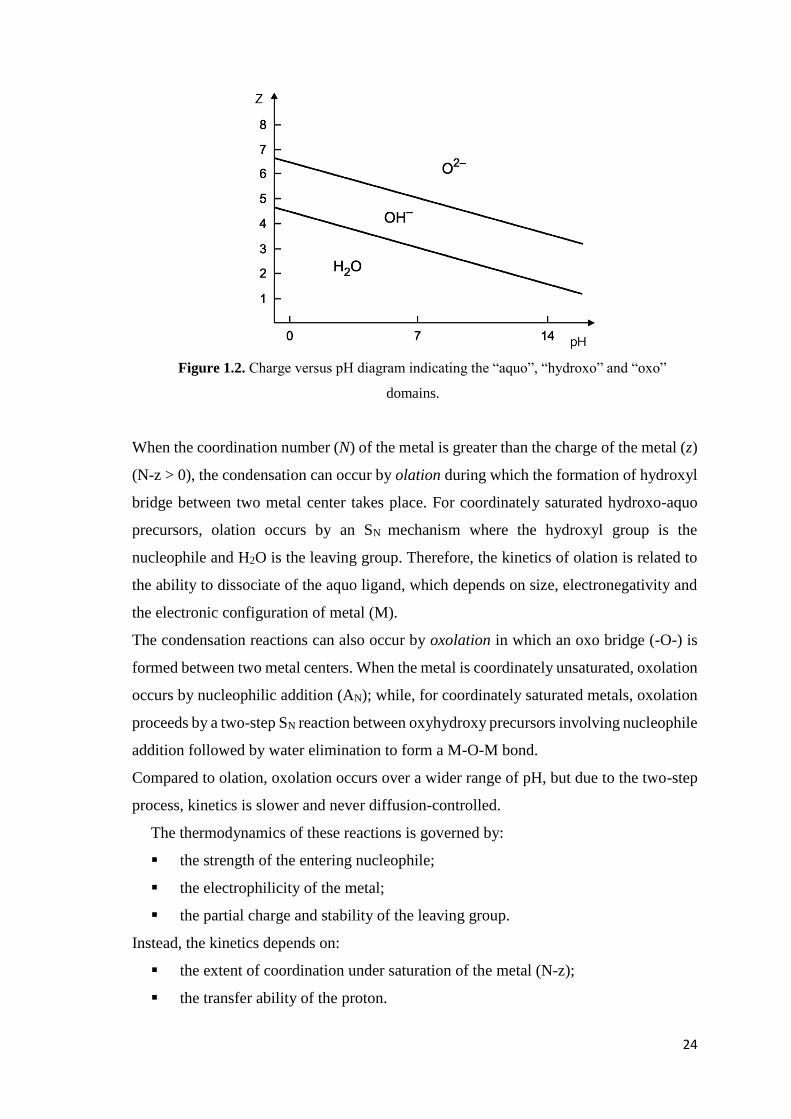
In Figure 1.2., the charge versus pH diagram displays the “aquo”, “hydroxo” and “oxo”
domains.
M1 – OX + M
2 – OY M
1 – O – M
2 – OY
X
(1.3)
24
Figure 1.2. Charge versus pH diagram indicating the “aquo”, “hydroxo” and “oxo”
domains.
When the coordination number (N) of the metal is greater than the charge of the metal (z)
(N-z > 0), the condensation can occur by olation during which the formation of hydroxyl
bridge between two metal center takes place. For coordinately saturated hydroxo-aquo
precursors, olation occurs by an SN mechanism where the hydroxyl group is the
nucleophile and H2O is the leaving group. Therefore, the kinetics of olation is related to
the ability to dissociate of the aquo ligand, which depends on size, electronegativity and
the electronic configuration of metal (M).
The condensation reactions can also occur by oxolation in which an oxo bridge (-O-) is
formed between two metal centers. When the metal is coordinately unsaturated, oxolation
occurs by nucleophilic addition (AN); while, for coordinately saturated metals, oxolation
proceeds by a two-step SN reaction between oxyhydroxy precursors involving nucleophile
addition followed by water elimination to form a M-O-M bond.
Compared to olation, oxolation occurs over a wider range of pH, but due to the two-step
process, kinetics is slower and never diffusion-controlled.
The thermodynamics of these reactions is governed by:
the strength of the entering nucleophile;
the electrophilicity of the metal;
the partial charge and stability of the leaving group.
Instead, the kinetics depends on:
the extent of coordination under saturation of the metal (N-z);
the transfer ability of the proton.
25
Therefore, larger values of (N-z) and greater acidities of the protons reduce the activation
barriers and enhance the kinetics.
Another factor that influences reaction kinetics is the extent of oligomerization
(molecular complexity) of the metal alkoxides. The molecular complexity depends on
both the nature of the metal atom and alkoxide ligand. The hydrolysis rate decreases with
the alkyl chain length consistent with the steric effect expected for an associative SN
reaction mechanism. The alkyl chain also influences the morphology (particle size and
surface area) and the crystallization behavior of the resulting gel.
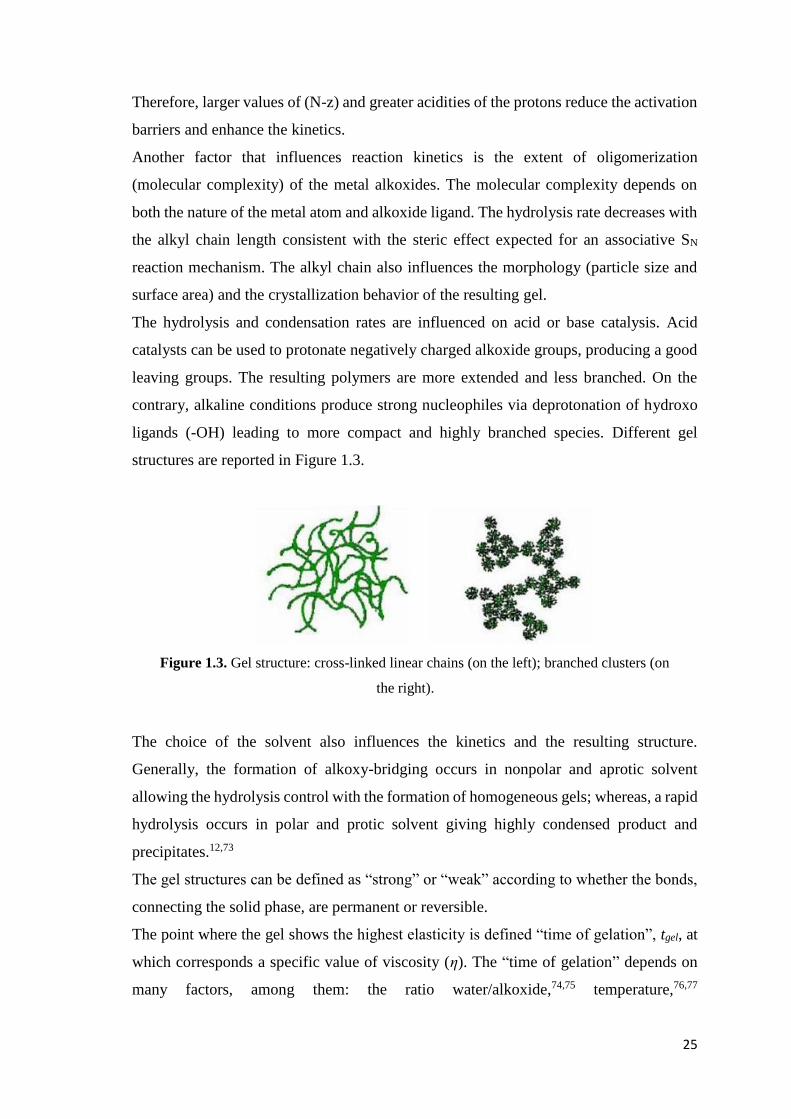
The hydrolysis and condensation rates are influenced on acid or base catalysis. Acid
catalysts can be used to protonate negatively charged alkoxide groups, producing a good
leaving groups. The resulting polymers are more extended and less branched. On the
contrary, alkaline conditions produce strong nucleophiles via deprotonation of hydroxo
ligands (-OH) leading to more compact and highly branched species. Different gel
structures are reported in Figure 1.3.
Figure 1.3. Gel structure: cross-linked linear chains (on the left); branched clusters (on
the right).
The choice of the solvent also influences the kinetics and the resulting structure.
Generally, the formation of alkoxy-bridging occurs in nonpolar and aprotic solvent
allowing the hydrolysis control with the formation of homogeneous gels; whereas, a rapid
hydrolysis occurs in polar and protic solvent giving highly condensed product and
precipitates.12,73
The gel structures can be defined as “strong” or “weak” according to whether the bonds,
connecting the solid phase, are permanent or reversible.
The point where the gel shows the highest elasticity is defined “time of gelation”, tgel, at
which corresponds a specific value of viscosity (η). The “time of gelation” depends on
many factors, among them: the ratio water/alkoxide,74,75 temperature,76,77
26
concentration75,78 and size of the alkoxide.79,80 When all these values increase, the time of
gelation decrease. Generally, tgel decreases by factors that increase the condensation rate.
After gelation, the chemical reaction carries on in the period called “aging” of the gel.
During the aging process, therefore, many changes occur in the structure and properties
of gels. These changes can be categorized as:12,66
Polymerization, is the increase in connectivity of the network produced by
condensation reactions which occur for months at room temperature;
Syneresis, is shrinkage of the gel network resulting in expulsion of liquid from the
pores. This process is caused by the same condensation reactions that produce the
gelation;
Coarsening or ripening, is a process which consists in the growth of particles in
aqueous conditions starting from aggregates restructured through dissolution-
reprecipitation in order to form larger and more stable particles, thereby consuming the
small primary particles.
Finally, to obtain a xerogel, the wet gel must be subjected to specific heating treatments
to avoid changing the structure of the synthetized material. The removal of solvent occurs
in several phases; initially, it is carried out with a constant evaporation rate during the
which the volume reduction is evident. In this phase, same cracks can be formed. Then,
the evaporation rate is carried on more slowly due to capillary pressure into pores caused
by several factors, such as the different temperature in and out material, the surface
tension and the vapor pressure.
1.3 Role of organic ligands
The choice of the molecular precursors plays a key role in the synthesis procedure. They
should have a comparable hydrolysis rates in order to obtain homogeneous sols.
Frequently, the reactivity of silicon and metal alkoxides towards water have to be
controlled, in order to achieve cross-linking between clusters of different components
instead of precipitates. For this purpose, chemical additives can be added during synthesis
procedure.
Metal alkoxides show a higher reactivity than silicon alkoxides, due to both their lower
electronegativity compared to silicon and to their coordination number higher than their
valence. Therefore, metal alkoxides are Lewis acids and they can interact with
compounds having a lone pair of electrons (Lewis bases) to achieve higher coordination
number. While catalysts are often needed to enhance the reactivity of silicon alkoxides in
27
sol–gel processes, chemical additives are used to moderate the reactivity of metal
alkoxides.81
In recent years, the reactivity of zirconium alkoxides, Zr(OR)4, has been study. These
species show a very high reactivity toward the hydrolysis-condensation reactions due to
the high polarity of Zr-O bond which in turn generates a positive partial charge on the
zirconium atom, making it very susceptible to nucleophilic attack. Therefore, the use of
bidentate (bridging or chelating) complexing ligands (BL), was frequently employed with
the aim to control the hydrolysis reaction rate of zirconium precursors avoiding the
development of a particulate gel.16,82
Particularly, when a metal alkoxide M(OR)x is reacted with acetic acid or acetylacetone
(BL-H), a fraction of the alkoxide groups is substituted by acetate or acetylacetonate
groups. A new molecular precursor M(OR)x-y(BL)y is obtained with a different structure
and a lower reactivity.81
The metal compounds M(OR)x-y(BL)y are coordination compounds (metal complexes),
the stability of which is determined by the equilibrium constant K, called also “stability
constant”. The higher the stability constant, i.e., the more the equilibrium is shifted to the
product side, the more stable is the metal complex with respect to ligand elimination
reactions. Multidentate ligands are more strongly bonded than the corresponding
monodentate ligands because of the chelate effect. In this conditions, the stability constant
of the corresponding complexes is much higher. As a result of the stronger bonding,
multidentate ligands are less readily hydrolyzed than the remaining OR groups upon sol-
gel processing. Although a partial cleavage of the metal-BL bond normally cannot be
avoided due to the coordination equilibrium mentioned above, a substantial proportion of
the BL can be retained in the obtained gels. The replacement of one or more OR groups
by BL has several chemical and structural consequences for sol-gel processing apart from
the fact that the new precursor M(OR)x-y(BL)y has a different reactivity. The chemical
and structural consequences during sol-gel process can be reported as following:81
the degree of crosslinking of the gel network is decreased, because of the smaller
proportion of hydrolyzable OR groups;
the substitution of monodentate alkoxy group by bi- or multidentate BL lowers
the connectivity of the molecular building blocks. This favors the formation of gels
instead of crystalline precipitates;
M – (OR)x + yBL – H M(OR)
x-y (BL)
y + yROH (1.4)
28
the polarity change by the organic groups has probably a similar effect on the
network structure as changing the polarity of the solvent;
the complexing ligands may stereochemically direct the hydrolysis and
condensation reactions because the site trans to an organic group has a different reactivity
than the cis sites.
Besides controlling the reactivity of the metal alkoxides and the network structure of the
obtained gels, the bidentate ligands can also be used to introduce functional organic
groups into gels by means of appropriately substituted derivatives.16
As matter of fact, when methacrylic acid is used instead of acetic acid to modify a metal
alkoxide, the coordination of the carboxylate group to the metal, i.e., the chemical
environment of the metal, is the same. However, the material obtained by sol-gel
processing contains organic functionalities (polymerizable double bonds in the case of
methacrylate) tethered to the metal via the carboxylate group. In the other hand, the
possibility to introduce organic functionalities into metal-based sol-gel materials by using
organofunctional BL is an important innovation.
A first mechanism proposed to explain the sol stabilization, is based on the hypothesis
that a kinetic control is exerted by the modifying chelating ligand on hydrolysis and
polycondensation reactions of metal alkoxide. According to this mechanism, chelating
ligands block the coordination sites of ions such as Ti4+, Zr4+, decreasing their rate of
hydrolysis and Polycondensation.11,16,19,20
A more recent interpretation has been suggested by Kessler et al.,22,83 and supported by
papers recently published about the reactivity of titanium and zirconium alkoxides.23,24
Kessler et al. have shown that the hydrolysis and polycondensation of these metal
alkoxides are facilitated by the chemical modification and their kinetics has no direct
relation to the sol-gel transformation of metal alkoxides. Therefore, the whole process of
sol formation is directed by the self-assembly of ligands. According to this, chelating
ligands increase the rate of hydrolysis and polycondensation giving nanoparticles, formed
by oxo-clusters (core) containing chelating ligands on the surface (shell), that exhibit a
structure typical of micelles. Therefore, the oxo-alkoxide molecules formed, serve
apparently as nuclei for the formation of larger aggregates that become phase separated
and can be referred to as Micelles Templated by Self-Assembly of Ligands.
The stabilization of sol is obtained as a consequence of the interfacial activity of these
micelles.22
29
1.4 Role of surfactant agent
Surfactant agent allows to control over the greater and finer structure of a material. A
sacrificial template, which acts as a support around which the final material is built before
being removed, is commonly used for the preparation of materials with a specified outer
structure as well as a predetermined inner arrangement. Numerous porous materials are
fabricated using surfactants to provide control over the inner porous structure.
The use of these agents to form macroporous solids has recently gained attention from
the research community. The final structures exhibit some resemblance to the initial
template and generally show properties that could not be achieved without the structure
directing agent.84
Surfactants act as pore-directing agents within the sol-gel process due to their amphiphilic
nature, allowing them to spontaneously orient themselves in such a way that the contact
between the solvent and the hydrophobic group of the surfactant is minimized, thereby
decreasing the free energy of the system.85,86 As a result, the surfactant is often regarded
as a “spacer” within the sol–gel, and can enable the production of highly porous materials
with a specific pore structure and size.
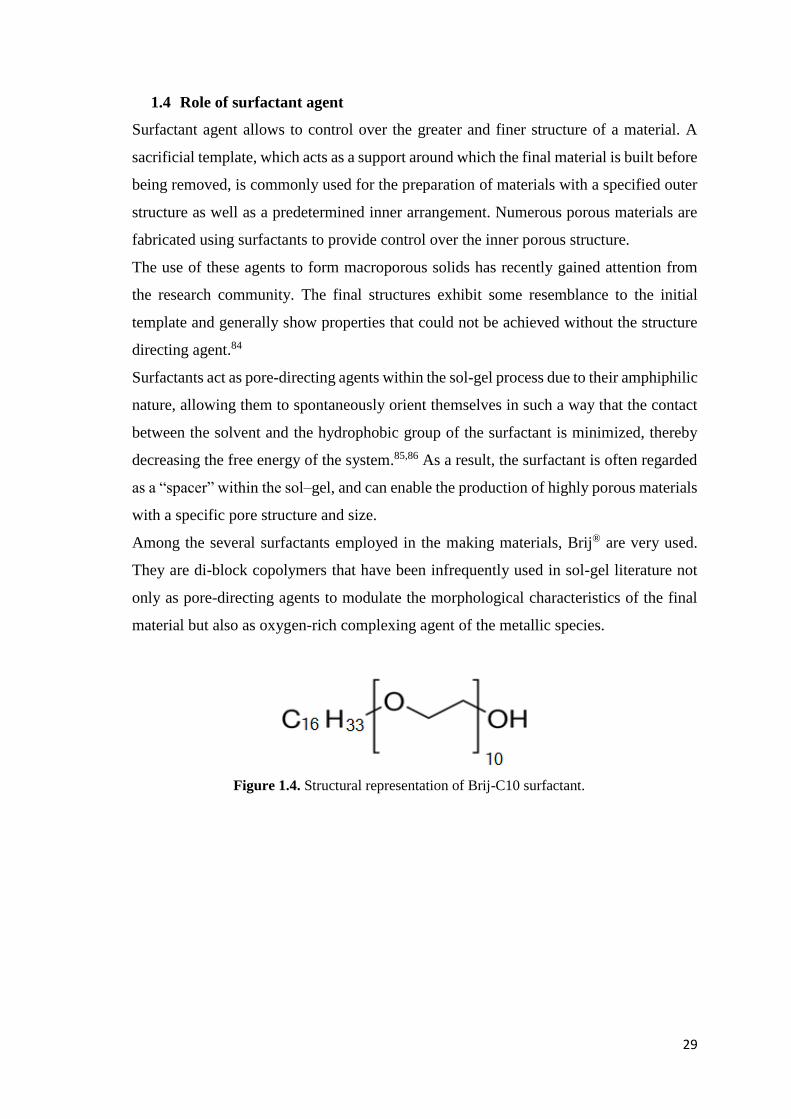
Among the several surfactants employed in the making materials, Brij® are very used.
They are di-block copolymers that have been infrequently used in sol-gel literature not
only as pore-directing agents to modulate the morphological characteristics of the final
material but also as oxygen-rich complexing agent of the metallic species.
Figure 1.4. Structural representation of Brij-C10 surfactant.

30
CHAPTER 2
EXPERIMENTAL SECTION
31
2.1 ZrO2-acetylacetonate (HSGZ)
Materials. Zirconium (IV) propoxide (70 wt.% in 1-propanol), acetylacetone (C5H8O2 >
99%), and 1-propanol (C3H8O > 99.80%) were purchased by Sigma-Aldrich (Milan,
Italy).
4-Chloro-2-methylphenoxyacetic acid (MCPA), 4-chlorophenoxyacetic acid (4-CPA),
2,4 dichlorophenoxyacetic acid (2,4-D), and 4-(4-chloro-2-methylphenoxy)butanoic acid
(MCPB) were purchased by Sigma-Aldrich Chemical Co. (Poole, Dorset, UK; 99.0%
purity).
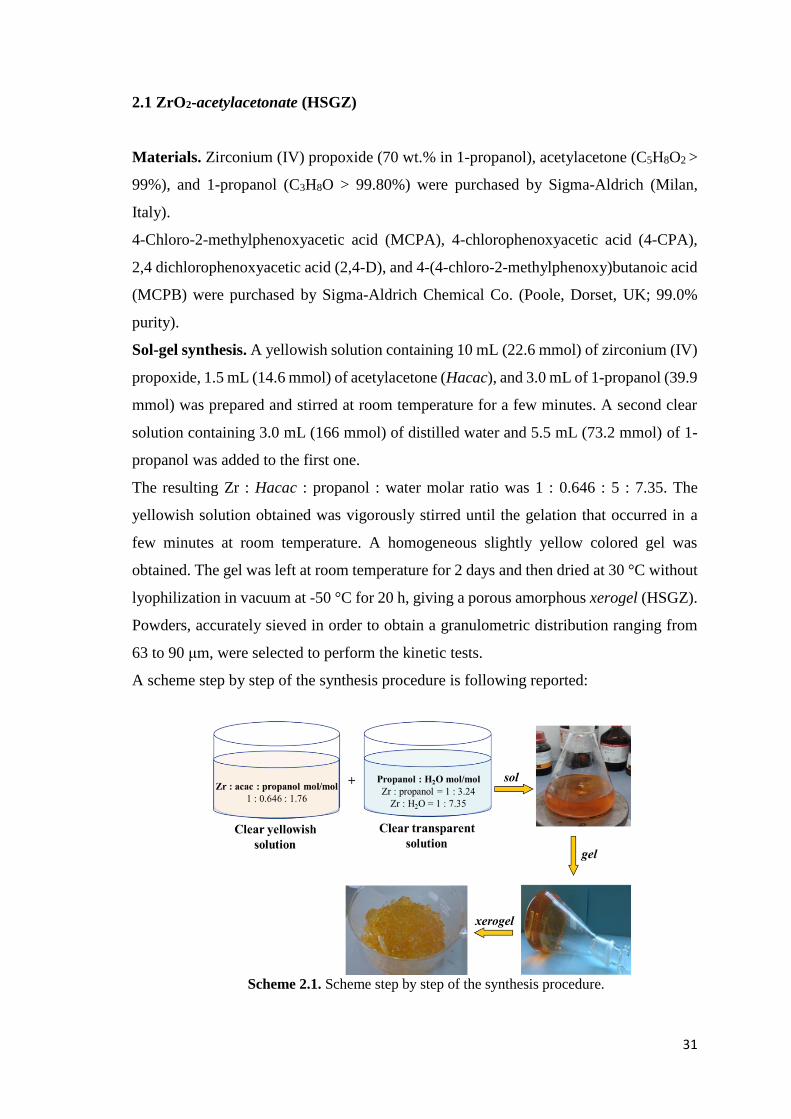
Sol-gel synthesis. A yellowish solution containing 10 mL (22.6 mmol) of zirconium (IV)
propoxide, 1.5 mL (14.6 mmol) of acetylacetone (Hacac), and 3.0 mL of 1-propanol (39.9
mmol) was prepared and stirred at room temperature for a few minutes. A second clear
solution containing 3.0 mL (166 mmol) of distilled water and 5.5 mL (73.2 mmol) of 1-
propanol was added to the first one.
The resulting Zr : Hacac : propanol : water molar ratio was 1 : 0.646 : 5 : 7.35. The
yellowish solution obtained was vigorously stirred until the gelation that occurred in a
few minutes at room temperature. A homogeneous slightly yellow colored gel was
obtained. The gel was left at room temperature for 2 days and then dried at 30 °C without
lyophilization in vacuum at -50 °C for 20 h, giving a porous amorphous xerogel (HSGZ).
Powders, accurately sieved in order to obtain a granulometric distribution ranging from
63 to 90 μm, were selected to perform the kinetic tests.
A scheme step by step of the synthesis procedure is following reported:
Scheme 2.1. Scheme step by step of the synthesis procedure.
32
Thermogravimetric (TG) and Differential Thermal Analyses (DTA). To study the
reactions occurring during xerogels heating, we carried out TG-DTA analyses, using a
TA Instruments SDT Q 600. The TG and DTA tests were performed keeping 20−25 mg
of xerogel under nitrogen atmosphere, varying the temperature from 20 to 1000 °C. A
heating rate of 10 °C min−1 was adopted.87
X-ray diffraction (XRD). The amorphous nature of the dried gels as well as the nature
of the crystallizing phases were ascertained by X-ray diffraction (XRD) with a Philips
X’PERT−PRO diffractometer by using monochromatized CuKα radiation (40 mA, 40
kV) with a step width of 0.013° 2θ.87
Fourier transform infrared (FTIR) spectroscopy. The structure of the HSGZ matrix,
as well as its structural evolution during the heating, was studied by Fourier Transform
InfraRed (FTIR) spectroscopy.
FTIR spectra of dried and heat-treated gel samples were carried out at room temperature
by a Nicolet system, Nexus model, equipped with a DTGS KBr (deuterated triglycine
sulfate with potassium bromide windows) detector.
The absorption spectra were recorded in the 4000−400 cm−1 range with a spectral
resolution of 2 cm−1 on samples diluted in KBr. The spectrum of each sample represents
an average of 64 scans, which were corrected for the spectrum of the blank KBr.
Moreover, FTIR spectrum of HSGZ after repeated batch tests in the presence of 0.2 mmol
L−1 of MCPB solution was recorded at room temperature, as reported in literature.87
Ultra violet and visible light diffuse reflection (UV–vis DR) spectroscopy. Ultra violet
and visible light diffuse reflection (UV–vis DR) spectra were recorded in the range of
200-800 nm on a doubled beam Jasco spectrophotometer.
Barium sulfate was used as a reflectance standard. The measured intensity was expressed
as the value of the Kubelka-Munk function F(R).88
Electron Paramagnetic Resonance (EPR) spectroscopy. The powder sample was
analysed using a X-band (9 GHz) Bruker Elexys E-500 spectrometer (Bruker,
Rheinstetten, Germany). The capillary containing the sample was placed in a standard 4
mm quartz sample tube. The temperature of the sample was regulated at 25 °C and
maintained constant during the measurement by blowing thermostated nitrogen gas
through a quartz Dewar.
The instrumental settings were as follows: sweep width, 100 G; resolution, 1024 points;
modulation frequency, 100 kHz; modulation amplitude, 1.0 G; time constant, 20.5 ms.
EPR spectra were measured with attenuation of 10 dB to avoid microwave saturation of
33
resonance absorption curve. Several scans, typically 64, were accumulated to improve the
signal-to-noise ratio.
The g values were evaluated by means of two internal standards (1,1-diphenyl-2-
picrylhydrazyl (DPPH) and a 4-hydroxy-2,2,6,6-tetramethylpiperidin-1-oxyl (TEMPOL)
ethanol solution) which were inserted in the quartz sample tube co-axially with the
capillary containing the HSGZ sample.88
Analytical Determination of herbicides. MCPA, 4-CPA, 2,4-D and MCPB herbicides
were analyzed with an Agilent 1200 Series HPLC apparatus (Wilmington U.S.), equipped
with a DAD and a ChemStation Agilent Software. A Macharey-Nagel Nucleosil 100-5
C18 column (stainless steel 250 × 4 mm) was utilized.
In the case of MCPA, the mobile phase composed of a binary system of 50:50 acetonitrile:
phosphate buffer (0.1%, pH 2.5) was pumped at 1 mL min−1 flow in isocratic mode. The
detector was set at 225 nm.
MCPB was analyzed using the previously described conditions, except of the eluent
system which is composed by a binary system of 60:40 acetonitrile: phosphate buffer
(0.1%, pH 2.5).
For 2,4-D and 4-CPA, the mobile phase formed by a binary system of 40:60 acetonitrile:
phosphate buffer (0.1%, pH 2.5) was pumped at 1 mL min−1 flow in isocratic mode. The
detector was set at 283 nm.
For all chosen herbicides, the injection volume was 20 μL.
The quantitative determination was performed using a calibration curve for each
herbicide investigated. The following concentration ranges were adopted: 0.0002-0.9
mmol L−1, 0.0001-0.2 mmol L−1, 0.0002-2.7 mmol L−1, and 0.0002-2.0 mmol L−1, for
MCPA, MCPB, 4-CPA and 2,4-D, respectively.87
Removal Tests of herbicides by HSGZ Matrix. A stock solution of each herbicide was
prepared by dissolving in 500 mL of Milli-Q ultrapure water the following amounts:
100 mg of MCPA (final concentration 0.9 mmol L−1);
22 mg of MCPB (final concentration 0.2 mmol L−1);
250 mg of 4-CPA (final concentration 2.7 mmol L -1);
250 mg of 2,4-D (final concentration 2.0 mmol L−1).
The obtained solutions were subsequently kept refrigerated.
34
All the experiments were carried out in batch conditions in the dark, in a thermostatic
rotary shaker at 30 °C. Blanks of each herbicide in aqueous solution were analyzed in
order to check the pesticide stability and the possible sorption to vials.
After incubation, the samples were centrifuged at 7000 rpm for 20 min and the
supernatants were analyzed as above-reported.
Kinetic experiments were performed incubating about 1 mg of HSGZ matrix with 1 mL
of each herbicide (solid/liquid ratio (R) was 1.0) at 0.2 mmol L−1 concentration for
different incubation times (0.25, 0.5, 1.0, 2.0, 3.0, 4.0, 5.0, 6.0, 16, 24, 72 h) at 30 °C.
In order to clarify the effect of the herbicide concentration, kinetic tests were carried out,
as above-reported, adopting for each herbicide concentration values close to solubility
limits.
The experiments were conducted at R = 1.0 using solutions at 0.9, 0.2, 2.7, and 2.0 mmol
L−1 of MCPA, MCPB, 4-CPA, and 2,4-D, respectively, at 30 °C.
With the purpose to investigate the effect of HSGZ matrix amount, kinetic tests of MCPA
removal were performed at 0.2 mmol L−1 concentration and at R = 1.0, 2.0 (obtained by
adding 4 mg of matrix in 2.0 mL of final volume), and 5.0 (obtained by adding 10 mg of
matrix in 2.0 mL of final volume).
Finally, the long-term applicability of the MCPB-removal system was verified by
carrying out repeated batch tests. After each batch test, the liquid phase was removed and
replaced by an equal volume of MCPB solution at the initial concentration of 0.2 mmol
L−1.
In conclusion, to investigate the stability of the catalyst, FTIR spectrum of HSGZ before
and after repeated batch tests at room temperature was recorded.87
Kinetic Models. The removal kinetics of the four herbicides on the HSGZ were
elaborated considering an alternative physico-mathematical model in which the first stage
of the herbicide removal implied a reversible first-order adsorption on HSGZ surface
following from degradation of them. All the experiments were carried out in triplicate
and the relative standard deviation was lower than 4%.87
35
2.2 Nb2O5•SiO2 and Ru/RuO2@Nb2O5∙SiO2
Materials. Tetraethoxysilane (TEOS) (Si(OC2H5)4 99%, Sigma Aldrich), niobium (V)
chloride, NbCl5 (99%, Sigma Aldrich), anhydrous ethanol (EtOH) (Sigma Aldrich),
Ruthenium (III) chloride-3-hydrate (RuCl3·3H2O 99.98%, Aldrich), polyethylene glycol
hexadecyl ether (Brij-C10) (C16H33(OCH2CH2)10OH, Sigma Aldrich). Tetramethylsilane
(TMS) (Si(CH3)4 ≥ 99.0 %, Sigma Aldrich).
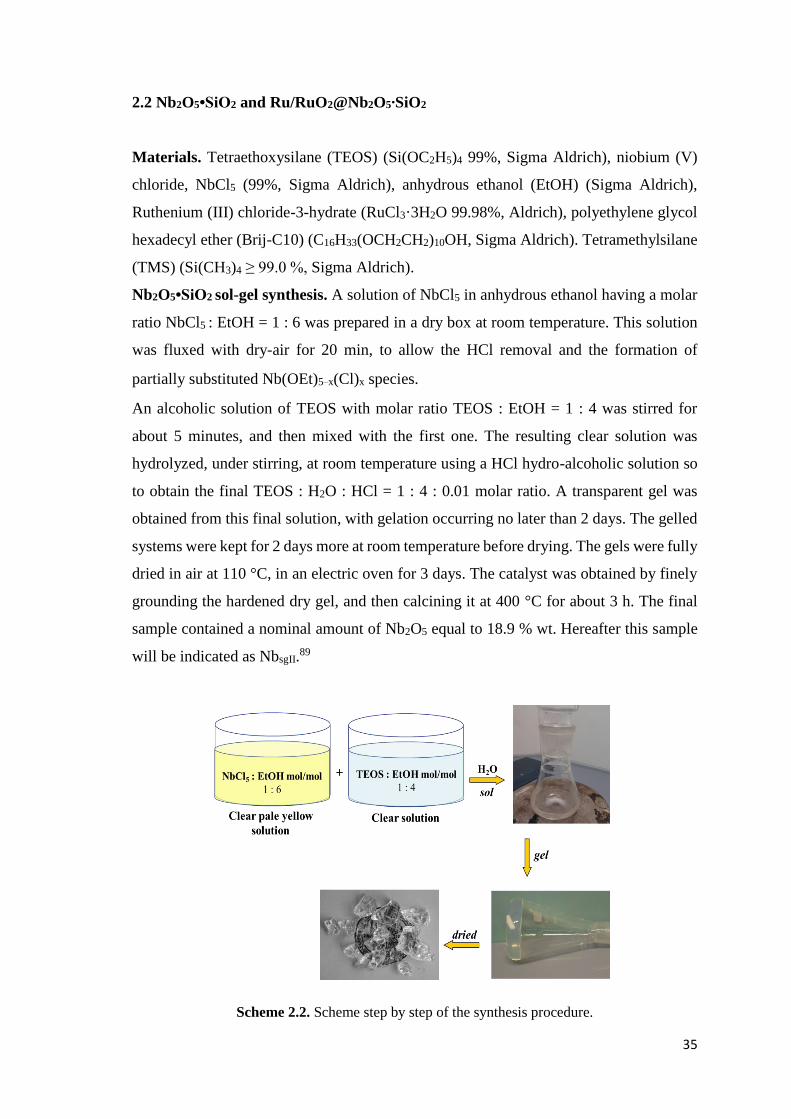
Nb2O5•SiO2 sol-gel synthesis. A solution of NbCl5 in anhydrous ethanol having a molar
ratio NbCl5 : EtOH = 1 : 6 was prepared in a dry box at room temperature. This solution
was fluxed with dry-air for 20 min, to allow the HCl removal and the formation of
partially substituted Nb(OEt)5−x(Cl)x species.
An alcoholic solution of TEOS with molar ratio TEOS : EtOH = 1 : 4 was stirred for
about 5 minutes, and then mixed with the first one. The resulting clear solution was
hydrolyzed, under stirring, at room temperature using a HCl hydro-alcoholic solution so
to obtain the final TEOS : H2O : HCl = 1 : 4 : 0.01 molar ratio. A transparent gel was
obtained from this final solution, with gelation occurring no later than 2 days. The gelled
systems were kept for 2 days more at room temperature before drying. The gels were fully
dried in air at 110 °C, in an electric oven for 3 days. The catalyst was obtained by finely
grounding the hardened dry gel, and then calcining it at 400 °C for about 3 h. The final
sample contained a nominal amount of Nb2O5 equal to 18.9 % wt. Hereafter this sample
will be indicated as NbsgII.89
Scheme 2.2. Scheme step by step of the synthesis procedure.
36
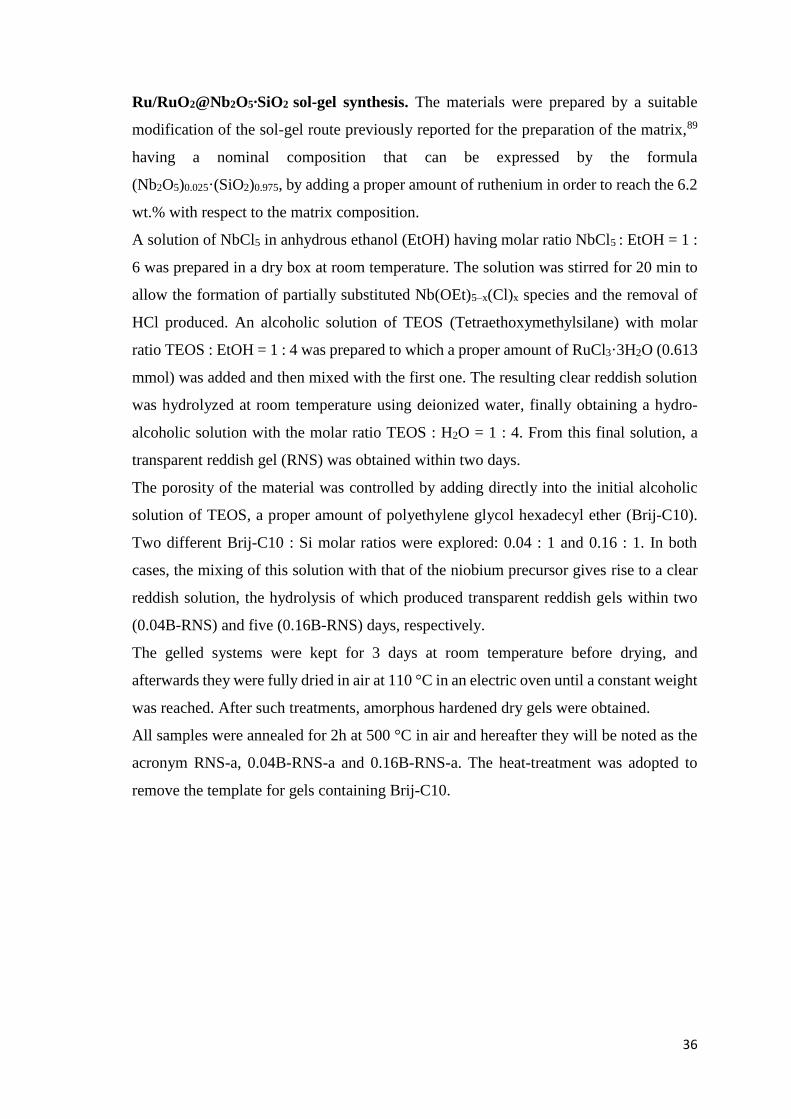
Ru/RuO2@Nb2O5∙SiO2 sol-gel synthesis. The materials were prepared by a suitable
modification of the sol-gel route previously reported for the preparation of the matrix,89
having a nominal composition that can be expressed by the formula
(Nb2O5)0.025·(SiO2)0.975, by adding a proper amount of ruthenium in order to reach the 6.2
wt.% with respect to the matrix composition.
A solution of NbCl5 in anhydrous ethanol (EtOH) having molar ratio NbCl5 : EtOH = 1 :
6 was prepared in a dry box at room temperature. The solution was stirred for 20 min to
allow the formation of partially substituted Nb(OEt)5–x(Cl)x species and the removal of
HCl produced. An alcoholic solution of TEOS (Tetraethoxymethylsilane) with molar
ratio TEOS : EtOH = 1 : 4 was prepared to which a proper amount of RuCl3·3H2O (0.613
mmol) was added and then mixed with the first one. The resulting clear reddish solution
was hydrolyzed at room temperature using deionized water, finally obtaining a hydro-
alcoholic solution with the molar ratio TEOS : H2O = 1 : 4. From this final solution, a
transparent reddish gel (RNS) was obtained within two days.
The porosity of the material was controlled by adding directly into the initial alcoholic
solution of TEOS, a proper amount of polyethylene glycol hexadecyl ether (Brij-C10).
Two different Brij-C10 : Si molar ratios were explored: 0.04 : 1 and 0.16 : 1. In both
cases, the mixing of this solution with that of the niobium precursor gives rise to a clear
reddish solution, the hydrolysis of which produced transparent reddish gels within two
(0.04B-RNS) and five (0.16B-RNS) days, respectively.
The gelled systems were kept for 3 days at room temperature before drying, and
afterwards they were fully dried in air at 110 °C in an electric oven until a constant weight
was reached. After such treatments, amorphous hardened dry gels were obtained.
All samples were annealed for 2h at 500 °C in air and hereafter they will be noted as the
acronym RNS-a, 0.04B-RNS-a and 0.16B-RNS-a. The heat-treatment was adopted to
remove the template for gels containing Brij-C10.
37
Scheme 2.3. Scheme step by step of the synthesis procedure.
X-ray diffraction (XRD). XRD patterns of Nb2O5•SiO2 powders were recorded by using
a Bruker 2D phaser with a CuKα radiation of 1.5418 Å (40 kV and 20 mA). A 2D range
from 5° to 80° was scanned, at a velocity of 0.02° 2θ min−1.89
The amorphous nature of Ruthenium-based dried gels as well as the nature of any
crystalline phase formed at high temperature, were ascertained by XRD using a Philips
diffractometer model PW1710 (Cu Kα) at a scan rate of 1° min-1.
Ultra violet and visible light diffuse reflection (UV–vis DR) spectroscopy. Ultra violet
and visible light diffuse reflection (UV–vis DR) spectra were recorded in the range of
200-800 nm on a doubled beam Jasco spectrophotometer.
Barium sulfate was used as a reflectance standard. The measured intensity was expressed
as the value of the Kubelka-Munk function F(R).89
Fourier transform infrared (FTIR) spectroscopy. Fourier transform (FT) IR spectra of
dried and heat-treated gel samples were carried out at room temperature by a Nicolet
system, Nexus model, equipped with a DTGS KBr (deuterated triglycine sulfate with
potassium bromide windows) detector. The absorption spectra were recorded in the 4000–
400 cm–1 range with a spectral resolution of 2 cm–1 using pressed disks of powders diluted
in KBr (about 200 mg x 1 cm2). The spectrum of each sample represents an average of
64 scans, which were corrected for the spectrum of the blank KBr. To allow the
comparison of the absorbance values, all FTIR spectra were normalized with respect to
the maximum absorbance value recorded for each spectrum.89
38
N2 adsorption-desorption isotherms. Nb2O5•SiO2 powders were characterized by N2
isotherms were obtained in an automatic analyzer (Sorptomatic 1900 instrument). The
samples were previously treated in the sample cell at 350 °C under vacuum, up for 16 h
up to complete degassing. Specific surface area (SSA) was calculated according to the
BET (Brunauer-Emmett-Teller) method.89
Ruthenium-based powders were also characterized by N2 adsorption at temperature of -
196°C on ca. 100 mg sample previously outgassed at 300 °C for 3h to remove
atmospheric contaminants (Quantachrome Autosorb 1 instrument). Specific surface area
(SSA) was calculated both according to the BET (Brunauer-Emmett-Teller) method and
through the Langmuir equation in the case of microporous samples. The pore size
distribution (PSD) was calculated by applying the Non Local-Density Functional Theory
(NL-DFT) method to isotherms adsorption branches, by applying a N2-silica kernel.
Temperature Programmed Reduction (TPR) and Temperature Programmed
Oxidation (TPO). Ruthenium-based materials were characterized H2-TPR (Temperature
Programmed Reduction) and O2-TPO (Temperature Programmed Oxidation) analysis,
carried out on a TPD/R/O 1100 ThermoQuest instrument and using a 5% H2/Ar (Q= 20
cm3 min−1) or a 2% O2/He mixture (Q = 40 cm3 min−1), respectively, with heating rate of
10 °C min−1. The sample (100 mg) was loaded in a quartz down-flow cell with a K
thermocouple in close contact with the sample.
Morphological characterization: SEM-EDX and TEM. Microstructure and chemical
composition of the samples were investigated by NOVA/NANOSEM 450 FEI scanning
electron microscopy (SEM), equipped with an energy dispersive X-ray analyzer (EDX)
at an accelerating voltage of 30 kV.89
TEM observation of the Ruthenium-based samples was performed by transmission
electron microscopy (TEM) - TECNAI G12 Spirit-Twin (LaB6 source) equipped with a
FEI Eagle 4k CCD camera, operating with an acceleration voltage of 120 kV.
Thermogravimetric (TG) and Differential Thermal Analyses (DTA). The weight loss
of the Ruthenium-based gels as well as the nature and temperatures of the various
reactions occurring during the heating were evaluated by a TA Instrument simultaneous
thermoanalyser SDT Q600. The TG/DTA tests were carried out on 20 mg of dried gel
specimens in N2, from room temperature up to 1000 °C heating rate of 10 °C min-1.
Nb2O5∙SiO2 application: methyl oleate epoxidation. The catalytic performance of the
Nb2O5∙SiO2 materials was evaluated in methyl oleate epoxidation with hydrogen peroxide
as oxidant. Epoxidation reactions were carried out in a round-bottom glass batch reactor,
39
put in an oil bath, equipped with a condenser and thermometer, and a magnetic bar for
vigorous stirring (300 rpm). In a typical experiment, 600 mg of catalyst, 20 cm3 of
acetonitrile, 5 g of methyl oleate (25 mmol) and 6.9 g of hydrogen peroxide 54.9 % wt.
(111 mmol) were used. The temperature was kept constant (≈80 °C) with solvent
refluxing. All reagents were added in one pot at the beginning of the reaction. The final
solution was separated from the catalyst by decantation, and it was analyzed to evaluate
the double bond conversion, through the determination of the Iodine Number (I.N.), and
the epoxide yield, through the evaluation of the Oxirane Number (O.N.), according to the
analytical methods reported in the literature.36 The double bond conversions (C) have
been determined as:
The yields to epoxide (Y) have been determined as:
where:
I.N. is expressed as the grams of I2 per 100 g of the oil;
O.N. is expressed as the grams of epoxydic oxygen per 100 g of the oil;
PMI2 is the molar weight of I2 (g/mol);
PMO is the molar weight of O (g/mol).
The selectivity (S) has been evaluated as:
After all tests, the presence of residual hydrogen peroxide was evaluated. With respect to
the initial content charged a residual amount (≈20%) was found indicating that in no case
hydrogen peroxide was the limiting reagent. The leaching of the active species into the
liquid phase under operating conditions has been verified removing the catalyst from the
(eq. 2.1) C(%) =
[I.N.]i - [I.N.]
f
[I.N.]i
x 100
(eq. 2.2) Y(%) = x 100
[O.N.] x [PM]
I 2
[I.N.]f
x [PM]O
(eq. 2.3) S(%) = x 100
Conversion
Yield
40
reaction mixture by filtration after 150 minutes from the start of the reaction, and then
recording the residual conversion for additional 150 minutes. For each catalyst almost no
detectable subsequent conversion in the filtrate after removing the catalyst was observed,
giving very strong evidence that these materials act as real heterogeneous catalysts.
Ru/RuO2@Nb2O5∙SiO2 application: Levulinic Acid (LA) hydrogenation. The
catalytic performance of the Ru/RuO2@Nb2O5∙SiO2 materials was evaluated in levulinic
acid (LA) hydrogenation to produce γ-valerolactone (GVL). The hydrogenation reaction
was performed in a fed-batch reactor, where hydrogen is fed at constant pressure to a 0.3L
vessel charged with about 4g of levulinic acid and 200g of water. Before loading the
catalyst, it was prereduced in a dedicated system under a 0.1L/min hydrogen flow, 1bar
and 300 °C of temperature for 3h. The catalyst so reduced, was cooled at room
temperature under the same hydrogen flow and then charged quickly to the vessel. The
reaction mixture, containing the catalyst, was then flushed with nitrogen at 5 bars, in order
to evacuate the dissolved oxygen before feeding hydrogen. In this step, temperature was
increased at the desired value (usually 70 °C), and the solution is stirred at 300 rpm. After
about 10 washes, hydrogen was sent to the reactor at the desired pressure and the reaction
starts. Periodical samples were withdrawn in order to evaluate the evolution with time of
both LA conversion and GVL yield. An AISI 316 stainless steel net was installed at the
bottom of the withdrawn pipe in order to avoid any catalyst loss. For each catalyst the
reuse experiments have been made by performing cycles of 5 experiments the time during
of which was 1.5 h. During the course of the reaction reagent/intermediate/product were
analyzed by GC (see supplementary materials) every half hour according to a procedure
followed described. Once the individual experiment, lasting 1.5h, was concluded, the
catalyst was washed with distilled water and reused after filtration for a new experimental
test performed in the same operating conditions as the previous. Adsorption tests have
been performed by putting in contact either the reagent or the product with the catalyst at
fixed temperature and stirring rate. Temperature and hydrogen flow were acquired thanks
to a National Instruments DAQ device, while the acquisition software is homemade and
written in LabView 2013.
Analytical methods. The withdrawn samples are analyzed via GC, using 1,3-propanediol
as external standard. In particular, in about 2-4 cm3 of samples, 100μL of standard are
dissolved. 500μL of the solution were put in contact with 250μL of TMS for 45min at
90°C, as a derivatization procedure. The sample so prepared was injected to a Perkin
Elmer Clarus 580 GC, with a Zebron ZB-WAX column (30m x 0.32mm x 0.25μm). The

41
injector is a PSSI, working at 250°C, with a carrier (He) pressure of 14psi and splitless
configuration. The temperature ramp has been set as it follows: 150°C heating to 250°C
with a rate of 20°C/min; temperature was kept at the final value for 25 minutes.
The retention times are here reported: TMS 5.7 min, α-angelicolactone 11.1 min, γ-
valerolactone 7.4 min, 1,3-propanediol 7.7 min and levulinic acid 11.3 min, γ-
hydroxyvaleric acid 13.6 min.

42
CHAPTER 3
RESULT AND DISCUSSION
PART 1
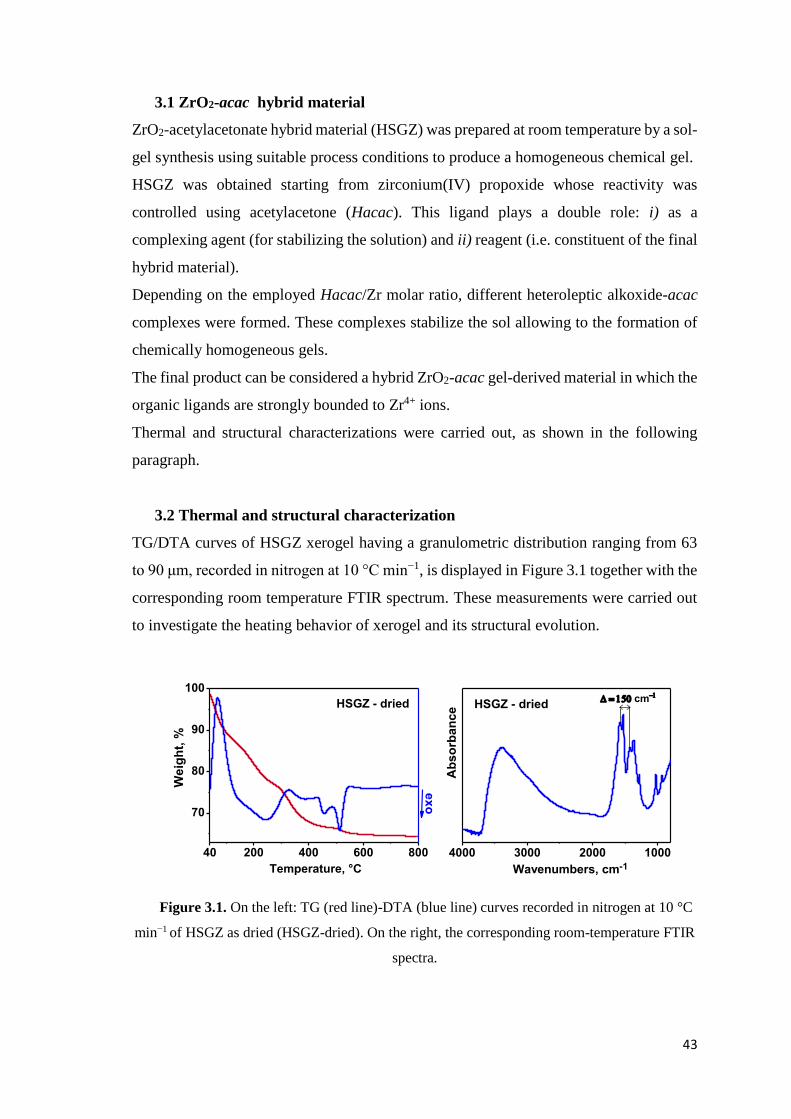
43
3.1 ZrO2-acac hybrid material
ZrO2-acetylacetonate hybrid material (HSGZ) was prepared at room temperature by a sol-
gel synthesis using suitable process conditions to produce a homogeneous chemical gel.
HSGZ was obtained starting from zirconium(IV) propoxide whose reactivity was
controlled using acetylacetone (Hacac). This ligand plays a double role: i) as a
complexing agent (for stabilizing the solution) and ii) reagent (i.e. constituent of the final
hybrid material).
Depending on the employed Hacac/Zr molar ratio, different heteroleptic alkoxide-acac
complexes were formed. These complexes stabilize the sol allowing to the formation of
chemically homogeneous gels.
The final product can be considered a hybrid ZrO2-acac gel-derived material in which the
organic ligands are strongly bounded to Zr4+ ions.
Thermal and structural characterizations were carried out, as shown in the following
paragraph.
3.2 Thermal and structural characterization
TG/DTA curves of HSGZ xerogel having a granulometric distribution ranging from 63
to 90 μm, recorded in nitrogen at 10 °C min−1, is displayed in Figure 3.1 together with the
corresponding room temperature FTIR spectrum. These measurements were carried out
to investigate the heating behavior of xerogel and its structural evolution.
Figure 3.1. On the left: TG (red line)-DTA (blue line) curves recorded in nitrogen at 10 °C
min−1 of HSGZ as dried (HSGZ-dried). On the right, the corresponding room-temperature FTIR
spectra.
4000 3000 2000 1000
Wavenumbers, cm-1
Ab
so
rba
nc
e cm
HSGZ - dried
40 200 400 600 800
70
80
90
100
Temperature, °C
We
igh
t, %
HSGZ - dried
ex
o
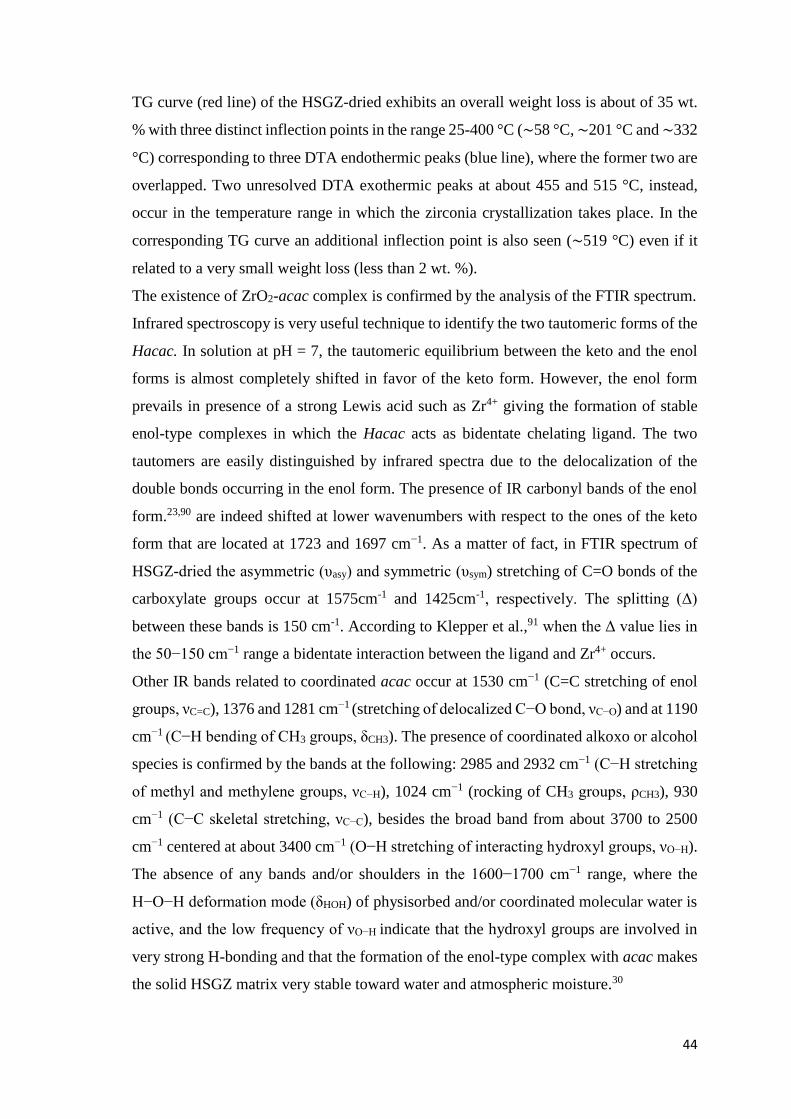
44
TG curve (red line) of the HSGZ-dried exhibits an overall weight loss is about of 35 wt.
% with three distinct inflection points in the range 25-400 °C (∼58 °C, ∼201 °C and ∼332
°C) corresponding to three DTA endothermic peaks (blue line), where the former two are
overlapped. Two unresolved DTA exothermic peaks at about 455 and 515 °C, instead,
occur in the temperature range in which the zirconia crystallization takes place. In the
corresponding TG curve an additional inflection point is also seen (∼519 °C) even if it
related to a very small weight loss (less than 2 wt. %).
The existence of ZrO2-acac complex is confirmed by the analysis of the FTIR spectrum.
Infrared spectroscopy is very useful technique to identify the two tautomeric forms of the
Hacac. In solution at pH = 7, the tautomeric equilibrium between the keto and the enol
forms is almost completely shifted in favor of the keto form. However, the enol form
prevails in presence of a strong Lewis acid such as Zr4+ giving the formation of stable
enol-type complexes in which the Hacac acts as bidentate chelating ligand. The two
tautomers are easily distinguished by infrared spectra due to the delocalization of the
double bonds occurring in the enol form. The presence of IR carbonyl bands of the enol
form.23,90 are indeed shifted at lower wavenumbers with respect to the ones of the keto
form that are located at 1723 and 1697 cm−1. As a matter of fact, in FTIR spectrum of
HSGZ-dried the asymmetric (υasy) and symmetric (υsym) stretching of C=O bonds of the
carboxylate groups occur at 1575cm-1 and 1425cm-1, respectively. The splitting (Δ)
between these bands is 150 cm-1. According to Klepper et al.,91 when the Δ value lies in
the 50−150 cm−1 range a bidentate interaction between the ligand and Zr4+ occurs.
Other IR bands related to coordinated acac occur at 1530 cm−1 (C=C stretching of enol
groups, νC=C), 1376 and 1281 cm−1 (stretching of delocalized C−O bond, νC−O) and at 1190
cm−1 (C−H bending of CH3 groups, δCH3). The presence of coordinated alkoxo or alcohol
species is confirmed by the bands at the following: 2985 and 2932 cm−1 (C−H stretching
of methyl and methylene groups, νC−H), 1024 cm−1 (rocking of CH3 groups, ρCH3), 930
cm−1 (C−C skeletal stretching, νC−C), besides the broad band from about 3700 to 2500
cm−1 centered at about 3400 cm−1 (O−H stretching of interacting hydroxyl groups, νO−H).
The absence of any bands and/or shoulders in the 1600−1700 cm−1 range, where the
H−O−H deformation mode (δHOH) of physisorbed and/or coordinated molecular water is
active, and the low frequency of νO−H indicate that the hydroxyl groups are involved in
very strong H-bonding and that the formation of the enol-type complex with acac makes
the solid HSGZ matrix very stable toward water and atmospheric moisture.30
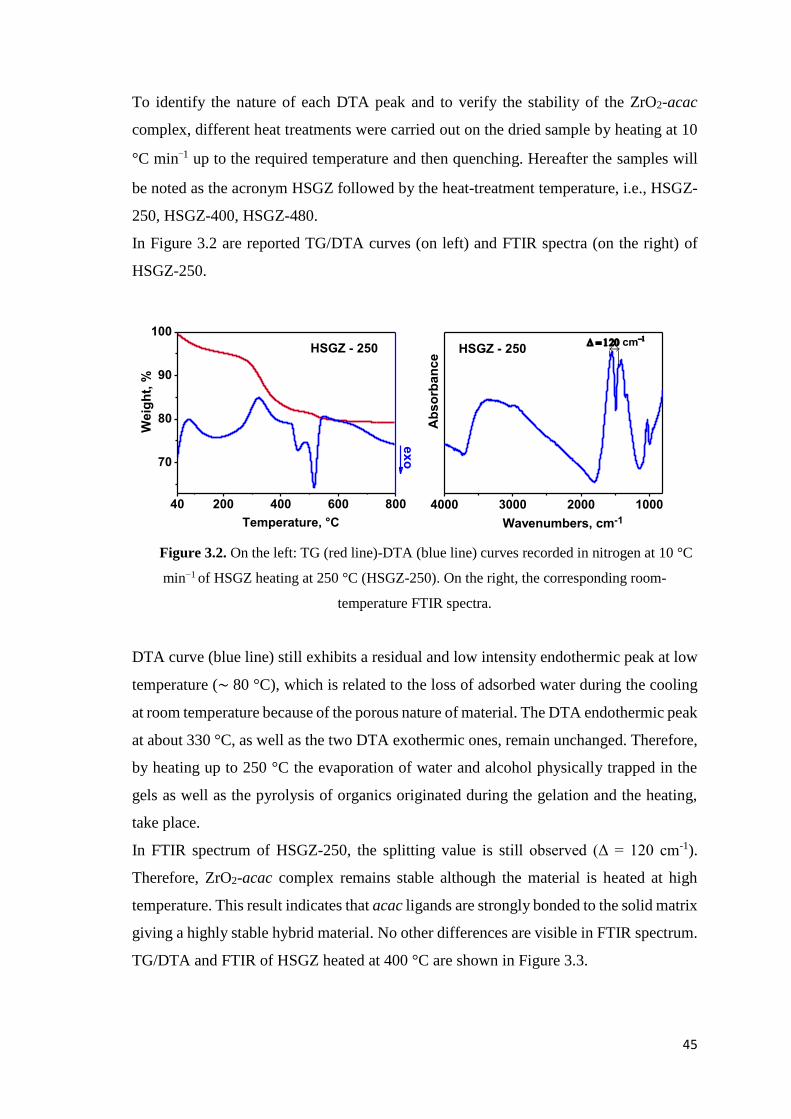
45
To identify the nature of each DTA peak and to verify the stability of the ZrO2-acac
complex, different heat treatments were carried out on the dried sample by heating at 10
°C min−1 up to the required temperature and then quenching. Hereafter the samples will
be noted as the acronym HSGZ followed by the heat-treatment temperature, i.e., HSGZ-
250, HSGZ-400, HSGZ-480.
In Figure 3.2 are reported TG/DTA curves (on left) and FTIR spectra (on the right) of
HSGZ-250.
Figure 3.2. On the left: TG (red line)-DTA (blue line) curves recorded in nitrogen at 10 °C
min−1 of HSGZ heating at 250 °C (HSGZ-250). On the right, the corresponding room-
temperature FTIR spectra.
DTA curve (blue line) still exhibits a residual and low intensity endothermic peak at low
temperature (∼ 80 °C), which is related to the loss of adsorbed water during the cooling
at room temperature because of the porous nature of material. The DTA endothermic peak
at about 330 °C, as well as the two DTA exothermic ones, remain unchanged. Therefore,
by heating up to 250 °C the evaporation of water and alcohol physically trapped in the
gels as well as the pyrolysis of organics originated during the gelation and the heating,
take place.
In FTIR spectrum of HSGZ-250, the splitting value is still observed (Δ = 120 cm-1).
Therefore, ZrO2-acac complex remains stable although the material is heated at high
temperature. This result indicates that acac ligands are strongly bonded to the solid matrix
giving a highly stable hybrid material. No other differences are visible in FTIR spectrum.
TG/DTA and FTIR of HSGZ heated at 400 °C are shown in Figure 3.3.
4000 3000 2000 1000
Wavenumbers, cm-1
cm
Ab
so
rban
ce HSGZ - 250
40 200 400 600 800
70
80
90
100
Temperature, °C
HSGZ - 250
We
igh
t, %
ex
o
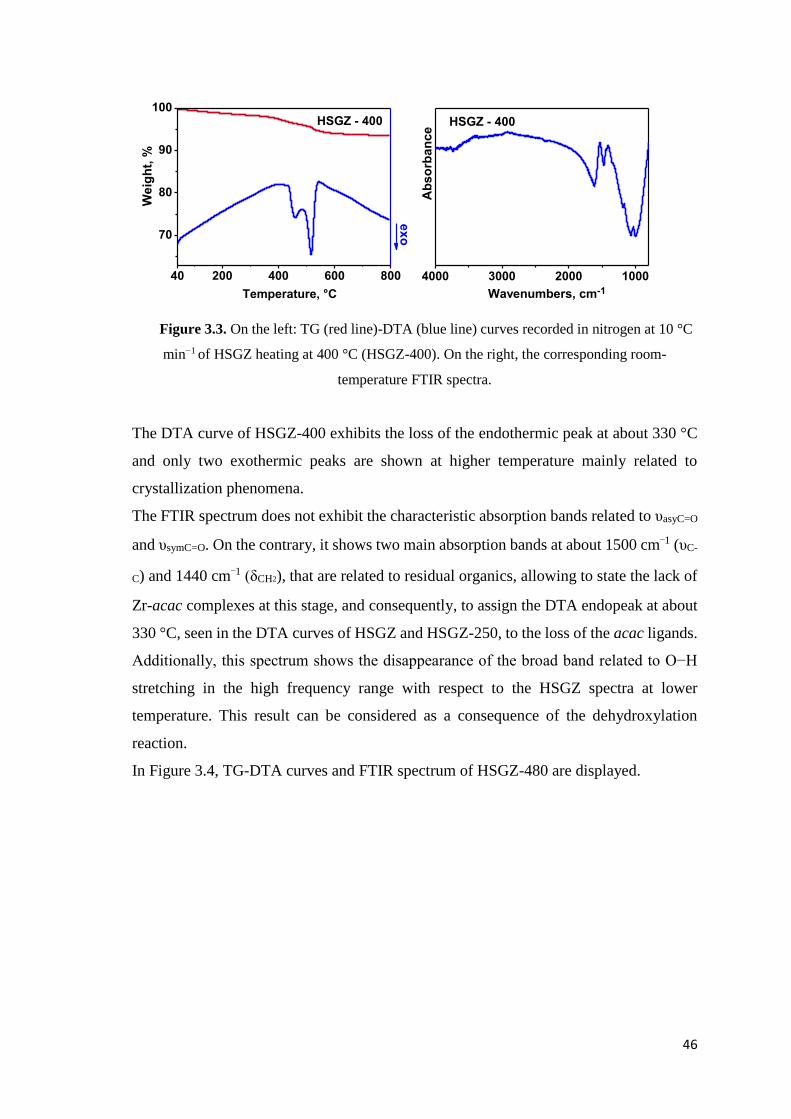
46
Figure 3.3. On the left: TG (red line)-DTA (blue line) curves recorded in nitrogen at 10 °C
min−1 of HSGZ heating at 400 °C (HSGZ-400). On the right, the corresponding room-
temperature FTIR spectra.
The DTA curve of HSGZ-400 exhibits the loss of the endothermic peak at about 330 °C
and only two exothermic peaks are shown at higher temperature mainly related to
crystallization phenomena.
The FTIR spectrum does not exhibit the characteristic absorption bands related to υasyC=O
and υsymC=O. On the contrary, it shows two main absorption bands at about 1500 cm−1 (υC-
C) and 1440 cm−1 (δCH2), that are related to residual organics, allowing to state the lack of
Zr-acac complexes at this stage, and consequently, to assign the DTA endopeak at about
330 °C, seen in the DTA curves of HSGZ and HSGZ-250, to the loss of the acac ligands.
Additionally, this spectrum shows the disappearance of the broad band related to O−H
stretching in the high frequency range with respect to the HSGZ spectra at lower
temperature. This result can be considered as a consequence of the dehydroxylation
reaction.
In Figure 3.4, TG-DTA curves and FTIR spectrum of HSGZ-480 are displayed.
4000 3000 2000 1000
Wavenumbers, cm-1
Ab
so
rba
nc
e
HSGZ - 400
40 200 400 600 800
70
80
90
100
Temperature, °C
HSGZ - 400
ex
o
Weig
ht,
%
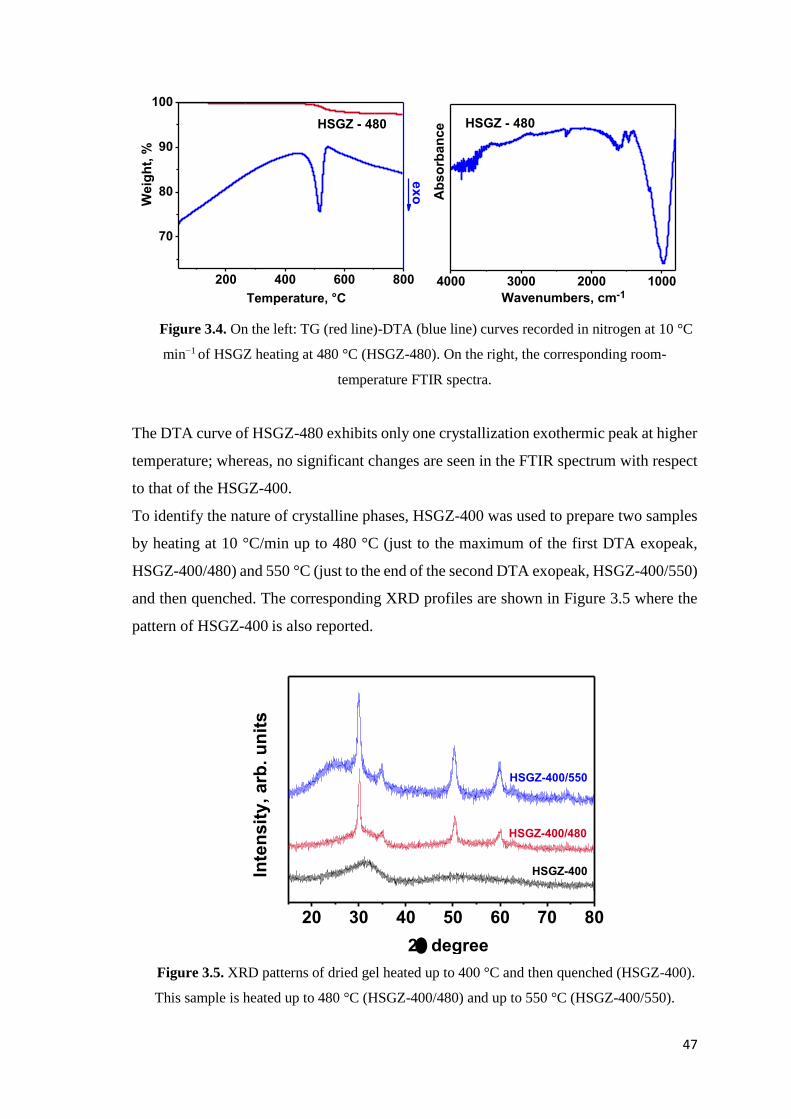
47
Figure 3.4. On the left: TG (red line)-DTA (blue line) curves recorded in nitrogen at 10 °C
min−1 of HSGZ heating at 480 °C (HSGZ-480). On the right, the corresponding room-
temperature FTIR spectra.
The DTA curve of HSGZ-480 exhibits only one crystallization exothermic peak at higher
temperature; whereas, no significant changes are seen in the FTIR spectrum with respect
to that of the HSGZ-400.
To identify the nature of crystalline phases, HSGZ-400 was used to prepare two samples
by heating at 10 °C/min up to 480 °C (just to the maximum of the first DTA exopeak,
HSGZ-400/480) and 550 °C (just to the end of the second DTA exopeak, HSGZ-400/550)
and then quenched. The corresponding XRD profiles are shown in Figure 3.5 where the
pattern of HSGZ-400 is also reported.
Figure 3.5. XRD patterns of dried gel heated up to 400 °C and then quenched (HSGZ-400).
This sample is heated up to 480 °C (HSGZ-400/480) and up to 550 °C (HSGZ-400/550).
4000 3000 2000 1000
Ab
so
rba
nc
e
HSGZ - 480
Wavenumbers, cm-1
200 400 600 800
70
80
90
100
HSGZ - 480
Temperature, °C
We
igh
t, %
exo
20 30 40 50 60 70 80
HSGZ-400
HSGZ-400/480
Inte
ns
ity
, a
rb.
un
its
2 degree
HSGZ-400/550
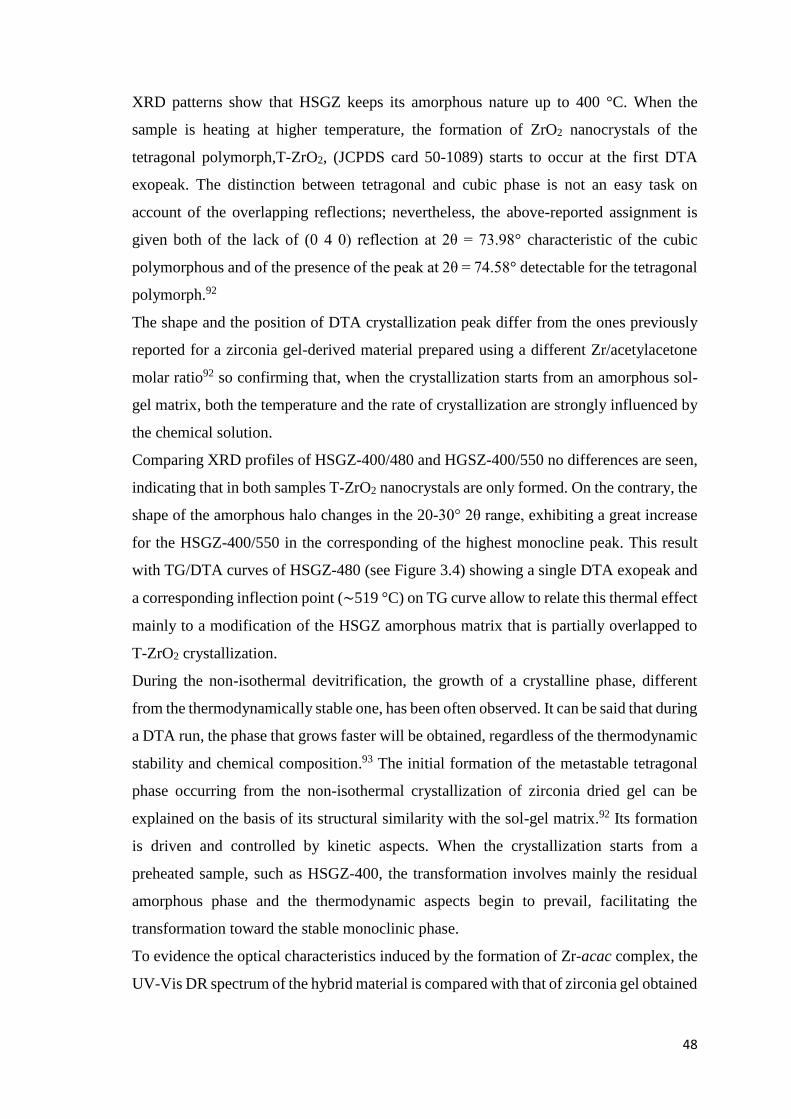
48
XRD patterns show that HSGZ keeps its amorphous nature up to 400 °C. When the
sample is heating at higher temperature, the formation of ZrO2 nanocrystals of the
tetragonal polymorph,T-ZrO2, (JCPDS card 50-1089) starts to occur at the first DTA
exopeak. The distinction between tetragonal and cubic phase is not an easy task on
account of the overlapping reflections; nevertheless, the above-reported assignment is
given both of the lack of (0 4 0) reflection at 2θ = 73.98° characteristic of the cubic
polymorphous and of the presence of the peak at 2θ = 74.58° detectable for the tetragonal
polymorph.92
The shape and the position of DTA crystallization peak differ from the ones previously
reported for a zirconia gel-derived material prepared using a different Zr/acetylacetone
molar ratio92 so confirming that, when the crystallization starts from an amorphous sol-
gel matrix, both the temperature and the rate of crystallization are strongly influenced by
the chemical solution.
Comparing XRD profiles of HSGZ-400/480 and HGSZ-400/550 no differences are seen,
indicating that in both samples T-ZrO2 nanocrystals are only formed. On the contrary, the
shape of the amorphous halo changes in the 20-30° 2θ range, exhibiting a great increase
for the HSGZ-400/550 in the corresponding of the highest monocline peak. This result
with TG/DTA curves of HSGZ-480 (see Figure 3.4) showing a single DTA exopeak and
a corresponding inflection point (∼519 °C) on TG curve allow to relate this thermal effect
mainly to a modification of the HSGZ amorphous matrix that is partially overlapped to
T-ZrO2 crystallization.
During the non-isothermal devitrification, the growth of a crystalline phase, different
from the thermodynamically stable one, has been often observed. It can be said that during
a DTA run, the phase that grows faster will be obtained, regardless of the thermodynamic
stability and chemical composition.93 The initial formation of the metastable tetragonal
phase occurring from the non-isothermal crystallization of zirconia dried gel can be
explained on the basis of its structural similarity with the sol-gel matrix.92 Its formation
is driven and controlled by kinetic aspects. When the crystallization starts from a
preheated sample, such as HSGZ-400, the transformation involves mainly the residual
amorphous phase and the thermodynamic aspects begin to prevail, facilitating the
transformation toward the stable monoclinic phase.
To evidence the optical characteristics induced by the formation of Zr-acac complex, the
UV-Vis DR spectrum of the hybrid material is compared with that of zirconia gel obtained
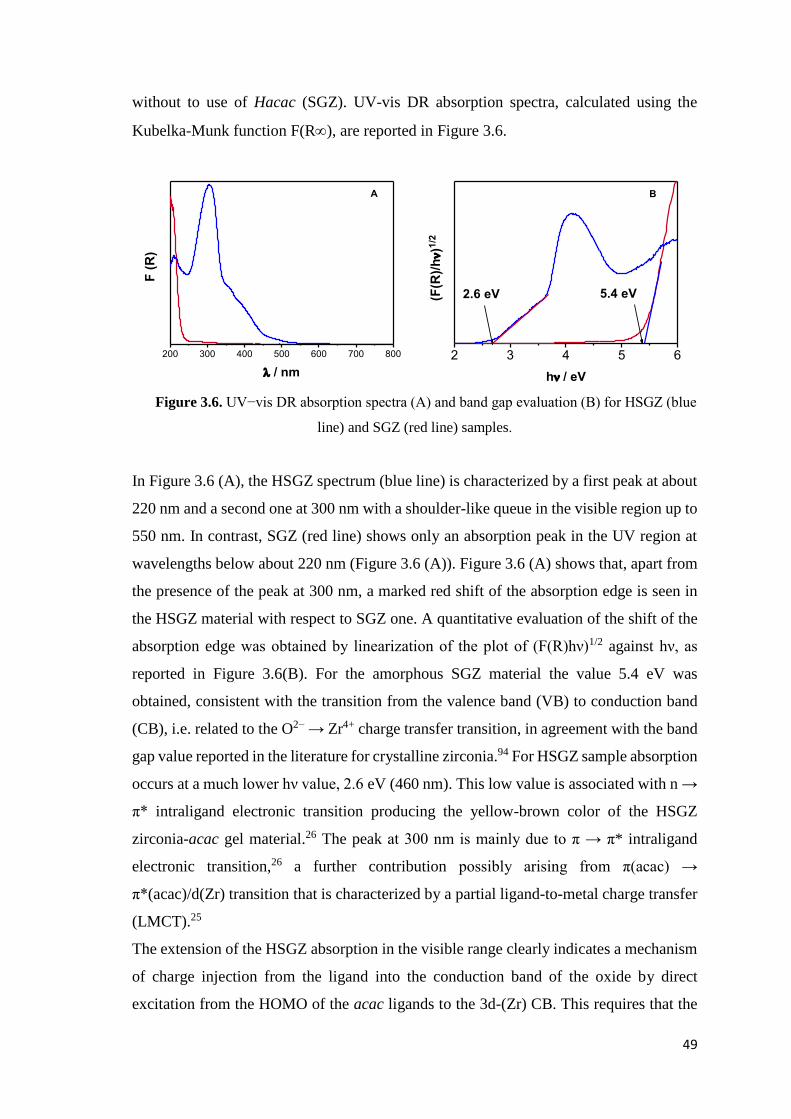
49
without to use of Hacac (SGZ). UV-vis DR absorption spectra, calculated using the
Kubelka-Munk function F(R), are reported in Figure 3.6.
Figure 3.6. UV−vis DR absorption spectra (A) and band gap evaluation (B) for HSGZ (blue
line) and SGZ (red line) samples.
In Figure 3.6 (A), the HSGZ spectrum (blue line) is characterized by a first peak at about
220 nm and a second one at 300 nm with a shoulder-like queue in the visible region up to
550 nm. In contrast, SGZ (red line) shows only an absorption peak in the UV region at
wavelengths below about 220 nm (Figure 3.6 (A)). Figure 3.6 (A) shows that, apart from
the presence of the peak at 300 nm, a marked red shift of the absorption edge is seen in
the HSGZ material with respect to SGZ one. A quantitative evaluation of the shift of the
absorption edge was obtained by linearization of the plot of (F(R)hν)1/2 against hν, as
reported in Figure 3.6(B). For the amorphous SGZ material the value 5.4 eV was
obtained, consistent with the transition from the valence band (VB) to conduction band
(CB), i.e. related to the O2− → Zr4+ charge transfer transition, in agreement with the band
gap value reported in the literature for crystalline zirconia.94 For HSGZ sample absorption
occurs at a much lower hν value, 2.6 eV (460 nm). This low value is associated with n →
π* intraligand electronic transition producing the yellow-brown color of the HSGZ
zirconia-acac gel material.26 The peak at 300 nm is mainly due to π → π* intraligand
electronic transition,26 a further contribution possibly arising from π(acac) →
π*(acac)/d(Zr) transition that is characterized by a partial ligand-to-metal charge transfer
(LMCT).25
The extension of the HSGZ absorption in the visible range clearly indicates a mechanism
of charge injection from the ligand into the conduction band of the oxide by direct
excitation from the HOMO of the acac ligands to the 3d-(Zr) CB. This requires that the
2 3 4 5 6
5.4 eV2.6 eV
(F(R
)/h)1
/2
h/ eV
B
200 300 400 500 600 700 800
F (
R)
/ nm
A
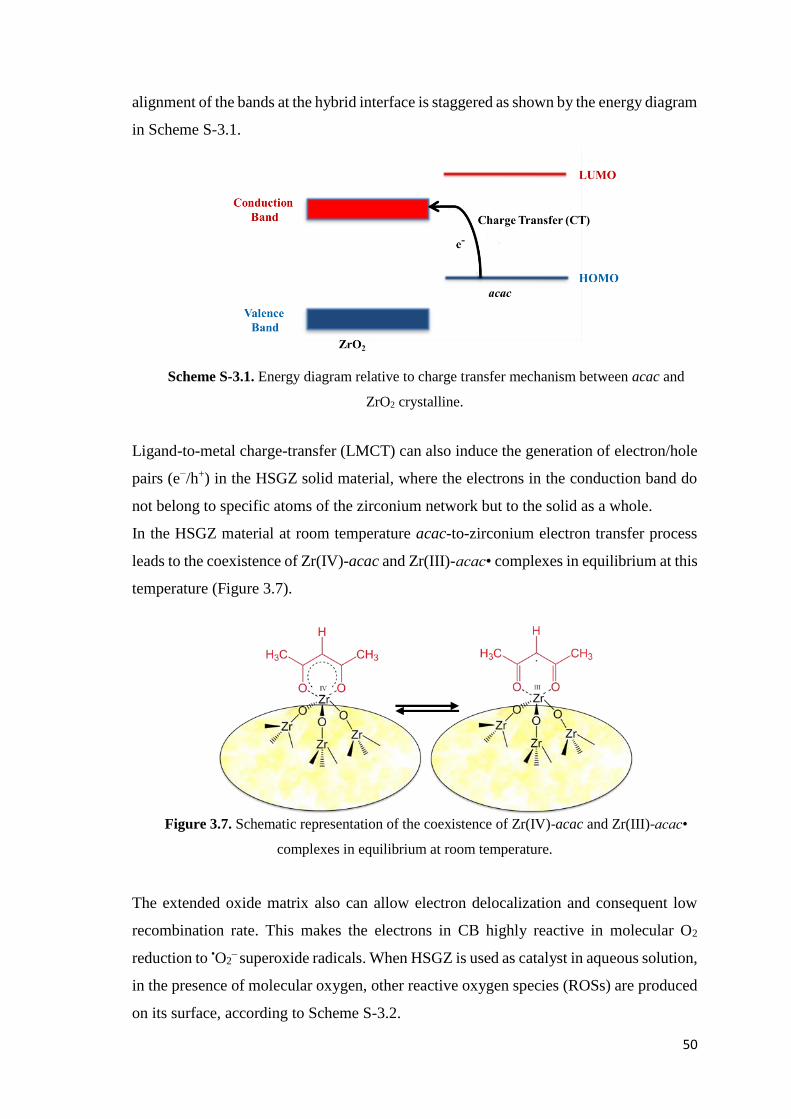
50
alignment of the bands at the hybrid interface is staggered as shown by the energy diagram
in Scheme S-3.1.
Scheme S-3.1. Energy diagram relative to charge transfer mechanism between acac and
ZrO2 crystalline.
Ligand-to-metal charge-transfer (LMCT) can also induce the generation of electron/hole
pairs (e−/h+) in the HSGZ solid material, where the electrons in the conduction band do
not belong to specific atoms of the zirconium network but to the solid as a whole.
In the HSGZ material at room temperature acac-to-zirconium electron transfer process
leads to the coexistence of Zr(IV)-acac and Zr(III)-acac• complexes in equilibrium at this
temperature (Figure 3.7).
Figure 3.7. Schematic representation of the coexistence of Zr(IV)-acac and Zr(III)-acac•
complexes in equilibrium at room temperature.
The extended oxide matrix also can allow electron delocalization and consequent low
recombination rate. This makes the electrons in CB highly reactive in molecular O2
reduction to •O2– superoxide radicals. When HSGZ is used as catalyst in aqueous solution,
in the presence of molecular oxygen, other reactive oxygen species (ROSs) are produced
on its surface, according to Scheme S-3.2.
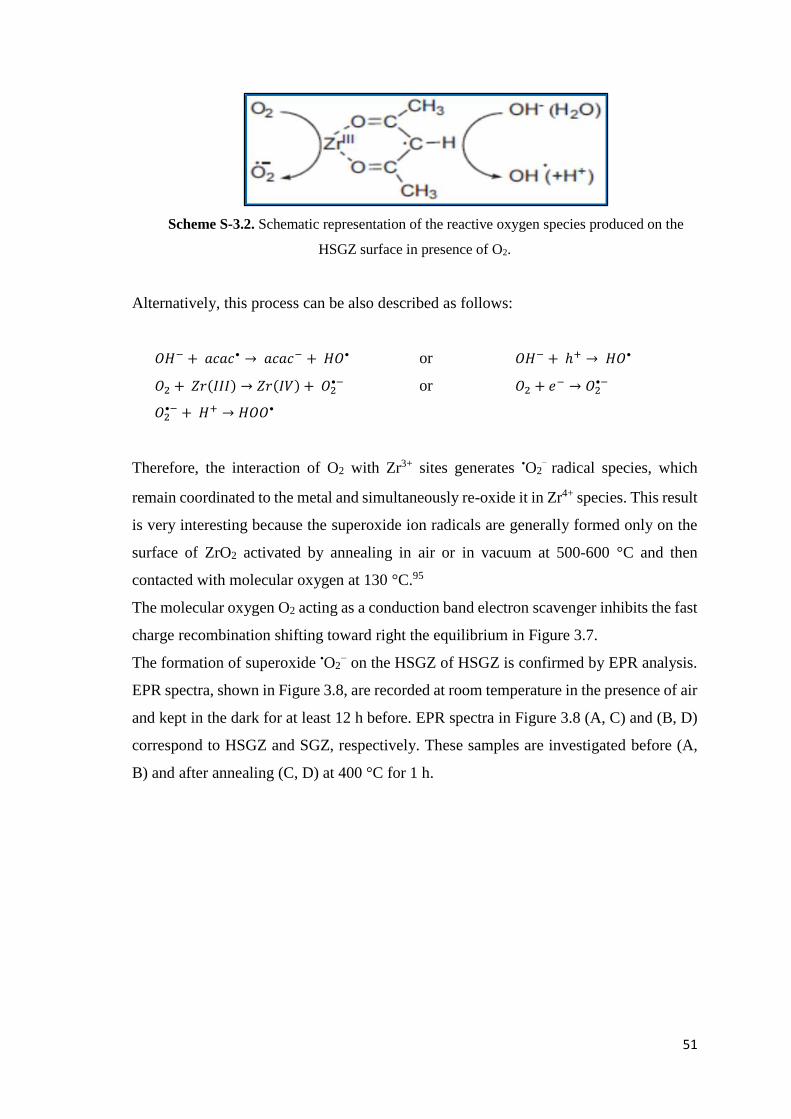
51
Scheme S-3.2. Schematic representation of the reactive oxygen species produced on the
HSGZ surface in presence of O2.
Alternatively, this process can be also described as follows:
𝑂𝐻− + 𝑎𝑐𝑎𝑐• → 𝑎𝑐𝑎𝑐− + 𝐻𝑂• or 𝑂𝐻− + ℎ+ → 𝐻𝑂•
𝑂2 + 𝑍𝑟(𝐼𝐼𝐼) → 𝑍𝑟(𝐼𝑉) + 𝑂2•− or 𝑂2 + 𝑒− → 𝑂2
•−
𝑂2•− + 𝐻+ → 𝐻𝑂𝑂•
Therefore, the interaction of O2 with Zr3+ sites generates •O2− radical species, which
remain coordinated to the metal and simultaneously re-oxide it in Zr4+ species. This result
is very interesting because the superoxide ion radicals are generally formed only on the
surface of ZrO2 activated by annealing in air or in vacuum at 500-600 °C and then
contacted with molecular oxygen at 130 °C.95
The molecular oxygen O2 acting as a conduction band electron scavenger inhibits the fast
charge recombination shifting toward right the equilibrium in Figure 3.7.
The formation of superoxide •O2− on the HSGZ of HSGZ is confirmed by EPR analysis.
EPR spectra, shown in Figure 3.8, are recorded at room temperature in the presence of air
and kept in the dark for at least 12 h before. EPR spectra in Figure 3.8 (A, C) and (B, D)
correspond to HSGZ and SGZ, respectively. These samples are investigated before (A,
B) and after annealing (C, D) at 400 °C for 1 h.
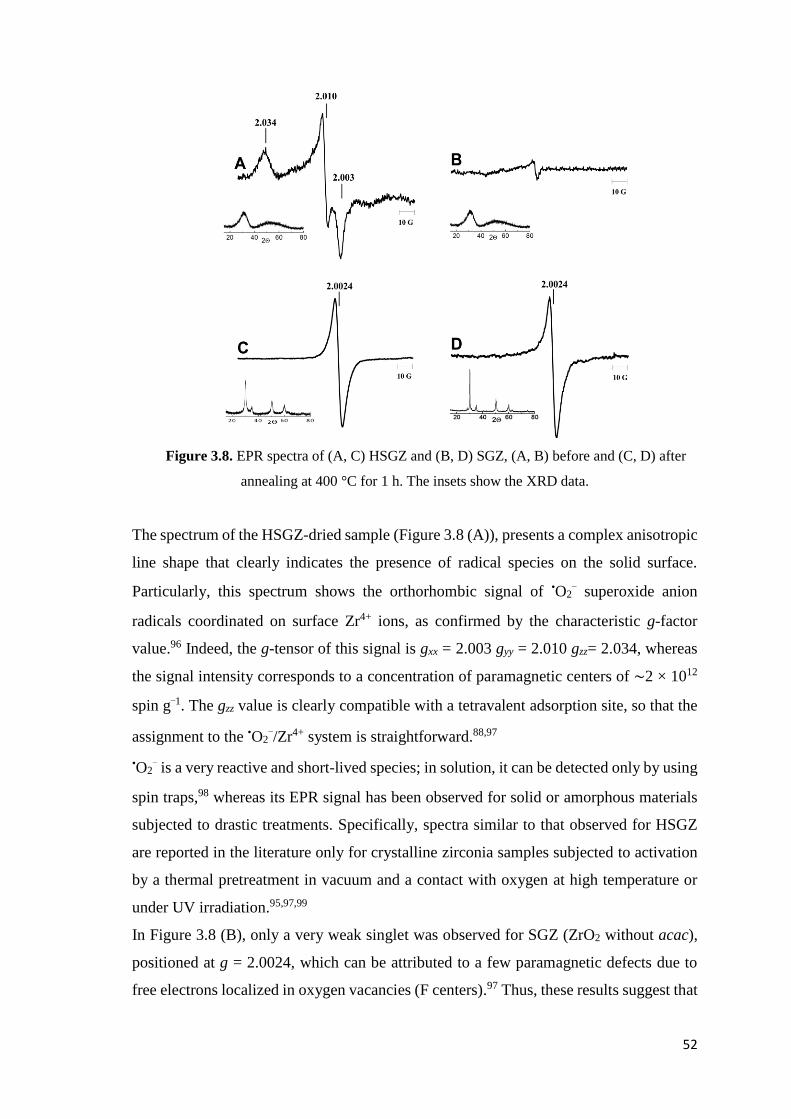
52
Figure 3.8. EPR spectra of (A, C) HSGZ and (B, D) SGZ, (A, B) before and (C, D) after
annealing at 400 °C for 1 h. The insets show the XRD data.
The spectrum of the HSGZ-dried sample (Figure 3.8 (A)), presents a complex anisotropic
line shape that clearly indicates the presence of radical species on the solid surface.
Particularly, this spectrum shows the orthorhombic signal of •O2− superoxide anion
radicals coordinated on surface Zr4+ ions, as confirmed by the characteristic g-factor
value.96 Indeed, the g-tensor of this signal is gxx = 2.003 gyy = 2.010 gzz= 2.034, whereas
the signal intensity corresponds to a concentration of paramagnetic centers of ∼2 × 10¹²
spin g−1. The gzz value is clearly compatible with a tetravalent adsorption site, so that the
assignment to the •O2−/Zr4+ system is straightforward.88,97
•O2− is a very reactive and short-lived species; in solution, it can be detected only by using
spin traps,98 whereas its EPR signal has been observed for solid or amorphous materials
subjected to drastic treatments. Specifically, spectra similar to that observed for HSGZ
are reported in the literature only for crystalline zirconia samples subjected to activation
by a thermal pretreatment in vacuum and a contact with oxygen at high temperature or
under UV irradiation.95,97,99
In Figure 3.8 (B), only a very weak singlet was observed for SGZ (ZrO2 without acac),
positioned at g = 2.0024, which can be attributed to a few paramagnetic defects due to
free electrons localized in oxygen vacancies (F centers).97 Thus, these results suggest that
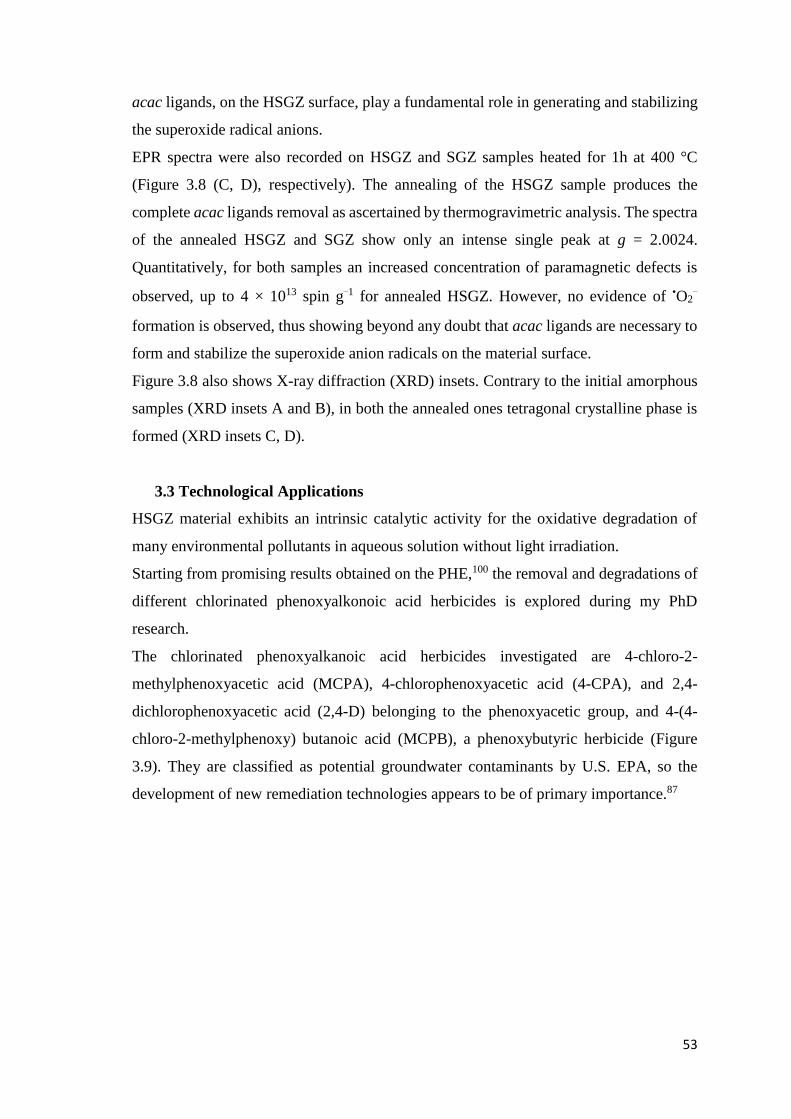
53
acac ligands, on the HSGZ surface, play a fundamental role in generating and stabilizing
the superoxide radical anions.
EPR spectra were also recorded on HSGZ and SGZ samples heated for 1h at 400 °C
(Figure 3.8 (C, D), respectively). The annealing of the HSGZ sample produces the
complete acac ligands removal as ascertained by thermogravimetric analysis. The spectra
of the annealed HSGZ and SGZ show only an intense single peak at g = 2.0024.
Quantitatively, for both samples an increased concentration of paramagnetic defects is
observed, up to 4 × 10¹³ spin g−1 for annealed HSGZ. However, no evidence of •O2−
formation is observed, thus showing beyond any doubt that acac ligands are necessary to
form and stabilize the superoxide anion radicals on the material surface.
Figure 3.8 also shows X-ray diffraction (XRD) insets. Contrary to the initial amorphous
samples (XRD insets A and B), in both the annealed ones tetragonal crystalline phase is
formed (XRD insets C, D).
3.3 Technological Applications
HSGZ material exhibits an intrinsic catalytic activity for the oxidative degradation of
many environmental pollutants in aqueous solution without light irradiation.
Starting from promising results obtained on the PHE,100 the removal and degradations of
different chlorinated phenoxyalkonoic acid herbicides is explored during my PhD
research.
The chlorinated phenoxyalkanoic acid herbicides investigated are 4-chloro-2-
methylphenoxyacetic acid (MCPA), 4-chlorophenoxyacetic acid (4-CPA), and 2,4-
dichlorophenoxyacetic acid (2,4-D) belonging to the phenoxyacetic group, and 4-(4-
chloro-2-methylphenoxy) butanoic acid (MCPB), a phenoxybutyric herbicide (Figure
3.9). They are classified as potential groundwater contaminants by U.S. EPA, so the
development of new remediation technologies appears to be of primary importance.87
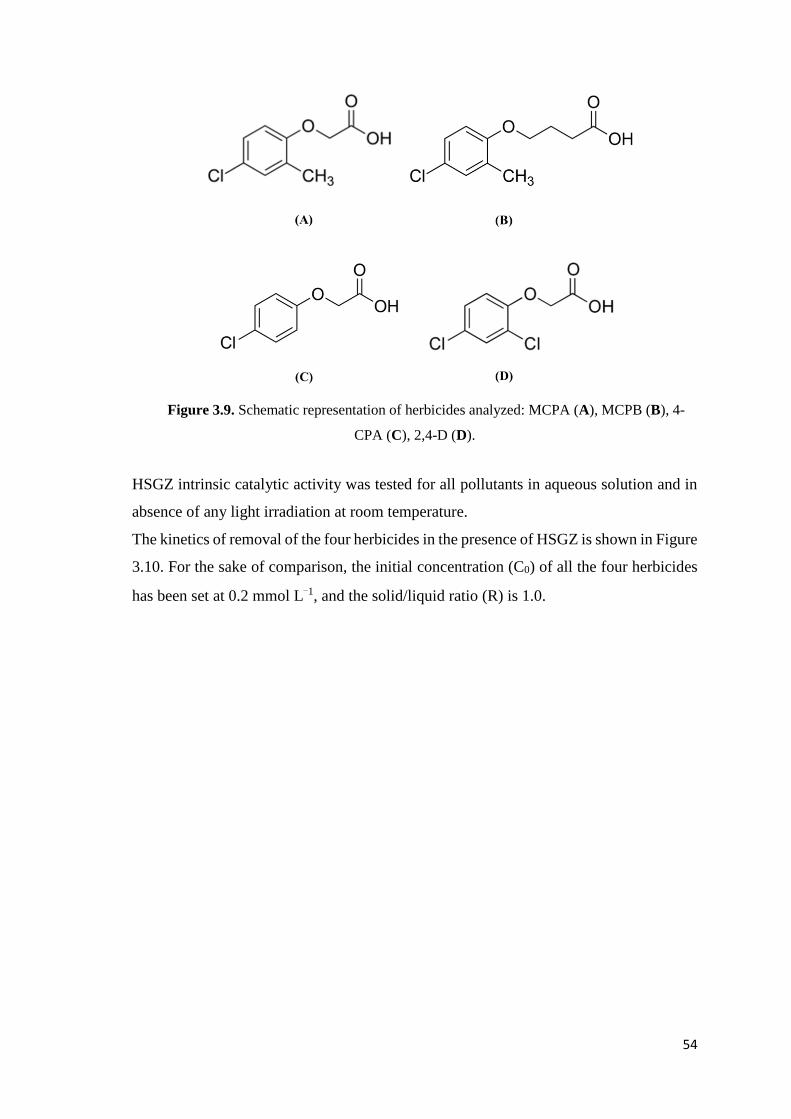
54
Figure 3.9. Schematic representation of herbicides analyzed: MCPA (A), MCPB (B), 4-
CPA (C), 2,4-D (D).
HSGZ intrinsic catalytic activity was tested for all pollutants in aqueous solution and in
absence of any light irradiation at room temperature.
The kinetics of removal of the four herbicides in the presence of HSGZ is shown in Figure
3.10. For the sake of comparison, the initial concentration (C0) of all the four herbicides
has been set at 0.2 mmol L−1, and the solid/liquid ratio (R) is 1.0.
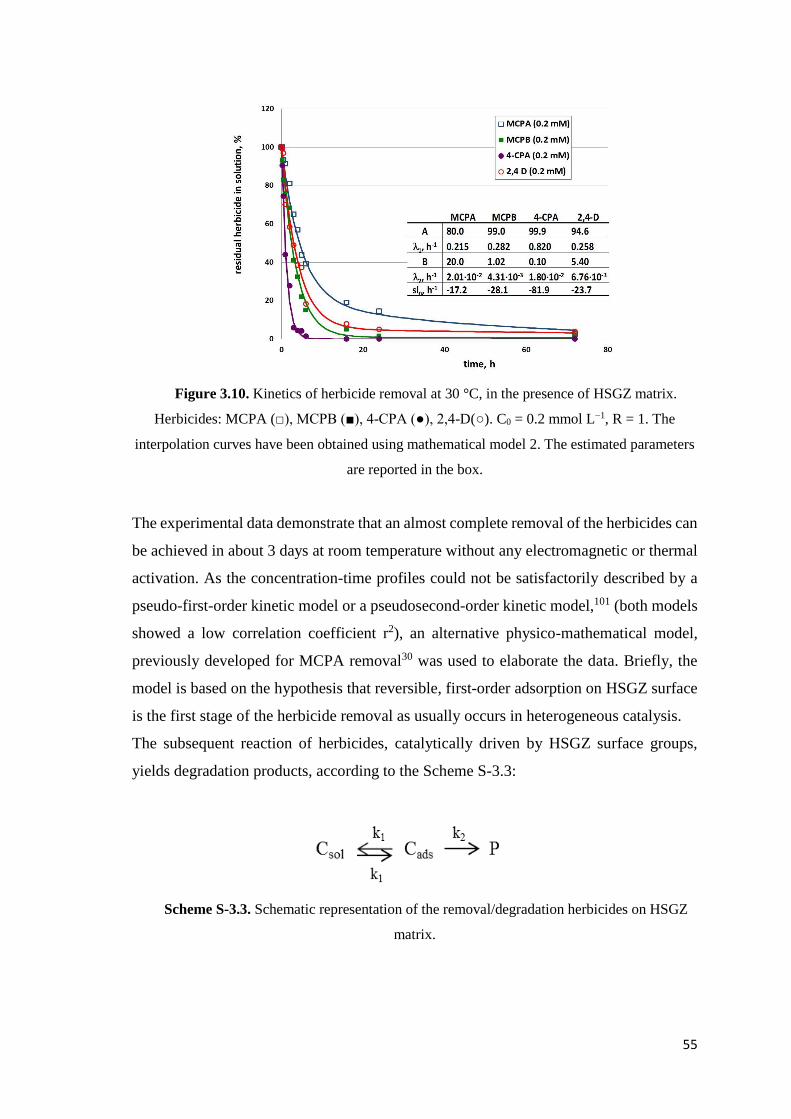
55
Figure 3.10. Kinetics of herbicide removal at 30 °C, in the presence of HSGZ matrix.
Herbicides: MCPA (□), MCPB (■), 4-CPA (●), 2,4-D(○). C0 = 0.2 mmol L−1, R = 1. The
interpolation curves have been obtained using mathematical model 2. The estimated parameters
are reported in the box.
The experimental data demonstrate that an almost complete removal of the herbicides can
be achieved in about 3 days at room temperature without any electromagnetic or thermal
activation. As the concentration-time profiles could not be satisfactorily described by a
pseudo-first-order kinetic model or a pseudosecond-order kinetic model,101 (both models
showed a low correlation coefficient r2), an alternative physico-mathematical model,
previously developed for MCPA removal30 was used to elaborate the data. Briefly, the
model is based on the hypothesis that reversible, first-order adsorption on HSGZ surface
is the first stage of the herbicide removal as usually occurs in heterogeneous catalysis.
The subsequent reaction of herbicides, catalytically driven by HSGZ surface groups,
yields degradation products, according to the Scheme S-3.3:
Scheme S-3.3. Schematic representation of the removal/degradation herbicides on HSGZ
matrix.
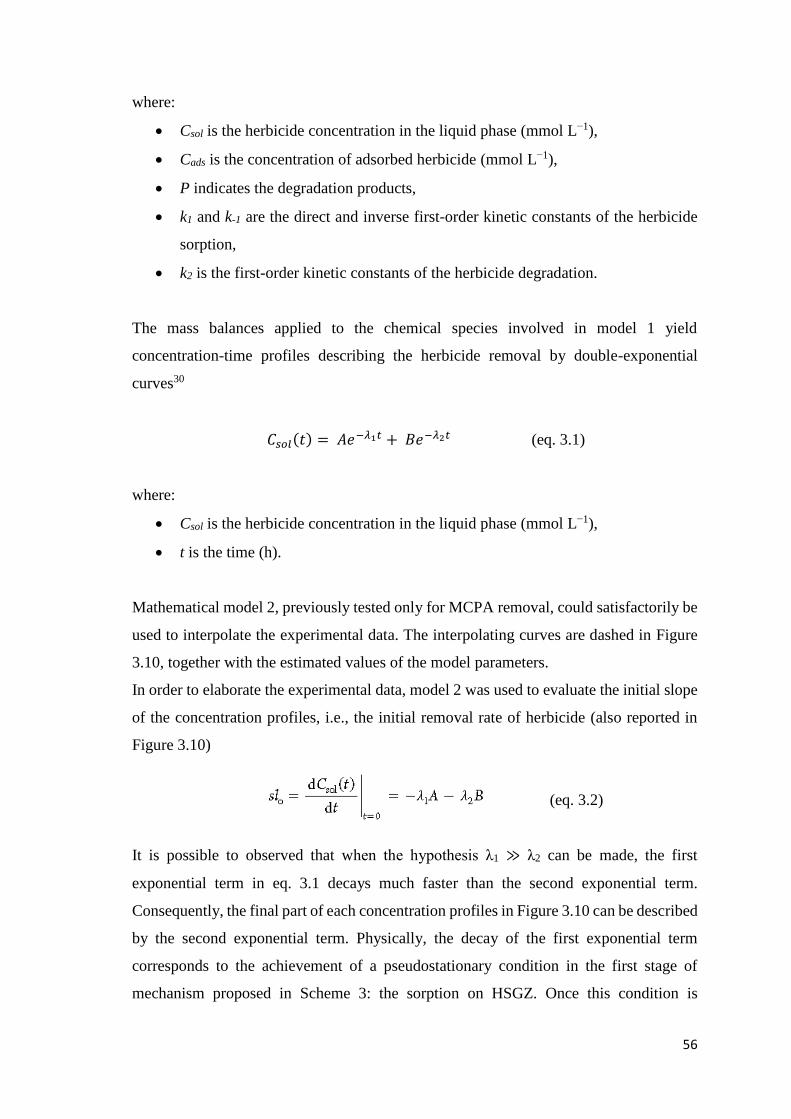
56
where:
Csol is the herbicide concentration in the liquid phase (mmol L−1),
Cads is the concentration of adsorbed herbicide (mmol L−1),
P indicates the degradation products,
k1 and k-1 are the direct and inverse first-order kinetic constants of the herbicide
sorption,
k2 is the first-order kinetic constants of the herbicide degradation.
The mass balances applied to the chemical species involved in model 1 yield
concentration-time profiles describing the herbicide removal by double-exponential
curves30
𝐶𝑠𝑜𝑙(𝑡) = 𝐴𝑒−𝜆1𝑡 + 𝐵𝑒−𝜆2𝑡 (eq. 3.1)
where:
Csol is the herbicide concentration in the liquid phase (mmol L−1),
t is the time (h).
Mathematical model 2, previously tested only for MCPA removal, could satisfactorily be
used to interpolate the experimental data. The interpolating curves are dashed in Figure
3.10, together with the estimated values of the model parameters.
In order to elaborate the experimental data, model 2 was used to evaluate the initial slope
of the concentration profiles, i.e., the initial removal rate of herbicide (also reported in
Figure 3.10)
(eq. 3.2)
It is possible to observed that when the hypothesis λ1 ≫ λ2 can be made, the first
exponential term in eq. 3.1 decays much faster than the second exponential term.
Consequently, the final part of each concentration profiles in Figure 3.10 can be described
by the second exponential term. Physically, the decay of the first exponential term
corresponds to the achievement of a pseudostationary condition in the first stage of
mechanism proposed in Scheme 3: the sorption on HSGZ. Once this condition is
57
achieved, further changes in the concentration profiles of herbicides are much slower, as
they reflect the kinetics of herbicide degradation (second stage in mechanism of Scheme
3.3), that is described by the second exponential term in eq. 3.1. Therefore, when λ1 ≫
λ2, the parameter λ2 can be assumed to coincide with the first-order kinetic constant of
the herbicide degradation (k2). On the other hand, the pre-exponential term B can be seen
as a measurement of the herbicide amount that remains in liquid phase once the
pseudostationary condition is reached.
Under the experimental conditions adopted to obtain the curves in Figure 3.10, the initial
removal rate of 4-CPA is significantly faster as compared to those observed when the
other herbicides are tested. This effect is due to the higher sorption rate, as the degradation
rate for 4-CPA is not faster than those pertaining to other herbicides.
The values of B are close to zero when using MCPB and 4-CPA, indicating that most of
herbicide was removed before the pseudostationary condition is reached. In the tests with
2,4-D and with MCPA, higher values of B are obtained. This indicates that the HSGZ is
not able to fully adsorb the herbicide, and the total solute removal is obtained slowly, as
the progressive degradation of the adsorbed herbicide shifted the sorption equilibrium.
However, the fastest degradation rate is observed in the presence of MCPA.
To clarify the effect of the herbicide concentration, removal tests were carried out
adopting, for each herbicide, C0 values close to solubility limits, as shown in Figure 3.11.
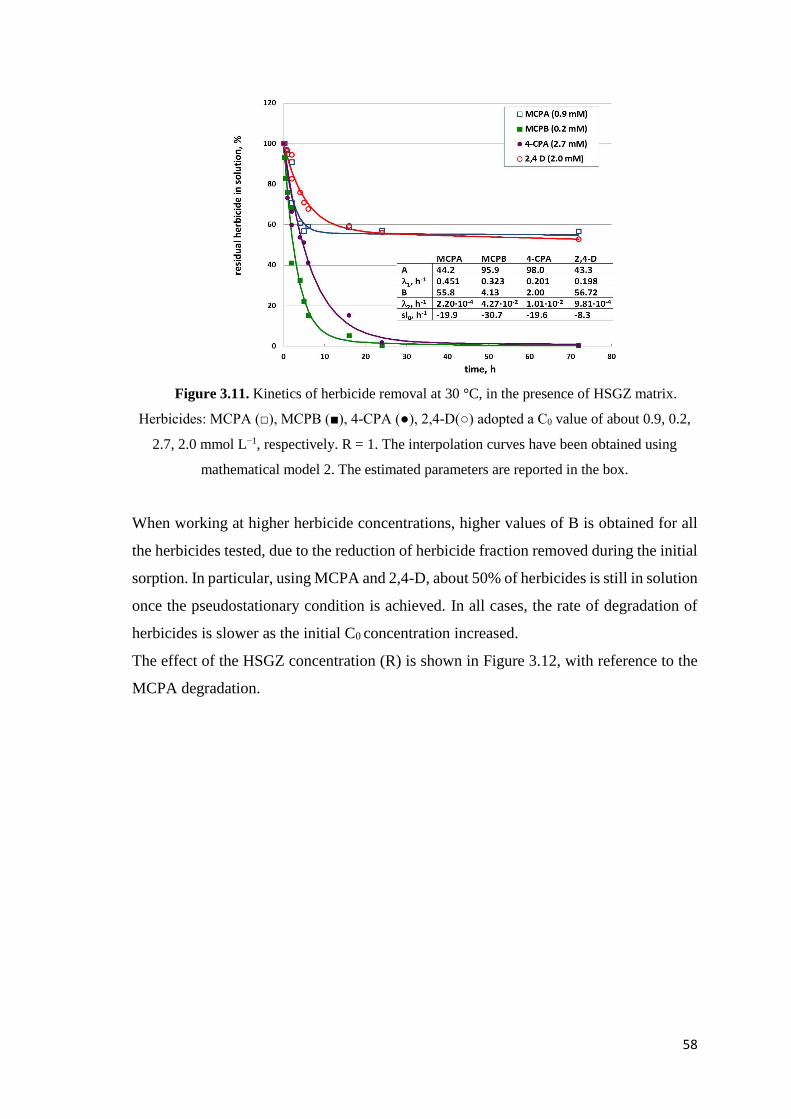
58
Figure 3.11. Kinetics of herbicide removal at 30 °C, in the presence of HSGZ matrix.
Herbicides: MCPA (□), MCPB (■), 4-CPA (●), 2,4-D(○) adopted a C0 value of about 0.9, 0.2,
2.7, 2.0 mmol L−1, respectively. R = 1. The interpolation curves have been obtained using
mathematical model 2. The estimated parameters are reported in the box.
When working at higher herbicide concentrations, higher values of B is obtained for all
the herbicides tested, due to the reduction of herbicide fraction removed during the initial
sorption. In particular, using MCPA and 2,4-D, about 50% of herbicides is still in solution
once the pseudostationary condition is achieved. In all cases, the rate of degradation of
herbicides is slower as the initial C0 concentration increased.
The effect of the HSGZ concentration (R) is shown in Figure 3.12, with reference to the
MCPA degradation.
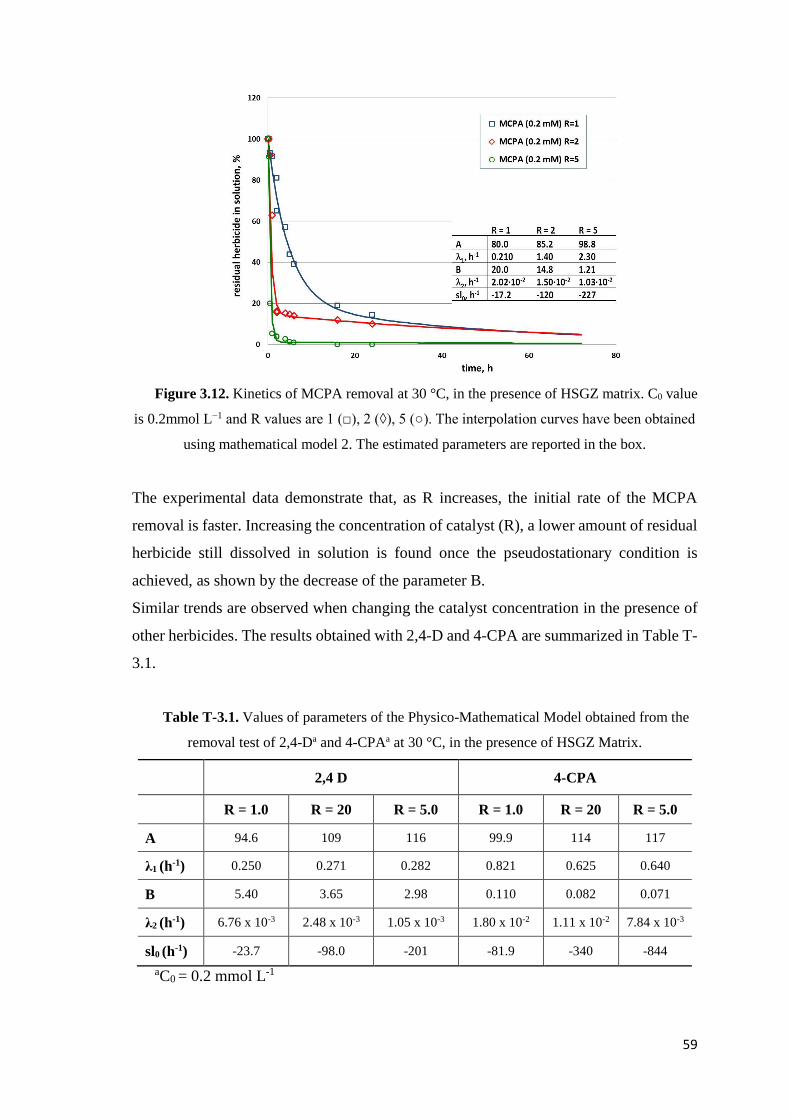
59
Figure 3.12. Kinetics of MCPA removal at 30 °C, in the presence of HSGZ matrix. C0 value
is 0.2mmol L−1 and R values are 1 (□), 2 (◊), 5 (○). The interpolation curves have been obtained
using mathematical model 2. The estimated parameters are reported in the box.
The experimental data demonstrate that, as R increases, the initial rate of the MCPA
removal is faster. Increasing the concentration of catalyst (R), a lower amount of residual
herbicide still dissolved in solution is found once the pseudostationary condition is
achieved, as shown by the decrease of the parameter B.
Similar trends are observed when changing the catalyst concentration in the presence of
other herbicides. The results obtained with 2,4-D and 4-CPA are summarized in Table T-
3.1.
Table T-3.1. Values of parameters of the Physico-Mathematical Model obtained from the
removal test of 2,4-Da and 4-CPAa at 30 °C, in the presence of HSGZ Matrix.
2,4 D 4-CPA
R = 1.0 R = 20 R = 5.0 R = 1.0 R = 20 R = 5.0
A 94.6 109 116 99.9 114 117
λ1 (h-1) 0.250 0.271 0.282 0.821 0.625 0.640
B 5.40 3.65 2.98 0.110 0.082 0.071
λ2 (h-1) 6.76 x 10⁻³ 2.48 x 10⁻³ 1.05 x 10⁻³ 1.80 x 10⁻² 1.11 x 10⁻² 7.84 x 10⁻³
sl0 (h-1) -23.7 -98.0 -201 -81.9 -340 -844
aC0 = 0.2 mmol L-1
60
Again, increases in the zirconia concentration (R) produce higher values of the initial rate
of the MCPA removal, as well as lower values of the parameter B.
When adopting MCPA concentration not above 0.2 mmol L−1, a complete herbicide
removal is obtained in a treatment time of 24-72 h. On the basis of these results, it can be
observed that the kinetics of herbicide removal by sorption/degradation mechanism using
HSGZ is comparable to that obtained by photodegradation,102,103 and in any case they
were much faster in comparison to ones achieved by bio-augmentation.104
This ability is due to facility to produce free radicals formed by an intramolecular LMCT
mechanism, confirmed by structural characterization (UV-vis DR and EPR
spectroscopy).
3.3.1 Long-Term Application
To evaluate the suitability of the HSGZ matrix for commercial application, the long-term
performance of its was tested by repeated batch cycles of MCPB removal (Figure 3.13).
Each batch sorption cycle was carried out for 1 h at 30 °C and R = 10, restoring the initial
concentration of MCPB (0.2 mmol L−1) after each test.
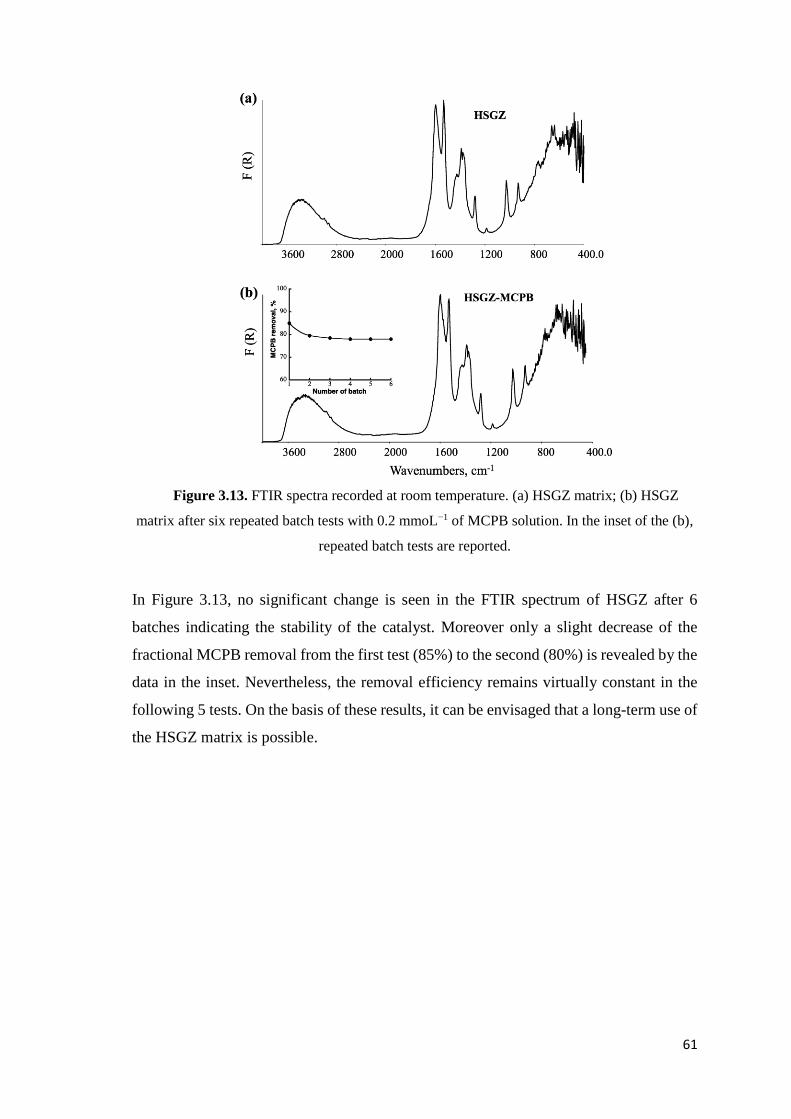
61
Figure 3.13. FTIR spectra recorded at room temperature. (a) HSGZ matrix; (b) HSGZ
matrix after six repeated batch tests with 0.2 mmoL−1 of MCPB solution. In the inset of the (b),
repeated batch tests are reported.
In Figure 3.13, no significant change is seen in the FTIR spectrum of HSGZ after 6
batches indicating the stability of the catalyst. Moreover only a slight decrease of the
fractional MCPB removal from the first test (85%) to the second (80%) is revealed by the
data in the inset. Nevertheless, the removal efficiency remains virtually constant in the
following 5 tests. On the basis of these results, it can be envisaged that a long-term use of
the HSGZ matrix is possible.

62
RESULTS AND DISCUSSION
PART 2A
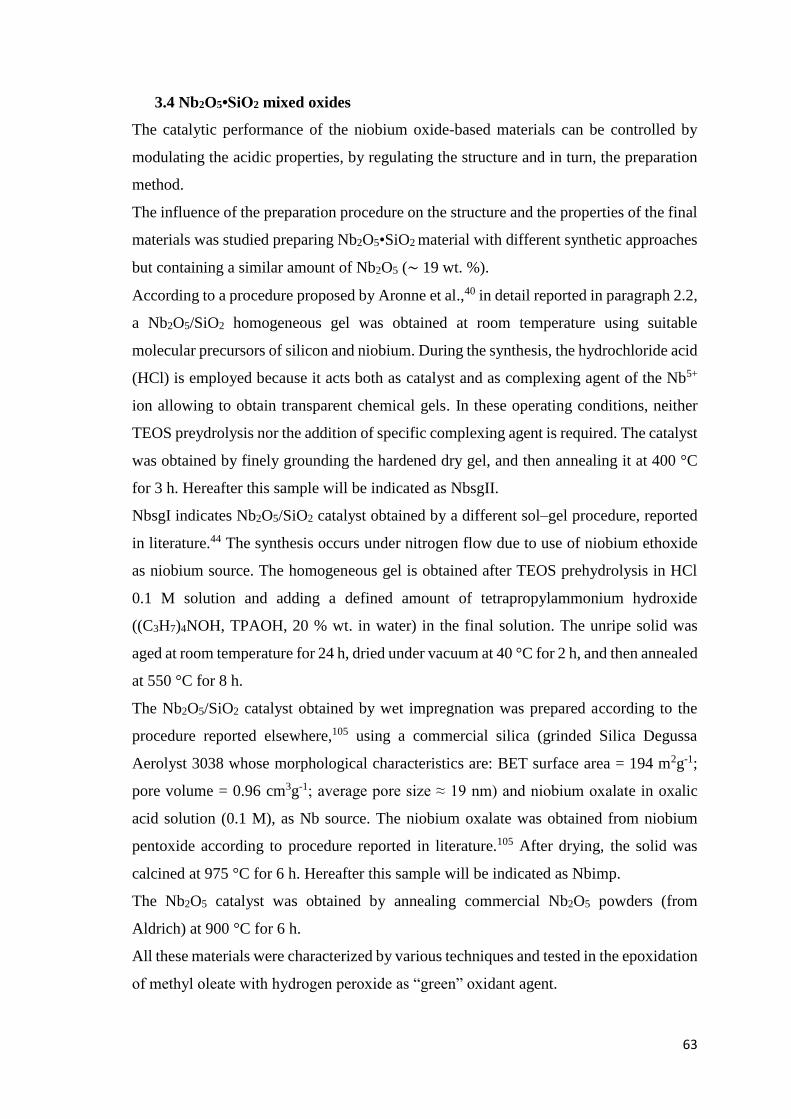
63
3.4 Nb2O5•SiO2 mixed oxides
The catalytic performance of the niobium oxide-based materials can be controlled by
modulating the acidic properties, by regulating the structure and in turn, the preparation
method.
The influence of the preparation procedure on the structure and the properties of the final
materials was studied preparing Nb2O5•SiO2 material with different synthetic approaches
but containing a similar amount of Nb2O5 (∼ 19 wt. %).
According to a procedure proposed by Aronne et al.,40 in detail reported in paragraph 2.2,
a Nb2O5/SiO2 homogeneous gel was obtained at room temperature using suitable
molecular precursors of silicon and niobium. During the synthesis, the hydrochloride acid
(HCl) is employed because it acts both as catalyst and as complexing agent of the Nb5+
ion allowing to obtain transparent chemical gels. In these operating conditions, neither
TEOS preydrolysis nor the addition of specific complexing agent is required. The catalyst
was obtained by finely grounding the hardened dry gel, and then annealing it at 400 °C
for 3 h. Hereafter this sample will be indicated as NbsgII.
NbsgI indicates Nb2O5/SiO2 catalyst obtained by a different sol–gel procedure, reported
in literature.44 The synthesis occurs under nitrogen flow due to use of niobium ethoxide
as niobium source. The homogeneous gel is obtained after TEOS prehydrolysis in HCl
0.1 M solution and adding a defined amount of tetrapropylammonium hydroxide
((C3H7)4NOH, TPAOH, 20 % wt. in water) in the final solution. The unripe solid was
aged at room temperature for 24 h, dried under vacuum at 40 °C for 2 h, and then annealed
at 550 °C for 8 h.
The Nb2O5/SiO2 catalyst obtained by wet impregnation was prepared according to the
procedure reported elsewhere,105 using a commercial silica (grinded Silica Degussa
Aerolyst 3038 whose morphological characteristics are: BET surface area = 194 m2g-1;
pore volume = 0.96 cm3g-1; average pore size ≈ 19 nm) and niobium oxalate in oxalic
acid solution (0.1 M), as Nb source. The niobium oxalate was obtained from niobium
pentoxide according to procedure reported in literature.105 After drying, the solid was
calcined at 975 °C for 6 h. Hereafter this sample will be indicated as Nbimp.
The Nb2O5 catalyst was obtained by annealing commercial Nb2O5 powders (from
Aldrich) at 900 °C for 6 h.
All these materials were characterized by various techniques and tested in the epoxidation
of methyl oleate with hydrogen peroxide as “green” oxidant agent.
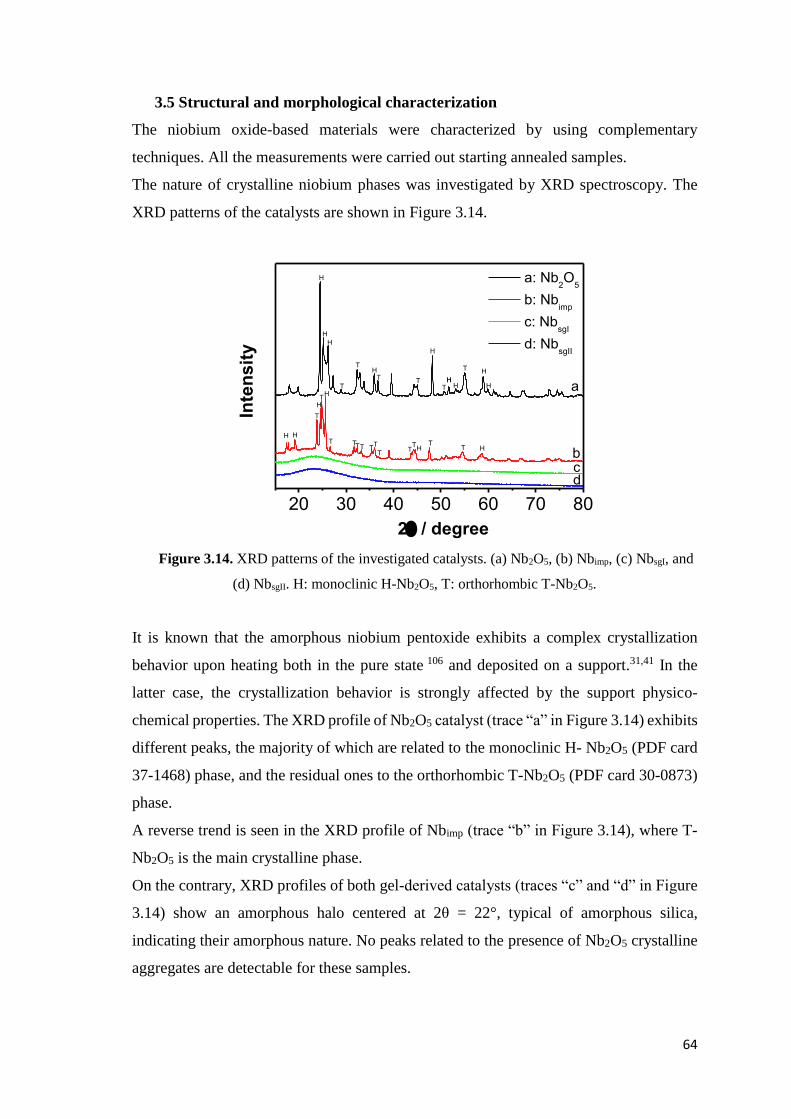
64
3.5 Structural and morphological characterization
The niobium oxide-based materials were characterized by using complementary
techniques. All the measurements were carried out starting annealed samples.
The nature of crystalline niobium phases was investigated by XRD spectroscopy. The
XRD patterns of the catalysts are shown in Figure 3.14.
Figure 3.14. XRD patterns of the investigated catalysts. (a) Nb2O5, (b) Nbimp, (c) NbsgI, and
(d) NbsgII. H: monoclinic H-Nb2O5, T: orthorhombic T-Nb2O5.
It is known that the amorphous niobium pentoxide exhibits a complex crystallization
behavior upon heating both in the pure state 106 and deposited on a support.31,41 In the
latter case, the crystallization behavior is strongly affected by the support physico-
chemical properties. The XRD profile of Nb2O5 catalyst (trace “a” in Figure 3.14) exhibits
different peaks, the majority of which are related to the monoclinic H- Nb2O5 (PDF card
37-1468) phase, and the residual ones to the orthorhombic T-Nb2O5 (PDF card 30-0873)
phase.
A reverse trend is seen in the XRD profile of Nbimp (trace “b” in Figure 3.14), where T-
Nb2O5 is the main crystalline phase.
On the contrary, XRD profiles of both gel-derived catalysts (traces “c” and “d” in Figure
3.14) show an amorphous halo centered at 2θ = 22°, typical of amorphous silica,
indicating their amorphous nature. No peaks related to the presence of Nb2O5 crystalline
aggregates are detectable for these samples.
20 30 40 50 60 70 80
H
H
TTT
TT
TTT
THHT
H
H H
H
T
T
T H
H
H
T
HTT
HT
T
T
H
H
b
a
c
a: Nb2O
5
b: Nbimp
c: NbsgI
d: NbsgII
In
ten
sit
y
2 / degree
d
H
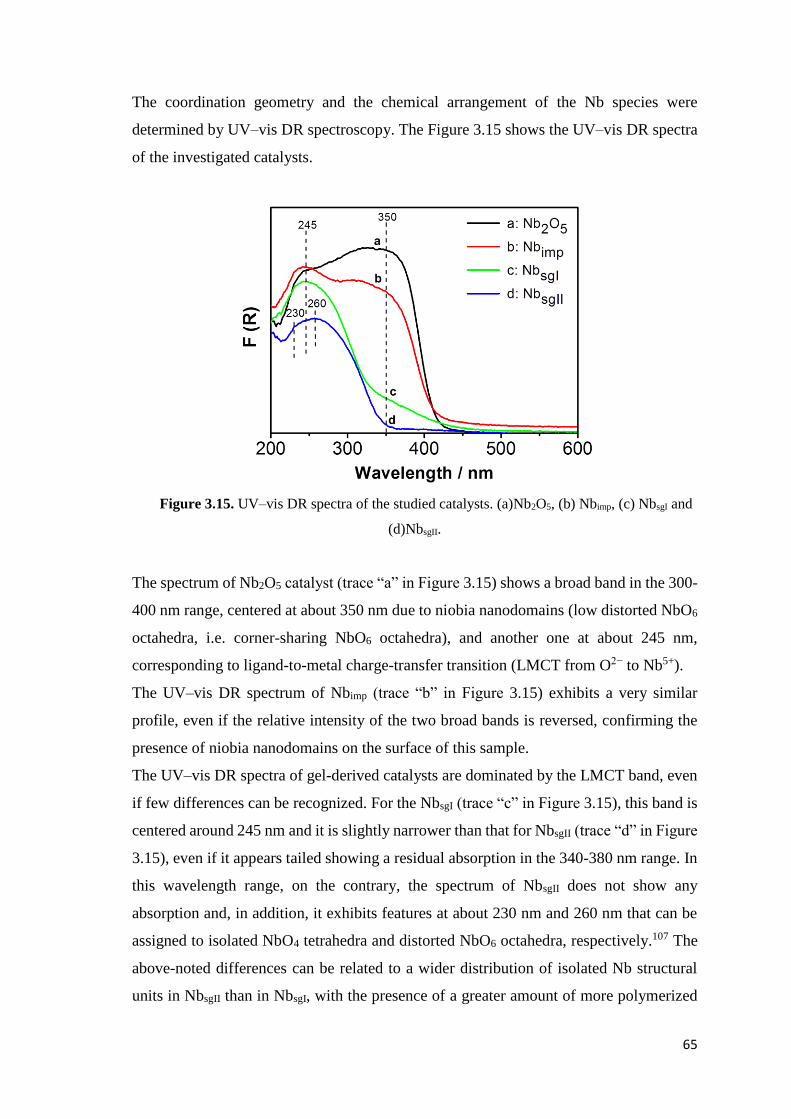
65
The coordination geometry and the chemical arrangement of the Nb species were
determined by UV–vis DR spectroscopy. The Figure 3.15 shows the UV–vis DR spectra
of the investigated catalysts.
Figure 3.15. UV–vis DR spectra of the studied catalysts. (a)Nb2O5, (b) Nbimp, (c) NbsgI and
(d)NbsgII.
The spectrum of Nb2O5 catalyst (trace “a” in Figure 3.15) shows a broad band in the 300-
400 nm range, centered at about 350 nm due to niobia nanodomains (low distorted NbO6
octahedra, i.e. corner-sharing NbO6 octahedra), and another one at about 245 nm,
corresponding to ligand-to-metal charge-transfer transition (LMCT from O2− to Nb5+).
The UV–vis DR spectrum of Nbimp (trace “b” in Figure 3.15) exhibits a very similar
profile, even if the relative intensity of the two broad bands is reversed, confirming the
presence of niobia nanodomains on the surface of this sample.
The UV–vis DR spectra of gel-derived catalysts are dominated by the LMCT band, even
if few differences can be recognized. For the NbsgI (trace “c” in Figure 3.15), this band is
centered around 245 nm and it is slightly narrower than that for NbsgII (trace “d” in Figure
3.15), even if it appears tailed showing a residual absorption in the 340-380 nm range. In
this wavelength range, on the contrary, the spectrum of NbsgII does not show any
absorption and, in addition, it exhibits features at about 230 nm and 260 nm that can be
assigned to isolated NbO4 tetrahedra and distorted NbO6 octahedra, respectively.107 The
above-noted differences can be related to a wider distribution of isolated Nb structural
units in NbsgII than in NbsgI, with the presence of a greater amount of more polymerized
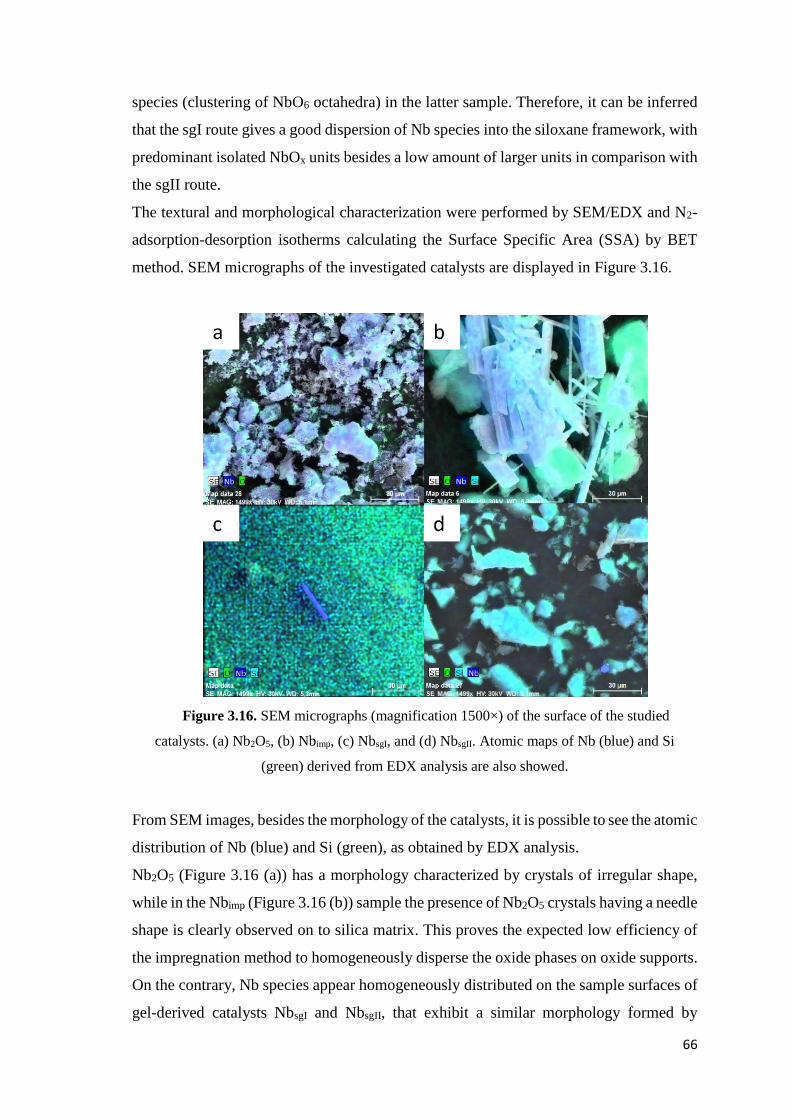
66
species (clustering of NbO6 octahedra) in the latter sample. Therefore, it can be inferred
that the sgI route gives a good dispersion of Nb species into the siloxane framework, with
predominant isolated NbOx units besides a low amount of larger units in comparison with
the sgII route.
The textural and morphological characterization were performed by SEM/EDX and N2-
adsorption-desorption isotherms calculating the Surface Specific Area (SSA) by BET
method. SEM micrographs of the investigated catalysts are displayed in Figure 3.16.
Figure 3.16. SEM micrographs (magnification 1500×) of the surface of the studied
catalysts. (a) Nb2O5, (b) Nbimp, (c) NbsgI, and (d) NbsgII. Atomic maps of Nb (blue) and Si
(green) derived from EDX analysis are also showed.
From SEM images, besides the morphology of the catalysts, it is possible to see the atomic
distribution of Nb (blue) and Si (green), as obtained by EDX analysis.
Nb2O5 (Figure 3.16 (a)) has a morphology characterized by crystals of irregular shape,
while in the Nbimp (Figure 3.16 (b)) sample the presence of Nb2O5 crystals having a needle
shape is clearly observed on to silica matrix. This proves the expected low efficiency of
the impregnation method to homogeneously disperse the oxide phases on oxide supports.
On the contrary, Nb species appear homogeneously distributed on the sample surfaces of
gel-derived catalysts NbsgI and NbsgII, that exhibit a similar morphology formed by
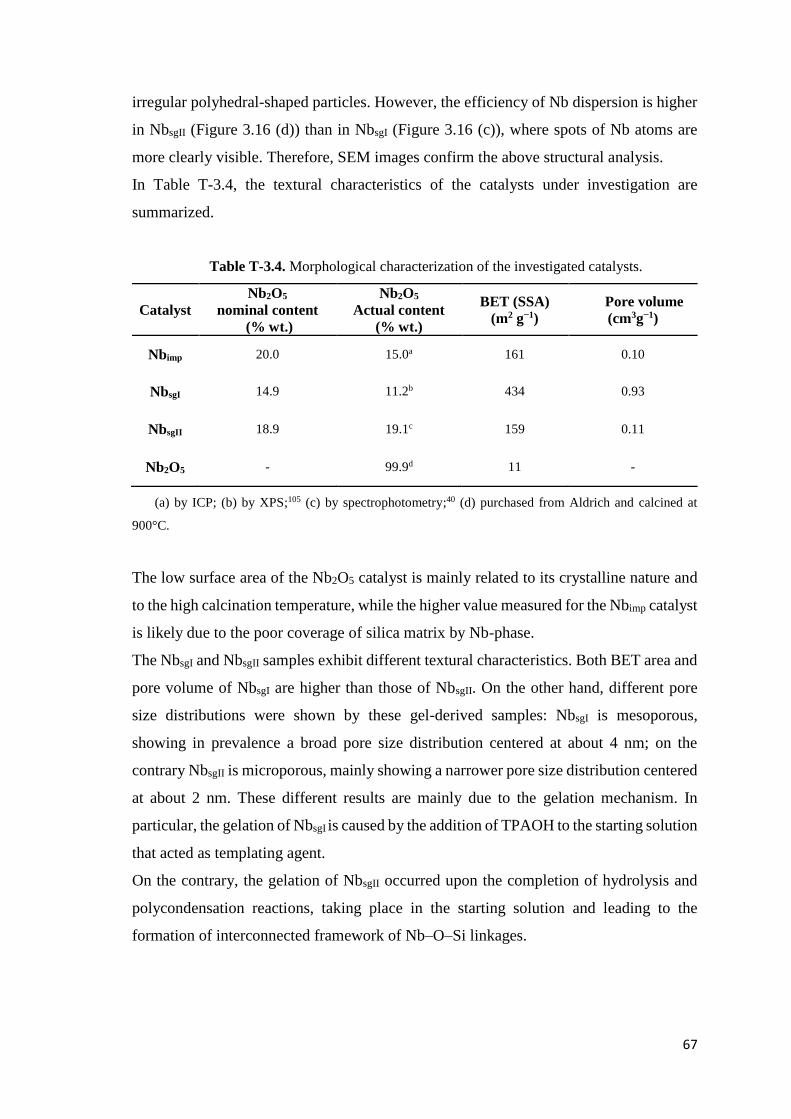
67
irregular polyhedral-shaped particles. However, the efficiency of Nb dispersion is higher
in NbsgII (Figure 3.16 (d)) than in NbsgI (Figure 3.16 (c)), where spots of Nb atoms are
more clearly visible. Therefore, SEM images confirm the above structural analysis.
In Table T-3.4, the textural characteristics of the catalysts under investigation are
summarized.
Table T-3.4. Morphological characterization of the investigated catalysts.
Catalyst
Nb2O5
nominal content
(% wt.)
Nb2O5
Actual content
(% wt.)
BET (SSA)
(m2 g−1)
Pore volume
(cm3g−1)
Nbimp 20.0 15.0a 161 0.10
NbsgI 14.9 11.2b 434 0.93
NbsgII 18.9 19.1c 159 0.11
Nb2O5 - 99.9d 11 -
(a) by ICP; (b) by XPS;105 (c) by spectrophotometry;40 (d) purchased from Aldrich and calcined at
900°C.
The low surface area of the Nb2O5 catalyst is mainly related to its crystalline nature and
to the high calcination temperature, while the higher value measured for the Nbimp catalyst
is likely due to the poor coverage of silica matrix by Nb-phase.
The NbsgI and NbsgII samples exhibit different textural characteristics. Both BET area and
pore volume of NbsgI are higher than those of NbsgII. On the other hand, different pore
size distributions were shown by these gel-derived samples: NbsgI is mesoporous,
showing in prevalence a broad pore size distribution centered at about 4 nm; on the
contrary NbsgII is microporous, mainly showing a narrower pore size distribution centered
at about 2 nm. These different results are mainly due to the gelation mechanism. In
particular, the gelation of NbsgI is caused by the addition of TPAOH to the starting solution
that acted as templating agent.
On the contrary, the gelation of NbsgII occurred upon the completion of hydrolysis and
polycondensation reactions, taking place in the starting solution and leading to the
formation of interconnected framework of Nb–O–Si linkages.
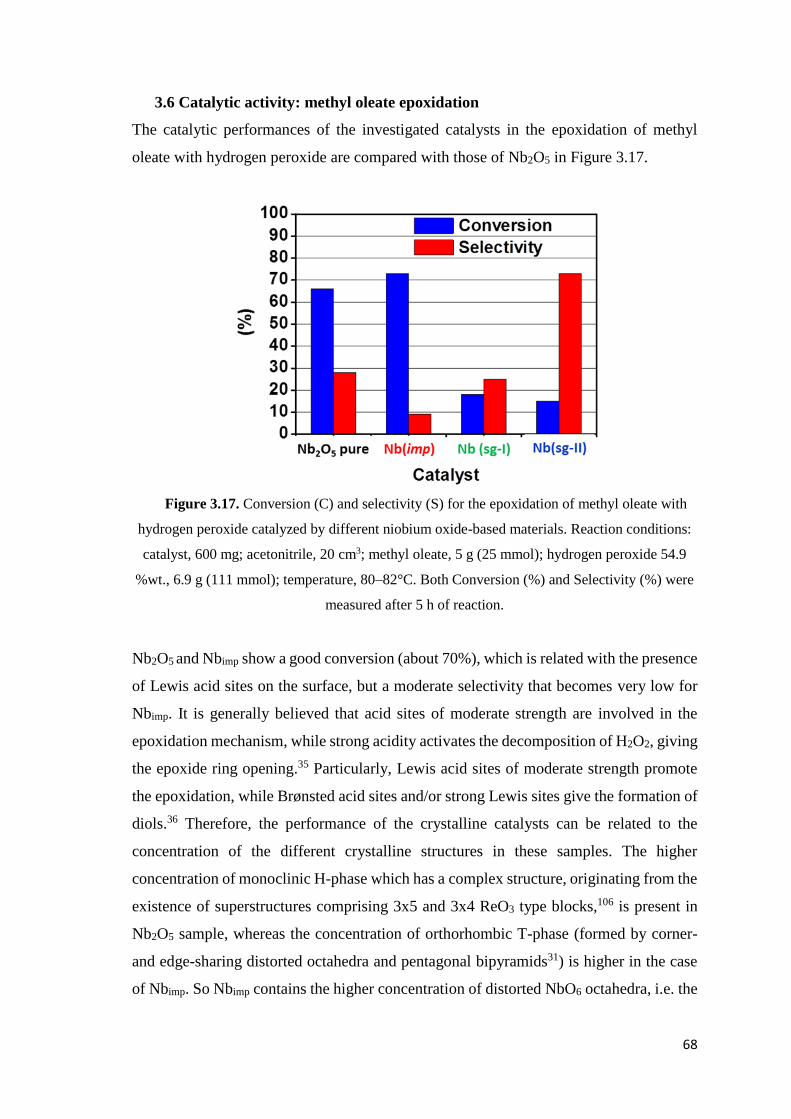
68
3.6 Catalytic activity: methyl oleate epoxidation
The catalytic performances of the investigated catalysts in the epoxidation of methyl
oleate with hydrogen peroxide are compared with those of Nb2O5 in Figure 3.17.
Figure 3.17. Conversion (C) and selectivity (S) for the epoxidation of methyl oleate with
hydrogen peroxide catalyzed by different niobium oxide-based materials. Reaction conditions:
catalyst, 600 mg; acetonitrile, 20 cm3; methyl oleate, 5 g (25 mmol); hydrogen peroxide 54.9
%wt., 6.9 g (111 mmol); temperature, 80–82°C. Both Conversion (%) and Selectivity (%) were
measured after 5 h of reaction.
Nb2O5 and Nbimp show a good conversion (about 70%), which is related with the presence
of Lewis acid sites on the surface, but a moderate selectivity that becomes very low for
Nbimp. It is generally believed that acid sites of moderate strength are involved in the
epoxidation mechanism, while strong acidity activates the decomposition of H2O2, giving
the epoxide ring opening.35 Particularly, Lewis acid sites of moderate strength promote
the epoxidation, while Brønsted acid sites and/or strong Lewis sites give the formation of
diols.36 Therefore, the performance of the crystalline catalysts can be related to the
concentration of the different crystalline structures in these samples. The higher
concentration of monoclinic H-phase which has a complex structure, originating from the
existence of superstructures comprising 3x5 and 3x4 ReO3 type blocks,106 is present in
Nb2O5 sample, whereas the concentration of orthorhombic T-phase (formed by corner-
and edge-sharing distorted octahedra and pentagonal bipyramids31) is higher in the case
of Nbimp. So Nbimp contains the higher concentration of distorted NbO6 octahedra, i.e. the
69
higher concentration of Brønsted acid sites and consequently it exhibits the lower
selectivity.
Both gel-derived catalysts exhibit a moderate conversion (about 15%), while their
selectivity is greatly different. NbsgII shows the highest selectivity (about 70%) among all
the investigated catalysts. This behavior can be related to two diverse characteristics of
the gel-derived catalysts that are related to each other: the dispersion degree of the active
phase (NbO4 tetrahedra) into the siloxane matrix and the distribution of the surface acid
sites.
According with recent results obtained for the epoxidation with H2O2,108,109 the presence
of only Nb species in tetrahedral coordination seems to be the key point to determinate
the selectivity to epoxide. As shown in Figure 3.15, NbsgII exhibits a wider distribution of
isolated Nb structural units than NbsgI that, on the contrary, shows a greater amount of
more polymerized species (clustering of NbO6 octahedra) than NbsgII. Therefore the
distribution of the surface acid sites in these samples is very different. The concentration
of Lewis acid sites results higher for NbsgII than NbsgI and, at the same time, the
concentration of Brønsted acid sites is higher in NbsgI than in NbsgII, yielding the higher
selectivity to epoxide for the NbsgII catalyst.

70
RESULTS AND DISCUSSION
PART 2B
71
3.7 Ru/RuO2@Nb2O5•SiO2 (RNS) system
Ru-based mixed oxide (Ru/RuO2@Nb2O5-SiO2) was obtained by an innovative sol-gel
synthesis wholly performed at room temperature and characterized by both easy handling
of precursors and the lack of toxic or pollutant reactants. A homogeneous gel is obtained
starting from niobium (V) chloride and tetraethoxysilane (TEOS) as precursors of the
matrix and adding in it a proper amount of ruthenium chloride (~ 6 wt. %). In order to
control the porosity of the final material, two specific amount (0.04 and 0.16 % mol.,
0.04B-RNS and 0.16B-RNS, respectively) of a nonionic surfactant (polyethylene glycol
hexadecyl ether, Brij-C10) were added directly into starting solution of precursors. In this
way, the surfactant can play a double role: i) as pore-directing agent and ii) as oxygen-
rich complexing agent of the metallic species. The influence of Brij-C10 incorporation
on porous structure, size and dispersion of ruthenium nanoparticles was investigated in
detail by structural, morphological and textural characterization.
Ru-based materials were tested in the hydrogenation of levulinc acid to γ-valerolactone
by a one-pot mechanism due to acidic (Nb2O5-SiO2 matrix) and redox (Ru metal)
functionalities of these bifunctional catalysts.
3.8 Thermal, structural and morphological characterization
Thermal, structural and morphological measurements were carried out starting from the
dried gel and including gels annealed at 500 °C. This temperature stands at the minimum
value at which it is possible to obtain stable and fully amorphous inorganic gel-derived
materials for all studied compositions, characterized by considerable residual porosity.
Thermal behaviour of RNS dried gel was investigated by TG/DTA analysis. Figure 3.17
shows the TG/DTA curves of the RNS dried gel.
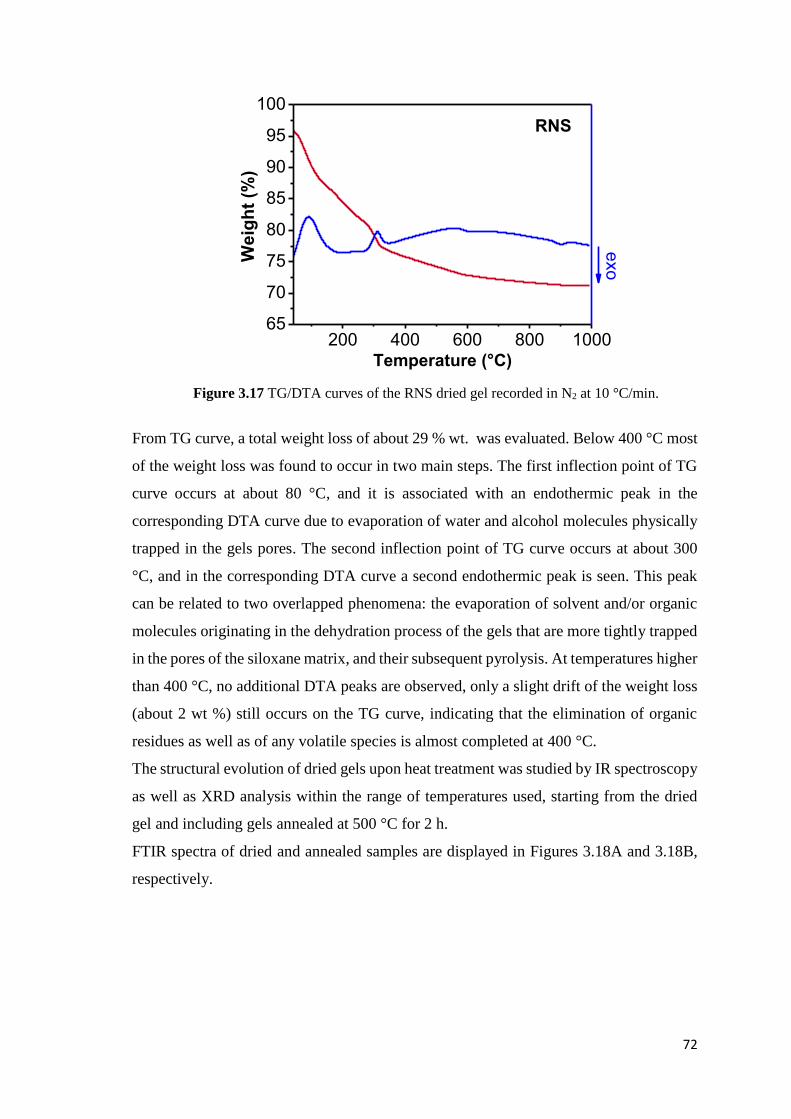
72
Figure 3.17 TG/DTA curves of the RNS dried gel recorded in N2 at 10 °C/min.
From TG curve, a total weight loss of about 29 % wt. was evaluated. Below 400 °C most
of the weight loss was found to occur in two main steps. The first inflection point of TG
curve occurs at about 80 °C, and it is associated with an endothermic peak in the
corresponding DTA curve due to evaporation of water and alcohol molecules physically
trapped in the gels pores. The second inflection point of TG curve occurs at about 300
°C, and in the corresponding DTA curve a second endothermic peak is seen. This peak
can be related to two overlapped phenomena: the evaporation of solvent and/or organic
molecules originating in the dehydration process of the gels that are more tightly trapped
in the pores of the siloxane matrix, and their subsequent pyrolysis. At temperatures higher
than 400 °C, no additional DTA peaks are observed, only a slight drift of the weight loss
(about 2 wt %) still occurs on the TG curve, indicating that the elimination of organic
residues as well as of any volatile species is almost completed at 400 °C.
The structural evolution of dried gels upon heat treatment was studied by IR spectroscopy
as well as XRD analysis within the range of temperatures used, starting from the dried
gel and including gels annealed at 500 °C for 2 h.
FTIR spectra of dried and annealed samples are displayed in Figures 3.18A and 3.18B,
respectively.
200 400 600 800 100065
70
75
80
85
90
95
100
Temperature (°C)
Weig
ht
(%)
RNS
exo
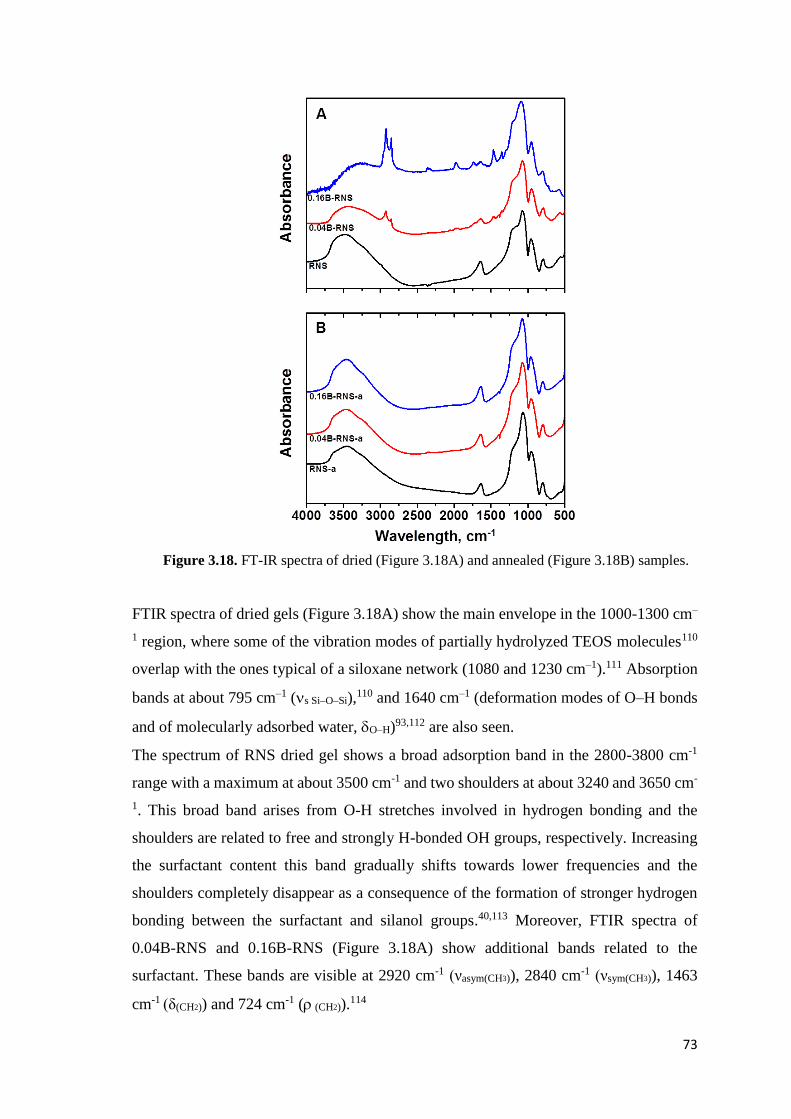
73
Figure 3.18. FT-IR spectra of dried (Figure 3.18A) and annealed (Figure 3.18B) samples.
FTIR spectra of dried gels (Figure 3.18A) show the main envelope in the 1000-1300 cm–
1 region, where some of the vibration modes of partially hydrolyzed TEOS molecules110
overlap with the ones typical of a siloxane network (1080 and 1230 cm–1).111 Absorption
bands at about 795 cm–1 (s Si–O–Si),110 and 1640 cm–1 (deformation modes of O–H bonds
and of molecularly adsorbed water, O–H)93,112 are also seen.
The spectrum of RNS dried gel shows a broad adsorption band in the 2800-3800 cm-1
range with a maximum at about 3500 cm-1 and two shoulders at about 3240 and 3650 cm-
1. This broad band arises from O-H stretches involved in hydrogen bonding and the
shoulders are related to free and strongly H-bonded OH groups, respectively. Increasing
the surfactant content this band gradually shifts towards lower frequencies and the
shoulders completely disappear as a consequence of the formation of stronger hydrogen
bonding between the surfactant and silanol groups.40,113 Moreover, FTIR spectra of
0.04B-RNS and 0.16B-RNS (Figure 3.18A) show additional bands related to the
surfactant. These bands are visible at 2920 cm-1 (νasym(CH3)), 2840 cm-1 (νsym(CH3)), 1463
cm-1 (δ(CH2)) and 724 cm-1 ( (CH2)).114
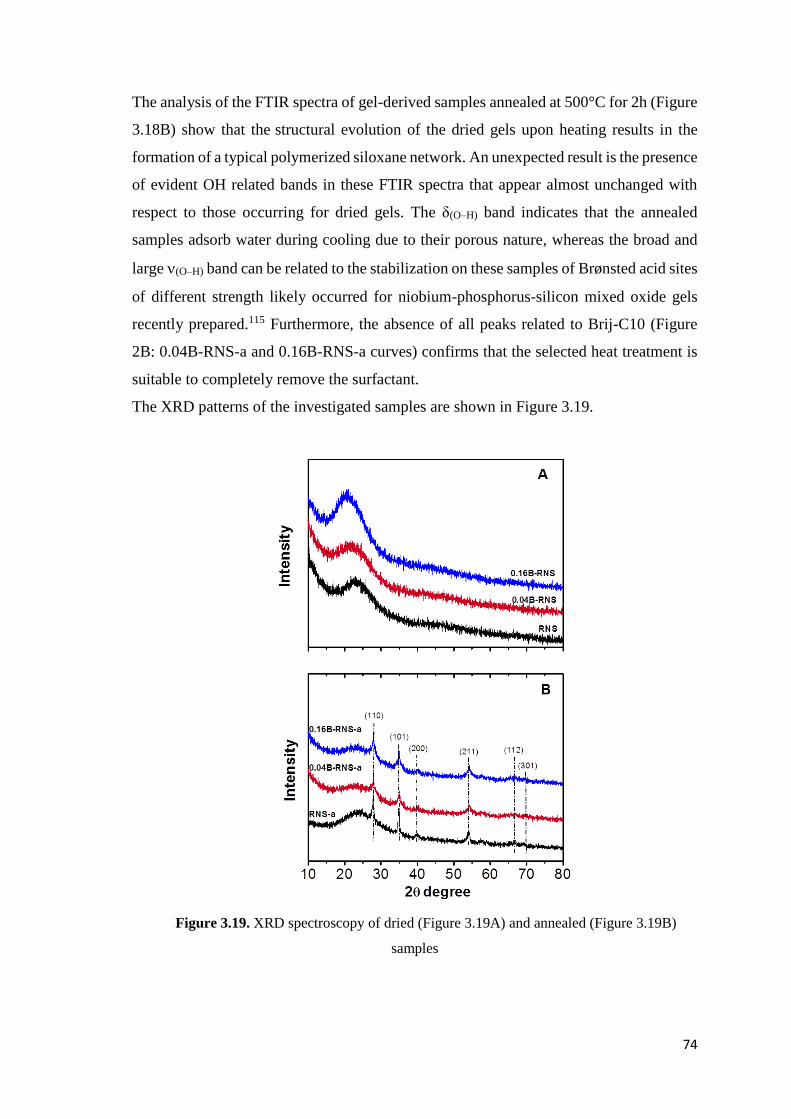
74
The analysis of the FTIR spectra of gel-derived samples annealed at 500°C for 2h (Figure
3.18B) show that the structural evolution of the dried gels upon heating results in the
formation of a typical polymerized siloxane network. An unexpected result is the presence
of evident OH related bands in these FTIR spectra that appear almost unchanged with
respect to those occurring for dried gels. The δ(O–H) band indicates that the annealed
samples adsorb water during cooling due to their porous nature, whereas the broad and
large (O–H) band can be related to the stabilization on these samples of Brønsted acid sites
of different strength likely occurred for niobium-phosphorus-silicon mixed oxide gels
recently prepared.115 Furthermore, the absence of all peaks related to Brij-C10 (Figure
2B: 0.04B-RNS-a and 0.16B-RNS-a curves) confirms that the selected heat treatment is
suitable to completely remove the surfactant.
The XRD patterns of the investigated samples are shown in Figure 3.19.
Figure 3.19. XRD spectroscopy of dried (Figure 3.19A) and annealed (Figure 3.19B)
samples
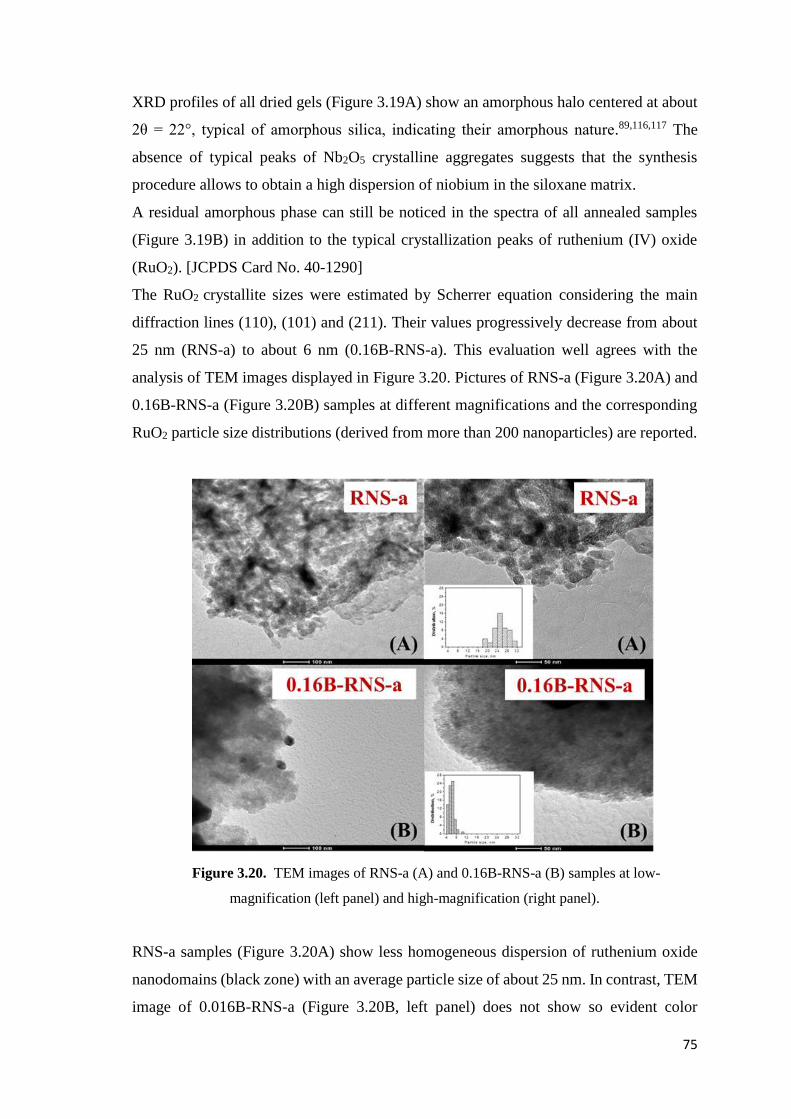
75
XRD profiles of all dried gels (Figure 3.19A) show an amorphous halo centered at about
2θ = 22°, typical of amorphous silica, indicating their amorphous nature.89,116,117 The
absence of typical peaks of Nb2O5 crystalline aggregates suggests that the synthesis
procedure allows to obtain a high dispersion of niobium in the siloxane matrix.
A residual amorphous phase can still be noticed in the spectra of all annealed samples
(Figure 3.19B) in addition to the typical crystallization peaks of ruthenium (IV) oxide
(RuO2). [JCPDS Card No. 40-1290]
The RuO2 crystallite sizes were estimated by Scherrer equation considering the main
diffraction lines (110), (101) and (211). Their values progressively decrease from about
25 nm (RNS-a) to about 6 nm (0.16B-RNS-a). This evaluation well agrees with the
analysis of TEM images displayed in Figure 3.20. Pictures of RNS-a (Figure 3.20A) and
0.16B-RNS-a (Figure 3.20B) samples at different magnifications and the corresponding
RuO2 particle size distributions (derived from more than 200 nanoparticles) are reported.
Figure 3.20. TEM images of RNS-a (A) and 0.16B-RNS-a (B) samples at low-
magnification (left panel) and high-magnification (right panel).
RNS-a samples (Figure 3.20A) show less homogeneous dispersion of ruthenium oxide
nanodomains (black zone) with an average particle size of about 25 nm. In contrast, TEM
image of 0.016B-RNS-a (Figure 3.20B, left panel) does not show so evident color
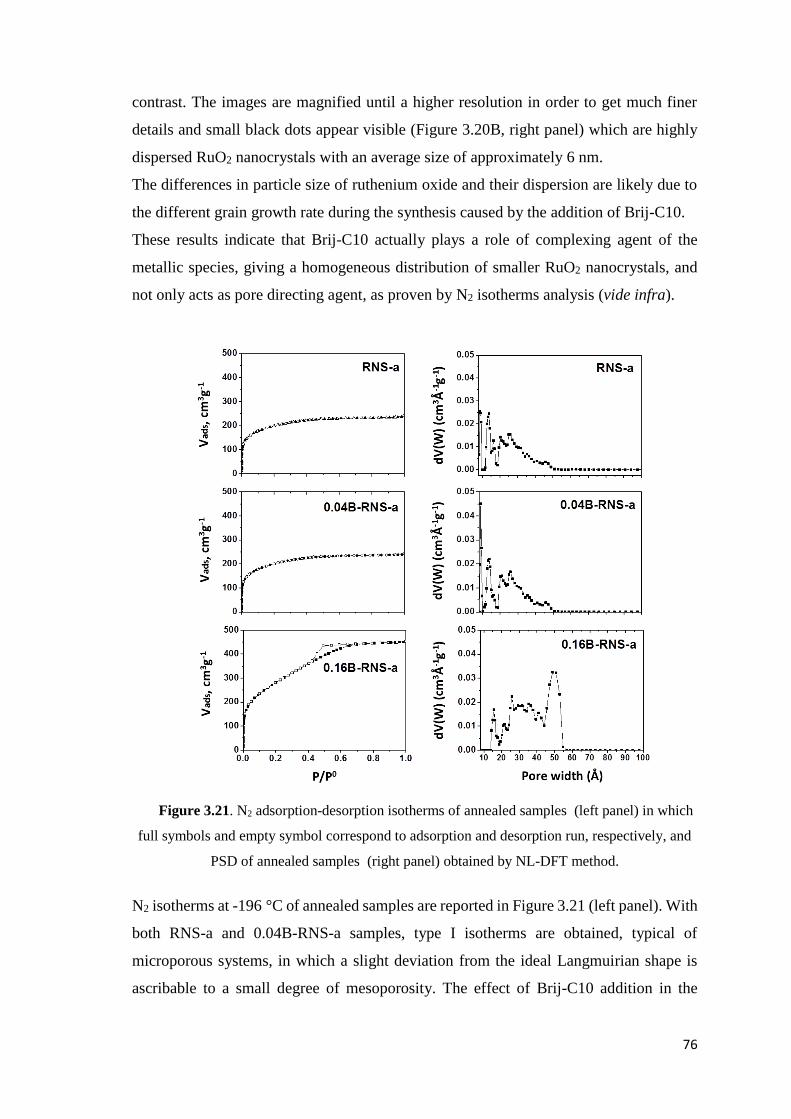
76
contrast. The images are magnified until a higher resolution in order to get much finer
details and small black dots appear visible (Figure 3.20B, right panel) which are highly
dispersed RuO2 nanocrystals with an average size of approximately 6 nm.
The differences in particle size of ruthenium oxide and their dispersion are likely due to
the different grain growth rate during the synthesis caused by the addition of Brij-C10.
These results indicate that Brij-C10 actually plays a role of complexing agent of the
metallic species, giving a homogeneous distribution of smaller RuO2 nanocrystals, and
not only acts as pore directing agent, as proven by N2 isotherms analysis (vide infra).
Figure 3.21. N2 adsorption-desorption isotherms of annealed samples (left panel) in which
full symbols and empty symbol correspond to adsorption and desorption run, respectively, and
PSD of annealed samples (right panel) obtained by NL-DFT method.
N2 isotherms at -196 °C of annealed samples are reported in Figure 3.21 (left panel). With
both RNS-a and 0.04B-RNS-a samples, type I isotherms are obtained, typical of
microporous systems, in which a slight deviation from the ideal Langmuirian shape is
ascribable to a small degree of mesoporosity. The effect of Brij-C10 addition in the

77
synthesis batch is instead relevant in the case of 0.16B-RNS-a sample: the corresponding
isotherm shows an initial steep increase at low P/P0 values, due to the presence of
micropores, followed by a continuous increase of adsorbed volume with increasing P/P0
and a small hysteresis loop, suggesting the presence of disordered mesopores with
variable diameter. The right part of Figure 3.21 reports the corresponding PSDs: as
suggested by the isotherms shape, both micro- and mesopores are present in all the
samples, but with different relative abundance. The 0.16B-RNS-a sample shows indeed
a major family of mesopores, with diameter in the 20-60 Å range, and a minor
contribution of micropores to porous volume. Table T-3.5 reports the corresponding data
for the samples prepared at different Brij-C10 content. N2 adsorption analysis provides
evidence that the introduction of a Brij-C10 content equal to 0.04 mol. % (0.04B-RNS-a)
does not contribute to a relevant change of the textural properties with respect to the bare
sample (RNS), whereas the addition of 0.16 mol % definitely affects both the SSA value
and the pore network, in that the total volume increases along with a simultaneous
decrease of the microporous volume, indicating the preferential formation of mesopores.
Table T-3.5. Samples properties of annealed samples as derived from N2 sorption isotherms
at -196°C.
Sample SSA
(m2 g-1)
Total Pore
Volume
(cm3 g-1)
Micropore
Volume
(cm3 g-1)c
Pore
Diameter
(Å)
0.16B-RNS-a 1030a (1165b) 0.7 0.061 15-50c
0.04B-RNS-a 706a (840b) 0.376 0.132 8-30c
RNS-a 697a (802b) 0.374 0.14 8-30c
a calculated according to the BET algorithm
b calculated by applying Langmuir equation
c obtained by applying the NL-DFT method to isotherms adsorption branch.
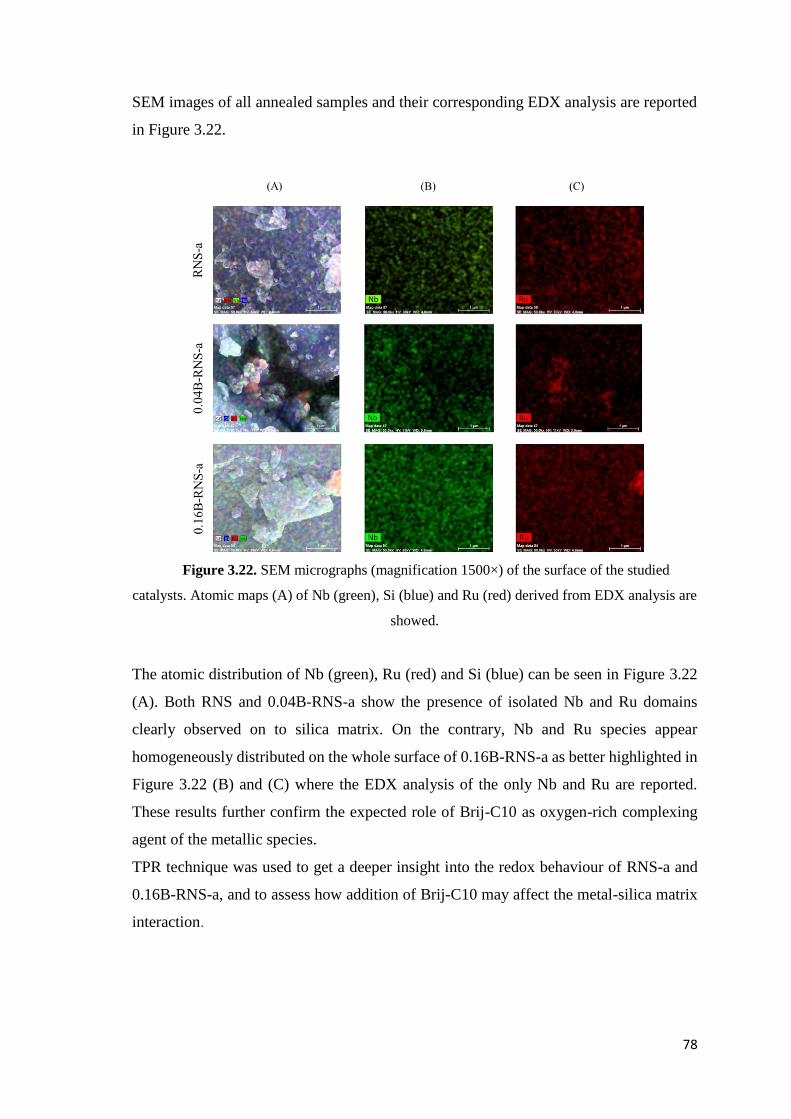
78
SEM images of all annealed samples and their corresponding EDX analysis are reported
in Figure 3.22.
Figure 3.22. SEM micrographs (magnification 1500×) of the surface of the studied
catalysts. Atomic maps (A) of Nb (green), Si (blue) and Ru (red) derived from EDX analysis are
showed.
The atomic distribution of Nb (green), Ru (red) and Si (blue) can be seen in Figure 3.22
(A). Both RNS and 0.04B-RNS-a show the presence of isolated Nb and Ru domains
clearly observed on to silica matrix. On the contrary, Nb and Ru species appear
homogeneously distributed on the whole surface of 0.16B-RNS-a as better highlighted in
Figure 3.22 (B) and (C) where the EDX analysis of the only Nb and Ru are reported.
These results further confirm the expected role of Brij-C10 as oxygen-rich complexing
agent of the metallic species.
TPR technique was used to get a deeper insight into the redox behaviour of RNS-a and
0.16B-RNS-a, and to assess how addition of Brij-C10 may affect the metal-silica matrix
interaction.
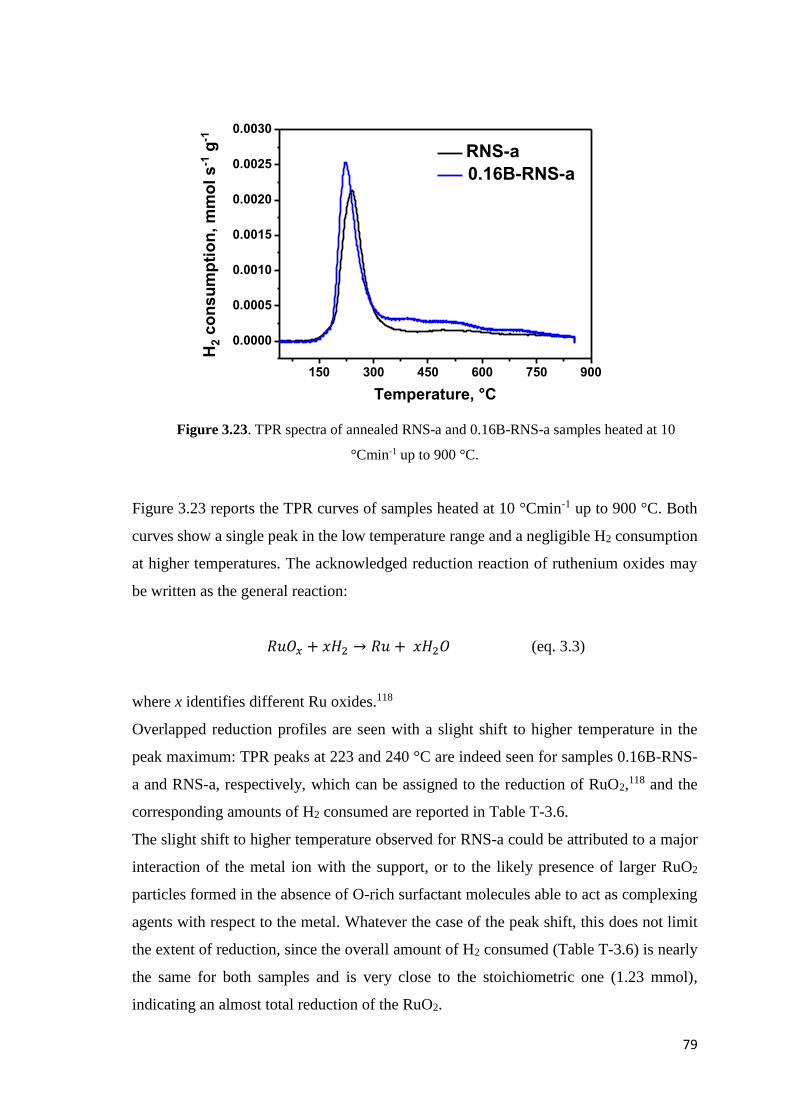
79
150 300 450 600 750 900
0.0000
0.0005
0.0010
0.0015
0.0020
0.0025
0.0030
RNS-a
0.16B-RNS-a
H2 c
on
su
mp
tio
n, m
mo
l s
-1 g
-1
Temperature, °C
Figure 3.23. TPR spectra of annealed RNS-a and 0.16B-RNS-a samples heated at 10
°Cmin-1 up to 900 °C.
Figure 3.23 reports the TPR curves of samples heated at 10 °Cmin-1 up to 900 °C. Both
curves show a single peak in the low temperature range and a negligible H2 consumption
at higher temperatures. The acknowledged reduction reaction of ruthenium oxides may
be written as the general reaction:
𝑅𝑢𝑂𝑥 + 𝑥𝐻2 → 𝑅𝑢 + 𝑥𝐻2𝑂 (eq. 3.3)
where x identifies different Ru oxides.118
Overlapped reduction profiles are seen with a slight shift to higher temperature in the
peak maximum: TPR peaks at 223 and 240 °C are indeed seen for samples 0.16B-RNS-
a and RNS-a, respectively, which can be assigned to the reduction of RuO2,118 and the
corresponding amounts of H2 consumed are reported in Table T-3.6.
The slight shift to higher temperature observed for RNS-a could be attributed to a major
interaction of the metal ion with the support, or to the likely presence of larger RuO2
particles formed in the absence of O-rich surfactant molecules able to act as complexing
agents with respect to the metal. Whatever the case of the peak shift, this does not limit
the extent of reduction, since the overall amount of H2 consumed (Table T-3.6) is nearly
the same for both samples and is very close to the stoichiometric one (1.23 mmol),
indicating an almost total reduction of the RuO2.
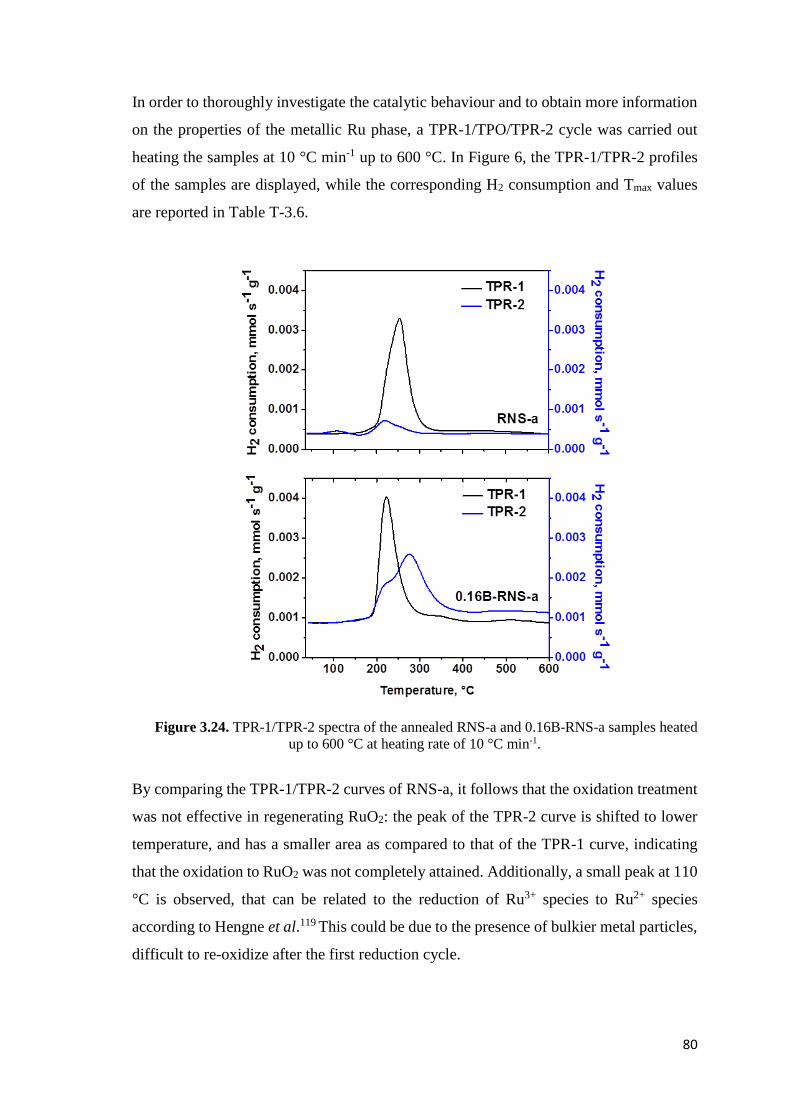
80
In order to thoroughly investigate the catalytic behaviour and to obtain more information
on the properties of the metallic Ru phase, a TPR-1/TPO/TPR-2 cycle was carried out
heating the samples at 10 °C min-1 up to 600 °C. In Figure 6, the TPR-1/TPR-2 profiles
of the samples are displayed, while the corresponding H2 consumption and Tmax values
are reported in Table T-3.6.
Figure 3.24. TPR-1/TPR-2 spectra of the annealed RNS-a and 0.16B-RNS-a samples heated
up to 600 °C at heating rate of 10 °C min-1.
By comparing the TPR-1/TPR-2 curves of RNS-a, it follows that the oxidation treatment
was not effective in regenerating RuO2: the peak of the TPR-2 curve is shifted to lower
temperature, and has a smaller area as compared to that of the TPR-1 curve, indicating
that the oxidation to RuO2 was not completely attained. Additionally, a small peak at 110
°C is observed, that can be related to the reduction of Ru3+ species to Ru2+ species
according to Hengne et al.119 This could be due to the presence of bulkier metal particles,
difficult to re-oxidize after the first reduction cycle.
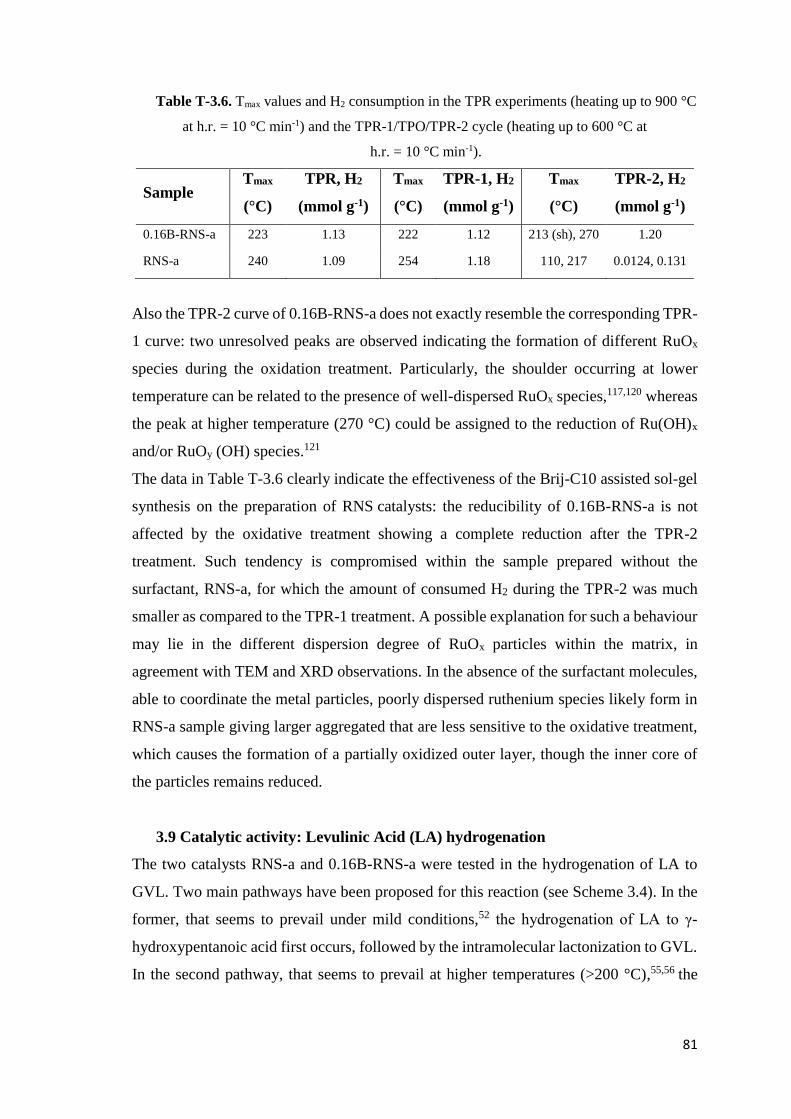
81
Table T-3.6. Tmax values and H2 consumption in the TPR experiments (heating up to 900 °C
at h.r. = 10 °C min-1) and the TPR-1/TPO/TPR-2 cycle (heating up to 600 °C at
h.r. = 10 °C min-1).
Sample Tmax
(°C)
TPR, H2
(mmol g-1)
Tmax
(°C)
TPR-1, H2
(mmol g-1)
Tmax
(°C)
TPR-2, H2
(mmol g-1)
0.16B-RNS-a 223 1.13 222 1.12 213 (sh), 270 1.20
RNS-a 240 1.09 254 1.18 110, 217 0.0124, 0.131
Also the TPR-2 curve of 0.16B-RNS-a does not exactly resemble the corresponding TPR-
1 curve: two unresolved peaks are observed indicating the formation of different RuOx
species during the oxidation treatment. Particularly, the shoulder occurring at lower
temperature can be related to the presence of well-dispersed RuOx species,117,120 whereas
the peak at higher temperature (270 °C) could be assigned to the reduction of Ru(OH)x
and/or RuOy (OH) species.121
The data in Table T-3.6 clearly indicate the effectiveness of the Brij-C10 assisted sol-gel
synthesis on the preparation of RNS catalysts: the reducibility of 0.16B-RNS-a is not
affected by the oxidative treatment showing a complete reduction after the TPR-2
treatment. Such tendency is compromised within the sample prepared without the
surfactant, RNS-a, for which the amount of consumed H2 during the TPR-2 was much
smaller as compared to the TPR-1 treatment. A possible explanation for such a behaviour
may lie in the different dispersion degree of RuOx particles within the matrix, in
agreement with TEM and XRD observations. In the absence of the surfactant molecules,
able to coordinate the metal particles, poorly dispersed ruthenium species likely form in
RNS-a sample giving larger aggregated that are less sensitive to the oxidative treatment,
which causes the formation of a partially oxidized outer layer, though the inner core of
the particles remains reduced.
3.9 Catalytic activity: Levulinic Acid (LA) hydrogenation
The two catalysts RNS-a and 0.16B-RNS-a were tested in the hydrogenation of LA to
GVL. Two main pathways have been proposed for this reaction (see Scheme 3.4). In the
former, that seems to prevail under mild conditions,52 the hydrogenation of LA to γ-
hydroxypentanoic acid first occurs, followed by the intramolecular lactonization to GVL.
In the second pathway, that seems to prevail at higher temperatures (>200 °C),55,56 the
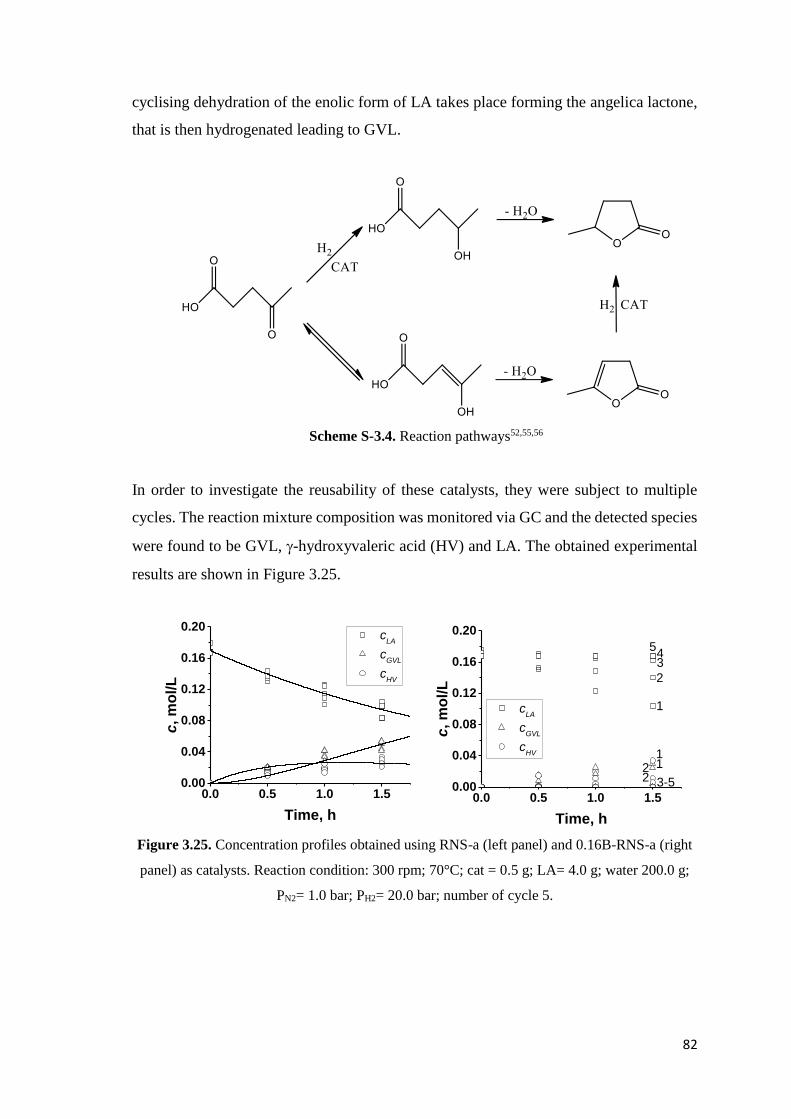
82
cyclising dehydration of the enolic form of LA takes place forming the angelica lactone,
that is then hydrogenated leading to GVL.
Scheme S-3.4. Reaction pathways52,55,56
In order to investigate the reusability of these catalysts, they were subject to multiple
cycles. The reaction mixture composition was monitored via GC and the detected species
were found to be GVL, -hydroxyvaleric acid (HV) and LA. The obtained experimental
results are shown in Figure 3.25.
Figure 3.25. Concentration profiles obtained using RNS-a (left panel) and 0.16B-RNS-a (right
panel) as catalysts. Reaction condition: 300 rpm; 70°C; cat = 0.5 g; LA= 4.0 g; water 200.0 g;
PN2= 1.0 bar; PH2= 20.0 bar; number of cycle 5.
0.0 0.5 1.0 1.50.00
0.04
0.08
0.12
0.16
0.20 c
LA
cGVL
cHV
c, m
ol/L
Time, h
0.0 0.5 1.0 1.50.00
0.04
0.08
0.12
0.16
0.20
1
11
2
22
34
5
cLA
cGVL
cHV
c, m
ol/L
Time, h
3-5
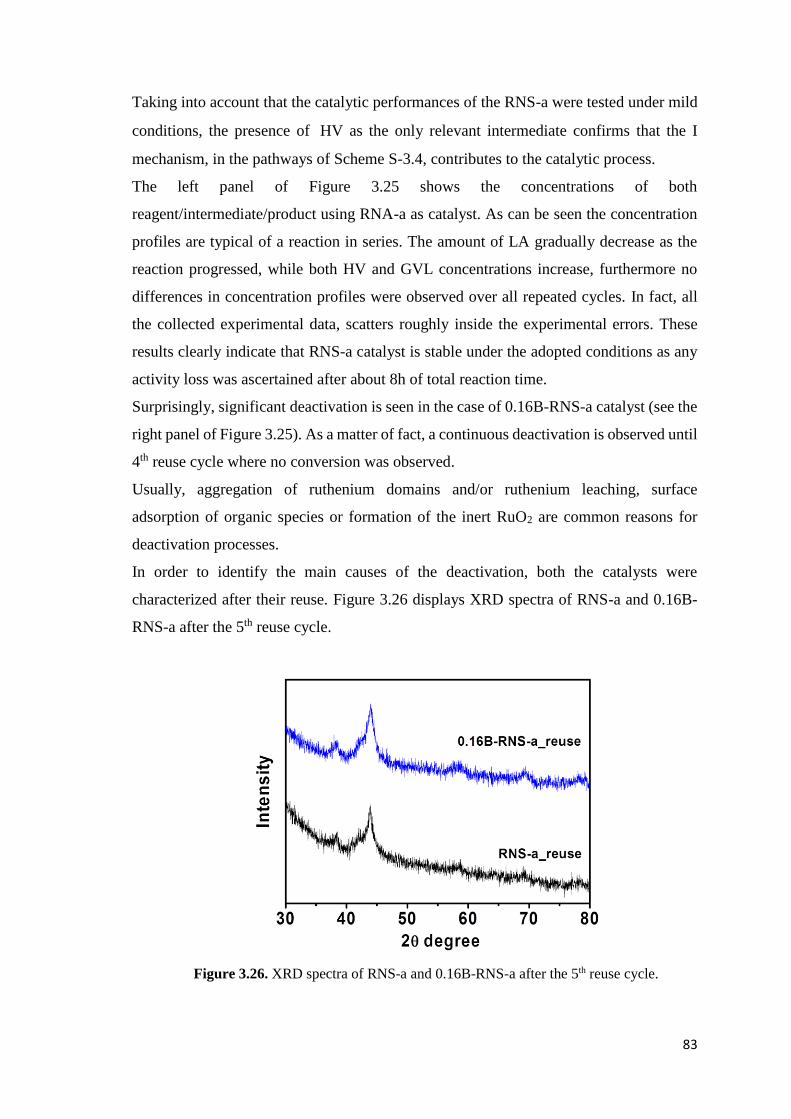
83
Taking into account that the catalytic performances of the RNS-a were tested under mild
conditions, the presence of HV as the only relevant intermediate confirms that the I
mechanism, in the pathways of Scheme S-3.4, contributes to the catalytic process.
The left panel of Figure 3.25 shows the concentrations of both
reagent/intermediate/product using RNA-a as catalyst. As can be seen the concentration
profiles are typical of a reaction in series. The amount of LA gradually decrease as the
reaction progressed, while both HV and GVL concentrations increase, furthermore no
differences in concentration profiles were observed over all repeated cycles. In fact, all
the collected experimental data, scatters roughly inside the experimental errors. These
results clearly indicate that RNS-a catalyst is stable under the adopted conditions as any
activity loss was ascertained after about 8h of total reaction time.
Surprisingly, significant deactivation is seen in the case of 0.16B-RNS-a catalyst (see the
right panel of Figure 3.25). As a matter of fact, a continuous deactivation is observed until
4th reuse cycle where no conversion was observed.
Usually, aggregation of ruthenium domains and/or ruthenium leaching, surface
adsorption of organic species or formation of the inert RuO2 are common reasons for
deactivation processes.
In order to identify the main causes of the deactivation, both the catalysts were
characterized after their reuse. Figure 3.26 displays XRD spectra of RNS-a and 0.16B-
RNS-a after the 5th reuse cycle.
Figure 3.26. XRD spectra of RNS-a and 0.16B-RNS-a after the 5th reuse cycle.
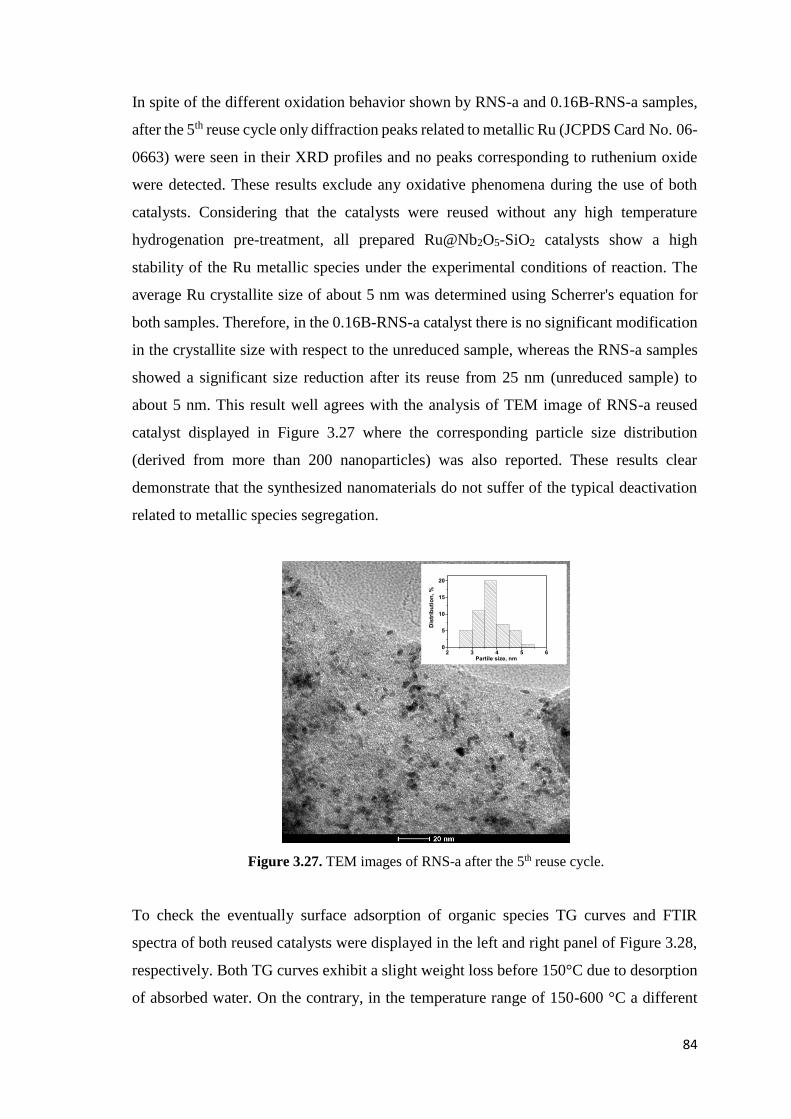
84
In spite of the different oxidation behavior shown by RNS-a and 0.16B-RNS-a samples,
after the 5th reuse cycle only diffraction peaks related to metallic Ru (JCPDS Card No. 06-
0663) were seen in their XRD profiles and no peaks corresponding to ruthenium oxide
were detected. These results exclude any oxidative phenomena during the use of both
catalysts. Considering that the catalysts were reused without any high temperature
hydrogenation pre-treatment, all prepared Ru@Nb2O5-SiO2 catalysts show a high
stability of the Ru metallic species under the experimental conditions of reaction. The
average Ru crystallite size of about 5 nm was determined using Scherrer's equation for
both samples. Therefore, in the 0.16B-RNS-a catalyst there is no significant modification
in the crystallite size with respect to the unreduced sample, whereas the RNS-a samples
showed a significant size reduction after its reuse from 25 nm (unreduced sample) to
about 5 nm. This result well agrees with the analysis of TEM image of RNS-a reused
catalyst displayed in Figure 3.27 where the corresponding particle size distribution
(derived from more than 200 nanoparticles) was also reported. These results clear
demonstrate that the synthesized nanomaterials do not suffer of the typical deactivation
related to metallic species segregation.
Figure 3.27. TEM images of RNS-a after the 5th reuse cycle.
To check the eventually surface adsorption of organic species TG curves and FTIR
spectra of both reused catalysts were displayed in the left and right panel of Figure 3.28,
respectively. Both TG curves exhibit a slight weight loss before 150°C due to desorption
of absorbed water. On the contrary, in the temperature range of 150-600 °C a different
2 3 4 5 60
5
10
15
20
D
istr
ibu
tio
n, %
Partile size, nm
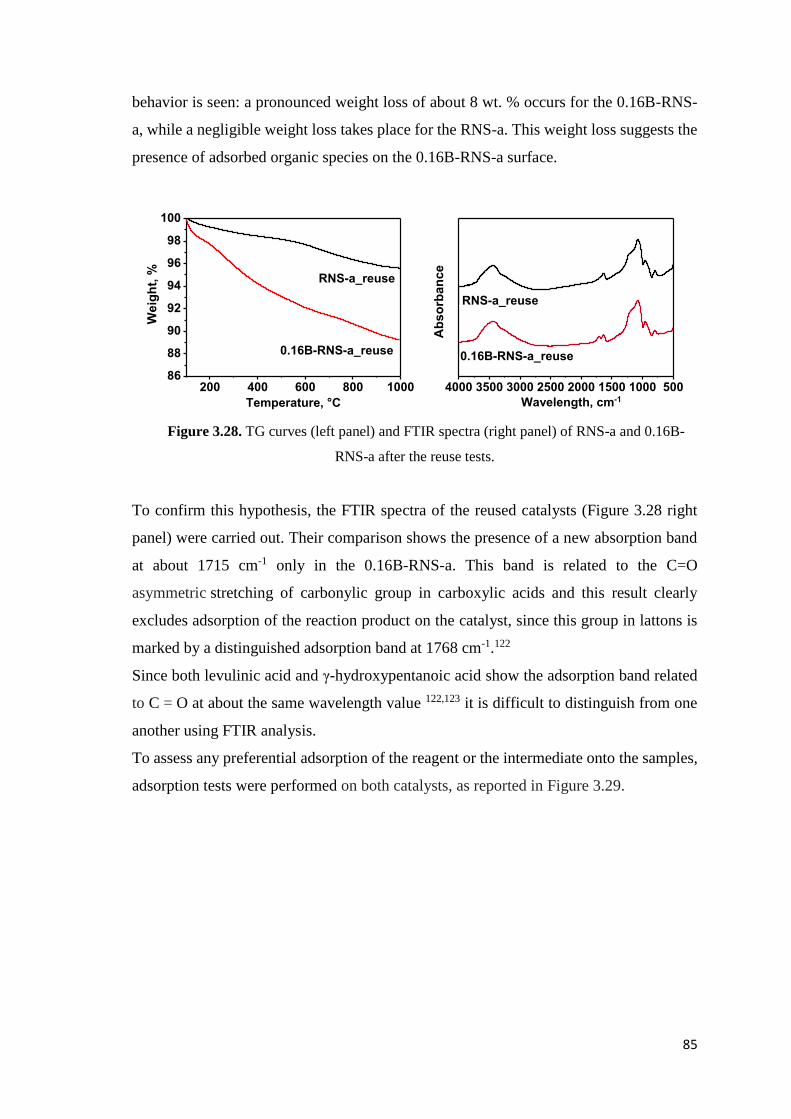
85
behavior is seen: a pronounced weight loss of about 8 wt. % occurs for the 0.16B-RNS-
a, while a negligible weight loss takes place for the RNS-a. This weight loss suggests the
presence of adsorbed organic species on the 0.16B-RNS-a surface.
Figure 3.28. TG curves (left panel) and FTIR spectra (right panel) of RNS-a and 0.16B-
RNS-a after the reuse tests.
To confirm this hypothesis, the FTIR spectra of the reused catalysts (Figure 3.28 right
panel) were carried out. Their comparison shows the presence of a new absorption band
at about 1715 cm-1 only in the 0.16B-RNS-a. This band is related to the C=O
asymmetric stretching of carbonylic group in carboxylic acids and this result clearly
excludes adsorption of the reaction product on the catalyst, since this group in lattons is
marked by a distinguished adsorption band at 1768 cm-1.122
Since both levulinic acid and γ-hydroxypentanoic acid show the adsorption band related
to C = O at about the same wavelength value 122,123 it is difficult to distinguish from one
another using FTIR analysis.
To assess any preferential adsorption of the reagent or the intermediate onto the samples,
adsorption tests were performed on both catalysts, as reported in Figure 3.29.
200 400 600 800 100086
88
90
92
94
96
98
100
0.16B-RNS-a_reuse
Weig
ht,
%
Temperature, °C
RNS-a_reuse
4000 3500 3000 2500 2000 1500 1000 500
0.16B-RNS-a_reuse
RNS-a_reuse
Ab
so
rban
ce
Wavelength, cm-1
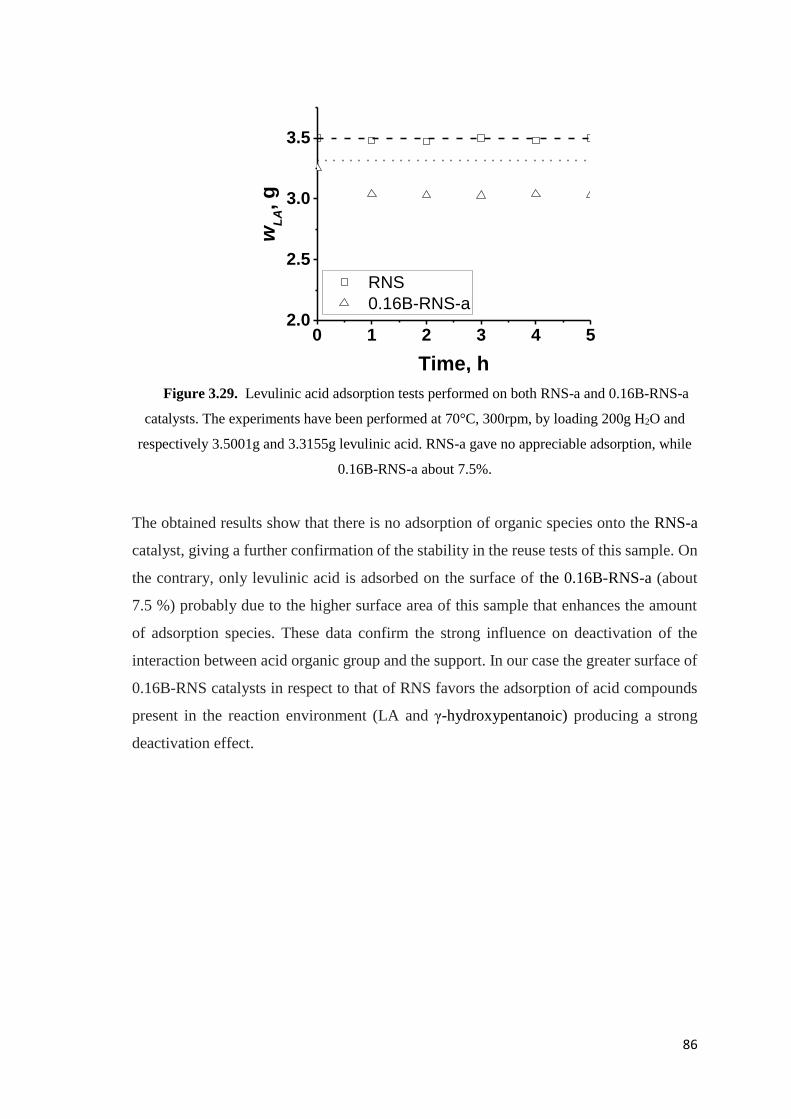
86
Figure 3.29. Levulinic acid adsorption tests performed on both RNS-a and 0.16B-RNS-a
catalysts. The experiments have been performed at 70°C, 300rpm, by loading 200g H2O and
respectively 3.5001g and 3.3155g levulinic acid. RNS-a gave no appreciable adsorption, while
0.16B-RNS-a about 7.5%.
The obtained results show that there is no adsorption of organic species onto the RNS-a
catalyst, giving a further confirmation of the stability in the reuse tests of this sample. On
the contrary, only levulinic acid is adsorbed on the surface of the 0.16B-RNS-a (about
7.5 %) probably due to the higher surface area of this sample that enhances the amount
of adsorption species. These data confirm the strong influence on deactivation of the
interaction between acid organic group and the support. In our case the greater surface of
0.16B-RNS catalysts in respect to that of RNS favors the adsorption of acid compounds
present in the reaction environment (LA and γ-hydroxypentanoic) producing a strong
deactivation effect.
0 1 2 3 4 52.0
2.5
3.0
3.5
RNS
0.16B-RNS-a
wL
A, g
Time, h
87
CONCLUSION
In this PhD research activity hybrid (ZrO2-acac) and inorganic (Nb2O5∙SiO2 and
Ru/RuO2@Nb2O5∙SiO2) mixed oxide materials were synthesized by sol-gel route and
characterised in view of their applications in catalytic field.
ZrO2-based organic-inorganic hybrid materials
ZrO2-based hybrid material was prepared using acetylacetone (Hacac) to control the
hydrolysis reaction rate of zirconium precursor avoiding the development of a particulate
gel. Contrary to the usual practice, these acac complexing/sensitizing molecules were
added directly to the solution containing the precursor of zirconium.
The formation of a hybrid homogeneous xerogel (HSGZ), slightly yellow colored, was
obtained by a synthesis procedure entirely performed in air at room temperature. The
porous gel derived material can be described as a polymeric network of zirconium oxo-
clusters, on the surface of which part of Zr4+ ions are involved in strong complexation
with acac ligands. Therefore, HSGZ can be considered as an acac surface-modified porous
zirconia. These characteristics were confirmed by TG-DTA analysis and FTIR
spectroscopy which indicated that HSGZ is a highly stable hybrid material. The presence
of acac, strongly bond on the surface, induced a ligand-to-metal charge transfer giving
light absorption in the visible region with a reduction of band gap value (2.6 eV). The
intramolecular acac-to-metal electron transfer mechanism was also responsible of the
equilibrium formation between Zr(IV)-acac and Zr(III)-acac• complexes on the solid
surface from which in presence of molecular O2, reactive oxygen species (ROSs) were
produced. Particularly, the organic ligand played a pivotal role in generating and
stabilizing the superoxide radical species (•O2-) at the HSGZ-air interfaces for very long
time. Therefore, HSGZ material behaved like radicals initiator in absence of any light
irradiation at room temperature. The ability of this hybrid material to produce these
paramagnetic centers was checked by EPR measurements, carried out in absence of
irradiation. The presence of free radicals made HSGZ material a useful catalyst in
degradation of organic pollutants. Its catalytic activity has been tested in the oxidative
degradation of different chlorinated phenoxyalkanoic acid herbicides (MCPA, 2,4-D, 4-
CPA, and MCPB) without light irradiation with special reference to evaluation of their
degradation kinetics. A virtually complete removal in about 3 days at room temperature
88
was achieved for the four herbicides. This result is comparable to those usually obtained
by photo-oxidation.102 A long-term application of the HSGZ catalyst tested by repeated-
batch tests was achieved, as well.
Finally, these results lead the path toward further development of HSGZ and related
hybrid materials for ROS-based energy and environmental applications that do not require
any activation procedure neither thermal nor light.
Niobium-silicon mixed oxides
Niobium-silicon mixed oxide, containing about 19 wt. % of Nb2O5 (NbsgII), was prepared
by a sol-gel synthesis procedure and its structural, morphological and textural properties
were studied and compared with the results obtained from niobium oxides-based materials
containing a similar amount of Nb2O5 but prepared following different synthetic
procedures: wet impregnation (Nbimp),105 different sol-gel route (NbsgI)44 and pure
niobium pentoxide (Nb2O5).
All materials were tested in the epoxidation of methyl oleate, which is structure-sensitive
on crystalline Nb2O5. It was shown, indeed, that the prevalence of the monoclinic H-phase
in the commercial Nb2O5 and of the orthorhombic T-phase in Nbimp catalyst enhances
the epoxidation in the first case while promotes the hydrolysis of epoxide in the last
instance leading to a decrease of the selectivity. In the amorphous catalysts prepared by
sol-gel, instead, the selectivity is moderate and increases for NbsgII material. This effect
is due to the presence of different NbOx surface species that, interacting with the siloxane
matrix, give rise to different acid sites (Brønsted, NbO6 octhaedra, and Lewis, NbO4
tetrahedra, acid sites) which strongly influence the catalytic performance of investigated
catalysts. It was shown that the dispersion of the active NbO4 tetrahedra in the NbsgII
material is the most important factor affecting the oxirane selectivity.
It can be concluded that the nature and the distribution of Nb polyedra are strongly
influenced by the synthesis parameters and, in turn, are responsible for the catalytic
performance.
Ruthenium-based mixed oxides
Ru/RuO2@Nb2O5-SiO2 sol-gel materials, characterized by a very high dispersion of the
metallic species, both in the oxidized and reduced state, were successfully synthesised by
an innovative co-synthesis process.

89
The structural properties of the samples were modulated adding a nonionic surfactant
directly in the starting solution of precursors that actually plays a role of both pore
directing and complexing agent of the metallic species. Varying the amount of the
surfactant both the specific surface area and the pore network of the materials can be
affected obtaining a very homogeneous distribution of RuO2 nanocrystals.
Ru@Nb2O5-SiO2 were demonstrated to be effective bifunctional catalysts in the
hydrogenation of LA to GVL, carried out under mild conditions and in aqueous
environment, and the catalytic performances are not influenced by textural properties of
these materials in their first use. The reusability experiments showed good stability of the
catalyst prepared without the surfactant and any activity loss was ascertained after about
8h of total reaction time. Deactivation phenomena, by contrast, occurred in the catalyst
prepared with the surfactant. Deep investigation revealed the adsorption of levulinic acid
onto this catalyst, enhanced by the higher surface area that actually caused a deactivation
already at the second run of the reuse tests.
90
REFERENCES
1. Macwan, D. P.; Dave, P. N.; Chaturvedi, S., J Mater Sci, 2011, 46, 3669-3686.
2. Kumar, S. G.; Devi, L. G., J. Phys. Chem. A, 2011, 115, 13211-13241.
3. Zhang, G.; Kim, G.; Choi, W., Energy Environ. Sci., 2014, 7, 954-966.
4. Gionco, C.; Paganini, M. C.; Giamello, E.; Burgess, R.; Di Valentin, C.;
Pacchioni, G., J. Phys. Chem. Lett., 2014, 5, 447-451.
5. Gionco, C.; Livraghi, S.; Maurelli, S.; Giamello, E.; Tosoni, S.; Di Valentin, C.;
Pacchioni, G., Chem. Mater., 2015, 27, 3936-3945.
6. Nakahira, T., Grätzel, M., Makromol. Chem., Rapid Commun., 1985, 6, 341-347.
7. O’Regan, B.; Gratzel, M.; Nature, 1991, 353, 737-740.
8. Vinodgopal, K.; Wynkoop, D. E.; Kamat, P. V., Eviron. Sci. Technol., 1996, 30,
1660-1666.
9. Finkelstein-Shapiro, D.; Petrosko, S. H.; Dimitrijevic, N. M.; Gosztola, D.; Gray,
K. A.; Rajh, T.; Tarakeshwar, P.; Mujica, V.; J. Phys. Chem. Lett., 2013, 4, 475-
479.
10. Musumeci, A.; Gosztola, D.; Schiller, T.; Dimitrijevic, N. M.; Mujica, V.; Martin,
D.; Rajh, T., J. Am. Chem. Soc., 2009, 131, 6040-6041.
11. Schubert, U., Acc. Chem. Res., 2007, 40, 730-737.
12. Brinker, C. J.; Schere, S. W., Sol-Gel science: the physics and chemistry of sol-
gel processing, Academic Press, New York, 1990.
13. Sanchez, C.; Gómez-Romero, P., Functional Hybrid Materials, Wiley VCH,
Weinheim, 2004.
14. Sanchez, C.; Julian, B.; Belleville, P.; Popall, M., J. Mater. Chem., 2005, 15,
3559-3592.
15. Sanchez, C.; Shea, K. J.; Kitagawa, S., Chem. Soc. Rev., 2011, 40, Themed issue:
Hybrid material.
16. Schubert, U., J. Sol-Gel Sci. Technol., 2003, 26, 47-55.
17. Spijksma, G. I.; Bouwmeester, H. J. M.; Blank, D. H. A.; Kessler, V. G., Chem
Commun., 2004, 16, 1874-1875.
18. Seisenbaeva, G. A.; Gohil, S.; Kessler, V. G., J. Mater. Chem., 2006, 14, 3177-
3190.
19. Sanchez, C.; In, M., J. Non-Cryst. Solids, 1992, 147&148, 1-12.
91
20. Percy, M. J.; Barlett, J. R.; Woolfrey, J. L.; Spiccia, L.; West, B. O., J. Mater.
Chem., 1999, 9, 499-505.
21. Pirozzi, D.; Fanelli, E.; Aronne, A.; Pernice, P.; Mingione, A., J. Mol. Catal. B:
Enzymatic, 2009, 59, 116-120.
22. Kessler, V. G.; Spijksma, G. I.; Seisenbaeva, G. A.; Håkansson, S.; Blank., D. H.
A.; Bouwmeester, H. J. M., J. Sol-Gel Sci. Technol., 2006, 40, 163-179.
23. Lemonnier, S.; Grandjean, S.; Robisson, A. C.; Jolivet, J. P., Dalton Trans., 2010,
39, 2254-2262.
24. van den Brom, C. R.; Vogel, N.; Hauser, C. P.; Goerres, S.; Wagner, M.;
Landfester, K.; Weiss, C. K., Langmuir, 2011, 27, 8044-8053.
25. Georgieva, I.; Danchova, N.; Gutzov, S.; Trendafilova, N., J Mol Model, 2012,
18, 2409-2422.
26. Petkova, N.; Dlugocz, S.; Gutzov, S., J. Non-Cryst. Solids, 2011, 357, 1547-1551.
27. Spijksma, G. I.; Bouwmeester, H. J. M.; Blank, D. H. A.; Kessler, V. G., Chem
Commun., 2004, 16, 1874-1875.
28. Jones, A. C., J. Mater. Chem., 2002, 12, 2576-2590.
29. Fanelli, E.; Turco, M.; Russo, A.; Bagnasco, G.; Marchese, S.; Pernice, P.;
Aronne, A., J. Sol-Gel Sci. Technol., 2011, 426-436.
30. Aronne, A.; Sannino, F., Bonavolonta, S. R., Fanelli, E., Mingione, A.; Pernice,
P.; Spaccini, R.; Pirozzi, D., Environ. Sci. Technol., 2012, 46, 1755-1763.
31. Francisco, M. S. P.; Gushikem, Y., J. Mater. Chem., 2002, 12, 2552-2558.
32. Dragone, L.; Moggi, P.; Predieri, G.; Zanoni, R., Appl. Surf. Sci., 2002, 187, 82-
88.
33. Julián, B.; Gervais, C.; Cordoncillo, E.; Escribano P.; Babonneau, F.; Sanchez,
C., Chem. Mater., 2003, 15, 3026-3034.
34. Drake, K.; Carta, D.; Skipper, L.J.; Sowrey, F. E.; Newport, R. J.; Smith M. E.,
Solid State Nucl. Magn. Reson., 2005, 27, 28-36.
35. Aronne, A.; Turco, M.; Bagnasco, G.; Ramis, G.; Santacesaria, E.; Di Serio, M.;
Marenna, E.; Bevilacqua, M.; Cammarano, C.; Fanelli, E., Appl. Catal., A, 2008,
347, 179-185.
36. Di Serio, M.; Turco, R.; Pernice, P.; Aronne, A.; Sannino, F.; Santacesaria, E.,
Catal. Today, 2012, 192, 112-116.
37. Rosatto, S. S.; Sotomayor, P. T.; Kubota, L. T.; Gushikem, Y., Electrochim Acta,
2002, 47, 4451-4458.
92
38. Clapsaddle, B. J.; Sprehn, D. W.; Gash, A. E.; Satcher Jr, J. H.; Simpson, R. L.,
J. Non-Cryst. Solids, 2004, 350, 173-181.
39. Francisco, M. S. P.; Landers, R; Gushikem, Y., J. Solid State Chem., 2004, 177,
2432-2439.
40. Aronne, A.; Marenna, E.; Califano, V.; Fanelli, E.; Pernice, P.; Trifuoggi, M.;
Vergara, A., J. Sol-Gel Sci. Technol., 2007, 43, 193-204.
41. Braga, V. S.; Dias, J. A.; Dias, S. C. L.; de Macedo, J. L., Chem Mater., 2005, 17,
690-695.
42. Camargo, E. R.; Popa, M.; Kakihana, M., Chem Mater., 2002, 14, 2365-2368.
43. Somma, F.; Canton, P.; Strukul, G., J. Catal., 2005, 229, 490-498.
44. Carniti, P.; Gervasini, A.; Marzo, M., J. Phys. Chem. C, 2008, 112, 14064-14074.
45. Damayanova, S.; Dimitrov, L.; Petrov, L.; Grange, P., Appl. Surf. Sci., 2003, 214,
68-74.
46. Tanabe, K., Solid Acids and Bases: their catalytic properties; Academic Press:
New York, 1970.
47. Kumar, V. V.; Naresh, G.; Sudhakar, M.; Tardio, J.; Bhargava, S. K.; Venugopal,
A., Appl. Catal., A, 2015, 505, 217-223.
48. Xu, Q.; Li, X.; Pan, T.; Yu, C.; Deng, J.; Guo, Q.; Fu, Y., Green Chem., 2016, 18,
1287-1294.
49. Kuwahara, Y.; Magatania, Y.; Hiromi Y., Catalysis Today, 2015, 258, 262.269.
50. Huber, G. W.; Corma, A., Angew. Chem. Int., 2007, 46, 7184-7201.
51. Alonso, D. M.; Wettstein, S. G.; Dumesic, J. A., Gren Chem., 2013, 15, 584-595.
52. Raspolli Galletti, A. M.; Antonetti, C.; De Luise, V.; Martinelli, M., Green Chem.,
2012, 14, 688-694.
53. Abdelrahman, O. A.; Luo, H. Y.; Heyden, A.; Román-Leshkov, Y.; Bond, J. Q.,
J. Catal., 2015, 329, 10-21.
54. Cao, S.; Monnier, J. R.; Williams, C. T.; Diao, W.; Regalbuto, J. R., J. Catal.,
2015, 326, 69-81.
55. Sudhakar, M.; Vijay Kumar, V.; Naresh, G.; Lakshmi Kantam, M.; Bhargav, S.K.;
Venugopal, A., Appl. Catal. B, 2016, 180, 113-120.
56. Michel, C.; Zaffran, J.; Ruppert, A. M.; Matras-Michalska, J.; Jedrzejczyk, M.;
Gramsb, J.; Sautet, P., Chem. Commun., 2014, 50, 12450-12453.
57. Wąchała, M.; Grams, J.; Kwapiński, W.; Ruppert, A. M., Int. J. Hydrogen Energy,
2016, http://dx.doi.org/10.1016/j.ijhydene.2015.12.089.
93
58. Xiao, C.; Goh, T-W.; Qi, Z.; Goes, S.; Brashler, K.; Perez, C.; Huang, W., ACS
Catal., 2016, 6, 593-599.
59. Jansat, S.; Pelzer, K.; García-Antón, J.; Raucoules, R.; Philippot, K.; Maisonnat,
A.; Chaudret, B.; Guari, Y.; Mehdi, A.; Reyé, C.; Corriu, R. J. P., Adv. Funct.
Mater., 2007, 17, 3339-3347.
60. Zhang, Y.; Judkins, E. C.; McMillin, D. R.; Mehta, D.; Ren, T., ACS Catal., 2013,
3, 2474-2478.
61. Lo, C.-P.; Ramani, V., ACS Appl. Mater. Interfaces, 2012, 4, 6109-6116.
62. Matsura, V.; Guari, Y.; Reyé, C.; Corriu, R. J. P.; Tristany, M.; Jansat, S.;
Philippot, K.; Maisonnat, A.; Chaudret, B., Adv. Funct. Mater., 2009, 19, 3781-
3787.
63. Tristany, M.; Philippot, K.; Guari, Y.; Collière, V.; Lecante, P.; Chaudret, B., J.
Mater. Chem., 2010, 20, 9523-9530.
64. Brinker, C.J.; Bunker, B.C. et al., Structure of Sol-Gel Derived Inorganic
Polymers: Silicates and Borates, Am. Chem. Soc., 1988, 26, 314-332.
65. Jones, R.W., Fundamental Principles of Sol-Gel Technology, 1989.
66. Hench, L. L.; West, J. K., Chem. Rev., 1990, 90, 33-72.
67. Flory, P. J., Principles of Polymer Chemistry, 1953, Cornell University Press:
Ithaca, NY, chapter IX.
68. Fidalgo, A.; Rosa, M. E.; Ilharco, L. M., Chem. Mater., 2003, 15, 2186-2192.
69. Ciriminna, R.; Fidalgo, A.; Pandarus, V.; Beland, F.; Ilharco, L. M.; Pagliaro M.,
Chem. Rev., 2013, 113, 6592−6620.
70. Dislich, H.; Hinz, P., J. Non-Cryst. Solids, 1982, 48, 11-16.
71. Klein, L.C.; Garvey, G.J., Mater. Res. Soc. Sym. Proc., 1984, 32, 33-36.
72. Keefer, K. D., Mater. Res. Soc. Sym. Proc., 1984, 32, 15-24.
73. Livage, J.; Henry, M.; Sanchez, C., Prog. Solid St. Chem., 1988, 18, 259-341.
74. Gottardi, V.; Guglielmi, M.; Bertoluzza, A.; Fagnano, C.; Morelli, M. A., J. Non-
Cryst. Solids, 1984, 63, 71-80.
75. Bechtold, M. F.; Mahler, W.; Schunn, R. A., J. Polym. Sci.:Polym. Chem., 1980,
18, 2823-2855.
76. Hurd, C. B.; Chem. Rev., 1938, 22, 403-422.
77. Colby, M.; Osaka, A.; Mackenzie, J. D.; J. Non-Cryst. Solids, 1988, 99, 129-139.
78. Debsikdar, J. C., Adv. Ceram. Mater, 1986, 1, 93-98.
94
79. Mackenzie, J. D., Science of Ceramic Chemical Processing, eds. Hench, L. L.;
Ulrich, D. R.: New York, 1986, 113-122.
80. Chen, K. C.; Tsuchiya, T.; Mackenzie, J. D., J. Non-Cryst. Solids, 1986, 81, 227-
237.
81. Schubert, U., J. Mater. Chem., 2005, 15, 3701-3715.
82. Sanchez, C.; Livage, J.; Henry, M.; Babonneau, F., J. Non-Cryst. Solids, 1988,
100, 65-76.
83. Kessler, J. Sol-Gel Sci. Techn., 2009, 51, 264-271.
84. Schattka, J. H.; Wong, E. H.-M. M.; Antonietti, M.; Caruso, R. A., J. Mater.
Chem., 2006, 16, 1414-1420.
85. Rosen, M. J.; Dahanayake, M., Industrial Utilization of Surfactants: Principles
and Practice, Amer Oil Chemists Society, 2000.
86. Anderson, A.-L.; Binions, R., Polyhedron, 2015, 85, 83-92.
87. Sannino, F.; Pernice. P.; Minieri, L.; Camandona, G. A.; Aronne, A.; Pirozzi, D.;
Appl. Mater. Interfaces, 2015, 7, 256-263.
88. Munoz-García, A. B.; Sannino, F.; Vitiello, G.; Pirozzi, D.; Minieri, L.; Aronne,
A.; Pernice, P.; Pavone, M.; D’Errico G., ACS Appl. Mater. Interfaces, 2015, 7,
21662-21667.
89. Turco, R.; Aronne, A.; Carniti, P.; Gervasini, A.; Minieri, L.; Pernice, P.; Tesser,
R.; Vitiello, R.; Di Serio, M., Catal. Today, 2015, 254, 99-103.
90. Dickie, S. A.; McQuillan, A. J., Langmuir, 2004, 20, 11630-11636.
91. Klepper, K. B.; Nilsen, O.; Hansen, P.-A.; Fjellvåg, H., Dalton Trans., 2011, 40,
4636-4646.
92. Esposito, S.; Turco, M.; Bagnasco, G.; Cammarano, C.; Pernice, P.; Aronne, A.,
Appl Catal., A, 2010, 372, 48-57.
93. Aronne, A.; Vladimir, N.; Champagnon, S. B.; Fanelli, E.; Califano, V.;
Usmanova, L. Z.; Pernice, P., J. Non-Cryst. Solids, 2005, 351, 3610-3618.
94. Chang, S.-m.; Doong, R.-a.; Chem. Mater. 2007, 19, 4804-4810.
95. Gionco, C.; Paganini, M. C.; Giamello, E.; Burgess, R.; Di Valentin, C.;
Pacchioni, G., Chem. Mater., 2013, 25, 2243-2253.
96. Cesareo, E.; Korkina, L.; D’Errico, G.; Vitiello, G.; Aguzzi, M. S.; Passarelli, F.;
Pedersen, J. Z.; Facchiano, A., PlosOne, 2012, 7, e48849.
97. Anpo, M.; Che, M.; Fubini, B.; Garrone, E.; Giamello, E.; Paganini, M. C., Top.
Catal., 1999, 8, 189-198.
95
98. Pieta, P.; Petr, A.; Kutner, W.; Dunsch, L., Electrochim. Acta, 2008, 53, 3412-
3415.
99. Bedilo, A. F.; Plotnikov, M. A.; Mezentseva, N. V.; Volodin, A. M.; Zhidomirov,
G. M.; Rybkin, I. M.; Klabunde, K. J., Phys. Chem. Chem. Phys., 2005, 7, 3059-
3069.
100. Sannino, F.; Pirozzi, D.; Vitiello, G.; D’Errico, G.; Aronne, A.; Fanelli, E.;
Pernice, P., Appl. Catal. B, 2014, 156-157, 101-107.
101. Ozacar, M.; Sengil, I. A., J. Environ. Manage, 2006, 80, 372-379.
102. Vione, D.; Khanra, S.; Das, R.; Minero, C.; Maurino, V.; Brigante, M.; Mailhot,
G., Water Res., 2010, 44, 6053-6062.
103. Burrows, H. D.; Canle, M.; Santaballa, J. A.; Steenkenc, S., J. Photochem.
Photobiol. B, 2002, 67, 71-108.
104. Onneby, K.; Hakansson, S.; Pizzul, L.; Stenstrom, J., Biodegradation, 2014, 25,
291-300.
105. Medeiros, F. F. P.; Moura, M. F. V.; da Silva, A. G. P.; Souza, C. P.; Gomes, K.
K. P.; Gomes, U. U.; Braz. J. Chem. Eng., 2006, 23, 531-538.
106. Nowak, I.; Ziolek, M., Chem. Rev. 1999, 99, 3603-3624.
107. Zhu, H.; Zheng, Z.; Gao, X.; Huang, Y.; Yan, Z.; Zou, J.; Yin, H.; Zou, Q.;
Kable, S. H.; Zhao, J.; Xi, Y.; Martens, W. N.; Frost, R. L., J. Am. Chem. Soc.,
2006, 128, 2373-2384.
108. Gallo, A.; Tiozzo, C.; Psaro, R.; Carniato, F.; Guidotti, M., J. Catal., 2013, 298,
77-83.
109. Tiozzo, C.; Bisio, C.; Carniato, F.; Gallo, A.; Scott, S. L.; Psaro, R.; Guidotti,
M., Phys.Chem. Chem. Phys., 2013, 15, 13354-13362.
110. Innocenzi, P., J Non-Cryst Solids, 2003, 316, 309-319.
111. Gallardo, J.; Durán, A.; Di Martino, D.; Almeida, R. M., J. Non-Cryst. Solids,
2002, 298, 219-225.
112. Cerruti, M.; Magnacca, G.; Bolis, V.; Morterra, C., J Mater Chem, 2003, 13,
1279-1286.
113. Fidalgo, A.; Ilharco, L. M., J. Non-Cryst. Solids, 2001, 283, 144-154.
114. Zhang, L.; Shi, H.; Li, W.; Zhang, X., Thermoch. Acta, 2003, 570, 1-7.
115. Clayden, N. J.; Accardo, G.; Mazzei, P.; Piccolo, A.; Pernice, P.; Vergara,
A.; Ferone, C.; Aronne, A., J. Mater. Chem. A, 2015, 3, 15986-15995.
116. Kalapathy, U.; Proctor, A.; Shultz, J., Bioresour. Technol., 2000, 73, 257-262.
96
117. Velmurugan, P.; Shim, J.; Lee, K.-J.; Cho, M.; Lim, S.-S.; Seo, S.-K.; Cho, K.-
M.; Bang, K.-S.; Oh, B.-T. J. Ind. Eng. Chem., 2015,
http://dx.doi.org/10.1016/j.jiec.2015.04.009.
118. Lanza, R.; Järås, S.G.; Canu, P., Appl. Catal., A, 2007, 325, 57-67.
119. Hengne, A. M.; Biradar, N. S.; Rode, C. V., Catal Lett, 2012, 142, 779-787.
120. Bagnasco, G.; Cammarano, C.; Turco, M.; Esposito, S.; Aronne, A.; Pernice, P.,
Thermochim Acta, 2008, 471, 51-54.
121. Manyara, H.G.; Weberb, D.; Dalya, H.; Thompsona, J. T.; Rooneya, D. W.;
Gladdenb, L. F.; Stittc, E. H.; Delgadod, J. J.; Bernald, S.; Hardacrea, C., J. Catal.,
2009, 265, 80-88.
122. Tukacs, J.M.; Király, D.; Strádi, A.; Novodarszki, G.; Eke, Z.; Dibó, G.; Kégl
T.; Mika, L.T., Green Chem, 2012, 14, 2057-2065.
123. Chappell, J.S.; Meyn, A.W.; Ngim, K. K., J Forensic Sci, 2004, 49, 1-8.