Embed Size (px)
Citation preview
Biotech Cotton in India, 2002 to 2014 Adoption, Impact, Progress & Future
Bhagirath Choudhary & Kadambini Gaur
Bhagirath Choudhary & Kadambini Gaur
© The International Service for the Acquisition of Agri-biotech Applications (ISAAA).
Copyright: ISAAA 2015. All rights reserved. This is a research publication authored by the staff of the International Service for the Acquisition of Agri-biotech Applications (ISAAA) based in India. Whereas ISAAA encourages the global sharing of information, no part of this publication shall be reproduced in any form or by any means, electronically, mechanically, by photocopying, recording or otherwise without the permission of the copyright owners. Reproduction of this publication, or parts thereof, for educational and non-commercial purposes is encouraged with due acknowledgment, subsequent to permission being granted by ISAAA.
Citation:
Choudhary, B. and Gaur, K. 2015. Biotech Cotton in India, 2002 to 2014. ISAAA Series of Biotech Crop Profiles. ISAAA: Ithaca, NY.
ISBN: 978-1-892456-62-1
The authors gratefully acknowledge the support of ISAAA management and the staff of the Biotechnology Information Centers (BICs) in the preparation and the free distribution in developing countries. The objective of “Biotech Cotton in India, 2002 to 2014” is to provide information and knowledge to the society on the adoption and impact of Bt cotton in India from 2002 to 2014. The document is a user-friendly, comprehensive and rich source of information on Bt cotton in India. A major portion of the document is excerpted from ISAAA Brief 46, 2013 and ISAAA Brief 49, 2014.The authors, not ISAAA, take full responsibility for the views expressed in this publication and for any errors of omission or misinterpretation.
Publication Orders: Please contact ISAAA representative for your copy at [email protected] A copy of the “Biotech Cotton in India, 2002 to 2014” is available online at http://www.isaaa.org/ . A copy of the document is also available in Hindi at http://www.isaaa.org/india ISAAA South Asia Centre C/o ICRISAT, NASC Complex Dev Prakash Shastri Marg New Delhi-110012, India
Info on ISAAA: For information about ISAAA, please contact the Center nearest you: ISAAA AmeriCenter ISAAA AfriCenter ISAAA SEAsiaCenter 105 Leland Lab P.O Box 70 c/o IRRI Cornell University ILRI Campus, Old Naivasha Rd. DAPO Box 7777 Ithaca NY 14853 Uthiru, Nairobi 00605 Metro Manila U.S.A. Kenya Philippines
ISAAA on net: For more information, please visit http://www.isaaa.org & www.isaaa.org/india
1
Bhagirath Choudhary & Kadambini Gaur
CONTENTS
1) India Becomes the Number One Cotton Producing Country in the world
2) Synopsis of Thirteen Years of Adoption and Commercial Release of Bt Cotton in
India, 2002-2014
3) Adoption of Single and Double Gene Bt Cotton Hybrids in India, 2006-2014
4) Approval of Events and Bt Cotton Hybrids in India, 2002-2014
5) Savings of Insecticides due to Bt Cotton, 2001-2012
6) Export and Import of Cotton in India, 2002-2014
7) Biotech Cotton and Indian Edible Oil Sector
8) Pending Commercial Approval and Resumption of Field Trials of GM Crops in
India
9) Socio-Economic Benefits and Impact of Bt Cotton in India
10) Major Policy Developments on GM Crops in India
11) References
FIGURES
Figure 1. Top Three Cotton Producing Countries in the World, 1960 to 2014
Figure 2. Distribution of World Cotton Market Share by Top Five Producing Countries,
2002 to 2014
Figure 3. The Adoption and Impact of Bt Cotton on the Cotton Production in India,
1950 to 2014
Figure 4. Percentage Reduction of Insecticides on Cotton Relative to Total
Insecticides/Pesticides Used in Agriculture in India, 2001-2011
Figure 5. Percentage Reduction of Insecticides on Cotton Bollworm Relative to Total
Insecticide Used in Cotton in India, 2001-2011
Figure 6. Export and Import of Cotton in India, 2001 to 2014
2
Bhagirath Choudhary & Kadambini Gaur
Figure 7. Net Effects of Bt Adoption on Household Calorie Consumption
Figure 8. Distribution of Cost of Cotton Cultivation Post Bt Cotton Era
TABLES
Table 1. Thirteen Years of Adoption and Commercial Release of Bt Cotton in India,
2002 to 2014
Table 2. Adoption of Single and Double Gene Bt Cotton Hybrids in India, 2006 to 2014
(Millions Hectares and Percentage)
Table 3. Commercial Release of Different Bt Cotton Events in India, 2002-2014
Table 4. Thirteen Years of Adoption of Bt Cotton in India, by Major States*, 2002-2014
(Thousand Hectares)
Table 5. Deployment of Approved Bt Cotton Events/Hybrids/Variety by Region in India
in 2014
Table 6. Import Approval of Soybean Events for Food and Feed in India, 2010 to 2014
Table 7. Contribution of Cotton Oil to Edible Oil Sector in India, 2002-03 & 2013-14
Table 8. Status of Biotech/GM Crops Pending Approval for Field Trials and Commercial
Release in India, 2014-2015
Table 9. Distribution of Bt Brinjal Hybrids and OPVs
Table 10. Fourteen Studies Conducted by Public Institutes on the Benefits of Bt Cotton
in India for the Years, 1998 to 2013
Table 11. ISCI Survey: Economics of Bt Cotton Cultivation in Maharashtra, Andhra
Pradesh and Punjab
PICTURES
Picture 1. ISCI survey report "The Adoption and Uptake Pathways of Bt Cotton in India"
released by India’s former Union Minister of Agriculture, Mr. Sharad Pawar
Picture 2. Infographic: Bt Cotton Technology Attracting Younger Farmers to Farming
in India
3
Bhagirath Choudhary & Kadambini Gaur
Biotech Cotton in India, 2002 to 2014
Adoption, Impact, Progress & Future
SUMMARY
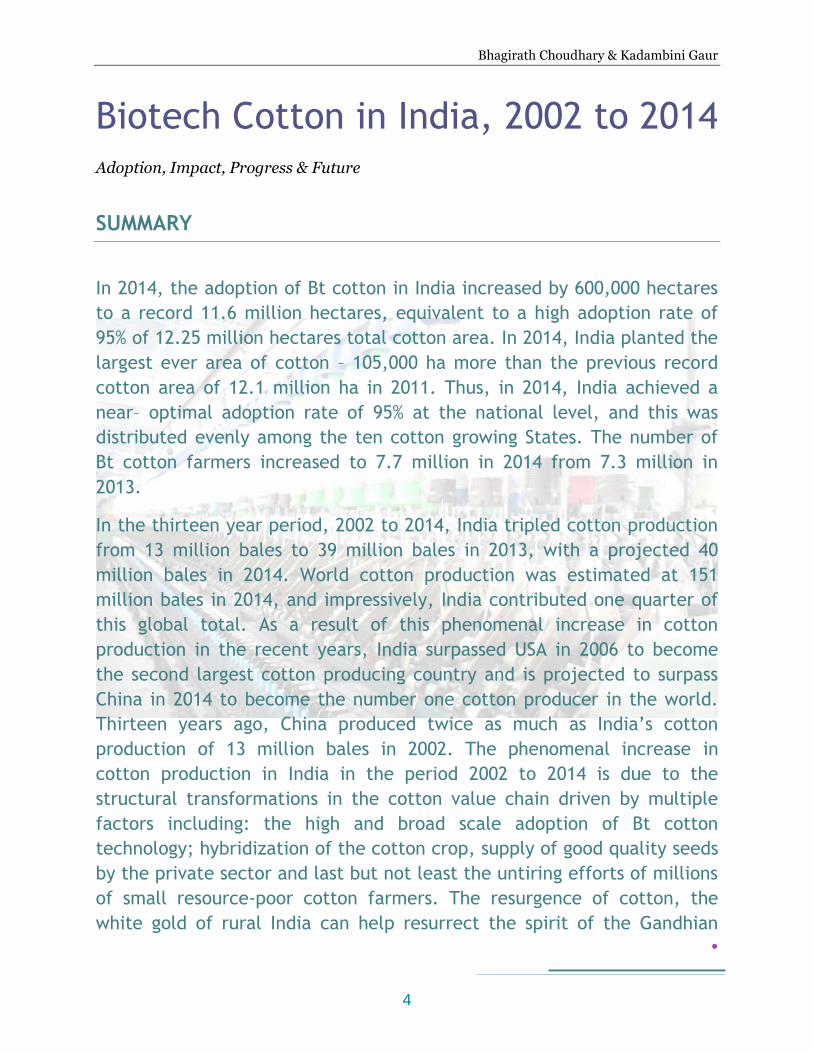
In 2014, the adoption of Bt cotton in India increased by 600,000 hectares
to a record 11.6 million hectares, equivalent to a high adoption rate of
95% of 12.25 million hectares total cotton area. In 2014, India planted the
largest ever area of cotton – 105,000 ha more than the previous record
cotton area of 12.1 million ha in 2011. Thus, in 2014, India achieved a
near– optimal adoption rate of 95% at the national level, and this was
distributed evenly among the ten cotton growing States. The number of
Bt cotton farmers increased to 7.7 million in 2014 from 7.3 million in
2013.
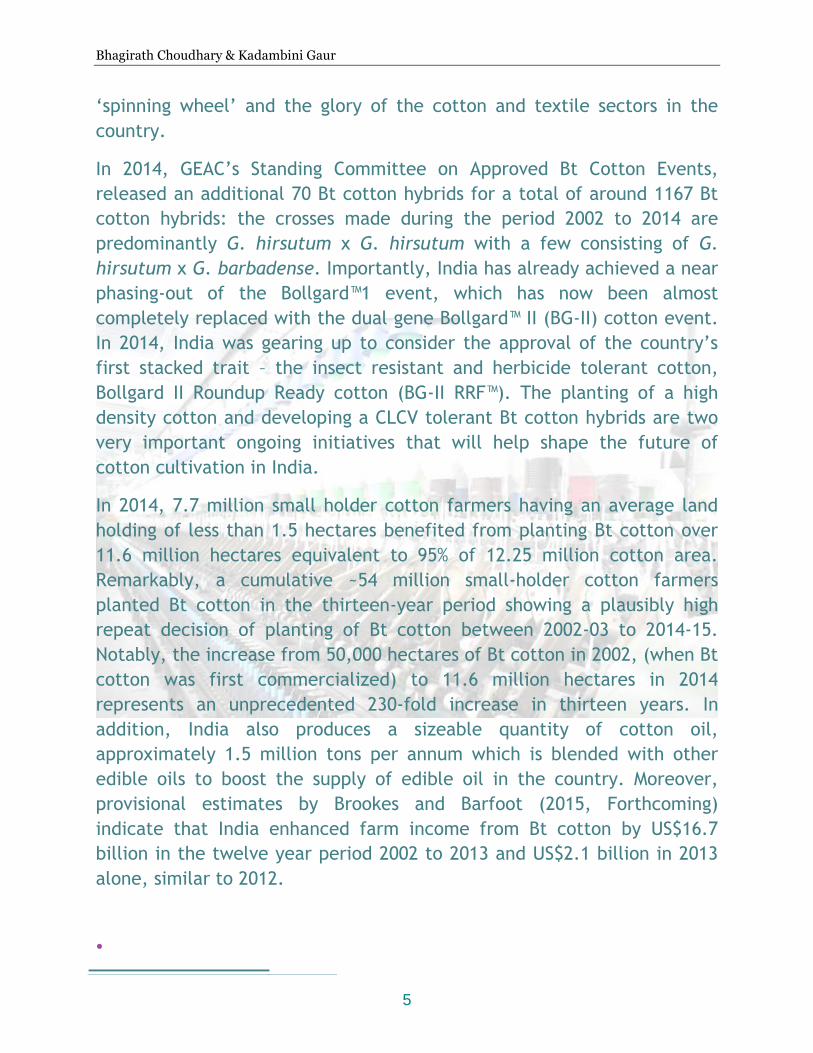
In the thirteen year period, 2002 to 2014, India tripled cotton production
from 13 million bales to 39 million bales in 2013, with a projected 40
million bales in 2014. World cotton production was estimated at 151
million bales in 2014, and impressively, India contributed one quarter of
this global total. As a result of this phenomenal increase in cotton
production in the recent years, India surpassed USA in 2006 to become
the second largest cotton producing country and is projected to surpass
China in 2014 to become the number one cotton producer in the world.
Thirteen years ago, China produced twice as much as India’s cotton
production of 13 million bales in 2002. The phenomenal increase in
cotton production in India in the period 2002 to 2014 is due to the
structural transformations in the cotton value chain driven by multiple
factors including: the high and broad scale adoption of Bt cotton
technology; hybridization of the cotton crop, supply of good quality seeds
by the private sector and last but not least the untiring efforts of millions
of small resource-poor cotton farmers. The resurgence of cotton, the
white gold of rural India can help resurrect the spirit of the Gandhian
4
Bhagirath Choudhary & Kadambini Gaur
‘spinning wheel’ and the glory of the cotton and textile sectors in the
country.
In 2014, GEAC’s Standing Committee on Approved Bt Cotton Events,
released an additional 70 Bt cotton hybrids for a total of around 1167 Bt
cotton hybrids: the crosses made during the period 2002 to 2014 are
predominantly G. hirsutum x G. hirsutum with a few consisting of G.
hirsutum x G. barbadense. Importantly, India has already achieved a near
phasing-out of the Bollgard™1 event, which has now been almost
completely replaced with the dual gene Bollgard™ II (BG-II) cotton event.
In 2014, India was gearing up to consider the approval of the country’s
first stacked trait – the insect resistant and herbicide tolerant cotton,
Bollgard II Roundup Ready cotton (BG-II RRF™). The planting of a high
density cotton and developing a CLCV tolerant Bt cotton hybrids are two
very important ongoing initiatives that will help shape the future of
cotton cultivation in India.
In 2014, 7.7 million small holder cotton farmers having an average land
holding of less than 1.5 hectares benefited from planting Bt cotton over
11.6 million hectares equivalent to 95% of 12.25 million cotton area.
Remarkably, a cumulative ~54 million small-holder cotton farmers
planted Bt cotton in the thirteen-year period showing a plausibly high
repeat decision of planting of Bt cotton between 2002-03 to 2014-15.
Notably, the increase from 50,000 hectares of Bt cotton in 2002, (when Bt
cotton was first commercialized) to 11.6 million hectares in 2014
represents an unprecedented 230-fold increase in thirteen years. In
addition, India also produces a sizeable quantity of cotton oil,
approximately 1.5 million tons per annum which is blended with other
edible oils to boost the supply of edible oil in the country. Moreover,
provisional estimates by Brookes and Barfoot (2015, Forthcoming)
indicate that India enhanced farm income from Bt cotton by US$16.7
billion in the twelve year period 2002 to 2013 and US$2.1 billion in 2013
alone, similar to 2012.
5
Bhagirath Choudhary & Kadambini Gaur
India Becomes the Number One Cotton Producing Country in the world
In 2014, India achieved a historic milestone by producing more cotton than China and becomes
the number one cotton producing country in the World. For the first time in the history of
agriculture, India dethroned China to earn the crown of the white gold – as cotton is known
among smallholder farmers in the rural parts of India and China (USDA, 2014; Reuters, 2014).
In 2006, India displaced USA to third position by harvesting 28 million bales – a million more
than USA to become the second largest cotton producing country (USDA, 2007). Over the
subsequent eight years, 2007-2014, India sustained the growth of cotton primarily due to the
introduction and rapid adoption of dual gene Bt cotton technology coupled with a large scale
hybridization of cotton area, supply of good quality seeds by private sector and untiring efforts
by approximately 8 million cotton farmers in the country.
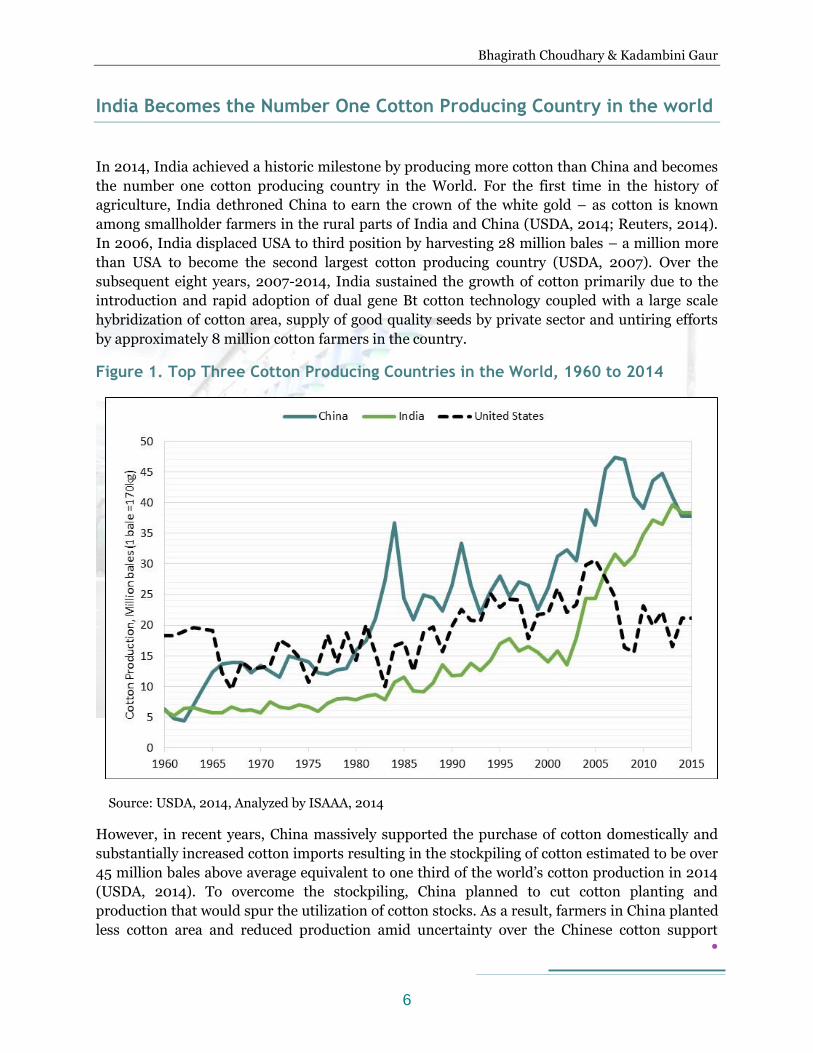
Figure 1. Top Three Cotton Producing Countries in the World, 1960 to 2014
Source: USDA, 2014, Analyzed by ISAAA, 2014
However, in recent years, China massively supported the purchase of cotton domestically and
substantially increased cotton imports resulting in the stockpiling of cotton estimated to be over
45 million bales above average equivalent to one third of the world’s cotton production in 2014
(USDA, 2014). To overcome the stockpiling, China planned to cut cotton planting and
production that would spur the utilization of cotton stocks. As a result, farmers in China planted
less cotton area and reduced production amid uncertainty over the Chinese cotton support
6
Bhagirath Choudhary & Kadambini Gaur
program at domestic level (Reuters, 2014). The OECD/FAO Global Agricultural Outlook 2014
report projected that China’s cotton production would decline by 17% over the next few years.
On the contrary, India substantially increased area under cotton, estimated to produce a record
40 million bales of cotton in 2014, compared to 39 million bales in 2013 and 35 million bales in
2012. As a result of the phenomenal increase in cotton production, India surpassed China to
occupy the top cotton producing country in the world in 2014 (OCED/FAO, 2014; USDA, 2014).
Figure 1 shows the trend in cotton production over a 40 year period, 1960 to 2014 of top three
cotton producing countries including China, India and USA. The trend lines distinctively
indicate a steep increase in cotton production in USA beginning 1996, China in 1997 and India
in 2002 corresponding with the introduction of the insect resistant Bt cotton in these countries.
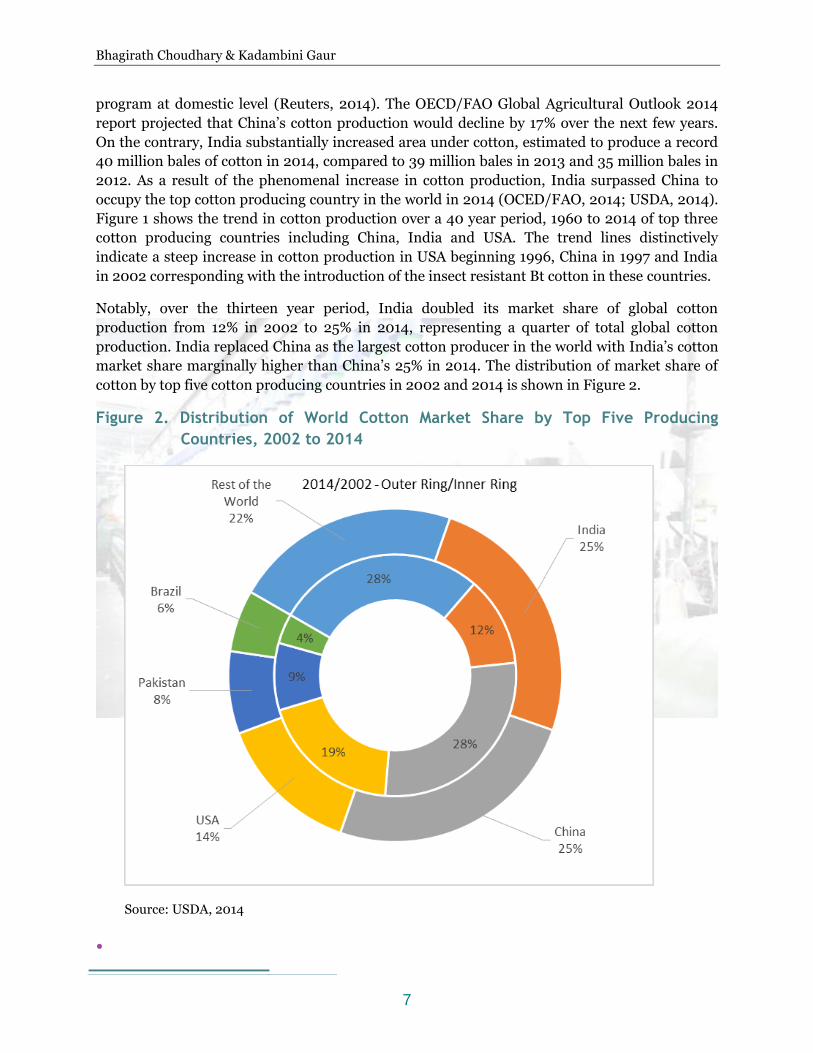
Notably, over the thirteen year period, India doubled its market share of global cotton
production from 12% in 2002 to 25% in 2014, representing a quarter of total global cotton
production. India replaced China as the largest cotton producer in the world with India’s cotton
market share marginally higher than China’s 25% in 2014. The distribution of market share of
cotton by top five cotton producing countries in 2002 and 2014 is shown in Figure 2.
Figure 2. Distribution of World Cotton Market Share by Top Five Producing
Countries, 2002 to 2014
Source: USDA, 2014
7
Bhagirath Choudhary & Kadambini Gaur
Synopsis of Thirteen Years of Adoption and Commercial Release of Bt
Cotton in India, 2002-2014
From 2002-03 to 2013-14, ISAAA has been reporting major changes in cotton sector in India of
which key developments are discussed in this document and underscore the remarkable effects
of Bt technology in cotton cultivation and production in the country (James, 2011; 2012; 2013).
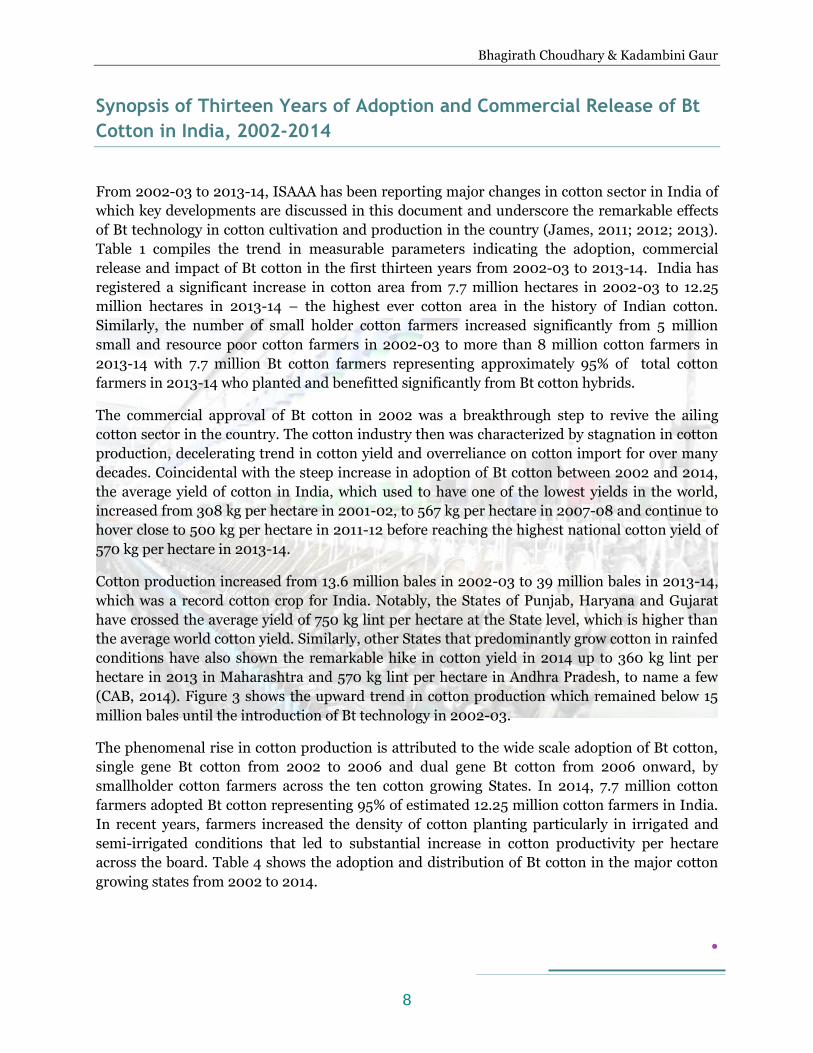
Table 1 compiles the trend in measurable parameters indicating the adoption, commercial
release and impact of Bt cotton in the first thirteen years from 2002-03 to 2013-14. India has
registered a significant increase in cotton area from 7.7 million hectares in 2002-03 to 12.25
million hectares in 2013-14 – the highest ever cotton area in the history of Indian cotton.
Similarly, the number of small holder cotton farmers increased significantly from 5 million
small and resource poor cotton farmers in 2002-03 to more than 8 million cotton farmers in
2013-14 with 7.7 million Bt cotton farmers representing approximately 95% of total cotton
farmers in 2013-14 who planted and benefitted significantly from Bt cotton hybrids.
The commercial approval of Bt cotton in 2002 was a breakthrough step to revive the ailing
cotton sector in the country. The cotton industry then was characterized by stagnation in cotton
production, decelerating trend in cotton yield and overreliance on cotton import for over many
decades. Coincidental with the steep increase in adoption of Bt cotton between 2002 and 2014,
the average yield of cotton in India, which used to have one of the lowest yields in the world,
increased from 308 kg per hectare in 2001-02, to 567 kg per hectare in 2007-08 and continue to
hover close to 500 kg per hectare in 2011-12 before reaching the highest national cotton yield of
570 kg per hectare in 2013-14.
Cotton production increased from 13.6 million bales in 2002-03 to 39 million bales in 2013-14,
which was a record cotton crop for India. Notably, the States of Punjab, Haryana and Gujarat
have crossed the average yield of 750 kg lint per hectare at the State level, which is higher than
the average world cotton yield. Similarly, other States that predominantly grow cotton in rainfed
conditions have also shown the remarkable hike in cotton yield in 2014 up to 360 kg lint per
hectare in 2013 in Maharashtra and 570 kg lint per hectare in Andhra Pradesh, to name a few
(CAB, 2014). Figure 3 shows the upward trend in cotton production which remained below 15
million bales until the introduction of Bt technology in 2002-03.
The phenomenal rise in cotton production is attributed to the wide scale adoption of Bt cotton,
single gene Bt cotton from 2002 to 2006 and dual gene Bt cotton from 2006 onward, by
smallholder cotton farmers across the ten cotton growing States. In 2014, 7.7 million cotton
farmers adopted Bt cotton representing 95% of estimated 12.25 million cotton farmers in India.
In recent years, farmers increased the density of cotton planting particularly in irrigated and
semi-irrigated conditions that led to substantial increase in cotton productivity per hectare
across the board. Table 4 shows the adoption and distribution of Bt cotton in the major cotton
growing states from 2002 to 2014.
8
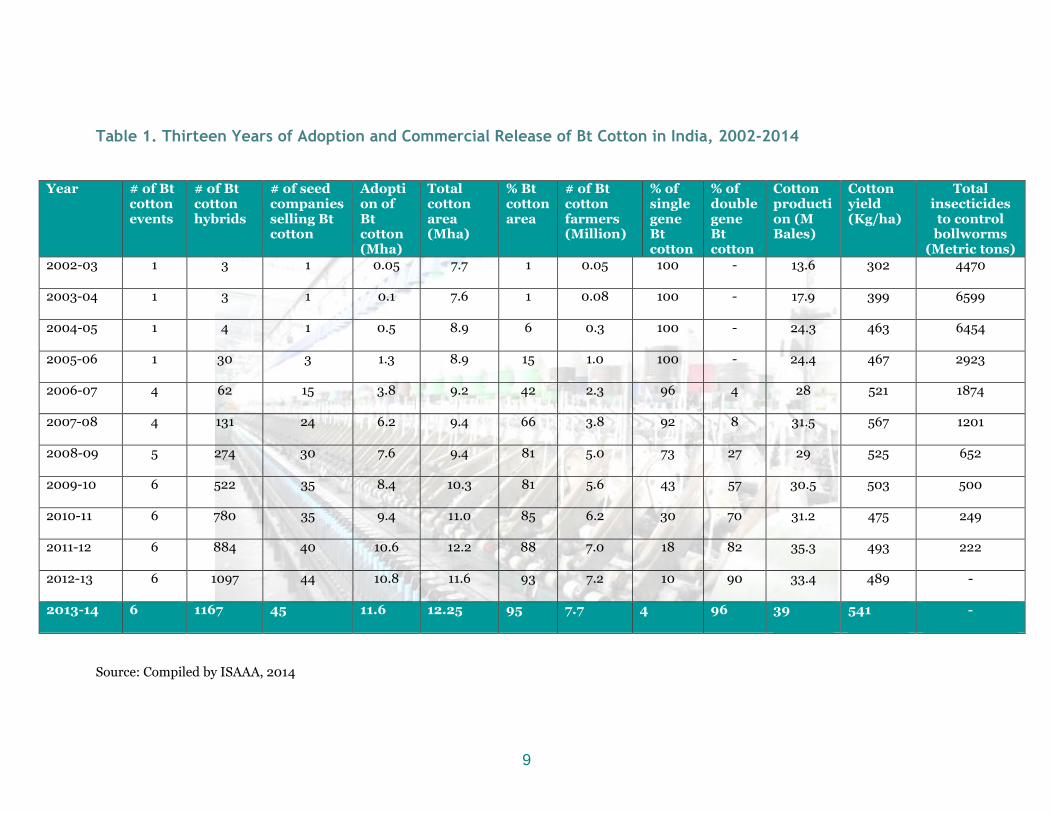
Table 1. Thirteen Years of Adoption and Commercial Release of Bt Cotton in India, 2002-2014
Year # of Bt
cotton events
# of Bt cotton hybrids
# of seed companies selling Bt cotton
Adoption of Bt cotton (Mha)
Total cotton area (Mha)
% Bt cotton area
# of Bt cotton farmers (Million)
% of single gene Bt cotton
% of double gene Bt cotton
Cotton production (M Bales)
Cotton yield (Kg/ha)
Total insecticides to control bollworms
(Metric tons) 2002-03 1 3 1 0.05 7.7 1 0.05 100 - 13.6 302 4470
2003-04 1 3 1 0.1 7.6 1 0.08 100 - 17.9 399 6599
2004-05 1 4 1 0.5 8.9 6 0.3 100 - 24.3 463 6454
2005-06 1 30 3 1.3 8.9 15 1.0 100 - 24.4 467 2923
2006-07 4 62 15 3.8 9.2 42 2.3 96 4 28 521 1874
2007-08 4 131 24 6.2 9.4 66 3.8 92 8 31.5 567 1201
2008-09 5 274 30 7.6 9.4 81 5.0 73 27 29 525 652
2009-10 6 522 35 8.4 10.3 81 5.6 43 57 30.5 503 500
2010-11 6 780 35 9.4 11.0 85 6.2 30 70 31.2 475 249
2011-12 6 884 40 10.6 12.2 88 7.0 18 82 35.3 493 222
2012-13 6 1097 44 10.8 11.6 93 7.2 10 90 33.4 489 -
2013-14 6 1167 45 11.6 12.25 95 7.7 4 96 39 541 -
Source: Compiled by ISAAA, 2014
9
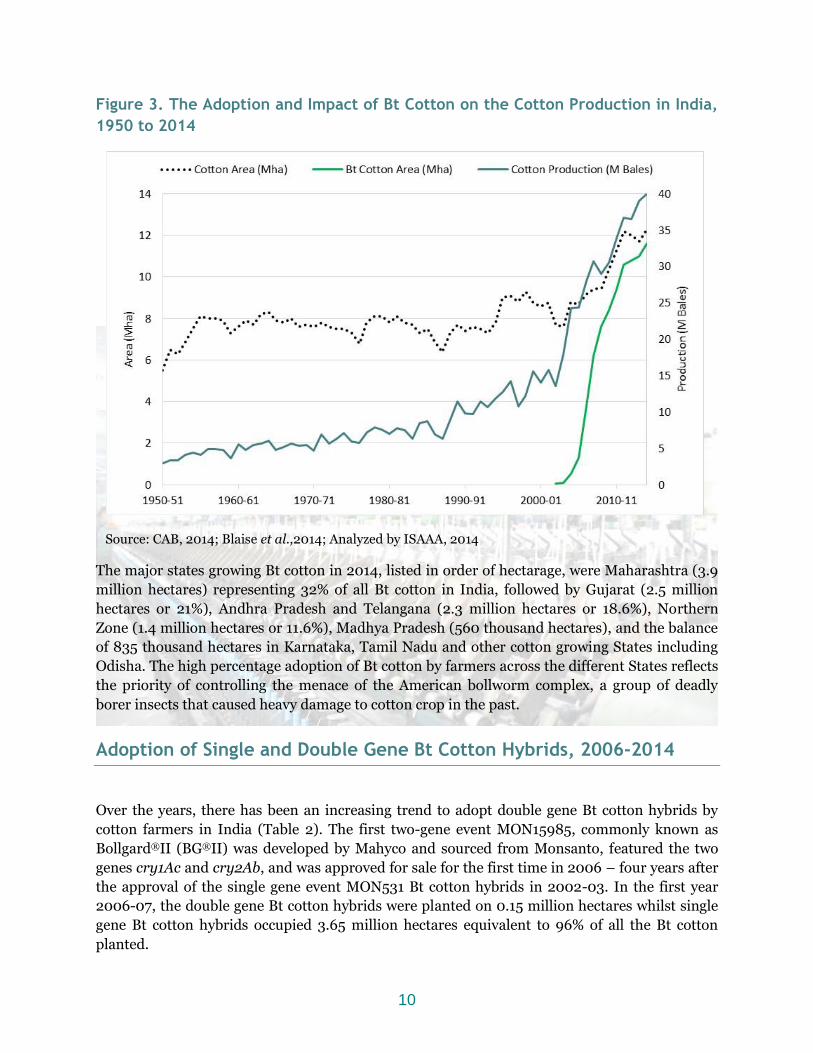
Figure 3. The Adoption and Impact of Bt Cotton on the Cotton Production in India,
1950 to 2014
Source: CAB, 2014; Blaise et al.,2014; Analyzed by ISAAA, 2014
The major states growing Bt cotton in 2014, listed in order of hectarage, were Maharashtra (3.9
million hectares) representing 32% of all Bt cotton in India, followed by Gujarat (2.5 million
hectares or 21%), Andhra Pradesh and Telangana (2.3 million hectares or 18.6%), Northern
Zone (1.4 million hectares or 11.6%), Madhya Pradesh (560 thousand hectares), and the balance
of 835 thousand hectares in Karnataka, Tamil Nadu and other cotton growing States including
Odisha. The high percentage adoption of Bt cotton by farmers across the different States reflects
the priority of controlling the menace of the American bollworm complex, a group of deadly
borer insects that caused heavy damage to cotton crop in the past.
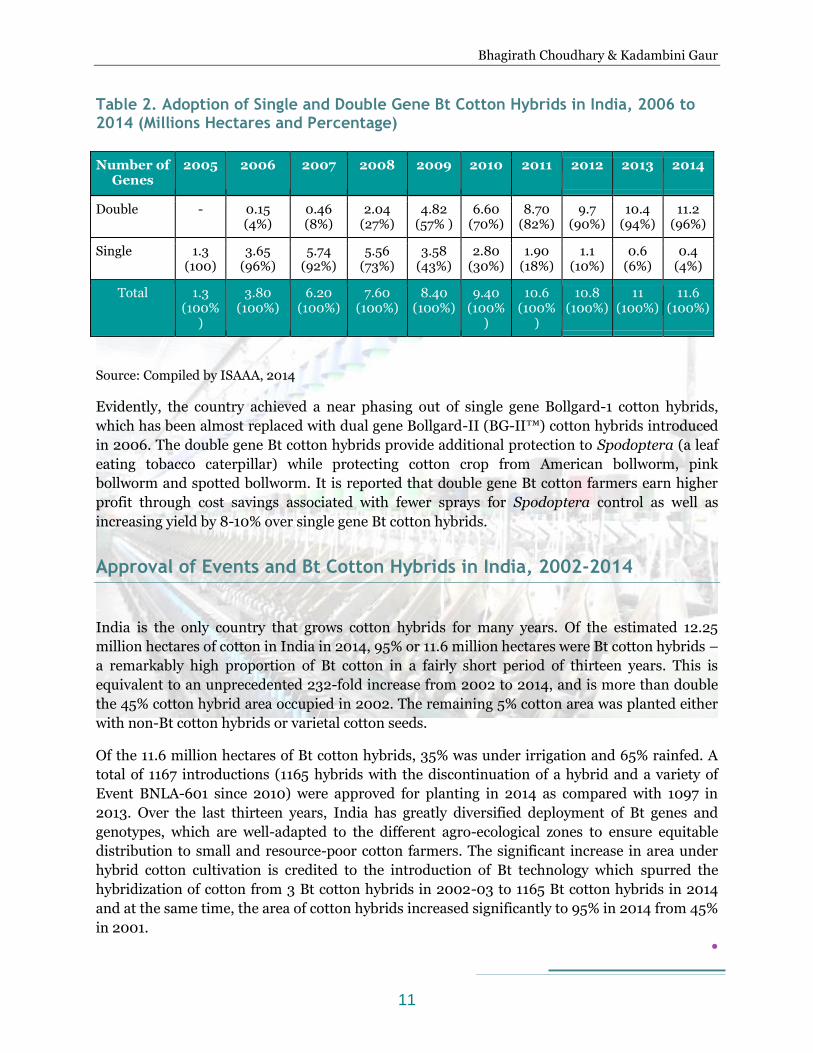
Adoption of Single and Double Gene Bt Cotton Hybrids, 2006-2014
Over the years, there has been an increasing trend to adopt double gene Bt cotton hybrids by
cotton farmers in India (Table 2). The first two-gene event MON15985, commonly known as
Bollgard®II (BG®II) was developed by Mahyco and sourced from Monsanto, featured the two
genes cry1Ac and cry2Ab, and was approved for sale for the first time in 2006 – four years after
the approval of the single gene event MON531 Bt cotton hybrids in 2002-03. In the first year
2006-07, the double gene Bt cotton hybrids were planted on 0.15 million hectares whilst single
gene Bt cotton hybrids occupied 3.65 million hectares equivalent to 96% of all the Bt cotton
planted.
10
Bhagirath Choudhary & Kadambini Gaur
Table 2. Adoption of Single and Double Gene Bt Cotton Hybrids in India, 2006 to 2014 (Millions Hectares and Percentage)
Number of Genes
2005
2006
2007
2008
2009
2010
2011
2012 2013 2014
Double
-
0.15 (4%)
0.46 (8%)
2.04 (27%)
4.82 (57% )
6.60 (70%)
8.70 (82%)
9.7 (90%)
10.4 (94%)
11.2 (96%)
Single
1.3 (100)
3.65 (96%)
5.74 (92%)
5.56 (73%)
3.58 (43%)
2.80 (30%)
1.90 (18%)
1.1 (10%)
0.6 (6%)
0.4 (4%)
Total
1.3 (100%
)
3.80 (100%)
6.20 (100%)
7.60 (100%)
8.40 (100%)
9.40 (100%
)
10.6 (100%
)
10.8 (100%)
11 (100%)
11.6 (100%)
Source: Compiled by ISAAA, 2014
Evidently, the country achieved a near phasing out of single gene Bollgard-1 cotton hybrids,
which has been almost replaced with dual gene Bollgard-II (BG-II™) cotton hybrids introduced
in 2006. The double gene Bt cotton hybrids provide additional protection to Spodoptera (a leaf
eating tobacco caterpillar) while protecting cotton crop from American bollworm, pink
bollworm and spotted bollworm. It is reported that double gene Bt cotton farmers earn higher
profit through cost savings associated with fewer sprays for Spodoptera control as well as
increasing yield by 8-10% over single gene Bt cotton hybrids.
Approval of Events and Bt Cotton Hybrids in India, 2002-2014
India is the only country that grows cotton hybrids for many years. Of the estimated 12.25
million hectares of cotton in India in 2014, 95% or 11.6 million hectares were Bt cotton hybrids –
a remarkably high proportion of Bt cotton in a fairly short period of thirteen years. This is
equivalent to an unprecedented 232-fold increase from 2002 to 2014, and is more than double
the 45% cotton hybrid area occupied in 2002. The remaining 5% cotton area was planted either
with non-Bt cotton hybrids or varietal cotton seeds.
Of the 11.6 million hectares of Bt cotton hybrids, 35% was under irrigation and 65% rainfed. A
total of 1167 introductions (1165 hybrids with the discontinuation of a hybrid and a variety of
Event BNLA-601 since 2010) were approved for planting in 2014 as compared with 1097 in
2013. Over the last thirteen years, India has greatly diversified deployment of Bt genes and
genotypes, which are well-adapted to the different agro-ecological zones to ensure equitable
distribution to small and resource-poor cotton farmers. The significant increase in area under
hybrid cotton cultivation is credited to the introduction of Bt technology which spurred the
hybridization of cotton from 3 Bt cotton hybrids in 2002-03 to 1165 Bt cotton hybrids in 2014
and at the same time, the area of cotton hybrids increased significantly to 95% in 2014 from 45%
in 2001.
11
Bhagirath Choudhary & Kadambini Gaur
The number of events as well as the number of Bt cotton hybrids and companies marketing
approved hybrids have all increased significantly from 2002, the first year of commercialization
of Bt cotton in India. The Genetic Engineering Appraisal Committee (GEAC) of the Ministry of
Environment and Forest (MOEF) approved six events of Bt cotton incorporating single and
double genes in the eleven year period from 2002 to 2014. These events included MON531
featuring cry1Ac gene, followed by first two-gene event MON15985 featuring cry1Ac and
cry2Ab2, Event-1 featuring cry1Ac, GFM event featuring fused genes cry1Ab and cry1Ac, BNLA-
601 event featuring cry1Ac gene and finally MLS-921 featuring synthetic cry1C gene. The event
BNLA-601 featuring cry1Ac gene in an open pollinated variety and a hybrid was the first event
developed by public sector institutes in India was discontinued in 2010 and is under scientific
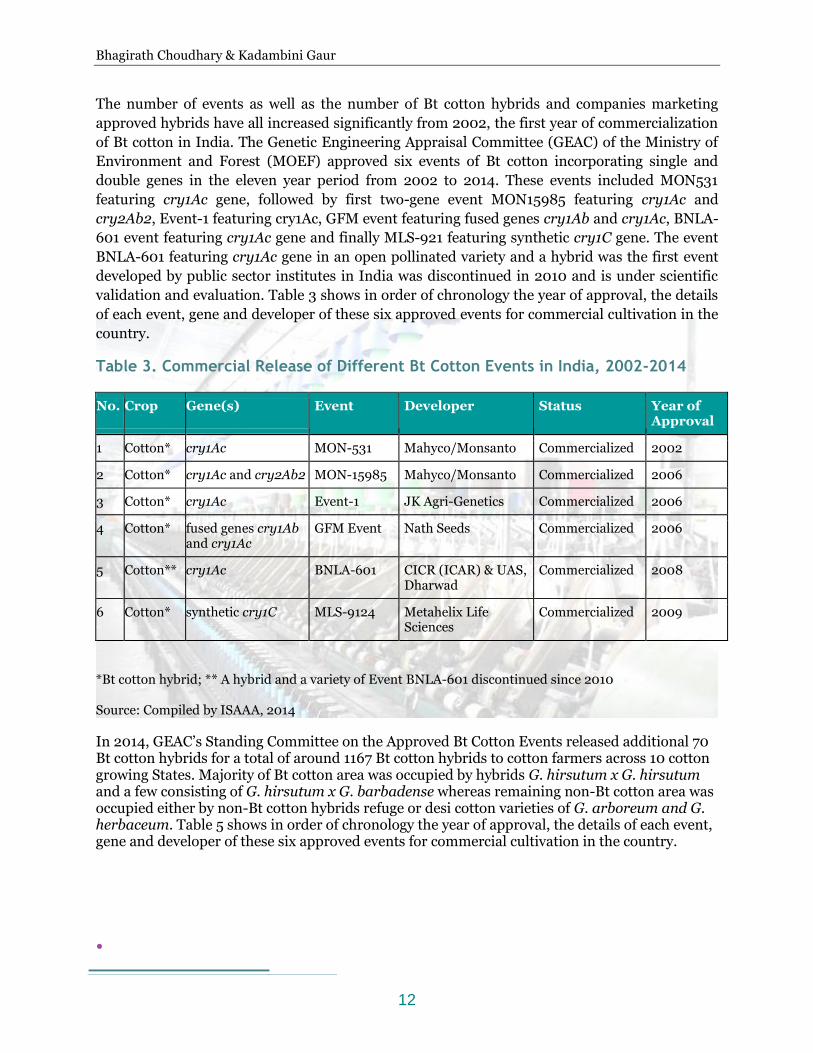
validation and evaluation. Table 3 shows in order of chronology the year of approval, the details
of each event, gene and developer of these six approved events for commercial cultivation in the
country.
Table 3. Commercial Release of Different Bt Cotton Events in India, 2002-2014
No. Crop Gene(s) Event Developer Status Year of Approval
1 Cotton* cry1Ac MON-531 Mahyco/Monsanto Commercialized 2002
2 Cotton* cry1Ac and cry2Ab2 MON-15985 Mahyco/Monsanto Commercialized 2006
3 Cotton* cry1Ac Event-1 JK Agri-Genetics Commercialized 2006
4 Cotton* fused genes cry1Ab and cry1Ac
GFM Event Nath Seeds Commercialized 2006
5 Cotton** cry1Ac BNLA-601 CICR (ICAR) & UAS, Dharwad
Commercialized
2008
6
Cotton*
synthetic cry1C MLS-9124
Metahelix Life Sciences
Commercialized
2009
*Bt cotton hybrid; ** A hybrid and a variety of Event BNLA-601 discontinued since 2010
Source: Compiled by ISAAA, 2014
In 2014, GEAC’s Standing Committee on the Approved Bt Cotton Events released additional 70 Bt cotton hybrids for a total of around 1167 Bt cotton hybrids to cotton farmers across 10 cotton growing States. Majority of Bt cotton area was occupied by hybrids G. hirsutum x G. hirsutum and a few consisting of G. hirsutum x G. barbadense whereas remaining non-Bt cotton area was occupied either by non-Bt cotton hybrids refuge or desi cotton varieties of G. arboreum and G. herbaceum. Table 5 shows in order of chronology the year of approval, the details of each event, gene and developer of these six approved events for commercial cultivation in the country.
12
Bhagirath Choudhary & Kadambini Gaur
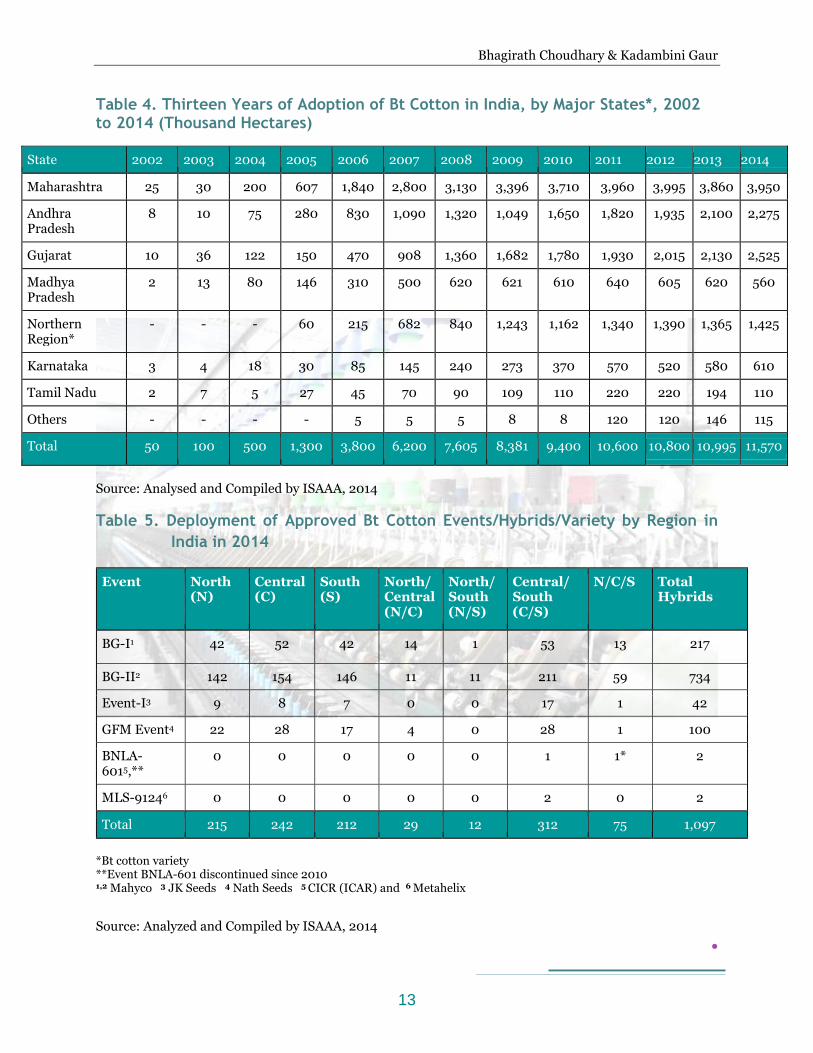
Table 4. Thirteen Years of Adoption of Bt Cotton in India, by Major States*, 2002 to 2014 (Thousand Hectares)
Source: Analysed and Compiled by ISAAA, 2014
Table 5. Deployment of Approved Bt Cotton Events/Hybrids/Variety by Region in
India in 2014
Event North (N)
Central (C)
South (S)
North/ Central (N/C)
North/ South (N/S)
Central/ South (C/S)
N/C/S Total Hybrids
BG-I1 42 52 42 14 1 53 13 217
BG-II2 142 154 146 11 11 211 59 734
Event-I3 9 8 7 0 0 17 1 42
GFM Event4 22 28 17 4 0 28 1 100
BNLA-6015,**
0 0 0 0 0 1 1* 2
MLS-91246 0 0 0 0 0 2 0 2
Total 215 242 212 29 12 312 75 1,097
*Bt cotton variety **Event BNLA-601 discontinued since 2010 1,2 Mahyco 3 JK Seeds 4 Nath Seeds 5 CICR (ICAR) and 6 Metahelix
Source: Analyzed and Compiled by ISAAA, 2014
State 2002 2003 2004 2005 2006 2007 2008 2009 2010 2011 2012 2013 2014
Maharashtra 25 30 200 607 1,840 2,800 3,130 3,396 3,710 3,960 3,995 3,860 3,950
Andhra Pradesh
8 10 75 280 830 1,090 1,320 1,049 1,650 1,820 1,935 2,100 2,275
Gujarat 10 36 122 150 470 908 1,360 1,682 1,780 1,930 2,015 2,130 2,525
Madhya Pradesh
2 13 80
146
310
500
620
621
610
640
605 620 560
Northern Region*
-
-
-
60
215
682
840
1,243
1,162
1,340
1,390 1,365 1,425
Karnataka 3 4 18 30 85 145 240 273 370 570 520 580 610
Tamil Nadu 2 7 5 27 45 70 90 109 110 220 220 194 110
Others - - - - 5 5 5 8 8 120 120 146 115
Total 50 100 500 1,300 3,800 6,200 7,605 8,381 9,400 10,600 10,800 10,995 11,570
13
Bhagirath Choudhary & Kadambini Gaur
Savings of Insecticides due to Bt Cotton, 2001-2012
In addition to boosting cotton production in the last thirteen years, Bt cotton has made a
substantial contribution to stem the cost of production by drastically reducing applications of
insecticide sprays to control key cotton pests such as American bollworm, pink bollworm,
spotted bollworm and Spodoptera. On average, Bt cotton helped farmers to reduce insecticide
sprays from more than two dozen (24) sprays to 2-3 sprays in a season. Traditionally, cotton
consumed more insecticides than any other crop equivalent to 46% of the total insecticide
market for all crops in India (Kranthi, 2012). Over the years, the market share for cotton
insecticides as a percentage of total insecticides declined steeply from 46% in 2001, to 26% in
2006 and to 20% in 2011.
Notably, there has been a very steep decline in insecticide usages particularly on Helicoverpa
armigera from 71% in 2001 to 3% in 2011. At the macro-level, the percentage of cotton
insecticides to the total pesticides market in India registered a steep decline from 33% in 2001 to
11% in 2011 at a time when total pesticides market in the country increased significantly during
the same period (CIBRC, 2012). This saving in insecticides on cotton between 2004 and 2014
coincided with the large scale adoption of Bt cotton from half a million hectares in 2004 to 11.6
million hectares in 2014-15, equivalent to 95% of the total cotton crop in 2014-15.
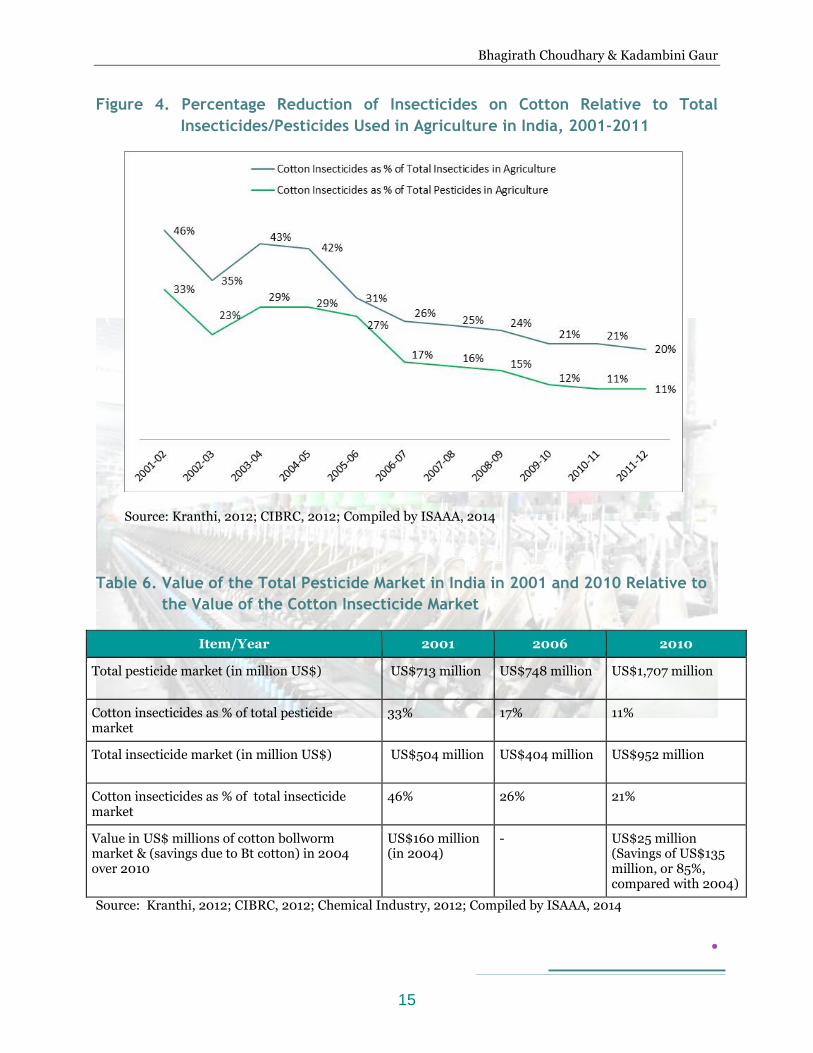
Traditionally, cotton consumed more insecticides than any other crop in India and was a
significant proportion of the total pesticide (insecticides, fungicides and herbicides) market for
all crops. For example, of the total pesticide market in India in 2001 valued at US$713 million
(Figure 4 and Table 6), 33% was for cotton insecticides only, which were equal to 46% of the
total insecticide market for all crops in India (Kranthi, 2012). Subsequent to the introduction of
Bt cotton, cotton consumed only 18% of the total pesticide market, in 2006, valued at US$900
million as compared to a much higher 30% in 1998. Similarly, the market share for cotton
insecticides as a percentage of total insecticides declined from 46% in 2001, to 26% in 2006 and
to 20% in 2011. The percentage of cotton insecticides to the total insecticides used in agriculture
in India halved to 20% in 2011 from 46% in 2001, prior to the introduction of Bt cotton in India
in 2002. At the macro-level, the percentage of cotton insecticides to the total pesticides market
in India registered a steep decline from 33% in 2001 to 11% in 2011 at the time when total
pesticides market in the country more than doubled from US$713 million in 2001 to more than
US$1,707 million in 2011
.
14
Bhagirath Choudhary & Kadambini Gaur
Figure 4. Percentage Reduction of Insecticides on Cotton Relative to Total
Insecticides/Pesticides Used in Agriculture in India, 2001-2011
Source: Kranthi, 2012; CIBRC, 2012; Compiled by ISAAA, 2014
Table 6. Value of the Total Pesticide Market in India in 2001 and 2010 Relative to
the Value of the Cotton Insecticide Market
Item/Year 2001 2006 2010
Total pesticide market (in million US$)
US$713 million US$748 million US$1,707 million
Cotton insecticides as % of total pesticide market
33%
17%
11%
Total insecticide market (in million US$)
US$504 million US$404 million US$952 million
Cotton insecticides as % of total insecticide market
46%
26%
21%
Value in US$ millions of cotton bollworm market & (savings due to Bt cotton) in 2004 over 2010
US$160 million (in 2004)
-
US$25 million (Savings of US$135 million, or 85%, compared with 2004)
Source: Kranthi, 2012; CIBRC, 2012; Chemical Industry, 2012; Compiled by ISAAA, 2014
15
Bhagirath Choudhary & Kadambini Gaur
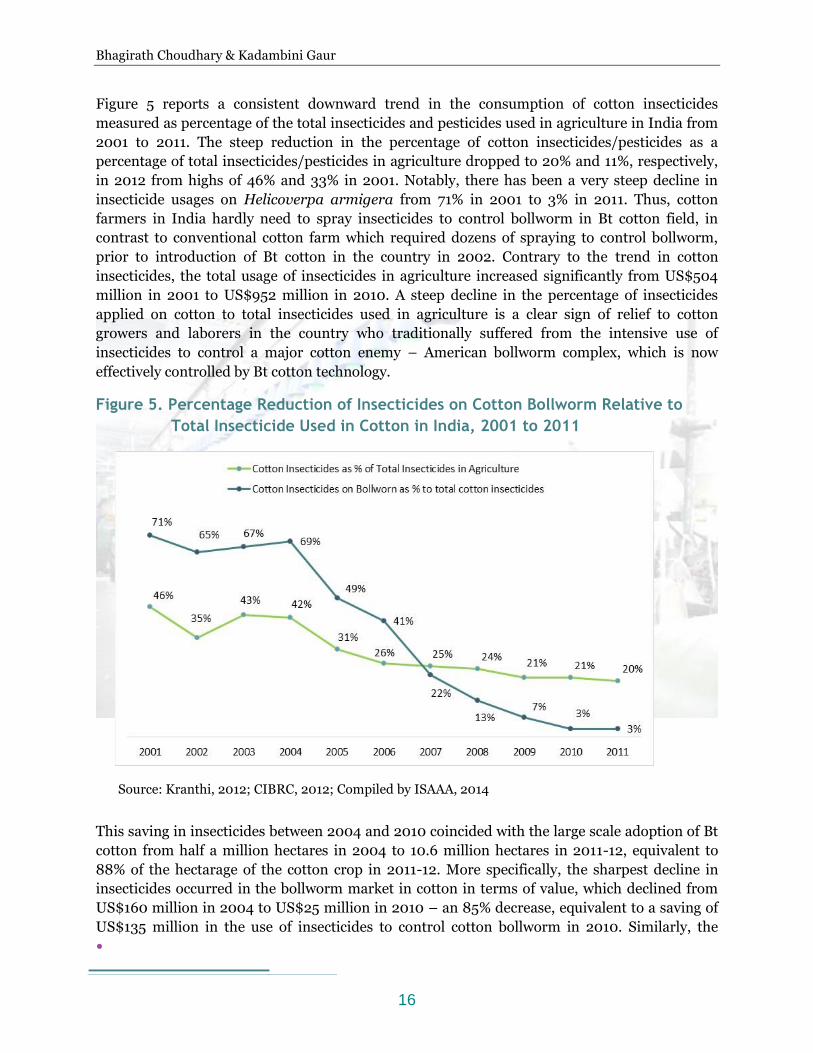
Figure 5 reports a consistent downward trend in the consumption of cotton insecticides
measured as percentage of the total insecticides and pesticides used in agriculture in India from
2001 to 2011. The steep reduction in the percentage of cotton insecticides/pesticides as a
percentage of total insecticides/pesticides in agriculture dropped to 20% and 11%, respectively,
in 2012 from highs of 46% and 33% in 2001. Notably, there has been a very steep decline in
insecticide usages on Helicoverpa armigera from 71% in 2001 to 3% in 2011. Thus, cotton
farmers in India hardly need to spray insecticides to control bollworm in Bt cotton field, in
contrast to conventional cotton farm which required dozens of spraying to control bollworm,
prior to introduction of Bt cotton in the country in 2002. Contrary to the trend in cotton
insecticides, the total usage of insecticides in agriculture increased significantly from US$504
million in 2001 to US$952 million in 2010. A steep decline in the percentage of insecticides
applied on cotton to total insecticides used in agriculture is a clear sign of relief to cotton
growers and laborers in the country who traditionally suffered from the intensive use of
insecticides to control a major cotton enemy – American bollworm complex, which is now
effectively controlled by Bt cotton technology.
Figure 5. Percentage Reduction of Insecticides on Cotton Bollworm Relative to
Total Insecticide Used in Cotton in India, 2001 to 2011
Source: Kranthi, 2012; CIBRC, 2012; Compiled by ISAAA, 2014
This saving in insecticides between 2004 and 2010 coincided with the large scale adoption of Bt
cotton from half a million hectares in 2004 to 10.6 million hectares in 2011-12, equivalent to
88% of the hectarage of the cotton crop in 2011-12. More specifically, the sharpest decline in
insecticides occurred in the bollworm market in cotton in terms of value, which declined from
US$160 million in 2004 to US$25 million in 2010 – an 85% decrease, equivalent to a saving of
US$135 million in the use of insecticides to control cotton bollworm in 2010. Similarly, the
16
Bhagirath Choudhary & Kadambini Gaur
quantity of insecticides used to control bollworm reduced by 96% from 5748 metric tons of
active ingredients in 2001 to as low as 222 metric tons of active ingredients in 2011. Thus,
insecticide use for the control of bollworm dropped significantly at the same time when
approximately 88% of the cotton area in 2011 (10.6 million hectares) and 95% of total cotton
area in 2014 (12.25 million hectares) was benefiting from controlling bollworm with Bt cotton.
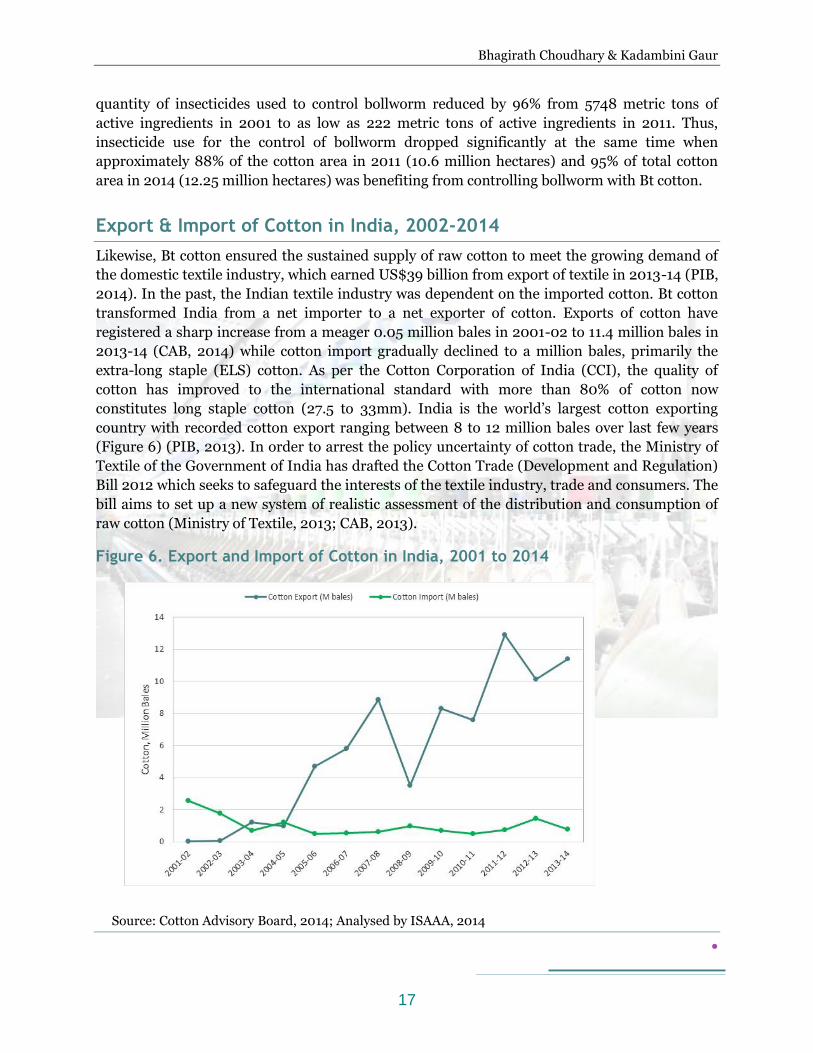
Export & Import of Cotton in India, 2002-2014
Likewise, Bt cotton ensured the sustained supply of raw cotton to meet the growing demand of
the domestic textile industry, which earned US$39 billion from export of textile in 2013-14 (PIB,
2014). In the past, the Indian textile industry was dependent on the imported cotton. Bt cotton
transformed India from a net importer to a net exporter of cotton. Exports of cotton have
registered a sharp increase from a meager 0.05 million bales in 2001-02 to 11.4 million bales in
2013-14 (CAB, 2014) while cotton import gradually declined to a million bales, primarily the
extra-long staple (ELS) cotton. As per the Cotton Corporation of India (CCI), the quality of
cotton has improved to the international standard with more than 80% of cotton now
constitutes long staple cotton (27.5 to 33mm). India is the world’s largest cotton exporting
country with recorded cotton export ranging between 8 to 12 million bales over last few years
(Figure 6) (PIB, 2013). In order to arrest the policy uncertainty of cotton trade, the Ministry of
Textile of the Government of India has drafted the Cotton Trade (Development and Regulation)
Bill 2012 which seeks to safeguard the interests of the textile industry, trade and consumers. The
bill aims to set up a new system of realistic assessment of the distribution and consumption of
raw cotton (Ministry of Textile, 2013; CAB, 2013).
Figure 6. Export and Import of Cotton in India, 2001 to 2014
Source: Cotton Advisory Board, 2014; Analysed by ISAAA, 2014
17
Bhagirath Choudhary & Kadambini Gaur
Biotech Cotton and Indian Edible Oil Sector
Edible oil is a vital ingredient of the deep-fried cooking and the Indian diet. Annually, India
consumes approximately 18 million tons of edible oil of which 40% is produced domestically
and remaining 60% is imported to meet domestic consumption. Crops like soybean, mustard,
cotton, groundnut, sunflower and other minor crops are the major sources of domestic supply
whereas the majority of imported edible oil is sourced primarily from palm and soybean (MOA,
2014). Over the years, India’s reliance on imported edible oils has soared. In 2014, India
imported the largest quantity of edible oil of 11.4 million tons which was around 65% of the total
domestic consumption (Reuters, 2014a). The import of edible oil costs approximately Rupees
60,000 crore or around US$10 billion in 2014 alone, making it the third largest import bill after
petroleum products and gold. Almost all soybean oil imported from North America and Latin
America are derived from genetically modified soybean. In 2013, the adoption of genetically
modified soybean was over 93%, 92% and 100% of total soybean area in USA, Brazil and
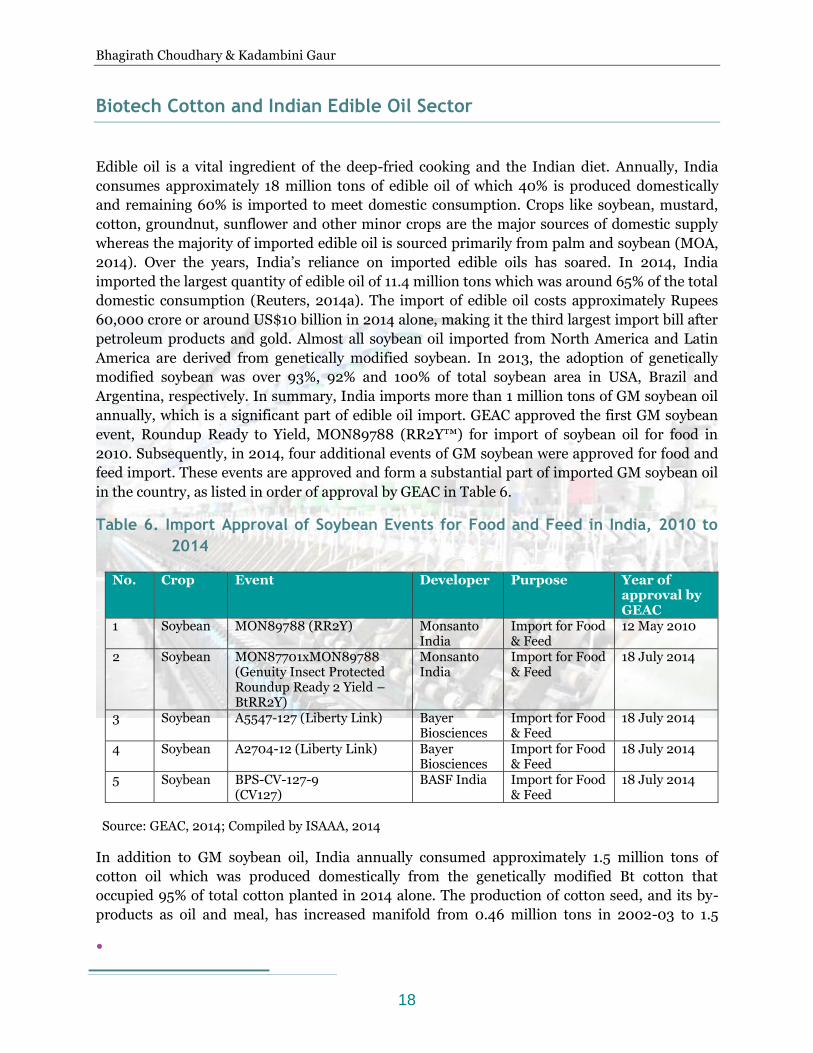
Argentina, respectively. In summary, India imports more than 1 million tons of GM soybean oil
annually, which is a significant part of edible oil import. GEAC approved the first GM soybean
event, Roundup Ready to Yield, MON89788 (RR2Y™) for import of soybean oil for food in
2010. Subsequently, in 2014, four additional events of GM soybean were approved for food and
feed import. These events are approved and form a substantial part of imported GM soybean oil
in the country, as listed in order of approval by GEAC in Table 6.
Table 6. Import Approval of Soybean Events for Food and Feed in India, 2010 to
2014
No. Crop Event Developer Purpose Year of approval by GEAC
1 Soybean MON89788 (RR2Y) Monsanto India
Import for Food & Feed
12 May 2010
2 Soybean MON87701xMON89788 (Genuity Insect Protected Roundup Ready 2 Yield –BtRR2Y)
Monsanto India
Import for Food & Feed
18 July 2014
3 Soybean A5547-127 (Liberty Link) Bayer Biosciences
Import for Food & Feed
18 July 2014
4 Soybean A2704-12 (Liberty Link) Bayer Biosciences
Import for Food & Feed
18 July 2014
5 Soybean BPS-CV-127-9 (CV127)
BASF India Import for Food & Feed
18 July 2014
Source: GEAC, 2014; Compiled by ISAAA, 2014
In addition to GM soybean oil, India annually consumed approximately 1.5 million tons of
cotton oil which was produced domestically from the genetically modified Bt cotton that
occupied 95% of total cotton planted in 2014 alone. The production of cotton seed, and its by-
products as oil and meal, has increased manifold from 0.46 million tons in 2002-03 to 1.5
18
Bhagirath Choudhary & Kadambini Gaur
million tons in 2014-15 – a three-fold increase in cotton oil production in the last thirteen years.
Notably, Bt cotton meal (de-oiled cake) contributes more than one third of the country’s total
demand for animal feed, whereas cotton oil contributes around 20% of total edible oil
production for human consumption in the country. Due to the high nutritional content of cotton
oil, Bt cotton oil is marketed after blending it with different edible oils. So far, India consumes a
significant amount of Bt cotton oil (20% of total domestic production) and Bt cotton cake
contributes one third of the total animal feed from 2002 to 2014, and thus contributed
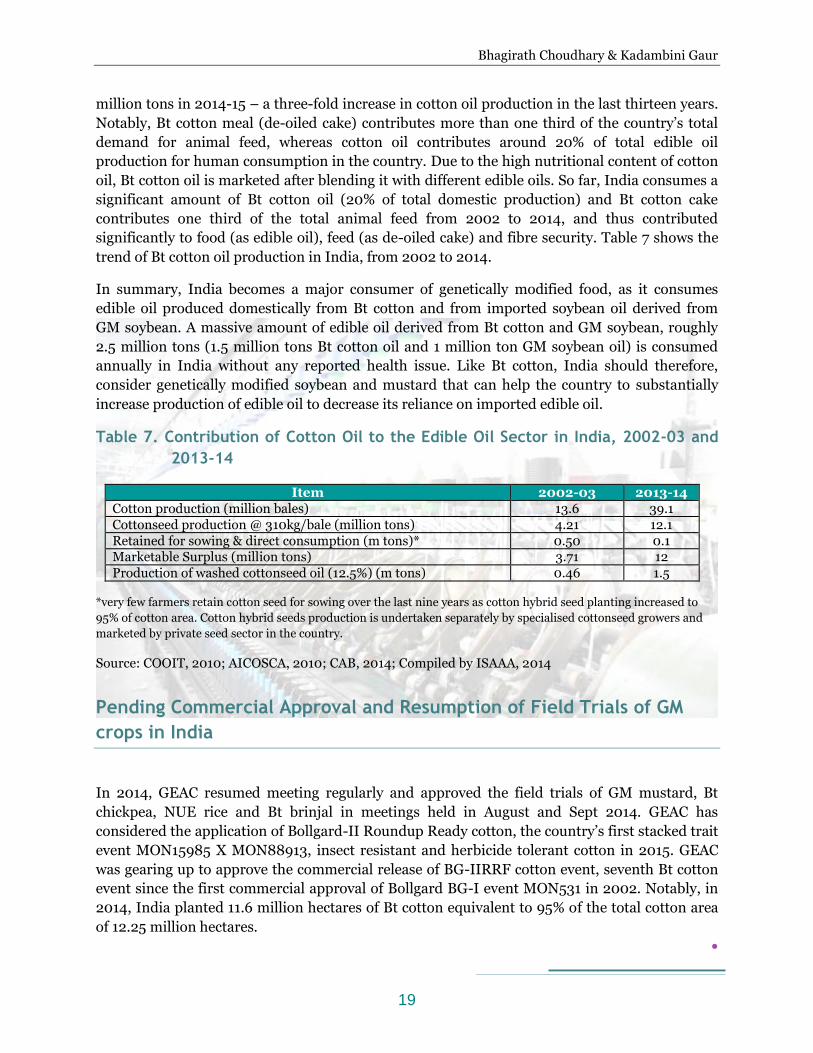
significantly to food (as edible oil), feed (as de-oiled cake) and fibre security. Table 7 shows the
trend of Bt cotton oil production in India, from 2002 to 2014.
In summary, India becomes a major consumer of genetically modified food, as it consumes
edible oil produced domestically from Bt cotton and from imported soybean oil derived from
GM soybean. A massive amount of edible oil derived from Bt cotton and GM soybean, roughly
2.5 million tons (1.5 million tons Bt cotton oil and 1 million ton GM soybean oil) is consumed
annually in India without any reported health issue. Like Bt cotton, India should therefore,
consider genetically modified soybean and mustard that can help the country to substantially
increase production of edible oil to decrease its reliance on imported edible oil.
Table 7. Contribution of Cotton Oil to the Edible Oil Sector in India, 2002-03 and
2013-14
Item 2002-03 2013-14
Cotton production (million bales) 13.6 39.1
Cottonseed production @ 310kg/bale (million tons) 4.21 12.1
Retained for sowing & direct consumption (m tons)* 0.50 0.1 Marketable Surplus (million tons) 3.71 12
Production of washed cottonseed oil (12.5%) (m tons) 0.46 1.5 *very few farmers retain cotton seed for sowing over the last nine years as cotton hybrid seed planting increased to
95% of cotton area. Cotton hybrid seeds production is undertaken separately by specialised cottonseed growers and
marketed by private seed sector in the country.
Source: COOIT, 2010; AICOSCA, 2010; CAB, 2014; Compiled by ISAAA, 2014
Pending Commercial Approval and Resumption of Field Trials of GM
crops in India
In 2014, GEAC resumed meeting regularly and approved the field trials of GM mustard, Bt
chickpea, NUE rice and Bt brinjal in meetings held in August and Sept 2014. GEAC has
considered the application of Bollgard-II Roundup Ready cotton, the country’s first stacked trait
event MON15985 X MON88913, insect resistant and herbicide tolerant cotton in 2015. GEAC
was gearing up to approve the commercial release of BG-IIRRF cotton event, seventh Bt cotton
event since the first commercial approval of Bollgard BG-I event MON531 in 2002. Notably, in
2014, India planted 11.6 million hectares of Bt cotton equivalent to 95% of the total cotton area
of 12.25 million hectares.
19
Bhagirath Choudhary & Kadambini Gaur
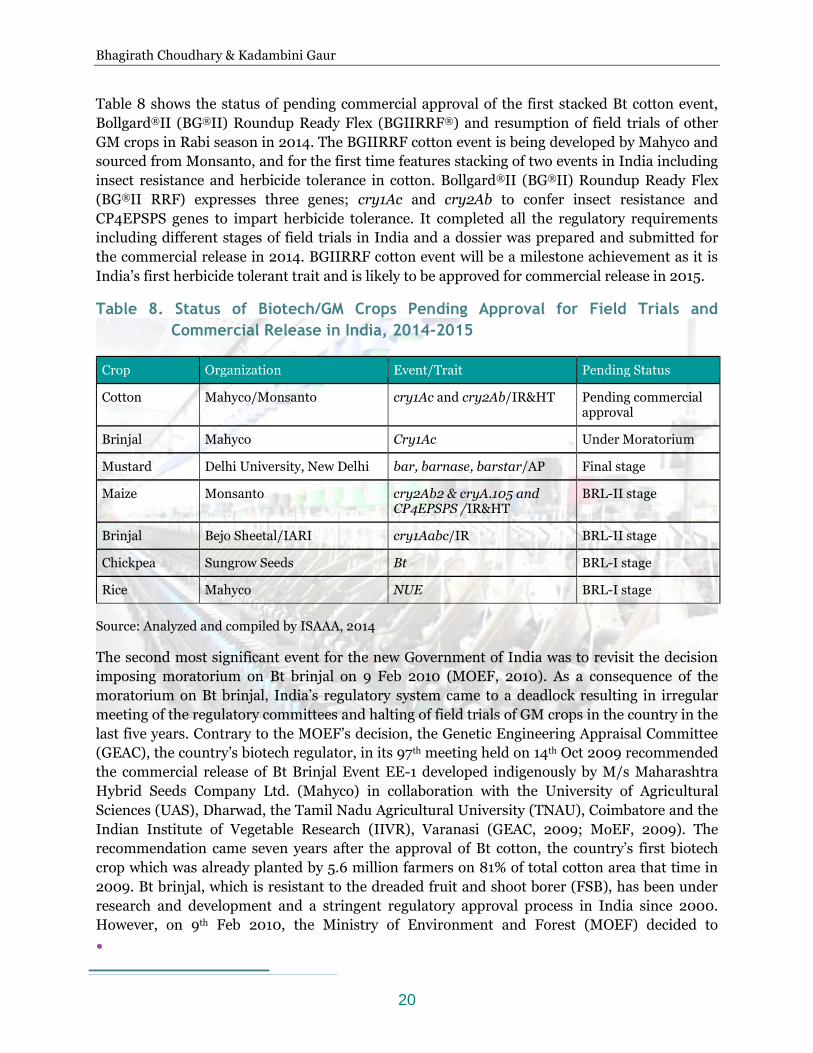
Table 8 shows the status of pending commercial approval of the first stacked Bt cotton event,
Bollgard®II (BG®II) Roundup Ready Flex (BGIIRRF®) and resumption of field trials of other
GM crops in Rabi season in 2014. The BGIIRRF cotton event is being developed by Mahyco and
sourced from Monsanto, and for the first time features stacking of two events in India including
insect resistance and herbicide tolerance in cotton. Bollgard®II (BG®II) Roundup Ready Flex
(BG®II RRF) expresses three genes; cry1Ac and cry2Ab to confer insect resistance and
CP4EPSPS genes to impart herbicide tolerance. It completed all the regulatory requirements
including different stages of field trials in India and a dossier was prepared and submitted for
the commercial release in 2014. BGIIRRF cotton event will be a milestone achievement as it is
India’s first herbicide tolerant trait and is likely to be approved for commercial release in 2015.
Table 8. Status of Biotech/GM Crops Pending Approval for Field Trials and
Commercial Release in India, 2014-2015
Crop Organization Event/Trait Pending Status
Cotton Mahyco/Monsanto cry1Ac and cry2Ab/IR&HT Pending commercial approval
Brinjal Mahyco Cry1Ac Under Moratorium
Mustard Delhi University, New Delhi bar, barnase, barstar/AP Final stage
Maize Monsanto cry2Ab2 & cryA.105 and CP4EPSPS /IR&HT
BRL-II stage
Brinjal Bejo Sheetal/IARI cry1Aabc/IR BRL-II stage
Chickpea Sungrow Seeds Bt BRL-I stage
Rice Mahyco NUE BRL-I stage
Source: Analyzed and compiled by ISAAA, 2014
The second most significant event for the new Government of India was to revisit the decision
imposing moratorium on Bt brinjal on 9 Feb 2010 (MOEF, 2010). As a consequence of the
moratorium on Bt brinjal, India’s regulatory system came to a deadlock resulting in irregular
meeting of the regulatory committees and halting of field trials of GM crops in the country in the
last five years. Contrary to the MOEF’s decision, the Genetic Engineering Appraisal Committee
(GEAC), the country’s biotech regulator, in its 97th meeting held on 14th Oct 2009 recommended
the commercial release of Bt Brinjal Event EE-1 developed indigenously by M/s Maharashtra
Hybrid Seeds Company Ltd. (Mahyco) in collaboration with the University of Agricultural
Sciences (UAS), Dharwad, the Tamil Nadu Agricultural University (TNAU), Coimbatore and the
Indian Institute of Vegetable Research (IIVR), Varanasi (GEAC, 2009; MoEF, 2009). The
recommendation came seven years after the approval of Bt cotton, the country’s first biotech
crop which was already planted by 5.6 million farmers on 81% of total cotton area that time in
2009. Bt brinjal, which is resistant to the dreaded fruit and shoot borer (FSB), has been under
research and development and a stringent regulatory approval process in India since 2000.
However, on 9th Feb 2010, the Ministry of Environment and Forest (MOEF) decided to
20
Bhagirath Choudhary & Kadambini Gaur
temporarily halt the commercial release of Bt brinjal until such time independent scientific
studies are established, to the satisfaction of both the public and professionals, the safety of the
product from the point of view of its long-term impact on human health and environment,
including the rich genetic wealth existing in brinjal in India (MOEF, 2010).
In addition to Bt brinjal Event EE-1, GEAC has also approved the field trials of another Bt
brinjal event developed by NRCPB and to be commercialized by Bejo Sheetal. GEAC’s approval
of field trials of Bt brinjal event opens up an opportunity for the Government of India to revisit
the moratorium on Bt brinjal event EE-1 which was declared safe for environmental release by
GEAC on 14 October 2009. The Government of India should prioritize the commercial approval
of 16 varieties of Bt brinjal with event EE-1 developed by TNAU, Coimbatore; UAS Dharward
and IIVR, Varanasi pending commercialization for five years now. Notably, the public sector
investment in developing these varieties set to go to waste because seeds tend to lose their
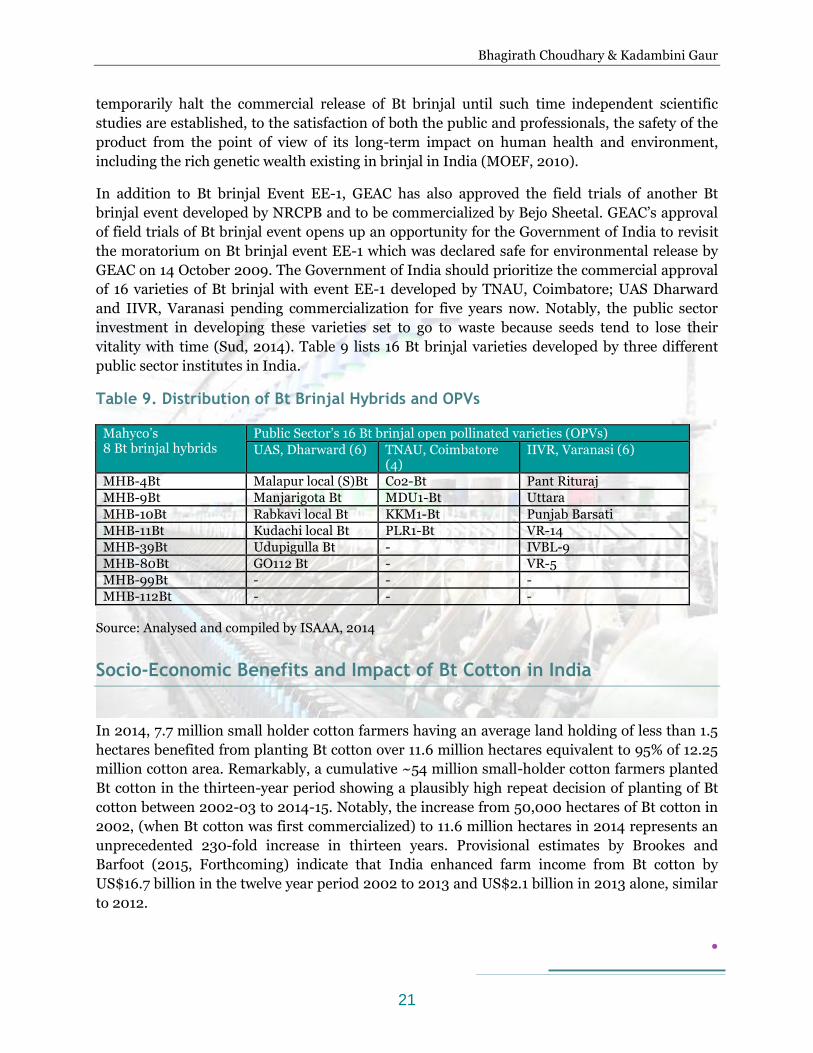
vitality with time (Sud, 2014). Table 9 lists 16 Bt brinjal varieties developed by three different
public sector institutes in India.
Table 9. Distribution of Bt Brinjal Hybrids and OPVs
Mahyco’s 8 Bt brinjal hybrids
Public Sector’s 16 Bt brinjal open pollinated varieties (OPVs)
UAS, Dharward (6) TNAU, Coimbatore (4)
IIVR, Varanasi (6)
MHB-4Bt Malapur local (S)Bt Co2-Bt Pant Rituraj
MHB-9Bt Manjarigota Bt MDU1-Bt Uttara
MHB-10Bt Rabkavi local Bt KKM1-Bt Punjab Barsati
MHB-11Bt Kudachi local Bt PLR1-Bt VR-14
MHB-39Bt Udupigulla Bt - IVBL-9
MHB-80Bt GO112 Bt - VR-5
MHB-99Bt - - -
MHB-112Bt - - -
Source: Analysed and compiled by ISAAA, 2014
Socio-Economic Benefits and Impact of Bt Cotton in India
In 2014, 7.7 million small holder cotton farmers having an average land holding of less than 1.5
hectares benefited from planting Bt cotton over 11.6 million hectares equivalent to 95% of 12.25
million cotton area. Remarkably, a cumulative ~54 million small-holder cotton farmers planted
Bt cotton in the thirteen-year period showing a plausibly high repeat decision of planting of Bt
cotton between 2002-03 to 2014-15. Notably, the increase from 50,000 hectares of Bt cotton in
2002, (when Bt cotton was first commercialized) to 11.6 million hectares in 2014 represents an
unprecedented 230-fold increase in thirteen years. Provisional estimates by Brookes and
Barfoot (2015, Forthcoming) indicate that India enhanced farm income from Bt cotton by
US$16.7 billion in the twelve year period 2002 to 2013 and US$2.1 billion in 2013 alone, similar
to 2012.
21
Bhagirath Choudhary & Kadambini Gaur
The field performance and socio-economic assessment of Bt cotton have been the integral part
of the regulatory process of commercialization of Bt cotton in India. Until now, fourteen peer-
reviewed research studies have been conducted over the years, three studies were conducted
prior to the commercialization of Bt cotton from 1998 to 2001, whereas eleven studies were
carried out to assess ex-ante impact of Bt cotton, which were reported during the post
commercialization of Bt cotton from 2002 to 2013. The results of these studies on Bt cotton
were consistent with the study undertaken by Gandhi and Namboodiri in 2006 showing yield
gains of approximately 31%, a significant 39% reduction in the number of insecticide sprays,
leading to an 88% increase in profitability, equivalent to a substantial increase of approximately
US$250 per hectare. These studies as referenced chronologically in Table 10 confirm the socio-
economic benefits of Bt cotton in India for the years 1998-2013.
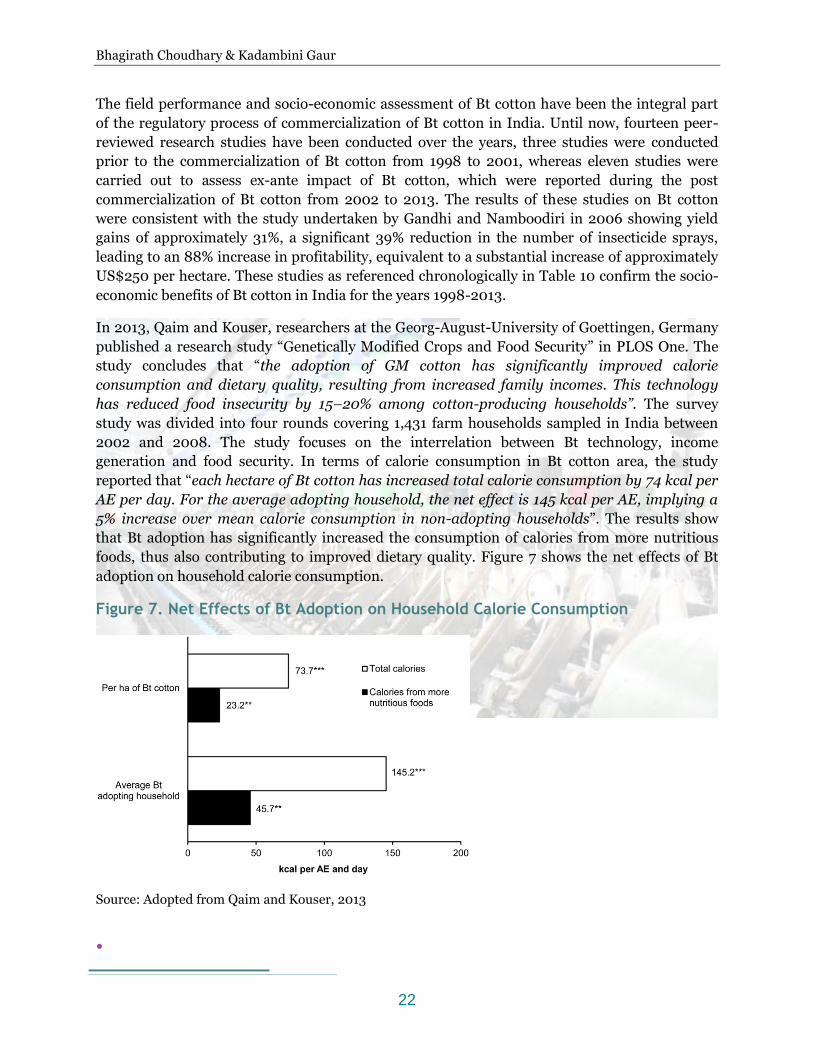
In 2013, Qaim and Kouser, researchers at the Georg-August-University of Goettingen, Germany
published a research study “Genetically Modified Crops and Food Security” in PLOS One. The
study concludes that “the adoption of GM cotton has significantly improved calorie
consumption and dietary quality, resulting from increased family incomes. This technology
has reduced food insecurity by 15–20% among cotton-producing households”. The survey
study was divided into four rounds covering 1,431 farm households sampled in India between
2002 and 2008. The study focuses on the interrelation between Bt technology, income
generation and food security. In terms of calorie consumption in Bt cotton area, the study
reported that “each hectare of Bt cotton has increased total calorie consumption by 74 kcal per
AE per day. For the average adopting household, the net effect is 145 kcal per AE, implying a
5% increase over mean calorie consumption in non-adopting households”. The results show
that Bt adoption has significantly increased the consumption of calories from more nutritious
foods, thus also contributing to improved dietary quality. Figure 7 shows the net effects of Bt
adoption on household calorie consumption.
Figure 7. Net Effects of Bt Adoption on Household Calorie Consumption
Source: Adopted from Qaim and Kouser, 2013
22
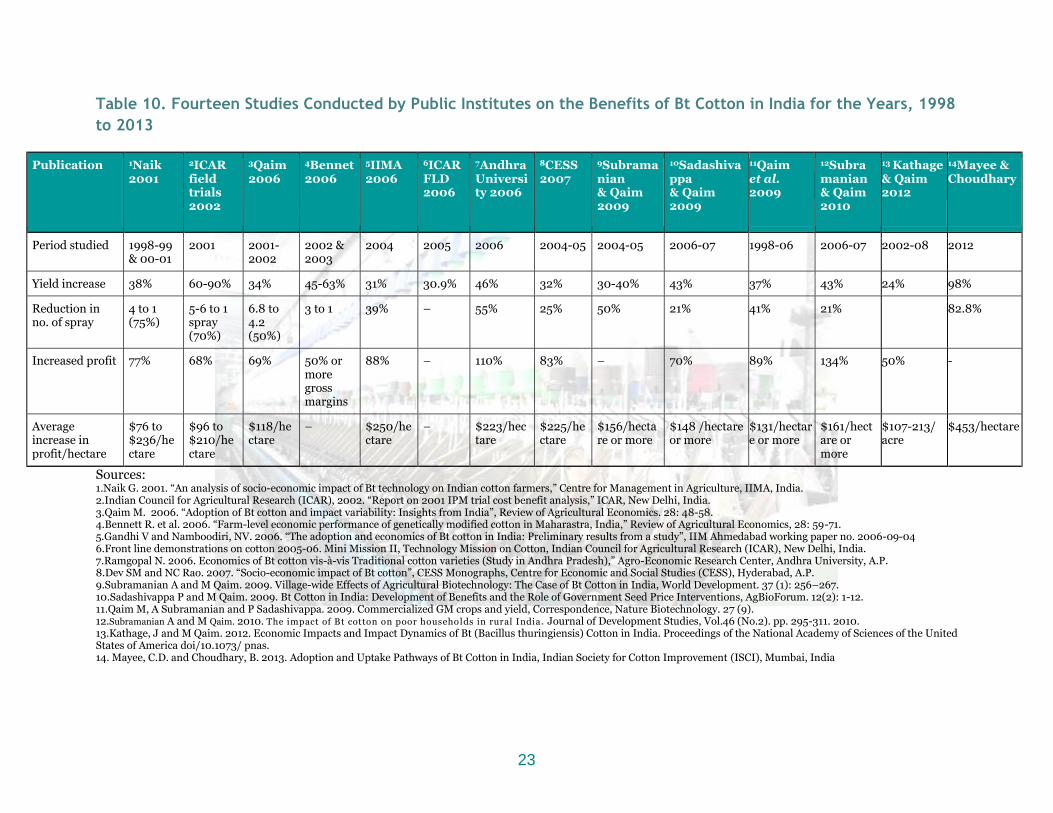
Table 10. Fourteen Studies Conducted by Public Institutes on the Benefits of Bt Cotton in India for the Years, 1998
to 2013
Sources: 1.Naik G. 2001. “An analysis of socio-economic impact of Bt technology on Indian cotton farmers,” Centre for Management in Agriculture, IIMA, India. 2.Indian Council for Agricultural Research (ICAR), 2002. “Report on 2001 IPM trial cost benefit analysis,” ICAR, New Delhi, India. 3.Qaim M. 2006. “Adoption of Bt cotton and impact variability: Insights from India”, Review of Agricultural Economics. 28: 48-58. 4.Bennett R. et al. 2006. “Farm-level economic performance of genetically modified cotton in Maharastra, India,” Review of Agricultural Economics, 28: 59-71. 5.Gandhi V and Namboodiri, NV. 2006. “The adoption and economics of Bt cotton in India: Preliminary results from a study”, IIM Ahmedabad working paper no. 2006-09-04 6.Front line demonstrations on cotton 2005-06. Mini Mission II, Technology Mission on Cotton, Indian Council for Agricultural Research (ICAR), New Delhi, India. 7.Ramgopal N. 2006. Economics of Bt cotton vis-à-vis Traditional cotton varieties (Study in Andhra Pradesh),” Agro-Economic Research Center, Andhra University, A.P. 8.Dev SM and NC Rao. 2007. “Socio-economic impact of Bt cotton”, CESS Monographs, Centre for Economic and Social Studies (CESS), Hyderabad, A.P. 9.Subramanian A and M Qaim. 2009. Village-wide Effects of Agricultural Biotechnology: The Case of Bt Cotton in India, World Development. 37 (1): 256–267. 10.Sadashivappa P and M Qaim. 2009. Bt Cotton in India: Development of Benefits and the Role of Government Seed Price Interventions, AgBioForum. 12(2): 1-12. 11.Qaim M, A Subramanian and P Sadashivappa. 2009. Commercialized GM crops and yield, Correspondence, Nature Biotechnology. 27 (9). 12.Subramanian A and M Qaim. 2010. The impact of Bt cotton on poor households in rural India. Journal of Development Studies, Vol.46 (No.2). pp. 295-311. 2010. 13.Kathage, J and M Qaim. 2012. Economic Impacts and Impact Dynamics of Bt (Bacillus thuringiensis) Cotton in India. Proceedings of the National Academy of Sciences of the United States of America doi/10.1073/ pnas. 14. Mayee, C.D. and Choudhary, B. 2013. Adoption and Uptake Pathways of Bt Cotton in India, Indian Society for Cotton Improvement (ISCI), Mumbai, India
Publication 1Naik 2001
2ICAR field trials 2002
3Qaim 2006
4Bennet 2006
5IIMA 2006
6ICAR FLD 2006
7Andhra University 2006
8CESS 2007
9Subramanian & Qaim 2009
10Sadashivappa & Qaim 2009
11Qaim et al. 2009
12Subramanian & Qaim 2010
13 Kathage & Qaim 2012
14Mayee & Choudhary
Period studied 1998-99 & 00-01
2001 2001-2002
2002 & 2003
2004 2005 2006 2004-05 2004-05 2006-07 1998-06 2006-07 2002-08 2012
Yield increase 38% 60-90% 34% 45-63% 31% 30.9% 46% 32% 30-40% 43% 37% 43% 24% 98%
Reduction in no. of spray
4 to 1 (75%)
5-6 to 1 spray (70%)
6.8 to 4.2 (50%)
3 to 1 39% – 55% 25% 50% 21% 41% 21% 82.8%
Increased profit 77% 68% 69% 50% or more gross margins
88% – 110% 83% – 70% 89% 134% 50% -
Average increase in profit/hectare
$76 to $236/hectare
$96 to $210/hectare
$118/hectare
– $250/hectare
– $223/hectare
$225/hectare
$156/hectare or more
$148 /hectare or more
$131/hectare or more
$161/hectare or more
$107-213/ acre
$453/hectare
23
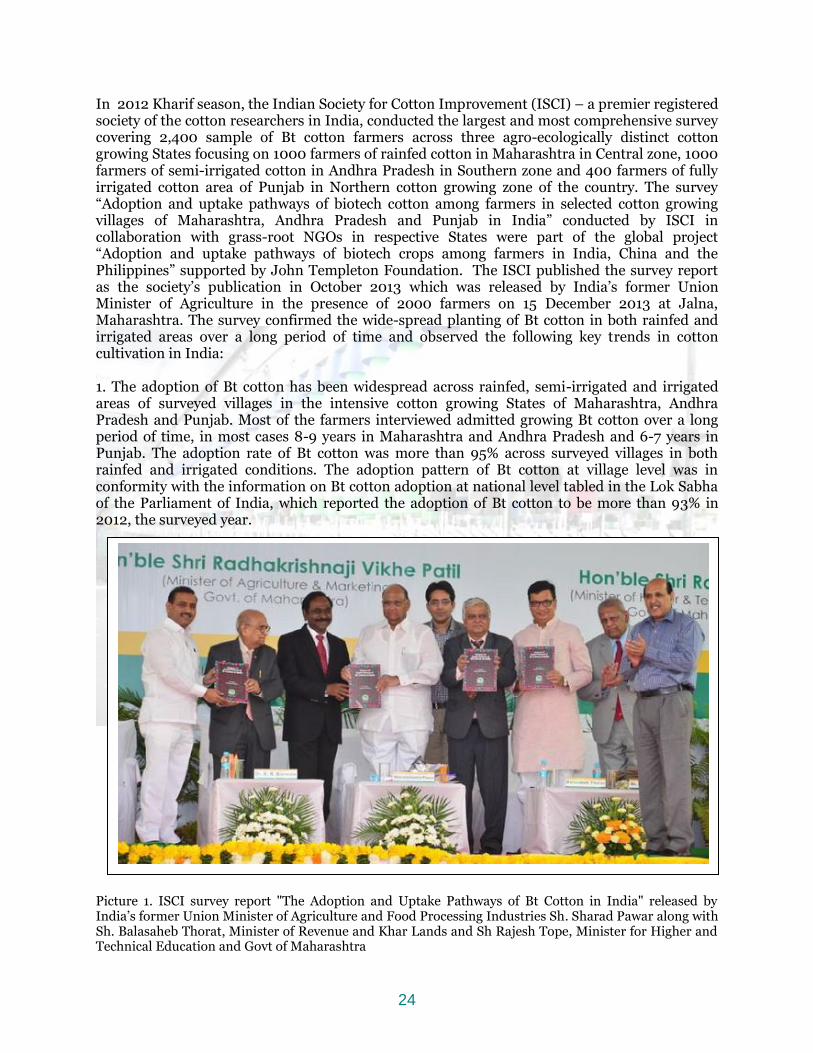
In 2012 Kharif season, the Indian Society for Cotton Improvement (ISCI) – a premier registered society of the cotton researchers in India, conducted the largest and most comprehensive survey covering 2,400 sample of Bt cotton farmers across three agro-ecologically distinct cotton growing States focusing on 1000 farmers of rainfed cotton in Maharashtra in Central zone, 1000 farmers of semi-irrigated cotton in Andhra Pradesh in Southern zone and 400 farmers of fully irrigated cotton area of Punjab in Northern cotton growing zone of the country. The survey “Adoption and uptake pathways of biotech cotton among farmers in selected cotton growing villages of Maharashtra, Andhra Pradesh and Punjab in India” conducted by ISCI in collaboration with grass-root NGOs in respective States were part of the global project “Adoption and uptake pathways of biotech crops among farmers in India, China and the Philippines” supported by John Templeton Foundation. The ISCI published the survey report as the society’s publication in October 2013 which was released by India’s former Union Minister of Agriculture in the presence of 2000 farmers on 15 December 2013 at Jalna, Maharashtra. The survey confirmed the wide-spread planting of Bt cotton in both rainfed and irrigated areas over a long period of time and observed the following key trends in cotton cultivation in India: 1. The adoption of Bt cotton has been widespread across rainfed, semi-irrigated and irrigated areas of surveyed villages in the intensive cotton growing States of Maharashtra, Andhra Pradesh and Punjab. Most of the farmers interviewed admitted growing Bt cotton over a long period of time, in most cases 8-9 years in Maharashtra and Andhra Pradesh and 6-7 years in Punjab. The adoption rate of Bt cotton was more than 95% across surveyed villages in both rainfed and irrigated conditions. The adoption pattern of Bt cotton at village level was in conformity with the information on Bt cotton adoption at national level tabled in the Lok Sabha of the Parliament of India, which reported the adoption of Bt cotton to be more than 93% in 2012, the surveyed year. Picture 1. ISCI survey report "The Adoption and Uptake Pathways of Bt Cotton in India" released by India’s former Union Minister of Agriculture and Food Processing Industries Sh. Sharad Pawar along with Sh. Balasaheb Thorat, Minister of Revenue and Khar Lands and Sh Rajesh Tope, Minister for Higher and Technical Education and Govt of Maharashtra
24
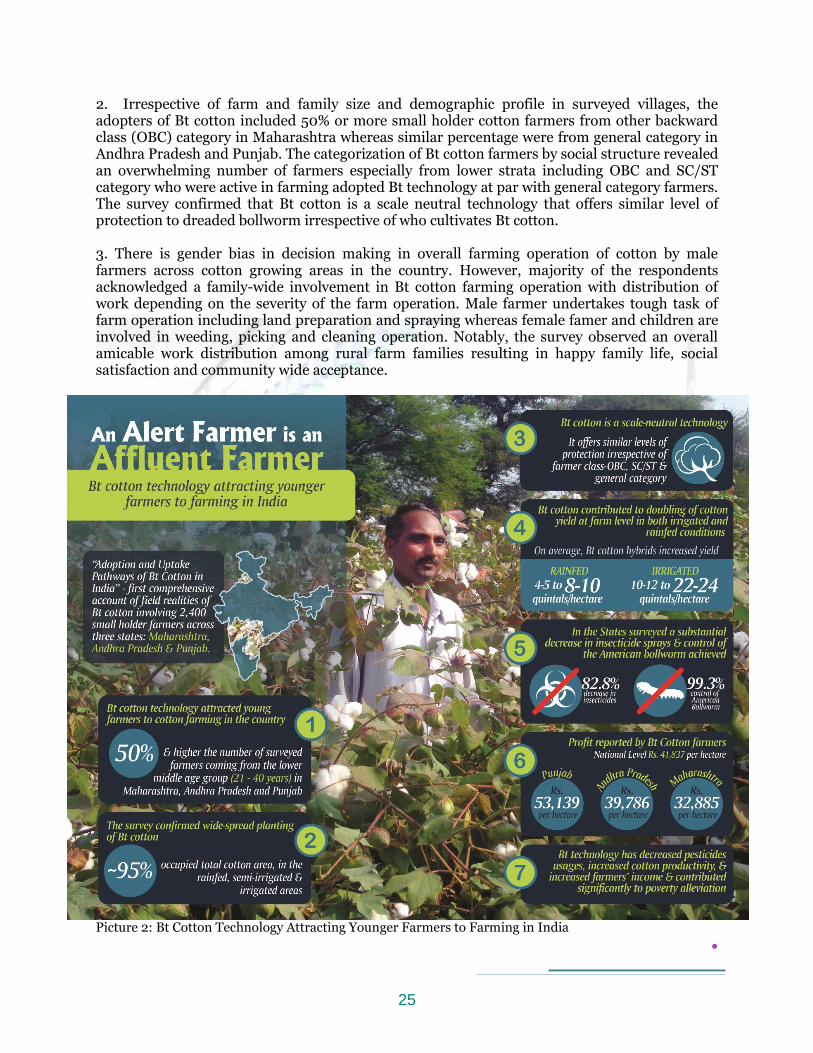
2. Irrespective of farm and family size and demographic profile in surveyed villages, the adopters of Bt cotton included 50% or more small holder cotton farmers from other backward class (OBC) category in Maharashtra whereas similar percentage were from general category in Andhra Pradesh and Punjab. The categorization of Bt cotton farmers by social structure revealed an overwhelming number of farmers especially from lower strata including OBC and SC/ST category who were active in farming adopted Bt technology at par with general category farmers. The survey confirmed that Bt cotton is a scale neutral technology that offers similar level of protection to dreaded bollworm irrespective of who cultivates Bt cotton. 3. There is gender bias in decision making in overall farming operation of cotton by male farmers across cotton growing areas in the country. However, majority of the respondents acknowledged a family-wide involvement in Bt cotton farming operation with distribution of work depending on the severity of the farm operation. Male farmer undertakes tough task of farm operation including land preparation and spraying whereas female famer and children are involved in weeding, picking and cleaning operation. Notably, the survey observed an overall amicable work distribution among rural farm families resulting in happy family life, social satisfaction and community wide acceptance.
Picture 2: Bt Cotton Technology Attracting Younger Farmers to Farming in India
25
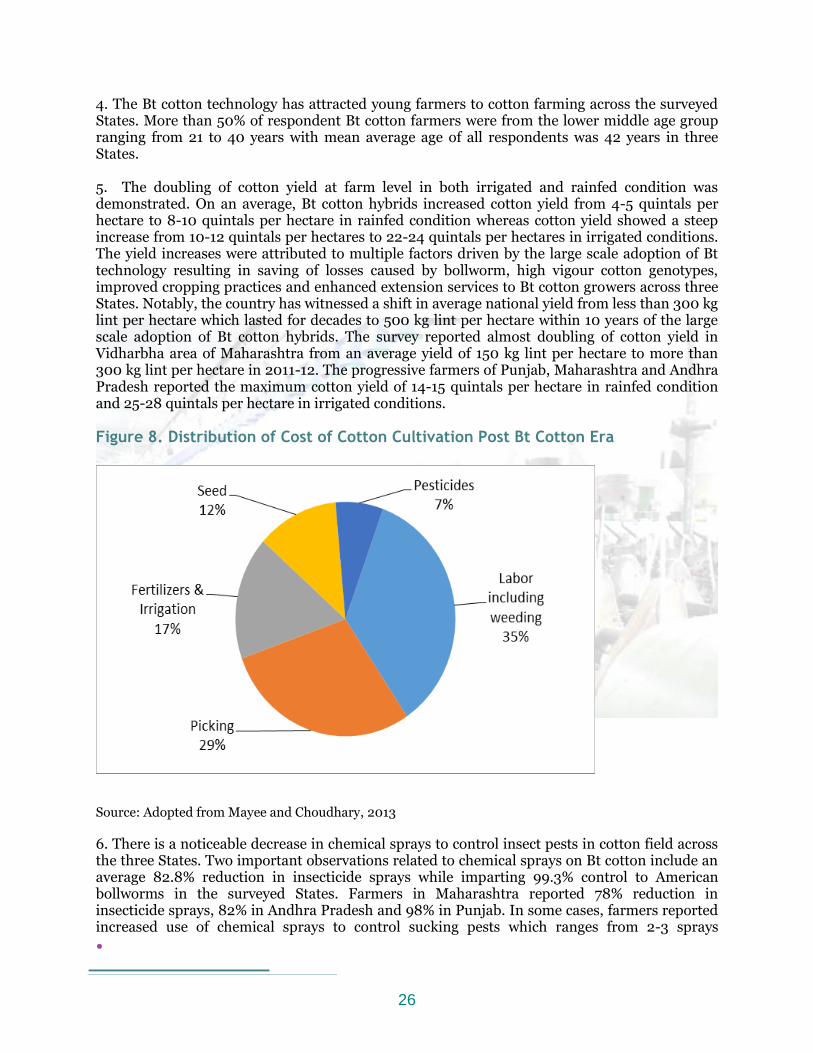
4. The Bt cotton technology has attracted young farmers to cotton farming across the surveyed States. More than 50% of respondent Bt cotton farmers were from the lower middle age group ranging from 21 to 40 years with mean average age of all respondents was 42 years in three States. 5. The doubling of cotton yield at farm level in both irrigated and rainfed condition was demonstrated. On an average, Bt cotton hybrids increased cotton yield from 4-5 quintals per hectare to 8-10 quintals per hectare in rainfed condition whereas cotton yield showed a steep increase from 10-12 quintals per hectares to 22-24 quintals per hectares in irrigated conditions. The yield increases were attributed to multiple factors driven by the large scale adoption of Bt technology resulting in saving of losses caused by bollworm, high vigour cotton genotypes, improved cropping practices and enhanced extension services to Bt cotton growers across three States. Notably, the country has witnessed a shift in average national yield from less than 300 kg lint per hectare which lasted for decades to 500 kg lint per hectare within 10 years of the large scale adoption of Bt cotton hybrids. The survey reported almost doubling of cotton yield in Vidharbha area of Maharashtra from an average yield of 150 kg lint per hectare to more than 300 kg lint per hectare in 2011-12. The progressive farmers of Punjab, Maharashtra and Andhra Pradesh reported the maximum cotton yield of 14-15 quintals per hectare in rainfed condition and 25-28 quintals per hectare in irrigated conditions. Figure 8. Distribution of Cost of Cotton Cultivation Post Bt Cotton Era
Source: Adopted from Mayee and Choudhary, 2013
6. There is a noticeable decrease in chemical sprays to control insect pests in cotton field across the three States. Two important observations related to chemical sprays on Bt cotton include an average 82.8% reduction in insecticide sprays while imparting 99.3% control to American bollworms in the surveyed States. Farmers in Maharashtra reported 78% reduction in insecticide sprays, 82% in Andhra Pradesh and 98% in Punjab. In some cases, farmers reported increased use of chemical sprays to control sucking pests which ranges from 2-3 sprays
26
primarily in irrigated cotton areas of Punjab. The overall trend of insecticide usage to control bollworm decreased drastically from an annual insecticide usage of 9410 metric tons of active ingredient in 2001-02 to 222 metric tons of active ingredient in 2011 – a 40-fold decrease. Similarly, the Central Institute of Cotton Research (CICR) reported an annual saving of Rupees 651.3 crore on insecticides sprays to control cotton bollworm in 2011 alone. 7. Bt cotton reduced and changed the composition of the cost of cultivation of cotton across three States. In the post-Bt cotton period, the total cost of production was around Rs. 35,000 per hectare and the variation in inputs cost was observed marginal among states. On an average, Bt cotton farmers spent around 64% of total inputs cost on labor including farm operation, weeding and picking as shown in Figure 8. Fertilizers and irrigation accounted for 17% of total inputs costs followed by 12% on Bt cotton seeds and 7% on pesticides. The cost of pesticides which used to be the highest input cost prior to Bt cotton was reduced significantly and now ranges from 5.9% in rainfed area and 8.3% in irrigated area, which is reported to be the lowest of all input cost. The investment on Bt cotton seeds ranged from 10% in rainfed area to 15.2% in irrigated area due to variation in seed rates, gap filling and plant population.
8. Bt cotton farmers confirmed that more than 90% of farmers did not use non-Bt cotton packet
for refuge plantings across three States. It was shocking to note that most of the cotton farmers
either discarded non-Bt cotton packet or sold it at a cheap price to local retailers. The remaining
10% of farmers used non-Bt cotton refuge bag for gap filling and a very few percentage of them
actually planted refuge around Bt cotton field. The unwillingness of farmers to plant non-Bt
cotton refuge is a violation of the regulatory requirements of Bt cotton cultivation. It was
observed that farmers who received pigeonpea as refuge bag planted it along with Bt cotton
particularly in Maharashtra state. Many famers also complained about low quality of non-Bt
cotton refuge bag and didn’t use it fearing it would attract insect pests and would not produce
desirable cotton yield. It is important to note that refuge bag is supplied as a non-Bt counterpart
of 120gm packaged separately in the Bt cotton hybrid seed bag.
9. There was no reported visual presence of American bollworm in Bt cotton field since the
cultivation of Bt cotton in their respective fields. Farmers also reported that they staved off
insecticides sprays, which used to require about 15 sprays for the control of American bollworm.
Bt cotton continues to provide effective protection against targeted insect pests bollworm and
there was no field level resistance development of the insect pests to Bt cotton. The observations
on resistance management is in line with the reports of the Central Institute for Cotton Research
(CICR) that has been implementing one of the most comprehensive resistance management
program on Bt cotton in the world. Another finding of the survey is that majority of farmers
(77.8%) across three States were growing double gene Bt cotton, the more durable Bt cotton
hybrids providing effective protection to insect pests.
10. In spite of large numbers of Bt cotton hybrids approved between 2002 to 2012, cotton
farmers across three State reported that they were selective in cultivating a few popular Bt
cotton hybrids. There was area-wise dominance of a few common Bt cotton hybrids planted
across irrigated and rainfed conditions. Around 90% of the surveyed farmers were aware of
denomination of Bt cotton hybrid and shared information about the brand name and seed
company to which it belonged. The survey also showed a relatively quick turnabout of Bt cotton
27
hybrids driven by farmers’ preferences based on the quality and performance of Bt cotton
hybrids in the field. Punjab farmers showed a high degree of preference for new Bt cotton
hybrids belonging to different seed companies such as Rasi seeds, Vibha seeds, Nuziveedu seeds,
Bioseeds, Ankur seeds to Mahyco hybrid seeds. In addition, many farmers reported the
unavailability of the preferred Bt cotton hybrids and in some cases they had to compromise
planting of non-preferred Bt cotton hybrids in absence of pre-booked Bt hybrids with local
retailers.
11. Farmers reported a substantial increase in net income of Bt cotton farmers. However,
farmers noted an annual fluctuation in net income of Bt cotton due to volatile market cotton
prices, which fortunately remained above the Minimum Support Price (MSP) during the last
couple of years giving higher return to Bt cotton farmers. The overall economics of Bt cotton
cultivation was favorable to cotton farmers across three States. In 2011 Kharif season, the survey
reported an average net income of Rs. 41,837 per hectare at national level which was reported to
be highest in Punjab at Rs. 53,139 per hectare followed by Rs 39,786 in Andhra Pradesh and Rs.
32,885 per hectare in Maharashtra. Ironically, Maharashtra reported highest cost of cultivation
whereas the reported yield was highest in Punjab and Andhra Pradesh (Table 11).
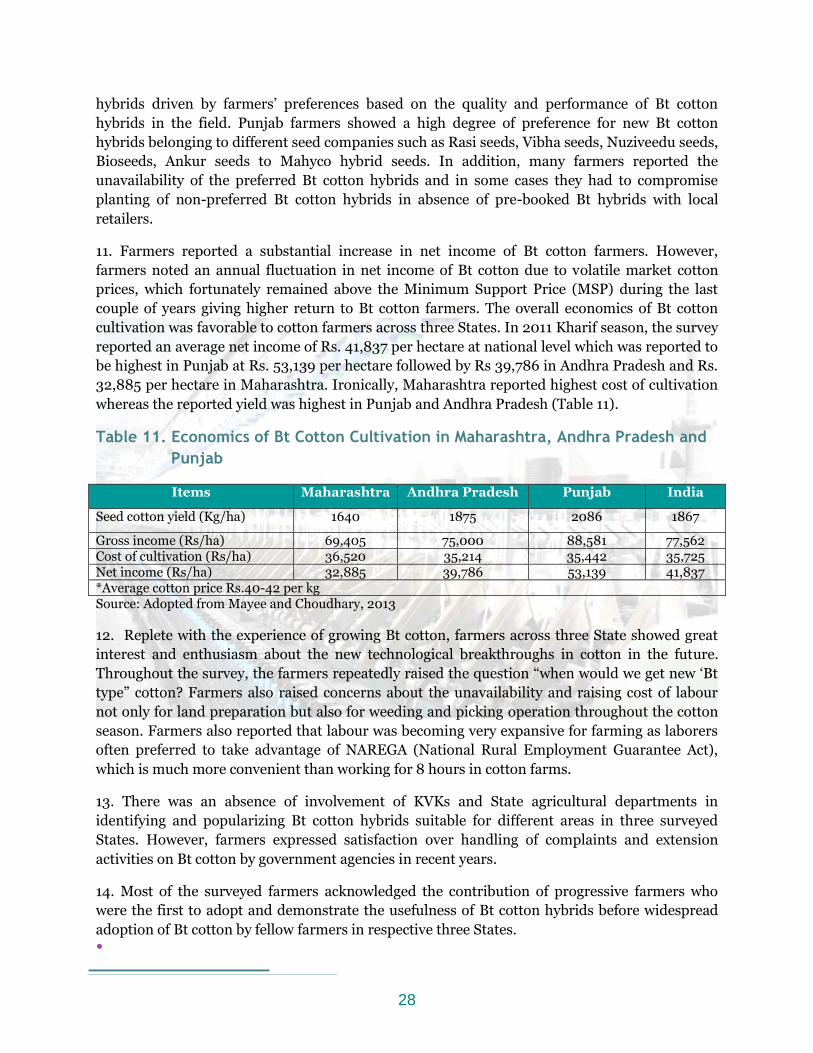
Table 11. Economics of Bt Cotton Cultivation in Maharashtra, Andhra Pradesh and
Punjab
Items Maharashtra Andhra Pradesh Punjab India
Seed cotton yield (Kg/ha) 1640 1875 2086 1867
Gross income (Rs/ha) 69,405 75,000 88,581 77,562 Cost of cultivation (Rs/ha) 36,520 35,214 35,442 35,725 Net income (Rs/ha) 32,885 39,786 53,139 41,837 *Average cotton price Rs.40-42 per kg Source: Adopted from Mayee and Choudhary, 2013
12. Replete with the experience of growing Bt cotton, farmers across three State showed great
interest and enthusiasm about the new technological breakthroughs in cotton in the future.
Throughout the survey, the farmers repeatedly raised the question “when would we get new ‘Bt
type” cotton? Farmers also raised concerns about the unavailability and raising cost of labour
not only for land preparation but also for weeding and picking operation throughout the cotton
season. Farmers also reported that labour was becoming very expansive for farming as laborers
often preferred to take advantage of NAREGA (National Rural Employment Guarantee Act),
which is much more convenient than working for 8 hours in cotton farms.
13. There was an absence of involvement of KVKs and State agricultural departments in
identifying and popularizing Bt cotton hybrids suitable for different areas in three surveyed
States. However, farmers expressed satisfaction over handling of complaints and extension
activities on Bt cotton by government agencies in recent years.
14. Most of the surveyed farmers acknowledged the contribution of progressive farmers who
were the first to adopt and demonstrate the usefulness of Bt cotton hybrids before widespread
adoption of Bt cotton by fellow farmers in respective three States.
28
15. Farmers also reported various communication and outreach activities on Bt cotton at village
level by multiple stakeholders including private seed companies, dealers and retailers, media
campaigns, advertisements, pamphlets distributions and pasting of stickers about different Bt
cotton hybrids across cotton villages.
16. Farmers and farm community were the key driving force behind the quick and large scale
adoption of Bt cotton across surveyed villages. The salient feature of the large scale adoption was
the two-way communication channel among farmers at multiple levels including family level,
friend’s level, choupal level, community level, village level and between fellow farmers across
different villages in the surveyed States.
17. There is a growing understanding and interest among farmers and farm community about Bt
cotton hybrids. Farmers acknowledged sharing of information about every aspect of cotton value
chain, suitability and unsuitability of Bt cotton hybrids, shared learning about new farm
practices and products in agriculture and most importantly access to the correct information
about market price resulting in higher income. Similarly, in recent years farmers showed keen
interest in different private companies selling Bt cotton hybrids and do keep track of new
offering from news reports, advertisements in news papers, posters at community centre and
local bazaar and often visited nearby KVKs to gain insight on new offering in agriculture.
18. Farmers across surveyed villages realized for the first time the true value of technology only
after they commenced plantings of Bt cotton and were convinced that technological
breakthroughs can improve agriculture at farm levels. Farmers voiced their support for “Bt type”
technologies in agriculture and believed that technologies will play a key role in farming in the
future.
19. Farmers reported high expectation in increase in cotton yield year-after-year after as they
realized a bountiful harvest due to Bt cotton hybrids over last couple of years. However, they
were concerned for not being able to increase cotton yield to a higher level due to lack of new
high yielding cotton hybrids.
Finally, farmers across three States echoed the same sentiments about welfare benefits of
growing Bt cotton in terms of spending less time in the field, more time for family and doing
other productive work, less exposure to pesticides & reaped more income and were no longer
worried about the possibilities of big losses of cotton by insect pests.
Recognizing the importance of knowledge sharing as a critical component of technology
adoption and dissemination in rural areas, the survey reinforced the age old practice of field
demonstration and an active role of risk taking farmers as a most effective tool of wider
dissemination of Bt cotton in the country. The survey’s key message that “Bt technology has
decreased pesticide usage, increased cotton productivity and increased farmer’s income and
contributed significantly to poverty alleviation” will be used to call on the governments in
developing countries to empower farmers with a knowledge centric campaign of “An Alert
Farmer is An Affluent Farmer”.
29
Major Policy Developments on GM Crops in India
Despite raging controversy by anti-biotech activists, there have been numerous initiatives to
strengthen the regulatory system and raise public and policy makers understanding about GM
crops in India. A summary of these initiatives are briefly described below;
• NAAS Public Understanding Committee on Science: The Indian National Academy of
Agricultural Sciences (NAAS) conveyed a roundtable meeting on “GM Crops for
Nutritional Security” under the chairmanship of Prof. M.S. Swaminathan on 12 February
2014 at the National Academy of Agricultural Sciences, New Delhi. NAAS unanimously
passed a resolution endorsing application of biotechnology in agriculture. NAAS’
resolution included the setting up two committees for the purpose of educating public
and politicians on “scientific facts” about GM crops. The resolution states that NAAS
may set up two committees on the pattern set up by the Royal Society of London
including first, the Committee on Public Understanding of Science and second, the
Committee on Political Understanding of Science.
The academy concurred that GM crop technology is a promising, relevant and efficient
technology for low-input high-output agriculture for crop improvement where
conventional breeding tools have not been effective. GM technology will be a tool to
improve agricultural crops for their nutritional value, nutrient and water use efficiency,
productivity, tolerance/resistance to biotic and abiotic stresses. The academy called on
the Government of India to lift de facto moratorium on the field trials of GM crops
(NAAS, 2014).
• MOST DBT Launches Biotech Strategy: The Department of Biotechnology of the
Ministry of Science and Technology has released the draft national biotechnology
development strategy, 2014, suggesting improvement in the existing regulatory system.
The “Biotech Strategy-II” pitches for a world class regulatory system which can build
confidence among the civil society, farmers, consumers and scientific community. The
Biotech Strategy-II has also outlined measures to achieve this vision and also details on
the establishment of Biotechnology Regulatory Authority of India (BRAI). In addition,
DBT’s revised strategy of ‘Vision 2020’ highlighted how GM crops would help achieve
“higher productivity and better quality food while reducing resource inputs” (DBT,
2014).
• Biotechnology Regulatory Authority of India (BRAI): The Department of Biotechnology
of the Ministry of Science and Technology has been attempting to set up the
independent, science-based and professionally-led biotechnology regulatory authority of
India. BRAI aims at creating a world class regulatory system that is science-based,
transparent, efficient and dedicated to the safety of consumers and environment. It is
expected that the establishment of BRAI would build confidence among the civil society,
farmers, consumers and the scientific community and a rigorous but transparent
regulatory system will also boost the confidence of the industry in investing in the
30
biotech sector. (DBT, 2014). The BRAI Bill was introduced by the Union Science and
Technology Minister in the Lok Sabha of the Parliament of India on April 22, 2013 in
order to establish BRAI to carry out the risk assessment of all biotech products and
supervise field trials of genetically modified crops. The BRAI Bill 2013 was lapsed in the
parliament in 2014 and needs to be reintroduced at the earliest to expedite setting up of
the independent biotech regulator in the country. BRAI shall consist of a 17-member
inter-ministerial governing board to oversee the authority’s performance and a
Biotechnology Regulatory Appellate Tribunal where BRAI decisions could be challenged.
However, the commercialization of biotechnology products in agriculture and healthcare
would be left to central and state Governments respectively (Biospectrum, 2014).
31
References
Biospectrum. 2014. BRAI bill crosses stage one, industry hopeful, 16 January, 2014 http://www.biospectrumindia.com/biospecindia/news/187506/brai-crosses-stage-industry-hopeful#sthash.qhoYIVdx.dpuf Blaize, D., et al., 2014. Introduction of Bt cotton hybrids in India: Did it change the agronomy?,
Indian Journal of Agronomy, 59 (1), pp. 1-20, March 2014
CAB, 2014. Minutes of the Second Meeting of Cotton Advisory Board, The Textile
Commissioner of India, Ministry of Textile, Govt of India, 2 July 2014, Mumbai, India
CAB. 2013. Minutes of the first meeting of the consultative committee of the Cotton
Advisory Board (CAB) held on 1 Nov 2013 for the cotton crop of 2013-14, The Office of the
Textile Commissioner, Ministry of Textile, Mumbai, India.
CIBRC, 2012. Central Insecticides Board and Registration Committee (CIBRC), Ministry of Agriculture, Government of India. http://cibrc.nic.in Choudhary, B., Nasiruddin K. M. and Gaur, K. 2014. The Status of Commercialized Bt Brinjal in
Bangladesh. ISAAA Brief No. 47. ISAAA: Ithaca, NY.
DBT. 2014. National Biotechnology Development Strategy. (Biotech Strategy II). Department of
Biotechnology, Ministry of Science and Technology, Government of India, March 2014, available
at http://dbtindia.nic.in/docs/NBDS_2014.pdf
Financial Express. 2014. It would be shameful if we let GM technology pass, Financial Express, 19 July, 2014 http://www.financialexpress.com/news/it-would-be-shameful-if-we-let-gm-technology-pass/1271366/0 Genetic Engineering Approval Committee (GEAC), 2009. Minutes of 97th Meeting, 14th Oct,
2009, Ministry of Environment and Forest (MoEF), http://www.envfor.nic.in/divisions/csurv/geac/decision-oct-97.pdf
IBN, 2014. Can't ignore science: Minister Prakash Javadekar on opposition to GM crops, IBN Live, 6 August 2014 http://ibnlive.in.com/news/cant-ignore-science-minister-prakash-javadekar-on-opposition-to-gm-crops/490579-37-64.html
ICAR. 2014. Speech by the President of India, Shri Pranab Mukherjee at Conference of VCs of
Agricultural Universities, ICAR, 19 January, 2014 http://www.icar.org.in/en/node/7237
ICAR. 2014a. 86th Foundation Day and ICAR Award Ceremony, ICAR, 29 July 2014 http://www.icar.org.in/en/node/7898 and http://www.narendramodi.in/pm-addresses-scientists-at-86th-icar-foundation-day/
32
Indian National Science Academy (INSA). 2010a. Inter Academy Report of GM Crops, Indian National Science Academy (INSA), Sept 2010. Indian National Science Academy (INSA). 2010b. Preparation of the report on GM crops under the auspices of academies –Preliminaries, Indian National Science Academy (INSA), Oct 2010, available at: http://insaindia.org/pdf/gmcrops.pdf Indian National Science Academy (INSA). 2010c, Inter-Academy Report on GM Crops –Updated, Indian National Science Academy (INSA), New Delhi, Dec 2010. James, C. 2013. Global Status of Commercialized Biotech/GM Crops: 2013. ISAAA Brief No. 46.
ISAAA: Ithaca, NY.
James, C. 2014. Global Status of Commercialized Biotech/GM Crops: 2014. ISAAA Brief No. 49.
ISAAA: Ithaca, NY.
Jha, G.K., et al., 2012. Edible Oilseeds Supply and Demand Scenario in India: Implications for
Policy, Indian Agricultural Research Institute (IARI), New Delhi, 2012
Kranthi, KR. 2012. Bt Cotton -Q&A, pp 64. Indian Society for Cotton Improvement (ISCI),
Mumbai, India.
Lok Sabha. 2014. Unstarred Question 3627, Answered on 5 August 2014. GM Crops. Ministry of
Agriculture, Government of India, Sixteenth Lok Sabha, 5 August 2014.
http://164.100.47.132/LssNew/psearch/QResult16.aspx?qref=3056
Mayee, C.D. and Choudhary, B., 2013. Adoption and Uptake Pathways of Bt Cotton in India,
Indian Society for Cotton Improvement (ISCI), Mumbai, India, Oct. 2013.
Ministry of Textile. 2013. The Cotton Trade (Development and Regulation) Bill, 2012, Ministry
of Textile, 2013.
Ministry of Environment and Forest (MoEF). 2010. Decision on commercialization of Bt brinjal, Minister’s report, Minister of State for Environment and Forest (MOEF), Government of India dated 9th Feb 2010 available at: http://moef.nic.in/downloads/public-information/minister_REPORT.pdf Ministry of Environment and Forest (MoEF). 2009. Press Statement by Mr. Jairam Ramesh,
Minister of State for Environment and Forest, Government of India dated 15th Oct 2009
available at: http://moef.nic.in/downloads/public-information/Press_Bt%20Brinjal.pdf
MOA, 2014, Edible Oil Profiles, Department of Agriculture and Cooperation, Ministry of
Agriculture, Govt of India, 9 Sept 2014
NAAS. 2014. GM Crops for Nutritional Security. National Academy of Agricultural Sciences, NAAS. Feb 12, 2014 http://naasindia.org/documents/GM%20Crop%20Round%20Table%20Resolution%20website.pdf
33
OECD/FAO, 2014. Cotton, OECD-FAO Agricultural Outlook 2014, 11 July 2014, available at
http://www.oecd-ilibrary.org/agriculture-and-food/oecd-fao-agricultural-outlook-2014/cotton_agr_outlook-2014-13-en PIB, 2014. Exports of Textiles, the Press Information Bureau, Ministry of Textile, Govt of India,
14 August 2014, available at: http://pib.nic.in/newsite/erelease.aspx?relid=108715
PIB. 2014a. Use of Bio-Technology in Agriculture can Yield Revolutionary Results – Agriculture
Minister. Press Information Bureau, Government of India, 25 August, 2014
http://pib.nic.in/newsite/PrintRelease.aspx?relid=109053 Press Information Bureau (PIB). 2013. Cotton Exports, Press Information Bureau, Govt of India. Available at: http://pib.nic.in/newsite/erelease.aspx?relid=89388 PIB, 2012. Meeting of Scientific Advisory Council of PM on Biotechnology and Agriculture, Press Information Bureau, Government of India, 9 October 2012 Reuters, 2014. India will oust China as top cotton producer this year – USDA, Reuters
News Service, 15 Sept 2014, available at: http://in.reuters.com/article/2014/09/11/cotton-
india-topspot-idINKBN0H62BW20140911
Reuters, 2014a. India's 2014/15 edible oil imports seen up on weak domestic output, Reuters News, 26 June 2014 Scidev. 2014. Q&A: Krishnaswamy VijayRaghavan on GM food crops, 11 June, 2014 http://www.scidev.net/south-asia/agriculture/feature/q-a-krishnaswamy-vijayraghavan-on-gm-food-crops.html
Sud, S., 2014. Foreign fears, India tears, Business Standard, 25 August 2014
The Hindu. 2014. Proper Caution needed for GM Crops. 6 August 2014 http://www.thehindu.com/news/national/proper-caution-needs-to-be-taken-for-gm-crops-javadekar/article6288295.ece USDA, 2014. Cotton: World Market and Trend, USDA FAS, September 2014, available at: http://apps.fas.usda.gov/psdonline/circulars/cotton.pdf
34