Embed Size (px)
Citation preview
I
Biosynthesis of metal/metal-oxide
nanoparticles and measurement of their
physical, biophysical properties
Umesh Kumar
UNDER THE GUIDANCE OF
Dr. Archana Pundle
BIOCHEMICAL SCIENCES DIVISION NATIONAL CHEMICAL LABORATORY
PUNE - 411008, INDIA
AND CO-GUIDANCE OF
Dr. Pankaj Poddar
PHYSICAL CHEMISTRY DIVISION NATIONAL CHEMICAL LABORATORY
PUNE - 411008, INDIA
February 2011

II
INDIA
Dr. Pankaj Poddar
(Research co-guide)
SCIENTIST
MATERIALS CHEMISTRY DIVISION
NATIONAL CHEMICAL LABORATORY
PUNE - 411008
Biosynthesis of metal/metal - oxide
nanoparticles and measurement of their
physical, biophysical properties
SUBMITTED TO THE
UNIVERSITY OF PUNE
FOR THE DEGREE OF
DOCTOR OF PHILOSOPHY
IN
BIOTECHNOLOGY
BY
Mr. Umesh Kumar
UNDER THE GUIDANCE OF
Dr. Archana Pundle
(Research guide)
SCIENTIST
BIOCHEMICAL SCIENCES DIVISION
NATIONAL CHEMICAL LABORATORY
PUNE - 411008

III
CERTIFICATE
Certified that the work incorporated in the thesis entitled: “Biosynthesis of
metal/metal-oxide nanoparticles and measurement of their physical, biophysical
properties”, submitted by Mr. Umesh Kumar, for the degree of Doctor of
Philosophy, was carried out by the candidate under my supervision at the Division of
Biochemical Sciences and Physical and Materials Chemistry Division, National
Chemical Laboratory, Pune. Materials acquired from other sources have been duly
acknowledged. To the best of my knowledge, the present work or any part thereof
has not been submitted to any other University for the award of any other degree or
diploma.
Date: Dr.(Mrs) Archana Pundle
Place: NCL, Pune (Research guide)

IV
CERTIFICATE
Certified that the work incorporated in the thesis entitled: “Biosynthesis of
metal/metal-oxide nanoparticles and measurement of their physical, biophysical
properties”, submitted by Mr. Umesh Kumar, for the degree of Doctor of
Philosophy, was carried out by the candidate under my supervision at the Division of
Biochemical Sciences and Physical and Materials Chemistry Division, National
Chemical Laboratory, Pune. Materials acquired from other sources have been duly
acknowledged. To the best of my knowledge, the present work or any part thereof
has not been submitted to any other University for the award of any other degree or
diploma.
Date: Dr. Pankaj Poddar
Place: NCL, Pune (Research Co-guide)

V
DECLARATION
I hereby declare that the work incorporated in this thesis entitled “Biosynthesis of
metal/metal-oxide nanoparticles and measurement of their physical, biophysical
properties” submitted for the degree of Doctor of Philosophy in Biotechnology has
been carried out by me at the Biochemical Sciences and the Materials Chemistry
Divisions of the National Chemical Laboratory, Pune, India under the joint
supervision of Dr. (Mrs.) Archana Pundle and Dr. Pankaj Poddar. Materials acquired
from other sources have been duly acknowledged in this thesis. The work is original
and has not been submitted in part or full by me for award of any other degree or
diploma in any other University.
Date: Umesh Kumar
Place: NCL, Pune (Research Student)
VI
Acknowledgement
It gives me a great pleasure to thank all those who were associated with me during
my Ph.D. at National Chemical Laboratory. The work described in this thesis would
not have been possible without these people because they were involved directly or
indirectly. Therefore I would like to extend my sincere thanks and gratitude towards
these people who were there with me during my tenure at National Chemical
Laboratory.
First and foremost among them is my research advisor and research co-guide Dr.
Pankaj Poddar whose constant support and guidance has been always precious to
make this thesis possible. His valuable suggestions and fruitful discussions made
significant contribution to make this thesis feasible. I am also thankful to him for
providing me an opportunity to get hands on exposure to hi-tech instruments like
Atomic Force microscopy, Ellipsometry, Dynamic light Scattering, Small angle X-
ray scattering etc. which has opened a new horizon to my future research.
I would also like to thank my research guide Dr. Archana Pundle, without her
support this thesis would not have completed. I am thankful for her regular guidance,
encouragement, cooperation and appreciation. I would like to thank her deep from
my heart for all the help and moral support that she has provided throughout,
especially in latter part of my research work.
I express my gratitude to Dr. Absar Ahmad for providing me accessibility to his lab
facilities even during odd hours as well as for our fruitful discussions. I thank Dr.
Asmita Prabhune for encouragement and support during my work. My sincere thanks
to Dr. B. L. V. Prasad and Prof. Satish Ogale for their continuous support, friendly
nature, elderly advice and scientific interactions.
I would also like to extend my sincere thanks to Mrs. Suguna Adhyanthaya for
helping me at NCL in all the official activities and for her elderly advice irrespective
of my work commitments, thinking about my betterment always. Her help in TGA and

VII
DSC measurements used in this thesis is gratefully acknowledged. I appreciate her
support in facilitating various materials characterization, going out of her way.
I would also like to mention about about Dr. (Mrs) Manjula Shelke madam who
helped me in environmental Scanning Electron Microscopy measurements when this
facility was newly established at NCL. I would also like to thanks A.B. Gaikwad Sir
for always opening his doors for Scanning electron Microscopy measurements
whenever I needed that.
My research work has involved a lot of collaborative work both within NCL and
outside. Among them, my sincere thanks goes to Dr. Anandwardhan A. Hardikar of
National cell centre for cell Sciences, Pune for all mammalian cell culture work and
cytoxicity related experiments. I would also like to mention without failure one of his
best senior student Mr. Amresh Ranjan who was always there irrespective of lab
timings, during these studies.
I also thank Dr. Atanu Basu, from the National institute of Virology, University of
Pune for being the member of the work evaluation committee.
I would also like to thank Dr. S. Sivram, Director, NCL and Dr. Sourav Pal, HOD,
Physical Chemistry Division, for allowing me to carry out research at this institute
and providing the required facilities. I am thankful to CSIR, Govt. of India, for the
research fellowship.
This acknowledgement would be incomplete without the special mention of my
former and current lab-mates for their help in the experiments and encouragement. I
would especially like to thank Dr. Ashwini for her help with bacterial isolation and
identification work. I extend my sincere appreciation to Dr. Hrushi, Dr. Ambrish, Dr.
Akhilesh, Dr. Amit, Dr. Atul, Dr. Vipul, Dr. Sourabh, Dr. Sanjay, Dr. Deepti,
Maggie, Manasi, Ajay, Sudarshan, Prathap, Priyanka, Sheetal, Dr. Vijay, Vilas,
Anal, Ravikumar, Anil, Imran, Ramya, Baisakhi, Adhish, Neeraj, Priya, Raja,
Vivekanand, Dr. Atul Feranzi, Ambresh, Reetika, Sridevi, Kasture, Jaysree and
Avinash for creating a cordial atmosphere and helping me.
I would also like to thank all M. Sc. students who had worked with me for their
project. I am also thankful to my NCL and Golden Jubilee hostel friends (Ajeet,

VIII
Jeetu, Kaushal, Jha, Prince, Chand, Maurya, K.P, Atul and Negi for their support
and cheerful discussions at dinner table in the mess hall.
I would especially like to thank my enthusiastic group members, both from NCL
(Priyanka, Maggi and Sanjay) and NCCS (Prayag et. al) with whom I use to break
free or share light moments either at badminton court or during trekking tour
whenever we get some time out of our busy schedule.
I would like to thanks Mr. Deepak, Mr. Punekar and Mr. Pardesi from the Physical
Chemical Division office for helping me extensively with the routine official and
administrative work. I would also like to thank NCL Library staff, administrative
staff, and technical staff at CMC for their assistance in the administrative issues
during this time.
This thesis would not have been possible without the strong faith, continious support
and encouragement of my family, because of all their efforts I am here. I wish to
express my deep gratitude to my parents for their support, trust, patience and
blessing that led me to successfully complete my doctoral research.
Umesh Kumar

IX
Table of Contents
Chapter 1: Introduction
1. Introduction to nano -regime and the science there exists 2
1.1 The “NANO”–“BIO” Interface 3
1.2 Nanobiotechnology 3
1.3 Nature: Motivation for nanomaterials synthesis 9
1.4 Biomineralization: A phenomena that existed in nature since ages 10
1.5 Biomimetic mineralization 13
1.6 Biomineralization in situ: nature’s Way 15
1.7 Strategies used to synthesize nanoparticles 15
1.7.1 Physical and chemical methods of nanoparticle synthesis 16
1.7.2 Biosynthesis of nanoparticles 16
1.7.2.1 Use of organisms to synthesize nanoparticles 17
1.8 Outline of the Thesis 20
1.9 References 22
Chapter 2: Extracellular microbial synthesis of Co3O4
nanoparticles by using marine bacterium Brevibacterium
casei
2.1 Introduction 32
2.2 Materials and methods 35
2.2.1 Isolation of the bacterial strains (Brevibacterium casei) from the
Arabian sea-coast 35
2.2.2 Biosynthesis of Co3O4 nanoparticles by using Brevibacterium casei 36
X
2.2.3 Morphological studies of Brevibacterium casei by SEM while
interacting with precursor salt to synthesize Co3O4 nanoparticles 37
2.2.4 Magnetic measurements 37
2.2.5 Protein profile studies 37
2.3 Material characterization 38
2.4 Results and Discussion 39
2.4.1 Transmission electron microscopic analysis 39
2.4.2 X-ray diffraction spectra analysis 40
2.4.3 HRTEM analysis 41
2.4.4 X-ray Photo-electron Spectroscopy (XPS) analysis 42
2.4.5 FTIR spectra and SDS-PAGE analysis 44
2.4.6 Bacterial morphological studies before and after exposure to precursor
salt (cobalt acetate) by SEM in real time 45
2.4.7 Magnetic property measurements of Co3O4 nanoparticles 47
2.5 Conclusion 48
2.6 References 48
Chapter 3: Measurement of biophysical properties of
bacterial cells under stress due to the exposure to Cobalt
acetate during microbial synthesis of Co3O4 nanoparticles
3.1 Introduction 52
3.2 Materials and methods 54
3.3 Results and discussion 57
3.3.1 Calculation of adhesive force and adhesion energy on microbial cell
surface 62
3.3.2 Calculation of Young,s modulus 65
3.4 Conclusion 67
3.5 References 68

XI
Chapter 4: Lysozyme mediated size controlled synthesis
of antimicrobial, biocompatible noble metal (Au and Ag)
nanoparticles
4.1 Introduction 73
4.2 Materials and methods 77
4.2.1 Materials 77
4.2.2. Experimental details 77
4.2.2.1 Nanoparticle synthesis procedure 77
4.2.2.2 Removal of silver chloride (AgCl) impurity from nanoparticles
solution 77
4.2.2.3 Modifications of lysozyme 77
4.2.2.4 Chemical modifications of tyrosine residues of lysozyme with N-
Acetylimidazole (NAI) 77
4.2.2.5 Chemical modifications of tryptohan residues of lysozyme with N-
Bromosuccinimide (NBS) 78
4.2.2.6 Cytotoxicity test i.e MTT (3,[4,5-dimethylthiazol-2-yl]-2,5-
diphenyltetrazolium bromide) assay 78
4.3. Characterization techniques 79
4.4 Results and discussion 80
4.4.1. Proposed mechanisms for nanoparticle synthesis 80
4.4.2. Identification of the key residues of lysozyme responsible for
nanoparticle synthesis 81
4.4.3. Size controlled synthesis of nanoparticles by chemical modification of
lysozyme with NAI and NBS. 85
4.4.4. Determining changes in the secondary/tertiary structure of lysozyme
present on nanoparticles surface 88
4.4.5. Determination of crystallinity, shape and size distribution of
nanoparticles 89
4.4.6. Identification of charge, stability and loading amount of lysozyme
present on nanoparticles surface 93
XII
4.4.7. Oxidation state determination of lysozyme capped nanoparticles
95
4.4.8. Determination of biofunctionality and biocompatibility of lysozyme
capped nanoparticles 96
4.4.9. Surface enhanced Raman spectroscopic studies for lysozyme capped
gold and silver nanoparticles 98
5.0. Conclusion 103
5.1 References 103
Chapter 5: Lysozyme mediated aqueous phase synthesis
of chromium (IV) oxide at ambient conditions
5.1 Inrtoduction 108
5.2 Materials and methods 110
5.3 Results and discussion 111
5.3.1 Synthesis of lysozyme capped chromium (IV) oxide nanoparticles 111
5.3.2 UV-visible absorption spectroscopy measurements 112
5.3.3 FTIR spectroscopy measurements 112
5.3.4 X-ray diffraction spectra analysis 113
5.3.5 X-ray Photo-electron Spectroscopy measurements 114
5.3.5 Thermal measurements 115
5.3.6 Differential scanning calorimetry (DSC) measurements 116
5.3.7 Transmission electron microscopic analysis 117
5.3.8 Magnetic measurements 118
5.4 Conclusion 119
5.5 References 119

XIII
Chapter 6: Conclusions
6.1 Summary of the work 123
6.2 Scope for future work 125
Annexure-1 Microbiological media and Phylogenetic tree
Annexure-2 Mammalian cell culture media
Annexure-3 List of Publications

CHAPTER-I INTRODUCTION

Chapter I
Ph.D Thesis Umesh Kumar University of Pune
Pag
e1
Introduction
(Images courtesy: Various sources at http://images.google.com)
This chapter deals with brief introduction to the big realm of nanobiotechnology and
the kind of work presented in this thesis which starts with the motivation for work,
followed by an overview of biomineralization processes occurring in nature. The
syntheses of various biomaterials in their natural habitats and their specific biological
role has been discussed. Various biological and biomimetic approaches currently in
use for the in silico synthesis of nanomaterials have also been emphasized. The
chapter also briefly describes the rationale behind the new biological methods that
we have used for the biosynthesis of metal/metal-oxide nanomaterials. Finally, an
outline of the chapter-wise work described in this thesis has been presented.

Chapter I
Ph.D Thesis Umesh Kumar University of Pune
Pag
e2
1. INTRODUCTION TO NANOREGIME AND THE
SCIENCE THERE EXISTS
Nanoscience is the study of phenomena and manipulation of materials at atomic,
molecular and macromolecular scales, where properties differ significantly from
their bulk counterparts. It deals with the study of the objects and systems in which at
least one dimension is less than 100 nm.
Similarly, nanotechnology can be defined as the design, characterization,
production and application of structures, devices and systems by controlling shape
and size at the nanometer scale. This technology uses science on the nanoscale,
occurring at the level of atoms and molecules. At this level, traditional boundaries
between biology, chemistry and physics get merged or indistinguishable. It is a
highly interdisciplinary area because it involves ideas integrated from many
traditional disciplines e.g. physics, chemistry, biology, engineering, medicine and
information technology etc. The primary concept was presented on December 29,
1959, when Richard Feynman presented a lecture entitled “There’s Plenty of Room
at the Bottom” at the annual meeting of the American Physical Society, the
California Institute of Technology.1
Figure 1.1: Schematic picture showing multidisciplinary nature of nanotechnology

Chapter I
Ph.D Thesis Umesh Kumar University of Pune
Pag
e3
1.1 THE “NANO”–“BIO” INTERFACE
Biosystems are governed by nanoscale processes and structures that have been
optimized over millions of years. Biologists have been operating for many years at
the molecular level, in the range of nanometers (DNA and proteins) to micrometers
(cells). A typical protein like haemoglobin has a diameter of about 5 nm, the DNA’s
double helix is about 2 nm wide, and a mitochondrion spans a few hundred
nanometers. Therefore, the study of any subcellular entity can be considered
“nanobiology.” Furthermore, the living cell along with its hundreds of nanomachines
is considered, today, to be the ultimate nanoscale fabrication system.
1.2 NANOBIOTECHNOLOGY
The groundwork of each and every biological system is nanosized molecular
building block and machinery that cooperates to produce living entities. These
elements have ignited the imagination of nanotechnologists for many years and it is
the combination of these two disciplines, nano and biotechnology, that has resulted
in the birth of the new science of nanobiotechnology. Nanotechnology provides the
tools and technology platform for transformation and investigation of biological
systems, and biology offers inspirational models and bio-assembled components to
nanotechnology.
There are two basic fabrication approaches for creating nanostructures:
bottom-up and top-down. The bottom-up approach exploits biological structures and
processes to create novel functional materials, biosensors, and bioelectronics for
different applications. This field encompasses many disciplines, including material
science, organic chemistry, chemical engineering, biochemistry, and molecular
biology.
In the top-down approach, nanobiotechnology applies tools and processes of
nano/microfabrication to build nanostructures and nanodevices. The tools that are
used often involve optical and electron beam lithography and the processing of large
materials into fine structures with defined surface features. One of the major
differences in approach used for nanoparticles synthesis in nanotechnology and
nanobiotechnology is that, in the former, the dominant approach is top-down,
whereas in the latter, it is bottom-up. An example of the bottom-up approach is the
pioneering work of two leading groups on biomolecular motor proteins.2-7
In these

Chapter I
Ph.D Thesis Umesh Kumar University of Pune
Pag
e4
studies, naturally occurring motor proteins were engineered for compatibility with
artificial interfaces to create new ways of joining proteins to synthetic nanomaterials.
Unlike nonbiological systems that are fabricated top-down, the biological systems
build up from the molecular level (bottom-up).
Figure 1.2: Schematic showing two basic approaches for nanoparticles synthesis
It is done this via collection of molecular tool kits of atomic resolution that are used
to fabricate micro and macrostructure architectures. Biological nanotechnology, or
nanobiotechnology can be viewed in many ways: one way is the incorporation of
nanoscale machines into biological organisms for the ultimate purpose of improving
the organism’s quality of life. Another way is the use of biological “tool kits” to
construct nano- to microstructures. However the broad perspective is probably the
Chapter I
Ph.D Thesis Umesh Kumar University of Pune
Pag
e5
one that will include both and will be defined as: the engineering, construction,
and manipulation of entities in the 1 to 100 nm range using biologically based
approaches or for the benefit of biological systems. The biological approaches can
be either an inspired way of mimicking biological structures or the actual use of
biological building blocks and building tools to assemble nanostructures. Our main
emphasis will be on the different biological approaches to synthesize metal/metal
oxide nanoparticles and their property measurements which will be discussed
throughout this chapter.
Typical examples of bottom–up synthesis of nanomaterials can be observed
in Nature, which have been discussed in the later part of this chapter. During efforts
towards creation of miniaturized materials, it has been realized that materials in
nano–dimensions usually exhibit properties that are very different from their bulk
counterparts. Increasing knowledge about the unique properties of nanoparticles has
led to renewed interest in their potential applications. Nanoparticles have been
around for a long time; presumably the first nanoparticle was recognized in 1570
with aurum potable (potable gold) and luna potable (potable silver) which alchemists
used as elixirs.8-11
One of the oldest applications of nanoparticles that we come
across in literature is the use of gold nanoparticles for staining glasses; a famous
example is the Lycurgus cup that dates back to 4th century AD.12-14
Nowadays it is
becoming more and more evident in the form of potential applications of
nanoparticles, which extend to wide-ranging areas such as catalysis15,16
, biosensors17-
20, diagnostics
21, cell labelling
22-24, solar cells
25,26, fuel cells
27, photonic band gap
materials28
, single electron transistors29,30
, non-linear optical devices2,31-33
,
information storage34
, refrigeration35
,chemical/optical computers36
, harder metals37
,
surface enhanced Raman spectroscopy38
, self cleaning paints39
, environmental clean
up40-46
, and improved national security 47,48
to name a few and the list goes on.39
The
realization of their various potential applications is only limited by our
imagination.49-54
A remarkable aspect of nanomaterials is that a number of factors
can influence their physical, chemical, optical, electronic and magnetic properties.
The factors that can strongly modulate their properties include their size55-60
, shape61-
63, surface composition
64-67, dielectric environment
68-71 and the interparticle
interactions.72-76
Such remarkable variations in properties of nanomaterials are due to
their dimensions being comparable to the de Broglie wavelength of the charge
carriers, which modify their properties significantly.77,78
One of the readily

Chapter I
Ph.D Thesis Umesh Kumar University of Pune
Pag
e6
perceptible properties in case of metal nanoparticles is their colour. The colour of
metal nanoparticles originates due to surface plasmons i.e. the coherent charge
density oscillations.79
Surface plasmon is a special phenomenon, which is observed
in metal nanoparticles at nanoscale. It is a dimension below 100 nm, where
properties such as melting point, colour (i.e. band gap and wavelength of optical
transitions), ionisation potential, hardness, catalytic activity and selectivity, or
magnetic properties such as coercivity, permeability and saturation magnetisation,
which we are used to thinking of as constant, vary with size. We basically distinguish
two types of variations as a function of size:
Scalable effects: Energy levels or properties of surface atoms are different
from bulk atoms. As the particle size increases, the surface-to-volume ratio decreases
which is inversely proportional to the particle size. Thus, all properties which depend
on the surface to-volume ratio keep changing and extrapolate slowly to bulk values.
Quantum effects: When the molecular electronic wave function is delocalised
over the entire particle then a small, molecule-like cluster has discrete energy levels
so that it may be regarded like an atom (sometimes called a super atom). The
simplest model for it is that of a particle in a box. Adding more atoms to the cluster
changes the size of the box continuously so that the energy levels close up to some
extent. More importantly, adding more atoms means adding more valence electrons
to the system. Thus whenever a shell of sometimes multiple degenerate energy levels
is filled the next electron has to be accommodated in the next shell of higher energy.
The situation is analogous to the evolution of properties with increasing atomic
number in the periodic table. Filled shells represent a particularly stable
configuration. Properties such as ionisation potential and electron affinity are well
known to display a discontinuous behaviour as one moves along the periodic table.
For clusters consisting of atoms with strongly overlapping atomic orbitals, i.e. for
metals and semiconductors the situation is analogous. As a consequence, the
developments which were initially concerned with metal nanoparticles led to the
realization that essentially all solid materials in nanoscale would be of interest.
The science of ceramic/oxide nanoparticles is no exception and this area of
nanoscience is exciting due to the fact that many of the ceramic systems of interest
have been studied extensively in the bulk form and therefore provide ready
comparisons with nanoparticulate systems.80
A beneficial consequence of the
reduced size of oxide nanoparticles, and for that matter for all the nanoparticle
Chapter I
Ph.D Thesis Umesh Kumar University of Pune
Pag
e7
systems, is the large increase in the surface to volume ratio of the nanomaterials in
comparison with their bulk counterparts. Because of the huge number of atoms at the
surface and their limited availability within the lattice, the chemistry of oxide
nanoparticles is greatly affected by the defect sites present both within the lattice
(point defects) as well as on the surface (planar defects). Point defects arise either
due to the absence of the constituent atoms/ions on the lattice sites or their presence
in interstitial positions. Even the presence of foreign atoms/ions in the lattice causes
point defects. These point defects result in the displacement of neighbouring
atoms/ions because of the polarization in surrounding region, and hence modify the
crystal lattice. However, since the creation of point defects is generally an
endothermic process, the intrinsic defect concentration in binary oxides is extremely
low (~ 10–5 at around 0.8 Tm). On the other hand, the surface of oxide nanocrystals
constitutes considerable amount of planar two dimensional defects in the form of
grain boundaries, stacking faults and crystallographic shear planes. These extrinsic
defects lead to tilt boundaries (array of period space or edge dislocations), twist
boundaries (array of screw dislocations), twin boundaries (a layer with mirror plane
symmetry with respect to the rotation of one part of the crystal, on a specific plane,
with respect to another) and/or antiphase boundaries (across which the sublattice
occupation becomes interchanged) in nanooxides. The highly ionic nature of some
materials, especially Co3O4, CrO2, TiO2, ZrO2, MgO and Al2O3, further promote the
formation of many stable defect sites, including edges, corners, and anion/cation
vacancies. Different morphologies of oxide nanomaterials may also alter their
surface chemistry and adsorption characteristics, hence imparting important
properties.46
However, an intricate yet fascinating consequence of the size and defect
dependent applicability of nanomaterials is that the properties of nanocrystals
obtained by various routes cannot be generalized, since various synthesis routes may
lead to altering defect conditions in these nanocrystals. The display of unique
properties by the nanoparticles that can be controlled by many external and internal
factors and the scope for diverse applications makes the synthesis of such
nanomaterials extremely important and therefore a number of routes for synthesis of
nanomaterials being evolved (Figure 1.3). So far synthesis of inorganic

Chapter I
Ph.D Thesis Umesh Kumar University of Pune
Pag
e8
Figure 1.3: Schematic presentation showing different routes for nanoparticle synthesis
nanomaterials has been demonstrated mainly by physical and chemical means.
Various physical routes leading to successful synthesis of nanophase materials,
especially oxide powders are vapour condensation techniques81-88
, spray pyrolysis89-
94, thermochemical decomposition of metal–organic precursors in flame reactors
95-98
and other aerosol processes which are named after the energy sources applied to
provide the high temperatures during gas–particle conversion. The Liquid phase
chemical methods for the synthesis of inorganic nanoparticles including metal oxides
have received wider acceptance than physical methods and are the most commonly
followed route. This increasing interest in chemical processing of nanoscale particles
of metal oxides and other materials is clearly indicated by the number of reports and
reviews on this subject.99-108
Chemically, inorganic nanoparticles can be synthesized
by reduction or oxidation of metal ions or by precipitation of the necessary precursor
ions in solution phase. The control on size, shape, stability and the assembly of
nanoparticles is achieved by incorporating different capping agents, solvents and
templates. Capping agents that have been used, range from simple ions to polymeric
molecules and even biomolecules.109-114
As a solvent, though water is largely used,
Chapter I
Ph.D Thesis Umesh Kumar University of Pune
Pag
e9
the use of organic solvents,115,116
ionic liquids117
and supercritical fluids118,119
has also
been demonstrated. Similarly many soft and rigid templates such as micelles,120-122
polymeric molecules,123,124
DNA,125,126
Tobacco Mosaic Virus,127-129
mesoporous
materials and many more including preformed nanoparticles130
have been employed
to get control over the formation and assembly of nanoparticles. Evidently,
nanoparticle synthesis has gained due focus and the scope for new synthesis methods
has been increasing constantly with innovative contributions. Though the chemical
and physical routes of nanomaterials synthesis have principally dominated the
nanosphere, recently there is a growing attention towards the use of advantageous
biological means for nanoparticle synthesis. The following sections of this chapter
focus on biological routes to nanomaterials synthesis with brief introductions to:
1) Rationale behind thesis work
2) Biomineralization in natural environment
3) Biomimetic approaches for mimicking natural biomineralization
4) Imitating Nature’s way of biomineralization in situ
1.3 Nature: Motivation for Nanomaterials Synthesis
The morphological diversity and complexity of naturally occurring forms and
patterns has been the motivation for human to copy Nature and to adapt the ideas
from Nature to achieve functional, aesthetic, and societal value.131
Magnetotactic
bacteria, for example, are able to form nanometre-sized, membrane-bound magnetic
iron minerals, magnetite (Fe3O4) or greigite (Fe3S4), with narrow size distributions
and high magnetic moments. However in vivo this synthesis is typically limited to
certain materials which includes magnetite, silica, or calcium carbonate.
These materials combine complex morphology over several hierarchy levels with
superior material properties and environment friendly synthesis and biocompatibility.
This makes them very attractive archetypes for materials chemists. To mimic the
synthesis of these material the goal is not to simply emulate a particular biological
architecture or system, but to abstract the guiding principles and ideas and use such
knowledge for the preparation of new synthetic materials.132

Chapter I
Ph.D Thesis Umesh Kumar University of Pune
Pag
e10
1.4 Biomineralization: A Phenomena that Existed in
Nature since Ages
The course of evolution on our planet has resulted in the appearance, diversification,
and proliferation of organisms capable of producing complex structures from hard
inorganic materials, via processes collectively known as biomineralization.133-136
For
example, magnetotactic bacteria produce nanoparticles of Fe3O4 or Fe3S4 that have
well-defined sizes and shapes that enable these microorganisms to utilize magnetic
fields for alignment and migration.134,135,137,138
Fish grow structures, known as
otoliths or “ear stones”, within the inner ear that assist in inertial sensing.135,139
These
otoliths are composed of the aragonite polymorph of calcium carbonate.135,139
Remarkably the mollusks produce shells that contain a distinct crystalline form of
calcium carbonate such as aragonite, or may contain segregated layers of calcite and
aragonite.133,140
In addition to the crystalline forms of calcium carbonate, an
amorphous phase of this mineral is synthesized by sea urchins to produce spines
(spicules).141
Marine sponges produce silica spicules that have been demonstrated to
possess light-guiding characteristics and may reach lengths up to 3 m.135,142-146
The
diatoms, a type of unicellular eukaryotic algae, produce intricately detailed silica cell
walls, known as frustules, that are organized over multiple length scales.134,135,147
In
each of the examples listed above, specialized biomolecules have been found, or are
thought, to play a major role in directing the formation of these often complex
inorganic structures.134,135
Biominerals are most often considered in either their more traditional roles as critical
structural components of organisms (e.g., teeth, the siliceous shell of diatoms) and
important ion reservoirs for cellular function (Ca2+
and bone) or in their highly
evolved functional roles (e.g., magnetotactic sensing, buoyancy/balance regulation).
Increasingly, it is becoming apparent that biominerals also play an important
protective role by acting as critical detoxification sinks within certain organisms.
Thus, organisms ranging from protozoa to eukaryotes utilize the same principles of
biomineralization (cellular processing, supramolecular organization, and interfacial
recognition) to form such materials as Abalone nacre to efficiently remove
potentially toxic species from their immediate environment. Thus the understanding
how biological systems exert their nanoscale control over structural biominerals has
revealed important biomimetic routes to novel materials synthesis.

Chapter I
Ph.D Thesis Umesh Kumar University of Pune
Pag
e11
A variety of minerals are synthesized in Nature and they can be traced to various
groups of organisms including plants, animals and microorganisms (Table 1.1). The
component that perhaps distinguishes natural materials from synthetic materials is
the presence of biomacromolecules as an intimate mix with the mineral phases at all
the different hierarchical levels, starting at the nanometer scale. It was recognized
that many of these macromolecules have a common chemical attribute that they are
rich in carboxyl groups.148,149
These may be the constituents of protein and/or
polysaccharide moieties. Many of these macromolecules also possess phosphate
and/or sulfate groups in addition to the carboxyl groups. The presence of all these
charged groups makes these macromolecules excellent candidates for interacting
with the mineral ions in solution or with the surfaces of the solid phase.148,149
Table 1.1 Various biominerals and their roles in biological systems150-155
Biogenic
minerals
Biological
system
Biological
location
Biological
function
Calcium
carbonate
(calcite,
vaterite,
aragonite)
Plants, aves,
mammals,
many marine
organisms,
coccoliths
Mollusk shell,
eye lens, crab
cuticle, egg
shells, leaves,
inner ear
Exoskeleton,
optical,
mechanical
strength,
protection, gravity
receptor, buoyancy
device, calcium
storage [156-160]
Calcium
phosphate
(hydroxyapatite,
dahllite,
octacalcium
phosphate)
Mammals, fish,
bivalves
Bone, teeth,
scales, gills,
gizzard plates,
Mitochondria
Endoskeleton, ion
store,
cutting/grinding,
protection

Chapter I
Ph.D Thesis Umesh Kumar University of Pune
Pag
e12
Iron oxides
(magnetite,
greigite,
goethite,
lepidocrocite,
ferrihydrite)
Bacteria, algae,
dinoflagellates,
chitons, trouts,
euglena, human
brain, salmons
Intracellular,
teeth, head,
filaments, ferritin
protein
Magnetotaxis,
magnetic
orientation,
mechanical
strength, iron
storage
[160-172]
Sulfates
(gypsum,
celestite, barite)
Jellyfish,
acantharia,
loxodes, chara,
photosynthetic
bacteria
Statoconia,
cellular,
intracellular,
tatoliths
Gravity receptor,
skeleton, gravity
device/receptor
[173]
Silicon oxides
(amorphous
silica)
Diatoms,
radiolarians,
sponges, plants,
microbes, etc.
Cell wall,
cellular, leaves
Exoskeleton,
protection,
Mechanical
support, plant
nutrient, resistance
against pests and
predators [174]
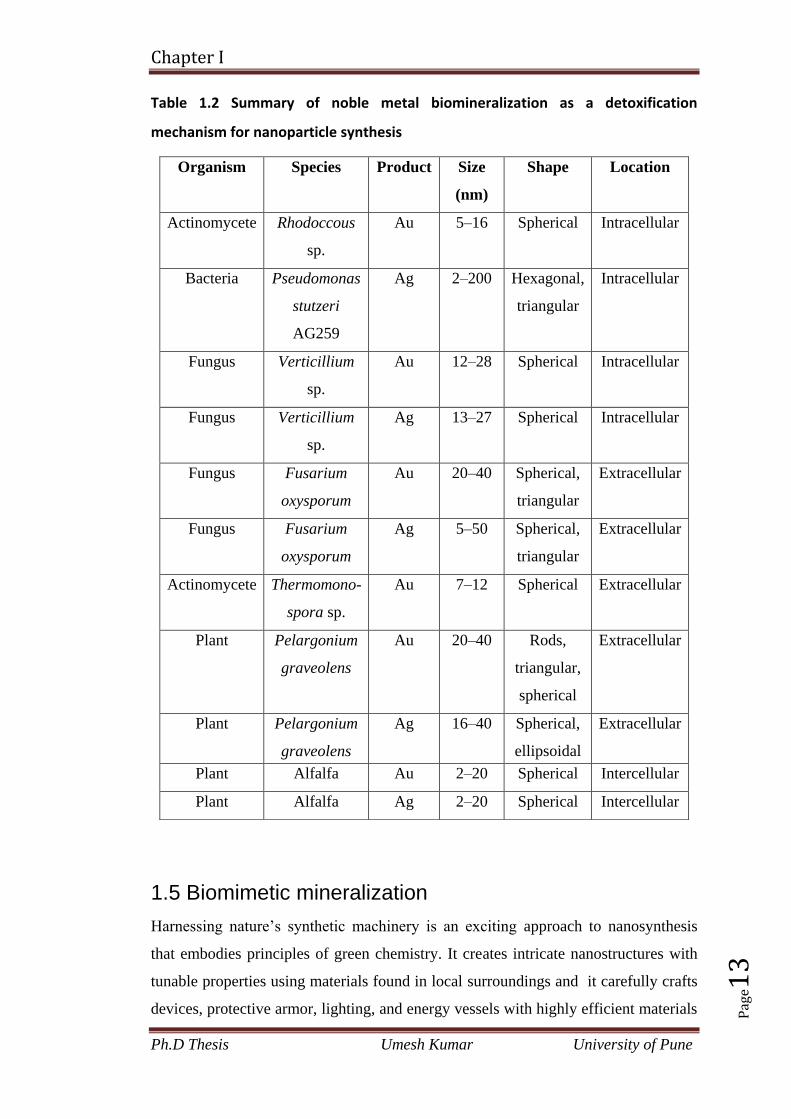
The biological systems have been using biomineralization (Table 1.2) as a type of
detoxification mechanism for noble metals for over 2.8 billion years175
, as witnessed
by placer gold deposits around the world. Noble metals such as silver and gold are
naturally found in sea water, soil, and rocks in nanogram to microgram levels. While
silver and gold are not the most reactive metals on the periodic table, they are able to
act as electron sinks disrupting vital respiratory enzymes and electron transport
within organisms. Silver can also block the permeability of the outer membrane,
inhibiting growth.176,177
As a result, trace amounts of these metals can have
detrimental effects on an organisms. Biomineralization detoxification of silver and
gold metal ions can be accomplished by way of three different modes: intracellular,
extracellular, and intercellular.
Chapter I
Ph.D Thesis Umesh Kumar University of Pune
Pag
e13
Table 1.2 Summary of noble metal biomineralization as a detoxification
mechanism for nanoparticle synthesis
1.5 Biomimetic mineralization
Harnessing nature’s synthetic machinery is an exciting approach to nanosynthesis
that embodies principles of green chemistry. It creates intricate nanostructures with
tunable properties using materials found in local surroundings and it carefully crafts
devices, protective armor, lighting, and energy vessels with highly efficient materials
Organism Species Product Size
(nm)
Shape Location
Actinomycete Rhodoccous
sp.
Au 5–16 Spherical Intracellular
Bacteria
Pseudomonas
stutzeri
AG259
Ag
2–200 Hexagonal,
triangular
Intracellular
Fungus Verticillium
sp.
Au 12–28 Spherical Intracellular
Fungus Verticillium
sp.
Ag 13–27 Spherical Intracellular
Fungus Fusarium
oxysporum
Au 20–40 Spherical,
triangular
Extracellular
Fungus Fusarium
oxysporum
Ag 5–50 Spherical,
triangular
Extracellular
Actinomycete
Thermomono-
spora sp.
Au 7–12 Spherical Extracellular
Plant
Pelargonium
graveolens
Au
20–40
Rods,
triangular,
spherical
Extracellular
Plant
Pelargonium
graveolens
Ag
16–40
Spherical,
ellipsoidal
Extracellular
Plant Alfalfa Au 2–20 Spherical Intercellular
Plant Alfalfa Ag 2–20 Spherical Intercellular

Chapter I
Ph.D Thesis Umesh Kumar University of Pune
Pag
e14
use. Materials scientists, engineers, physicists, and chemists have turned to nature to
understand the mechanisms and to develop clean, green nanomaterials through
biomimetic and biosynthetic approaches. One of the key tenets of biology is the
ability of biomolecules to self assemble into supramolecular structures. This intrinsic
ability has piqued the interest of scientists and engineers to develop a bottom-up
approach to nanofabrication. Biological self assembly occurs at the molecular scale
and is often reversible, self-correcting, and self-healing. The shape and size of self
assembled structures are intricately controlled on the nanoscale. Thus, understanding
these mechanisms can open doors for development of a wide variety of new
materials from self-healing fibres for wound repair to faster, smaller computer
devices. Understanding how biology self-assembles structures can also lead to
synthetic methods for creating supramolecular structures, using nature’s blueprints to
create synthetic nanomaterials.
Some organisms have the capability to take up minerals from their
surrounding environment and create intricate inorganic-organic hybrid structures that
possess remarkable nanoscale properties. Bone, teeth, and seashells are just a few
examples that utilize calcium carbonate to make hard composites. Some unicellular
organisms make exoskeletons: coccolithophores create exoskeletons using calcium
carbonate much like seashells, and diatoms produce shells from amorphous silica.
Calcium carbonate producing animals are under intense investigation in the hopes of
producing artificial bone or dental composites.
Several methods exist for controlling the size and shape of nanoparticles. For
example, nature creates nanoparticles of very defined shapes and sizes using genetic
control. We can exploit similar biomechanisms to create nanoparticles using
biological molecules or organisms as precursors or seeds for growth. To date, whole
organism systems have been used to produce metallic nanoparticles, although some
limited studies have begun to explore fabrication of Ge178
in bioreactors or Ti from
purified biological macromolecules.179
Nevertheless, attempts have been made to
ascertain which organic components of microorganism are responsible for directing
crystal growth. Proteins, polysaccharides, lipids, peptides, and amino acids are
among the most studied organic biomolecules responsible for directing crystal
growth and can be considered capping agents in production of nanocrystals. Proteins
and polysaccharides have been partially purified from the marine organisms that
direct calcium carbonate crystallization in the production of exoskeletons. 180,181

Chapter I
Ph.D Thesis Umesh Kumar University of Pune
Pag
e15
Proteins responsible for silica deposition in diatoms182
and sponge spicules183
have
been well characterized, and in many cases recombinant proteins have been
produced. These biological macromolecules are under genetic control and can
potentially be used to fabricate novel nanostructures.
1.6 Biomineralization in situ: Nature’s Way
The interest in inorganic nanoparticles is growing tremendously as they provide
superior material properties with functional versatility. Due to their size features and
advantages over available chemical imaging drugs and drug agents, the inorganic
nanoparticles have been considered as potential tools for medical imaging as well as
for treating diseases. Inorganic nanomaterials have been widely used for cellular
delivery due to their versatile features like wide availability, rich functionality, good
biocompatibility, capability of targeted drug delivery and controlled release of
drugs.184
For example mesoporous silica when combined with molecular machines
prove to be excellent imaging and drug releasing systems. Gold nanoparticles have
been used extensively in imaging, as drug carriers and in thermo therapy of
biological targets185
. Inorganic nanoparticles (such as metallic and semiconductor
nanoparticles) exhibit intrinsic optical properties which may enhance the
transparency of polymer- particle composites. For such reasons, inorganic
nanoparticles have found special interest in studies devoted to optical properties in
composites. For instance, size dependant colour of gold nanoparticles has been used
to colour glass for centuries.186
1.7 Strategies used to synthesize nanoparticles
Traditionally nanoparticles were produced only by physical and chemical methods.
Some of the commonly used physical and chemical methods are ion sputtering,
solvothermal synthesis, reduction and sol gel technique. Basically there are two
approaches for nanoparticle synthesis namely the Bottom up approach and the Top
down approach. In the Top down approach, scientists try to formulate nanoparticles
using larger ones to direct their assembly. The Bottom up approach is a process that
builds towards larger more complex systems by starting at the molecular level and
maintaining precise control of molecular structure.

Chapter I
Ph.D Thesis Umesh Kumar University of Pune
Pag
e16
1.7.1 Physical and chemical methods of nanoparticle
synthesis
Some of the commonly used physical and chemical methods include:
a) Sol-gel technique, which is a wet chemical technique used for the fabrication of
metal oxides from a chemical solution which acts as a precursor for integrated
network (gel) of discrete particles or polymers. The precursor sol can be either
deposited on the substrate to form a film, cast into a suitable container with desired
shape or used to synthesize powders.
b) Solvothermal synthesis, which is a versatile low temperature route in which polar
solvents under pressure and at temperatures above their boiling points are used.
Under solvothermal conditions, the solubility of reactants increases significantly,
enabling reaction to take place at lower temperature.
c) Chemical reduction, which is the reduction of an ionic salt in an appropriate
medium in the presence of surfactant using reducing agents. Some of the commonly
used reducing agents are sodium borohydride, hydrazine hydrate and sodium citrate.
d) Laser ablation, which is the process of removing material from a solid surface by
irradiating with a laser beam. At low laser flux, the material is heated by absorbed
laser energy and evaporates or sublimates. At higher flux, the material is converted to
plasma. The depth over which laser energy is absorbed and the amount of material
removed by single laser pulse depends on the material’s optical properties and the
laser wavelength. Carbon nanotubes can be produced by this method.
e) Inert gas condensation, where different metals are evaporated in separate crucibles
inside an ultra high vacuum chamber filled with helium or argon gas at typical
pressure of few hundred pascals. As a result of inter atomic collisions with gas atoms
in chamber, the evaporated metal atoms lose their kinetic energy and condense in the
form of small crystals which accumulate on liquid nitrogen filled cold finger. E.g.
gold nanoparticles have been synthesized from gold wires.
1.7.2 Biosynthesis of nanoparticles
The need for biosynthesis of nanoparticles arose as the physical and chemical
processes were costly. So in the search of for cheaper pathways for nanoparticle
synthesis, scientists used microorganisms and then plant extracts for synthesis.
Nature has devised various processes for the synthesis of nano- and micro scaled

Chapter I
Ph.D Thesis Umesh Kumar University of Pune
Pag
e17
inorganic materials which have contributed to the development of relatively new and
largely unexplored area of research
based on the biosynthesis of nanomaterials.187
Biosynthesis of nanoparticles is a kind of bottom up approach where the main
reaction occurring is reduction/oxidation. The microbial enzymes or the plant
phytochemicals with anti oxidant or reducing properties are usually responsible for
reduction of metal compounds into their respective nanoparticles.
In the preparation of nanoparticles, three main steps to be evaluated from a green
chemistry perspective are, the choice of the solvent medium, the choice of an
environmentally benign reducing agent and the choice of a non toxic material for the
stabilization of the nanoparticles. Most of the synthetic methods reported to date rely
heavily on organic solvents due to the hydrophobicity of the capping agents used.188
Synthesis using microorganisms is in agreement with the green chemistry principles
as
(i) microorganism (ii) the reducing agent and (iii) the capping agent employed in
the reaction are eco-friendly.189
Often chemical synthesis methods lead to the presence of some toxic chemical
species adsorbed on the surface of nanoparticles that may have adverse effects in
medical applications190
. This possibility when it comes to biosynthesized
nanoparticles as they are eco friendly and biocompatible for pharmaceutical
applications.
1.7.2.1 Use of organisms to synthesize nanoparticles
Biomimetics refers to applying biological principles for materials formation. One of
the primary processes in biomimetics involves bioreduction. Initially bacteria were
used to synthesize nanoparticles and this was later succeeded with the use of fungi,
actinomycetes and plants.

Chapter I
Ph.D Thesis Umesh Kumar University of Pune
Pag
e18
Figure 1.4: Schematic diagram showing different steps involved in biosynthesis of nanoparticles and their characterization
Here we have tried to list the names of nanomaterials synthesized by biosynthetic
route using either whole organism or extracts (plants).
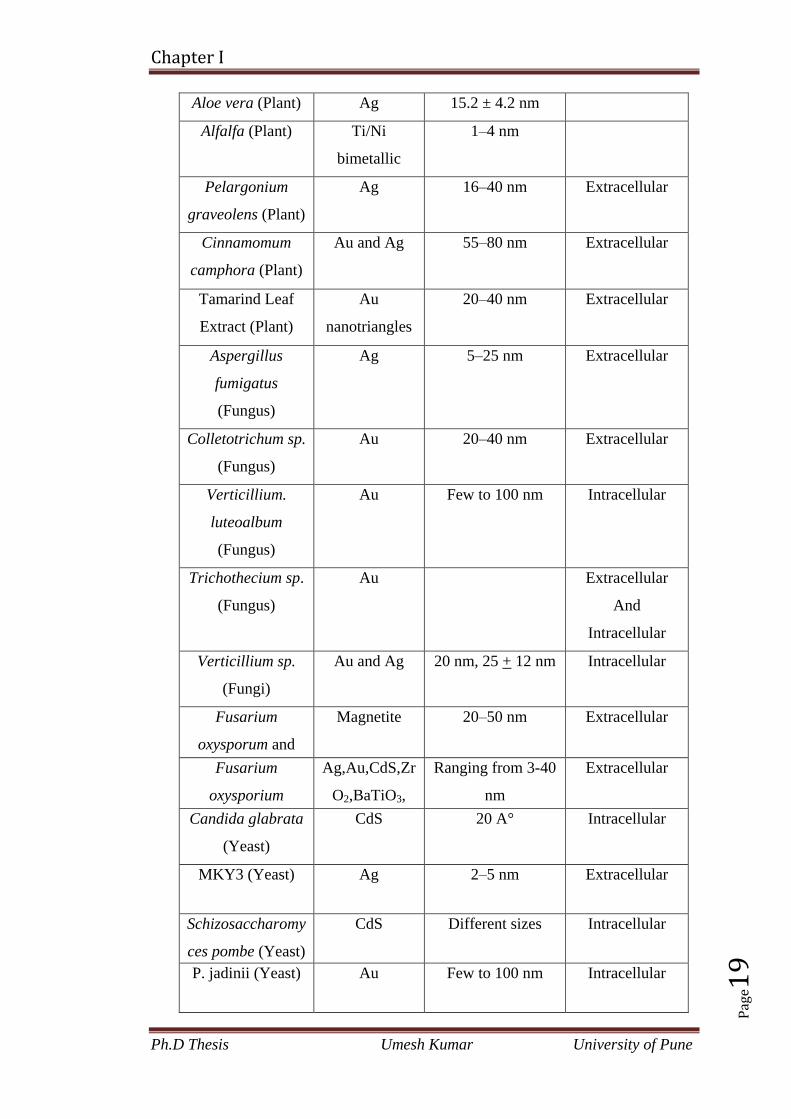
Table 1.3 Use of various biological entities in the production of nanoparticles
Biological entity
Nanoparticles
Size
Extracellular/
intracellular
Avena sativa
(Plant)
Au
5–20 nm (at pH 3
and 4), 25–85 nm
(at pH 2)
Intracellular
Azadirachta
indica (Plant)
Ag, Au and
Ag/Au
bimetallic
50–100 nm Extracellular
Emblica
Officinalis (Plant)
Ag and Au
(10–20 nm) and
(15–25 nm )
Extracellular
Chapter I
Ph.D Thesis Umesh Kumar University of Pune
Pag
e19
Aloe vera (Plant) Ag 15.2 ± 4.2 nm
Alfalfa (Plant) Ti/Ni
bimetallic
1–4 nm
Pelargonium
graveolens (Plant)
Ag 16–40 nm Extracellular
Cinnamomum
camphora (Plant)
Au and Ag 55–80 nm Extracellular
Tamarind Leaf
Extract (Plant)
Au
nanotriangles
20–40 nm Extracellular
Aspergillus
fumigatus
(Fungus)
Ag 5–25 nm Extracellular
Colletotrichum sp.
(Fungus)
Au 20–40 nm Extracellular
Verticillium.
luteoalbum
(Fungus)
Au Few to 100 nm Intracellular
Trichothecium sp.
(Fungus)
Au
Extracellular
And
Intracellular
Verticillium sp.
(Fungi)
Au and Ag 20 nm, 25 + 12 nm Intracellular
Fusarium
oxysporum and
Verticillium sp.
(Fungi)
Magnetite 20–50 nm Extracellular
Fusarium
oxysporium
(Fungus)
Ag,Au,CdS,Zr
O2,BaTiO3,
SiO2,
TiO2,CdSe
Ranging from 3-40
nm
Extracellular
Candida glabrata
(Yeast)
CdS 20 A° Intracellular
MKY3 (Yeast) Ag 2–5 nm Extracellular
Schizosaccharomy
ces pombe (Yeast)
Intracellular
CdS Different sizes Intracellular
P. jadinii (Yeast) Au Few to 100 nm Intracellular

Chapter I
Ph.D Thesis Umesh Kumar University of Pune
Pag
e20
Desulfovibrio
desulfuricans
(Bacteria)
(((Bacterium)
(Bacterium)
(Bacterium)
Palladium
Magnetotactic
bacteria
Magnetic
(Fe3O4),
greigite
(Fe3S4)
Pseudomonas
stutzeri
(Bacterium)
Ag Up to 200 nm
Rhodococcus
sp.(Actinomycete)
Au 5–15 nm Intracellular
Thermomonospor
a sp.
(Actinomycetes)
Au 8 nm Extracellular
Plectonema
boryanum
UTEX485
(Cyanobacterium)
Octahedral Au
platlets
6 µM to 10 nm At the cell wall
1.8 Outline of the Thesis
The work presented in this thesis describes the biosynthesis of metal/metal-oxide
nanoparticles using both whole cell organism (Brevibacterium casei) and
biomolecular approach in an attempt to extend the biological synthesis protocols
towards a possibility of scale-up. An important outcome of this approach is that a
range of metal/metal-oxide (Co3O4, CrO2, Au and Ag) nanoparticles can be
synthesized using this route. These nanoparticles possess unusual yet interesting
functional properties. An attempt has been made to probe the changes in
biomechanical properties associated with bacterium (Brevibacterium casei) during
cobalt oxide (Co3O4) nanoparticles synthesis using Atomic Force Microscopy.
Further the lysozyme synthesized metal (gold and silver) nanoparticles have been
shown to retain their antimicrobial activity after synthesis. They are tested and found
to be biocompatible. The chapter-wise discussion of these studies is as follows:
Chapter 2 discusses the extracellular bacterial synthesis of Cobalt oxide (Co3O4)
nanoparticles at room-temperature in aqueous environment. These sub–10 nm
nanoparticles could be synthesized under ambient conditions by reaction of marine
bacterium Brevibacterium casei with appropriate chemical precursors for 72 hours.
The bacterial proteins involved in the oxidation of precursors to yield oxide

Chapter I
Ph.D Thesis Umesh Kumar University of Pune
Pag
e21
nanoparticles were investigated and involvement of low molecular weight proteins of
ca. 30–65 kDa in the biosynthesis process was established. In addition, single
crystalline, sub–10 nm cobalt oxide nanocrystals was observed for the first time in
case of biologically synthesized spinel compounds.
Chapter 3 discusses the use of AFM force-distance curves on bacterial cells, to
directly monitor (in real time) the changes in the surface-topography, surface-
adhesion, indentation-depth, and Young’s modulus of a metal-tolerant marine
bacterium, Brevibacterium casei, isolated from the coast of the Arabian Sea, after its
exposure to the Co2+
during the process of biosynthesis of nanoparticles. This chapter
describes significant changes in the morphology as well as elastic and adhesive
properties of the Brevibacterium casei, where an increase in the adhesive properties
and the indentation depth of the bacterial surfaces and a decrease in the cell stiffness
after several hours of exposure to the cobalt acetate were observed. We have
discussed both qualitative and quantitative analysis of the force-spectroscopy data in
detail in this chapter.
Chapter 4 discusses the lysozyme mediated size dependent synthesis of gold and
silver nanocrystals at controlled pH and light conditions without using any known
reducing agents. As-synthesized lysozyme capped gold nanoparticles prepared by
this method are biocompatible and retain antibacterial property. Further we have
shown the possible involvement of tyrosine and tryptophan residues and the use of
Surface Enhanced Raman Spectroscopy (SERS) technique to precisely determine the
functional groups responsible in the surface capping of gold and silver nanoparticles
synthesized by the hen egg white lysozyme.
Chapter 5 discusses the lysozyme mediated synthesis of chromium oxide (CrO2)
nanocrystals in aqueous conditions without using any known reducing agents. Being
metastable, presence of few nm thick layer of Cr(OH)3 was observed at the surface of
CrO2. As-synthesized lysozyme capped nanoparticles prepared by this method are
paramagnetic and sub 10 nm in size. In this synthesis procedure lysozyme acts both
as reducing as well as capping agent.

Chapter I
Ph.D Thesis Umesh Kumar University of Pune
Pag
e22
Chapter 6 includes a brief summary of the thesis work and the scope for possible
further research in these areas.
1.9 References
1. http://www.zyvex.com/nanotech/feynman.html.
2. Hess, H.; Vogel, V. J Biotechnol 2001, 82, 67.
3. Hess, H.; Bachand, G.; Vogel, V. Chemistry 2004, 10, 2110.
4. Hess, H.; Clemmens, J.; Brunner, C.; Doot, R.; Luna, S.; Ernst, K. H.; Vogel, V.
Nano Lett 2005, 5, 629.
5. Montemagno, C. J Nanotechnol 1999, 10, 225.
6. Liu, H.; Schmidt, J. J.; Bachand, G. D. et al. Nat Mater 2002, 1, 173.
7. Xi, J.; Schmidt, J. J.; Montemagno, C. D. Nat Mater 2005, 4, 180.
8. Antonii, F. Panacea Aurea–Auro Potabile, Bibliopolio Frobeniano, Hamburg
1618.
9. Kunckels, J. Nuetliche Observationes oder Anmerkungen von Auro und Argento
Potabili, Schutzens, Hamburg 1676.
10. Helcher, H. H. Aurum Potabile oder Gold Tinstur, J. Herbord Klossen, Breslau
and Leipzig 1718.
11. Ostwald, W. Kolloid Z. 1909, 4, 5.
12. Savage, G. Glass and Glassware, Octopus Book, London 1975.
13. Wagner, F. E. et al., Nature 2000, 407, 691.
14. Turkevich, J. Gold Bull. 1985, 18, 86.
15. Smalley, R. Congressional Hearings, Summer 1999.
16. Roucoux, A.; Schulz, J.; Patin, H. Chem. Rev. 2002, 102, 3757.
17. Lewis, L. N. Chem. Rev. 1993, 93, 2693.
18. Niemeyer, C. M. Angew. Chem. Int. Ed. 2001, 40, 4128.
19. Niemeyer, C. M. Angew. Chem. Int. Ed. 2003, 42, 5974.
20. Parak, W. J. et al., Nanotechnology 2003, 14, R15.
21. Caski, A.; Maubach, G.; Born, D.; Reichert, J.; Fritzsche, W. Single Mol. 2002,
3, 275.
22. Rosi, N. L.; Mirkin, C. A. Chem. Rev. 2005, 105, 1547.
23. Parak, W. J.; Pellegrino, T.; Plank, C. Nanotechnology 2005, 16, R9.
24. Bruchez, M.; Moronne, Jr. M.; Gin, P.; Weiss, S.; Alivisatos, A. P. Science

Chapter I
Ph.D Thesis Umesh Kumar University of Pune
Pag
e23
1998, 281, 2013.
25. Chan, W. C. W.; Nie, S. M. Science 1998, 281, 2016.
26. Hagfeldt, A.; Graetzel, M. Acc. Chem. Res. 2000, 33, 269.
27. Bueno, J. T.; Shchukina, N.; Ramos, A. A. Nature 2004, 430, 326.
28. Fichtner, M. Adv. Eng. Mater. 2005, 7, 443.
29. Moran, C. E.; Steele, J. M.; Halas, N. J. Nano Lett. 2004, 4, 1497.
30. Simon, U. Nanoparticles: From Theory to Application, Schmid, G. (ed.) Wiley-
VCH, Weinheim, Germany 2004.
31. Edelstein, A. S.; Cammarata, R. C. (eds.) Nanomaterials: Synthesis, Properties,
and Applications, Institute of Physics Publishing, Bristol, U.K. 1996.
32. Maier, S. A.; Brongersma, M. L.; Kik, P. G.; Atwater, H. A. Phys. Rev. B 2002,
65, 193408.
33. Wang, Y. Acc. Chem. Res. 1991, 24, 133.
34. Yoffe, A. D. Adv. Phys. 1993, 42, 173.
35. Matejivic, E. Annu. Rev. Mater. Sci. 1985, 15, 483.
36. Shull, R. D.; McMichael, R. D.; Swartzendruber, L. J.; Benett, L. H. Studies of
Magnetic Properties of Fine Particles and Their Relevance to Materials Science,
Pormann, J. J.; Fiorani, D. (eds.) Elsevier Publishers, Amsterdam 1992, p. 161.
37. Heath, J. R.; Kuekes, P. J.; Snider, G. S.; Williams, R. S. Science 1998, 280,
1716.
38. Andres, R. P. et al., J. Mater. Res. 1989, 4, 704.
39. Li, X. et al., Langmuir 2004, 20, 1298.
40. Roco, M. C.; Williams, R. S.; Alivisatos, P. (eds.) Interagenecy Working Group
in Nanoscience Engineering and Technology (IWGN) Workshop Report:
Nanotechnology Research Directions; Vision for Nanotechnology R and D in the
Next Decade, Int. Tech. Research Institutes, WTEC Division, Loyola College 1999.
41. Kiwi, J.; Gratzel, M. Angew. Chemie. Int. Ed. 1979, 18, 624.
42. Riegel, G.; Bolton, R. J. J. Phys. Chem. 1995, 280, 1716.
43. Boronina, T.; Klabunde, K. J.; Sergeev, G. B. Environ. Sci.Technol. 1995, 29,
1511.
44. Li, Y. X.; Klabunde, K. J. Langmuir 1991, 7, 1388.
45. Lucas, E.; Klabunde, K. J. Nanostruct. Mater. 1999, 12, 179.
46. Khaleel, A.; Kapoor, P.; Klabunde, K. J. Nanostruct. Mater. 1999, 11, 459.
47. Koper, O.; Lagadic, I.; Volodin, A.; Klabunde, K. J. Chem. Mater. 1997, 9, 2468.

Chapter I
Ph.D Thesis Umesh Kumar University of Pune
Pag
e24
48. Koper, O. B.; Lucas, E.; Klabunde, K. J. J. Appl. Toxicol. 1999, 19, 559.
49. Wagner, G. W.; Koper, O. B.; Lucas, E.; Decker, S.; Klabunde, K. J. J. Phys.
Chem. B 2000, 104, 5118.
50. Rouvray, D. Chem. Br. 2000, 36, 46.
51. Lawton, G. Chem. Ind. (London) 2001, 174.
52. Havancsak, K. Mater. Sci. Forum 2003, 414, 85.
53. Mazzola, L. Nature Biotech. 2003, 21, 1137.
54. Hayat, M. A. (ed.) Colloidal Gold :Principles, Methods and Application,
Academic Press, San Diego 1989, Vol. 1.
55. Alivisatos, P. Nature Biotechnol. 2004, 22, 47.
56. Buffat, P.; Borel, J. P. Phys. Rev. A 1976, 13, 2287.
57. Brust, M.; Kiely, C. J. Colloids Surf. A: Physicochem. Eng. Asp. 2002, 202, 175.
58. Link, S.; El-Sayed, M. A. J. Phys. Chem. B 1999, 103, 4212.
59. Dick, K.; Dhanasekaran, T.; Zhang, Z.; Meisel, D. J. Am. Chem. Soc., 2002, 124,
2312.
60. Glinka, Y. D.; Lin, S. H.; Hwang, L. P.; Chen, Y. T.; Tolk, N. H. Phys. Rev. B,
2001, 64, 085421.
61. McHale, J. M.; Auroux, A.; Perotta, A. J.; Navrotsky, A. Science 1997, 277, 788.
62. El-Sayed, M. A. Acc. Chem. Res. 2001, 34, 257.
63. Link, S.; El-Sayed, M. A. J. Phys. Chem. B 1999, 103, 8410.
64. Burda, C.; Chen, X.; Narayanan, R.; El-Sayed, M. A. Chem. Rev. 2005, 105,
1025.
65. Chen, S. et al., Science 1998, 280, 2098.
66. Chen, S.; Pei, R. J. Am. Chem. Soc. 2001, 123, 10607.
67. Zhang, P.; Sham, T. K. Appl. Phys. Lett. 2002, 81, 736.
68. Quinn, B. M.; Liljeroth, P.; Ruiz, V.; Laaksonen, T.; Kontturi, K. J. Am. Chem.
Soc. 2003, 125, 6644.
69. Link, S.; Mohamed, M. B.; El-Sayed, M. A. J. Phys. Chem. B 1999, 103, 3073.
70. Templeton, A. C.; Pietron, J. J.; Murray, R. W.; Mulvaney, P. J. Phys. Chem. B
2000, 104, 564.
71. Itoh, T.; Asahi, T.; Masuhara, H. Appl. Phys. Lett. 2001, 79, 1667.
72. Yan, B.; Yang, Y.; Wang, Y. J. Phys. Chem. B 2003, 107, 9159.
73. Al-Rawashdeh, N.; Foss, C. A., Jr. Nanostruct. Mater. 1997, 9, 383.
74. Xu, H.; Bjerneld, E. J.; Kall, M.; Borjesson, L. Phys. Rev. Lett. 1999, 83, 4357.

Chapter I
Ph.D Thesis Umesh Kumar University of Pune
Pag
e25
75. Su, K. H. et al., Nano Lett. 2003, 3, 1087.
76. Kelly, K. L.; Coronado, E.; Zhao, L. L.; Schatz, G. C. J. Phys. Chem. B 2003,
107, 668.
77. Schmid, G.; Simon, U. Chem. Commun. 2005, 6, 697.
78. Zhang, J. H. Acc. Chem. Res. 1997, 30, 423.
79. Raimondi, F.; Scherer, G. G.; Kotz, R.; Wokaun, A. Angew. Chem. Int. Ed. 2005,
44, 2190.
80. Kreibieg, U.; Vollmer, M. Optical properties of metal clusters, Springer, Berlin
and New York 1995.
81. Khallel, A.; Richards, R. M. Nanoscale Materials in Chemistry Klabunde, K. J.
(ed.) John Wiley & Sons, New York 2001, pp. 85–120.
82. El-Shall, M. S.; Slack, W.; Vann, W.; Kane, D.; Hanley, D. J. Phys. Chem. 1994,
98, 3067.
83. Edelstein, A. S.; Hadjipanayis, G. C.; Siegel, R. W. (eds.) Nanophase Materials,
Kluwer Academic Publishers, Dordrecht 1994, pp. 73–80.
84. Edelstein, A. S.; Hadjipanayis, G. C.; Siegel, R. W. (eds.) Nanophase Materials,
Kluwer Academic Publishers, Dordrecht 1994, pp. 85–88.
85. Tan, S.; Leo, N. T. Trans. Nanostruct. Met. Soc. China 1995, 2, 58.
86. Baraton, M. I.; El-Shall, M. S. Nanostruct. Mater. 1995, 6, 301.
87. Cow, G. M.; Gonsalves, K. E. (eds.) Nanotechnology, Molecularly Designed
Materials, American Chemical Society, Washington, D.C. 1996, pp. 79–99.
88. Siegel, R. W. et al., J. Mater. Res. 1998, 3, 1367.
89. Huh, M. Y.; Kim, S. H.; Ahn, J. P.; Park, J. K.; Kim, B. K. Nanostruct. Mater.
1999, 11, 211.
90. Messing, G. L.; Gardner, T. J. Am. Ceram. Soc. Bull. 1984, 64, 1498.
91. Kodas, T. T. Adv. Mater. 1989, 6, 180.
92. Jayanthi, V.; Zhang, S. C.; Messing, G. L. J. Aerosol Sci. Technol. 1993, 19, 478.
93. Messing, G. L.; Zhang, S. C.; Jayanthi, V. J. Am. Ceram. Soc. 1993, 76, 2707.
94. Edelstein, A. S.; Hadjipanayis, G. C.; Siegel, R. W. (eds.) Nanophase Materials,
Kluwer Academic Publishers, Dordrecht 1994, pp. 109–116.
95. Janackovic, D.; Jokanovic, V.; Gvozdenovic, L. K.; Uskokovic, D. Nanostruct.
Mater. 1998, 10, 341.
96. Ulrich, G. D.; Riehl, J. W. J. Colloid Interface Sci. Technol. 1982, 87, 257.
Chapter I
Ph.D Thesis Umesh Kumar University of Pune
Pag
e26
97. Cow, G. M.; Gonsalves, K. E. (eds.) Nanotechnology, Molecularly Designed
Materials, American Chemical Society, Washington, D.C. 1996, pp. 64–78.
98. Lindackers, D.; Janzen, C.; Rellinghaus, B.; Wassermann, E. F.; Roth, P.
Nanostruct. Mater. 1998, 10, 1247.
99. Palkar, V. R. Nanostruct. Mater. 1999, 11, 369.
100. Barringer, E. A.; Bowen, H. K. J. Am. Ceram. Soc. 1982, 65, C199.
101. Segal, D. Chemical Synthesis of Advanced Ceramic Materials, Cambridge
University Press, Cambridge 1989.
102. Gesser, H. D.; Gosswami, P. C. Chem. Rev. 1989, 89, 765.
103. West, J. K. Chem. Rev. 1990, 90, 33.
104. Brinker, C. J.; Scherer, G. W. Sol–Gel Science: The Physics and Chemistry of
Sol–Gel Processing, Academic Press, Boston 1990.
105. Chandler, C. D.; Roger, C.; Smith, M. J. H. Chem. Rev. 1993, 93, 1205.
106. Klein, L. (ed.) Sol–Gel Optics: Processing and Applications, Kluwer, Boston
1993.
107. Hench, L. L.; Avnir, D. Acc. Chem. Res. 1995, 28, 328.
108. Narula, C. K. Ceramic Precursor Technology and Its Applications, Marcel
Decker, New York 1995.
109. Interrante, L. V.; Smith, M. J. H. (eds.) Chemistry of Advanced Materials: An
Overview, Wiley–VCH, New York 1998.
110. Toshima, N.; Harada, M.; Yonezawa, T.; Kushihashi, K.; Asakura, K. J. Phys.
Chem. 1991, 95, 7448.
111. Chaudret, B.; Bradley, J. S.; Mazel, R.; Roucau, C. J. Am. Chem. Soc. 1993,
115, 11638.
112. Toshima, N.; Wang, Y. Adv. Mater. 1994, 6, 245.
113. Naka, K.; Yaguchi, M.; Chujo, Y. Chem. Mater. 1999, 11, 849.
114. Warner, M. G.; Reed, S. M.; Hutchison, J. E. Chem. Mater. 2000, 12, 3316.
115. Tan, Y.; Dai, X.; Li, Y.; Zhu, D. J. Mater. Chem. 2003, 13, 1069.
116. Trivino, G. C.; Klabunde, K. J.; Dale, E. B. Langmuir 1987, 3, 986.
117. Brust, M.; Fink, J.; Bethell, D.; Schiffrin, D. J.; Kiely, C. J. Chem. Commun.
1995, 1655.
118. Kim, K. S.; Demberelnyamba, D.; Lee, H. Langmuir 2004, 20, 556.
119. Ohde, H.; Hunt, F.; Wai, C. M. Chem. Mater. 2001, 13, 4130.

Chapter I
Ph.D Thesis Umesh Kumar University of Pune
Pag
e27
120. Viswanathan, R.; Lilly, G. D.; Gale, W. F.; Gupta, R. B. Ind. Eng. Chem. Res.
2003, 42, 5535.
121. Meyer, M.; Wallberg, C.; Kurihara, K.; Fendler, J. H. Chem. Commun. 1984,
90.
123. Petit, C.; Jain, T. K.; Billoudet, F.; Pileni, M. P. Langmuir 1994, 10, 4446.
124. Forster, S.; Antonietti, M. Adv. Mater. 1998, 10, 195.
125. Minko, S.; Kiriy, A.; Gorodyska, G.; Stamm, M. J. Am. Chem. Soc. 2002, 124,
10192.
126. Zhang, M.; Drechsler, M.; Muller, A. H. E. Chem. Mater. 2004, 16, 537.
127. Braun, E.; Eichen, Y.; Sivan, U.; Yoseph, G. B. Nature 1998, 391, 775.
128. Richter, J. et al., Adv. Mater. 2000, 12, 507.
129. Shenton, W.; Douglas, T.; Young, M.; Stubbs, G.; Mann, S. Adv. Mater. 1999,
11, 253.
130. Fowler, C. E.; Shenton, W.; Stubbs, G.; Mann, S. Adv. Mater. 2001, 13, 126.
131. Dujardin, E.; Peet, C.; Stubbs, G.; Culver, J. N.; Mann, S. Nano Lett. 2003, 3,
413.
132. Wiesner, J.; Wokaun, A. Chem. Phys. Lett. 1989, 57, 569.
133. Mann, S.; Angew. Chem., Int. Ed., 2000, 39, 3392–3406.
134. Dujardin, E. and Mann, S. Adv. Mater., 2002, 14, 775–788.
135. Lowenstam, H. A.; Weiner, S. On Biomineralization; Oxford University Press:
New York, 1989.
136. Baeuerlein, E. Biomineralization, Progress in Biology, Molecular Biology, and
Application; Wiley-VCH Verlag GmbH & Co. KGaA: Weinheim, Germany, 2004.
137. Baeuerlein, E. Handbook of Biomineralization, Biological Aspects and
Structure Formation; Wiley-VCH Verlag GmbH & Co. KGaA: Weinheim,
Germany, 2007.
138. Mann, S. Biomineralization; Oxford University Press: Oxford, U.K., 2002.
139. Bazylinski, D. A.; Frankel, R. B. Nat. Rev. Microbiol. 2004, 2, 217.
140. Komeili, A. Annu. Rev. Biochem. 2007, 76, 351.
141. Sollner, C.; Burghammer, M.; Busch-Nentwich, E.; Berger, J.; Schwarz, H.;
Riekel, C.; Nicolson, T. Science 2003, 302, 282.
142. Addadi, L.; Joester, D.; Nudelman, F.; Weiner, S. Chem.sEur. J. 2006, 12, 981.
143. Addadi, L.; Raz, S.; Weiner, S. Adv. Mater. 2003, 15, 959.

Chapter I
Ph.D Thesis Umesh Kumar University of Pune
Pag
e28
144. Aizenberg, J.; Sundar, V. C.; Yablon, A. D.; Weaver, J. C.; Chen, G. Proc. Natl.
Acad. Sci. U.S.A. 2004, 101, 3358.
145. Sundar, V. C.; Yablon, A. D.; Grazul, J. L.; Ilan, M.; Aizenberg, J. Nature 2003,
424, 899.
146. Muller, W. E. G.; Eckert, C.; Kropf, K.; Wang, X. H.; Schlomacher, U.;
Seckert, C.; Wolf, S. E.; Tremel, W.; Schroder, H. C. Cell Tissue Res. 2007, 329,
363.
147. Muller, W. E. G.; Wendt, K.; Geppert, C.; Wiens, M.; Reiber, A.; Schroder, H.
C. Biosens. Bioelectron. 2006, 21, 1149.
148. Cattaneo-Vietti, R.; Bavestrello, G.; Cerrano, C.; Sara, M.; Benatti, U.; Giovine,
M.; Gaino, E. Nature 1996, 383, 397.
149. Round, F. E.; Crawford, R. M.; Mann, D. G. The Diatoms: Biology and
Morphology of the Genera; Cambridge University Press: New York, 1990.
150. Addadi, L.; Weiner, S. Angew. Chem. Int. Ed. 1992, 31, 153.
151. Weiner, S.; Traub, W.; Lowenstam, H. A. Biomineralization and Biological
Metal Accumulation, Westbroek, P.; Jong, E. W.; Dordrecht, R. (eds.) 1983, p. 205.
152. Gower, L. A. Variety of Biomineral Types and Biological Systems,
http://www.gower.mse.ufl.edu/research.html.
153. Mann, S. Inorganic Materials, 2nd edition, Bruce, D. W.; O’Hare, D. (eds.)
John Wiley & Sons 1996.
154. Cheavin, W. H. S. Microscope 1938, 2, 155.
155. Monje, P.V.; Baran, E. J. J. Plant Physiol. 2004, 161, 121.
156. Arnott, H.J. Biological Mineralization and Demineralization, Nancollas, G. H.
(ed.) Springer Verlag, Berlin 1982, pp. 199–218.
157. Monje, P. V.; Baran, E. J. Advances in Plant Physiology, Vol. 7,
Hemantaranjan, H. (ed.) Scientific Publishers, Jodhpur 2004 pp. 403–419.
158. Wal, P. V. D.; Jong, E. W. D.; Westbrock, P.; Bruijn, W. C. D.; Stapel A. A. H.
J. Ultrastructure. Res. 1983, 85, 139.
159. Marsh, M. E. Biomineralization, Baeuerlein, E. (ed.) Wiley–VCH, Weinheim,
Germany 2000, p. 251–268.
160. Frankel, R. B.; Bicudo, C. E. M. Biophys. J. 1986, 50, 375.
161. Mann, S.; Sparks, N. H.; Walker, M. M.; Kirschvink, J. L. J. Exp. Biol. 1988,
140, 35.
162. Kirschvink, A. K.; Woodford, B. J. Proc. Natl. Acad. Sci. USA 1992, 89, 7683.

Chapter I
Ph.D Thesis Umesh Kumar University of Pune
Pag
e29
163. Kirschvink, J. L.; Dobson, J.; Grassi, P. P. Brain Res. Bull. 1996, 39, 255.
164. Walker, M. M. et al., Nature 1997, 390, 371.
165. Devouard, B. et al., Am. Mineral. 1998, 83, 1387.
166. Grassi, P. P. S.; Wessiken, R.; Dobson, J. Biochem. Biophys. Acta 1999, 1426,
212.
167. Grassi, P. P. S.; Dobson, J. BioMetals 1999, 12, 67.
168. Araujo, F. F. T. D.; Pires, M. A.; Bazylinski, D. A.; Frankel, R. B.
Biomineralization, Baeuerlein , E. (ed.) Wiley–VCH, Weinheim, Germany 2000, p.
41–43.
169. Diebel, C. E.; Proksch, R.; Green, C. R.; Neilson, P.; Walker, M. M. Nature
2000, 406, 299.
170. Posfai M. et al., Eur. J. Mineral. 2001, 13, 691.
171. Josifovska M. G.; McClean R. G.; Schofield M. A.; Sommer C. V.; Kean W. F.
Eur. J. Mineral. 2001, 13, 863.
172. Baurerlein, E. Angew. Chem. Int. Ed. 2003, 42, 614.
173. Monje, P. V.; Baran, E. J.; J. Plant Physiol. 2000, 157, 457.
174. Mann S (1992) Nature 357:358
175. Slocik JM, Knecht MR, Wright DW In: Nalwa HS (ed) Encyclopedia of
nanoscience and nanotechnology, 2004, vol 1. American Scientific, p 293
176. Li X-Z, Nikaido H, Williams KE J Bacteriol 1997, 179, 6127.
177. Rorrer, G. L.; Chang, C. H.; Liu, S. H.; Jeffryes, C.; Jiao, J.; Hedberg, J. A. J.
Nanosci. Nanotechnol. 2005, 5, 41.
178. Curnow, P.; Bessette, P. H.; Kisailus, D.; Murr, M. M.; Daugherty, P. S.; Morse,
D. E. J. Am. Chem. Soc. 2005, 127, 15749.
179. Smith, B. L.; Paloczi, G. T.; Hansma, P. K.; Levine, R. P. J. Cryst. Growth
2000, 211, 116.
180. Walters, D. A.; Smith, B. L.; Belcher, A. M.; Paloczi, G. T.; Stucky, G. D.;
Morse, D. E.; Hansma, P. K. Biophys. J. 1997, 72, 1425.
181. Kroger, N.; Lehmann, G.; Rachel, R.; Sumper, M. Eur. J. Biochem. 1997, 250,
99.
182. Shimizu, K.; Cha, J.; Stucky, G. D.; Morse, D. E. Proc. Natl. Acad. Sci. U.S.A.
1998, 95, 6234.
183. Xu, Z.P.; Zeng, Q.H.; Lu, G.Q. & Yu, A.B. Chem. Engineering Sc 2006, 61,
1027.

Chapter I
Ph.D Thesis Umesh Kumar University of Pune
Pag
e30
184. Cheon, J. & Horace, G. J. Mater. Chem. 2009, 19, 6249.
185. Caseri, W. Chem. Engineering Commun. 2009, 196 (5), 549.
186. Mohanpuria, P.; Rana, K.N. & Yadav, S.K J. Nano. Res. 2008, 10, 507.
187. Raveendran, P.; Fu, J. & Wallen., S.L. J. Am. Chem. Soc. 2003, 125 (46),
13940.
188. Li, S.; Shen, Y.; Xie,A.; Yu, X.; Qui, L.; Zhang, L. & Zhang, Q. Green
Chemistry 2007, 9, 852.
189. Parashar, U.K.; Saxena, S.P. & Srivastava, A. Digest journal of nanomaterials
and biostructures 2009, 4 (1), 159.
190. Parashar, V.; Prashar, R.; Sharma, B. & Pandey, A.C. Digest journal of
nanomaterials and biostructures 2009, 4 (1), 45.

CHAPTER-II Extracellular microbial
synthesis of Co3O4
nanoparticles by using
marine bacterium
Brevibacterium casei

Chapter II
Ph.D thesis Umesh Kumar University of Pune
Pag
e31
Extracellular microbial synthesis of Co3O4 nanoparticles
using marine bacterium Brevibacterium casei
Co3O4, which crystallizes in spinel phase at temperatures much higher than ambient
temperatures, orders antiferromagnetically below its Neel temperature (~40K),
However, in nano size, it shows ferromagnetic ordering due to surface canting,
disorder, imperfect oxygen atom coordination etc. Here, for the first time, we report
the synthesis of single-crystalline, ferromagnetic Co3O4 nanoparticles functionalized
with proteins (size 5-7 nm) using cobalt acetate as precursor at room temperature in
aqueous medium by a metal-tolerant marine bacterium isolated from the coast of the
Arabian Sea. Energetically unfavourable change in the oxidation state of cobalt
atoms from (+2 to +3) during synthesis by the bacterial strain was evidenced by X-
ray photoelectron spectroscopy. The effect on the morphology of bacterial cells after
exposure to the cobalt acetate was imaged by scanning electron microscopy showing
cooperative, self-organized, structured aggregate formation, possibly due to the inter-

Chapter II
Ph.D thesis Umesh Kumar University of Pune
Pag
e32
bacterial communication under external stress. This chapter describes a new method
for the synthesis of Co3O4 nanopoarticles under ambient conditions with the using
bacteria; Brevibacterium casei. The oxidation of the precursor, which results in
Co3O4 nanocrystals formation, passivated by protein; is hypothesized to be mediated
by the oxido-reductase and hydrolases class of enzymes. Different experimental
techniques have been used to thoroughly characterize this material and their details
are discussed in this chapter.
2.1 Introduction
It is well known that biological systems can synthesize number of metal or metal-
containing particles in the nanometer size range1. For example, many multicellular
organisms use inorganic materials (such as calcium carbonate or silica) in
combination with an organic matrix (proteins, lipids or polysaccharides) to produce
hard materials, such as skeletal units, teeth and bones. Single-celled organisms can
also produce mineral structures that form inorganic materials either intracellularly or
extracellularly; examples include magnetotactic bacteria, which produce magnetite
(Fe3O4) or greigite (Fe3S4) and diatoms, which produce siliceous materials. These
particulate systems can be used as precursors for the manufacturing the functional
materials2. Furthermore, microbial activity is known to be responsible for the
transformation of at least one third of the elements in the periodic table3. These
transformations are the results of assimilatory, dissimilatory, or detoxification
processes and form the cornerstones of many biogeochemical cycles involving
change in the valence states (i.e. oxidation/reduction) or chemical form (i.e. solid,
liquid, gas) of elements3. Metals play an integral role in the life- processes of
microorganisms. Some metals, such as calcium, cobalt, iron, potassium, sodium etc.
are as essential as nutrients and are required since they function as the catalysts for
biochemical reactions, stabilizer of protein structures and bacterial cell walls, serve
in maintaining osmotic balance, involve in redox processes or stabilize various
enzymes and DNA through electrostatic forces4. Marine water and sediments contain
lot of metal salts which are naturally present or they enter into the marine
environment as contaminants through dumping of huge amount of industrial and
domestic wastes containing salts of lead, arsenic, cadmium, nickel, cobalt, mercury,
silver etc5. Therefore, high metal tolerance, among marine bacteria, is a common

Chapter II
Ph.D thesis Umesh Kumar University of Pune
Pag
e33
phenomenon which makes them ideal candidates for exploring metal/metal-oxide
nanoparticle synthesis in the laboratory environment6.
Very recently, the microbial syntheses of inorganic materials including noble
metals, alloys, binary oxides as well as ternary oxides using fungi, yeast, bacteria and
variety of other microorganisms has gained popularity7-9
. The reason being, their
obvious advantages over the traditional wet-chemical methods, wherein, the
synthesis methodology often requires expensive organometallic precursors, high
temperature, pressure and hazardous chemicals and solvents. On the other hand, the
reduction of metal ions by microbes in nature occurs under ambient conditions. In
this ―green synthesis route‖, as-synthesized particle surface is inherently
functionalized by the proteins which give them specific advantages. Due to this
inherent and robust bio-fuctionalization, the as-synthesized particles form stable
suspension in the aqueous medium and further coating of bio-molecules becomes
easier. The protein layer also prevents particles surfaces from fusing together
directly, although, the particles tend to agglomerate due to the protein-protein
interactions. In contrast to the surfactant passivated magnetic nanoparticles
synthesized by traditional methods, the protein functionalized particles are more
likely to behave as isolated particles due to relatively thicker coating of proteins
preventing interparticle interactions. These particles can be easily dried out of
aqueous medium to form powder and can be resuspended without agglomeration.
Similar to any other synthesis route, the microbial synthesis comes with
several challenges such as- better control over size and shape, scaling-up of the
synthesis of nanomaterials as well as synthesis of complex oxide materials with
desired phases which need to be addressed and solved. Chemical synthesis of
nanomaterials, on the other hand, has already advanced to provide excellent control
over size and shape. Another challenge, in case of microbial technique, is to fully
understand the synthesis mechanism at the molecular level, which eventually may
help in providing better control over size and shapes as well as crystallinity in future.
In this chapter, learning from nature’s own sustainable way of remediation of
the metal ions, we have shown the utilization of ability of a marine bacterial culture
in the laboratory environment to synthesize spinel structured, crystalline Co3O4
nanoparticles. This sample of marine water was obtained from the Arabian sea-coast.
Out of 15 bacterial strains isolated from the marine-water and sediment sample, only
three bacterial strains showed resistance to cobalt after exposing them to cobalt-

Chapter II
Ph.D thesis Umesh Kumar University of Pune
Pag
e34
acetate which is used as a precursor in this study for the synthesis of Co3O4
nanoparticles. Further, only one strain gave us the visible indication of formation of
nanoparticles i.e appearance of turbidity and other two did not give any positive
indication. The Co3O4 particles formed by this method are inherently passivated by
the bacterial proteins. Co3O4 is known to have a normal cubic spinel structure and is
antiferromagnetic in the bulk form with the Neel temperature TN between 30-40 K10
.
However, in the nano-regime, uncompensated spins at the particle surfaces can
become a large fraction of the total number of spins thereby giving overall
ferromagnetic-type behaviour. Magnetic nanoparticles have aroused enormous
interest owing to their unique size and shape dependent properties and potential
applications e.g., magnetocaloric refrigeration, read-head sensors, magnetic storage
media, as filler materials in polymers in electromagnetic shielding applications,
magnetorheological devices etc11-15
. There are various wet-chemical methods
reported to synthesize the Co3O4 nanoparticles, however, to the best of our
knowledge, there is no report on the microbial synthesis of Co3O4. We believe that
any previous attempts for the microbial synthesis of this material (or even cobalt-
nanoparticles) could have failed due to the toxicity of the cobalt ions towards
previously used bacterial, fungi cultures. Moreover, it should be noted that when it
comes to the microbial synthesis of the magnetic nanoparticles, γ-Fe2O3 and Fe3O4
are the only materials which are previously reported in the literature7. According to
the current understanding, in most of these biosynthesis processes, precursor salts are
either hydrolyzed or reduced, and the proteins responsible for these processes are
generally cationic in nature.16
Heavy metals are disseminated through the
environment as part of a natural planetary biogeochemical activity and have been
adopted by the biological systems because of their catalytic versatility but their
reactivity turns them toxic even at very low concentrations. Their toxicity in
connection with their nonspecific intake by different channels and transporters has
forced the organisms living in contact with these metals to develop systems to tightly
control metal-ion homeostasis and resistance17
. Heavy metal resistance in bacteria is
the result of multiple resistance systems; different mechanisms displayed by different
organisms, probably depend on the niche from which the organism has been isolated.
Different mechanisms are responsible for conferring cobalt resistance. The first
mechanism includes the members of the resistance-nodulation cell division (RND)
protein family which helps in export of superfluous cations. This system is known as

Chapter II
Ph.D thesis Umesh Kumar University of Pune
Pag
e35
the CzcCBA efflux system which is responsible for efflux of Co2+
, Zn2+
, Cd2+
, and
Ni2+
. Similar to CzcCBA, two different homologous systems have been reported, i.e.,
Cnr operon and rcnA locus which confers resistance to cobalt and nickel18,19
and ncc
locus which confers resistance to cobalt, nickel, and cadmium20
. The second
mechanism is cation diffusion facilitator (CDF family) which serves as secondary
cation filters in bacteria. Primary substrates of CDF proteins are Zn2+
, Co2+
, Ni2+
,
Cd2+
, and Fe2+
.21
In all these mechanisms, it has been proposed that Co2+
is the ion
moiety which goes inside the cell and comes out through efflux pump.
The possible proteins/enzymes involved in the process of Co3O4 nanoparticles
synthesis have been analyzed by SDS-PAGE and the over expression of few new
proteins was observed. The molecular weight of these proteins resembled with those
of oxidases and reductases, and was in accordance with the earlier reports16,22
. The
presence of protein coating on the resultant nanoparticles has been confirmed by
FTIR spectroscopy. The formation of Co3O4 is comprehensively and conclusively
proven by XPS, XRD, TEM and HRTEM studies.
2.2 Materials and methods
2.2.1 Isolation of the bacterial strains (Brevibacterium
casei) from the Arabian sea-coast
The marine-water and sediment samples were collected from the coastal areas of the
Arabian sea near the Sindhudurg district, India. For this purpose, surface-water
samples (approximately 300 ml) were collected in the sterile plastic bottles from 3-4
places of the site and sediment samples were collected on the beach from depth of 1
foot. These samples were processed in the laboratory after 10-12 hours and stored at
4 °C until further use. Various media were used for the isolation of marine strains
including the ―Zobell marine medium‖ (Annexure-1) (HiMedia Labs Pvt. Ltd,
Mumbai, India) and the ―Minimal medium‖ (MM). All the samples were pooled
together and mixed thoroughly. From this pooled main sample, three subsamples
were used for further processing. Individual samples were also processed in the same
manner. From the undiluted and serially diluted (10-2
, 10-4
, 10-6
, 10-8
) subsamples,
100 μl aliquots was plated on each medium. All the media plates were incubated at
28 °C for seven days. The colony morphotypes on each plate were observed after

Chapter II
Ph.D thesis Umesh Kumar University of Pune
Pag
e36
every 24 hour interval. As many as 15 bacterial strains isolated from the marine
water and sediment samples were selected for further use. The growth pattern of the
bacterial strains was checked on the ―Zobell marine medium‖ containing cobalt to
select the cobalt resistant bacterium for the nanoparticle synthesis. The ―minimum
inhibitory concentration‖ (MIC) of cobalt for all the bacterial strains was determined
using the ―double-dilution method‖23
. It was observed that three strains showed
higher MIC (1024 μg/ml) and therefore selected for the synthesis of cobalt-oxide
nanoparticles.
2.2.2 Biosynthesis of Co3O4 nanoparticles using
Brevibacterium casei
After isolation and identification of three bacterial strains, the bacterial cells were
grown in Zobell broth (100 ml) for 24 hours at room temperature. Once the bacterial-
growth attains log phase, cells were harvested by centrifugation at 6000 rpm for 10
minutes and washed twice with autoclaved-water maintaining the sterile condition.
After washing, the cell pellet was resuspended in 100 ml aqueous solution of 1mM
cobalt acetate. The reaction-flask was kept on the shaker at room temperature for 72
hours at 200 rpm. After three days, visible indication of nanoparticles formation i.e.
appearance of turbidity was noticed in case of only one strain and other two strains
did not give any positive indication. The bacterial isolate (AP6) showing positive
results was identified by 16S rRNA oligonucleotide cataloguing technique.
Phylogenetic analysis of the 16S rRNA gene sequence of AP6 revealed an affiliation
of the strain with Brevibacterium casei (Annexure-1). The reaction mixture was
centrifuged at 6000 rpm for 10 minutes and the supernatant was used for further
characterization by using different characterization techniques such as UV-vis
spectrophotometer, FTIR, TEM, SEM, XRD, XPS and HRTEM. Part of the sample
was also calcined at 200 °C for 2 hours to remove the excess protein. In control
experiment, the harvested bacterial biomass was resuspended in autoclaved
deionized water in the absence of cobalt acetate and the filtrate obtained thereafter
was characterized for the presence of cobalt oxide (Co3O4) nanoparticles. Formation
of nanoparticles was not observed in this reaction as expected. In another
experiment, the oxidation of (Co2+
) cobalt acetate in autoclaved deionized water in
Chapter II
Ph.D thesis Umesh Kumar University of Pune
Pag
e37
the absence of bacterial biomass was studied by TEM and FTIR. This control
experiment was also negative as no nanoparticles were detected.
2.2.3 Morphological studies of Brevibacterium casei by
SEM while interacting with precursor salt to synthesize
Co3O4 nanoparticles
Morphological status of bacterial cells before and after exposure to cobalt acetate
was examined by carrying out SEM studies. The bacterial SEM samples were
prepared by removing the bacterial cells samples at regular intervals of 24 h, 48 h
and 72 h from the reaction flask after exposing them to the precursor salt. Respective
control samples were also prepared in the similar way but without exposing the cells
to the precursor salt. In all the cases, the cells were washed twice with double
distilled water by centrifuging at 6000 rpm for 10 minutes which was followed by
resuspending them in water for sample preparation and dropcasting on the glass
cover-slips. The cells were then treated with 2% gluteraldehyde at 4 °C for 2 hours.
These cells were further treated with the ―phosphate buffer saline‖ (PBS, pH=7.2,
0.1M) twice for 20 minutes each. These cells were then exposed to different grades
of ethanol (i.e 30%. 70% and 100%) each for 20 seconds. After that the cells were
finally air dried and coated with gold for SEM imaging.
2.2.4 Magnetic measurements
To check the magnetic properties of the Co3O4 nanoparticles magnetization vs
magnetic field loop measurements for as-synthesized and calcined samples were
carried out at 10 and 300 K. For these measurements, Magnetic Property
Measurement System (MPMS) from Quantum Design Inc., USA equipped with
SQUID magnetometer and superconducting magnet was used. For this purpose, the
sample was wrapped in the Teflon tape and packed inside the gelatin capsule.
2.2.5 Protein profile studies
To identify the bacterial protein(s) responsible for oxidation of the Co2+
the
extracellular protein profile of the bacterial culture supernatant was checked for the
induction of new protein/s upon 1mM cobalt acetate exposure. Proteins formed were
analyzed by running 10% SDS-PAGE (Sodium Dodecyl Sulphate Polyacrylamide

Chapter II
Ph.D thesis Umesh Kumar University of Pune
Pag
e38
Gel Electrophoresis). The 24 h grown bacterial biomass was suspended in 100 ml of
sterile distilled water containing 1 mM cobalt acetate. This cell suspension was kept
at room temperature and 200 rpm for 72 h. The supernatant containing the
extracellular proteins secreted by the bacteria in presence of salt precursor, cobalt
acetate, were separated from the bacterial biomass by centrifugation at 6000 rpm for
10 minutes. This cell free solution or supernatant was then lyophilized and
concentrated. In a separate set of experiments, all the conditions were kept same
except for addition of salt precursor. The cell free supernatant obtained in this case
also were concentrated as stated above. The proteins obtained this way were
analyzed by 10% SDS-PAGE, at pH 8.5 and run along with the standard molecular
weight markers according to the procedure published by Laemmli24
. The
polyacrylamide gels were stained using silver staining protocol to visualise the
protein bands.
2.3 Material characterization
FTIR spectroscopy measurement for as prepared and calcined Co3O4 nanocrystalline
powder was taken in KBr pellet using a Perkin–Elmer Spectrum One instrument.
Spectrometer operated in the diffuse reflectance mode at a resolution of 2 cm-1
. SEM
measurements on bacterial cells were performed on a Leica Stereoscan-440
instrument equipped with a Phoenix EDAX attachment operated at 20 kV. Samples
for the Transmission Electron Microscopy (TEM) were prepared by drop coating the
nanoparticles solution on carbon-coated copper grids. Selected area electron
diffraction (SAED) as well as High Resolution Transmission Electron Microscopy
(HRTEM) measurements were also carried out from the same TEM grid. TEM
measurements were performed on a JEOL model 1200EX instrument operated at an
accelerating voltage of 120 kV. HRTEM measurements were carried out on a JEOL–
JEM-2010 UHR instrument operated at a lattice image resolution of 0.14 nm. X-Ray
Diffraction (XRD) measurements of drop coated films of reaction products on glass
substrate were carried out on a PHILIPS X’PERT PRO instrument equipped with
X’celerator- a fast solid-state detector on dropcoated sample on glass substrate. The
sample was scanned using X’celerator with a total number of active channels of 121.
Iron-filtered Cu Kα radiation (=1.5406 Å) was used. XRD patterns were recorded in
the 2θ range of 20°- 80° with a step size of 0.02° and a time of 5 seconds per step. X-

Chapter II
Ph.D thesis Umesh Kumar University of Pune
Pag
e39
ray photoemission spectroscopy (XPS) measurements of films of the nanocoparticles
casted on to Si substrates were carried out on a VG MicroTech ESCA 3000
instrument at a pressure <1x10⁻⁹
Torr with an overall resolution of 1 eV. The spectra
was recorded with unmonochromatic Mg K alpha radiation (photon energy = 1253.6
eV) at a pass energy of 50 eV and electron take off angle (angle between electron
emission direction and surface plane) of 60°. Thermogravimetric analysis for
biologically synthesized Co3O4 nanocrystals was performed on Diamond Q5000 by
Perkin-Elmer by applying scan rate 100 °C min-1
under the flow of nitrogen. For
these measurements, samples were dried under the lamp to obtain it in powder form.
2.4 Results and Discussions
2.4.1 Transmission electron microscopic analysis
To analyze the size and shape of the particles in a broader range, TEM investigation
were performed (figure 2.1) on both as-synthesized (panel A) and calcined
nanoparticles (panel B). The top panel shows that the as-synthesized particles seem
to agglomerate due to protein-functionalized surfaces with average size of the quasi-
spherical particles around 6 nm. The robust protein coating, on one hand, helps the
agglomeration due to the interprotein linkage and, on the other hand, prevents the
Co3O4 particles surfaces to fuse together to have exchange interaction, thereby
keeping their identity as an isolated intact nanoparticle. After mild calcination (200
°C for 2 h), it appears that the particles get further agglomerated, and the size of
these agglomerates increases to around 50 nm as at this temperature proteins start
Figure 2.1: TEM micrographs of as-synthesized (panel A) and calcined (panel B) Co3O4 nanoparticles. Inset shows selected area diffraction (SAED) patterns
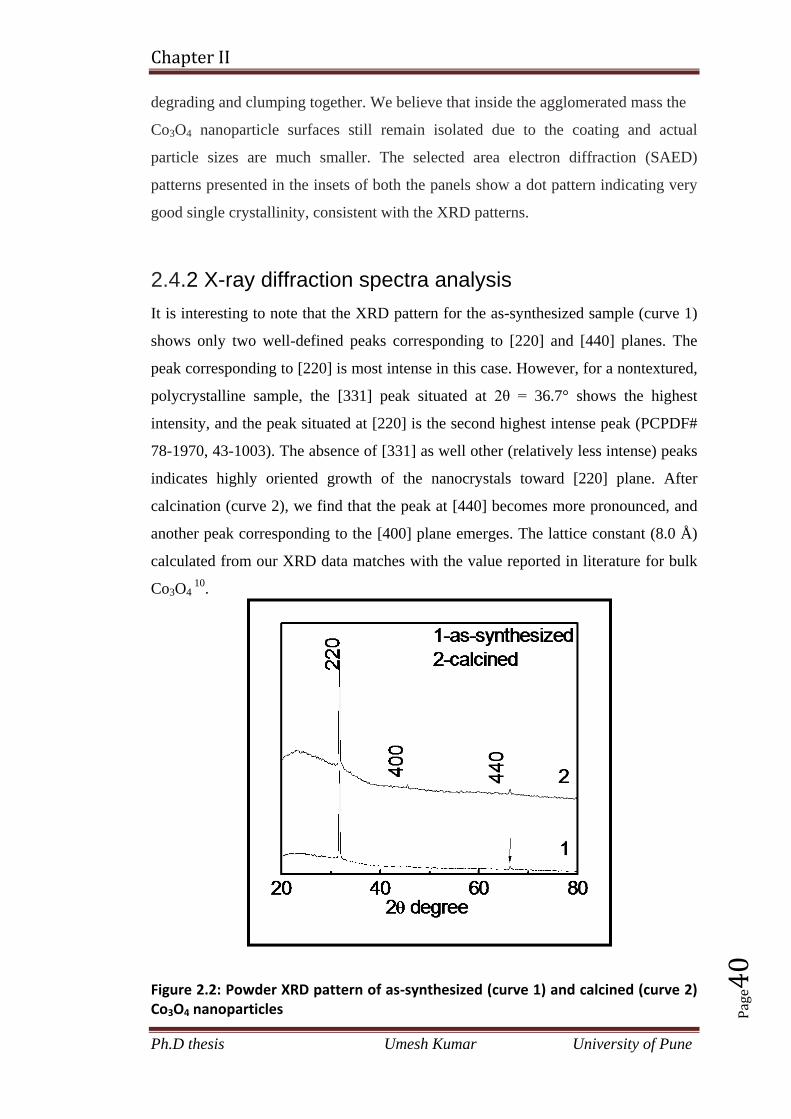
Chapter II
Ph.D thesis Umesh Kumar University of Pune
Pag
e40
degrading and clumping together. We believe that inside the agglomerated mass the
Co3O4 nanoparticle surfaces still remain isolated due to the coating and actual
particle sizes are much smaller. The selected area electron diffraction (SAED)
patterns presented in the insets of both the panels show a dot pattern indicating very
good single crystallinity, consistent with the XRD patterns.
2.4.2 X-ray diffraction spectra analysis
It is interesting to note that the XRD pattern for the as-synthesized sample (curve 1)
shows only two well-defined peaks corresponding to [220] and [440] planes. The
peak corresponding to [220] is most intense in this case. However, for a nontextured,
polycrystalline sample, the [331] peak situated at 2θ = 36.7° shows the highest
intensity, and the peak situated at [220] is the second highest intense peak (PCPDF#
78-1970, 43-1003). The absence of [331] as well other (relatively less intense) peaks
indicates highly oriented growth of the nanocrystals toward [220] plane. After
calcination (curve 2), we find that the peak at [440] becomes more pronounced, and
another peak corresponding to the [400] plane emerges. The lattice constant (8.0 Å)
calculated from our XRD data matches with the value reported in literature for bulk
Co3O4 10
.
Figure 2.2: Powder XRD pattern of as-synthesized (curve 1) and calcined (curve 2) Co3O4 nanoparticles

Chapter II
Ph.D thesis Umesh Kumar University of Pune
Pag
e41
2.4.3 HRTEM analysis
To confirm the crystallinity and shape of the particles, high-resolution transmission
electron microscopy (HR-TEM) investigation were performed on as-synthesized
particle (figure 2.3), where HR image (A) and SAED pattern (B) could be seen. In
figure A, highly crystalline lattice was seen clearly even for as-synthesized particles
with lattice-plane corresponding to [311] with d value of 2.4 Å (highest intense)
which was not seen in the XRD pattern (Figure 2.2). The SAED image (B) shows a
nice dot pattern indexed for [400] and [440] planes. In figure 2.3C-E, HR-TEM
images and SAED pattern for the calcined particles were shown. Here, C and D
again show highly crystalline particles with lattice planes [311] and [220]
corresponding to the most intense and second most intense peaks reported for bulk
Co3O4. The SAED pattern (E) could be indexed for [331] and [440]. Here it is quite
interesting to note that phase formed by the microbial method is quite pure as any
indication of CoO phase was not observed. This is probably due to the fact that at
Figure 2.3: HR-TEM images and selected area diffraction (SAED) patterns for as-synthesized Co3O4 nanoparticles (panels A & B) and for calcined nanoparticles (panels C, D & E)

Chapter II
Ph.D thesis Umesh Kumar University of Pune
Pag
e42
room temperature the formation of Co3O4 is thermodynamically favorable,25
and
only after heating Co3O4 above 930 °C (in reducing environment), it gets
transformed into CoO phase25
.
2.4.4 X-ray Photo-electron Spectroscopy (XPS) analysis.
To investigate the purity of Co3O4 phase as well as presence of proteins, X-ray
photoemission spectroscopy measurements were performed, which is a highly
surface sensitive technique. As-obtained XPS core level spectra were background
corrected using the Shirley algorithm, and chemically distinct species were resolved
using a nonlinear least-squares fitting procedure. The core level binding energies
(BE) were aligned with the carbon binding energy of 285 eV. In Figure 2.4, the
Figure 2.4: XPS spectra of as-synthesized (A-D), calcined (E-H) Co3O4 nanoparticles and cobalt-acetate (I). The solid lines show deconvoluted curve-fits
background-corrected XPS spectra for as-synthesized (panels A-D) and calcined
(panels E-H) Co3O4 nanoparticles were compared. In (Figure 2.4A), the carbon 1s
core level spectra shows well-defined (deconvoluted) peaks at the binding energies
282, 285, 286, and 288 eV, where the peak at 285 eV is due to the C 1s core level
transition originating from hydrocarbon chains and subsequent peaks situated at 286
and 288 eV are due to the presence of R-carbon and -COOH groups present in the
proteins, respectively26
. The peak at lower binding energy of ~282 eV indicates the
presence of aromatic carbon due to the protein. It should be noted that after
calcination (panel E) the peak at 286 eV disappears due to the partial
removal/degradation of the proteins. Panels B and F show N 1s core level spectra for
as-synthesized and calcined samples where the peak at 398 eV is due to the N 1s core

Chapter II
Ph.D thesis Umesh Kumar University of Pune
Pag
e43
level transitions and the peak at 400 eV is due to possible cationic state of nitrogen
present in protein-nanoparticle complex. The peaks at 532 eV shown in panels C and
G correspond to the O 1s core level transition. The peaks shown in panels D and H
correspond to Co 2p core level spectra indicating the presence of four peaks at BE
around 782, 788, 797, and 803 eV. Among these peaks, the peaks at binding energies
782 and 797 eV are due to spin–orbit splitting in the 2p level—2p3/2
and 2p1/2
correspondingly with an energy gap of 15 eV. It should be noted here that shift of the
peaks 2p3/2
and 2p1/2
from 778 and 793 eV correspondingly to the higher binding
energies indicates absence of cobalt metal27
. The remaining peaks at 789 and 804 eV
are satellite peaks which are weaker in intensity28,29
. For the octahedrally coordinated
cobaltous ion (Co2+
), the 2p3/2
peak is split by nearly 6.2 eV to form a satellite peak
at 788.2 eV and for the tetrahedrally coordinated one; the splitting is around 5.3 eV
to form the satellite peak at 787.3 eV28,29
. In our case, these two satellite peaks are
seen as a broad peak situated at around 788 eV. On the other hand, for Co 2p1/2
levels, both 6- and 4-fold coordination ions have about 6.2 eV satellite splitting
which gives the satellite peak at around 803.2 eV as seen in our case also. Overall,
the cobalt 2p spectrum for Co3O4 is considered to be the sum of spectra of Co2+
and
Co3+
. A comparison between the panels D and H show that after calcination (panel
H) the peaks become more intense. To further investigate the presence of Co3+
in
microbial synthesized Co3O4, we decided to compare D and H with the XPS spectra
of cobalt acetate shown in panel I. In sharp contrast, we can see that the peaks in the
precursor molecule (due to just Co2+
) are quite sharp in comparison to D and H
where the peaks are quite broad, which indicates that the peak broadening in D and H
is due to the contribution from Co3+
as well as due to the change in the chemical
environment. Here it is worth mentioning that, in contrast to other neighbouring
spinels such as Fe3O4 and Mn3O4; Co3O4 is thermodynamically stable at room
temperature (surfaces of Fe3O4 and Mn3O4 readily convert to Fe2O3 and Mn2O3,
respectively). In the case of Fe3O4 and Mn3O4, XPS may not show a contribution
from Fe3+
and Mn3+
; however, on the other hand, Co3O4, being a stable phase, does
show a peak corresponding to Co3+
as discussed above 28,29
. Another reason behind
the contribution of Co3+
is that Co2+
are located at the tetrahedral sites (A) giving net
magnetic moment, and Co3+
(diamagnetic) occupy octahedral B-sites; therefore, due
to the absence of any interaction between both of these ions in photoelectron

Chapter II
Ph.D thesis Umesh Kumar University of Pune
Pag
e44
emission process, they should give intrinsically different spectral lines which are
seen as a broadened peak in our case28,29
.
2.4.5 FTIR spectra and SDS-PAGE analysis
Figure 2.5: Graph showing FTIR spectra of precursor (1), calcined (2) and asprepared (3) taken in diffuse reflectance mode (A). Protein profile of extracellular proteins from Brevibacterium casei obtained by running 10% SDS
In order to determine the presence of bond between cobalt and oxygen (Co-O) in
Co3O4 nanoparticles FTIR was taken for asprepared and calcined samples. Figure 2.5
A shows the FTIR spectrum recorded from the cell free extracellular supernatant,
collected after 72 h of reaction between Brevibacterium casei. and precursor salt
(cobalt acetate). In figure 2.5 A, curve-2 and 3 shows the FTIR spectra recorded from
the calcined and as synthesized sample of Co3O4 nanoparticles respectively while
curve-1 is FTIR spectra recorded from cobalt acetate alone. As expected, curve-1
does not show any Co-O vibration band specific to Co3O4. The stretching of Co-O
bond in Co3O4 is usually seen at around 583 cm-1
and 664 cm-1
, whereas in this case,
these peaks are shifted to 620 cm-1
and 695 cm-1
respectively30,31
. This may be due to
the change in the chemical environment because of the proteins present in the
samples. Further to investigate the protein/proteins responsible for nanoparticles
synthesis 10% SDS Polyacrylamide gel electrophoresis was performed for both
supernantants collected from treated and untreated cells. Figure 2.5 B shows the
SDS-PAGE profile obtained from the extracellular protein of Brevibacterium casei.
culture supernatant in absence (lane-2) and presence (lane-3) of cobalt acetate. In
comparison with the control (lane-2), it can be clearly observed that there are two
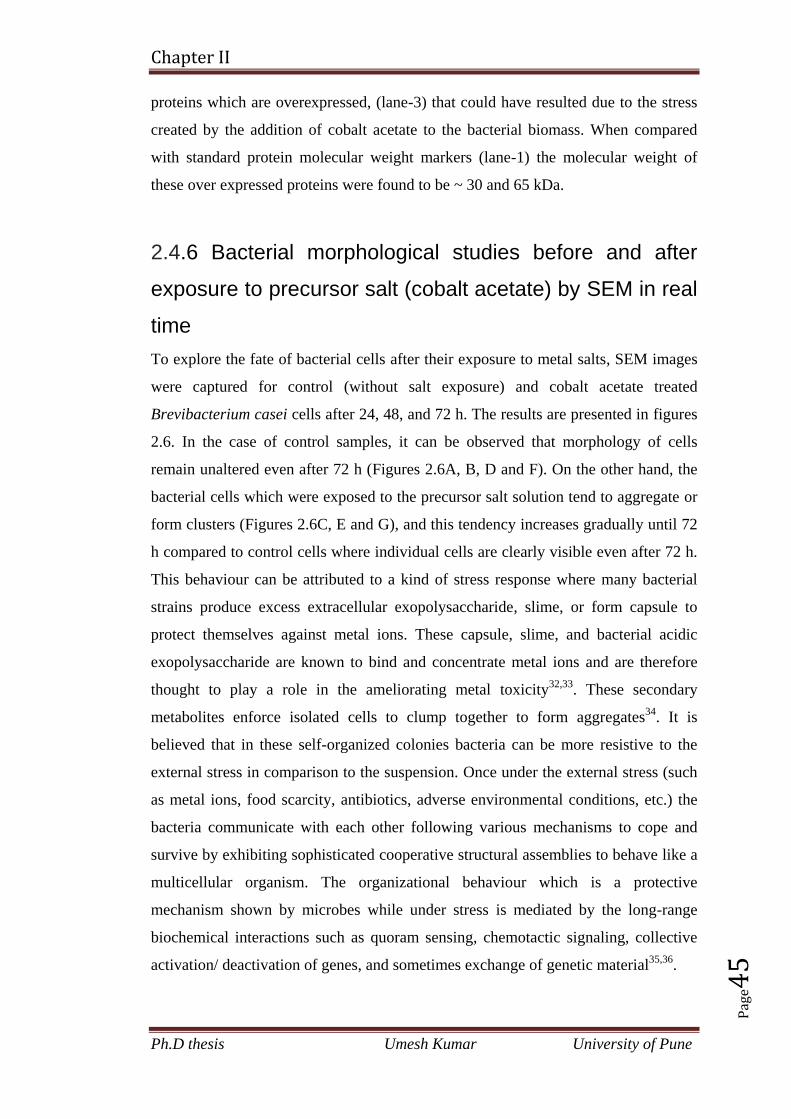
Chapter II
Ph.D thesis Umesh Kumar University of Pune
Pag
e45
proteins which are overexpressed, (lane-3) that could have resulted due to the stress
created by the addition of cobalt acetate to the bacterial biomass. When compared
with standard protein molecular weight markers (lane-1) the molecular weight of
these over expressed proteins were found to be ~ 30 and 65 kDa.
2.4.6 Bacterial morphological studies before and after
exposure to precursor salt (cobalt acetate) by SEM in real
time
To explore the fate of bacterial cells after their exposure to metal salts, SEM images
were captured for control (without salt exposure) and cobalt acetate treated
Brevibacterium casei cells after 24, 48, and 72 h. The results are presented in figures
2.6. In the case of control samples, it can be observed that morphology of cells
remain unaltered even after 72 h (Figures 2.6A, B, D and F). On the other hand, the
bacterial cells which were exposed to the precursor salt solution tend to aggregate or
form clusters (Figures 2.6C, E and G), and this tendency increases gradually until 72
h compared to control cells where individual cells are clearly visible even after 72 h.
This behaviour can be attributed to a kind of stress response where many bacterial
strains produce excess extracellular exopolysaccharide, slime, or form capsule to
protect themselves against metal ions. These capsule, slime, and bacterial acidic
exopolysaccharide are known to bind and concentrate metal ions and are therefore
thought to play a role in the ameliorating metal toxicity32,33
. These secondary
metabolites enforce isolated cells to clump together to form aggregates34
. It is
believed that in these self-organized colonies bacteria can be more resistive to the
external stress in comparison to the suspension. Once under the external stress (such
as metal ions, food scarcity, antibiotics, adverse environmental conditions, etc.) the
bacteria communicate with each other following various mechanisms to cope and
survive by exhibiting sophisticated cooperative structural assemblies to behave like a
multicellular organism. The organizational behaviour which is a protective
mechanism shown by microbes while under stress is mediated by the long-range
biochemical interactions such as quoram sensing, chemotactic signaling, collective
activation/ deactivation of genes, and sometimes exchange of genetic material35,36
.
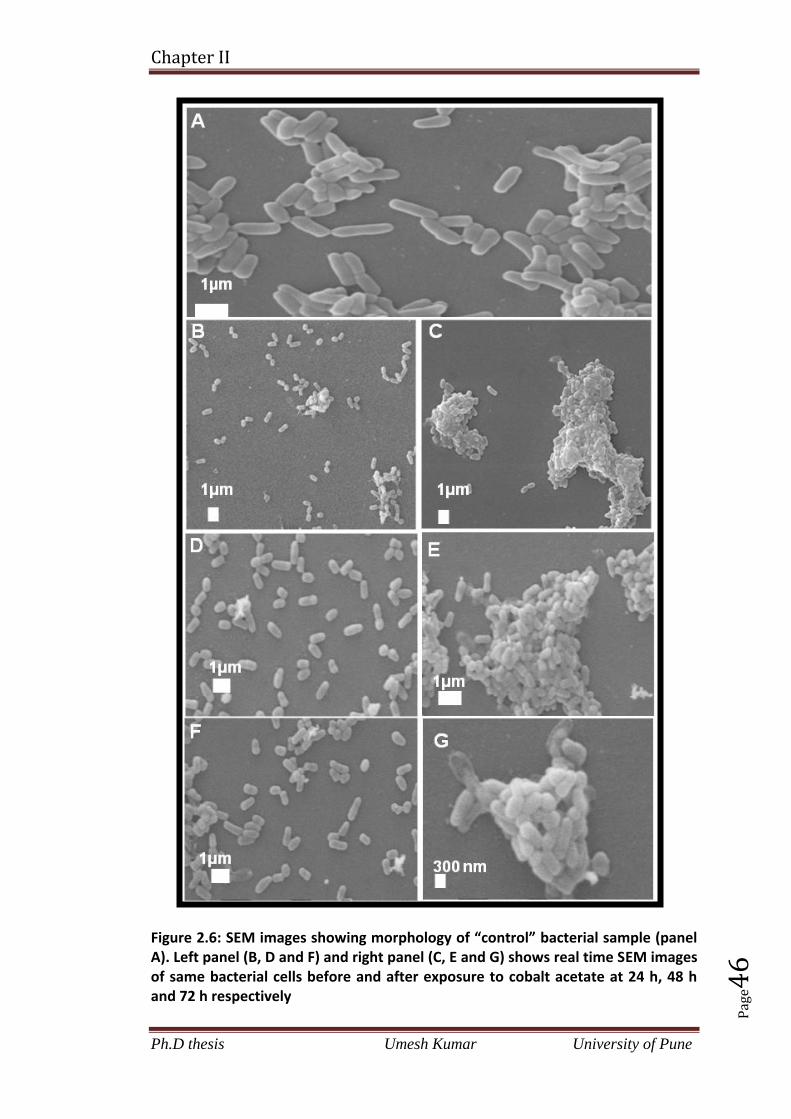
Chapter II
Ph.D thesis Umesh Kumar University of Pune
Pag
e46
Figure 2.6: SEM images showing morphology of “control” bacterial sample (panel A). Left panel (B, D and F) and right panel (C, E and G) shows real time SEM images of same bacterial cells before and after exposure to cobalt acetate at 24 h, 48 h and 72 h respectively
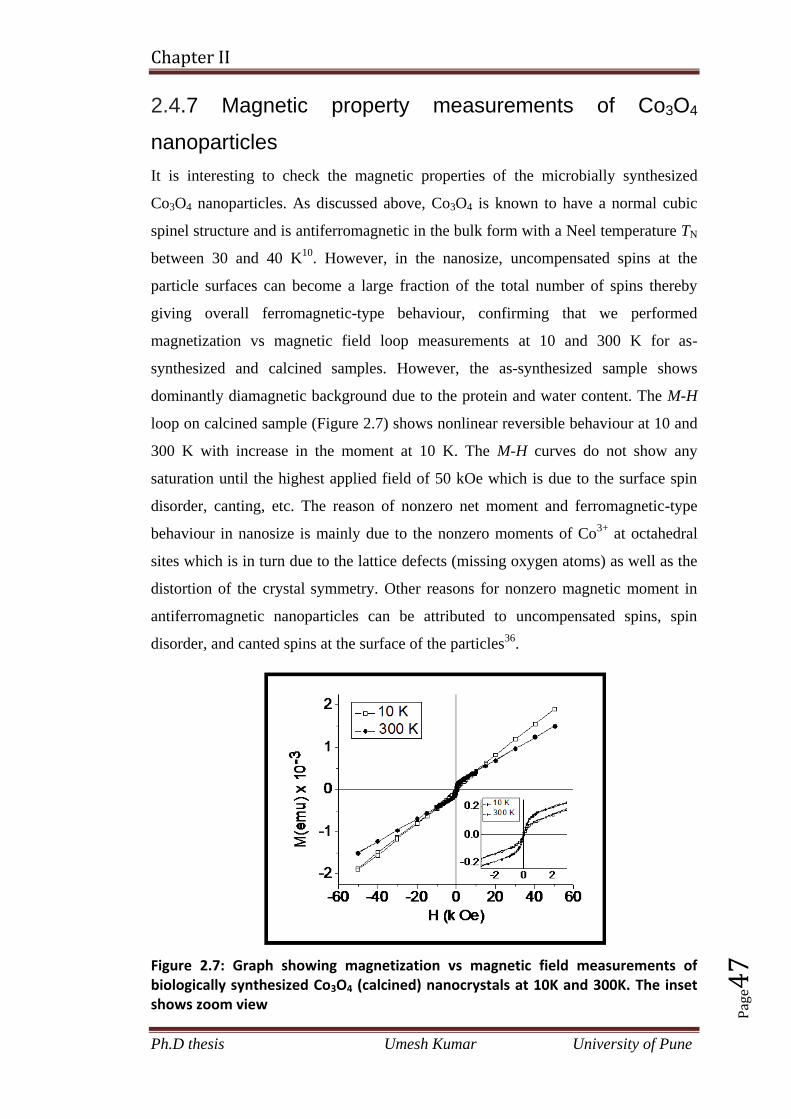
Chapter II
Ph.D thesis Umesh Kumar University of Pune
Pag
e47
2.4.7 Magnetic property measurements of Co3O4
nanoparticles
It is interesting to check the magnetic properties of the microbially synthesized
Co3O4 nanoparticles. As discussed above, Co3O4 is known to have a normal cubic
spinel structure and is antiferromagnetic in the bulk form with a Neel temperature TN
between 30 and 40 K10
. However, in the nanosize, uncompensated spins at the
particle surfaces can become a large fraction of the total number of spins thereby
giving overall ferromagnetic-type behaviour, confirming that we performed
magnetization vs magnetic field loop measurements at 10 and 300 K for as-
synthesized and calcined samples. However, the as-synthesized sample shows
dominantly diamagnetic background due to the protein and water content. The M-H
loop on calcined sample (Figure 2.7) shows nonlinear reversible behaviour at 10 and
300 K with increase in the moment at 10 K. The M-H curves do not show any
saturation until the highest applied field of 50 kOe which is due to the surface spin
disorder, canting, etc. The reason of nonzero net moment and ferromagnetic-type
behaviour in nanosize is mainly due to the nonzero moments of Co3+
at octahedral
sites which is in turn due to the lattice defects (missing oxygen atoms) as well as the
distortion of the crystal symmetry. Other reasons for nonzero magnetic moment in
antiferromagnetic nanoparticles can be attributed to uncompensated spins, spin
disorder, and canted spins at the surface of the particles36
.
Figure 2.7: Graph showing magnetization vs magnetic field measurements of biologically synthesized Co3O4 (calcined) nanocrystals at 10K and 300K. The inset shows zoom view

Chapter II
Ph.D thesis Umesh Kumar University of Pune
Pag
e48
2.5 Conclusion
Here we report for the first time that Co2+
was supplied to the biological system in
the form of cobalt acetate, but the nanoparticles formed showed the presence of both
Co2+
and Co3+
as discussed earlier. This change in oxidation state requires the
presence of Brevibacterium casei which has been supported by our XPS studies. We
believe that the change in oxidation state is either due to one of the mechanisms
discussed above or because of a totally new hitherto unknown mechanism working in
Brevibacterium casei. Such type of oxidation mechanism has been reported for other
metals as well; for example, arsenite oxidase converts As(III) to As(V) and arsenate
reductase converts As(V) to As(III)37
.
2.6 References
1. Dickson, D.P.E. Nanostructured magnetism in living systems. J. Magn. Magn.
Mater. 1999, 203, 46–49.
2. Mann, S. (ed.) Biomimetic Materials Chemistry 1996, VCH Publishers.
3. Stolz, J. F.; Basu, P.; Oremland, R.S. Int. J. Microbiol. 2002, 5, 201.
4. Bruins, M. R.; Kapil, S.; Oehm, F. W. Ecotox. Environ. Safe. 2000, 45, 198.
5. ―Our Planet, Our Health‖; Report of the World Health Organization on Health and
Environment, Oxford University Press, Oxford, 1992.
6. Sabry, S. A.; Ghozlan, H. A.; Abou-Zeid, D. M. J. Appl. Microbiol. 1997, 82,
245.
7. Bharde, A.; Wani, A.; Shouche, Y.; Pattayil, A. J.; Prasad, B. L. V.; Sastry, M. J.
Am. Chem. Soc. 2005, 127, 9326.
8. Bansal, V.; Poddar, P.; Ahmad, A.; Sastry, M. J. Am. Chem. Soc. 2006, 128,
11958.
9. Kowshik, M.; Ashtaputre, S.; Kharrazi, S.; Vogel W.; Urban J.; Kulkarni S. K.;
Paknikar K. M. Nanotechnol. 2003, 14, 95.
10. Roth, W. L.; J. Phys. Chem. Solids. 1964, 25, 1.
11. Poddar, P.; Sahoo, Y.; Srikanth, H.; Prasad, P. N. App. Phys. Lett. 2005, 87,
062506.
12. Poddar, P.; Fried, T.; Markovich, G.; Sharoni, A.; Katz, D.; Wizansky T.; Milo,
O. Eur Phys Lett. 2003, 64, 98.
13. Poddar, P.; Fried, T.; Markovich, G. Phys. Rev. B 2002, 65, 172405.
Chapter II
Ph.D thesis Umesh Kumar University of Pune
Pag
e49
14. Poddar, P.; Wilson, J. L.; Srikanth, H.; Yoo, Y. H.; Wereley, N. M.; Kotha, S.;
Barghouty, L.; Radhakrishnan, R. J. Nanosci. Nanotech. 2004, 4, 192.
15. Poddar, P.; Wilson, J. L.; Srikanth, H.; Morrison, S. A., Carpenter, E. E.
Nanotechnol. 2004, 15, S570.
16. Bharde, A.; Wani, A.; Shouche, Y.; Joy, P. A.; Prasad B. L. V.; Sastry, M. J. Am.
Chem. Soc. 2005, 127, 9326.
17. Checa, S. K.; Espariz, M.; Audero, M. E.; Botta, P. E.; Spinelli, S. V.; Soncini, F.
C. Mol. Microbiol. 2007, 63, 1307.
18. Rodrigue, A.; Effantin, G.; Mandrand-Berthelot M. A. J Bacteriol. 2005, 187,
2912.
19. Liesegang, H.; Lemke, K.; Siddiqui, R A.; Schlegel, H. G. J. Bacteriol. 1993,
175, 767.
20. Schmidt, T.; Schlegel, H. G. J Bacteriol. 1994, 176, 7045.
21. Nies, D. H. FEMS Microbiol. Rev. 2003, 27, 313.
22. Bharde, A.; Sastry, M. J. Nanosci. Nanotechnol. 2007.
23. Dhakephalker, P. K.; Chopade B. A. BioMetals. 1994, 7, 67.
24. Laemmli, U. K. Nature. 1970, 227, 680.
25. Wu, R. J.; Wu, J. G.; Tsai, T. K.; Yeh, C. T. Sensor Actuat B-chem. 2006, 120,
104.
26. Bansal, V.; Rautaray, D.; Bharde, A.; Ahire, K.; Sanyal, A.; Ahmad, A.; Sastry,
M. J. Mater. Chem. 2005, 15, 2583.
27. Girardon, J.; Lermontov, A. S.; Gengembre, L.; Chernavskii, P. A.; Griboval-
Constant, A.; Khodakov, A. Y. J. Cata. 2005, 230, 339.
28. Oku, M.; Hirokawa, K. J. Electron Spectrosc relat Phenom. 1976, 8, 475.
29. Hirokawa, K.; Honda, F.; Oku, M.; J. Electron Spectrosc Relat Phenom. 1975, 6,
333.
30. Cao, A.M.; Hu, J.S.; Liang, H.P.; Song, W.G.; Wan L.J.; He, X.L.; Gao, X. G;
Xia, S.H. J. Phys. Chem. B 2006, 110, 15858.
31. He, T.; Chen, D.; Jiao, X. Chem. Mater. 2004, 16, 737.
32. Zhang, Y.; Jock, S.; Geider K. Mol Gen Genet. 2001, 264, 732.
33. Richau, J. A.; Choquenet, D.; Fialho, A. M; Correia, I. Res. Microbiol. 1997,
148, 251.
34. Tang, Y. J.; Ashcroft, J. M.; Chen, D.; Min,G.; Kim,C. H.; Murkhejee,B.;
Larabell,C.; Keasling, J. D; Chen, F. F. Nano Lett. 2007, 7, 754
Chapter II
Ph.D thesis Umesh Kumar University of Pune
Pag
e50
35. Jacob, E. B.; Becker, I.; Shapira, Y.; Levine H. Trends Microbiol. 2004, 12, 366.
36. Jacob, E. B.; Cohen, I.; Golding, I.; Gutnick, D. L.; Tcherpakov, M.; Helbing, D.;
Ron, I. G.; Physica A. 2000, 282, 247.
37. Mukhopadhyay, R.; Rosen, B. P.; Phung, L. T.; Silver, S. FEMS Microbiol. Rev.
2002, 26, 311.

CHAPTER-III Measurement of
biophysical properties of
bacterial cells under stress
due to the exposure of
Cobalt acetate during
microbial synthesis of
Co3O4 nanoparticles

Chapter III
Ph.D Thesis Umesh Kumar University of Pune
Pag
e51
Measurement of biophysical properties of bacterial cells
under stress due to the exposure of Cobalt acetate during
microbial synthesis of Co3O4 nanoparticles
In this chapter we have shown, the use of AFM force-distance curves on bacterial
cells, to directly monitor the real time changes in the surface-topography, surface-
adhesion, indentation-depth, and Young’s modulus of a metal-tolerant marine
bacterium, Brevibacterium casei, isolated from the coast of the Arabian Sea after its
exposure to the Co2+
during the process of biosynthesis of nanoparticles. This chapter
describes significant changes in the morphology as well as elastic and adhesive
properties of the Brevibacterium casei, where an increase in the adhesive properties
and the indentation depth of the bacterial surfaces and a decrease in the cell stiffness
after several hours of exposure to the cobalt acetate were observed. We have
discussed both qualitative and quantitative analysis of the force-spectroscopy data in
details in this chapter.

Chapter III
Ph.D Thesis Umesh Kumar University of Pune
Pag
e52
3.1 Introduction
A new microscopy technique, namely atomic force microscopy (AFM), emerged in
the late 1990s and offered great promise for high-resolution imaging and enabling
imaging under physiological conditions1,2
. Three intrinsic advantages of this
technology have attracted much attention of researchers interested in cellular biology
and cellular physical chemistry. First, AFM offers high resolution. Molecular
resolution, for instance, at a sub-nanometer level, was achieved for inorganic
crystals3 as well as protein crystals
4. Applications of AFM in cellular structure
characterization also proved to be very encouraging5-7
. Important structural features,
such as stress fibers, were visualized8. Second, time-dependent imaging in near-
physiological media enabled many dynamic processes to be visualized in situ and in
real time, such as the identification of a new membrane structure by Jena et al., “the
porosome”, first in the apical plasma membrane of pancreatic acinar cells and
subsequently in neurons, where secretory vesicles specifically dock and fuse9-11
.
Other examples include the activation of human platelets12
, the transport of
intracellular particles13
, and the spreading of a Kupffer cell14
. Third, AFM enables
physical property measurements locally and globally on a single cell. For example,
measuring adhesion between an AFM tip and cellular receptor, or single molecular
forces15,16
, enables the mapping of the distribution of heat shock proteins (HSP) on
human umbilical venous endothelial cells (HUVECs)17
.
These kind of studies were done in force spectroscopy mode which is used to
measure interaction force and physical properties of biological samples. In this mode,
the cantilever deflection (i.e. force signal) is recorded as a function of its vertical
displacement (i.e. distance signal) as the tip approaches toward and retracts from the
sample to obtain a force–distance curve (Figure 3.1). Moreover, spatial resolution
can be achieved by generating a force–volume image through acquiring force –
distance curves at multi-locations. The new frontier in this area is using specifically
functionalized AFM tips to study protein unfolding/folding mechanisms and
recognize molecular groups on cell surface18,19
. Because of the above-mentioned
unique features AFM has been used in the investigation of microbiological samples
since the late 1980s, and it has become a rapidly growing field in the past decade20-23
.
Recently, atomic force microscopy (AFM) has turned out to be the instrument of

Chapter III
Ph.D Thesis Umesh Kumar University of Pune
Pag
e53
choice to image cells in their physiological environment both statically and
dynamically. AFM is currently the only technique that can image the surface of a
living cell down to molecular level resolution and in real time. Thus its importance in
the surface science of cellular systems is well beyond being just a complementary
technique to electron microscopy for topographical mapping.
The main advantage of using AFM at a relatively lower resolution
(micrometer level) is that the dynamic events, such as the cell growth, budding
processes, and changes in the cell surface morphology resulting from the treatment
with external agents (e.g., enzymes and antibiotics), can be directly tracked in real
time, providing a wealth of information. In this technique, either the bacterium is
attached to the AFM tip24
or the tip is used to probe the bacterium25
. Additionally,
using force spectroscopy (force distance curves), it is possible to precisely get
quantitative information about elasticity, plasticity, adhesiveness, and the
indentation-depth of the materials, including polymers, biological materials, thin
films, etc. at the nanolevel26
. In simpler words, it is a record of the controlled
approach and interaction of the tip and sample where the force involved such as the
electrostatic, magnetostatic, van-der Waals, capillary, and adhesive forces, etc. can
be probed at a level down to the pico-Newton. As we indicated earlier, the potential
of AFM for stable imaging as well as the acquisition of force-distance curves on the
living cells for extended time periods facilitates the study of dynamic processes due
to the external stimuli, which is not possible by any other method. Simply, we can
say that AFM technique relies on a basic principle where a sample attached to a
piezoelectric positioner is rastered beneath a sharp tip attached to a sensitive
cantilever spring. Undulations in the surface lead to the deflection of the cantilever,
which is monitored optically using a photodiode. Usually a feedback loop is
employed, which keeps the cantilever deflection constant and the corresponding
movement of the piezoelectric positioner thus generating the image27-29
. There are
several reports in the literature, where the force-distance spectroscopy has been
extensively and successfully used to locally measure the elastic properties of cellular
systems using it as a nanoindentation technique30-36
. It is now understood that the
stiffness of a cell surface, as observed by the indentation with an AFM tip, may
originate from various sources such as (a) the cell wall itself and/or (b) underlying
structures (cytoskeleton etc.) and/or (c) the pressure difference between the cell

Chapter III
Ph.D Thesis Umesh Kumar University of Pune
Pag
e54
interior and the exterior. Arnoldi et al. presented a theoretical model taking into
account different contributions to measure the cell stiffness by osmotic pressure
inside the bacterium (turgor pressure), the bending elasticity of the cell wall, and the
surface tension. The application of this model to the indentation curves on the
bacterium Magnetospirillum gryphiswaldense showed that the measured cell
response is dominated by the turgor pressure of 105 Pa. Similar values of the turgor
pressure were also found for the Pseudomonas aeruginosa and Enterococcus hirae
bacteria37
. It is reported in the literature that for the live mammalian cells, for
example, liver endothelial cells, the typical values of the elastic modulus are around
2 kPa and more than 100 kPa for the glutaraldehyde fixed cells38
. Various groups
have seen a similar effect for the E. coli K12 strains, where a 4-fold increase in the
cell stiffness was found due to the cell fixation.10 Higher values of the Young’s
modulus were also reported for isolated sheaths of the archeaon Methanospirrilum
hungatei GP1 (20-40 GPa)39
. In fact the force-plot measurements can also be used to
differentiate between the normal cells and the cancerous cells40
. It was reported that
in the case of living lung carcinoma cells, Young’s modulus ranges from 0.013 to 0.1
MPa31
whereas in the human platelets this value is in the range of 1-50 kPa32
. In the
case of prokaryotic cells such as B. subtillis, the value of Young’s modulus is as high
as 50 MPa whereas in case of eukaryotic cells such as S. cerevisiae, it is up to 110
MPa41
.
Hence due to the sensitive nature of this technique, we have used this
technique to answer a few of the fundamental questions related to the cell-
mechanism during the biosynthesis after exposure to the Co2+
. Below we present our
results on the force-distance spectroscopy to understand the effect of Co2+
exposure
during the synthesis of Co3O4 nanocrystals on the Brevibacterium cells. A detailed
quantitative and qualitative analysis of the changes in the nanomechanical properties
of cells such as Young’s modulus, indentation depth, and adhesiveness is discussed
in this chapter.
3.2 Materials and methods
For the atomic force microscopy measurements, the bacterial cells grown in Zobell
medium were harvested after incubation of 24 hours at 27 ºC and 200 rpm. These

Chapter III
Ph.D Thesis Umesh Kumar University of Pune
Pag
e55
cells were washed twice with Millipore water followed by centrifuging the cells at
6000 rpm for 5 min. Finally these cells were resuspended in Millipore water and
drop-casted on the freshly cleaved mica substrates for the AFM measurements. For
the real time observation of the Co2+
toxicity effects on the cells, the cells were
incubated with an aqueous solution of cobalt acetate. In this case the concentration of
the cobalt acetate was similar to the concentration used in our earlier study for the
synthesis of Co3O4 nanoparticles using the Brevibacterium casie culture (Previous
chapter). The cells were drop casted on the mica surfaces after 24, 48, and 72 hour of
incubation to study a time dependent effect on the cell physiology, and these results
were compared with those of the untreated cells (control i.e. 0 hour). Therefore this
study truly represents the changes in the morphology and mechanical properties
during as well as after the biosynthesis of the Co3O4 nanoparticles. Here the 0 hour
measurement corresponds to the time prior to reaction, the sample taken after 24
hour of incubation corresponds to the measurements “during” the synthesis process
and the corresponding surface changes on bacterial cells, and the 48 h sample
represent the time-scale after completion of the synthesis process and reflects the
corresponding surface changes. Lastly, the 72 hour sample corresponds to the time
interval well beyond the formation of nanoparticles. The atomic force microscopy
measurements were performed using a Multimode scanning probe microscope
equipped with a Nanoscope IV controller from Veeco Instrument Inc., Santa
Barbara, CA. All the AFM measurements were carried out under ambient conditions
using the soft tapping mode AFM probes model-Multi75Al purchased from Budget
Sensors, with proper precautions to avoid drying of the cells. The radii of tips used in
this study were less than 100 nm, and their height was 17 μm. The probe used had a
resonant frequency of 75 kHz with a 30 nm thick aluminum reflex coating on the
back side of the cantilever of the length 225 μm, and it was characterized for the
force constant using the thermal noise method42
using a Nanoscope V controller from
Veeco Instruments. The measured force constant was around 1.86 N/m (soft enough
for the biological cells). It is worth mentioning here that it is important to measure
the exact value of the force constant to convert the cantilever deflection and tip-
sample distance curve into the force-distance curve. The soft cantilevers are
susceptible to thermal fluctuations, which can be measured and analyzed (cantilever
movement) by AFM. The thermal noise spectrum is a plot of cantilever fluctuations

Chapter III
Ph.D Thesis Umesh Kumar University of Pune
Pag
e56
as a function of frequency; usually the greatest amplitude will be seen around the
cantilever resonance frequency, where there will be a maximum energy transfer. The
amplitude of fluctuations at a given temperature depends entirely upon the spring-
constant of the cantilever43
; therefore, the thermal resonance curve can be fitted into
a Lorentz function which allows calculation of the spring-constant. The deflection
sensitivity of the cantilever was calibrated at the end of the measurements by
drawing a line parallel to the 2-4 segment of a typical force plot curve (figure 3.1),
where the tip is already in contact with the hard surface, obtained on a freshly
cleaned silicon substrate which converts the cantilever deflection value, which is
Figure-3.1: Schematic diagram of typical force plot curve showing its different parts
generated in Volt units from the photodiode detectors, to distance units (the actual
cantilever deflection in nanometers). The calibration on the hard surface ensured that
the indentation depth is zero while doing the deflection sensitivity measurements. As
we know that deflection sensitivity is different for each cantilever and changes with
the cantilever length, thickness, coating, and contamination, etc. Besides this
cantilever sensitivity also depends on the position of the laser light on the cantilever
as well as the quality of the laser beam reflection (spot size, shape) from the
cantilever. Therefore all the necessary precautions were taken to have reproducible
deflection sensitivity.
Chapter III
Ph.D Thesis Umesh Kumar University of Pune
Pag
e57
3.3 Results and discussion
The loading and unloading cycles during force-distance measurements were shown
as schematic diagram in figure 3.1. The region “0-1” of the schematic diagram, when
the tip starts approaching the sample surface and the separation between them is
approximately 10-100 μm, there is no interaction between the tip and the sample.
Typically, for a tip-sample separation of a few micrometers to few tens of
nanometers, the long-range electrostatic forces contribute to the approach part of a
force-distance curve. When the separation reduces to below few tens of nanometers,
magnetostatic, van-der Waals, capillary, and other short-range forces play a
predominant role shown by region 0-1 in the schematic diagram just before the jump
into contact point. At around position 1, when the tip-sample separation is hardly a
few atomic distances, the tip comes into contact with the sample. Position 1 is also
called the jump-into-contact point, where the tip is pulled toward the sample due to
the capillary, van der Waals forces. The segment “3-4” of the schematic diagram
represents the event when the tip presses the sample surface and the cantilever bends
upward. This region is very informative as it gives an idea of the stiffness (Young’
modulus, elastic or plastic response, and viscoelastic response etc.) of the sample.
The segment “4-6” indicates that the tip is lifting-off the sample surface (a few
atomic distances to nanometers). This region gives an idea about the adhesive
properties of the sample which can be specific (ligand-receptor) or nonspecific
(chemical affinity, surface coatings etc.). Precisely the segment “5-6” of the figure
3.1 shows the point where the tip leaves contact with the surface. This is also known
as jump-off contact. It gives an idea of the adhesive forces, as we shall discuss ahead
in this chapter41
. It can be noticed that almost each part of the force-distance curves
carries significant and precise information about the tip-sample interaction. Surface
topography of the untreated cells assembled on the mica surface in 5 μm range using
the cantilever deflection image (error signal mode) was shown in figure 3.2 (left
panel), where a nice closed packed structure of the microbial cells without any
visible surface deformation or damage was observed. In the right panel of the same
figure, the section analysis of the untreated cells was shown. It is well known fact
that, in the microbial imaging due to roughness of the samples, the deflection image
provides much detailed information in comparison to the height image; therefore we

Chapter III
Ph.D Thesis Umesh Kumar University of Pune
Pag
e58
Figure 3.2: Deflection image of untreated Brevibacterium cells (0 h) where size of typical bacterial cell is measured
chose to present our data only the deflection images. The surface topography of the
cells incubated with the cobalt acetate is shown in figure 3.3; left, middle, and the
right panels depict the topography (deflection) images after 24, 48, and 72 hours. The
image after 72 hours was not captured as this is the maximum time required for the
Figure 3.3: Deflection image of Brevibacterium cells treated with 1mM cobalt acetate solution after 24, 48 and 72 hrs
complete synthesis of Co3O4 nanoparticles. In comparison to the earlier image of the
untreated cells (figure 3.2), a remarkable deformation in the cellular structure,
particularly with respect to aggregation of the cells, which increases as a function of
time (from 24 to 72 hours) due to the increasing exposure to Co2+
was clearly

Chapter III
Ph.D Thesis Umesh Kumar University of Pune
Pag
e59
observed. In earlier chapter the mechanism behind the aggregation and deformation
of the cells in response to the precursor salt, 1mM cobalt acetate, was explained in
detail. We believe that this is a kind of stress response where many bacterial strains
produce excess extracellular exopolysaccharide or slime or form capsules to protect
themselves against the metal ions. Capsules, slime, and bacterial acidic
exoploysaccharide are known to bind and concentrate metal ions and are therefore
thought to play a considerable role in ameliorating metal toxicity. These secondary
metabolites enforce isolated cells to clump together to form aggregates. It is believed
that in these self-organized colonies bacteria can be more resistive to the external
stress in comparison to the cells in suspension. Once under the external stress such as
metal ions, food scarcity, antibiotics, adverse environmental conditions etc. the
bacteria communicate with each other following various mechanisms to cope and
survive by exhibiting sophisticated cooperative structural assemblies to behave like a
multicellular organism. This organizational behaviour which is a protective
mechanism shown by microbes while under stress, is mediated by series of
biochemical interactions such as quoram sensing, chemotactic signaling, collective
activation/deactivation of genes, and sometimes the exchange of genetic material. To
further explore the effect of the exposure of the cells to the Co2+
such as presence of
exopolysaccharide at the cell surfaces leading to their aggregation as mentioned
above and to see the change in their nanomechanical behaviour due to the
deformation during the microbial synthesis of Co3O4 nanoparticles, force-distance
spectroscopy measurements were performed on several cell samples taken both
during and after the synthesis of nanoparticles. For this purpose, the desired bacterial
cell was focussed after getting the topography image (figure 3.3) and the force-
distance data was collected at the center of each cell. Results on the cells treated with
1 mM cobalt acetate for 24, 48, and 72 hours are presented in figure 3.4; obtained
keeping the speed of loading and unloading at 598 nm/s, which is acceptable for the
cellular systems. It should be noted that too high speed may lead to the distortion of
elastic response. The force-distance curves are also influenced by the time of
interaction and the load as well as the physicochemical and mechanical changes of
the cell surfaces caused by the cell immobilization. Taking these factors into account,
we performed the force-distance measurements on the control (figure 3.4, top-left
panel) samples and all the AFM parameters were kept unchanged (interaction time,

Chapter III
Ph.D Thesis Umesh Kumar University of Pune
Pag
e60
protocol for cell immobilization, load etc.). Spring-constant value of 1.86 N/m is
used to convert the cantilever deflection (nm) versus tip-sample distance (nm) curves
into the force (nN)-distance (nm) curves. The force exerted on the sample during
force measurements can be calculated using the relation
F = kd (1)
where k is the spring constant of the cantilever and d is the deflection produced by
the cantilever as a consequence of interaction between the tip and the sample surface.
The x-axis in these curves presents the distance travelled by the piezotube toward the
sample, and the y-axis shows the force experienced by the cantilever after interacting
with cells (in nano- Newtons). Details of the information represented by various parts
of the force-distance curve (loading-unloading cycles) were discussed earlier in
figure 3.1. From the “contact” regions of all the force-distance curves shown in the
figure 3.4, it was noticed that there is a significant difference between the approach
and retract branches of the curves apart from being slightly nonlinear. For ideal
elastic or hard surface there should not be any deviation or hysteresis in the contact
region. Hence the approach and withdrawal contact lines must overlap and the retract
curve should also cross the zero force level at the point where the approach curve
touches the zero force point after jumping to contact the surface31
. However, if the
surface of the sample is plastically deformable then during approach of the AFM tip,
the sample undergoes a deformation, and in the retract cycle, the sample does not
regain its original shape. It is considered that most of the samples show a mixed
(plastic and elastic) behaviour and the approach and retract curves rarely overlap on
each other as seen in the present case. This can also happen due to a small hysteresis
in the piezo in Z movement. In this case, the deviation in both the curves is due to the
plasticity (irreversible deformation) of the cell surfaces, which is also visible from
the indent left at the cell surface after the measurement. The best way to check the
instrument related artifact is to carry out the force-distance measurements on the hard
surface. We performed this measurement on the silicon surface and did observe only
a small hysteresis in the contact region.16
Therefore we conclude that, in case of
Brevibacterium, the deviations in both the curves are primarily due to the plasticity
(irreversible deformation) of the cell surfaces. Additionally, the fact that the retrace
curve is falling behind the trace curve also proves the plastic behaviour of cells. It

Chapter III
Ph.D Thesis Umesh Kumar University of Pune
Pag
e61
Figure 3.4: The force-distance curves obtained with control (0hr) and treated Brevibacterium cells (24, 48 and 72 hr)
should be noted that usually microbial cells do not show such type of behaviour due
to the presence of a rigid cell wall. However in this case, due to exposure to the metal
ions during Co3O4 nanoparticles synthesis and due to drying or dehydration during
sample preparation, the cells might show such type of plastic behaviour of their
surfaces. This is for the first time where a clear change in the topography of the
microbial cells as well as their mechanical behaviour has been observed during
nanoparticles synthesis. The nonlinearity in the contact region is again the signature
of the presence of the soft and deformable sample where the contact region of the
curve is a convolution of the viscoelesatic property of the sample and that of the
cantilever, as against the nondeformable tip or samples, the contact region should be
perfectly linear44
. Another important feature about the curves presented in figure 3.4
is the onset of the “jump-into the surface” region, which is characterized by the point

Chapter III
Ph.D Thesis Umesh Kumar University of Pune
Pag
e62
where the gradient of the attractive force exceeds the spring constant31
. This feature
is due to the attractive forces such as capillary forces and van der Waals forces
between the tip and the sample surface. These are mostly present under ambient
conditions, as we discussed earlier. Some groups have reported not to observe the
“jump-to-contact” region in their force-distance curves of the bacterial cells.
However, we believe that their observation is due to the dominant electrostatic
repulsion where both the bacterial cells and the AFM tip were probably negatively
charged, thereby masking the effect of the capillary forces45
. In fact, in almost all the
cases under normal relative humidity, the capillary forces are also strong enough to
mask the van der Waals forces. The absolute linearity of the approach or retract
curve in the noncontact region of the force curve shows absence of any long-range
attractive or repulsive forces in case of Brevibacterium cells used for Co3O4
nanoparticles synthesis.
3.3.1 Calculation of adhesive force and adhesion energy
on microbial cell surface
An additional hysteresis behaviour seen in figure 3.4 is discussed in this section. This
is observed as a large difference in horizontal (Z) position of the jump-to-contact and
jump-off contact points (also shown as regions 2 and 6 in the figure 3.1), which
shows up due to the tip-sample interaction and is a signature of the presence of
strong adhesion forces between tip and cellular surface probably originating from the
exopolysaccharide and other biomolecules at the surface. In normal imaging, this
adhesion loop is usually checked (on hard surface) to estimate the cleanliness of the
tip, and it should be minimized. However, in the present case, we have used it to
provide a quantitative evaluation of the variation of the adhesive forces at the cell
surfaces during the exposure to the Co2+
in biosynthesis. In fact, the area under the
adhesion loop (in the absence of Z-piezohysteresis) represents the work done in the
approach-retract cycle against the tip-sample interaction. The amount of force
required to snap the tip off the cell surface is given by the force just before the jump-
off contact and gives a measurement of the maximum tip-sample adhesion. However,
the measured adhesion force also depends on the time scale of the retraction; that is,
the faster the curve, the lower the adhesion. In present case, the time taken for the

Chapter III
Ph.D Thesis Umesh Kumar University of Pune
Pag
e63
retract curve was around 0.3 s, which is quite reasonable. The adhesive force
calculated by the force plot comes out to be 10, 40, 15, and 25 nN after 0 (control),
24, 48, and 72 hours of exposure of the cells to metal ions during the microbial
synthesis of Co3O4 nanoparticles, respectively. We calculated the adhesion energy
for various samples by calculating the area under the force-distance curve below the
zero force line of the adhesion loop (refer to the schematic diagram shown in figure
3.1), and these values were 0 h = -177.073 × 10⁻¹⁸ J, 24 h = -1211.45 × 10-18 J, 48 h
= -197.01 × 10⁻¹⁸ J, and 72 h = -1067.49 × 10-18 J. It is clear that the adhesive force
and adhesive energy show an enhancement during the biosynthesis after the exposure
of the bacterial cells to the metal ions, which is probably due to the presence of an
increasing amount of exopolysaccharide and other biomolecules at the surface as the
microbial reaction proceeds. To assess whether the cells have undergone
physiological changes upon treatment with the cobalt acetate as reaction time evolves
during the synthesis of Co3O4 nanoparticles, it is required now to do further
quantitative analysis to calculate the indentation depth from the force spectroscopy
data on the treated cells at 0, 24, 48, and 72 hours. The indentation made by the tip
on the cell surface during the force measurements is quantified by the indentation
depth, δ, which can be calculated following the schematic presentation shown in
figure 3.5 using the relation :
δ = d1 - d2 (2)
Figure 3.5: Schematic picture showing the method used for indentation depth calculation

Chapter III
Ph.D Thesis Umesh Kumar University of Pune
Pag
e64
where d1 and d2 correspond to the deflections produced by the approach curves on a
hard surface such as silicon (where the indentation would be essentially zero) and a
sample of interest, respectively41
. In the schematic diagram shown in figure 3.5, we
have explained the procedure that we followed to calculate the indentation depth at
various load values in the contact region. In this method, as a first step, the offsets in
the deflection and the stresses on the cantilever were taken into consideration. In the
second step, the point at which jump into contact occurs due to the instability
between the tip and the sample is made common for both the silicon reference and
the sample, as shown in schematic figure 3.5. Indentation depth versus force curves
(cantilever deflection) for various time-scales of Co2+
ion exposure during the
synthesis was shown in figure 3.6. It is clear that the indentation depth inside the
Figure 3.6: Loading force as a function of indentation depth for 0 hr, 24 hrs, 48 hrs and 72 hrs and their polynomial fits as calculated from the force-distance curves

Chapter III
Ph.D Thesis Umesh Kumar University of Pune
Pag
e65
cells generally increases with increasing force applied at the cell surface. It is
interesting to know however that, for a typical applied force (say 10 nN), the
indentation depth calculated for the untreated cells (0 hour) is smallest and the
indentation depth shows an overall increasing trend as the reaction progresses, which
is probably due to an overall decrease in the stiffness of the cell surface during the
synthesis as the exposure time to the metal ions increases.
These results clearly indicate a sharp change in the nanomechanical
properties of cells after exposing them to the toxic environment of transition metal
ions. As already mentioned, the nanomechanical properties of cells such as Young’s
modulus are extremely sensitive to the surrounding environment; therefore, next, we
calculated the Young’s modulus values for each step, before, during, and after the
synthesis of Co3O4 nanoparticles (various levels of exposure to the metal ions) using
the Hertz model46,47
. A more generalized model given by Sneddon et al. is an
extension of the Hertz model which takes into account the contribution from the
deformable tip41
. The Hertz model is a good choice for calculating the Young’s
modulus of cells, as this model assumes that it is the sample alone undergoing
deformation during the tip-sample interaction rather than the tip itself which is very
stiff in comparison to the biological material, as the Young’s modulus for the AFM
tips for silicon or silicon nitride is several orders of magnitude higher than that for
cells.
3.3.2 Calculation of Young,s modulus
Assuming the tip shape to be spherical or paraboloid, the Young’s modulus, E,
according to the Hertz model is given by the relation :
(3)

Chapter III
Ph.D Thesis Umesh Kumar University of Pune
Pag
e66
where F is the force experienced by the cantilever and the indentation depth, δ, can
be obtained from equations 1 and 2, respectively. R is the radius of curvature of the
tip used for the force measurement (estimated to be around 100 nm), and σ is
Poisson’s ratio. The value of Poisson’s ratio always comes in the range from 0 to 0.5,
but for the biological cells, σ typically lies in a range from 0.3 to 0.5.47,48
. In the
present case, we have taken Poisson’s ratio as 0.5, assuming the cells to be
incompressible during the force measurements. The calculated values of the Young’s
modulus using eq (3) at various levels of reaction as a function of indentation depth,
is shown in figure 3.7. It should be noted that as the biological cells are
inhomogeneous systems, their elastic properties varies with the indentation depth of
Figure 3.7: Typical Young’s moduli values as a function of indentation depth calculated using the Hertz model for 0, 24, 48 and 72 hrs
the material. From figure 3.7, we infer that for the control sample (0 hour) the
Young’s modulus shows a gradual increase as a function of indentation depth as

Chapter III
Ph.D Thesis Umesh Kumar University of Pune
Pag
e67
compared to the rest of the curves (for 24, 48, and 72 hours after the reaction starts).
It is also evident that, for larger indentation depth values, an approach toward a
plateau in the Young’s modulus values is seen for almost all the four cases. Usually
this situation arises when the applied load is proportional to the deformation
produced in the sample, indicating that the region is in the elastic limit. In this
region, the calculated values for Young’s modulus for 0, 24, 48, and 72 h of reaction
are 769.28 ( 73.07 MPa, 170.921 ( 38.93 MPa, 82.860 ( 20.42 MPa, and 209.526 (
6.14 MPa, respectively, which shows mostly a decreasing trend in elasticity of the
cells as the reaction progresses. As we discussed earlier, it is believed that the
Young’s modulus of a cell surface may originate from various sources such as (a) the
cell wall itself and/or (b) underlying structures (cytoskeleton etc.) and/or (c) a
pressure difference between the cell interior and the exterior (turgor pressure). The
metabolic processes inside the cells and at the cell surface might be greatly affected
by the presence of Co2+
, leading to the loss of turgor pressure and change in the
elastic properties of the cell wall itself as well. As seen in the topographical images
of the cells, we can conclude that these factors collectively lead to an overall drop in
the elasticity in case of Brevibacterium cells, although the approach to the plateau of
Young’s modulus as a function of indentation depth is faster in the 0 and 24 hours
samples. This saturation point is different for each sample depending upon their
exposure to the Co2+
, probably due to the clumping of cells during the microbial
synthesis of Co3O4 nanoparticles. Unexpected high values of Young’s modulus for
the 0 h sample (before reaction) indicate that the turgor pressure is maintained. As
the reaction progresses, we notice a decrease in the Young’s modulus values and
softness of the sample, which is probably due to loss of turgidity during the synthesis
process.
3.4 Conclusion
In summary, our force-spectroscopy measurements on the microbial cells show an
overall decrease in the Young’s modulus value and an increase in the adhesiveness
due to the secretion of the proteins and other biomolecules at the cell surfaces during
interaction of the cells with the cobalt acetate during the synthesis of Co3O4
nanoparticles. We believe that this is a kind of study where a detailed quantitative

Chapter III
Ph.D Thesis Umesh Kumar University of Pune
Pag
e68
and qualitative analysis before, during, and after the microbial synthesis of Co3O4
nanoparticles indicates the sensitivity of the micromechanical properties of cells to
the surrounding toxic environment.
3.5 References
1. Binnig, G.; Quate, C. F.; Gerber, C. Phys. Rev. Lett. 1986, 56, 930.
2. Drake, B.; Prater, C. B.; Weisenhorn, A. L.; Gould, S. A. C.; Albrecht, T. R.;
Quate, C. F.; Cannell, D. S.; Hansma, H. G.; Hansma, P. K. Science 1989, 243, 1586.
3. Ohnesorge, F.; Binnig, G. Science 1993, 260, 1451.
4. Muller, D. J.; Buldt, G.; Engel, A. J. Mol. Biol. 1995, 249, 239.
5. Butt, H. J.; Downing, K. H.; Hansma, P. K. Biophys. J. 1990, 58, 1473.
6. Radmacher, M.; Tillamnn, R. W.; Fritz, M.; Gaub, H. E. Science 1992, 257, 1900.
7. Haberle, W.; Horber, J. K. H.; Binnig, G. Force Microscopy on Living Cells 1991.
8. Hofmann, U. G.; Rotsch, C.; Parak, W. J.; Radmacher, M. J. Struct. Biol. 1997,
119, 84.
9. Schneider, S. W.; Sritharan, K. C.; Geibel, J. P.; Oberleithner, H.; Jena, B. P. Proc.
Natl. Acad. Sci. U.S.A. 1997, 94, 316.
10. Jena, B. P. J. Cell. Mol. Med. 2004, 8, 1.
11. Jena, B. P. Mol. Cells 2008, 26, 517.
12. Fritz, M.; Radmacher, M.; Petersen, N.; Gaub, H. E. J. Vac. Sci. Technol. B 1994,
12, 1526.
13. Schoenenberger, C. A.; Hoh, J. H. Biophys. J. 1994, 67, 929.
14. Rotsch, C.; Braet, F.; Wisse, E.; Radmacher, M. Cell Biol. Int. 1997, 21, 685.
Chapter III
Ph.D Thesis Umesh Kumar University of Pune
Pag
e69
15. Ebner, A.; Madl, J.; Kienberger, F.; Chtcheglova, L. A.; Puntheeranurak, T.; Zhu,
R.; Tang, J. L.; Gruber, H. J.; Schutz, G. J.; Hinterdorfer, P. Curr. Nanosci. 2007, 3,
49.
16. Dufrene, Y. F.; Hinterdorfer, P. Pflugers Arch. 2008, 456, 237.
17. Pfister, G.; Stroh, C. M.; Perschinka, H.; Kind, M.; Knoflach, M.; Hinterdorfer,
P.; Wick, G. J. Cell Sci. 2005, 118, 1587.
18. Dufrene, Y. F. Analyst. 2008a, 133, 297.
19. Muller, D.J.; Krieg, M.; Alsteens, D.; Dufrene, Y. F. Curr Opi Microbiol. 2009,
20, 4.
20. Dufrene, Y. F. Curr Opin Microbiol. 2003, 6, 317.
21. Dupres, V.; Alsteens, D.; Andre, G.; Verbelen, C.; Dufrene, Y. F. Nano Today.
2009, 4, 262.
22. Hinterdorfer, P.; Dufrene, Y. F. Nat Methods. 2006, 3, 347.
23. Morris, V. J.; Kirby, A. R.; Gunning, A. P. Imperial College Press, London.
1999.
24. Razatos, A. P.; et al. Abs. Pap. Am. Chem. Soc. 1998, 216, U271.
25. Velegol, S. B.; Logan, B. E. Langmuir 2002, 18 (13), 5256.
26. Butt, H. J.; Cappella, B.; Kappl, M. Surf. Sci. Rep. 2005, 59 (1-6), 1.
27. Binnig, G.; Quate, C.; Gerber, G. Phys. Rev. Lett. 1986, 56, 930.
28. Binnig, G.; Rohrer, H. Helv. Phys. Acta 1982, 55, 726.
29. Ralston, J.; Larson, I.; Rutland, M. W.; Feiler, A. A.; Kleijn, M. Pure Appl.
Chem. 2005, 77 (12), 2149.
30. Burnham, N. A.; Colton, R. J. J. Vacuum Sci. Technol. A 1989, 7, 2906.
31. Weisenhorn, A. L.; Khorsandi, M.; Kasas, S.; Gotzos, V.; Butt, H.
Nanotechnology 1993, 4, 106.

Chapter III
Ph.D Thesis Umesh Kumar University of Pune
Pag
e70
32. Radmacher, M.; Fritz, M.; Kacher, C. M.; Cleveland, J. P.; Hansma, P. K.
Biophys. J. 1996, 70 (1), 556.
33. Tomasetti, E.; Legras, R.; Nysten, B. Nanotechnology 1998, 9, 305.
34. Rotsch, C.; Jacobson, K.; Radmacher, M. Proc. Natl. Acad. Sci.U.S.A. 1999, 96
(3), 921.
35. Matzke, R.; Jacobson, K.; Radmacher, M. Nat. Cell Biol. 2001, 3 (6), 607.
36. Radmacher, M. At. Force Microsc. Cell Biol. 2002, 68, 67.
37. Arnoldi, M.; Fritz, M.; Bauerlein, E.; Radmacher, M.; Sackmann,E.; Boulbitch,
A. Phys. Rev. E 2000, 62 (1), 1034.
38. Braet, F.; Rotsch, C.; Wisse, E.; Radmacher, M. Appl. Phys. A: Mater. Sci. Proc.
1998, 66, S575.
39. Xu, W.; Mulhern, P. J.; Blackford, B. L.; Jericho, M. H.; Firtel, M.; Beveridge, T.
J. J. Bacteriol. 1996, 178 (11), 3106.
40. Cross, S. E.; Jin, Y. S.; Rao, J.; Gimzewski, J. K. Nat. Nanotechnol. 2007, 2 (12),
780.
41. Touhami, A.; Nysten, B.; Dufrene, Y. F. Langmuir 2003, 19 (11), 4539.
42. Levy, R.; Maaloum, M. Nanotechnology 2002, 13 (1), PII S0957- 4484 (02)
27598.
43. Hutter, J. L.; Bechhoefer, J. Rev. Sci. Instrum. 1993, 64 (11), 3342.
44. A-Hassan, E.; Heinz, W. F.; Antonik, M. D.; D’Costa, N. P.; Nageswaran, S.;
Schoenenberger, C. A.; Hoh, J. H. Biophys. J. 1998, 74 (3), 1564.
45. (35) Burks, G. A.; Velegol, S. B.; Paramonova, E.; Lindenmuth, B. E.; Feick, J.
D.; Logan, B. E. Langmuir 2003, 19 (6), 2366.
46. Brochu, H.; Vermette, P. Langmuir 2008, 24 (5), 2009.

Chapter III
Ph.D Thesis Umesh Kumar University of Pune
Pag
e71
47. Dulinska, I.; Targosz, M.; Strojny, W.; Lekka, M.; Czuba, P.; Balwierz, W.;
Szymonski, M. J. Biochem. Biophys. Methods 2006, 66 (1-3), 1.
48. Dimitriadis, E. K.; Horkay, F.; Maresca, J.; Kachar, B.; Chadwick, R. S. Biophys.
J. 2002, 82 (5), 2798.

CHAPTER-IV Lysozyme mediated size
controlled synthesis of
antimicrobial,
biocompatible noble metal
(Au and Ag) nanoparticles

Chapter IV
Ph.D Thesis Umesh Kumar University of Pune
Pag
e72
Lysozyme mediated size controlled synthesis of
antimicrobial, biocompatible noble metal (Au and Ag)
nanoparticles
The study of interaction between inorganic materials and biomolecules such as
proteins, enzymes, DNA etc. as well as living cells e.g. microbial or mammalian
cells is an important concern for various applications ranging from bio-sensors, drug
delivery, biofunctionalization for bone-implants up to green chemistry involving
biomimetic synthesis of inorganic materials. Inspired by array of proteins present in
nature, we chose lysozyme from hen egg protein as a model system to synthesize
nanoparticles of noble metals to understand the mechanism of interaction as well as
to use them for potential applications such as potent antibacterial agents. Here in this
chapter we have discussed the synthesis mechanism of gold and silver nanocrystals
at controlled pH and light conditions without using any known reducing agent. The
synthesis of gold nanoparticles is assisted by the presence of low concentration of

Chapter IV
Ph.D Thesis Umesh Kumar University of Pune
Pag
e73
Ag+
ions through the galvanic exchange. As-synthesized lysozyme capped
nanoparticles prepared by this method are biocompatible and retain antibacterial
property. With increasing interest in the biofunctionalization of noble metal
nanoparticles for various applications, it is important to precisely investigate the
functional groups responsible for binding and probable structural changes in the
biomolecules, as both are key factors affecting the bioactivity of these molecules.
However, it is not an easy task to probe these properties; especially for the bigger
molecules such as enzymes/proteins. Surface-enhanced Raman spectroscopy (SERS)
has been used extensively in the detection of biomolecules and study of their
conformation on the noble metal surfaces since its discovery because of its high
sensitivity. This technique is capable of detecting changes in the secondary structure
and the effects of surrounding environment on the biomolecule in the proximity of
nanoscopic rough metal surfaces. In this chapter, we have demonstrated the use of
this technique to precisely determine the functional groups responsible in the surface
capping of gold and silver nanoparticles synthesized by the hen egg white- lysozyme.
4.1 Introduction
Noble metallic nanoparticles such as gold and silver have potential applications in
the fields of physics, chemistry, biology and material science because of their shape
and size dependent physical and chemical properties1. Several well established
methods are known for synthesis of these nanoparticles2-4
however chemical
reduction of the metal salts by NaBH4 or other reducing agents is still the most
frequently used method among various synthetic routes. Nowadays people are
focusing their efforts on fabrication of bioactive and biocompatible nanoparticles for
a variety of applications. DNA5, peptides
6, and proteins
7 have been conjugated to the
protecting agents of nanoparticles through an intermediate or linking agents. Direct
conjugation of biocompatible agents (lipid bilayers8 and dendrimers
9) and
biomolecules (amino acid such as lysine10,11
) to nanoparticles has been achieved in
aqueous medium. Sun12
and Yacaman13
et al. have employed biomacromolecules e.g
globular protein, bovine serum albumin in the preparation of bovine serum albumin
(BSA)-conjugated silver sulfide (Ag2S) and gold nanoparticles. Among all the
biomolecules it is always fascinating to tag various kinds of enzymes (or biocatalyst).
There are several reports in literature where different research groups have

Chapter IV
Ph.D Thesis Umesh Kumar University of Pune
Pag
e74
immobilized different enzymes on the surface of nanoparticles (e.g. magnetic or
metal nanoparticles) keeping their activity intact. Most of the enzymes e.g. glucose
oxidase14
, cholesterol oxidase15
, Streptokinase16,17
etc. are immobilized covalently on
nanoparticles surface for use in clinical applications and sensors15
. Major challenge
with this techniques is to retain the enzyme activity after immobilization. Sometimes
enhancement in enzyme activity is also seen as in case of DhlA-(FeAP)3-(His)6 and
DhlA-(SiAP)2-(His)6 possibly due to positive conformational changes caused by
different ways of folding of tagged DhlA. In addition changes in protein shape could
also lead to change in rate of substrate diffusion and its binding characteristics
subsequently the altered enzymatic activity18
.
Recently gold nanoparticles synthesized with R-amylase where enzyme acts both as
reducing as well as capping agent, has been reported to retain the enzyme activity
after the preparation 19
. We chose lysozyme from hen egg protein as a model system
to synthesize nanoparticles of noble metals, gold and silver, to understand the
mechanism of interaction as well as to assess their use in applications such as potent
antibacterial and anti HIV20
agents. Lysozyme is a well studied enzyme consisting of
129 amino acid residues with a molecular weight of 14.4 kDa. It catalyzes hydrolysis
of β-1,4-linkages between N-acetylmuramic acid and N-acetyl-D-glucosamine
residues in peptidoglycan present in the cell wall of gram positive bacteria and the
linkage between N-acetyl-D-glucosamine residues in chitodextrins. It is a very well
characterized biomolecule containing Tyrosine as one of the aromatic amino acids
having phenoxy group which is considered to be responsible for interaction with the
metal ions21
.
Currently some groups have claimed achieving control over shape and size of metal
nanoparticle as well as their higher order assemblies by using small peptides21,22
.
Sandhage et al., have used selected peptides to synthesize metal oxide (TiO2, SiO2)
at room temperature23,24
. There are reports in literature where lysozyme has been
used to synthesize antibacterial silica or titania nanoparticles of amorphous nature
with diameters of hundreds of nanometers by a rapid, room-temperature precipitation
method, with encapsulation of lysozyme within the nanoparticles25
. Recently Eby et
al. have synthesized antibacterial silver nanoparticles in organic solution using
lysozyme as the reducing as well as capping agent and transferred it to aqueous
solution maintaining its biological activity26
. The use of proteins and peptides to

Chapter IV
Ph.D Thesis Umesh Kumar University of Pune
Pag
e75
direct the in vitro syntheses of inorganic materials is attractive for a number of
reasons; a few of these are highlighted here and detailed throughout this chapter. The
first and the foremost potential benefit is the production of material under reaction
conditions that are much milder than those used in traditional materials-processing
techniques. Selected peptides and proteins can facilitate the syntheses of inorganic
materials at or around the room temperature, in aqueous solutions, and at or near
neutral pH. The reduction of energy input and avoidance of organic solvents to
produce nanomaterials in the presence of proteins and peptides make bioenabled
synthesis inherently “green” process. The second major advantage in exploiting
biomolecules for materials synthesis is the exquisite control that proteins and
peptides can impose on the size, shape, chemistry, and crystal structure of the
inorganic product. This is important because these characteristics often dictate or
determine the properties of the synthesized material and thirdly, the peptides and
proteins offer the potential to produce materials with multiple functions and high
specificity. For example, proteins and peptides may direct the formation of
enzymatically active composites or generate materials that specifically recognize
substrates and self-assemble27
.
When it comes to interaction of lysozyme with various nanomaterials, one of the
previous work utilized α-Fe2O3 particles to adsorb lysozyme and α-lactalbumin on its
surface using electrostatic interactions28
. Based on the ion exchange interactions,
lysozyme was tagged onto Fe3O4 nanoparticles coated with polyacrylic acid (PAA).29
It should be noted here that in all these previous studies, people used Fourier
transformed infrared spectroscopy (FTIR) to investigate the interaction of lysozyme
molecules with the inorganic particles. However, using FTIR spectroscopy alone,
these previous studies could not clearly indicate the binding mechanism (the
functional group involved in the binding process) which is extremely important as
the final application of biofunctionalized nanoparticles purely rests on this issue.
Yang et al. studied lysozyme monolayer protected gold nanoparticles through FTIR
but it was not conclusive as they were again unable to show the functional group
responsible for surface capping30
. As we know that FTIR signals can be masked by
the O-H stretching and to avoid the O-H stretching, the sample is normally dried, but
due to this drying process, we lose the desired information about the biomolecules as
Chapter IV
Ph.D Thesis Umesh Kumar University of Pune
Pag
e76
drying up the molecules could also change the structure of the protein molecules on
the surface.
In this chapter lysozyme mediated synthesis of antibacterial, biocompatible
silver and gold nanoparticles were discussed where lysozyme acts as reducing as
well as surface capping agent. Out of these materials, the synthesis of gold
nanoparticles is assisted by the presence of meagre concentration of Ag+
ions through
the galvanic exchange. In this chapter, we have shown the use of surface-enhanced
Raman scattering technique (SERS) to investigate the binding mechanism between
enzyme and noble metal surfaces. The SERS technique is especially useful in the
investigation of biomolecules due to its high sensitivity and fluorescence quenching
when adsorbed on gold or silver surface. Moreover, this technique can be used to
detect the effect of surrounding environment on the molecule. In case of protein
studies, the conventional Raman spectroscopy can detect the presence of disulfide
bond and protein conformation, which is quite difficult by any other spectroscopy
technique. But Raman spectroscopy cannot predict the information of peptide
backbone, disulfide bond geometry, and local environment effect on the side chain of
the amino acid residues31
. The SERS can detect protein sites in direct contact with
the charged surface like silver or gold31
. The presence of strong bands of any group
in the spectra gives the information about the preferential interaction of the protein
sites with the charged surface. Recently various types of surface enhancement based
techniques have been a boon to the molecular detection and have enriched almost all
branches of science where the proximity to the rough surfaces of noble metals is used
to enhance the signal ranging from magnetooptic Kerr effect in Fe3O4 nanoparticles32
to surface enhanced infrared absorption,33-35
UV/vis absorption,36
flurorescence,37-40
circular-dichroism41
and Raman spectroscopy42-45
. Among these techniques, the
surface-enhanced Raman spectroscopy (SERS) has been particularly popular recently
as people are still discovering better and better enhancement by experimenting with
the surface structure and type of metals. Below, we present the lysozyme mediated
synthesis of antimicrobial, biocompatible silver and gold nanoparticles and our
results on the surface enhanced Raman spectroscopy to study the protein functional
moiety of lysozyme responsible to cap and interact with silver and gold nanoparticles
surfaces.

Chapter IV
Ph.D Thesis Umesh Kumar University of Pune
Pag
e77
4.2 MATERIALS AND METHODS
4.2.1 Materials
Lysozyme was purchased from Sigma-Aldrich Inc. This protein was used as received
throughout nanoparticles synthesis procedure. Chloroauric acid and silver nitrate
were purchased from Sisco Research Lab (SRL) and Merck, India respectively. For
all the syntheses, we used deionized water from Milli-Q water purification system.
4.2.2. Experimental details
4.2.2.1 Nanoparticle synthesis procedure
Lysozyme (1mg/ml) was used to synthesize gold (pH 4.5) and silver (pH 7)
nanoparticles. Silver nitrate (3 mM) and chloroauric acid (1 mM) were used as
precursors for gold nanoparticles synthesis. Minimum concentration of silver nitrate
required for gold nanoparticles synthesis is 0.1 mM. Silver nitrate (1 mM) was used
as precursor for silver nanoparticles synthesis.
4.2.2.2 Removal of silver chloride (AgCl) impurity from
nanoparticles solution
Lysozyme synthesized nanoparticles solution was treated overnight with 1%
ammonium hydroxide followed by dialysis using dialysis membrane with molecular
weight cut off, 12.5 kD. Dialysis was carried out for 24 hours against milli Q water at
room temperature with three changes every 8 hours.
4.2.2.3 Modifications of lysozyme
4.2.2.3.1 Heat denaturation of lysozyme
Preparation of denatured lysozyme. For the denaturation of lysozyme, 1mg/ml
solution was heated at 100 ºC for 10 minutes followed by quench cooling at 4 ºC.
The final volume was made up by adding fresh water to maintain the said
concentration.
4.2.2.3.2 Chemical modification of tyrosine residues of
lysozyme with N-Acetylimidazole (NAI)
Freshly prepared aqueous solution of NAI was used for acetylation of tyrosine
residues present in lysozyme. An aliquot from stock solution of NAI was added to

Chapter IV
Ph.D Thesis Umesh Kumar University of Pune
Pag
e78
aqueous solution of lysozyme (1mg/ml) to the effective concentration of 10 mM. The
reaction was incubated at room temperature for 30 minutes followed by dialysis for
24 hours against milli Q water with three changes every 8 hours to remove excess of
NAI. The resulting modified lysozyme was used for synthesis of nanoparticles.
4.2.2.3.3 Chemical modifications of tryptohan residues of
lysozyme with N-Bromosuccinimide (NBS)
Aqueous solution of NBS was freshly prepared using recrystallized NBS. Stock
solution of NBS was added to aqueous solution of lysozyme (1mg/ml) to the
effective concentration of 2 mM at room temperature for 30 minutes followed by
dialysis for 24 hours as described above. The resulting modified lysozyme was used
for synthesis of nanoparticles.
4.2.3 Cytotoxicity test i.e MTT (3,[4,5-dimethylthiazol-2-
yl]-2,5-diphenyltetrazolium bromide) assay
To determine the toxicity of nanoparticles MTT assay was performed following
Plumb46
method with slight modification. In brief, the cells i.e. HEK 293T, HELA
and CHO K1 (2000 cells/well in 100 µl of medium, Dulbecco modified eagles
medium) were seeded in a 96 well plate and allowed to adhere for 24 h at 37 ºC in a
5% CO2 95% air atmosphere. The medium (Annexure-II) was replaced with serum-
free medium containing different concentrations of lysozyme capped gold
nanoparticles and incubated for 24 h at 37 ºC. The supernatant was removed and 100
µl serum-free medium with 0.5 mg/ml MTT were added to each well and re-
incubated for another 3 h at 37 ºC. The MTT solution was carefully discarded and
100 µl of 2% SDS was added to each well and incubated for another 12 h. After 12 h,
10 µl of 5 N HCl was added in each well for solubilization of formazan crystals.
After solubilisation the supernatants were carefully collected and centrifuged at
10000 rpm for 1 minute to get rid of nanoparticles and re-dispensed in new 96 well
ELISA plates and absorbance was recorded at 570 nm, using a multiwell microplate
reader (Spectromax 250 from Molecular Devices). The set of untreated samples (0
mM) was also run in parallel under identical conditions that served as the control.

Chapter IV
Ph.D Thesis Umesh Kumar University of Pune
Pag
e79
4.3. Characterization techniques
Ultraviolet-visible absorbance was recorded on a Jasco UV-vis-NIR (Model V570)
dual beam spectrophotometer operated at a resolution of 2 nm. Fluorescence spectra
were recorded on a CARY Eclipse instrument from Varian with a slit width of 5 nm.
Powder XRD patterns were carried out on a PHILIPS X’PERT PRO instrument
equipped with X’celerator- a fast solid-state detector on drop coated sample on glass
substrate. The sample was scanned using X’celerator with a total number of active
channels of 121. Iron-filtered CuKα radiation (λ=1.5406 Å) was used. The XRD
patterns were recorded in the 2θ range of 20°- 80°. Dynamic Light Scattering (DLS)
measurements were performed on a Brookhaven Instruments Corp. with 90 Plus
Particle Size Analyzer software version 3.94. Atomic Force Microscopy (AFM)
samples were prepared on fresh and clean silicon wafer. AFM images were obtained
using “E” scanner on Nanoscope IV (Veeco). The raw images obtained were offline
processed using 5.303r2 software. Determination of nanoparticle shape and size were
performed on FEI, Technai F30, electron microscope (TEM) operated at an
accelerating voltage of 300 kV. Thermogravimetric analysis (TGA) for lysozyme
synthesized metal nanocrystals was performed on Q5000 V2.4 Build 223 instrument
by applying scan rate 10 0C min
-1 in presence of nitrogen. Fourier Transform Infra
red Spectroscopy (FTIR) was carried out on a Perkin–Elmer Spectrum One
instrument operated in the diffuse reflectance mode at a resolution of 2 cm-1
. X-ray
photoelectron spectroscopy (XPS) for nanoparticles were performed on VG
MicroTech ESCA 3000 instrument at a pressure <1x10⁻⁹
Torr with an overall
resolution of 1 eV. The spectra was recorded with unmonochromatic Mg K alpha
radiation (photon energy = 1253.6 eV) at a pass energy of 50 eV and electron take
off angle (angle between electron emission direction and surface plane) of 60°.
Circular dichroism (CD) measurements were performed on a spectrophotometer
Jasco 715 with a step resolution of 1 nm keeping sensitivity of 100 milli degree. In
order to rule out the contribution from free or unbound protein present in each kind
of nanoparticle solution, CD spectra were recorded for both lysozyme capped
nanoparticle samples as well as unbound protein. In order to calculate the amount of
nanoparticles present in different samples AAS (Atomic absorption spectroscopy)
measurements were taken on Chemito-Atomic absorption spectrometer 201 with
silver hollow cathode lamp. Elemental ananlysis of different metals was done by

Chapter IV
Ph.D Thesis Umesh Kumar University of Pune
Pag
e80
elemental analyzer EA1108 (Carlo Erba Instruments). Raman spectroscopy
measurements were recorded at room temperature on a HR 800 Raman
spectrophotometer (Jobin Yvon, Horiba, France) using monochromatic radiation
emitted by a He-Ne laser (633 nm), operating at 20 mW. The experiment was
repeated at least three times to verify the consistency of the recorded spectra. The
samples for the Raman studies were prepared simply by drop casting the liquid on
the glass slide. For the crystalline lysozyme, the crystalline powder was dispersed on
the glass slide.
4.4 Results and discussion
4.4.1. Proposed mechanisms for nanoparticle synthesis It
is known that tyrosine plays important role in electron transfer in the photosystem II
(PS II) of photosynthesis, where a neutral tyrosyl radical is generated47
. Sjodin et al
proposed a proton coupled electron transfer for pH < 10 (below pKa of tyrosine ~10)
and single electron transfer was proposed for pH > 10 (above pKa of tyrosine). Since
we work around lower pH range, all tyrosine groups in protein will always be in
protonated form and similar proton coupled electron transfer (pH < 10) could be
responsible for the reduction of silver ions. It is worth mentioning here that there is
always a possibility of formation of protein silver ion complex while reduction
reaction takes place. This is because silver ions are known to form complex with
amino acid like Asp, Glu, His, Cys, Lys and Met48,49
having different side chain
groups. The driving force for silver nanocrystal formation in protein solution comes
from simple redox reaction where silver ions are reduced by accepting an electron
from tyrosine residue, which becomes oxidized in the process21
. The reaction mixture
was kept in the presence of light at temperature of 40 ºC. The pH of the protein
solution was adjusted to 4.5 and 7 for gold and silver respectively using 0.1 M
NaOH. In order to study the effect of light in synthesis, same reaction was kept in
dark keeping other parameters constant. Interestingly no nanoparticles formation was
observed in absence of light supporting the above mentioned hypothesis.
Comparative ultraviolet-visible absorption spectra of gold and silver nanoparticles
collected after 96 hours of reaction followed by dialysis suggested formation of
lysozyme capped noble metal nanoparticles as seen in figure 4.1(A). Appearance of
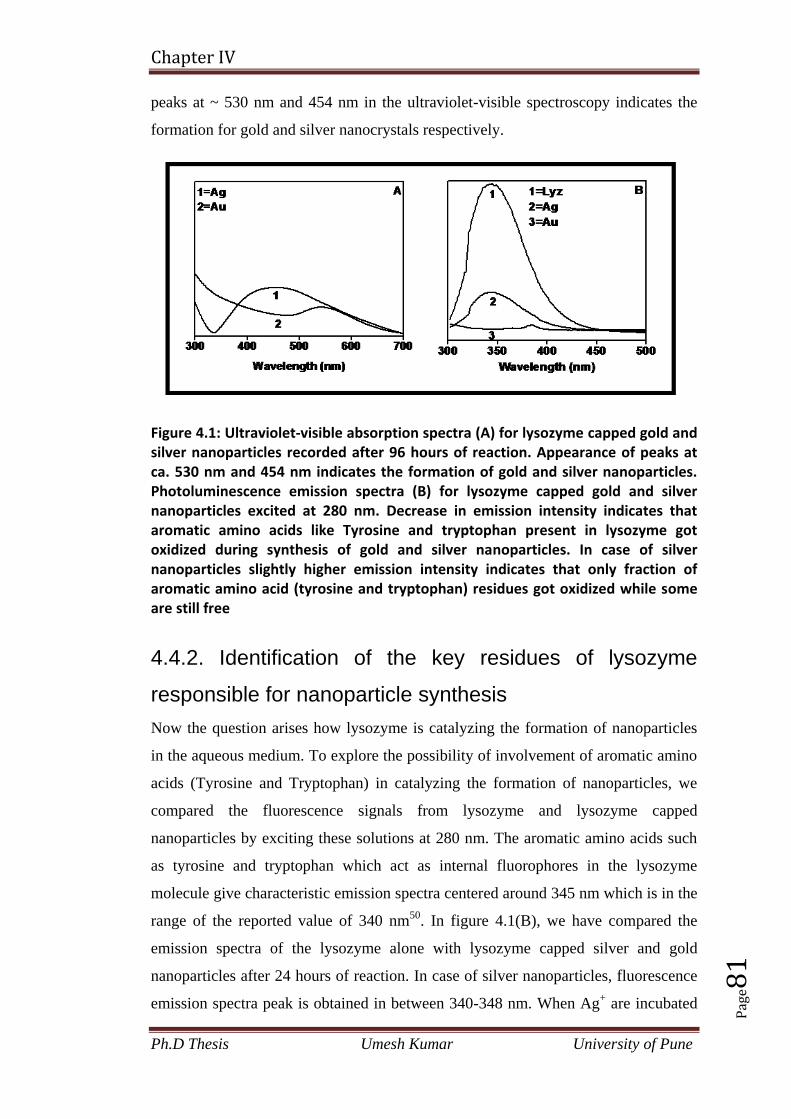
Chapter IV
Ph.D Thesis Umesh Kumar University of Pune
Pag
e81
peaks at ~ 530 nm and 454 nm in the ultraviolet-visible spectroscopy indicates the
formation for gold and silver nanocrystals respectively.
Figure 4.1: Ultraviolet-visible absorption spectra (A) for lysozyme capped gold and silver nanoparticles recorded after 96 hours of reaction. Appearance of peaks at ca. 530 nm and 454 nm indicates the formation of gold and silver nanoparticles. Photoluminescence emission spectra (B) for lysozyme capped gold and silver nanoparticles excited at 280 nm. Decrease in emission intensity indicates that aromatic amino acids like Tyrosine and tryptophan present in lysozyme got oxidized during synthesis of gold and silver nanoparticles. In case of silver nanoparticles slightly higher emission intensity indicates that only fraction of aromatic amino acid (tyrosine and tryptophan) residues got oxidized while some are still free
4.4.2. Identification of the key residues of lysozyme
responsible for nanoparticle synthesis
Now the question arises how lysozyme is catalyzing the formation of nanoparticles
in the aqueous medium. To explore the possibility of involvement of aromatic amino
acids (Tyrosine and Tryptophan) in catalyzing the formation of nanoparticles, we
compared the fluorescence signals from lysozyme and lysozyme capped
nanoparticles by exciting these solutions at 280 nm. The aromatic amino acids such
as tyrosine and tryptophan which act as internal fluorophores in the lysozyme
molecule give characteristic emission spectra centered around 345 nm which is in the
range of the reported value of 340 nm50
. In figure 4.1(B), we have compared the
emission spectra of the lysozyme alone with lysozyme capped silver and gold
nanoparticles after 24 hours of reaction. In case of silver nanoparticles, fluorescence
emission spectra peak is obtained in between 340-348 nm. When Ag+ are incubated

Chapter IV
Ph.D Thesis Umesh Kumar University of Pune
Pag
e82
with lysozyme at pH 7 and a temperature of 40 ºC, the Ag+ ions could be present in
the following forms: (1) free cationic form in solution and/or (2) strongly bound to
lysozyme molecules probably by binding through COO- groups (Asp and Glu) of
lysozyme and/or (3) by complex formation with the nucleophilic groups in the
residues, such as imidazole group (His), -SH (Cys), -SCH3 (Met), and -NH2 (Lys)21
.
The reducibility of the Ag-complex to form silver nanocrystals decreases with the
increasing binding strength of the complex. The standard electrode potential of
Ag+/Ag redox is 0.8 V
21. However, this value is significantly different when the Ag
ions are complexed. Generally, complexation lowers the redox potential and hence
the reducibility of Ag ions 21
. From the graph presented in figure 4.1(B) it is clear
that as the reaction progresses more and more Ag+
bind to the phenoxy moiety of
tyrosine probably resulting in change in the conformation of protein in such a way
that tryptophan becomes closer to the residues like aspartate and glutamate hence the
decreased emission intensity was observed21
compared to free lysozyme at 345 nm.
However in case of gold no significant emission spectra were observed in that region
(345 nm). This could be due to differential affinities of silver and gold ions which
can interact with side chain groups, such as amine, carboxyl and hydroxyl moieties
of tryptophan and tyrosine residues or it could be due to the change in the
conformation of protein in such a way that tryptophan becomes closer to the residues
like aspartate and glutamate51
. Now question arises, what is the effect of pH on
structure of lysozyme used for different nanoparticles synthesis (i.e. gold and silver)
since pH is known to be a crucial parameter influencing protein conformation. To
answer the above question we compared the fluorescence signal of lysozyme with
lysozyme capped different nanoparticles (i.e. gold and silver) under identical
conditions (figure 4.2). These results clearly show that there is no drastic change in
the structure of lysozyme itself at pH 4.5 and 7 used for synthesis of gold and silver
nanoparticles. Further to confirm our results we used tyrosine and tryptophan
solutions individually in same molar concentration as that of lysozyme (1mg/ml or
70 μM), mixed with gold and silver precursor salts to synthesize nanoparticles
keeping other parameters constant (pH, temperature, concentration). Interestingly
nanoparticle formation was not observed supporting the hypothesis for formation of
silver ion complex with different aminoacids present in lysozyme subsequently
lowering the reducibility of silver ions. We have shown temporal evolution of peaks

Chapter IV
Ph.D Thesis Umesh Kumar University of Pune
Pag
e83
Figure 4.2. Fluorescence emission spectra for lysozyme (Lz) capped gold, silver nanoparticles (left column) and their corresponding controls (right column) taken at 2,3,6,24,36,48,72 and 96 h of reaction. Decrease in emission intensity in (left column) indicates the oxidation of tyrosine and tryptophan residues present in lysozyme as reaction progresses.
during gold and silver nanoparticles synthesis when native and heat denatured
lysozyme were used (figure 4.3).
Figure 4.3: Ultraviolet-visible absorption spectra for gold (A,B) and silver nanoparticles recorded at 2,3,6,24,36,48,72 and 96 h of reaction(C,D) when native (A,C) and heat denatured, HD (B,D) lysozyme was used for synthesis indicating the temporal evolution of peaks as reaction progresses. Slightly blue shift in case of (B) indicates the enhanced binding of lysozyme with gold nanoparticles surface via its side groups like amino group of tryptophan residues as reaction progresses. Enhanced binding of lysozyme occurs because of the breaking of dimeric and trimeric forms of lysozyme into monomeric forms due to heating. Drastic increase in intensity of peaks at 280 nm in case of (A) indicates the opening of polypeptide (lysozyme) chain containing aromatic amino acids
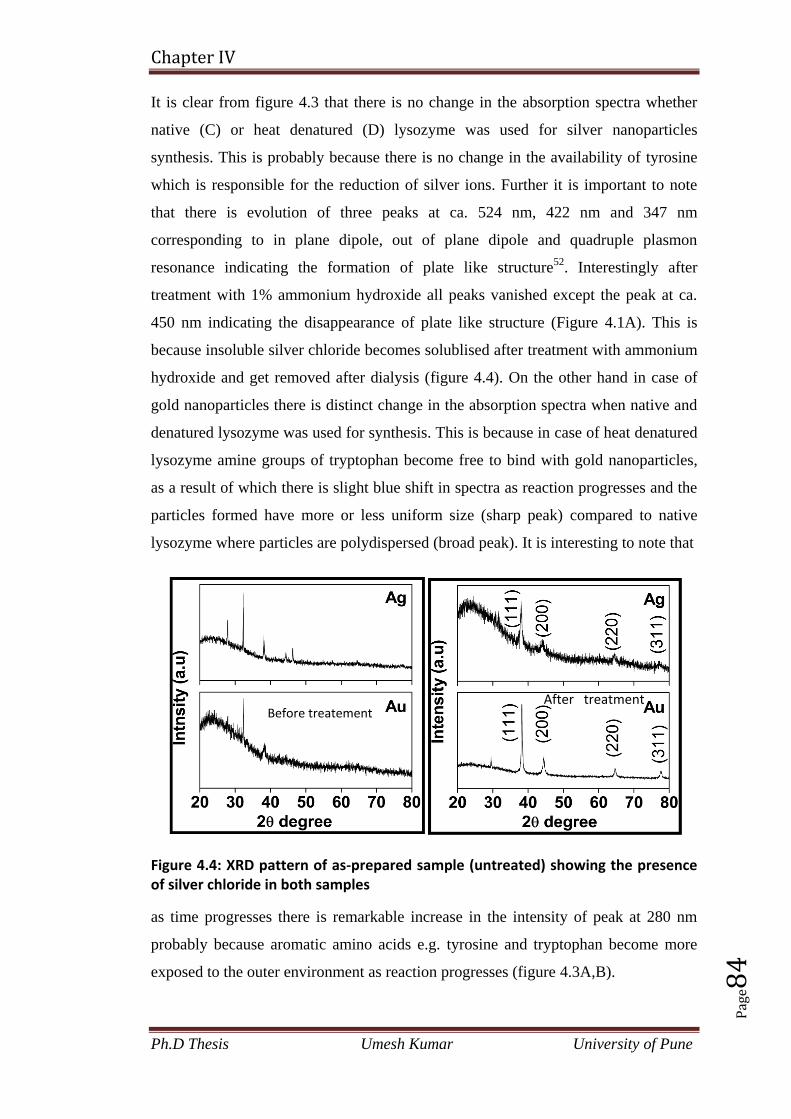
Chapter IV
Ph.D Thesis Umesh Kumar University of Pune
Pag
e84
It is clear from figure 4.3 that there is no change in the absorption spectra whether
native (C) or heat denatured (D) lysozyme was used for silver nanoparticles
synthesis. This is probably because there is no change in the availability of tyrosine
which is responsible for the reduction of silver ions. Further it is important to note
that there is evolution of three peaks at ca. 524 nm, 422 nm and 347 nm
corresponding to in plane dipole, out of plane dipole and quadruple plasmon
resonance indicating the formation of plate like structure52
. Interestingly after
treatment with 1% ammonium hydroxide all peaks vanished except the peak at ca.
450 nm indicating the disappearance of plate like structure (Figure 4.1A). This is
because insoluble silver chloride becomes solublised after treatment with ammonium
hydroxide and get removed after dialysis (figure 4.4). On the other hand in case of
gold nanoparticles there is distinct change in the absorption spectra when native and
denatured lysozyme was used for synthesis. This is because in case of heat denatured
lysozyme amine groups of tryptophan become free to bind with gold nanoparticles,
as a result of which there is slight blue shift in spectra as reaction progresses and the
particles formed have more or less uniform size (sharp peak) compared to native
lysozyme where particles are polydispersed (broad peak). It is interesting to note that
Figure 4.4: XRD pattern of as-prepared sample (untreated) showing the presence of silver chloride in both samples
as time progresses there is remarkable increase in the intensity of peak at 280 nm
probably because aromatic amino acids e.g. tyrosine and tryptophan become more
exposed to the outer environment as reaction progresses (figure 4.3A,B).
After treatment Before treatement

Chapter IV
Ph.D Thesis Umesh Kumar University of Pune
Pag
e85
4.4.3. Size controlled synthesis of nanoparticles by
chemical modification of lysozyme with NAI and NBS In
order to confirm our results we specifically blocked tyrosine and tryptophan residues
in native and heat denatured lysozyme by treating lysozyme with N-acetylimidazole
(NAI) and N-bromosuccinimide (NBS) respectively, dialysed for 24 hours and then
used for synthesizing nanoparticles of gold and silver. Ultra-violet visible
spectroscopy data clearly suggests that in absence of free tyrosine there is no silver
nanoparticle formation (figure 4.5A), but at the same time in case of heat denatured
Figure 4.5: Ultraviolet-visible absorption spectra of silver nanoparticles synthesized by chemically modified native and heat denatured (HD) lysozyme (N-acetylimidazole i.e NAI and N-bromosuccinimide i.e NBS treated) collected in real time manner, clearly indicating the role of tyrosine in synthesis lysozyme treated with NAI , there is occurrence of broad absorbance peak at ~ 450
nm (figure 4.5B) suggesting the formation of silver nanoparticles. This is probably
due to presence of some free tyrosine residue that is left unblocked due to
folding/unfolding of lysozyme during heat treatment. These findings were further
confirmed by appearance of clear absorbance peak at 420 nm when NBS treated

Chapter IV
Ph.D Thesis Umesh Kumar University of Pune
Pag
e86
native and heat denatured lysozyme was used for synthesis of silver nanoparticles
(figure 4.5C,D). It is interesting to note here that when native and heat denatured
lysozyme was used for synthesis of silver nanoparticles there is occurrence of three
peaks at ca.524 nm, 422 nm and 347 nm indicative of formation of plate like
structure which is absent in case of chemically modified native and heat denatured
lysozyme (NAI and NBS treated). Therefore we can say that by controlling the
availability of tyrosine and tryptophan present in lysozyme in a reaction mixture we
can precisely control the size of silver nanoparticles produced. Similarly role of
Figure 4.6: Ultraviolet-visible absorption spectra of gold nanoparticles synthesized by chemically modified lysozyme (N-acetylimidazole i.e NAI and N-bromosuccinimide i.e NBS treated) collected in real time manner, clearly indicating the role of tryptophan in synthesis
tryptophan was clearly demonstrated in gold nanoparticles synthesis where there is
occurrence of broad absorption peak between 550-600 nm in case of NAI treated
heat denatured lysozyme (figure 4.6B) but completely absent in case of NBS treated
both native and heat denatured lysozyme which is in accordance with our previous
results (figure 4.6C,D). These results clearly suggest that besides tyrosine,

Chapter IV
Ph.D Thesis Umesh Kumar University of Pune
Pag
e87
tryptophan is very important residue for gold nanoparticle synthesis. Interestingly we
observed quenching of fluorescence signal at 340 nm with respect to time in case of
silver nanoparticle synthesized using NAI treated native and heat denatured
lysozyme. This quenching (figure 4.7) is not because of the interaction of silver ions
with tryptophan but probably because of the change in the structure of lysozyme in
such a way that tryptophan becomes closer to amino acids residues like aspartate or
Figure 4.7: Photoluminiscence emission spectra of silver nanoparticles synthesized by chemically modified lysozyme (N-acetylimidazole i.e NAI and N-bromosuccinimide i.e NBS treated) collected in real time manner, clearly indicating the involvement of tyrosine in synthesis and hence quenching of emission at 345 nm is observed as reaction progresses
glutamate. These amino acids are known to quench the fluorescence emission signal
arising from tryptophan present in protein when excited at 280 nm. Similarly there is
complete absence of fluorescence signal when NBS treated native and heat denatured
lysozyme was used for silver nanoparticles synthesis not because of the interaction of
silver ions with tryptophan but because of the complete blocking of all tryptophan
residues present in lysozyme with NBS as depicted in graph (figure 4.7). To rule out

Chapter IV
Ph.D Thesis Umesh Kumar University of Pune
Pag
e88
the possibilty of quenching because of interaction of silver ions with tryptophan
residues present in lysozyme we have shown the fluorescence emission spectra of
NAI and NBS treated native and heat denatured lysozyme excited at 280 nm, (figure
4.8) where complete quenching of fluorescence signal at 340 nm can be clearly seen
in case of NBS treated native and heat denatured lysozyme compared to NAI treated
lysozyme.
Figure 4.8: Photoluminiscence emission spectra of chemically modified lysozyme excited at 280 nm (N-acetylimidazole i.e NAI and N-bromosuccinimide i.e NBS treated) indicating the presence of emission signal at 345 nm due to aromatic amino acids (tryptophan)
4.4.4. Determining changes in the secondary/tertiary
structure of lysozyme present on nanoparticles surface
To probe whether there is any change in the secondary or tertiary structure of protein
during tyrosine or tryptophan modifications we have carried out circular dichroism
(CD) studies on NAI and NBS treated native and heat denatured lysozyme and
compared them with native lysozyme CD spectra as shown in figure 4.9(A). Identical
CD spectra in case of NAI treated native and heat denatured lysozyme clearly
indicates that there is no major change in the structure of lysozyme due to these
treatments. On the other hand NBS treated native and heat denatured lysozyme
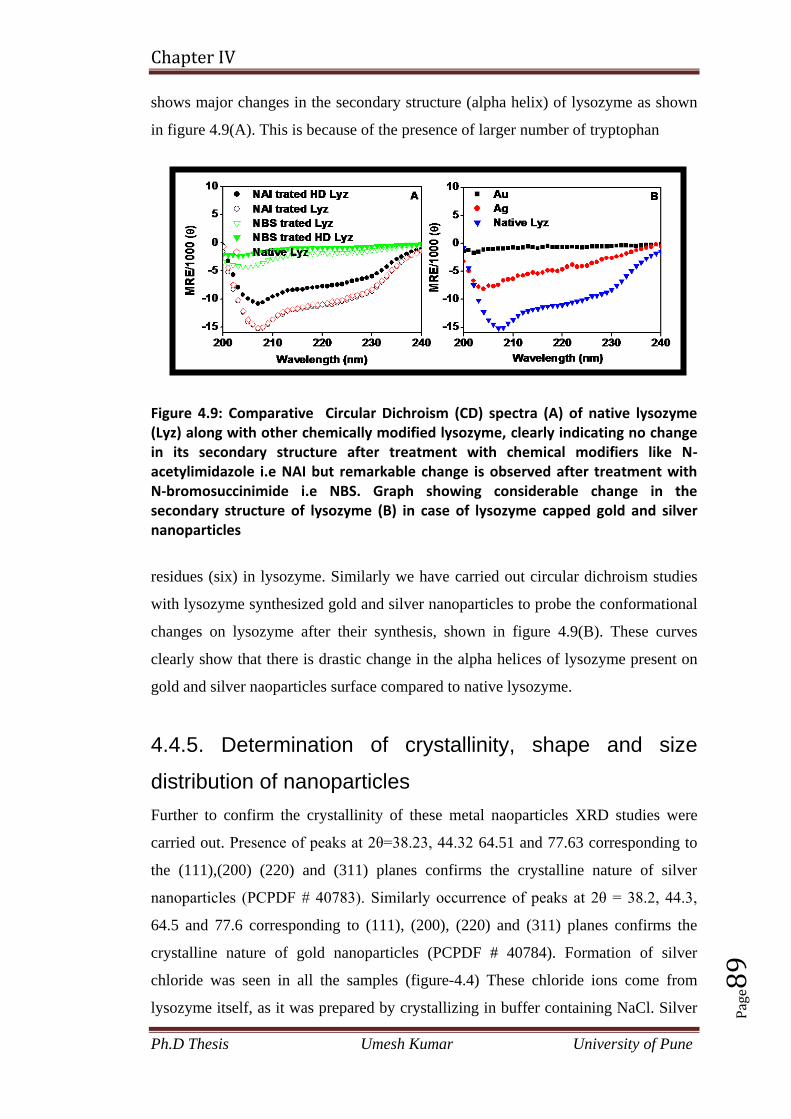
Chapter IV
Ph.D Thesis Umesh Kumar University of Pune
Pag
e89
shows major changes in the secondary structure (alpha helix) of lysozyme as shown
in figure 4.9(A). This is because of the presence of larger number of tryptophan
Figure 4.9: Comparative Circular Dichroism (CD) spectra (A) of native lysozyme (Lyz) along with other chemically modified lysozyme, clearly indicating no change in its secondary structure after treatment with chemical modifiers like N-acetylimidazole i.e NAI but remarkable change is observed after treatment with N-bromosuccinimide i.e NBS. Graph showing considerable change in the secondary structure of lysozyme (B) in case of lysozyme capped gold and silver nanoparticles
residues (six) in lysozyme. Similarly we have carried out circular dichroism studies
with lysozyme synthesized gold and silver nanoparticles to probe the conformational
changes on lysozyme after their synthesis, shown in figure 4.9(B). These curves
clearly show that there is drastic change in the alpha helices of lysozyme present on
gold and silver naoparticles surface compared to native lysozyme.
4.4.5. Determination of crystallinity, shape and size
distribution of nanoparticles
Further to confirm the crystallinity of these metal naoparticles XRD studies were
carried out. Presence of peaks at 2θ=38.23, 44.32 64.51 and 77.63 corresponding to
the (111),(200) (220) and (311) planes confirms the crystalline nature of silver
nanoparticles (PCPDF # 40783). Similarly occurrence of peaks at 2θ = 38.2, 44.3,
64.5 and 77.6 corresponding to (111), (200), (220) and (311) planes confirms the
crystalline nature of gold nanoparticles (PCPDF # 40784). Formation of silver
chloride was seen in all the samples (figure-4.4) These chloride ions come from
lysozyme itself, as it was prepared by crystallizing in buffer containing NaCl. Silver

Chapter IV
Ph.D Thesis Umesh Kumar University of Pune
Pag
e90
chloride was removed from each colloidal solution by treating it with 1% ammonium
hydroxide followed by dialysis for 24 hour. The XRD pattern shown in figure 4.10
was recorded after dialysis.
Figure 4.10: X-ray diffraction (XRD) pattern for nanocrystalline gold and silver nanoparticles synthesized by lysozyme recorded after treatment with 1% ammonium hydroxide followed by dialysis for 24 hours
Formation of gold nanoparticles was assisted by silver through
galvanization/transmetallation reaction53,54
. In order to determine the size of the
nanoparticle DLS experiments were carried out with dialysed samples. It is
interesting to note that in all these samples atleast two different particle size
populations were seen (Figure 4.11). This is probably because there are two different
Figure 4.11: Average particle size (hydrodynamic radii) calculated by Dynamic light scattering (DLS) measurements for gold (A) and silver (B) nanoparticles. Presence of multimodal size distribution indicates the presence of protein aggregates of different sizes in every sample
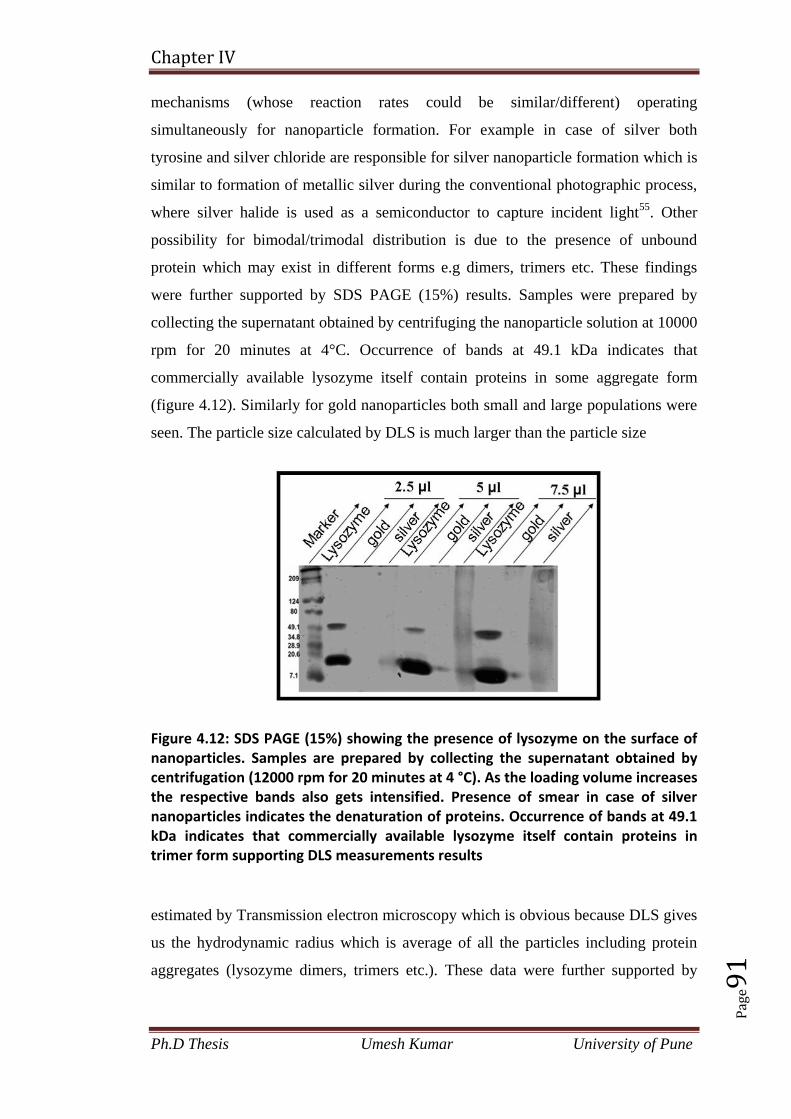
Chapter IV
Ph.D Thesis Umesh Kumar University of Pune
Pag
e91
mechanisms (whose reaction rates could be similar/different) operating
simultaneously for nanoparticle formation. For example in case of silver both
tyrosine and silver chloride are responsible for silver nanoparticle formation which is
similar to formation of metallic silver during the conventional photographic process,
where silver halide is used as a semiconductor to capture incident light55
. Other
possibility for bimodal/trimodal distribution is due to the presence of unbound
protein which may exist in different forms e.g dimers, trimers etc. These findings
were further supported by SDS PAGE (15%) results. Samples were prepared by
collecting the supernatant obtained by centrifuging the nanoparticle solution at 10000
rpm for 20 minutes at 4°C. Occurrence of bands at 49.1 kDa indicates that
commercially available lysozyme itself contain proteins in some aggregate form
(figure 4.12). Similarly for gold nanoparticles both small and large populations were
seen. The particle size calculated by DLS is much larger than the particle size
Figure 4.12: SDS PAGE (15%) showing the presence of lysozyme on the surface of nanoparticles. Samples are prepared by collecting the supernatant obtained by centrifugation (12000 rpm for 20 minutes at 4 °C). As the loading volume increases the respective bands also gets intensified. Presence of smear in case of silver nanoparticles indicates the denaturation of proteins. Occurrence of bands at 49.1 kDa indicates that commercially available lysozyme itself contain proteins in trimer form supporting DLS measurements results
estimated by Transmission electron microscopy which is obvious because DLS gives
us the hydrodynamic radius which is average of all the particles including protein
aggregates (lysozyme dimers, trimers etc.). These data were further supported by
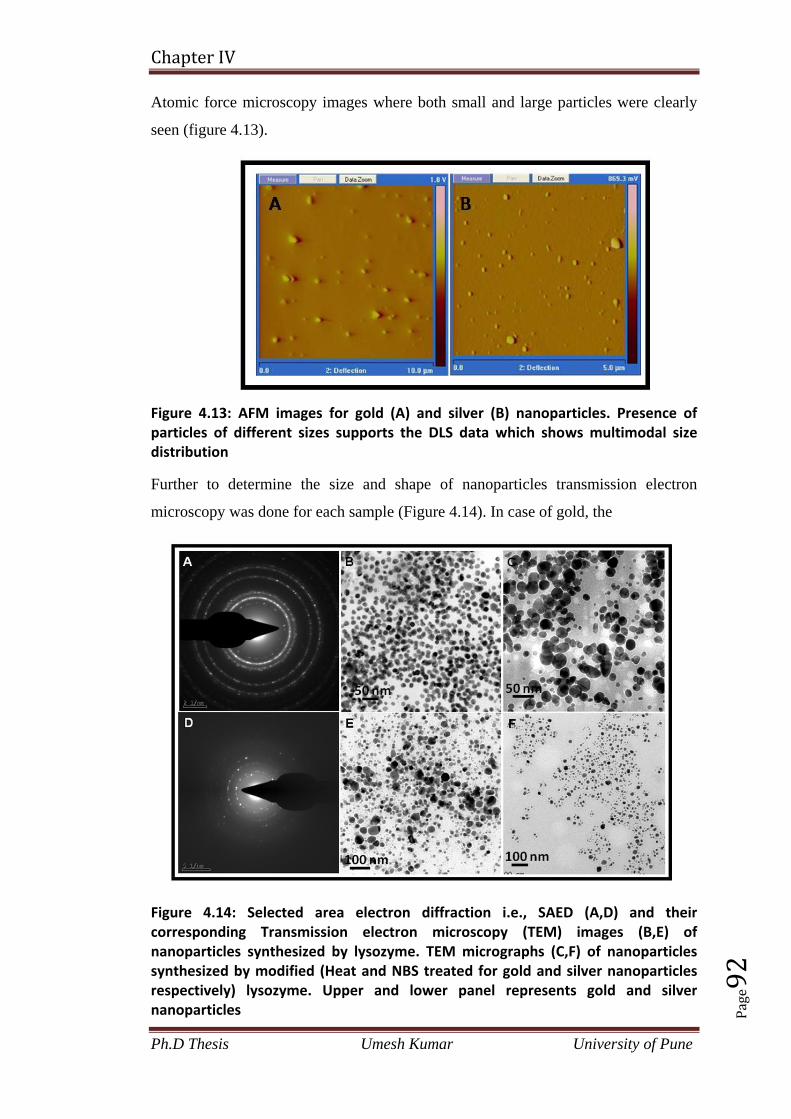
Chapter IV
Ph.D Thesis Umesh Kumar University of Pune
Pag
e92
Atomic force microscopy images where both small and large particles were clearly
seen (figure 4.13).
Figure 4.13: AFM images for gold (A) and silver (B) nanoparticles. Presence of particles of different sizes supports the DLS data which shows multimodal size distribution
Further to determine the size and shape of nanoparticles transmission electron
microscopy was done for each sample (Figure 4.14). In case of gold, the
Figure 4.14: Selected area electron diffraction i.e., SAED (A,D) and their corresponding Transmission electron microscopy (TEM) images (B,E) of nanoparticles synthesized by lysozyme. TEM micrographs (C,F) of nanoparticles synthesized by modified (Heat and NBS treated for gold and silver nanoparticles respectively) lysozyme. Upper and lower panel represents gold and silver nanoparticles
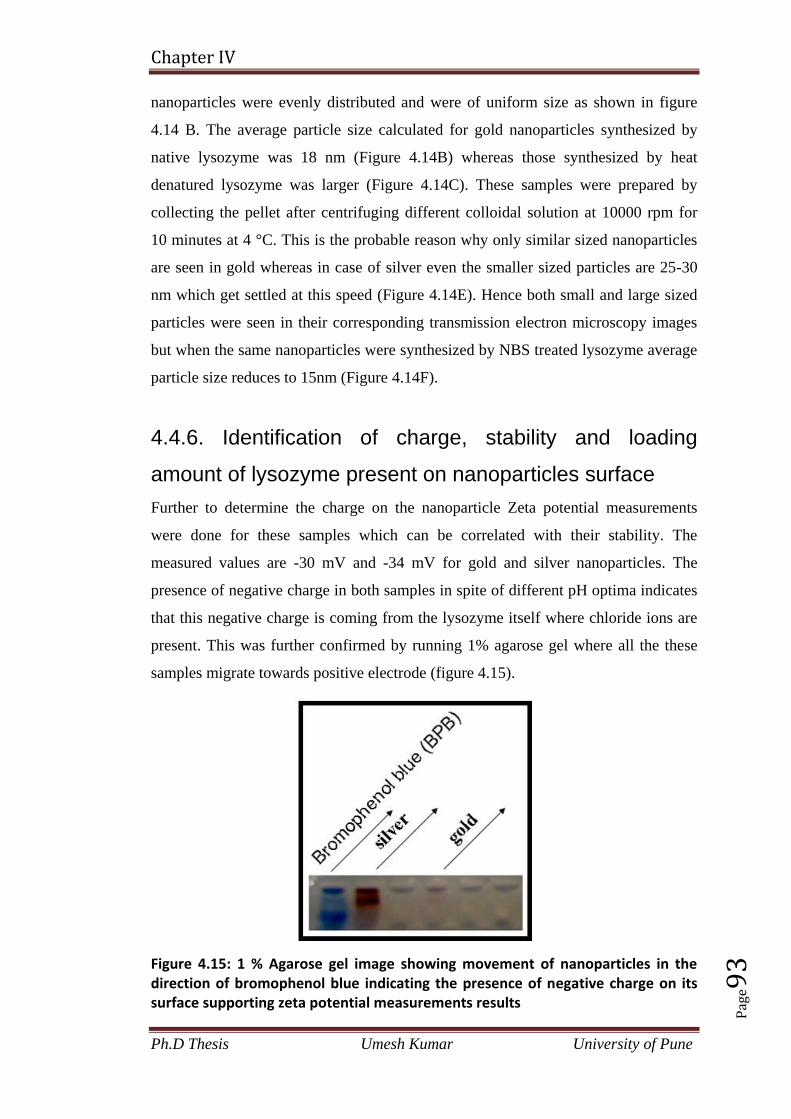
Chapter IV
Ph.D Thesis Umesh Kumar University of Pune
Pag
e93
nanoparticles were evenly distributed and were of uniform size as shown in figure
4.14 B. The average particle size calculated for gold nanoparticles synthesized by
native lysozyme was 18 nm (Figure 4.14B) whereas those synthesized by heat
denatured lysozyme was larger (Figure 4.14C). These samples were prepared by
collecting the pellet after centrifuging different colloidal solution at 10000 rpm for
10 minutes at 4 °C. This is the probable reason why only similar sized nanoparticles
are seen in gold whereas in case of silver even the smaller sized particles are 25-30
nm which get settled at this speed (Figure 4.14E). Hence both small and large sized
particles were seen in their corresponding transmission electron microscopy images
but when the same nanoparticles were synthesized by NBS treated lysozyme average
particle size reduces to 15nm (Figure 4.14F).
4.4.6. Identification of charge, stability and loading
amount of lysozyme present on nanoparticles surface
Further to determine the charge on the nanoparticle Zeta potential measurements
were done for these samples which can be correlated with their stability. The
measured values are -30 mV and -34 mV for gold and silver nanoparticles. The
presence of negative charge in both samples in spite of different pH optima indicates
that this negative charge is coming from the lysozyme itself where chloride ions are
present. This was further confirmed by running 1% agarose gel where all the these
samples migrate towards positive electrode (figure 4.15).
Figure 4.15: 1 % Agarose gel image showing movement of nanoparticles in the direction of bromophenol blue indicating the presence of negative charge on its surface supporting zeta potential measurements results

Chapter IV
Ph.D Thesis Umesh Kumar University of Pune
Pag
e94
In order to quantitatively determine the amount of protein bound to nanoparticles,
protein estimation was done using Lowry method using BSA as protein standard.
The samples were prepared by centrifugation of the nanoparticles solution at 10000
rpm for 10 minutes and resuspending the pellet in equal volume of water. Results
indicated approximately 15% – 20% protein loading, which is less than the amount
calculated by thermogravimetric analysis (TGA). For these measurements samples
were lyophilized to powder dry form. Higher values of weight loss (Figure 4.16)
were recorded for gold (40%) and silver (88%) because the samples for TGA
measurements had unbound protein also.
Figure 4.16:. Graph showing percentage weight loss for lysozyme capped gold (Au) and silver (Ag) nanoparticles measured by thermogravimetric analysis (TGA)
In this chapter we have shown that lysozyme is acting both as capping and reducing
agent in all these synthesis procedures. To confirm this hypothesis FTIR were
performed. FTIR samples for these studies were prepared by removing the unbound
proteins by centrifuging at 10000 rpm for 10 minutes at 4 °C and drop casting metal
nanoparticles (pellet) on silicon wafer. Occurrence of bands at 1682 cm-1
, 1552 cm-1
and 3306 cm-1
(Figure 4.17) corresponding to Amide-I, Amide-II and NH stretch in
all samples indicate the presence of proteins on the surface of all these metal
nanoparticles14
. There is a slight shift in these bands compared to bare lysozyme due
to binding of protein to nanoparticles surface.

Chapter IV
Ph.D Thesis Umesh Kumar University of Pune
Pag
e95
Figure 4.17: Fourier transform infra red (FTIR) spectra showing the presence of intact Amide-I, Amide-II and NH stretch in case of lysozyme (Lyz) capped gold (Au) and silver (Ag) nanoparticles
4.4.7. Oxidation state determination of lysozyme capped
nanoparticles
Further to determine the purity of these nanoparticles X-ray photoelectron
spectroscopy (XPS) was done. As-obtained XPS core level spectra were background
corrected using the Shirley algorithm and chemically distinct species were resolved
using a nonlinear least squares fitting procedure. The core level binding energies
(B.E.) were aligned with the carbon binding energy of 285 eV. In figure 4.18 we
have shown the background corrected XPS spectra for gold (A) and silver (B)
Figure 4.18: X-ray Photoelectron Spectroscopy curves for lysozyme capped gold (A) and silver (B) nanoparticles

Chapter IV
Ph.D Thesis Umesh Kumar University of Pune
Pag
e96
nanoparticles. Figure 4.18A shows the splitting of Au 4f spectrum into two spin–
orbit components. The Au 4f7/2 and 4f5/2 peaks occuring at a binding energy (BE) of
84.4 and 88.1 eV, respectively, and are assigned to metallic gold56
. Figure 4.18B
shows the splitting of Ag 3d spectrum, into two spin–orbit components. The Ag 3d5/2
and 3d3/2 peaks occurred at a B.E of 370.1 and 376.1 eV, respectively, corresponding
to metallic silver56
. It is important to note that there is shift of 2 eV in case of silver
nanoparticles because of the presence of electronegative atom chlorine attached to
lysozyme. Interestingly there is no shift in the case of gold probably because of more
(comparatively) binding of protein with silver nanoparticles as previously seen in
TGA curves (Figure 4.16).
4.4.8. Determination of biofunctionality and
biocompatibility of lysozyme capped nanoparticles
Finally to confirm wheather bioactivity of lysozyme is maintained or not after
synthesis of metal nanoparticles, antibacterial assay was performed against gram
positive bacterium, B. subtilis. It is important to note here that we have used the 24
hour dialysed nanoparticle
Figure 4.19: Antibacterial activity of lysozyme functionalized gold and silver nanoparticles performed against Bacillus subtillis. For comparison, we have used borohydrate reduced gold and lysozyme solution as control. Presence of zone of inhibition in case of nanoparticles solution indicates that lysozyme is still active after getting immobilised on to the surface of nanoparticles
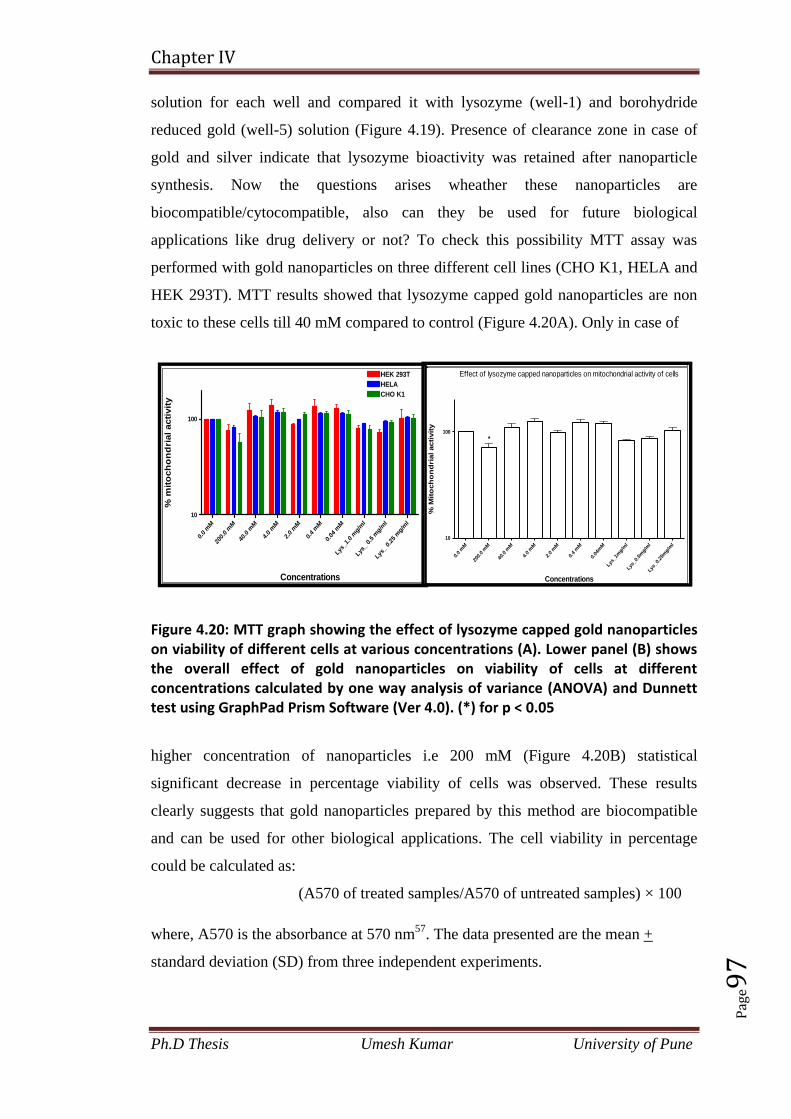
Chapter IV
Ph.D Thesis Umesh Kumar University of Pune
Pag
e97
solution for each well and compared it with lysozyme (well-1) and borohydride
reduced gold (well-5) solution (Figure 4.19). Presence of clearance zone in case of
gold and silver indicate that lysozyme bioactivity was retained after nanoparticle
synthesis. Now the questions arises wheather these nanoparticles are
biocompatible/cytocompatible, also can they be used for future biological
applications like drug delivery or not? To check this possibility MTT assay was
performed with gold nanoparticles on three different cell lines (CHO K1, HELA and
HEK 293T). MTT results showed that lysozyme capped gold nanoparticles are non
toxic to these cells till 40 mM compared to control (Figure 4.20A). Only in case of
Figure 4.20: MTT graph showing the effect of lysozyme capped gold nanoparticles on viability of different cells at various concentrations (A). Lower panel (B) shows the overall effect of gold nanoparticles on viability of cells at different concentrations calculated by one way analysis of variance (ANOVA) and Dunnett test using GraphPad Prism Software (Ver 4.0). (*) for p < 0.05
higher concentration of nanoparticles i.e 200 mM (Figure 4.20B) statistical
significant decrease in percentage viability of cells was observed. These results
clearly suggests that gold nanoparticles prepared by this method are biocompatible
and can be used for other biological applications. The cell viability in percentage
could be calculated as:
(A570 of treated samples/A570 of untreated samples) × 100
where, A570 is the absorbance at 570 nm57
. The data presented are the mean +
standard deviation (SD) from three independent experiments.
Effect of lysozyme capped nanoparticles on mitochondrial activity of cells
0.0 m
M
200.0 m
M
40.0 m
M
4.0 m
M
2.0 m
M
0.4 m
M
0.04
mM
Lys_
1mg/
ml
Lys_
0.5m
g/m
l
Lys_
0.25
mg/
ml
10
100
*
Concentrations
% M
ito
ch
on
dri
al acti
vit
y
0.0 m
M
200.0 m
M
40.0 m
M
4.0 m
M
2.0 m
M
0.4 m
M
0.04
mM
Lys_
1.0 m
g/m
l
Lys_
0.5 m
g/m
l
Lys_
0.25 m
g/m
l
10
100
HEK 293T
HELA
CHO K1
Concentrations
% m
ito
ch
on
dri
al acti
vit
y

Chapter IV
Ph.D Thesis Umesh Kumar University of Pune
Pag
e98
4.4.9. Surface enhanced Raman spectroscopic studies for
lysozyme capped gold and silver nanoparticles
As discussed earlier, FTIR was not the best technique to study the biomoleules in
their natural state as the O-H stretching could mask the desired modes and to avoid
the O-H stretching, the sample for FTIR measurements was dried out of the solution
which could change the conformation of the protein molecule on the surface giving
inconclusive results. Therefore, we studied the samples using Raman spectroscopy.
For this purpose, it was important for us to characterize first, the lysozyme itself in
detail in various conditions to understand and compare the changes in conformation
of lysozyme before and after surface capping and then analyse of the presence of
lysozyme on gold and silver nanoparticles. Initially we compared the Raman spectra
for the as-received solid lysozyme crystals with the lysozyme in the native and
denatured state in the solution phase without further purification. For native
lysozyme in aqueous medium, the commercially available lysozyme was dissolved in
deionized water. We observed that after dissolving the lysozyme crystals in the
water, the solution pH was about 4.5. Denatured lysozyme solution was prepared by
heating the lysozyme solution to 100 oC for 5 min followed by quench-cooling it at 4
oC for 10 minutes. In figure 4.21 we compared the Raman spectra for all the three
samples (as-received solid lysozyme crystals, lysozyme in the native and denatured
state in the solution phase) and details on the Raman peaks were tabulated in table
4.1. In all the three spectra a common peak at around 429 cm-1
was observed which
was assigned to the vibration of the amino acid residues of phenylalanine or tyrosine.
Further, we assigned the band situated around 760 cm-1
to symmetric
benzene/pyrrole in-phase breathing mode in tryptophan and symmetric ring breathing
mode in tyrosine and phenylalanine. The band at 1010 cm-1
was assigned to the
symmetric benzene/pyrrole out-of-phase breathing in tryptophan and the band at
1550 cm-1
was due to the symmetric phenyl ring mode in Tryptophan58-60
, which
appeared in the solid crystals (marked by star), but disappeared or was less intense in
the case of native and denatured lysozyme solution (panel a and b). It may be due to
the fact that the phenyl ring or the pyrrole ring of the amino acids which were
responsible for this vibration were quenched in the aqueous environment due to the
formation of hydrogen bonds with the water molecules. It was reported that in
Raman spectra, the S-S vibration band were observed around 509 cm-1
.61

Chapter IV
Ph.D Thesis Umesh Kumar University of Pune
Pag
e99
Figure 4.21: Comparison of Raman spectra of (a) denatured lysozyme in solution (b) native lysozyme in solution and (c) lysozyme solid crystals recorded at room temperature
Table 4.1: Raman shifts for lysozyme in various forms
Here in our study, the S-S vibration band was present in all the three cases, showing
that even the denaturization did not affect the disulfide bond. In literature, there was
Solid
Lysozyme
Native
Lysozyme
Denatured
Lysozyme
Tentative
Assignment
429
509
760
936
1010
1235-1310
1550
1640-1680
429
509
760
936
1010
1235-1310
1550
1640-1680
429
509
760
936
1010
1235-1310
1550
1640-1680
Phe or Tyr
S-S
Trp or His
Cα-C-N (Peptide
backbone)
Trp
Amide III
Trp, His
Amide I
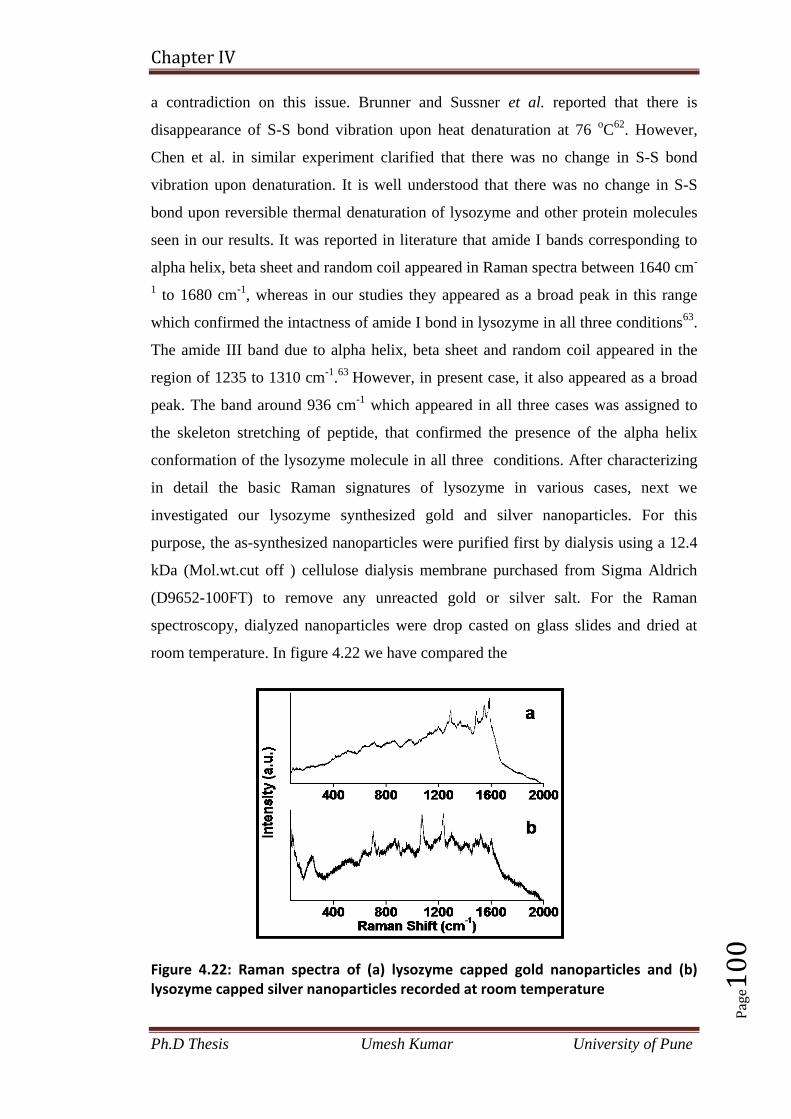
Chapter IV
Ph.D Thesis Umesh Kumar University of Pune
Pag
e10
0
a contradiction on this issue. Brunner and Sussner et al. reported that there is
disappearance of S-S bond vibration upon heat denaturation at 76 oC
62. However,
Chen et al. in similar experiment clarified that there was no change in S-S bond
vibration upon denaturation. It is well understood that there was no change in S-S
bond upon reversible thermal denaturation of lysozyme and other protein molecules
seen in our results. It was reported in literature that amide I bands corresponding to
alpha helix, beta sheet and random coil appeared in Raman spectra between 1640 cm-
1 to 1680 cm
-1, whereas in our studies they appeared as a broad peak in this range
which confirmed the intactness of amide I bond in lysozyme in all three conditions63
.
The amide III band due to alpha helix, beta sheet and random coil appeared in the
region of 1235 to 1310 cm-1
.63
However, in present case, it also appeared as a broad
peak. The band around 936 cm-1
which appeared in all three cases was assigned to
the skeleton stretching of peptide, that confirmed the presence of the alpha helix
conformation of the lysozyme molecule in all three conditions. After characterizing
in detail the basic Raman signatures of lysozyme in various cases, next we
investigated our lysozyme synthesized gold and silver nanoparticles. For this
purpose, the as-synthesized nanoparticles were purified first by dialysis using a 12.4
kDa (Mol.wt.cut off ) cellulose dialysis membrane purchased from Sigma Aldrich
(D9652-100FT) to remove any unreacted gold or silver salt. For the Raman
spectroscopy, dialyzed nanoparticles were drop casted on glass slides and dried at
room temperature. In figure 4.22 we have compared the
Figure 4.22: Raman spectra of (a) lysozyme capped gold nanoparticles and (b) lysozyme capped silver nanoparticles recorded at room temperature

Chapter IV
Ph.D Thesis Umesh Kumar University of Pune
Pag
e10
1
Raman spectra for both Au and Ag nanoparticles and the Raman shifts were
tabulated in table 4.2. By comparing the Raman spectra for lysozyme itself in various
forms and lysozyme synthesized Ag/Au nanoparticles (figures 4.21 and 4.22), it was
clear that there was an enhancement (due to the proximity of the lysozyme molecules
with metallic surfaces) in the intensity of some peaks with small shift as seen in
figure 4.22. In the case of lysozyme capped silver nanoparticles, the presence of peak
around 236 cm-1
indicated the binding of lysozyme molecules with the surface of Ag
nanoparticles through moiety containing N-atom64
.
Lysozyme capped silver nanoparticles Lysozyme capped gold nanoparticles
Raman Shift (cm-1
) Tentative
assignment
Raman Shift (cm-1
) Tentative
Assignment
206
509 (w)
704
866
1072
1235
1519 and 1598
Ag-N
S-S
Trp, Tyr and
Phe
Tyr
C-N
Amide III
Phe, His, Trp,
Phe or Tyr
509 (w)
1289
1484
1545
1583
S-S
Amide III
Phe, Tyr, Trp
Trp or His
Tyr
Table 4.2: Raman shifts for lysozyme capped silver and gold nanoparticles
The absence of sharp band around 509 cm-1
in both curves in figure 4.22 which was
assigned to the disulfide bond (Table 4.1) suggested that it was not interacting with
the Ag and Au nanoparticles during capping. The peak around 1640-1680 cm-1
which
was assigned to amide I band of alpha helix, beta sheet and random coil of lysozyme
molecule were also absent in lysozyme capped silver and gold nanoparticles spectra,
probably due to the fact that these functional groups were not involved in interaction
with silver and gold nanoparticles surface. In the case of lysozyme capped silver
Chapter IV
Ph.D Thesis Umesh Kumar University of Pune
Pag
e10
2
nanoparticles, a sharp intense peak at 704 cm-1
was observed which was assigned to
symmetric benzene/pyrrole in-phase breathing in tryptophan and symmetric ring
breathing in tyrosine and phenylalanine which suggested that in our samples, the
benzene and pyrrole ring might be either standing up or tilting at an angle with
respect to the Ag nanoparticles surface. It was also observed that Raman shift was
moved to higher wave numbers, clearly indicating that there was some interaction
between the Ag nanoparticles surface and these amino acid residues. Further
appearance of sharp intense peak at 866 cm-1
which was assigned to the vibration of
the tyrosine residue, confirmed the interaction of tyrosine with the Ag nanoparticles
surface. In this case also there was a slight shift in the peak position which might be
due the interaction of the amino acid residue with the Ag nanoparticles surface.
Other sharp and intense peaks at 1519 and 1598 cm-1
were assigned to the vibration
of phenylalanine, histidine, tryptophan and phenylalanine or tyrosine residues,
further suggesting the involvement of these amino acid residues with the Ag
nanoparticles surface during capping of the lysozyme molecule. Amide I and III
which are the backbone of the protein molecule could be studied by Raman spectra.
Amide III had a large contribution from the C-N-H in plane bending and C-N
stretching mode. In case of Raman spectra of lysozyme capped silver nanoparticles,
sharp and intense peaks were obtained at 1072 and 1235 cm-1
which were assigned to
the C-N stretching and amide III respectively. The observation of these sharp and
intense peaks clearly indicated that there was significant interaction of the amide III
of the lysozyme molecule with the silver nanoparticles. Other peaks for the amino
acid residues are also seen in the spectra but they were very weak in intensity and
might not contribute in interacting with metallic surfaces. Here, we do not rule out
the possibility of binding of silver nanoparticles with the carboxyl groups as it is
reported in literature that –COOH group along with –NH2 groups might be involved
in the binding65,66
of fatty acid with silver surfaces.
In case of lysozyme capped gold nanoparticles, a sharp and intense peak was
observed at 1583 cm-1
which was assigned to the tyrosine residue of the lysozyme
molecules. The presence of this peak showed the interaction of the tyrosine moiety of
the lysozyme molecule with the gold nanoparticles during capping of the
nanoparticles. Other two sharp and intense peaks were observed in the spectra at
1545 and 1484 cm-1
, which were assigned to symmetric phenyl ring mode in
tryptophan or histidine and vibration of the phenylalanine, histidine, and tryptophan.

Chapter IV
Ph.D Thesis Umesh Kumar University of Pune
Pag
e10
3
Intensity of these peaks showed that the amino acid residues phenylalanine, tyrosine,
tryptophan and histidine might be playing a major role in capping of the lysozyme
molecule on nanoparticles surface. Other bands for the amino acid residues were also
observed in the spectra but they were less intense. A sharp and intense peak was
observed at 1289 cm-1
which was assigned to the amide III band. The presence of
this intense band in the spectra suggested the involvement of the amino group of the
protein molecule with the nanoparticles surface. In both the cases we observed a
broad hump around 509 cm-1
which indicated the intactness of the disulfide bond.
However, as both the native and denatured lysozyme showed similar type of spectra,
it was very difficult to conclude whether the lysozyme on Au and Ag was in native
or denatured form.
5.0. Conclusion
A simple facile method has been developed for synthesis of metal nanoparticles
(gold and silver) utilizing the reduction abilities of amino acids present in lysozyme.
Our experimental results prove that hydroxyl groups in tyrosine residues and the
imino groups in tryptophan residues were found to be responsible for silver and gold
nanoparticles formation respectively. Formation of gold nanoparticles was assisted
by silver through galvanization/transmetallation reaction. Further by controlling the
availability of tyrosine and tryptophan in lysozyme by suitable chemical treatment
we can precisely control the size of nanoparticles. It is interesting to note that gold
nanoparticles prepared by this method are biocompatible and retains antibacterial
property. These nanoparticles can be used for future applications like drug delivery,
bioimaging etc by functionalizing it with ligand/molecule of our choice using
different functional groups present on the proteins.
5.1 References
1. Burda, C.; Chen, X. B.; Narayanan, R.; El-Sayed, M. A. Chem. Rev. 2005, 105 (4),
1025.
2. Shipway, A. N.; Katz, E.; Willner, I. Chemphyschem. 2000, 1 (1), 18.

Chapter IV
Ph.D Thesis Umesh Kumar University of Pune
Pag
e10
4
3. Roucoux, A.; Schulz, J.; Patin, H. Chem. Rev. 2002, 102 (10), 3757.
4. Daniel, M. C.; Astruc, D. Chem. Rev. 2004, 104 (1), 293.
5. Mirkin, C. A. Inorg. Chem. 2000, 39 (11), 2258.
6. Whaley, S. R.; English, D. S.; Hu, E. L.; Barbara, P. F.; Belcher, A. M. Nature.
2000, 405, 665.
7. Mamedova, N. N.; Kotov, N. A.; Rogach, A. L.; Studer, J. Nano Lett. 2001, 1 (6),
281.
8. Zhang, L. X.; Sun, X. P.; Song, Y. H.; Jiang, X.; Dong, S. J.; Wang, E. A.
Langmuir. 2006, 22 (6), 2838.
9. Haba, Y.; Kojima, C.; Harada, A.; Ura, T.; Horinaka, H.; Kono, K. Langmuir.
2007, 23 (10), 5243.
10. Zhong, Z. Y.; Luo, J. Z.; Ang, T. P.; Highfield, J.; Lin, J. Y.; Gedanken, A. J.
Phy. Chem. B. 2004, 108 (47), 18119.
11. Selvakannan, P. R.; Mandal, S.; Phadtare, S.; Pasricha, R.; Sastry, M. Langmuir.
2003, 19 (8), 3545.
12. Meziani, M. J.; Sun, Y. P. J. Am. Chem. Soc. 2003, 125 (26), 8015.
13. Burt, J. L.; Gutierrez-Wing, C.; Miki-Yoshida, M.; Jose-Yacaman, M. Langmuir.
2004, 20 (26), 11778.
14. Rossi, L. M.; Quach, A. D.; Rosenzweig, Z. Anal.Bioanal.Chem. 2004, 380 (4),
606.
15. Kouassi, G. K; Irudayaraj, J; McCarty, G. J. Nanobiotechnol. 2005, 3 (1), 1.
16. Koneracka, M.; Kopcansky, P.; Timko, M.; Ramchand, C. N. J. mol. cat B: enz.
2002, 18, 13.
17. Fernandes, E. G. R.; De Queiroz, A. A. A.; Abraham, G. A.; San Roman, J. J.
Mater. Sc-Mater. in Med. 2006, 17 (2), 105.
18. Gray, J. J. Curr. Opin. Struc. Biol. 2004, 14 (1), 110.
19. Rangnekar, A.; Sarma, T. K.; Singh, A. K.; Deka, J.; Ramesh, A.;
Chattopadhyay, A. Langmuir. 2007, 23 (10), 5700.
20. Lee-Huang, S.; Huang, P. L.; Sun, Y. T.; Kung, H. F.; Blithe, D. L.; Chen, H. C.
Proc. Natl. Acad. Sci. USA. 1999, 96 (6), 2678.
21. Xie, J. P.; Lee, J. Y.; Wang, D. I. C.; Ting, Y. P. Acs Nano. 2007, 1 (5), 429.
22. Slocik, J. M.; Govorov, A. O.; Naik, R. R. Supramol. Chem. 2006, 18 (5), 415.
23. Dickerson, M. B.; Jones, S. E.; Cai, Y.; Ahmad, G.; Naik, R. R.; Kroger, N.;
Sandhage, K. H. Chem. Mater 2008, 20 (4), 1578.

Chapter IV
Ph.D Thesis Umesh Kumar University of Pune
Pag
e10
5
24. Sowards, L. A.; Whitlock, P. W.; Brott, L. L.; Naik, R. R.; Stone, M. O. Abstr.
Am. Chem. Soc. 2001, 221, 232.
25. Luckarift, H. R.; Dickerson, M. B.; Sandhage, K. H.; Spain, J. C. Small. 2006, 2
(5), 640.
26. Eby, D. M.; Schaeublin, N. M.; Farrington, K. E.; Hussain, S. M.; Johnson, G. R.
Acs Nano. 2009, 3 (4), 984.
27. Dickerson, M. B.; Sandhage, K. H.; Naik, R. R. Chem. Rev. 2008, 108, 4935.
28. Haynes, C. A.; Norde, W. J. Coll. and Interf. Sc. 1995, 169, 313.
29. Liao, M. H.; Chen, D. H. Biotechnol. Letts. 2002, 24, 1913.
30. Yang, T.; Li, Z.; Wang, L.; Guo, C. L.; Sun, Y. J. Langmuir 2007, 23, 10533.
31. Koglin, E.; Squaris, J. M. Topics in Curr. Chem. 1986, 134, 39.
32. Shemer, G.; Markovich, G. J. Phy. Chem. B. 2002, 106, 9195.
33. Knoll, B.; Keilmann, F. Nature. 1999, 399, 134.
34. Wang, H.; Kundu, J.; Halas, N. J. Angew. Chem.-International Edition. 2007, 46,
9040.
35. Kosower, E. M.; Markovich, G.; Raichlin, Y.; Borz, G.; Katzir, A. J. Phy. Chem.
B. 2004, 108, 12633.
36. Elghanian, R.; Storhoff, J. J.; Mucic, R. C.; Letsinger, R. L.; Mirkin, C. A.
Science. 1997, 277, 1078.
37. Chu, L. Q.; Forch, R.; Knoll, W. Angew. Chem.-International Edition. 2007, 46,
4944.
38. Aslan, K.; Lakowicz, J. R.; Geddes, C. D. Anal. and Bioanal. Chem. 2005, 382,
926.
39. Antunes, P. A.; Constantino, C. J. L.; Aroca, R. F.; Duff, J. Langmuir. 2001, 17,
2958.
40. Kuhn, S.; Hakanson, U.; Rogobete, L.; Sandoghdar, V. Phy. Rev. Letts. 2006, 97.
41. Lieberman, I.; Shemer, G.; Fried, T.; Kosower, E. M.; Markovich, G. Angew.
Chem.-International Edition. 2008, 47, 4855.
42. Fleischmann, M.; Hendra, P. J.; Mcqillan, A. J. Chem. Phy. Letts. 1974, 26, 163.
43. Garcia Vidal, F. J.; Pendry, J. B. Phy. Rev. Letts. 1996, 77, 1163.
44. Michaels, A. M.; Nirmal, M.; Brus, L. E. J. Am. Chem. Soc. 1999, 121, 9932.
45. Gersten, J. J. Chem. Phy. 1980, 73, 3023.
46. Plumb, J. A.; Milroy, R.; Kaye, S. B. Cancer Res. 1989, 49, 4435.

Chapter IV
Ph.D Thesis Umesh Kumar University of Pune
Pag
e10
6
47. Sjodin, M.; Styring, S.; Akermark, B.; Sun, L. C.; Hammarstrom, L. J. Am.
Chem. Soc. 2000, 122, 3932.
48. Merril, C. R.; Harrington, M.; Alley, V. Electrophoresis. 1984, 5, 289–297.
49. Rabilloud, T. Electrophoresis. 1990, 11, 785.
50. Imoto, T.; Rupley, J. A.; Tanaka, F.; Forster, L. S. Proc. Nat. Acad. Sci. USA.
1972, 69 (5), 1151.
51. Chen, Y.; Barkley, M. D. Biochemistry. 1998, 37, 9976.
52. Jin, R. C.; Cao, Y. C.; Hao, E. C.; Metraux, G. S.; Schatz, G. C.; Mirkin, C. A.
Nature. 2003, 425, 487.
53. Shukla, S.; Pasricha, R.; Sastry, M. J.N.N. 2009, 9, 6401.
54. Murawala, P.; Phadnis, S. M.; Bhonde, R. R.; Prasad, B. L. V. Colloids Surf. B:
Biointerfaces. 2009, 73, 224.
55. Zhang, L. Z.; Yu, J. C.; Yip, H. Y.; Li, Q.; Kwong, K. W.; Xu, A. W.; Wong, P.
K. Langmuir. 2003, 19, 10372.
56. Fadley, C. S.; Shirley, D. A. J. Res. Natl. Bur. Stand., 1970, 74, 543.
57. Singh, S.; D’Britto, V.; Prabhune, A. A.; Ramana, C. V.; Dhawan, A.; Prasad, B.
L. V.; New J. Chem. 2010, 34, 294.
58. Blanch, E. W.; Hecht, L.; Barron, L. D. Methods. 2003, 29, 196.
59. Urabe, H.; Sugawara, Y.; Ataka, M.; Rupprecht, A. Biophy. J. 1998, 74, 1533.
60. Ionov, R.; Hedoux, A.; Guinet, Y.; Bordat, P.; Lerbret, A.; Affouard, F.; Prevost,
D.; Descamps, M. In 5th International Discussion Meeting on Relaxations in
Complex Systems Lille, France, 2005, p 4430-4436.
61. Grabbe, E. S.; Buck, R. P. J. Am. Chem. Soc. 1989, 111, 8362.
62. Brunner, H.; H., S. Biochimica et Biophysica Acta (BBA)-Protein Structure.
1972, 271, 16.
63. Ishizaki, H.; Balaram, P., Ed. Biophys. J. 1981, 36, 509.
64. Nabiev, I. R.; Savchenko, V. A.; Efremov, E. S. J. Raman. Spec. 1983, 14, 375.
65. Singh, S.; Patel, P.; Jaiswal, S.; Prabhune, A. A.; Ramana, C. V.; Prasad, B. L. V.
New J. Chem. 2009, 33, 646.
66. Wang, W.; Chen, X.; Efrima, S. J. Phy. Chem. B. 1999, 103, 7238.
CHAPTER-V Lysozyme mediated
aqueous phase synthesis of
chromium (IV) oxide
nanoparticles at ambient
conditions

Chapter V
Ph.D Thesis Umesh Kumar University of pune
Pag
e10
7
Lysozyme mediated aqueous phase synthesis of
chromium (IV) oxide nanoparticles under ambient
conditions
Biomimetic synthesis is a powerful tool for the synthesis of nanomaterials with
complex shape, hierarchical organization and controlled size, shape and polymorph
under ambient conditions in aqueous environments. Increased understanding of
biomineralization mechanisms has greatly enhanced the possibilities of biomimetic
mineralization approaches to synthesize new materials. Biological materials naturally
display a variety of functional structures highly organized at the nanoscale. Various
bioassemblies have been shown to be template for complex, multidimensional
inorganic nanoarchitectures that are typically not available by conventional synthetic
methodologies. In addition to the various naturally occurring templates, the powerful
techniques developed in life sciences are interesting tools for engineering approaches
towards material science. Besides structural and morphological control during
synthesis, biotemplating procedures may add another dimension to inorganic
materials such as biofunctionality. Here in this chapter lysozyme mediated synthesis
of chromium (IV) oxide at ambient conditions is discussed where lysozyme is acting
both as capping as well as reducing agent. The chromium dioxide nanoparticles
prepared by this method are smaller than 10 nm and shows paramagnetic behaviour.

Chapter V
Ph.D Thesis Umesh Kumar University of pune
Pag
e10
8
5.1 Inrtoduction
Study of interaction between proteins and inorganic materials has been the focus of
research in various fields, e.g. biomedicine, biochemistry, biophysics, and materials
chemistry. Materials can be synthesized using either physical, chemical or biological
route, however biological synthesis is gaining popularity among scientists because of
various advantages like green approach, size control, synthesis of unstable phases
under ambient conditions which are difficult to stabilize by other routes without
using higher temperature or pressure. Micro-organisms synthesize highly organized
inorganic materials with remarkable properties by uptake of the necessary precursors
from the local environment followed by incorporation into functional structures and
materials under ambient conditions. Although the mechanisms of in vivo
crystallization processes are often not known fully at the molecular level, proteins
play a key role in the formation of inorganic matter. However, this in vivo synthesis
is typically limited to certain materials e.g. magnetite, silica, or calcium carbonate.
Biomineralization-based techniques have emerged as alternative to traditional
materials syntheses as they offer ambient fabrication conditions with high degree of
compositional specificity. Biomolecules, such as proteins, peptides and single-
stranded DNA, are some of the most underused, yet powerful and versatile building
blocks1–3
. Their molecular recognition properties are unmatched to conventional
synthetic analogues4. So far, many smart inorganic materials have been prepared,
which include virus-based synthesis of magnetic and semiconducting nanowires5,
bacterial surface layers as template for the synthesis of CdS superlattices6, DNA
assisted synthesis of gold particle nanowires7, and biotemplate synthesis of metal
nanowires8. Fully investigating and exploiting these selective biomolecules might be
of great importance in the development of novel materials, especially in the areas of
medicine and nanotechnology9,10
. Nowadays scientists are using known
biomineralization agents to fabricate non-natural compositions of materials. A
typical example of this is the use of silicateins, which were isolated from the sponge
Tethya aurantia catalytically produce SiO2,11
Anatase phase TiO212
and GaOOH13
.
This example demonstrates the possible generality of the enzymatic methods for
metal oxide material production. Similarly Feldheim and colleagues, reported the
production of metal oxide nanomaterials, TiO2 and SiO2, from the non-material
based proteases, papain and trypsin14
. Both enzymes possess a catalytic triad that is
Chapter V
Ph.D Thesis Umesh Kumar University of pune
Pag
e10
9
similar to that of silicatein-α, with papain possessing a cysteine and trypsin
possessing a serine at the active site. Synthesis of TiO2 was possible using either of
the enzymes whereas SiO2 was synthesized from papain only. These results are
surprising as papain, with a cysteine at the active site can produce SiO2 while trypsin,
whose active site more closely mimics that of silicatein, cannot. Results obtained so
far implies that the positioning of the active site with respect to the solution and the
materials precursors may play an important role. Presence of highly exposed active
site to drive non-specific reactions may be required to allow for efficient materials
processing15
. Some of the sequence characteristics native to biomineralizing proteins
are also present in proteins, such as hen egg white lysozyme (HEWL) or bovine
serum albumin (BSA), making them popular candidates for biomimetic studies16-28
.
Hen egg white lysozyme possesses an excess of positively charged residues, making
it an adequate analog to the Long Chain Poly Amines or the R5 peptide. Indeed,
HEWL has found application in the synthesis of silica, as well as titania (a
nonbiogenic material).23-25
Besides lysozyme, a variety of other commercially
available enzymes, including R-amylase and pepsin, have been utilized as templates
for the production of nanomaterials26,29
. Inspired by the variety of proteins present in
nature, we chose lysozyme (hen egg white) as a model system to synthesize
chromium (IV) oxide nanoparticles to understand the mechanism of interaction.
Lysozyme is a protein with relatively high stability and is responsible for breaking
down the polysaccharide walls of many types of bacteria.30
Furthermore it has also
been confirmed that it shows chelating interactions with metal ions31-32
. Thus it is
reasonable to expect the function of lysozyme in the formation of inorganic
nanomaterials. This protein has also been found to be a new morphology-directing
agent to direct the growth of single crystal bismuth sulfide and oxide nanowires.
Although the exact mechanism of the reactions is not well known, there is no doubt
that the bio-molecules used must have played an important role in the formation of
the one dimensional (1D) nanostructures. The biomolecules, irrespective of whether
they are sugars or protein, peptide and amino acids have several functional groups
such as –OH, –NH2, and –COOH, which have strong coordination ability toward the
inorganic ions. These bio-molecules might react with inorganic species through the
functional groups to form special intermediates, and then direct the growth and/or the
assembly of the 1D nanostructures by their special structures. For example starch
molecules have been reported to be chain like structures with many hydroxyl (–OH)
Chapter V
Ph.D Thesis Umesh Kumar University of pune
Pag
e11
0
groups on their surfaces33,34
. During the synthesis of Te nanowires, these –OH
groups might react with TeO42-
groups through hydrogen bonds to form chain like
intermediate compounds. Thus the long chains of starch could serve as directing
template for the growth of tellurium nanowires. This biomolecule-assisted method
expands the application of biomolecules to the green synthesis of other
nanostructures and could promise for extension to topologically more intricate
structures in addition to the generation of other 1D nanomaterials. Lysozyme has not
been so far used that profoundly in aqueous phase synthesis of nanomaterials except
few35-38
. Here we report the lysozyme mediated aqueous phase synthesis of
Chromium (IV) oxide nanoparticles which are smaller than 10 nm and show
paramagnetism at lower temperature. Chromium (IV) oxide is unique rutile-type
transition metal dioxides39
which exhibits ferromagnetic (Tc = 395 K) and metallic
properties40
. These properties make this oxide the most desirable material for
magnetic recording medium in the form of tapes. The chromium ions in CrO2 are in
the Cr+4
state with a magnetic moment of 2µB per ion. The two 3d electrons occupy
spin-split t2g subbands, one localized and the other in a half-filled band. They are
strongly coupled by the on-site exchange interaction JH ~1 eV41
. Surface of CrO2,
generally has a native oxygen rich layer of thermodynamically stable Cr2O3 which is
generally few atomic layer thick42
. Cr2O3 orders antiferromagnetically below 307
K43
. The characterization of native oxide Cr2O3 surface layer on CrO2 films by
Cheng et al revealed that CrO2 might polarize the Cr2O3 layer44
. The native Cr2O3
surface layer acts as a tunnel barrier45
and is useful for applications with desirable
magneto transport properties. At the temperature higher than 288oC, CrO2 start
decomposing into the Cr2O340
.
5.2 Materials and methods
Chemicals: Lysozyme was purchased from Sigma-Aldrich Inc. This protein was
used as received through out nanoparticles synthesis. Potassium dichromate
(K2Cr2O7) was purchased from S. D. fine-chemicals India and used as received.
UV-Visible Spectroscopy measurement. Ultraviolet-visible absorbance was
recorded on a Jasco UV-vis-NIR (Model V570) dual beam spectrophotometer
operated at a resolution of 2 nm.

Chapter V
Ph.D Thesis Umesh Kumar University of pune
Pag
e11
1
Fourier transform infrared spectroscopy (FTIR). Fourier Transform Infra red
Spectroscopy (FTIR) was carried out on a Perkin–Elmer Spectrum One instrument
operated in the diffuse reflectance mode at a resolution of 2 cm-1
. To obtain good
signal to noise ratio, 128 scans of the film were taken in the range 450 – 4000 cm-1
.
X ray Diffraction pattern (XRD). Powder XRD patterns were recorded using
PHILIPS X’PERT PRO instrument equipped X’celerator, a fast solid-state detector
on drop-coated sample on glass substrate. The sample was scanned using X’celerator
with a total number of active channels of 121. Iron-filtered Cu K radiation
(λ=1.5406 Å) was used. XRD patterns were recorded in the 2θ range of 20°- 80°.
Thermogravimetric analysis (TGA) and DTA. Thermogravimetric analysis (TGA)
for lysozyme synthesized CrO2 was performed on Q5000 V2.4 Build 223 instrument
by applying scan rate 10°C min-1
in presence of air.
X-ray photoemission spectroscopy (XPS). X-ray photoelectron spectroscopy (XPS)
for nanoparticles were performed on VG MicroTech ESCA 3000 instrument at a
pressure <1x10⁻⁹
Torr with an overall resolution of 1 eV. The spectra was recorded
with unmonochromatic Mg K alpha radiation (photon energy = 1253.6 eV) at a pass
energy of 50 eV and electron take off angle (angle between electron emission
direction and surface plane) of 60°.
Transmission Electron Microscopy (TEM) measurements. Determination of
nanoparticle shape and size were performed on FEI, Technai F30, electron
microscope (TEM) operated at an accelerating voltage of 300 kV. For this purpose,
samples were prepared by drop-coating the particles suspended in aqueous medium
on carbon coated copper grids. Selected area electron diffraction (SAED) analysis
was carried-out on the same grids.
Magnetic measurement. For magnetization vs. magnetic field measurements, we
used a Physical Property Measurement System (PPMS) from Quantum Design Inc.,
San Diego, CA., equipped with a 7 T superconducting magnet and a vibrating sample
magnetometer operating at 40 Hz.
5.3 Results and discussion
5.3.1 Synthesis of lysozyme capped chromium (IV) oxide
nanoparticles. 10 mM of K2Cr2O7 was added to aqueous solution (3mg/ml) of
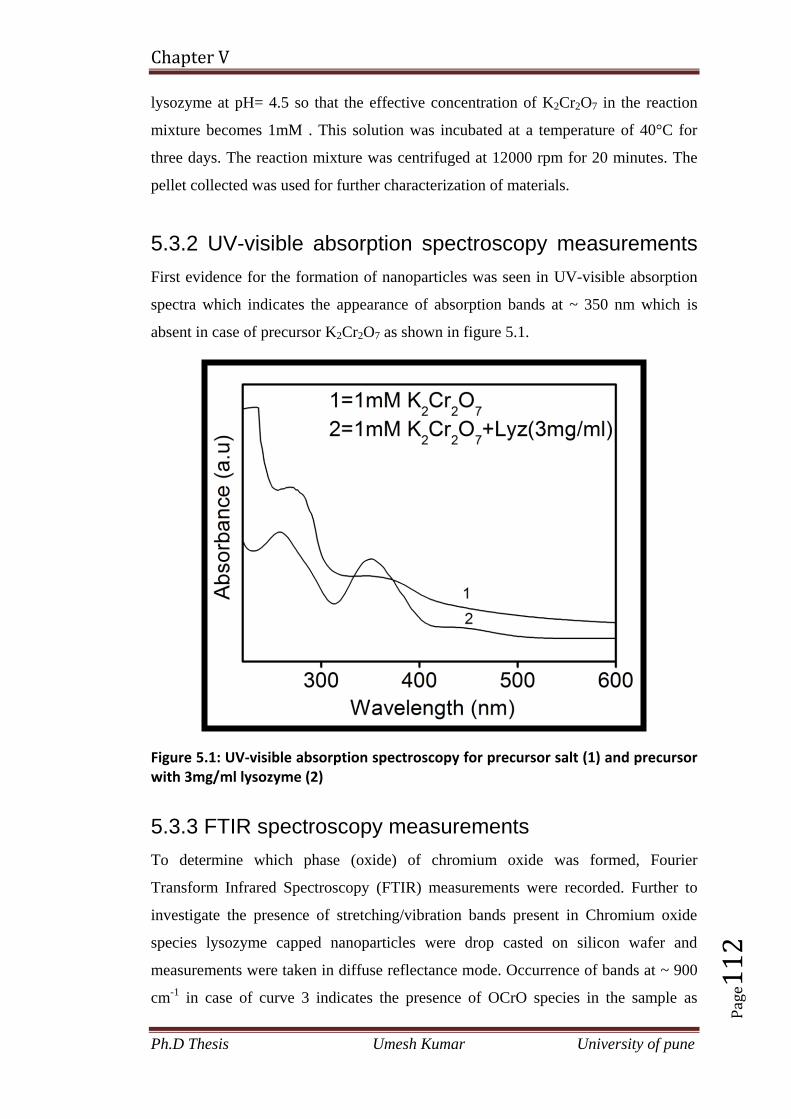
Chapter V
Ph.D Thesis Umesh Kumar University of pune
Pag
e11
2
lysozyme at pH= 4.5 so that the effective concentration of K2Cr2O7 in the reaction
mixture becomes 1mM . This solution was incubated at a temperature of 40°C for
three days. The reaction mixture was centrifuged at 12000 rpm for 20 minutes. The
pellet collected was used for further characterization of materials.
5.3.2 UV-visible absorption spectroscopy measurements
First evidence for the formation of nanoparticles was seen in UV-visible absorption
spectra which indicates the appearance of absorption bands at ~ 350 nm which is
absent in case of precursor K2Cr2O7 as shown in figure 5.1.
Figure 5.1: UV-visible absorption spectroscopy for precursor salt (1) and precursor with 3mg/ml lysozyme (2)
5.3.3 FTIR spectroscopy measurements
To determine which phase (oxide) of chromium oxide was formed, Fourier
Transform Infrared Spectroscopy (FTIR) measurements were recorded. Further to
investigate the presence of stretching/vibration bands present in Chromium oxide
species lysozyme capped nanoparticles were drop casted on silicon wafer and
measurements were taken in diffuse reflectance mode. Occurrence of bands at ~ 900
cm-1
in case of curve 3 indicates the presence of OCrO species in the sample as
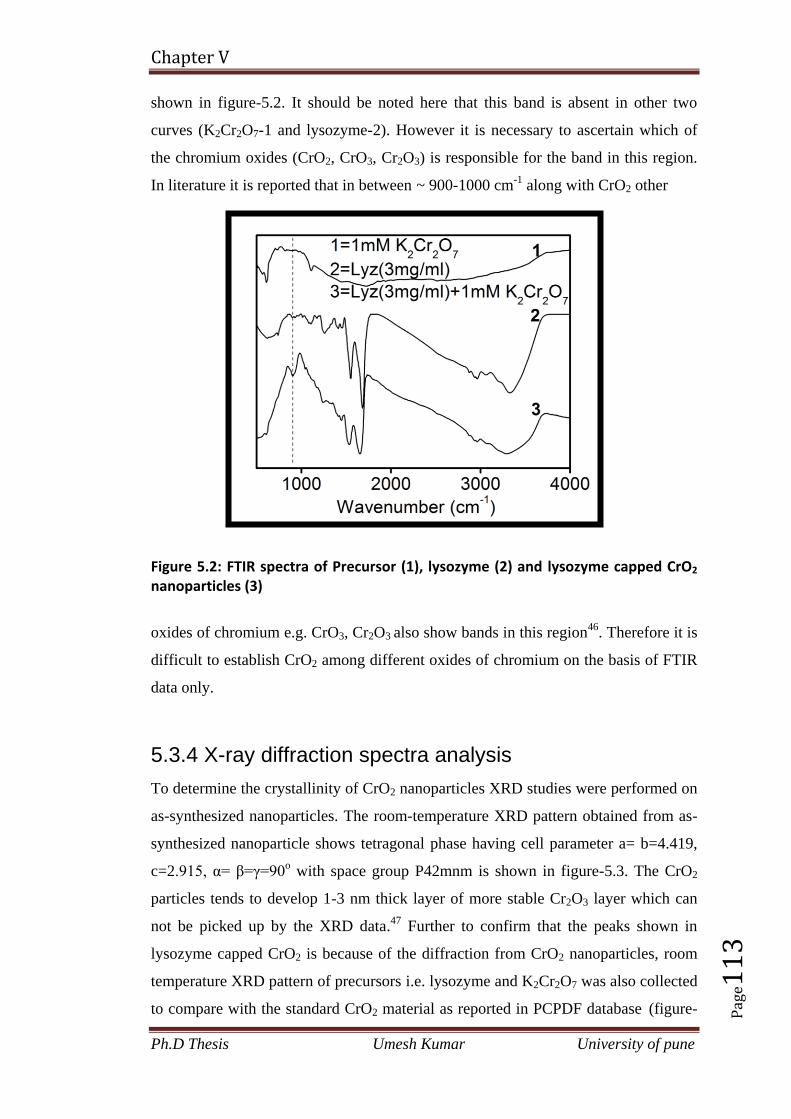
Chapter V
Ph.D Thesis Umesh Kumar University of pune
Pag
e11
3
shown in figure-5.2. It should be noted here that this band is absent in other two
curves (K2Cr2O7-1 and lysozyme-2). However it is necessary to ascertain which of
the chromium oxides (CrO2, CrO3, Cr2O3) is responsible for the band in this region.
In literature it is reported that in between ~ 900-1000 cm-1
along with CrO2 other
Figure 5.2: FTIR spectra of Precursor (1), lysozyme (2) and lysozyme capped CrO2 nanoparticles (3)
oxides of chromium e.g. CrO3, Cr2O3 also show bands in this region46
. Therefore it is
difficult to establish CrO2 among different oxides of chromium on the basis of FTIR
data only.
5.3.4 X-ray diffraction spectra analysis
To determine the crystallinity of CrO2 nanoparticles XRD studies were performed on
as-synthesized nanoparticles. The room-temperature XRD pattern obtained from as-
synthesized nanoparticle shows tetragonal phase having cell parameter a= b=4.419,
c=2.915, α= β=γ=90o with space group P42mnm is shown in figure-5.3. The CrO2
particles tends to develop 1-3 nm thick layer of more stable Cr2O3 layer which can
not be picked up by the XRD data.47
Further to confirm that the peaks shown in
lysozyme capped CrO2 is because of the diffraction from CrO2 nanoparticles, room
temperature XRD pattern of precursors i.e. lysozyme and K2Cr2O7 was also collected
to compare with the standard CrO2 material as reported in PCPDF database (figure-

Chapter V
Ph.D Thesis Umesh Kumar University of pune
Pag
e11
4
5.3). From figure-5.3 it can be clearly seen that the peaks observed in lysozyme
capped CrO2 nanoparticles are not present in precursors.
Figure 5.3: X-ray diffraction (XRD) pattern of crystalline CrO2 nanoparticles synthesized by lysozyme at different concentration (1&2), precursor salt (3) and bulk CrO2 as reported in PCPDF Database
5.3.5 X-ray Photo-electron Spectroscopy (XPS)
measurements:
To determine the purity of these nanoparticles X-ray photoelectron spectroscopy
(XPS) measurements were recorded. As-obtained XPS core level spectra were
background corrected using the Shirley algorithm and chemically distinct species
were resolved using a nonlinear least squares fitting procedure. The core level
binding energies (B.E.) were aligned with the carbon binding energy of 285 eV.
Background corrected XPS spectra for lysozyme capped CrO2 nanoparticles,
commercially available Cr2O3 and K2Cr2O7 were shown in figure 5.4. XPS spectra of
Cr2p can be split into two curves due to spin orbital splitting i.e. Cr2p1/2
aand Cr2p3/2
at a binding energy of 585.8 eV and 575.9 eV respectively corresponding to CrO2
which matches with its reported literature value48
. An additional peak is observed at
a binding energy of 577.3 eV which could be due to presence of Cr (III) species
found in Cr(OH)349
. It is clearly observed in figure 5.4 that the intensity of Cr (IV)
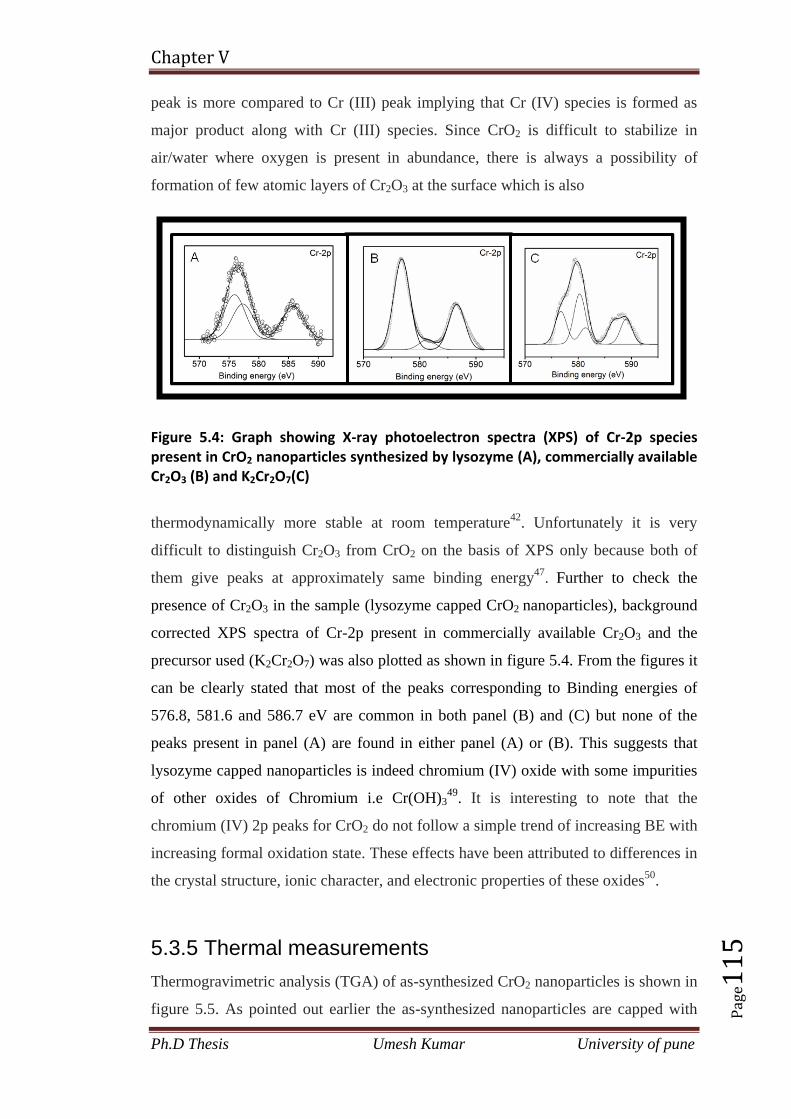
Chapter V
Ph.D Thesis Umesh Kumar University of pune
Pag
e11
5
peak is more compared to Cr (III) peak implying that Cr (IV) species is formed as
major product along with Cr (III) species. Since CrO2 is difficult to stabilize in
air/water where oxygen is present in abundance, there is always a possibility of
formation of few atomic layers of Cr2O3 at the surface which is also
Figure 5.4: Graph showing X-ray photoelectron spectra (XPS) of Cr-2p species present in CrO2 nanoparticles synthesized by lysozyme (A), commercially available Cr2O3 (B) and K2Cr2O7(C)
thermodynamically more stable at room temperature42
. Unfortunately it is very
difficult to distinguish Cr2O3 from CrO2 on the basis of XPS only because both of
them give peaks at approximately same binding energy47
. Further to check the
presence of Cr2O3 in the sample (lysozyme capped CrO2 nanoparticles), background
corrected XPS spectra of Cr-2p present in commercially available Cr2O3 and the
precursor used (K2Cr2O7) was also plotted as shown in figure 5.4. From the figures it
can be clearly stated that most of the peaks corresponding to Binding energies of
576.8, 581.6 and 586.7 eV are common in both panel (B) and (C) but none of the
peaks present in panel (A) are found in either panel (A) or (B). This suggests that
lysozyme capped nanoparticles is indeed chromium (IV) oxide with some impurities
of other oxides of Chromium i.e Cr(OH)349
. It is interesting to note that the
chromium (IV) 2p peaks for CrO2 do not follow a simple trend of increasing BE with
increasing formal oxidation state. These effects have been attributed to differences in
the crystal structure, ionic character, and electronic properties of these oxides50
.
5.3.5 Thermal measurements
Thermogravimetric analysis (TGA) of as-synthesized CrO2 nanoparticles is shown in
figure 5.5. As pointed out earlier the as-synthesized nanoparticles are capped with

Chapter V
Ph.D Thesis Umesh Kumar University of pune
Pag
e11
6
lysozyme that prevent them from aggregation. The presence of this coating even after
intense centrifugation is proven by the observation of almost 80% weight-loss during
heating the particles up to 700 °C, which is attributed to the loss of moisture and
biomolecules bound on the nanoparticle surface. Weight loss shown in figure 5.5 is a
multi step process. First loss starts at beginning and continues up to 280 °C and is
Figure 5.5: Graph showing TGA-DTA curve of lysozyme capped crystalline CrO2 nanoparticles
attributed to the complete loss of moisture and partial removal of biomolecules
(lysozyme). Second major weight loss starts at around 300 °C and continues up to
420 °C. This loss is also marked by appearance of an sharp exothermic peak (as
shown by Differential Thermal Analysis curve) corresponding to rutile phase
conversion of CrO2 to corundum phase Cr2O3. The temperatures and profiles of these
exotherms varied with the heating rate51,52
. Above 420 °C third weight loss was
observed which is attributed to complete decomposition of CrO2 to Cr2O3.
5.3.6 Differential scanning calorimetry (DSC)
measurements
To confirm the phase purity of lysozyme capped CrO2 nanoparticles DSC
measurements were performed on these as synthesized particles. As temperature
increases at constant rate there is endothermic removal of moisture till 120 °C as

Chapter V
Ph.D Thesis Umesh Kumar University of pune
Pag
e11
7
shown in figure 5.6. Further as heating continues biomolecules present on the surface
of CrO2 nanoparticles start degrading. At temperature around (280-320) °C, strong
endothermic peak attributing to phase conversion of CrO2 into Cr2O3 was observed.
Around 400 °C it shows the occurrence of exothermic peak indicating the
decomposition of CrO2 into Cr2O3 which was also observed in TGA curve. These
measurements were done in presence of nitrogen (inert atmosphere). It is interesting
to note that Curie temperature (Tc) around 120 °C was not observed in the DSC
curve because the lysozyme capped nanoparticles were very small (less than 10 nm)
and showed paramagnetic behaviour as discussed in magnetic measurement results.
Figure 5.6: DSC curve of lysozyme capped crystalline CrO2 nanoparticles
5.3.7 Transmission electron microscopic analysis
Finally to determine the shape, size and crystallinity of lysozyme capped CrO2
nanoparticles, transmission electron microscopy analysis was performed on drop
casted carbon coated, copper TEM grids. Electron micrograph shown in figure 5.7
suggests, that these particles are clusters of small nanoparticles which are
polycrystalline in nature as evident from the diffraction image which sows
combination of diffuse ring and dot pattern (SAED). These clusters are
approximately 10 nm or less than that and are irregular in shape.

Chapter V
Ph.D Thesis Umesh Kumar University of pune
Pag
e11
8
Figure 5.7: Transmission electron micrograph showing SAED (Selected Area Electron Diffraction) and its corresponding images of lysozyme capped crystalline CrO2 nanoparticles
5.3.8 Magnetic measurements
To probe the magnetic property of the lysozyme capped CrO2 particles we performed
field dependence of magnetization at 5 K. M-H loop show that magnetization does
not saturate up to 50 kOe magnetic field because this magnetic field is too low to
saturate the magnetization (figure 5.7). No opening up of M-H loop at low
temperature indicates the superparamagnetic nature of the sample. As seen from the
TEM image the crystallite are very small in size and they agglomerate to form the
larger clumps. The small crystallite below single domain size of the particles may be
responsible for the superparamagnetic nature of the sample53
.
Figure 5.7: Magnetization versuss magnetic field measurements of lysozyme capped CrO2 nanoparticles at 5 K

Chapter V
Ph.D Thesis Umesh Kumar University of pune
Pag
e11
9
5.4 Conclusion
A simple facile method has been developed for the aqueous phase synthesis of
Chromium (IV) oxide nanoparticles utilizing the chelation and complexation abilities
of amino acids present in the lysozyme. Being metastable it is very difficult to
stabilize pure CrO2 in water. Since these nanoparticles are very small in size (<10
nm) and they are passivated with thick layer of protein (lysozyme), as indicated by
thermo gravimetric studies (TGA), it is very difficult to get magnetic signals without
diamagnetic background. Chromium (IV) oxide is unique rutile-type transition metal
dioxides which exhibits ferromagnetic (Tc = 395 K) and metallic properties. These
nanoparticles cannot be heated to remove proteins because the Curie temperature for
CrO2 is very low i.e. 288°C. Other way is to remove these background signals
manually after magnetic measurements. Here in this chapter we have reported the
lysozyme mediated aqueous phase synthesis of mixed phase of chromium oxide
comprising CrO2 and Cr(OH)3 with Chromium (III) oxide present mainly on the
surface. Here lysozyme is acting both as capping as well as reducing agent. These
nanoparticles show paramagnetic behaviour.
5.5 References
1. Hartgerink, J. D.; Beniash E.; Stupp, S. I. Science. 2001, 294, 1684.
2 . Dujardin, E.; Hsin, L. B.; Wang, C.R.C.; Mann, S. Chem. Commun. 2001, 1264.
3. Lee, S. W.; Mao, C. B.; Flynn, C. E.; Belcher, A. M. Science. 2002, 296, 892.
4. Mirkin, C. A.; Taton, T. A. Nature. 2000, 408, 626.
5. Mao, C.; Solis, D. J.; Reiss, B. D.; Kottmann, S. T.; Sweeney, R. Y.; Hayhurst, A.;
Georgiou, G.; Iverson, B.; Belcher, A. M. Science. 2004, 303, 213.
6. Shenton, W.; Pum, D.; Sleytr, U. B.; Mann, S. Nature. 1997, 389, 585.
7. Patolsky, F.; Weizmann, Y.; Lioubashevski, O.; Willner, I. Angew. Chem. Int. Ed.
2002, 41, 2323.
8. Knez, M.; Bittner, A. M.; Boes, F.; Wege, C.; Jeske, H.; MaiB, E.; Kern, K. Nano
Lett. 2003, 3, 1079.
9. Storhoff, J. J.; Lazarides, A. A.; Mucic, R. C.; Mirkin, C. A.; Letsinger, R. L.;
Schatz, G. C. J. Am. Chem. Soc. 2000, 122, 4640.
10. Niemeyer, C. M.; Adler, M.; Gao, S.; Chi, L. Angew. Chem. Int. Ed. 2000, 39,
3055.
Chapter V
Ph.D Thesis Umesh Kumar University of pune
Pag
e12
0
11. Cha, J. N.; Shimizu, K.; Zhou, Y.; Christiansen, S. C.; Chmelka, B. F.; Stucky,
G. D. Morse, D. E. Proc. Natl. Acad. Sci. U. S. A. 1999, 96, 361.
12. Sumerel, J. L.; Yang, W. ; Kisailus, D.; Weaver, J. C.; Choi, J. H.; Morse, D. E.
Chem. Mater. 2003, 15, 4804.
13. Kisailus, D.; Choi, J. H.; Weaver, J. C.; Yang, W.; Morse, D. E. Adv. Mater.
2005, 17, 314.
14. Smith, G. P.; Baustian, K.; Ackerson, C. J.; Feldheim, D. L. J. Mater. Chem.
DOI:10.1039/b909286b.
15. Marc R. Knecht. J. Mater. Chem. 2009, 19, 8276.
16. Baeuerlein, E. Biomineralization., Progress in Biology, Molecular Biology, and
Application; Wiley-VCH Verlag GmbH & Co. KGaA:Weinheim, Germany, 2004.
17. Baeuerlein, E. Handbook of Biomineralization, Biological Aspects and Structure
Formation; Wiley-VCH Verlag GmbH & Co. KGaA: Weinheim, Germany, 2007.
18. Sumper, M.; Kroger, N. J. Mater. Chem. 2004, 14, 2059.
19. Muller, W. E. G.; Belikov, S. I.; Tremel, W.; Perry, C. C.; Gieskes, W. W. C.;
Boreiko, A.; Schroder, H. C. Micron. 2006, 37, 107.
20. Muller, W. E. G.; Krasko, A.; Le Pennec, G.; Schroder, H. C. Microsc. Res.
Tech. 2003, 62, 368.
21. Weaver, J. C.; Morse, D. E. Microsc. Res. Tech. 2003, 62, 356.
22. Yang, L.; Xing, R.; Shen, Q.; Jiang, K.; Ye, F.; Wang, J.; Ren, Q. J.Phys. Chem.
B. 2006, 110, 10534.
23. Coradin, T.; Coupe´, A.; Livage, J. Colloids Surf. B. 2003, 29, 189.
24. Shiomi, T.; Tsunoda, T.; Kawai, A.; Mizukami, F.; Sakaguchi, K. Chem. Mater.
2007, 19, 4486.
25. Luckarift, H. R.; Dickerson, M. B.; Sandhage, K. H.; Spain, J. C. Small 2006, 2,
640.
26. Rangnekar, A.; Sarma, T. K.; Singh, A. K.; Deka, J.; Ramesh, A.;
Chattopadhyay, A. Langmuir. 2007, 23, 5700.
27. Brelle, M. C.; Torres-Martinez, C. L.; McNulty, J. C.; Mehra, R. K.; Zhang, J. Z.
Pure Appl. Chem. 2000, 72, 101.
28. Xie, J.; Lee, J. Y.; Wang, D. I. C. J. Phys. Chem. C 2007, 111, 10226.
29. Chiu, T. C.; Chiou, S. H.; Hsieh, M. M.; Chen, Y. T.; Chang, H. T. J. Nanosci.
Nanotechnol. 2005, 5, 2128.
30. Kimball, J. W. Biology, 6th, Addison-Wesley Pub. Co.,1994.

Chapter V
Ph.D Thesis Umesh Kumar University of pune
Pag
e12
1
31. Sesta, B.; Gente, G.; Iovino, A.; Laureti, F.; Michiotti, P.; Paiusco, O.; Palacios,
A. C.; Persi, L.; Princi, A.; Sallustio, S.; Sarnthein-Graf, C.; Capalbi, A.; Mesa, C. L.
J. Phys. Chem. B. 2004, 108, 3036.
32. Mehta, S. B.; Shah, M. L. Asian J. Chem. 2002, 14, 236.
33. Kimball JW (1994) Biology, 6th edn. Addison-Wesley Publishing Company,
Mass., USA.
34. Hu HW (1990) Organic chemistry, 2nd edn. High Education Publisher, Beijing,
China.
35. Luckarift, H. R.; Dickerson, M. B.; Sandhage, K. H.; Spain, J. C. small. 2006, 2,
640.
36. Gao, F.; Lu, Q.; Komarneni, S. Chem. Comm. 2005, 531.
37. Eby, D. M.; Schaeublin, N. M.; Farrington, K. E.; Hussain, S. M.; Johnson, G. R.
ACS Nano. 2009, 3 (4), 984.
38. Das, R.; Jagannathan, R.; Sharan, C.; Kumar, U.; Poddar, P. J. Phys. Chem. C,
2009, 113 (52), 21493.
39. Rogers, D. B.; Shannon, R. D.; Sleight, A. W.; Gillson, J. L. Inorg.Chem. 1969,
8, 841.
40. Chamberland, B. L.; CRC Crit. Rev. Solid State Mater. Sci. 1977, 7, 1.
41. Gupta, A.; Li, X. W.; Xiao, G. J. Appl. Phys. 1 May 2000, Vol. 87, No. 9.
42. Robbert, P. S.; Geisler, H.; Ventrice, C. A.; Van Ek, J.; Chaturvedi, S.;
Rodriguez, J. A.; Kuhn, M.; Diebold, U. J. Vac. Sci. Technol. A. 1998. 16, 990.
43. Brand, E.; Kellett, D.; Enever, M. D.; Fellows, J. T.; Egdell, R. G. J. Mater.
Chem. 2005, 15, 1141.
44. Cheng, R.; Xu, B.; Borca, C. N.; Sokolov, A.; Yang, C. S.; Yuan, L.; Liou, S. H.;
Doudin, B.; Dowben, P. A. Appl. Phys. Lett. 2001, 79, 3122.
45. Hwang, H. Y.; Cheong, S. W. Science 1997, 278, 1607.
46. Jeiowska-Trzebiatowska, B.; Hanuza, J.; Wojciechowski, W.; Nawojska, J.
Inorganica Chimica Acta. June, 1968.
47. Dai, J.; Tang, J.; Xu, H.; Spinu, L.; Wang, W.; Wang, K.; Kumbhar, A.; Li, M.;
Diebold, U. Appl. Phys. Lett. 2000, 77, No. 18.
48. Wagner, C.D.; Moulder, J.F.; Davis, - L.E.; Riggs, W.M. Perking-Elmer
Corporation, Physical Electronics Division.
49. Stypula, B.; Stoch, J. Corrosion Science, 1994, 36, 2159.

Chapter V
Ph.D Thesis Umesh Kumar University of pune
Pag
e12
2
50. Hanafi, Z. M.; Ismail, F. M.; Mohamed, A. K. Z. Phys. Chem.(Munich) 1996,
194, 61.
51. Richardson, R. T. J. Mater. Sc. Letts. 1989, 8, 1264.
52. Chen, Y.J.; Zhang, X. Y.; Li, Z. Y. Chemical Physics Letters. 2003, 375, 213.
53. Cullity, B. D.; Graham, C. D. Introduction to magnetic materials, John Wiley &
Sons, Inc., Publication.

CHAPTER-VI CONCLUSIONS

Chapter VI
Ph.D Thesis Umesh Kumar University of Pune
Pag
e12
3
Conclusions
(Images courtesy: Various sources at http://images.google.com)
This chapter contains conclusions of the salient features of the work described in this
thesis and the scope for future potential developments in this field.
6.1 Summary of the work
Nature provides inspiration for designing materials and systems, which derive their
functions from highly organized structures. Biological hard tissues are hybrid
materials having both inorganics within a complex organic matrix, the molecular
scaffold controlling inorganic structures. Biocomposites incorporate both
biomacromolecules such as proteins, lipids and polysaccharides, and inorganic
materials, such as hydroxyapatite, silica, magnetite and calcite. The ordered
organization of hierarchical structures in organisms begins via the molecular
recognition of inorganics by proteins that control interactions and followed by the
highly efficient self-assembly across scales. Following the molecular biological
principle, proteins could also be used in controlling materials formation in practical
engineering via self-assembled, hybrid, functional materials structures. In molecular
biomimetics, material-specific peptides could be the key in the molecular
engineering of biology-inspired materials. With the recent developments of

Chapter VI
Ph.D Thesis Umesh Kumar University of Pune
Pag
e12
4
nanoscale engineering in physical sciences and the advances in molecular biology,
we now combine genetic tools with synthetic nanoscale constructs to create a novel
methodology. We first tactfully select and/or design peptides with specific binding to
functional solids, tailor their binding and assembly characteristics, develop
bifunctional peptide/protein constructs with both material binding and biological
activity, and use these as molecular synthesizers, erectors and assemblers.
In this thesis, we have described the bioinspired synthesis of metal/metal-oxide
nanomaterials. We observe that the marine isolate i.e Brevibacterium casei on
exposure to 1mM cobalt acetate extracellularly forms 6 nm, spinnel structure,
ferromagnetic Co3O4 nanoparticles passivated by proteins of microbial origin.
During this synthesis process Scanning Electron Microscopy real time kinetics
revealed that these bacteria tend to aggregate or form clusters and this tendency
increases gradually until 72 h compared to control cells where individual cells are
clearly visible even after 72 h. We attributed this behaviour to a kind of stress
response where many bacterial strains produce excess extracellular
exopolysaccharide, slime, or form capsule to protect themselves against metal ions.
Further SDS PAGE analysis revealed that there were over expression of two proteins
in treated bacterial cells which corresponds to ~ 30 and 65 kDa, belonging to oxido-
reductase family of enzymes. Here we report for the first time that Co2+
was supplied
to the bacterial system in the form of cobalt acetate, but the nanoparticles formed
showed the presence of both Co2+
and Co3+
ions. Such type of oxidation/reduction
mechanism has been reported for other metals as well; for example arsenite oxidase
converts As(III) to As(V) and arsenate reductase converts As(V) to As(III).
After biochemical analysis we were interested in determining the biophysical
properties of these bacterial cells during synthesis of nanoparticles. For this we have
used Atomic Force Microscopy which is a very sensitive surface technique. We
performed force-distance spectroscopy measurements on these cells to obtain
information like changes in the surface-topography, surface-adhesion, indentation-
depth, and Young’s modulus of a metal-tolerant marine bacterium, Brevibacterium
casei after the exposure to the Co2+
during biosynthesis of nanoparticles. Significant
changes in the morphology as well as elastic and adhesive properties of the
Brevibacterium casei where an increase in the adhesive properties and the

Chapter VI
Ph.D Thesis Umesh Kumar University of Pune
Pag
e12
5
indentation depth of the bacterial surfaces and a decrease in the cell stiffness after
several hours of exposure to the cobalt acetate was observed.
In most of the microbial syntheses either some enzymes or biomolecules are
involved. Therefore we have chosen hen egg white lysozyme to synthesize
metal/metal-oxide nanoparticles. We developed a simple facile method for synthesis
of metal nanoparticles (gold and silver) utilizing the reduction abilities of amino
acids present in the lysozyme. Our experimental results prove that hydroxyl groups
in tyrosine residues and the amine group in tryptophan residues were found to be
responsible for silver and gold nanoparticles formation respectively. Formation of
gold nanoparticles was assisted by silver through galvanization/transmetallation
reaction. Further by controlling the availability of tyrosine and tryptophan in
lysozyme by treatment with amino acid specific chemical regents we could precisely
control the size of nanoparticles. Further our invitro results prove that gold
nanoparticles prepared by this method are biocompatible and retain antibacterial
property. We have also shown the use of Surface Enhanced RAMAN spectroscopy to
precisely determine the functional groups responsible in the surface capping of gold
and silver nanoparticles synthesized by the hen egg white- lysozyme.
Further we have extended the same method to synthesize metastable CrO2 in aqueous
phase. Being metastable we got mixed phase comprising CrO2 and Cr(OH)3, with
Chromium (III) oxide present mainly on the surface.. We can say that a simple facile
method has been developed for the aqueous phase synthesis of Chromium (IV) oxide
nanoparticles utilizing the chelation and complexation abilities of amino acids
present in the lysozyme. These nanoparticles are smaller than 10 nm and shows
paramagnetic behaviour.
6.2 Scope for future work
One of the most challenging aspects of microbial synthesis of nanomaterials is to
identify the proteins/enzymes and their corresponding DNA fragment which actually
governs the biochemical pathway. This would lead to synthesis of respective
nanomaterials in bulk quantity and thus biotechnologists would be able to fulfil the
industrial needs.

Chapter VI
Ph.D Thesis Umesh Kumar University of Pune
Pag
e12
6
The Atomic Force Microscopy measurements can be done under physiological
conditions in fluid cell to give a more accurate and real picture of changes in the
nanomechanical properties of bacterial cells due to interaction with metal ions.
Similar force spectroscopy measurements can be performed on mammalian cells to
see the effect of nanoparticles/metal ions on them. This kind of information is very
useful for biological application purpose.
Further lysozyme mediated synthesis approach that we have used for synthesizing
metal/metal-oxide nanoparticles can be extended for synthesizing metal alloys (Au-
Ag) or core shell particles which has got different properties and application.
Similarly lysozyme mediated synthesis can be tried at different temperature to see its
shape and size controlling properties.
Invio toxicity studies of nanomaterials can be done in order to put forth well-
accepted mechanism which can be developed into technology.
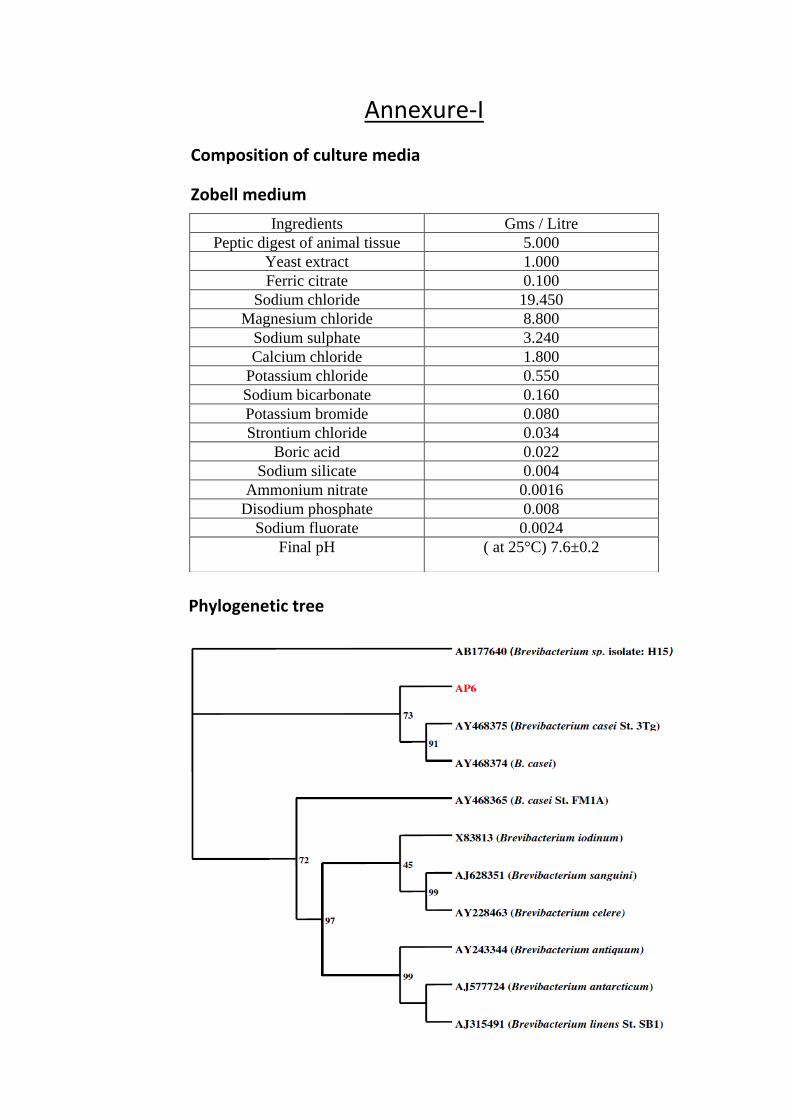
Annexure-I
Composition of culture media
Zobell medium
Phylogenetic tree
Ingredients Gms / Litre
Peptic digest of animal tissue 5.000
Yeast extract 1.000
Ferric citrate 0.100
Sodium chloride 19.450
Magnesium chloride 8.800
Sodium sulphate 3.240
Calcium chloride 1.800
Potassium chloride 0.550
Sodium bicarbonate 0.160
Potassium bromide 0.080
Strontium chloride 0.034
Boric acid 0.022
Sodium silicate 0.004
Ammonium nitrate 0.0016
Disodium phosphate 0.008
Sodium fluorate 0.0024
Final pH ( at 25°C) 7.6±0.2

Annexure-II
Medium used for cytotoxicity assay: (DMEM)
Composition of Dulbecco’s Modified Eagle Medium (DMEM)
Ingredients g/l
Glucose 4.5
L-Glutamine Traces
Sodium bicarbonate 3.7
Sodium pyruvate: 3.7
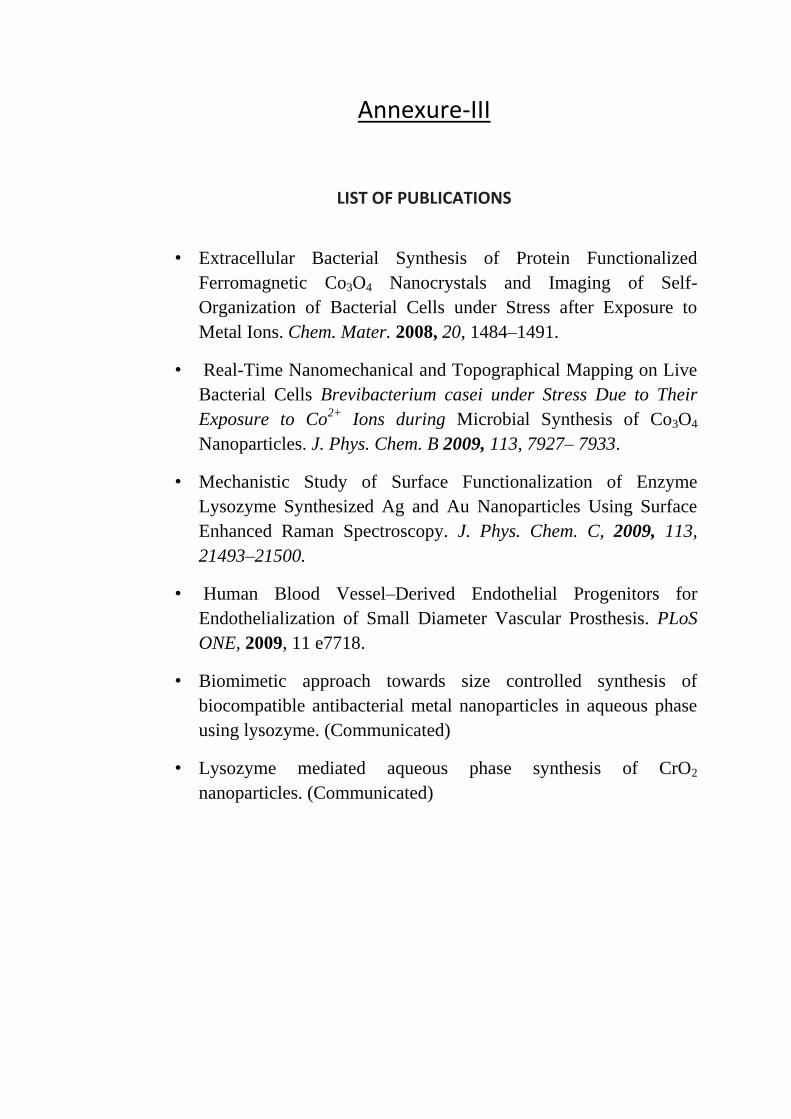
Annexure-III
LIST OF PUBLICATIONS
• Extracellular Bacterial Synthesis of Protein Functionalized
Ferromagnetic Co3O4 Nanocrystals and Imaging of Self-
Organization of Bacterial Cells under Stress after Exposure to
Metal Ions. Chem. Mater. 2008, 20, 1484–1491.
• Real-Time Nanomechanical and Topographical Mapping on Live
Bacterial Cells Brevibacterium casei under Stress Due to Their
Exposure to Co2+
Ions during Microbial Synthesis of Co3O4
Nanoparticles. J. Phys. Chem. B 2009, 113, 7927– 7933.
• Mechanistic Study of Surface Functionalization of Enzyme
Lysozyme Synthesized Ag and Au Nanoparticles Using Surface
Enhanced Raman Spectroscopy. J. Phys. Chem. C, 2009, 113,
21493–21500.
• Human Blood Vessel–Derived Endothelial Progenitors for
Endothelialization of Small Diameter Vascular Prosthesis. PLoS
ONE, 2009, 11 e7718.
• Biomimetic approach towards size controlled synthesis of
biocompatible antibacterial metal nanoparticles in aqueous phase
using lysozyme. (Communicated)
• Lysozyme mediated aqueous phase synthesis of CrO2
nanoparticles. (Communicated)