Embed Size (px)
Citation preview
Bioregional Plan for the Ekurhuleni Metropolitan Municipality
Compiled by
Ekurhuleni Metropolitan Municipality
November 2011, revised March 2014
2
Bioregional Plan for Ekurhuleni Metro – March 2014
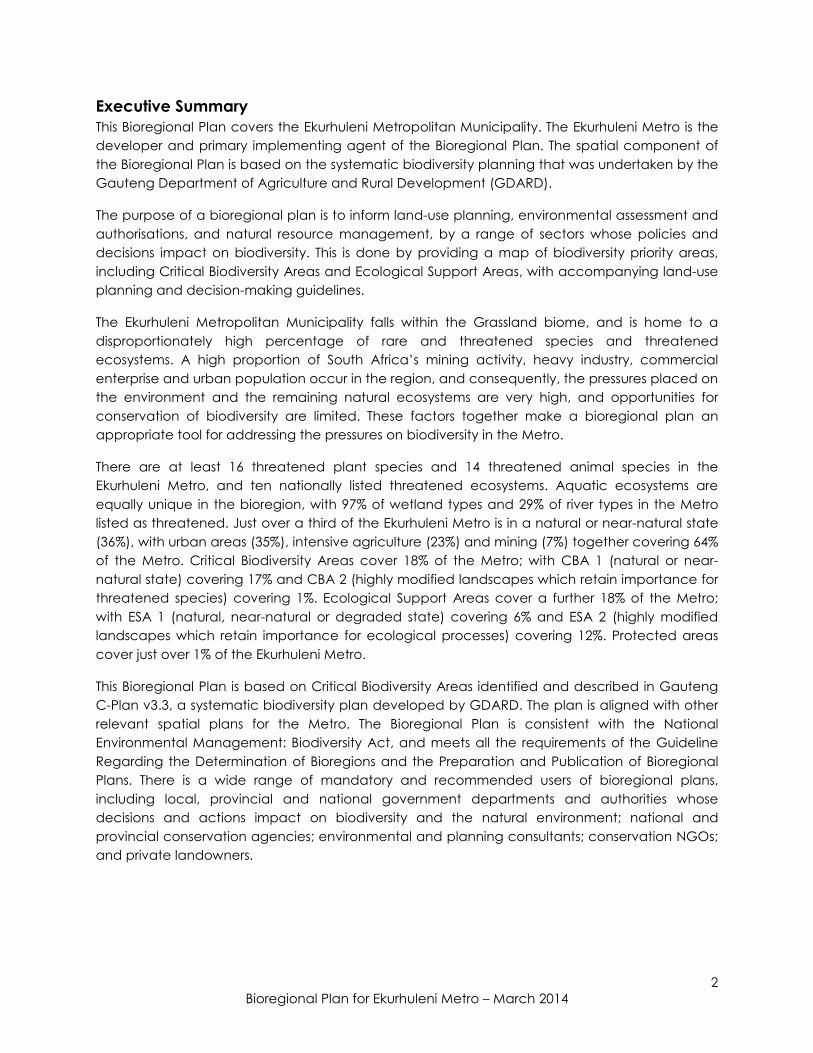
Executive Summary
This Bioregional Plan covers the Ekurhuleni Metropolitan Municipality. The Ekurhuleni Metro is the
developer and primary implementing agent of the Bioregional Plan. The spatial component of
the Bioregional Plan is based on the systematic biodiversity planning that was undertaken by the
Gauteng Department of Agriculture and Rural Development (GDARD).
The purpose of a bioregional plan is to inform land-use planning, environmental assessment and
authorisations, and natural resource management, by a range of sectors whose policies and
decisions impact on biodiversity. This is done by providing a map of biodiversity priority areas,
including Critical Biodiversity Areas and Ecological Support Areas, with accompanying land-use
planning and decision-making guidelines.
The Ekurhuleni Metropolitan Municipality falls within the Grassland biome, and is home to a
disproportionately high percentage of rare and threatened species and threatened
ecosystems. A high proportion of South Africa’s mining activity, heavy industry, commercial
enterprise and urban population occur in the region, and consequently, the pressures placed on
the environment and the remaining natural ecosystems are very high, and opportunities for
conservation of biodiversity are limited. These factors together make a bioregional plan an
appropriate tool for addressing the pressures on biodiversity in the Metro.
There are at least 16 threatened plant species and 14 threatened animal species in the
Ekurhuleni Metro, and ten nationally listed threatened ecosystems. Aquatic ecosystems are
equally unique in the bioregion, with 97% of wetland types and 29% of river types in the Metro
listed as threatened. Just over a third of the Ekurhuleni Metro is in a natural or near-natural state
(36%), with urban areas (35%), intensive agriculture (23%) and mining (7%) together covering 64%
of the Metro. Critical Biodiversity Areas cover 18% of the Metro; with CBA 1 (natural or near-
natural state) covering 17% and CBA 2 (highly modified landscapes which retain importance for
threatened species) covering 1%. Ecological Support Areas cover a further 18% of the Metro;
with ESA 1 (natural, near-natural or degraded state) covering 6% and ESA 2 (highly modified
landscapes which retain importance for ecological processes) covering 12%. Protected areas
cover just over 1% of the Ekurhuleni Metro.
This Bioregional Plan is based on Critical Biodiversity Areas identified and described in Gauteng
C-Plan v3.3, a systematic biodiversity plan developed by GDARD. The plan is aligned with other
relevant spatial plans for the Metro. The Bioregional Plan is consistent with the National
Environmental Management: Biodiversity Act, and meets all the requirements of the Guideline
Regarding the Determination of Bioregions and the Preparation and Publication of Bioregional
Plans. There is a wide range of mandatory and recommended users of bioregional plans,
including local, provincial and national government departments and authorities whose
decisions and actions impact on biodiversity and the natural environment; national and
provincial conservation agencies; environmental and planning consultants; conservation NGOs;
and private landowners.
3
Bioregional Plan for Ekurhuleni Metro – March 2014
Table of Contents
Executive Summary ....................................................................................................................................... 2
List of Abbreviations ...................................................................................................................................... 5
Acknowledgements ..................................................................................................................................... 5
Preface ............................................................................................................................................................ 6
1 Part A: Introduction and Objectives .................................................................................................. 7
1.1 Purpose and Objectives of the Bioregional Plan ................................................................... 8
1.2 Intended Users and Uses of the Bioregional Plan ................................................................... 8
1.3 Underlying Biodiversity Plan and Limitations ......................................................................... 11
2 Part B: Biodiversity Profile ................................................................................................................... 12
2.1 Significance of the Biodiversity within the Bioregion ........................................................... 12
2.2 Important Terrestrial Features ................................................................................................... 12
2.2.1 Threatened Species in the Ekurhuleni Metro ......................................................................... 12
2.2.2 Threatened Ecosystems ............................................................................................................ 12
2.3 Important Freshwater Features ................................................................................................ 15
2.4 Important Ecological Processes (including climate change mitigation and
adaptation) .............................................................................................................................................. 16
2.5 Patterns of Land-Use .................................................................................................................. 17
2.6 Ecosystem Protection Level within the Ekurhuleni Metro .................................................... 19
2.7 Why is a Bioregional Plan Necessary? .................................................................................... 21
2.8 Requirement for a systematic biodiversity plan ................................................................... 22
3 Part C: Critical Biodiversity Areas map, categories and description ....................................... 23
3.1 Description of Critical Biodiversity Areas and Ecological Support Areas ........................ 23
4 Part D: Guidelines ............................................................................................................................... 27
5 Part F: Monitoring, Reviewing and Updating ................................................................................. 36
5.1 Monitoring .................................................................................................................................... 36
5.2 Review .......................................................................................................................................... 37
5.3 Updating ...................................................................................................................................... 37
6 Part G: GIS Files ................................................................................................................................... 38
7 References ........................................................................................................................................... 39
8 Glossary ................................................................................................................................................ 41

4
Bioregional Plan for Ekurhuleni Metro – March 2014
List of Tables
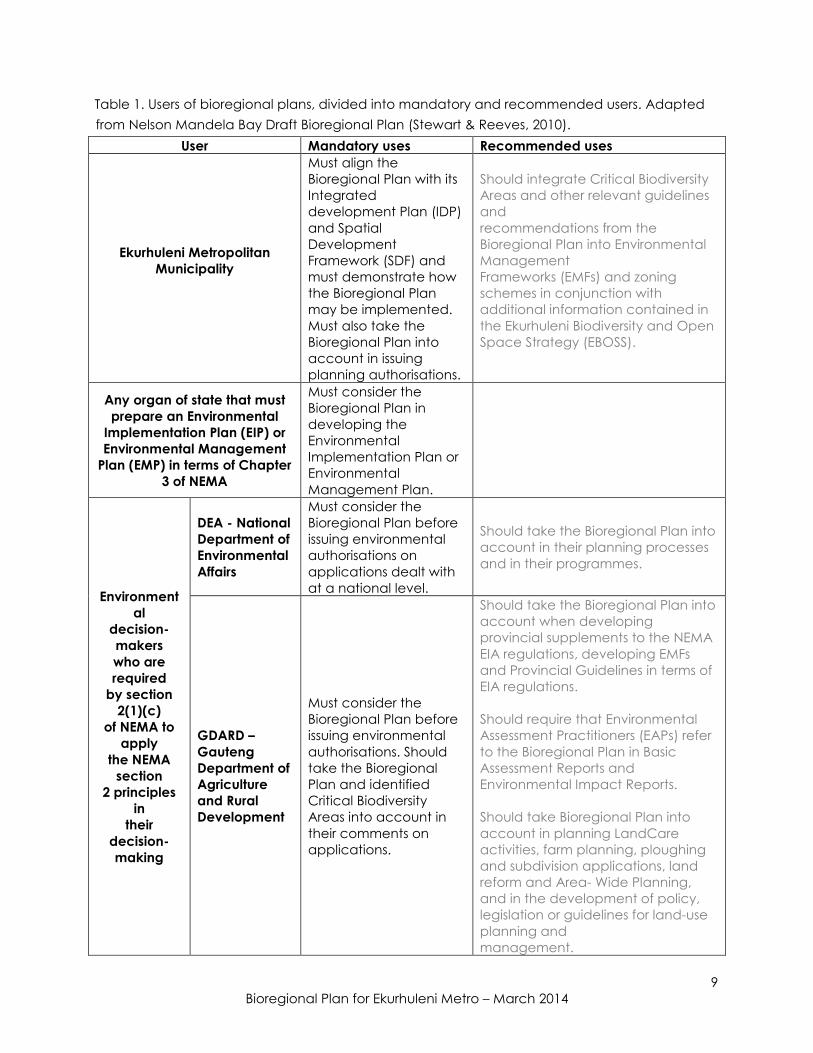
Table 1. Users of bioregional plans, divided into mandatory and recommended users. Adapted
from Nelson Mandela Bay Draft Bioregional Plan (Stewart & Reeves, 2010).
Table 2. Number of nationally listed threatened ecosystems occurring in the Ekurhuleni Metro
and in Gauteng Province.
Table 3. Extent in hectares (and percentage extent) of nationally listed threatened ecosystems
occurring in the Ekurhuleni Metro and Gauteng Province.
Table 4. River and wetland ecosystem threat status in Ekurhuleni Metro
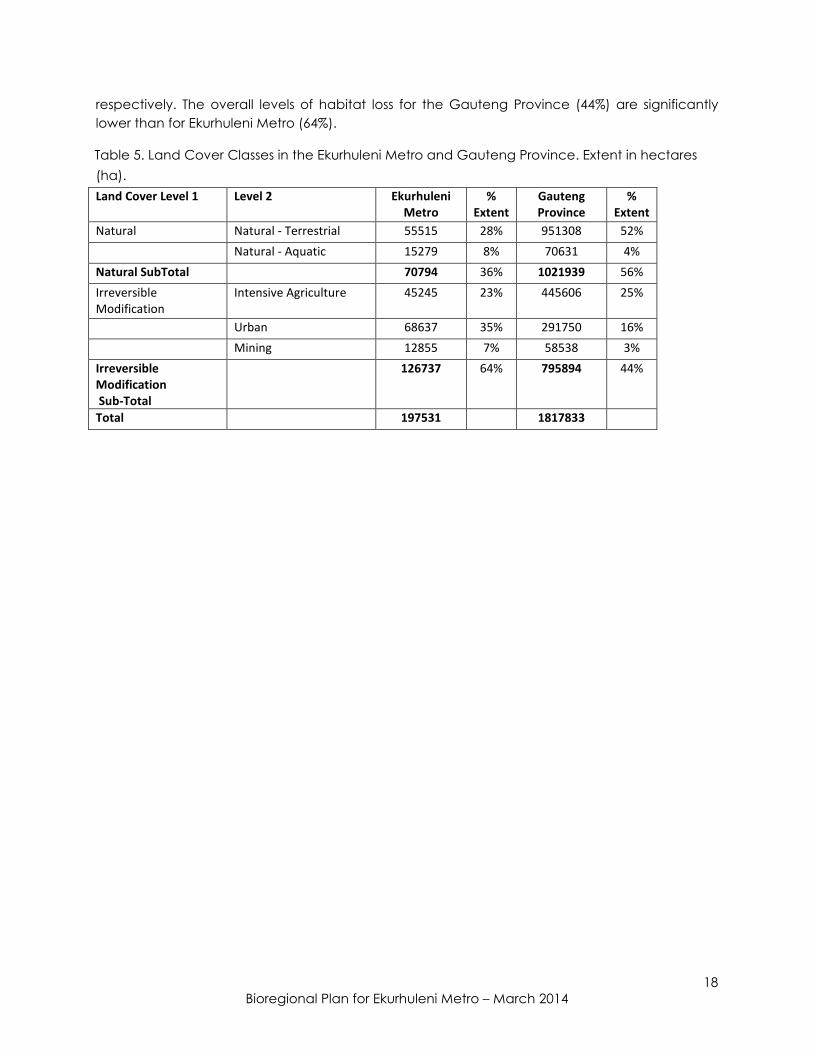
Table 5. Land Cover Classes in the Ekurhuleni Metro and Gauteng Province. Extent in hectares
(ha).
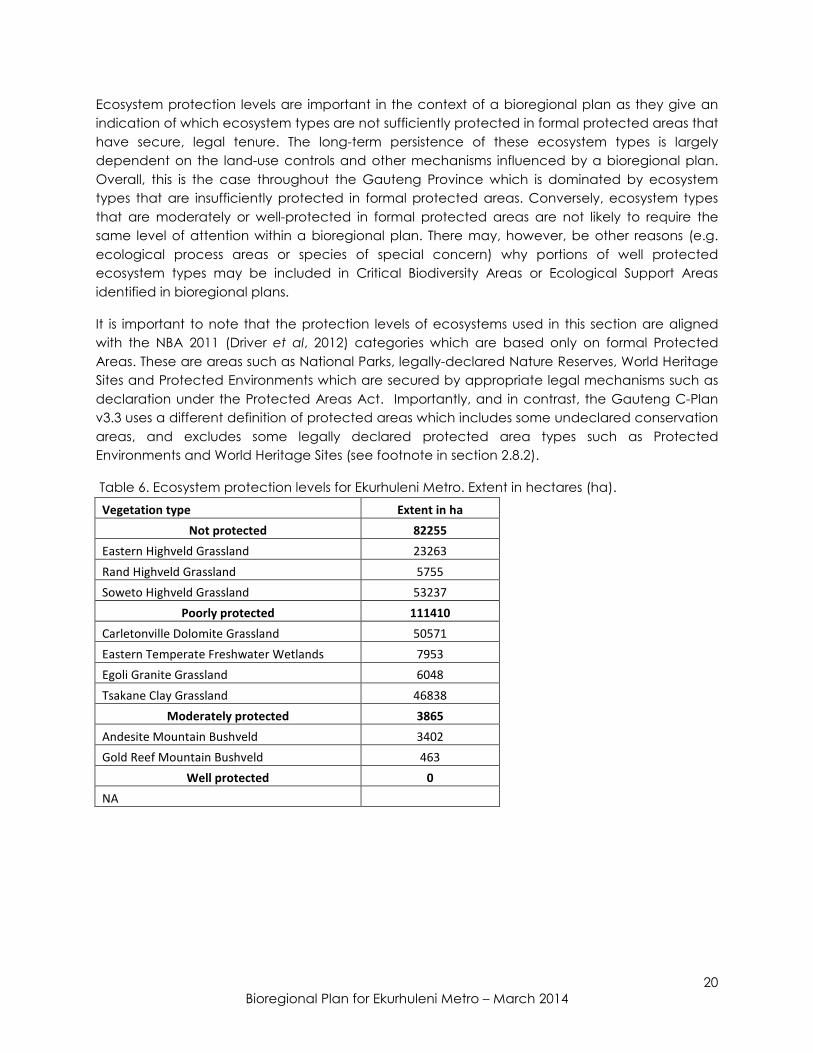
Table 6. Ecosystem protection levels for Ekurhuleni Metro. Extent in hectares (ha).
Table 7. Criteria used to define the CBA map categories.
Table 8. The extent (in hectares) and percentage extent of Critical Biodiversity Areas and
Ecological Support Areas identified by Gauteng C-Plan v3.3 in the Ekurhuleni Metro and in the
whole Gauteng Province.
Table 9. Biodiversity-compatible land-use guidelines for each category on the Critical Biodiversity
Area map.
Table 10. Recommended land management guidelines in Critical Biodiversity Areas and
Ecological Support Areas.
Table 11. Geographic Information System (GIS) Data files
List of Figures
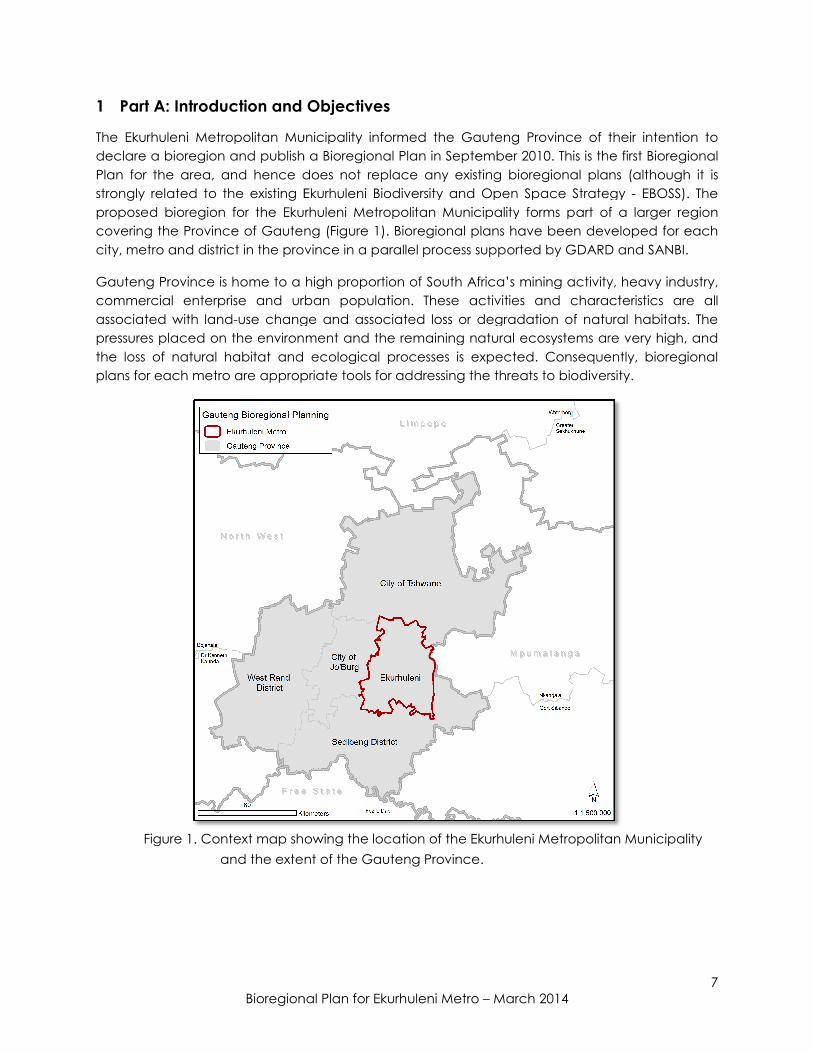
Figure 1. Context map showing the location of the Ekurhuleni Metropolitan Municipality and the
extent of the Gauteng Province Bioregion.
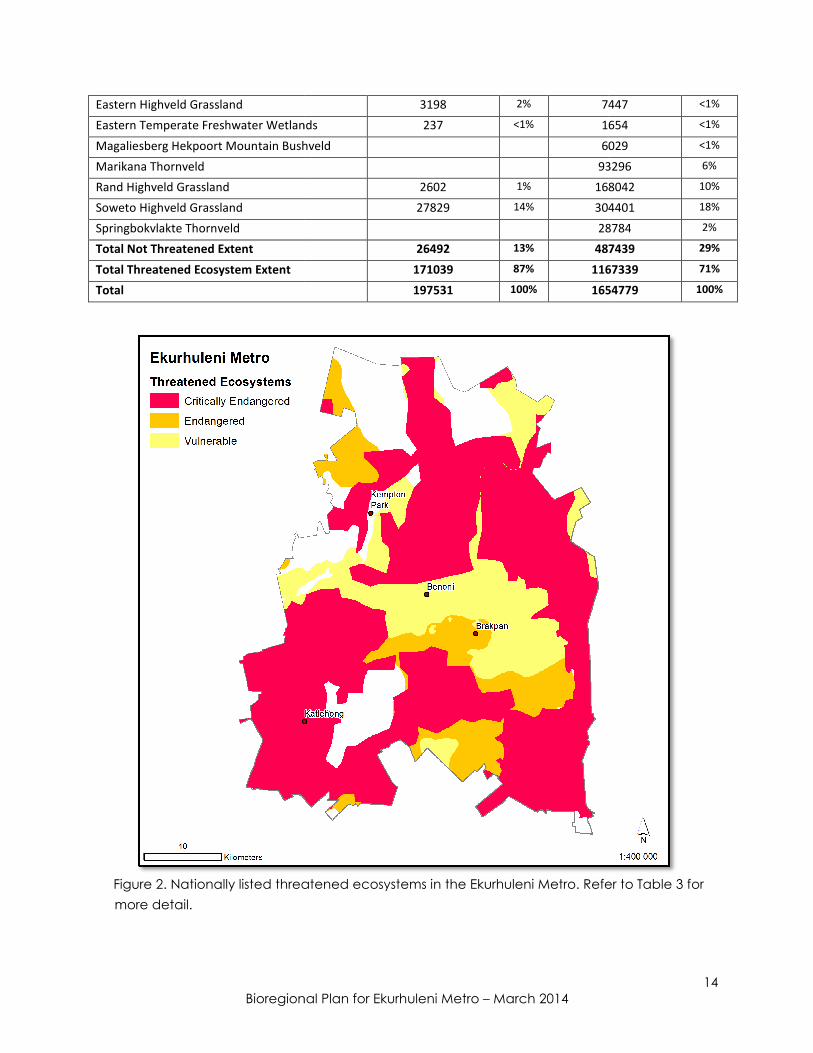
Figure 2. Nationally listed threatened ecosystems in the Ekurhuleni Metro. Refer to Table 3 for
more detail.
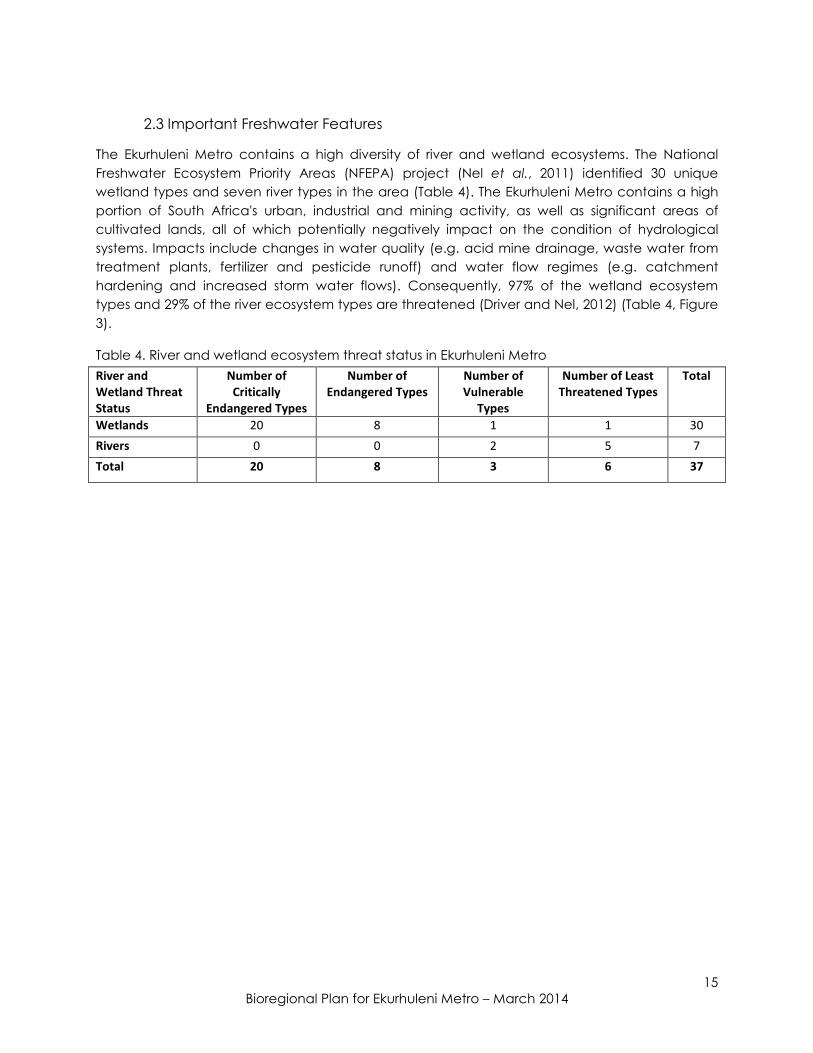
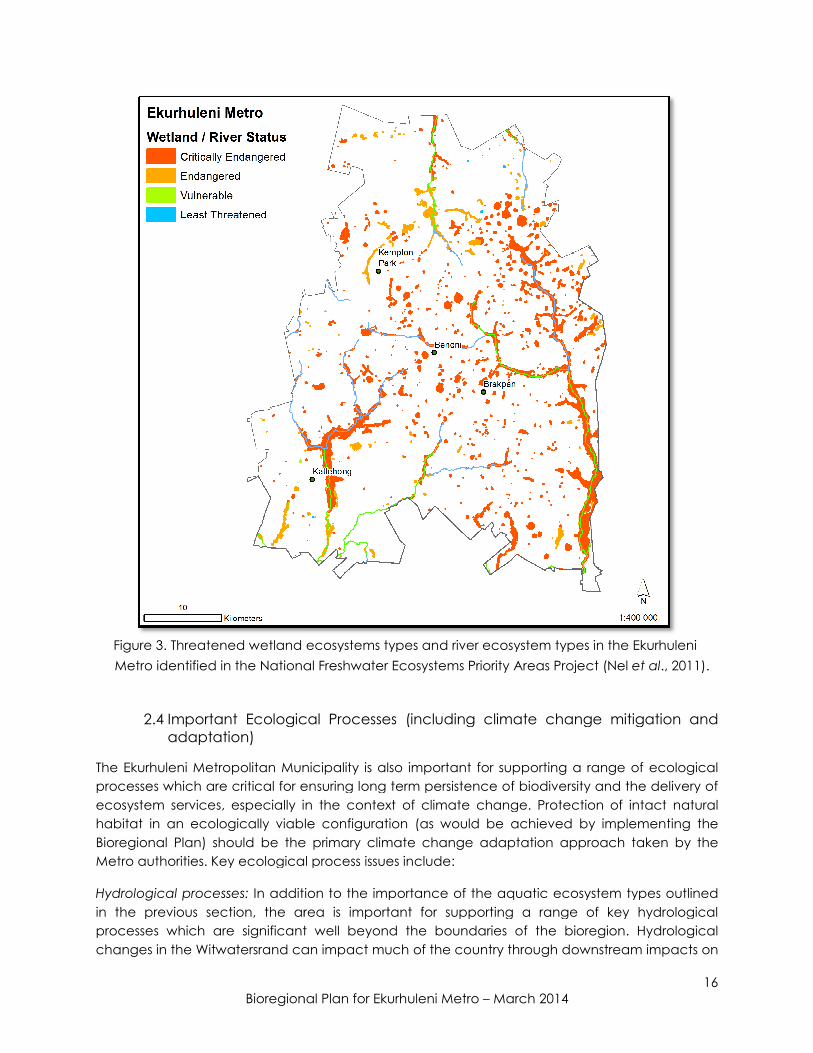
Figure 3. Threatened wetland ecosystems types and river ecosystem types in the Ekurhuleni
Metro identified in the National Freshwater Ecosystems Priority Areas Project (Nel et al., 2011).
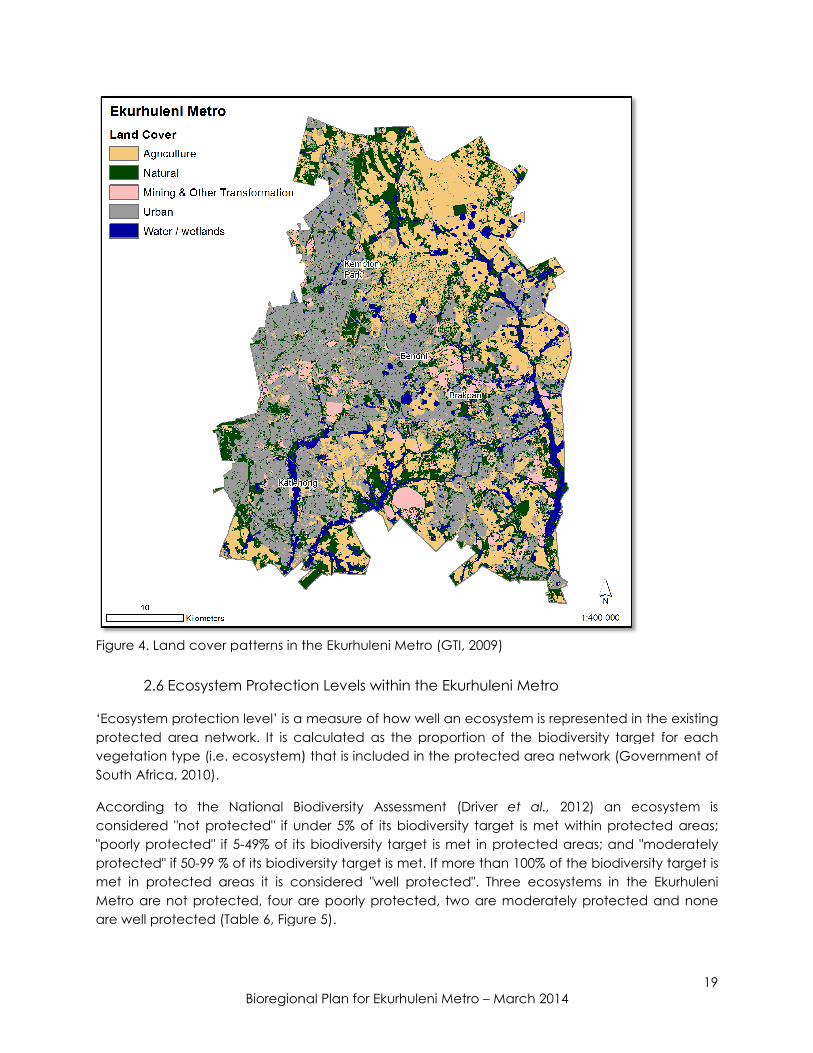
Figure 4. Land cover patterns in the Ekurhuleni Metro (GTI, 2009)
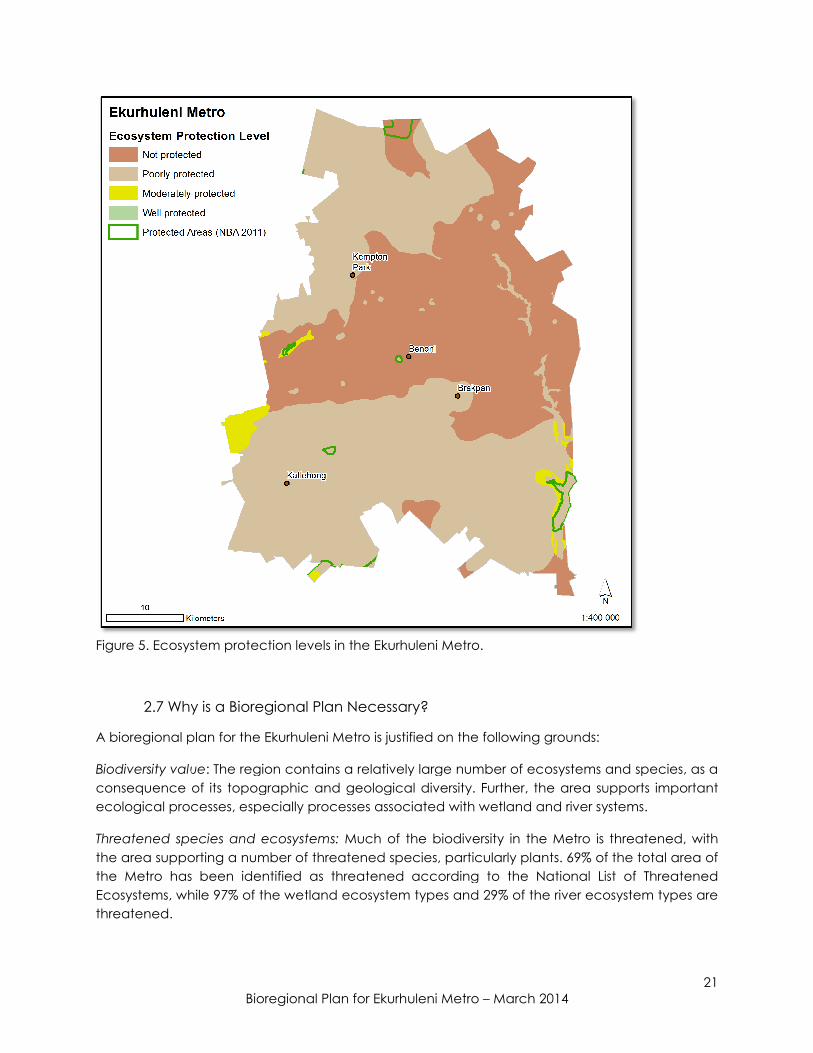
Figure 5. Ecosystem protection levels in the Ekurhuleni Metro.
Figure 6. Critical Biodiversity Areas and Ecological Support Areas for the Ekurhuleni Metro. See
Table 7 for category definitions.
5
Bioregional Plan for Ekurhuleni Metro – March 2014
List of Abbreviations
CBA Critical Biodiversity Area
CSIR Council for Scientific and Industrial Research
DEA Department of Environmental Affairs (National)
DEAT former Department of Environmental Affairs and Tourism (National)
EAP Environmental Assessment Practitioner
EBOSS Ekurhuleni Biodiversity and Open Space Strategy
EIA Environmental Impact Assessment
EIP Environmental Implementation Plan
EMF Environmental Management Framework
EMP Environmental Management Plan
ESA Ecological Support Area
GIS Geographic Information System
GDARD Gauteng Department of Agriculture and Rural Development
GTI Geo Terra Image
IDP Integrated Development Plan
LUPO Land-Use Planning Ordinance
MEC Member of the Executive Committee
Metro Metropolitan Municipality
NBA National Biodiversity Assessment 2011
NEMA National Environmental Management (Act 107 of 1998)
NFEPA National Freshwater Ecosystem Priority Areas
NGO Non-Governmental Organisation
NNR No Natural Habitat Remaining
NPAES National Protected Area Expansion Strategy 2008
ONA Other Natural Area
PA Protected Area
PE Protected Environment
SANBI South African National Biodiversity Institute
SEA Strategic Environmental Assessment
SDF Spatial Development Framework
WfW Working for Water
WHS World Heritage Site
Acknowledgements
Sections of this Bioregional Plan are adapted from the Bioregional Plan for the Nelson Mandel
Bay Municipality produced by Warrick Stewart and Brian Reeves from SRK Consulting (Stewart
and Reeves, 2010). The Biodiversity Sector Plans for Garden Route Initiative (Vromans, Maree,
Holness, Job and Brown, 2010) and the Guideline Regarding the Determination of Bioregions and
the Preparation and Publication of Bioregional Plans (DEAT 2009) were also used extensively to
guide the report structure and content. We would also like to acknowledge Pieta Compaan
and Michelle Pfab, the primary authors of the Gauteng C-plan v3.3 (GDARD, 2013), which
provides the Ekurhuleni Bioregional Plan with a robust and defensible technical basis. The spatial
components of the Bioregional Plan and Gauteng C-plan v3.3 in Ekurhuleni are heavily
dependent on areas identified within finescale planning undertaken for the Ekurhuleni
Biodiversity and Open Space Strategy (EBOSS).

6
Bioregional Plan for Ekurhuleni Metro – March 2014
Preface
This Bioregional Plan was compiled by consultants Dr Stephen Holness and Andrew Skowno of
ECOSOL GIS for the Ekurhuleni Metropolitan Municipality, with support from Gauteng
Department of Agriculture and Rural Development (GDARD) and financial support from the
Grasslands Programme of the South African National Biodiversity Institute (SANBI). This Bioregional
Plan was developed in 2010/2011and is based on analyses performed, and data sets available
at that time. The document was improved significantly by a review process in early 2014. One
aspect of the analysis (ecosystem protection level categories) was updated in order to align the
Bioregional Plan with the National Biodiversity Assessment 2011 (Driver, Sink, Nel, Holness, Van
Niekerk, Daniels, Jonas, Majiedt, Harris, & Maze, 2012). The reference list was updated to reflect
current publication statuses.
Bioregional
1 Part A: Introduction and
The Ekurhuleni Metropolitan Municipality
declare a bioregion and publish a
Plan for the area, and hence does not replace any
strongly related to the existing Ekurhulen
proposed bioregion for the Ekurhuleni Metropolitan Municipality
covering the Province of Gauteng
city, metro and district in the province in
Gauteng Province is home to a high proportion of South Africa’s mining activity, heavy industry,
commercial enterprise and urban population.
associated with land-use change and associated loss or degradation of natural habitats.
pressures placed on the environment and the remaining natural ecosystems are very high
the loss of natural habitat and ecological processes is expected
plans for each metro are appropriate tools
Figure 1. Context map showing the
and the extent
Bioregional Plan for Ekurhuleni Metro – March 2014
Objectives
Ekurhuleni Metropolitan Municipality informed the Gauteng Province of their intention to
declare a bioregion and publish a Bioregional Plan in September 2010. This is the first
for the area, and hence does not replace any existing bioregional plans
Ekurhuleni Biodiversity and Open Space Strategy
Ekurhuleni Metropolitan Municipality forms part of a
Gauteng (Figure 1). Bioregional plans have been developed for each
in the province in a parallel process supported by GDARD and
home to a high proportion of South Africa’s mining activity, heavy industry,
commercial enterprise and urban population. These activities and characteristics are all
use change and associated loss or degradation of natural habitats.
pressures placed on the environment and the remaining natural ecosystems are very high
the loss of natural habitat and ecological processes is expected. Consequently,
appropriate tools for addressing the threats to biodiversity.
. Context map showing the location of the Ekurhuleni Metropolitan Municipality
the extent of the Gauteng Province.
7
of their intention to
This is the first Bioregional
existing bioregional plans (although it is
versity and Open Space Strategy - EBOSS). The
forms part of a larger region
s have been developed for each
supported by GDARD and SANBI.
home to a high proportion of South Africa’s mining activity, heavy industry,
These activities and characteristics are all
use change and associated loss or degradation of natural habitats. The
pressures placed on the environment and the remaining natural ecosystems are very high, and
Consequently, bioregional
to biodiversity.
location of the Ekurhuleni Metropolitan Municipality
8
Bioregional Plan for Ekurhuleni Metro – March 2014
1.1 Purpose and Objectives of the Bioregional Plan
Bioregional plans are one of a range of tools provided for in the National Environmental
Management: Biodiversity Act (No. 10 of 2004 - hereafter referred at as the Biodiversity Act) that
can be used to facilitate the management and conservation of biodiversity priority areas
outside the protected area network. The purpose of a bioregional plan is to inform land-use
planning, environmental assessment and authorisations, and natural resource management, by
a range of sectors whose policies and decisions impact on biodiversity. This is done by providing
a map of biodiversity priority areas with accompanying land-use planning and decision-making
guidelines. Bioregional plans are intended to feed into a range of multi-sectoral planning and
assessment processes such as Environmental Management Frameworks (EMFs), Spatial
Development Frameworks (SDFs), Strategic Environmental Assessments (SEAs) and Environmental
Impact Assessments (EIAs), and to support and streamline environmental decision-making. A
bioregional plan is not in itself a multi-sectoral planning or assessment tool, but rather is the
biodiversity sector’s input into other planning and assessment processes.
The Bioregional Plan is consistent with National Environmental Management Act (No. 107 of 1998
- hereafter referred to as NEMA) principles and the Biodiversity Act. It is designed to support
integrated development planning and sustainable development by identifying an efficient set
of Critical Biodiversity Areas that are required to meet biodiversity objectives, in a configuration
that is least conflicting with other land-uses and activities. Where alternatives are available, the
Critical Biodiversity Areas are designed to avoid conflict with existing IDPs, EMFs and SDFs in the
region by favouring the selection of sites that are least conflicting with other land-uses. Within the
Ekurhuleni Metro this process was facilitated by strong alignment with spatial priorities identified
within the EBOSS.
1.2 Intended Users and Uses of the Bioregional Plan
Bioregional plans are aimed primarily at government and civil society sectors involved in land-
use planning and decision-making. The users of the bioregional plan can be divided into
mandatory users, i.e. those who are compelled to consider the bioregional plan; and
recommended users, i.e. those who will find it to be a useful planning and developmental tool
(Table 1).
The bioregional plan is the official reference for biodiversity priorities to be taken into account in
land-use planning and decision-making by all sectors. The bioregional plan has three main uses:
1. Proactive forward planning, serving as an input into mechanisms such as EMFs, SDFs, IDPs,
Metropolitan Open Space Systems and zoning schemes;
2. Reactive decision-making, providing guidance for evaluating environmental impact
assessments, agricultural land and water-licensing decisions, and development-control
decisions through land-use legislation (e.g. rezoning, subdivision and planning approvals).
3. Proactive conservation, providing an input into decisions on the expansion of protected
areas through land acquisition by the state and biodiversity stewardship agreements with
private or communal landowners.
9
Bioregional Plan for Ekurhuleni Metro – March 2014
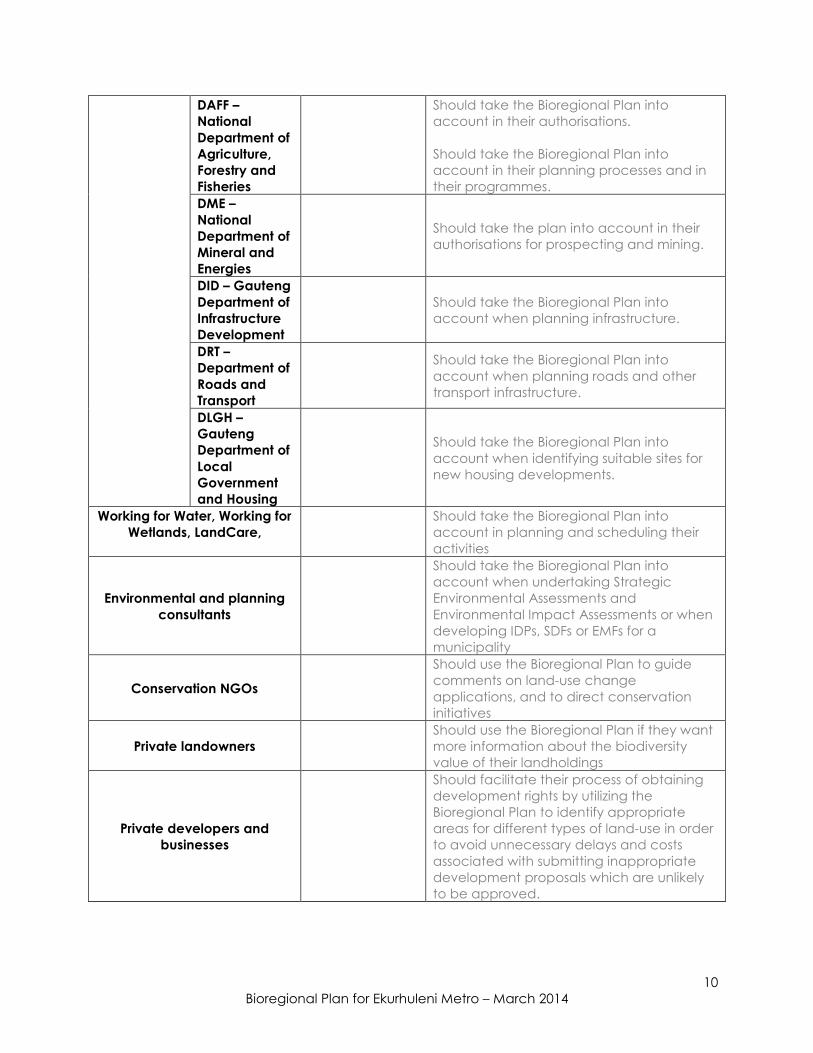
Table 1. Users of bioregional plans, divided into mandatory and recommended users. Adapted
from Nelson Mandela Bay Draft Bioregional Plan (Stewart & Reeves, 2010).
User Mandatory uses Recommended uses
Ekurhuleni Metropolitan
Municipality
Must align the
Bioregional Plan with its
Integrated
development Plan (IDP)
and Spatial
Development
Framework (SDF) and
must demonstrate how
the Bioregional Plan
may be implemented.
Must also take the
Bioregional Plan into
account in issuing
planning authorisations.
Should integrate Critical Biodiversity
Areas and other relevant guidelines
and
recommendations from the
Bioregional Plan into Environmental
Management
Frameworks (EMFs) and zoning
schemes in conjunction with
additional information contained in
the Ekurhuleni Biodiversity and Open
Space Strategy (EBOSS).
Any organ of state that must
prepare an Environmental
Implementation Plan (EIP) or
Environmental Management
Plan (EMP) in terms of Chapter
3 of NEMA
Must consider the
Bioregional Plan in
developing the
Environmental
Implementation Plan or
Environmental
Management Plan.
Environment
al
decision-
makers
who are
required
by section
2(1)(c)
of NEMA to
apply
the NEMA
section
2 principles
in
their
decision-
making
DEA - National
Department of
Environmental
Affairs
Must consider the
Bioregional Plan before
issuing environmental
authorisations on
applications dealt with
at a national level.
Should take the Bioregional Plan into
account in their planning processes
and in their programmes.
GDARD –
Gauteng
Department of
Agriculture
and Rural
Development
Must consider the
Bioregional Plan before
issuing environmental
authorisations. Should
take the Bioregional
Plan and identified
Critical Biodiversity
Areas into account in
their comments on
applications.
Should take the Bioregional Plan into
account when developing
provincial supplements to the NEMA
EIA regulations, developing EMFs
and Provincial Guidelines in terms of
EIA regulations.
Should require that Environmental
Assessment Practitioners (EAPs) refer
to the Bioregional Plan in Basic
Assessment Reports and
Environmental Impact Reports.
Should take Bioregional Plan into
account in planning LandCare
activities, farm planning, ploughing
and subdivision applications, land
reform and Area- Wide Planning,
and in the development of policy,
legislation or guidelines for land-use
planning and
management.
10
Bioregional Plan for Ekurhuleni Metro – March 2014
DAFF –
National
Department of
Agriculture,
Forestry and
Fisheries
Should take the Bioregional Plan into
account in their authorisations.
Should take the Bioregional Plan into
account in their planning processes and in
their programmes.
DME –
National
Department of
Mineral and
Energies
Should take the plan into account in their
authorisations for prospecting and mining.
DID – Gauteng
Department of
Infrastructure
Development
Should take the Bioregional Plan into
account when planning infrastructure.
DRT –
Department of
Roads and
Transport
Should take the Bioregional Plan into
account when planning roads and other
transport infrastructure.
DLGH –
Gauteng
Department of
Local
Government
and Housing
Should take the Bioregional Plan into
account when identifying suitable sites for
new housing developments.
Working for Water, Working for
Wetlands, LandCare,
Should take the Bioregional Plan into
account in planning and scheduling their
activities
Environmental and planning
consultants
Should take the Bioregional Plan into
account when undertaking Strategic
Environmental Assessments and
Environmental Impact Assessments or when
developing IDPs, SDFs or EMFs for a
municipality
Conservation NGOs
Should use the Bioregional Plan to guide
comments on land-use change
applications, and to direct conservation
initiatives
Private landowners
Should use the Bioregional Plan if they want
more information about the biodiversity
value of their landholdings
Private developers and
businesses
Should facilitate their process of obtaining
development rights by utilizing the
Bioregional Plan to identify appropriate
areas for different types of land-use in order
to avoid unnecessary delays and costs
associated with submitting inappropriate
development proposals which are unlikely
to be approved.
11
Bioregional Plan for Ekurhuleni Metro – March 2014
1.3 Underlying Biodiversity Plan and Limitations
This Bioregional Plan is based on Critical Biodiversity Areas designed and described in Gauteng
C-Plan v3.3 (GDARD, 2013), a systematic biodiversity plan developed by the Gauteng
Department of Agriculture and Rural Development (GDARD). The Bioregional Plan serves as the
primary biodiversity informant to a range of planning processes. However, it is important to
recognise that the Bioregional Plan does not replace these planning and decision-making
processes, and does not in itself grant or limit land-use rights. Further, the Bioregional Plan has
limitations, which although they do not restrict the application of the Bioregional Plan, need to
be recognized and appropriately addressed when it is used:
1. The Bioregional Plan does not replace the need for site assessments, particularly for
Environmental Impact Assessments. Although it is based on a fine-scale systematic
biodiversity plan, this does not remove the need for on-site verification of the identified
Critical Biodiversity Areas;
2. The underlying systematic biodiversity plan (Gauteng C-Plan v3.3), on which the
Bioregional Plan is based, is designed to be used at a scale of approximately 1:50 000.
Although it can be used at a finer scale, this requires specialist interpretation of the
specific features identified in the systematic biodiversity plan;
3. The systematic biodiversity plan (Gauteng C-Plan v3.3), on which the Bioregional Plan is
based, was developed using appropriate methods and uses the best available data at
the time of its development. However, key aspects such as the distribution of threatened
species remain incomplete;
Ongoing changes in land-use as well as changes in biodiversity, may impact on the
identified network of Critical Biodiversity Areas. It is likely that additional areas would need to
be designated as Critical Biodiversity Areas when the Bioregional Plan is revised due to these
changes.
12
Bioregional Plan for Ekurhuleni Metro – March 2014
2 Part B: Biodiversity Profile
2.1 Significance of the Biodiversity within the Bioregion
The Ekurhuleni Metro contains a disproportionately high percentage of rare and threatened
species and threatened ecosystems compared with both the rest of the Gauteng Province and
South Africa as a whole. This is a consequence of the combination of its topographic and
geological diversity resulting in a diversity of habitats (which in turn support a diversity of species)
and the high level of habitat modification that characterises the bioregion.
2.2 Important Terrestrial Features
2.2.1 Threatened Species in the Ekurhuleni Metro
This section is not intended to be a comprehensive review of species found in the bioregion,
rather it is a summary of existing information available on threatened species and species of
special concern.
• Plants: An examination of the threatened plant species records held within the National
Herbarium Pretoria Computerised Information System (PRECIS), supplemented by
provincial records, shows that 42 threatened plant species are recorded for the Gauteng
Province1. Of these, 16 are found in Ekurhuleni Metro including two Critically Endangered
erica species (Erica baueri subsp. baueri and Erica jasminiflora ), four Endangered
species (Habenaria mossii, Leucadendron daphnoides, Leucospermum saxosum and
Protea lacticolor)and ten Vulnerable species.
• Mammals: Two of Gauteng's threatened and special concern mammal species are
found in Ekurhuleni Metro, they include the Endangered White-tailed Mouse (Mystromys
albicaudutus)and the Near-Threatened Spotted-necked Otter (Lutra maculicollis).
• Reptiles: The range of the globally Near-Threatened Striped Harlequin Snake
(Homoroselaps dorsalis) extends into Ekurhuleni Metro.
• Birds: Eight Vulnerable species and four Near-Threatened species are particularly reliant
on the Gauteng region, and a number of others also occur occasionally. Four of these
species are found in the Ekurhuleni Metro. These include the Vulnerable African Marsh-
Harrier (Circus ranivorus) and African Grass-Owl (Tyto capensis) both of which are
dependent or partially dependent on wetlands, and the Near-Threatened Secretary bird
(Saggitarius serpentarius) and Melodious Lark (Mirafra cheniana).
• Invertebrates: Gauteng is important for at least four threatened invertebrate species.
One of these, Stobbia’s Fruit Chafer Beetle (Ichnestoma stobbiai) which is likely to be
listed as Vulnerable, is found within Ekurhuleni Metro.
2.2.2 Threatened Ecosystems
Ecosystem threat status refers to the degree to which an ecosystem is still intact, or alternatively
losing vital aspects of its structure, function or composition, for example as a result of irreversible
loss of natural habitat within that ecosystem. SANBI has developed a system for assessing threat
1 Based on an analysis of red listed plant species found within the Quarter Degree Squares
overlapping the Ekurhuleni Metro and the whole Gauteng Province.
13
Bioregional Plan for Ekurhuleni Metro – March 2014
status that uses a suite of criteria to assign national ecosystem status to South African vegetation
types. The list of threatened terrestrial ecosystems (hereafter referred to as the National
Threatened Ecosystems List) published by the Minister of Environmental Affairs in December 2011,
in terms of the National Environmental Management: Biodiversity Act (No. 10 of 2004)), is based
largely on South African vegetation types and the degree to which they have been irreversibly
modified. According to this list, the Ekurhuleni Metro has a total of ten threatened ecosystems,
four of which are considered Critically Endangered, two Endangered and four Vulnerable (Table
2 &3)(Figure 2). Although much of this habitat has now been irreversibly modified, the original
extent of the threatened habitat types covers 87% of the Ekurhuleni Metro.
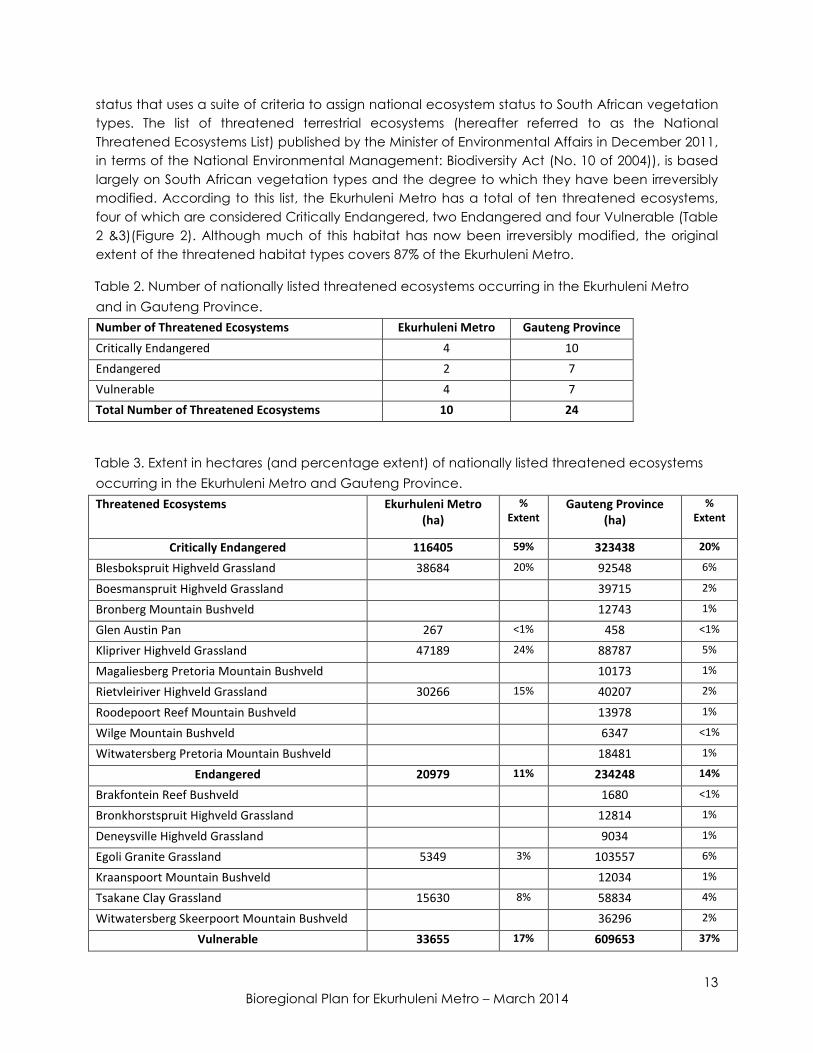
Table 2. Number of nationally listed threatened ecosystems occurring in the Ekurhuleni Metro
and in Gauteng Province.
Number of Threatened Ecosystems Ekurhuleni Metro Gauteng Province
Critically Endangered 4 10
Endangered 2 7
Vulnerable 4 7
Total Number of Threatened Ecosystems 10 24
Table 3. Extent in hectares (and percentage extent) of nationally listed threatened ecosystems
occurring in the Ekurhuleni Metro and Gauteng Province.
Threatened Ecosystems Ekurhuleni Metro
(ha)
%
Extent
Gauteng Province
(ha)
%
Extent
Critically Endangered 116405 59% 323438 20%
Blesbokspruit Highveld Grassland 38684 20% 92548 6%
Boesmanspruit Highveld Grassland 39715 2%
Bronberg Mountain Bushveld 12743 1%
Glen Austin Pan 267 <1% 458 <1%
Klipriver Highveld Grassland 47189 24% 88787 5%
Magaliesberg Pretoria Mountain Bushveld 10173 1%
Rietvleiriver Highveld Grassland 30266 15% 40207 2%
Roodepoort Reef Mountain Bushveld 13978 1%
Wilge Mountain Bushveld 6347 <1%
Witwatersberg Pretoria Mountain Bushveld 18481 1%
Endangered 20979 11% 234248 14%
Brakfontein Reef Bushveld 1680 <1%
Bronkhorstspruit Highveld Grassland 12814 1%
Deneysville Highveld Grassland 9034 1%
Egoli Granite Grassland 5349 3% 103557 6%
Kraanspoort Mountain Bushveld 12034 1%
Tsakane Clay Grassland 15630 8% 58834 4%
Witwatersberg Skeerpoort Mountain Bushveld 36296 2%
Vulnerable 33655 17% 609653 37%
Bioregional
Eastern Highveld Grassland
Eastern Temperate Freshwater Wetlands
Magaliesberg Hekpoort Mountain Bushveld
Marikana Thornveld
Rand Highveld Grassland
Soweto Highveld Grassland
Springbokvlakte Thornveld
Total Not Threatened Extent
Total Threatened Ecosystem Extent
Total
Figure 2. Nationally listed threatened ecosystems in the Ekurhuleni Metro. Refer to Table 3 for
more detail.
Bioregional Plan for Ekurhuleni Metro – March 2014
3198 2% 7447
Eastern Temperate Freshwater Wetlands 237 <1% 1654
Magaliesberg Hekpoort Mountain Bushveld 6029
93296
2602 1% 168042
27829 14% 304401
28784
26492 13% 487439
171039 87% 1167339
197531 100% 1654779
threatened ecosystems in the Ekurhuleni Metro. Refer to Table 3 for
14
7447 <1%
1654 <1%
6029 <1%
93296 6%
168042 10%
304401 18%
28784 2%
487439 29%
1167339 71%
1654779 100%
threatened ecosystems in the Ekurhuleni Metro. Refer to Table 3 for
15
Bioregional Plan for Ekurhuleni Metro – March 2014
2.3 Important Freshwater Features
The Ekurhuleni Metro contains a high diversity of river and wetland ecosystems. The National
Freshwater Ecosystem Priority Areas (NFEPA) project (Nel et al., 2011) identified 30 unique
wetland types and seven river types in the area (Table 4). The Ekurhuleni Metro contains a high
portion of South Africa's urban, industrial and mining activity, as well as significant areas of
cultivated lands, all of which potentially negatively impact on the condition of hydrological
systems. Impacts include changes in water quality (e.g. acid mine drainage, waste water from
treatment plants, fertilizer and pesticide runoff) and water flow regimes (e.g. catchment
hardening and increased storm water flows). Consequently, 97% of the wetland ecosystem
types and 29% of the river ecosystem types are threatened (Driver and Nel, 2012) (Table 4, Figure
3).
Table 4. River and wetland ecosystem threat status in Ekurhuleni Metro
River and
Wetland Threat
Status
Number of
Critically
Endangered Types
Number of
Endangered Types
Number of
Vulnerable
Types
Number of Least
Threatened Types
Total
Wetlands 20 8 1 1 30
Rivers 0 0 2 5 7
Total 20 8 3 6 37
Bioregional
Figure 3. Threatened wetland ecosystems types
Metro identified in the National Freshwater Ecosystems Priority Areas Project (Nel
2.4 Important Ecological
adaptation)
The Ekurhuleni Metropolitan Municipality
processes which are critical for ensuring long term persistence of biodiversity and the delivery of
ecosystem services, especially in the context of climate change. Protection of intact natural
habitat in an ecologically viable configuration (as would be achieved by implementing the
Bioregional Plan) should be the primary climate change adaptation approa
Metro authorities. Key ecological process issues include:
Hydrological processes: In addition
in the previous section, the area is important for supporting a range of key hydrological
processes which are significant well beyond the boundaries of the bioregion. Hydrological
changes in the Witwatersrand can impact much of the country through downstream impacts on
Bioregional Plan for Ekurhuleni Metro – March 2014
. Threatened wetland ecosystems types and river ecosystem types in the Ekurhuleni
Metro identified in the National Freshwater Ecosystems Priority Areas Project (Nel
Important Ecological Processes (including climate change mitigation and
Ekurhuleni Metropolitan Municipality is also important for supporting a range of ecological
processes which are critical for ensuring long term persistence of biodiversity and the delivery of
ecosystem services, especially in the context of climate change. Protection of intact natural
y viable configuration (as would be achieved by implementing the
) should be the primary climate change adaptation approa
Key ecological process issues include:
In addition to the importance of the aquatic ecosystem types
in the previous section, the area is important for supporting a range of key hydrological
processes which are significant well beyond the boundaries of the bioregion. Hydrological
and can impact much of the country through downstream impacts on
16
and river ecosystem types in the Ekurhuleni
Metro identified in the National Freshwater Ecosystems Priority Areas Project (Nel et al., 2011).
(including climate change mitigation and
for supporting a range of ecological
processes which are critical for ensuring long term persistence of biodiversity and the delivery of
ecosystem services, especially in the context of climate change. Protection of intact natural
y viable configuration (as would be achieved by implementing the
ch taken by the
importance of the aquatic ecosystem types outlined
in the previous section, the area is important for supporting a range of key hydrological
processes which are significant well beyond the boundaries of the bioregion. Hydrological
and can impact much of the country through downstream impacts on
17
Bioregional Plan for Ekurhuleni Metro – March 2014
the major Gariep and Limpopo river systems. Dolomite and wetland ecosystems play a major
role in controlling the hydrology of the region. Climate change impacts are likely to increase the
value of maintaining intact or at least functioning hydrological systems.
Climate change mitigation: Forest, woodland, wetland, and even grassland ecosystems, play
an important role in carbon sequestration and protection of remaining intact areas of natural
habitat is, therefore, a priority. Keeping sufficient habitat intact is important for minimizing the
long term magnitude of climate change events. Although the role of the Metro is small in a
global context, it is important that all areas contribute to climate change mitigation.
Climate change adaptation: Ecological process Issues important for climate change
adaptation include -
Corridors and connectivity: The high levels of habitat loss and urban infrastructure development
in the Grassland biome in general, and Gauteng Province in particular, strongly restrict
connectivity of ecosystems at a national level. Gauteng can be seen as a key bottleneck or
restriction in west-east ecological connectivity, which can impact on the long term survival of a
variety of species and ecosystems in the context of ongoing climate change. Maintaining
ecological connectivity is critical for long term persistence of biodiversity in the face of ongoing
climate change, and represents the major contribution which the Ekhuruleni Bioregion can
make to facilitating climate change adaptation within the Gauteng Province, and South Africa
as a whole.
Climate change refugia and areas of high diversity: The Gauteng biodiversity assessment
process identified a number of key areas that exhibit a high diversity of environmental
parameters in relatively small areas. These high value areas exist because of the relatively large
topographic and geological diversity of the region. These areas should be identified within a
bioregional plan as they are critical for ensuring the long term persistence of both species and
ecosystems, as they include both the ecological gradients required to allow species and
habitats to adjust to climate change impacts and are likely to include refuge areas. In addition,
ridges and higher altitude areas are important.
Areas for minimizing climate change impacts on society: Climate change is likely to result in
significant increases in climate variability. In the urban context, perhaps the most important
consequence is an increase in the likelihood of extreme flood events. Protection of intact natural
habitat (especially wetlands, floodplains and intact riparian habitat) is extremely important for
reducing the magnitude of flood events as these areas play an important role in regulating
hydrological processes such as storm runoff. In addition, these areas (especially floodplains) are
are at extremely high risk of being affected by events such as floods, so ensuring that
infrastructure development and agricultural activity is avoided where possible in high risk areas
will reduce the long term impact of climate change, particularly on poor communities.
2.5 Patterns of Land-Use
According to the recent Gauteng land cover (GTI, 2009), land cover patterns in the Ekurhuleni
Metro are characterised by high levels of habitat loss and urban development, with only 36% of
the Metro in a natural state and 64% severely or irreversibly modified (Table 5, Figure 4). Intensive
agriculture covers 23% of the Ekurhuleni Metro, and mining and urban development 7% and 35%
18
Bioregional Plan for Ekurhuleni Metro – March 2014
respectively. The overall levels of habitat loss for the Gauteng Province (44%) are significantly
lower than for Ekurhuleni Metro (64%).
Table 5. Land Cover Classes in the Ekurhuleni Metro and Gauteng Province. Extent in hectares
(ha).
Land Cover Level 1 Level 2 Ekurhuleni
Metro
%
Extent
Gauteng
Province
%
Extent
Natural Natural - Terrestrial 55515 28% 951308 52%
Natural - Aquatic 15279 8% 70631 4%
Natural SubTotal 70794 36% 1021939 56%
Irreversible
Modification
Intensive Agriculture 45245 23% 445606 25%
Urban 68637 35% 291750 16%
Mining 12855 7% 58538 3%
Irreversible
Modification
Sub-Total
126737 64% 795894 44%
Total 197531 1817833
Bioregional
Figure 4. Land cover patterns in the Ekurhuleni Metro (
2.6 Ecosystem Protection Level
‘Ecosystem protection level’ is a measure
protected area network. It is calculated as
vegetation type (i.e. ecosystem)
South Africa, 2010).
According to the National Biodiversity Assessment
considered "not protected" if under 5% of its biodiversity target is met within
"poorly protected" if 5-49% of its
protected" if 50-99 % of its biodiversity
met in protected areas it is considered "well protected
Metro are not protected, four are
are well protected (Table 6, Figure
Bioregional Plan for Ekurhuleni Metro – March 2014
Land cover patterns in the Ekurhuleni Metro (GTI, 2009)
Protection Levels within the Ekurhuleni Metro
a measure of how well an ecosystem is represented in
protected area network. It is calculated as the proportion of the biodiversity target
(i.e. ecosystem) that is included in the protected area network
ational Biodiversity Assessment (Driver et al., 2012) an ecosystem
under 5% of its biodiversity target is met within protected area
49% of its biodiversity target is met in protected areas; and "moderately
biodiversity target is met. If more than 100% of the biodiversity
met in protected areas it is considered "well protected". Three ecosystems
not protected, four are poorly protected, two are moderately protected and
, Figure 5).
19
an ecosystem is represented in the existing
proportion of the biodiversity target for each
protected area network (Government of
an ecosystem is
protected areas;
target is met in protected areas; and "moderately
the biodiversity target is
in the Ekurhuleni
protected and none
20
Bioregional Plan for Ekurhuleni Metro – March 2014
Ecosystem protection levels are important in the context of a bioregional plan as they give an
indication of which ecosystem types are not sufficiently protected in formal protected areas that
have secure, legal tenure. The long-term persistence of these ecosystem types is largely
dependent on the land-use controls and other mechanisms influenced by a bioregional plan.
Overall, this is the case throughout the Gauteng Province which is dominated by ecosystem
types that are insufficiently protected in formal protected areas. Conversely, ecosystem types
that are moderately or well-protected in formal protected areas are not likely to require the
same level of attention within a bioregional plan. There may, however, be other reasons (e.g.
ecological process areas or species of special concern) why portions of well protected
ecosystem types may be included in Critical Biodiversity Areas or Ecological Support Areas
identified in bioregional plans.
It is important to note that the protection levels of ecosystems used in this section are aligned
with the NBA 2011 (Driver et al, 2012) categories which are based only on formal Protected
Areas. These are areas such as National Parks, legally-declared Nature Reserves, World Heritage
Sites and Protected Environments which are secured by appropriate legal mechanisms such as
declaration under the Protected Areas Act. Importantly, and in contrast, the Gauteng C-Plan
v3.3 uses a different definition of protected areas which includes some undeclared conservation
areas, and excludes some legally declared protected area types such as Protected
Environments and World Heritage Sites (see footnote in section 2.8.2).
Table 6. Ecosystem protection levels for Ekurhuleni Metro. Extent in hectares (ha).
Vegetation type Extent in ha
Not protected 82255
Eastern Highveld Grassland 23263
Rand Highveld Grassland 5755
Soweto Highveld Grassland 53237
Poorly protected 111410
Carletonville Dolomite Grassland 50571
Eastern Temperate Freshwater Wetlands 7953
Egoli Granite Grassland 6048
Tsakane Clay Grassland 46838
Moderately protected 3865
Andesite Mountain Bushveld 3402
Gold Reef Mountain Bushveld 463
Well protected 0
NA
Bioregional
Figure 5. Ecosystem protection levels in the
2.7 Why is a Bioregional Plan N
A bioregional plan for the Ekurhuleni Metro
Biodiversity value: The region contains a relatively large number of
consequence of its topographic and geological diversity. Further, the area supports important
ecological processes, especially processes associated with wetland and river systems.
Threatened species and ecosystems
the area supporting a number of threatened species,
the Metro has been identified as threatened
Ecosystems, while 97% of the wetl
threatened.
Bioregional Plan for Ekurhuleni Metro – March 2014
evels in the Ekurhuleni Metro.
regional Plan Necessary?
Ekurhuleni Metro is justified on the following grounds:
: The region contains a relatively large number of ecosystems and species, as a
consequence of its topographic and geological diversity. Further, the area supports important
ecological processes, especially processes associated with wetland and river systems.
ecosystems: Much of the biodiversity in the Metro is threatened,
the area supporting a number of threatened species, particularly plants. 69% of the
etro has been identified as threatened according to the National List of Threatened
% of the wetland ecosystem types and 29% of the river ecosystem
21
and species, as a
consequence of its topographic and geological diversity. Further, the area supports important
ecological processes, especially processes associated with wetland and river systems.
etro is threatened, with
particularly plants. 69% of the total area of
according to the National List of Threatened
ecosystem types are
22
Bioregional Plan for Ekurhuleni Metro – March 2014
Nature of the pressures on biodiversity: The key pressures on biodiversity in the Gauteng Province
are linked to rapid land-use change, particularly urban and industrial development. Thus, a
bioregional plan, which is primarily aimed at influencing decision-making processes related to
land-use planning, is the appropriate intervention tool.
Lack of viable alternative methods to protect biodiversity: Although protected area expansion
through land purchase and biodiversity stewardship can play an important role in protecting
specific sites, the combination of high levels of habitat loss, numerous development pressures,
and high land value, is likely to preclude protected area expansion from being the dominant
conservation mechanism in the region. Most ecosystems remain poorly protected, and scope
for protected area expansion is relatively limited. Hence the use of controls related to land-use
(e.g. zoning schemes, SDFs, Metropolitan Open Space Systems), infrastructural development
approvals (both strategically using Environmental Management Frameworks and reactively via
the Environmental Impact Assessment process) and interventions such implementing an
appropriate Metropolitan Open Space System - all of which should be influenced by a
bioregional plan - represent the best prospect for ensuring long-term persistence of biodiversity
in the Metro.
Need to formalize status of areas identified in the Ekurhuleni Biodiversity and Open Space
Strategy: Publishing the Ekurhuleni Bioregional Plan will improve the status and recognition of
priority conservation areas identified in the EBOSS. This is important as although the EBOSS has
been officially ratified by the Ekurhuleni Metropolitan Municipality, it does not have legal
standing outside of the Metro.
2.8 Requirement for a systematic biodiversity plan
According to the Guideline for Bioregional Plans (DEAT, 2009) a bioregional plan must be a
spatial plan showing terrestrial and aquatic features in the landscape that are critical for the
persistence of biodiversity and maintainence of ecosystem functioning. A bioregional plan must
be based on a systematic biodiversity plan, which is a rigorous, data-driven approach for
assessing the location, status and importance of a range of biodiversity features. In addition to
the general requirement for a systematic biodiversity plan, the guidelines specify a range of key
characteristics that a biodiversity plan would need to have before it can be considered to be
systematic, and further details a number of specific issues that need to be addressed in the
systematic biodiversity plan.
This Bioregional Plan for the Ekurhuleni Metro, is based on Gauteng C-Plan version v3.3, which is a
systematic biodiversity plan that was developed by the GDARD. The spatial priorities are heavily
influenced by fine-scale planning undertaken for the Ekurhuleni Biodiversity and Open Space
Strategy. Details of the biodiversity planning process are described in the technical
documentation provided with Gauteng C-Plan v3.3.

23
Bioregional Plan for Ekurhuleni Metro – March 2014
3 Part C: Critical Biodiversity Areas map, categories and description
3.1 Description of Critical Biodiversity Areas and Ecological Support Areas
Critical Biodiversity Areas are the portfolio of sites that are required to meet the region's biodiversity targets, and
that need to be maintained in the appropriate condition for their category. A map of CBAs for Gauteng was
produced as part of the Gauteng C-Plan v3.3 process and sites were assigned to CBA categories based on
their biodiversity characteristics, spatial configuration and requirement for meeting biodiversity targets for both
biodiversity pattern and ecological processes (see Table 7).
In order to meet the requirements for publishing a bioregional plan, and to allow specific land-use guidelines to
be developed, the broad provincial categories of Critical Biodiversity Area used in Gauteng C-Plan v3.3 were
split into two sub-categories on the basis of land cover and the underlying biodiversity features, as follows:
Critical Biodiversity Area 1 (CBA1), which are areas that need to remain in a largely natural state, and Critical
Biodiversity Area 2 (CBA 2), which are intensive agricultural areas (including cultivated fields) that have
importance for supporting threatened species, and which should be maintained under their current agricultural
land use rather than in a natural state. Ecological Support Areas were identified which are areas that are
important for maintaining the ecological processes on which CBAs depend. Again, these were split into two
categories based on their current ecological condition: Ecological Support Area 1 (ESA 1), are largely natural or
near-natural landscapes which are important for preventing degradation of Critical Biodiversity Areas and
Protected Areas, and are particularly focussed on the maintenance of ecological processes (e.g. river buffers
helping to moderate water flow during floods) – these should be maintained in a natural or near-natural state;
while Ecological Support Area 2 (ESA 2) are highly modified areas which potentially retain some value for
supporting ecological processes and where additional impacts on ecological processes should be avoided.
Other categories included in the CBA map2 are Protected Areas3; Other Natural Areas, which are areas that still
contain natural habitat but are not required to meet biodiversity targets; and No Natural Areas Remaining,
which are areas identified in Gauteng C-Plan v3.3 as having no remaining intact, natural habitat.
2 A CBA Map in this context refers to a map showing all the Critical Biodiversity Areas, Ecological Support Areas,
Protected Areas, other natural areas, and no natural areas remaining. 3 The protected area definition used in Gauteng C-Plan v3.3 deviates from national policy documents and
guidelines (Protected Areas Act, NBA 2011 & NPAES 2008) which include all formally proclaimed protected
areas (including World Heritage Sites and Protected Environments) and exclude undeclared conservation
areas which do not have secure legal status. Gauteng C-Plan v3.3 includes most types of formal Protected
Area but excludes Protected Environments and World Heritage Sites (which are considered PAs under
Protected Areas Act), and includes undeclared private nature reserves and natural heritage sites that have
biodiversity focussed management plans in place (these would be categorised as informal conservation areas
under the National Protected Area Expansion Strategy and would not be seen to be formally meeting
Protected Area targets). Note these differences are not significant in Ekurhuleni Metro as both PA layers are the
same. In other parts of Gauteng the differences are significant.
24
Bioregional Plan for Ekurhuleni Metro – March 2014
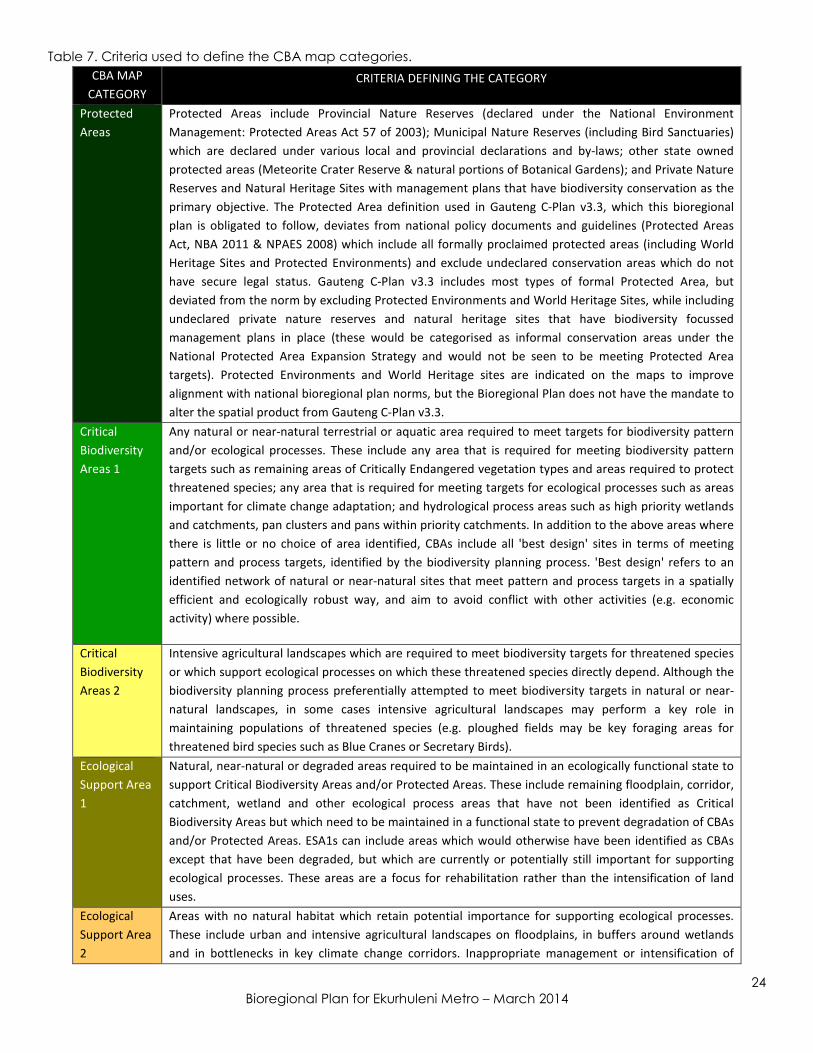
Table 7. Criteria used to define the CBA map categories.
CBA MAP
CATEGORY
CRITERIA DEFINING THE CATEGORY
Protected
Areas
Protected Areas include Provincial Nature Reserves (declared under the National Environment
Management: Protected Areas Act 57 of 2003); Municipal Nature Reserves (including Bird Sanctuaries)
which are declared under various local and provincial declarations and by-laws; other state owned
protected areas (Meteorite Crater Reserve & natural portions of Botanical Gardens); and Private Nature
Reserves and Natural Heritage Sites with management plans that have biodiversity conservation as the
primary objective. The Protected Area definition used in Gauteng C-Plan v3.3, which this bioregional
plan is obligated to follow, deviates from national policy documents and guidelines (Protected Areas
Act, NBA 2011 & NPAES 2008) which include all formally proclaimed protected areas (including World
Heritage Sites and Protected Environments) and exclude undeclared conservation areas which do not
have secure legal status. Gauteng C-Plan v3.3 includes most types of formal Protected Area, but
deviated from the norm by excluding Protected Environments and World Heritage Sites, while including
undeclared private nature reserves and natural heritage sites that have biodiversity focussed
management plans in place (these would be categorised as informal conservation areas under the
National Protected Area Expansion Strategy and would not be seen to be meeting Protected Area
targets). Protected Environments and World Heritage sites are indicated on the maps to improve
alignment with national bioregional plan norms, but the Bioregional Plan does not have the mandate to
alter the spatial product from Gauteng C-Plan v3.3.
Critical
Biodiversity
Areas 1
Any natural or near-natural terrestrial or aquatic area required to meet targets for biodiversity pattern
and/or ecological processes. These include any area that is required for meeting biodiversity pattern
targets such as remaining areas of Critically Endangered vegetation types and areas required to protect
threatened species; any area that is required for meeting targets for ecological processes such as areas
important for climate change adaptation; and hydrological process areas such as high priority wetlands
and catchments, pan clusters and pans within priority catchments. In addition to the above areas where
there is little or no choice of area identified, CBAs include all 'best design' sites in terms of meeting
pattern and process targets, identified by the biodiversity planning process. 'Best design' refers to an
identified network of natural or near-natural sites that meet pattern and process targets in a spatially
efficient and ecologically robust way, and aim to avoid conflict with other activities (e.g. economic
activity) where possible.
Critical
Biodiversity
Areas 2
Intensive agricultural landscapes which are required to meet biodiversity targets for threatened species
or which support ecological processes on which these threatened species directly depend. Although the
biodiversity planning process preferentially attempted to meet biodiversity targets in natural or near-
natural landscapes, in some cases intensive agricultural landscapes may perform a key role in
maintaining populations of threatened species (e.g. ploughed fields may be key foraging areas for
threatened bird species such as Blue Cranes or Secretary Birds).
Ecological
Support Area
1
Natural, near-natural or degraded areas required to be maintained in an ecologically functional state to
support Critical Biodiversity Areas and/or Protected Areas. These include remaining floodplain, corridor,
catchment, wetland and other ecological process areas that have not been identified as Critical
Biodiversity Areas but which need to be maintained in a functional state to prevent degradation of CBAs
and/or Protected Areas. ESA1s can include areas which would otherwise have been identified as CBAs
except that have been degraded, but which are currently or potentially still important for supporting
ecological processes. These areas are a focus for rehabilitation rather than the intensification of land
uses.
Ecological
Support Area
2
Areas with no natural habitat which retain potential importance for supporting ecological processes.
These include urban and intensive agricultural landscapes on floodplains, in buffers around wetlands
and in bottlenecks in key climate change corridors. Inappropriate management or intensification of
25
Bioregional Plan for Ekurhuleni Metro – March 2014
land-use in these areas could result in additional impacts on ecological processes.
Other
Natural Areas
Natural areas not included in the above categories.
No Natural
Areas
Remaining
These areas include intensive agriculture, plantations, mined areas, urban areas, infrastructure and
dams.
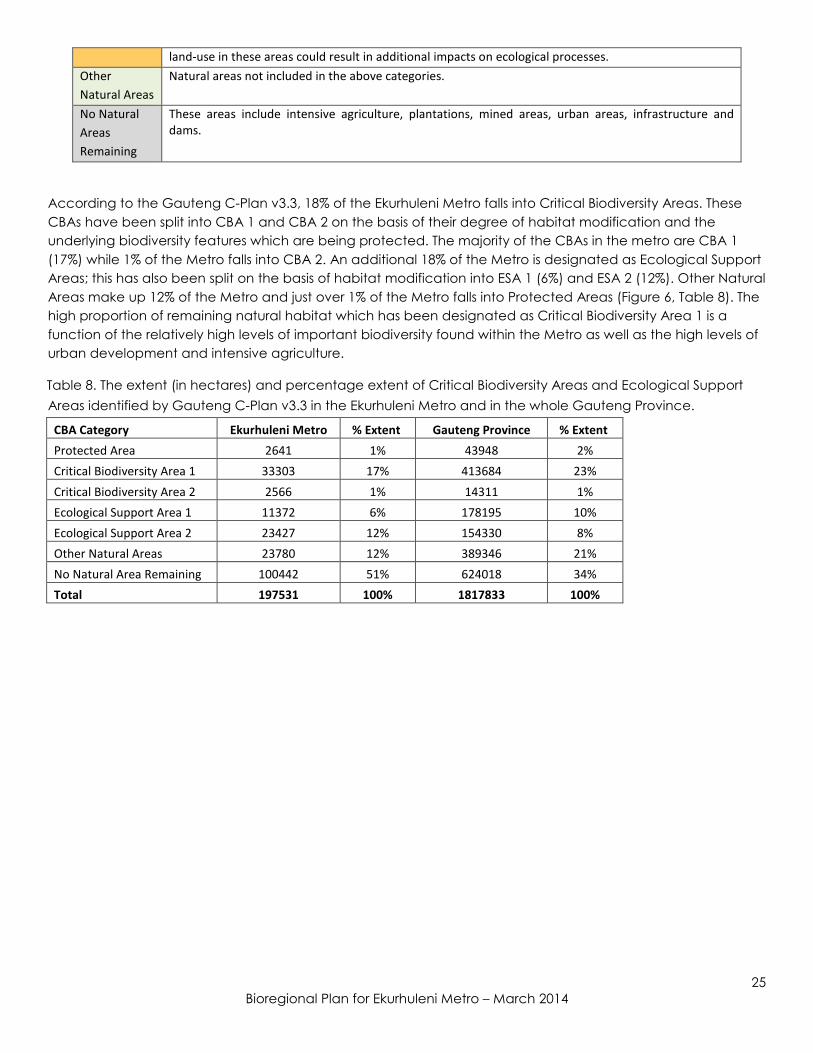
According to the Gauteng C-Plan v3.3, 18% of the Ekurhuleni Metro falls into Critical Biodiversity Areas. These
CBAs have been split into CBA 1 and CBA 2 on the basis of their degree of habitat modification and the
underlying biodiversity features which are being protected. The majority of the CBAs in the metro are CBA 1
(17%) while 1% of the Metro falls into CBA 2. An additional 18% of the Metro is designated as Ecological Support
Areas; this has also been split on the basis of habitat modification into ESA 1 (6%) and ESA 2 (12%). Other Natural
Areas make up 12% of the Metro and just over 1% of the Metro falls into Protected Areas (Figure 6, Table 8). The
high proportion of remaining natural habitat which has been designated as Critical Biodiversity Area 1 is a
function of the relatively high levels of important biodiversity found within the Metro as well as the high levels of
urban development and intensive agriculture.
Table 8. The extent (in hectares) and percentage extent of Critical Biodiversity Areas and Ecological Support
Areas identified by Gauteng C-Plan v3.3 in the Ekurhuleni Metro and in the whole Gauteng Province.
CBA Category Ekurhuleni Metro % Extent Gauteng Province % Extent
Protected Area 2641 1% 43948 2%
Critical Biodiversity Area 1 33303 17% 413684 23%
Critical Biodiversity Area 2 2566 1% 14311 1%
Ecological Support Area 1 11372 6% 178195 10%
Ecological Support Area 2 23427 12% 154330 8%
Other Natural Areas 23780 12% 389346 21%
No Natural Area Remaining 100442 51% 624018 34%
Total 197531 100% 1817833 100%
26
Bioregional Plan for Ekurhuleni Metro – March 2014
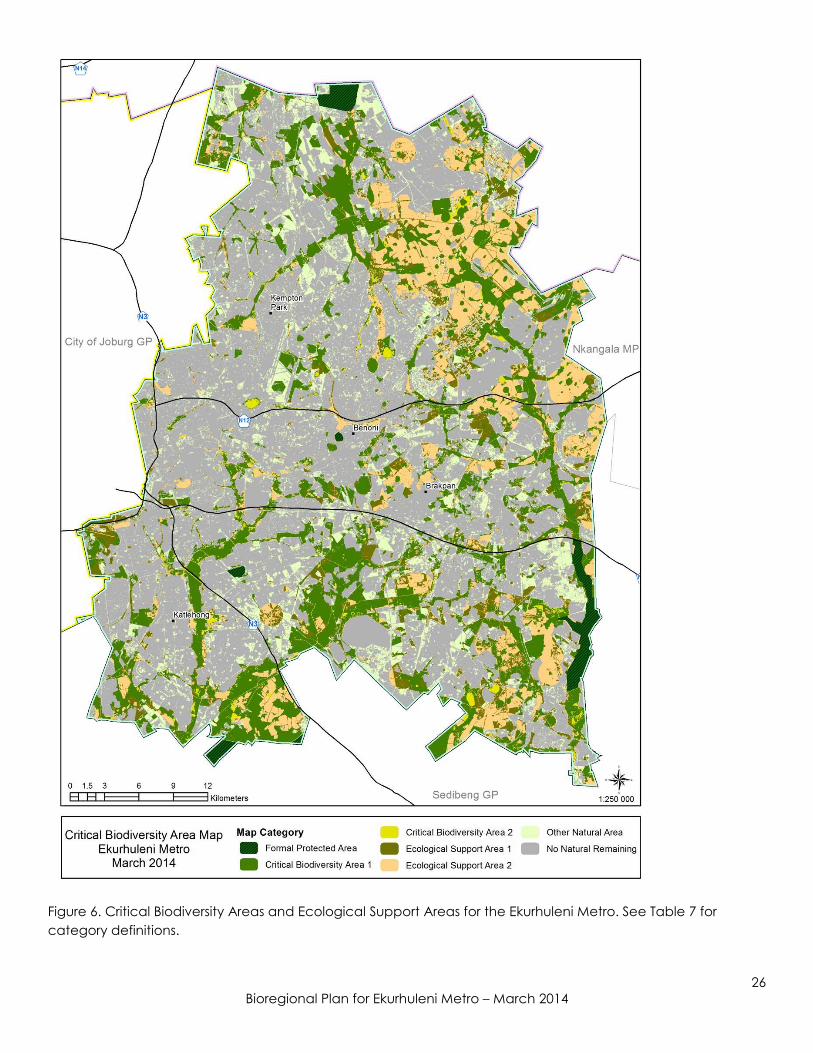
Figure 6. Critical Biodiversity Areas and Ecological Support Areas for the Ekurhuleni Metro. See Table 7 for
category definitions.
27
Bioregional Plan for Ekurhuleni Metro – March 2014
4 Part D: Guidelines
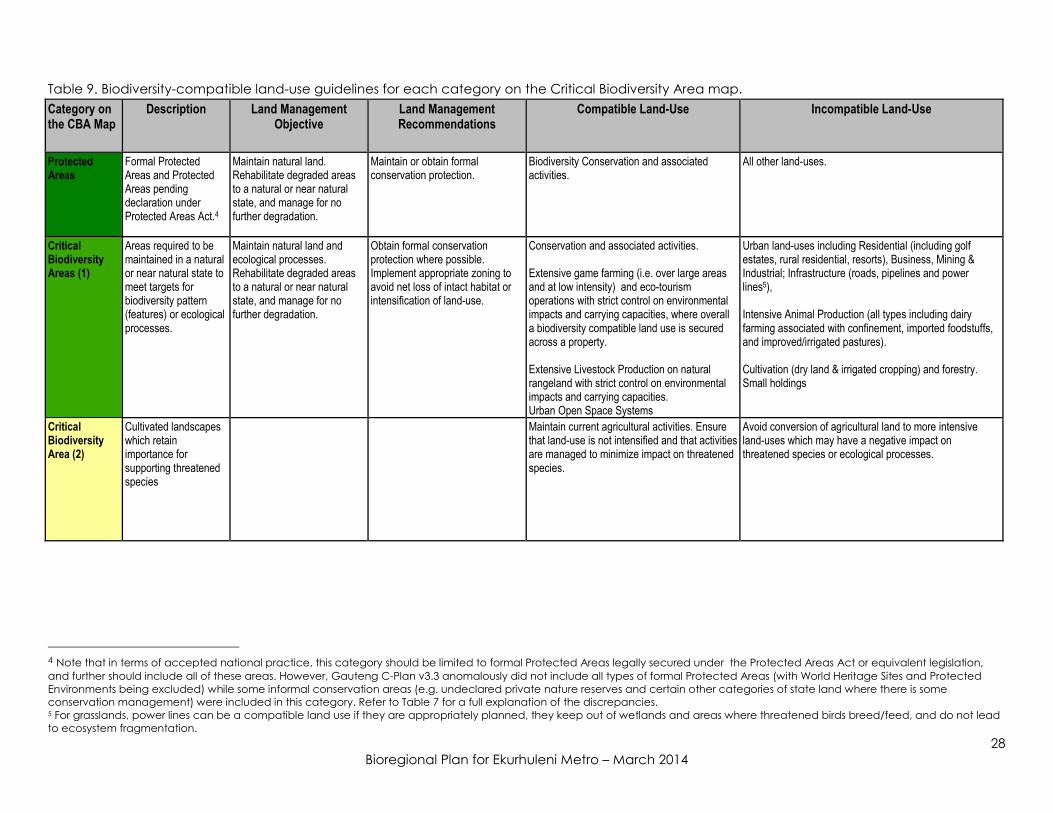
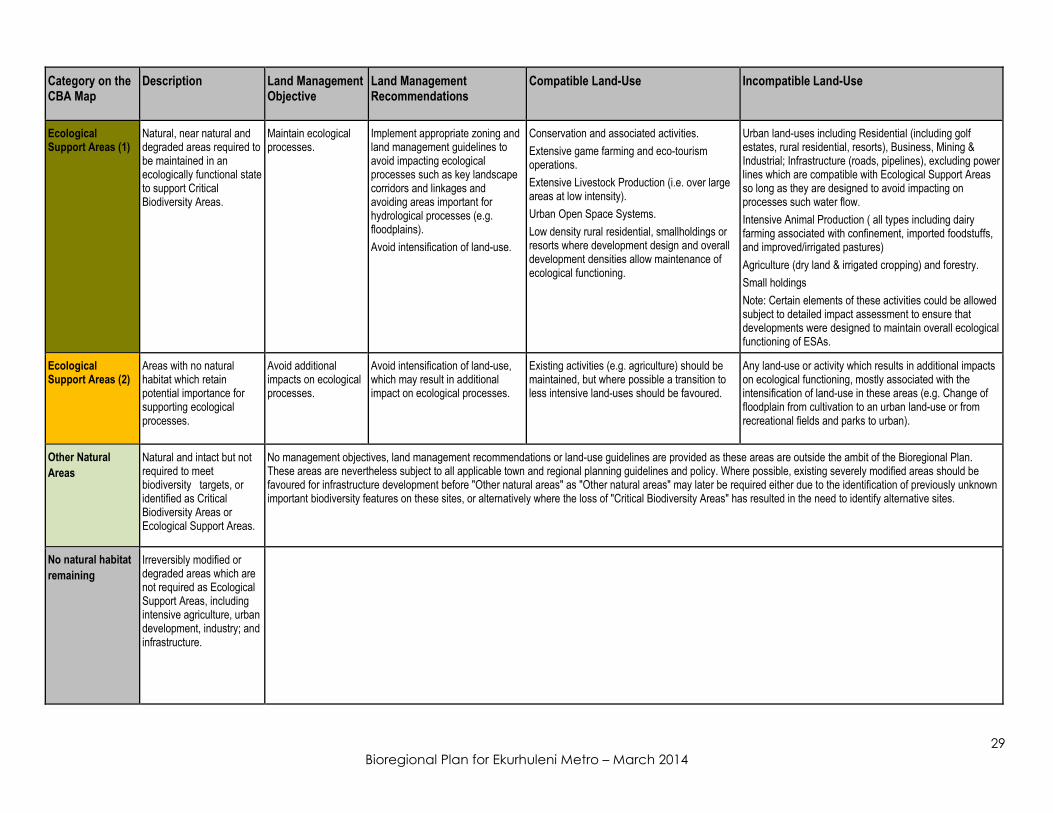
This section contains guidelines on land-uses that are compatible with the objectives of each
category on the Critical Biodiversity Area map. Table 9 is the summary of biodiversity-compatible
land-use guidelines, and includes a description of each category, the overall land management
objectives for land within that category, recommendations for appropriate management and
details of compatible and incompatible land-uses. The guidelines for compatible and
incompatible land-uses are designed to aid planners to identify the appropriate land-use zones
and controls to impose on areas designated as Critical Biodiversity Areas or Ecological Support
Areas when developing Spatial Development Frameworks, Environmental Management
Frameworks or similar strategic land-use planning tools. The guidelines also give the evaluators of
Environmental Impact Assessments an indication of appropriate land-use within each map
category. Importantly, the Bioregional Plan only provides guidance on appropriate land-uses
and activities and does not in itself grant or remove land development rights.
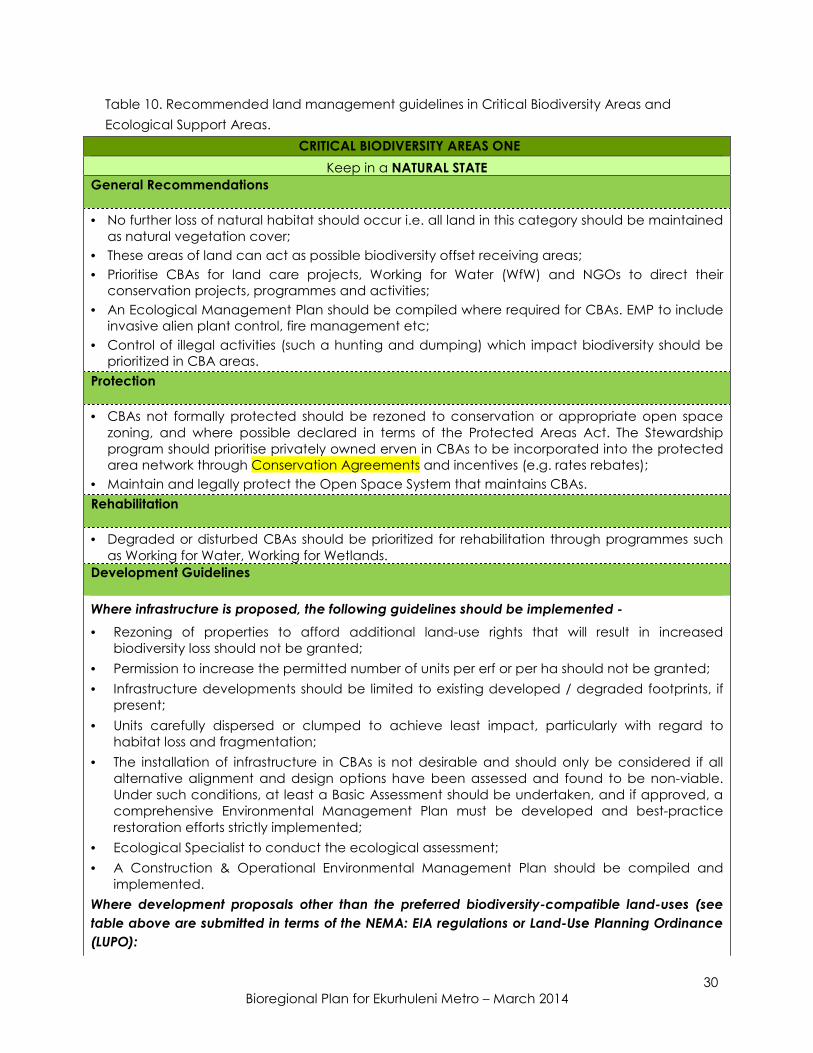
Table 10 contains broader land management guidelines for areas within each category on the
Critical Biodiversity Area map. The recommendations are designed to inform a wide range of
land-use planning and decision-making processes, as well as conservation implementation
activities. The recommendations only provide guidance to decision-makers and serve as an
informant to planning processes on appropriate land management and activities and do not in
themselves grant or remove land development rights.
28
Bioregional Plan for Ekurhuleni Metro – March 2014
Table 9. Biodiversity-compatible land-use guidelines for each category on the Critical Biodiversity Area map.
Category on the CBA Map
Description Land Management Objective
Land Management Recommendations
Compatible Land-Use Incompatible Land-Use
Protected Areas
Formal Protected Areas and Protected Areas pending declaration under Protected Areas Act.4
Maintain natural land. Rehabilitate degraded areas to a natural or near natural state, and manage for no further degradation.
Maintain or obtain formal conservation protection.
Biodiversity Conservation and associated activities.
All other land-uses.
Critical Biodiversity Areas (1)
Areas required to be maintained in a natural or near natural state to meet targets for biodiversity pattern (features) or ecological processes.
Maintain natural land and ecological processes. Rehabilitate degraded areas to a natural or near natural state, and manage for no further degradation.
Obtain formal conservation protection where possible. Implement appropriate zoning to avoid net loss of intact habitat or intensification of land-use.
Conservation and associated activities. Extensive game farming (i.e. over large areas and at low intensity) and eco-tourism operations with strict control on environmental impacts and carrying capacities, where overall a biodiversity compatible land use is secured across a property. Extensive Livestock Production on natural rangeland with strict control on environmental impacts and carrying capacities. Urban Open Space Systems
Urban land-uses including Residential (including golf estates, rural residential, resorts), Business, Mining & Industrial; Infrastructure (roads, pipelines and power lines5), Intensive Animal Production (all types including dairy farming associated with confinement, imported foodstuffs, and improved/irrigated pastures). Cultivation (dry land & irrigated cropping) and forestry. Small holdings
Critical Biodiversity Area (2)
Cultivated landscapes which retain importance for supporting threatened species
Maintain current agricultural activities. Ensure that land-use is not intensified and that activities are managed to minimize impact on threatened species.
Avoid conversion of agricultural land to more intensive land-uses which may have a negative impact on threatened species or ecological processes.
4 Note that in terms of accepted national practice, this category should be limited to formal Protected Areas legally secured under the Protected Areas Act or equivalent legislation,
and further should include all of these areas. However, Gauteng C-Plan v3.3 anomalously did not include all types of formal Protected Areas (with World Heritage Sites and Protected
Environments being excluded) while some informal conservation areas (e.g. undeclared private nature reserves and certain other categories of state land where there is some
conservation management) were included in this category. Refer to Table 7 for a full explanation of the discrepancies. 5 For grasslands, power lines can be a compatible land use if they are appropriately planned, they keep out of wetlands and areas where threatened birds breed/feed, and do not lead
to ecosystem fragmentation.
29
Bioregional Plan for Ekurhuleni Metro – March 2014
Category on the CBA Map
Description Land Management Objective
Land Management Recommendations
Compatible Land-Use Incompatible Land-Use
Ecological Support Areas (1)
Natural, near natural and degraded areas required to be maintained in an ecologically functional state to support Critical Biodiversity Areas.
Maintain ecological processes.
Implement appropriate zoning and land management guidelines to avoid impacting ecological processes such as key landscape corridors and linkages and avoiding areas important for hydrological processes (e.g. floodplains).
Avoid intensification of land-use.
Conservation and associated activities.
Extensive game farming and eco-tourism operations.
Extensive Livestock Production (i.e. over large areas at low intensity).
Urban Open Space Systems.
Low density rural residential, smallholdings or resorts where development design and overall development densities allow maintenance of ecological functioning.
Urban land-uses including Residential (including golf estates, rural residential, resorts), Business, Mining & Industrial; Infrastructure (roads, pipelines), excluding power lines which are compatible with Ecological Support Areas so long as they are designed to avoid impacting on processes such water flow.
Intensive Animal Production ( all types including dairy farming associated with confinement, imported foodstuffs, and improved/irrigated pastures)
Agriculture (dry land & irrigated cropping) and forestry.
Small holdings
Note: Certain elements of these activities could be allowed subject to detailed impact assessment to ensure that developments were designed to maintain overall ecological functioning of ESAs.
Ecological Support Areas (2)
Areas with no natural habitat which retain potential importance for supporting ecological processes.
Avoid additional impacts on ecological processes.
Avoid intensification of land-use, which may result in additional impact on ecological processes.
Existing activities (e.g. agriculture) should be maintained, but where possible a transition to less intensive land-uses should be favoured.
Any land-use or activity which results in additional impacts on ecological functioning, mostly associated with the intensification of land-use in these areas (e.g. Change of floodplain from cultivation to an urban land-use or from recreational fields and parks to urban).
Other Natural
Areas
Natural and intact but not required to meet biodiversity targets, or identified as Critical Biodiversity Areas or Ecological Support Areas.
No management objectives, land management recommendations or land-use guidelines are provided as these areas are outside the ambit of the Bioregional Plan. These areas are nevertheless subject to all applicable town and regional planning guidelines and policy. Where possible, existing severely modified areas should be favoured for infrastructure development before "Other natural areas" as "Other natural areas" may later be required either due to the identification of previously unknown important biodiversity features on these sites, or alternatively where the loss of "Critical Biodiversity Areas" has resulted in the need to identify alternative sites.
No natural habitat
remaining
Irreversibly modified or degraded areas which are not required as Ecological Support Areas, including intensive agriculture, urban development, industry; and infrastructure.
30
Bioregional Plan for Ekurhuleni Metro – March 2014
Table 10. Recommended land management guidelines in Critical Biodiversity Areas and
Ecological Support Areas.
CRITICAL BIODIVERSITY AREAS ONE
Keep in a NATURAL STATE
General Recommendations
• No further loss of natural habitat should occur i.e. all land in this category should be maintained
as natural vegetation cover;
• These areas of land can act as possible biodiversity offset receiving areas;
• Prioritise CBAs for land care projects, Working for Water (WfW) and NGOs to direct their
conservation projects, programmes and activities;
• An Ecological Management Plan should be compiled where required for CBAs. EMP to include
invasive alien plant control, fire management etc;
• Control of illegal activities (such a hunting and dumping) which impact biodiversity should be
prioritized in CBA areas.
Protection
• CBAs not formally protected should be rezoned to conservation or appropriate open space
zoning, and where possible declared in terms of the Protected Areas Act. The Stewardship
program should prioritise privately owned erven in CBAs to be incorporated into the protected
area network through Conservation Agreements and incentives (e.g. rates rebates);
• Maintain and legally protect the Open Space System that maintains CBAs.
Rehabilitation
• Degraded or disturbed CBAs should be prioritized for rehabilitation through programmes such
as Working for Water, Working for Wetlands.
Development Guidelines
Where infrastructure is proposed, the following guidelines should be implemented -
• Rezoning of properties to afford additional land-use rights that will result in increased
biodiversity loss should not be granted;
• Permission to increase the permitted number of units per erf or per ha should not be granted;
• Infrastructure developments should be limited to existing developed / degraded footprints, if
present;
• Units carefully dispersed or clumped to achieve least impact, particularly with regard to
habitat loss and fragmentation;
• The installation of infrastructure in CBAs is not desirable and should only be considered if all
alternative alignment and design options have been assessed and found to be non-viable.
Under such conditions, at least a Basic Assessment should be undertaken, and if approved, a
comprehensive Environmental Management Plan must be developed and best-practice
restoration efforts strictly implemented;
• Ecological Specialist to conduct the ecological assessment;
• A Construction & Operational Environmental Management Plan should be compiled and
implemented.
Where development proposals other than the preferred biodiversity-compatible land-uses (see
table above are submitted in terms of the NEMA: EIA regulations or Land-Use Planning Ordinance
(LUPO):
31
Bioregional Plan for Ekurhuleni Metro – March 2014
• A Screening Exercise should be undertaken by a Biodiversity Specialist or Ecologist to verify the
CBA map category on site;
• If the site is verified as a CBA, land-uses other than Conservation Use should be identified as a
‘Fatal Flaw’;
• If the application is pursued they should be informed by a specialist biodiversity assessment.
Aquatic Ecosystems
• Maintain water quality and flow regimes should be maintained as close to natural as possible;
• Where Environmental Reserves or Environmental Flow Requirements have been determined
these should be strictly adhered to;
• All effluent (including municipal, mining and industrial waste water) as well as acid mine
drainage should be treated to required specifications before release;
• Stormwater flow should be managed to avoid damage to CBA areas.
• Where CBAs include floodplains (e.g. areas within the 1:100 year floodline), riperian areas (e.g.
as a minimum, the 32m around rivers) or buffers around wetlands, particular attention should
applied to ensure that these remain in a natural state or are rehabilited to this state. In addition
to avoiding habitat loss or degradation, other activities such as livestock access may need to
be controlled and invasive alien vegetaion managed to avoid damage to banks. Do not
permit infilling, excavation, drainage, hardened surfaces (including buildings and asphalt),
intensive agriculture or any new infrastructure developments within a river or wetland.
• Areas that are degraded or disturbed should be rehabilitated, through programmes such as
Working for Water, Working for Wetlands and a systematic invasive alien vegetation
eradication programme implemented.
CRITICAL BIODIVERSTIY AREA TWO
Maintain as an AGRICULTURAL LANDSCAPE
General Recommendations
• Avoid conversion of agricultural land to more intensive land-uses which may have a negative
impact on threatened species or the ecological processes which support these species.
• Agricultural activities should be managed to avoid impacts on the specific threatened species
dependent on these areas.
• Intensification of land-use in these areas should be avoided.
• Should there be any remaining areas intact habitat in this category, these areas should be
treated as Critical Biodiversity Area One, and no further loss of natural habitat should occur;
• These areas of land would be the focus of threatened species specific management
interventions by conservation agencies and NGOs;
• Species management plans may be necessary in these areas.
• Control of illegal activities (such a hunting and dumping) which impact on threatened species
should be prioritized in CBA2 areas.
Protection
• CBA2s may be the focus of stewardship agreements aimed at the protection of threatened
species.
32
Bioregional Plan for Ekurhuleni Metro – March 2014
• CBA2s should be appropriately zoned to avoid conversion from agriculture.
Rehabilitation
• Rehabilitation work should only be undertaken if it does not negatively impact on the identified
threatened species dependent on the agricultural landscape.
Development Guidelines
Where infrastructure is proposed, the following guidelines should be implemented -
• Rezoning of properties to afford additional land-use rights that will result in increased
biodiversity loss through conversion of land from agriculture should not be granted;
• Permission to increase the permitted number of units per erf or per ha should not be granted;
• Infrastructure developments should be limited to existing footprints, if present, and should
avoid encroaching on natural or agricultural landscapes;
• Should additional infrastructure be required, the requirements of threatened species should be
taken into account. At least a Basic Assessment should be undertaken for any development
which results in the intensification of land-use, and if intensification of land-use is approved, a
comprehensive EMP or must be developed to minimize impacts on threatened species;
• Ecological Specialist to conduct the ecological assessment;
• A Construction & Operational Environmental Management Plan should be compiled and
implemented.
Where development proposals other than the preferred biodiversity-compatible land-uses (see
table above are submitted in terms of the NEMA: EIA regulations or Land-Use Planning Ordinance
(LUPO):
• A Screening Exercise should be undertaken by a Biodiversity Specialist or Ecologist to verify the
CBA map category on site;
• If the site is verified as a CBA2, developments which result in the intensification of land-use or
the conversion of agricultural land should be identified as a ‘Fatal Flaw’;
• If the application is pursued they should be informed by a specialist biodiversity assessment.
Aquatic Ecosystems
• Maintain water quality and flow regimes should be maintained as close to natural as possible;
• Where Environmental Reserves or Environmental Flow Requirements have been determined
these should be strictly adhered to;
• All effluent (including municipal, mining and industrial waste water) as well as acid mine
drainage should be treated to required specifications before release;
• Stormwater flow should be managed to avoid damage to CBA2 areas.
• Where CBA2s include floodplains (e.g. areas within the 1:100 year floodline), riperian areas (e.g.
as a minimum, the 32m around rivers) or buffers around wetlands, particular attention should
applied to ensure that these remain in a natural state or are rehabilited to this state in order to
maintain suitbaility for thretaned species dependent on these habitats. In addition to avoiding
intensification of land-use, other activities such as livestock access to wetalnds may need to be
controlled to avoid impacts on threatened species. Do not permit infilling, excavation,
drainage, hardened surfaces (including buildings and asphalt), intensive agriculture or any
new infrastructure developments within a river or wetland.
• Areas that are degraded or disturbed should be rehabilitated, through programmes such as
Working for Water, Working for Wetlands and a systematic invasive alien vegetation
33
Bioregional Plan for Ekurhuleni Metro – March 2014
eradication programme implemented. Rehabilitation work should be undertaken in a way
which does not negatively impact on the survival of threatened species.
ECOLOGICAL SUPPORT AREAS ONE
Maintain in a FUNCTIONAL STATE.
General Recommendations
• Maintain in a functional state, avoid intensification of land-uses, and rehabilitate to a natural
or semi-natural state where possible. In transformed areas which are important for maintaining
ecological processes, current land-uses should be maintained, intensification of use (e.g. a
transition from agriculture to urban) should be avoided, and where possible areas should be
rehabilitated.
• No further loss of natural habitat should be allowed, and land in this category currently in a
degraded state should be rehabilitated or restored to a natural or semi-natural state once the
current land-use has ceased;
• Maintain current land-uses where these play a role in supporting ecological processes;
• Ensure land-use changes do not impact negatively on ecological processes.
• The maintenance of connectivity between CBAs, continued ecosystem functioning within the
CBA corridors, and the prevention of degradation of adjacent Critical Biodiversity Areas must
be achieved;
• After the CBA1s, ESA1s should be prioritised for land care projects, Working for Water (WfW)
and NGOs to direct their conservation projects, programmes and activities;
• An Ecological Management Plan should be compiled where required for ESAs. EMP to include
invasive alien plant control, fire management etc.
Development Guidelines
Where infrastructure is proposed, the following guidelines should be implemented -
• Rezoning of properties to afford additional land-use rights that will result in increased impact
on ecological processes should not be granted, unless significant net conservation gains can
be achieved, ecosystem functioning and connectivity of Ecosystem Support Areas (ESAs) will
not compromised, and biodiversity impacts with regard to species and ecosystems are of an
acceptable level and mitigated where possible;
• Infrastructure developments should be limited to existing developed / degraded footprints,
where possible;
• Units carefully dispersed or clumped to achieve least impact, particularly with regard to
impacts on ecological processes;
• Ecological Specialist to conduct the ecological assessment;
• A Construction & Operational Environmental Management Plan to be compiled and
implemented.
Where development proposals other than the preferred biodiversity-compatible land-uses are
submitted in terms of the NEMA: EIA regulations or Land-use Planning Ordinance (LUPO) for areas
which remain intact:
34
Bioregional Plan for Ekurhuleni Metro – March 2014
• A Screening Exercise should be undertaken by a Biodiversity Specialist or Ecologist to verify
the CBA map category on site;
• If the site is verified as an ESA, developments other than the preferred biodiversity-compatible
land-uses should be carefully screened to ensure that developments are planned and
activities undertaken in a way that minimizes impact on ecological processes. Impacts should
be mitigated.
• If the application is pursued they should be informed by a specialist biodiversity assessment.
In transformed areas which are still important for supporting ecological processes, the following
guidelines should be implemented -
• Current land-uses should be maintained, intensification of use (e.g. a transition from extensive
agriculture to urban) should be avoided, and where possible areas should be rehabilitated;
• Land-use changes should be screened to ensure that they do not have an unacceptable
impact on ecological processes.
Aquatic Ecosystems
• Water quality and flow regimes should be maintained as close to natural as possible;
• Where Environmental Reserves or Environmental Flow Requirements have been determined
these should be strictly adhered to;
• All effluent (including municipal, mining and industrial waste water) as well as acid mine
drainage should be treated to required specifications before release;
• Stormwater flow should be managed to avoid damage to ESA areas;
• Where ESAs include floodplains (e.g. areas within the 1:100 year floodline), riperian areas (e.g.
as a minimum, the 32m around rivers) or buffers around wetlands, partcular attention should
applied to ensure that these remain in a natural state or are rehabilited to this state. In
addition to avoiding habitat loss or degradation, other activities such as livestock access may
need to be controlled and invasive alien vegetaion managed to avoid damage to banks. Do
not permit infilling, excavation, drainage, hardened surfaces (including buildings), intensive
agriculture or any new infrastructure developments within a river or wetland.
• Areas that are degraded or disturbed should be rehabilitated, through programmes such as
Working for Water, Working for Wetlands and a systematic invasive alien vegetation
eradication programme implemented.
• Creation of berms, roads, culverts, canalisation, channelisation, invasive alien vegetation,
impoundment, abstraction, well points, storm-water or other point source inflows, irrigation
return flows, grazing / trampling, agriculture, golf courses, suburban gardens, artificial
deepening, and drainage, should be avoided where possible within the 1:20 year floodline.
ECOLOGICAL SUPPORT AREAS TWO
Maintain and restore ECOLOGICAL FUNCTIONING where possible
General Recommendations
• Additional impacts on ecological processes should be avoided. In transformed areas which
are important for maintaining ecological processes, current land-uses should be maintained,
intensification of use (e.g. a transition from agriculture to urban) should be avoided, and
where possible areas should be rehabilitated.
35
Bioregional Plan for Ekurhuleni Metro – March 2014
• The maintenance of connectivity between CBAs, continued ecosystem functioning within the
CBA corridors, and the prevention of degradation of adjacent Critical Biodiversity Areas must
be achieved;
• In some cases the rehabilitation of ESA2s may be the suitable for land care projects, Working
for Water (WfW) and NGOs to direct their conservation projects, programmes and activities;
Development Guidelines
Where infrastructure is proposed, the following guidelines should be implemented -
• Infrastructure should be designed to avoid additional impacts on ecological processes.
In transformed areas which are still important for supporting ecological processes, the following
guidelines should be implemented -
• Current land-uses should be maintained, intensification of use (e.g. a transition from agriculture
to urban) should be avoided, and where possible areas should be rehabilitated;
• Infrastructural developments should be screened to ensure that they do not have an
unacceptable impact on ecological processes.
Aquatic Ecosystems
• Water quality and flow regimes should be maintained as close to natural as possible;
• Where Environmental Reserves or Environmental Flow Requirements have been determined
these should be strictly adhered to;
• All effluent (including municipal, mining and industrial waste water) as well as acid mine
drainage should be treated to required specifications before release;
• Stormwater flow should be managed to avoid damage to ESA2 areas;
• Where ESA2s include floodplains (e.g. areas within the 1:100 year floodline), riperian areas (e.g.
as a minimum, the 32m around rivers) or buffers around wetlands, partcular attention should
applied to ensure that there is no additional impact on ecological functioning, and where
possible these areas rehabilited to improve ecological functioning. In addition to avoiding
intensification of land-use, other activities such as livestock access may need to be controlled
and invasive alien vegetaion managed to avoid damage to banks. Do not permit infilling,
excavation, drainage, hardened surfaces (including buildings), intensive agriculture or any
new infrastructural developments within a river or wetland.
• Creation of berms, roads, culverts, canalisation, channelisation, invasive alien vegetation,
impoundment, abstraction, well points, storm-water or other point source inflows, irrigation
return flows, grazing / trampling, agriculture, golf courses, suburban gardens, artificial
deepening, and drainage, should be avoided where possible within the 1:20 year floodline.
36
Bioregional Plan for Ekurhuleni Metro – March 2014
5 Part F: Monitoring, Reviewing and Updating
The Ekurhuleni Metro is the developer and primary implementing agent of the Bioregional Plan,
and is, therefore, responsible for the monitoring, reviewing and updating of this plan. The
systematic biodiversity plan underpinning the Bioregional Plan is the responsibility of the Gauteng
Department of Agriculture and Rural Development (GDARD).
As the Bioregional Plan was developed in parallel to similar bioregional plans in the Gauteng
Province, it is dependent on the same underlying systematic biodiversity plan, and, as there are
numerous issues requiring joint planning (e.g. shared catchments), it would be efficient to
establish an inter-agency structure for coordinating the implementation, monitoring, reviewing
and updating of the bioregional plans. Alternatively, these activities would need to be
undertaken independently by the Ekurhuleni Metro.
• The establishment of an appropriate inter-agency structure to coordinate the
implementation, monitoring, reviewing and updating of the bioregional plan.
• The ongoing evaluation of its use in land-use planning and decision-making.
• The review of, and if necessary revision of the underlying systematic biodiversity plan at least
every five years.
• The update of the published bioregional plan at least every five years.
5.1 Monitoring
To ensure compliance with the Biodiversity Act and the Guideline for Bioregional Plans, formal
monitoring of the implementation of the Bioregional Plan must be undertaken on at least a five-
yearly cycle to ensure appropriate revision of the Bioregional Plan. However, as the successful
implementation of the Bioregional Plan is dependent on a variety of measures, and requires the
cooperation of a number of different departments and agencies, it is recommended that a bi-
annual or annual monitoring and reporting program is established immediately on the gazetting
of the Bioregional Plan. It is recommended that a Gauteng Bioregional Plan Coordination
Committee (or an equivalent structure) is convened with representation of Ekurhuleni Metro and
other municipalities with bioregional plans in Gauteng, and the Gauteng Department of
Agriculture and Rural Development (GDARD). The task of the committee would be to ensure the
effective implementation of the bioregional plans, to undertake the ongoing monitoring of the
implementation of the plans, and to ensure the review and update the bioregional plans when
necessary. Gathering of data on the monitoring indicators should become a normal function of
the planning departments within each of the municipalities. The outcomes of the monitoring
programmes should be used as key indicators for the biodiversity and planning departments
within the Ekurhuleni Metro and other municipalities with bioregional plans in Gauteng and the
Gauteng Department of Agriculture and Rural Development (GDARD).
5.1.1 Monitoring indicators
• The primary purpose of the ongoing monitoring is to evaluate the ongoing
implementation of the Bioregional Plan, rather than to evaluate the biodiversity
outcomes of these actions or to describe the state of biodiversity within the Bioregion.
Therefore, the following implementation monitoring indicators are proposed:
• Percentage (and area) of Critical Biodiversity Areas and Ecological Support Areas that
are contained within conservation orientated zones with Spatial Development
Frameworks and Environmental Management Frameworks. For this purpose, conservation
37
Bioregional Plan for Ekurhuleni Metro – March 2014
orientated zones are defined as areas where the primary purpose is conservation or
where there are significant restrictions on allowable land-uses.
• Percentage (and area) of Critical Biodiversity Areas and Ecological Support Areas that
are under some form of conservation management (including both formal protection
and biodiversity stewardship agreements).
• Percentage (and area) of Critical Biodiversity Areas and Ecological Support Areas where
subdivision has been approved or where increased development rights have been
granted.
• Percentage (and area) of Critical Biodiversity Areas and Ecological Support Areas where
appropriate biodiversity management interventions have been applied (e.g. clearing of
invasive alien species).
• The advantage of these indicators is that they do not require investment into baseline
biodiversity data gathering, but rather focus on the evaluation of the implementation
mechanism. This should allow these indicators to be evaluated on at least an annual
basis. However, it will be necessary to evaluate the biodiversity outcome of the
implementation of the bioregional plan in order to conduct the required five-year review
of the bioregional plan. Additional biodiversity monitoring indicators should include at
least an evaluation of:
o Percentage (and area) of Critical Biodiversity Areas and Ecological Support Areas
that have been severely modified due to various land-use changes.
o Percentage (and area) of Critical Biodiversity Areas and Ecological Support Areas
that are in a natural or near-natural state (key aspects would be level of invasive
alien vegetation infestation, level of degradation due to overgrazing or dumping
etc).
o Percentage (and area) of Critical Biodiversity Areas and Ecological Support Areas
that have been rehabilitated to a satisfactory ecological condition.
5.2 Review
The bioregional plan must be reviewed and updated (where necessary) at least every five
years. It is recommended that this is a function of the proposed Bioregional Plan Coordination
Committee (or an equivalent structure) which should include representatives of the Ekurhuleni
Metro and the other municipalities with bioregional plans in Gauteng, the Gauteng Department
of Agriculture and Rural Development (GDARD). The review process should examine:
• Progress towards the full implementation of the bioregional plan (as measured by the
implementation monitoring indicators from Section 5.1.1).
• The biodiversity outcome of the implementation actions (as measured by the biodiversity
monitoring indicators from Section 5.1.1).
• The need (or lack thereof) for an update of the underlying systematic biodiversity plan.
Although the update of a systematic biodiversity plan is a data intensive and time
consuming process, it is likely that it will be necessary to update underlying systematic
biodiversity plan for the province at least every five years.
• The need (or lack thereof) for an update of the other components of the bioregional plan
(e.g. land-use guidelines; monitoring indicators and processes).
5.3 Updating
Should the bioregional plan review process (5.2) indicate that it is necessary to update the
bioregional plan or components of the plan, then this should be undertaken, and the revised
plan should be resubmitted to the MEC for approval. Ideally this should be timed to precede the
revision cycle for municipal SDFs. Responsibility for the update lies with the Ekurhuleni Metro
which is the developer and primary implementing agent of the bioregional plan. Importantly,
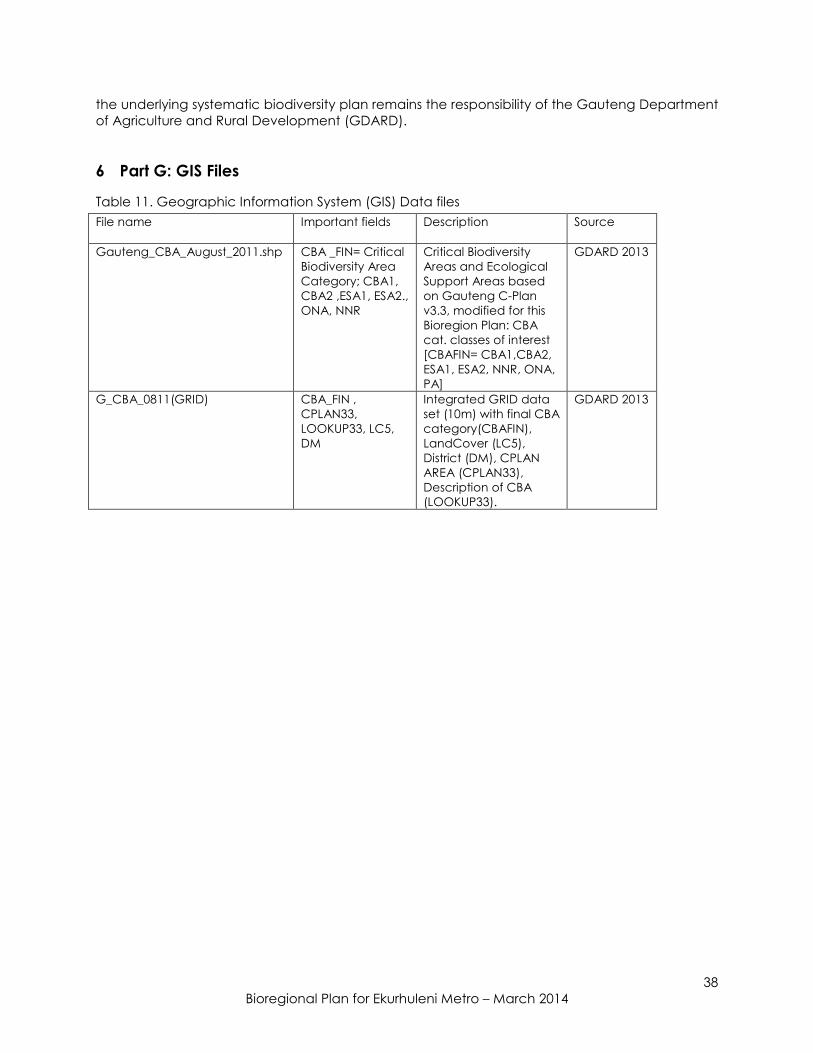
38
Bioregional Plan for Ekurhuleni Metro – March 2014
the underlying systematic biodiversity plan remains the responsibility of the Gauteng Department
of Agriculture and Rural Development (GDARD).
6 Part G: GIS Files
Table 11. Geographic Information System (GIS) Data files
File name
Important fields
Description Source
Gauteng_CBA_August_2011.shp CBA _FIN= Critical
Biodiversity Area
Category; CBA1,
CBA2 ,ESA1, ESA2.,
ONA, NNR
Critical Biodiversity
Areas and Ecological
Support Areas based
on Gauteng C-Plan
v3.3, modified for this
Bioregion Plan: CBA
cat. classes of interest
[CBAFIN= CBA1,CBA2,
ESA1, ESA2, NNR, ONA,
PA]
GDARD 2013
G_CBA_0811(GRID) CBA_FIN ,
CPLAN33,
LOOKUP33, LC5,
DM
Integrated GRID data
set (10m) with final CBA
category(CBAFIN),
LandCover (LC5),
District (DM), CPLAN
AREA (CPLAN33),
Description of CBA
(LOOKUP33).
GDARD 2013

39
Bioregional Plan for Ekurhuleni Metro – March 2014
7 References
Driver A., Sink, K.J., Nel, J.N., Holness, S., Van Niekerk, L., Daniels, F., Jonas, Z., Majiedt, P.A., Harris,
L. & Maze, K. (2012). National Biodiversity Assessment 2011: An assessment of South
Africa’s biodiversity and ecosystems. Synthesis Report. South African National Biodiversity
Institute and Department of Environmental Affairs, Pretoria
DEAT (2009). Guideline Regarding the Determination of Bioregions and the Preparation and
Publication of Bioregional Plans (Government Gazette No.32006, 16 March 2009)
Department of Environmental Affairs (2011). National list of ecosystems that are threatened and
in need of protection. Government Gazette No. 34809, Notice No. 1002, 9 December
2011.
GDARD (2013). Technical Report: Gauteng Conservation Plan version 3.3 ( 2011). Compiled by P.
Compaan. Gauteng Department of Agriculture and Rural Development: Nature
Conservation Directorate.
Government of South Africa (2010). National Protected Area Expansion Strategy 2008: Priorities
for expanding the protected area network for ecological sustainability and climate
change adaptation. Department of Environmental Affairs, Pretoria.
Ekurhuleni Metropolitan Municipality (2009). Ekurhuleni Biodiversity and Open Space Strategy
(EBOSS) Report.
Ekurhuleni Metropolitan Municipality (Unknown). Ekurhuleni wetland dataset.
Ekurhuleni Metropolitan Municipality and Gauteng Department of Agriculture, Conservation and
Environment (2007). Environmental Management Framework for Ekurhuleni.
Geo Terra Image (2009). Gauteng Land Cover Dataset. Version5 October 2009.
Mucina L. & Rutherford, M.C. (eds) (2006). The Vegetation of South Africa, Lesotho and
Swaziland. Strelitzia 19. South African National Biodiversity Institute, Pretoria.
Nel, J.L., Reyers, B., Van Deventer, H., Smith-Adao, L. (2007). Protected Area Expansion Strategy:
Spatial assessment of river priorities. Final Report. CSIR Report number
CSIR/NRE/ECO/2007/0134/C.
Nel J.L., Driver A., Strydom W., Maherry A., Petersen C., Roux D.J., Nienaber S., van Deventer H,
Smith-Adao LB and Hill L. (2011). Atlas of Freshwater Ecosystem Priority Areas in South
Africa: Maps to support sustainable development of water resources. WRC Report No. TT
500/11, Water Research Commission, Pretoria.
Nel, J.L. & Driver, A. (2012). National Biodiversity Assessment 2011: Technical Report. Volume 2:
Freshwater Component. CSIR Report Number CSIR/NRE/ECO/IR/2012/0022/A. Council for
Scientific and Industrial Research, Stellenbosch.
PRECIS (National Herbarium Pretoria (PRE) Computerised Information System), National
Herbarium in Pretoria, Data extracted May 2010.

40
Bioregional Plan for Ekurhuleni Metro – March 2014
Stewart, W. and B. Reeves (2010). Nelson Mandela Bay Municipality Draft Bioregional Plan.
NMBM Public Health Directorate, Environmental management Sub-Directorate. SRK
Report 400919/2.
Vromans, D.C., Maree, K.S., Holness, S.D., Job, N. and Brown, A.E. (2010). The Garden Route
Biodiversity Sector Plan for the George, Knysna and Bitou Municipalities. Supporting land-
use planning and decision-making in Critical Biodiversity Areas and Ecological Support
Areas for sustainable development. Garden Route Initiative. South African National Parks.
Knysna.
Vromans, D.C., Maree, K.S., Holness, S. D., Job, N. and Brown, A.E. (2010). The Garden Route
Biodiversity Sector Plan for the southern regions of the Kouga and Koukamma
Municipalities. Supporting land-use planning and decision-making in Critical Biodiversity
Areas and Ecological Support Areas for sustainable development. Garden Route
Initiative. South African National Parks, Knysna.
41
Bioregional Plan for Ekurhuleni Metro – March 2014
8 Glossary
Biodiversity: The diversity of genes, species and ecosystems on Earth, and the ecological and
evolutionary processes that maintain this diversity.
Biodiversity stewardship: a model for expanding the protected area network in which
conservation authorities enter into contract agreements with private and communal landowners
to place land that is of high biodiversity value under formal protection. Different categories of
agreement confer varying degrees of protection on the land and hold different benefits for
landowners. The landowner retains title to the land, and the primary responsibility for
management remains with the landowner, with technical advice and assistance provided by
the conservation authority.
Biodiversity target: The minimum proportion of each ecosystem type that needs to be kept in a
natural or near-natural state in the long term in order to maintain viable representative samples
of all ecosystem types and the majority of species associated with those ecosystem types.
Biome: An ecological unit of wide extent, characterised by complexes of plant communities
and associated animal communities and ecosystems, and determined mainly by climatic
factors and soil types. A biome may extend over large, more or less continuous expanses or land
surface, or may exist in small discontinuous patches.
Bioregional plan (published in terms of the Biodiversity Act): A map of Critical Biodiversity Areas
and Ecological Support Areas, for a municipality or group of municipalities, accompanied by
contextual information, land- and resource-use guidelines and supporting GIS data. The map
must be produced using the principles and methods of systematic biodiversity planning, in
accordance with the Guideline for Bioregional Plans.6 A bioregional plan represents the
biodiversity sector’s input into planning and decision-making in a range of other sectors. The
development of the plan is usually led by the relevant provincial conservation authority or
provincial environmental affairs department. A bioregional plan that has not yet been published
in the Government Gazette in terms of the Biodiversity Act is referred to as a biodiversity sector
plan.
Conservation area: Areas of land not formally protected by law but informally protected by the
current owners and users and managed at least partly for biodiversity conservation. Because
there is no long-term security associated with conservation areas, they are not considered a
strong form of protection. Also see Protected area.
Critical Biodiversity Area: Areas required to meet biodiversity targets for ecosystems, species or
ecological processes, as identified in a systematic biodiversity plan. May be terrestrial or aquatic.
Critically endangered ecosystem: an ecosystem type that has very little of its original extent
(measured as area, length or volume) left in natural or near-natural condition. Most of the
ecosystem type has been severely or moderately modified from its natural state. The ecosystem
6 Department of Environmental Affairs and Tourism. 2009. Guideline regarding the determination
of bioregions and the preparation and publication of bioregional plans. Notice No. 291,
Government Gazette No. 32006, 16 March 2009.
42
Bioregional Plan for Ekurhuleni Metro – March 2014
type is likely to have lost much of its natural structure and functioning, and species associated
with the ecosystem may have been lost.
Ecological Support Area: An area that is not essential for meeting biodiversity targets but plays
an important role in supporting the ecological functioning of one or more Critical Biodiversity
Areas or in delivering ecosystem services. May be terrestrial or aquatic.
Ecosystem protection level: Indicator of the extent to which ecosystems are adequately
protected or under-protected. Ecosystem types are categorised as well protected, moderately
protected, poorly protected, or not protected, based on the proportion of the biodiversity
target for each ecosystem type that is included within one or more protected areas.
Unprotected, poorly protected or moderately protected ecosystem types are collectively
referred to as under-protected ecosystems.
Ecosystem services: the benefits that people obtain from ecosystems, including provisioning
services (such as food and water), regulating services (such as flood control), cultural services
(such as recreational benefits), and supporting services (such as nutrient cycling, carbon
storage) that maintain the conditions for life on Earth. Ecosystem services are the flows of value
to human society that result from a healthy stock of ecological infrastructure. If ecological
infrastructure is degraded or lost, the flow of ecosystem services will diminish.
Ecosystem threat status: Indicator of how threatened ecosystems are, in other words the degree
to which ecosystems are still intact or alternatively losing vital aspects of their structure, function
or composition. Ecosystem types are categorised as critically endangered, endangered,
vulnerable or least threatened, based on the proportion of the original extent of each
ecosystem type that remains in good ecological condition relative to a series of biodiversity
thresholds. Critically endangered, endangered and vulnerable ecosystems are collectively
referred to threatened ecosystems, and may be listed as such in terms of the Biodiversity Act.
Ecosystem type: An ecosystem unit that has been identified and delineated as part of a
hierarchical classification system, based on biotic and/or abiotic factors. Factors used to map
and classify ecosystems differ in different environments. Ecosystem types can be defined as, for
example, vegetation types, river ecosystem types, wetland ecosystem types, estuary ecosystem
types, or marine or coastal habitat types. Ecosystems of the same type are likely to share broadly
similar ecological characteristics and functioning. Also see National ecosystem classification
system.
Endangered ecosystem: An ecosystem type that is close to becoming critically endangered.
Freshwater Ecosystem Priority Area: A river or wetland that is required to meet biodiversity targets
for freshwater ecosystems.
Least threatened ecosystem: An ecosystem type that has experienced little or no loss of natural
habitat or deterioration in condition
Protected area: An area of land or sea that is formally protected by law and managed mainly
for biodiversity conservation. This is a narrower definition than the IUCN definition, which includes
43
Bioregional Plan for Ekurhuleni Metro – March 2014
areas that are not legally protected and that would be defined in South Africa as conservation
areas rather than protected areas. Also see Conservation area.
Species of special concern: Species that have particular ecological, economic or cultural
significance, including but not limited to threatened species
Systematic biodiversity planning: A scientific method for identifying geographic areas of
biodiversity importance. It involves: mapping biodiversity features (such as ecosystems, species,
spatial components of ecological processes); mapping a range of information related to these
biodiversity features and their ecological condition; setting quantitative targets for biodiversity
features; analysing the information using software linked to GIS; and developing maps that show
spatial biodiversity priorities. The configuration of priority areas is designed to be spatially efficient
(i.e. to meet biodiversity targets in the smallest area possible) and to avoid conflict with other
land and water resource uses where possible.
Threatened ecosystem: An ecosystem that has been classified as critically endangered,
endangered or vulnerable, based on an analysis of ecosystem threat status. A threatened
ecosystem has lost or is losing vital aspects of its structure, function or composition. The
Biodiversity Act allows the Minister of Environmental Affairs or a provincial MEC for Environmental
Affairs to publish a list of threatened ecosystems. To date, threatened ecosystems have been
listed only in the terrestrial environment. In cases where no list has yet been published by the
Minister, such as for all aquatic ecosystems, the ecosystem threat status assessment in the NBA
can be used as an interim list in planning and decision-making. Also see Ecosystem threat status.
Threatened species: A species that has been classified as Critically Endangered, Endangered or
Vulnerable, based on a conservation assessment (Red List), using a standard set of criteria
developed by the IUCN for determining the likelihood of a species becoming extinct. A
threatened species faces a high risk of extinction in the near future.
Vulnerable ecosystem: An ecosystem type that still has the majority of its original extent
(measured as area, length or volume) left in natural or near-natural condition, but has
experienced some loss of habitat or deterioration in condition. The ecosystem type is likely to
have lost some of its structure and functioning, and will be further compromised if it continues to
lose natural habitat or deteriorate in condition.