Embed Size (px)
Citation preview
BIOPLASTICSfacts and fi guresBIOPLASTICSfacts and fi gures
BIOPL A S TICS AND THE EU’S BIOECONOMY
* Source: European Bioplastics 2012; EC-Communication “Innovating for Sustainable Growth: A Bioeconomy for Europe” 13.02.2012
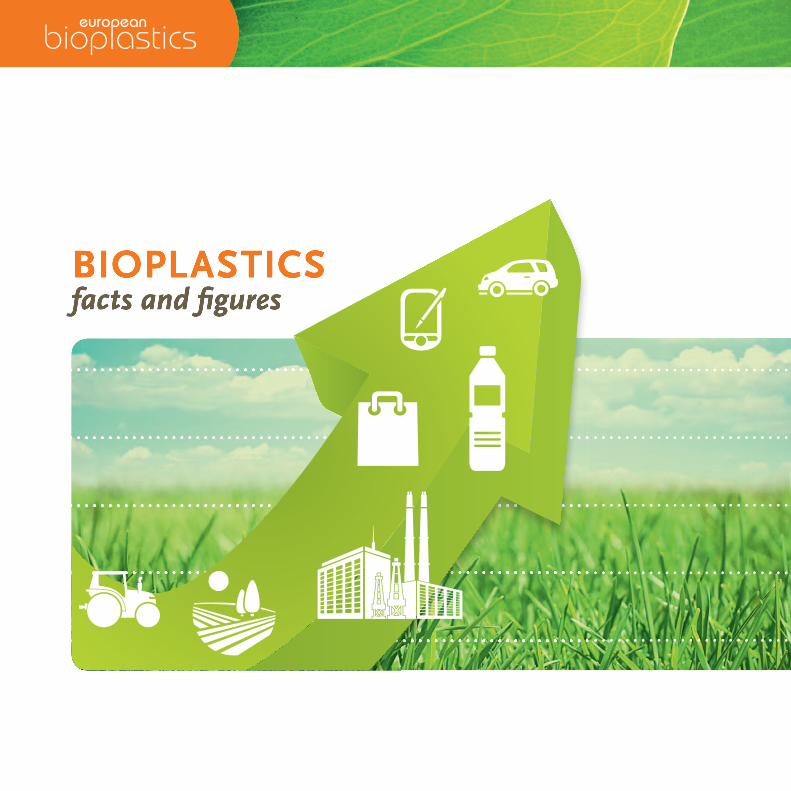
Today, the European bioeconomy sectors are worth 2 TRILLION EUROS in annual turnover and account for 22 MILLION JOBS in the EU. That is
9 % of the EU’s workforce.*approx.
BIOPLASTICS are (partly or fully) biobased, biodegradable, or both. The global bioplastics production capacity is set to grow 300 % by 2018.
BIOPLASTICS have been designated a LEAD MARKET by the
European Commission. The bioplastic market’s immense
growth will help drive the further evolution of
a bioeconomy in Europe.
Biodegradable Biobased/non-biodegradable Total capacityForecast
0
2,000
3,000
2012 2013 2014 2015
in m
etric
kTo
n
1,000
4,000
5,000
6,000
1,011
571
1,492
921
2016 2017 2018
7,000
610
1,6221,622 1,6701,6701,936 2,039
3,6133,613
6,7316,731
1,1771,1771,1771,1771,1771,1771,0281,0281,0281,0281,0281,0281,028
643643643643643 759759759759759 862862862862862
1,1771,1771,1771,1771,1771,177
1,0601,0601,0601,0601,0601,060
2,5532,5532,5532,5532,5532,5532,553
1,1261,1261,1261,1261,1261,126
5,6055,6055,6055,6055,6055,6055,605
Biodegradable Biobased/non-biodegradable Total capacityForecast
0
2,000
3,000
2012 2013 2014 2015
in m
etric
kTo
n
Global production capacities of bioplastics
1,000
4,000
5,000
Source: European Bioplastics, Institute for Bioplastics and Biocomposites, nova-Institute (2014)More information: www.bio-based.eu/markets and www.downloads.ifbb-hannover.de
6,000
1,011
571
1,492
921
2016 2017 2018
7,000
610
1,622 1,6701,936 2,039
3,613
6,731
1,1771,028
643 759 862
1,177
1,060
2,553
1,126
5,605
Global production capacities of bioplastics
POLICY SUPPORT DECIS IVE FOR MARKET SUCCESS
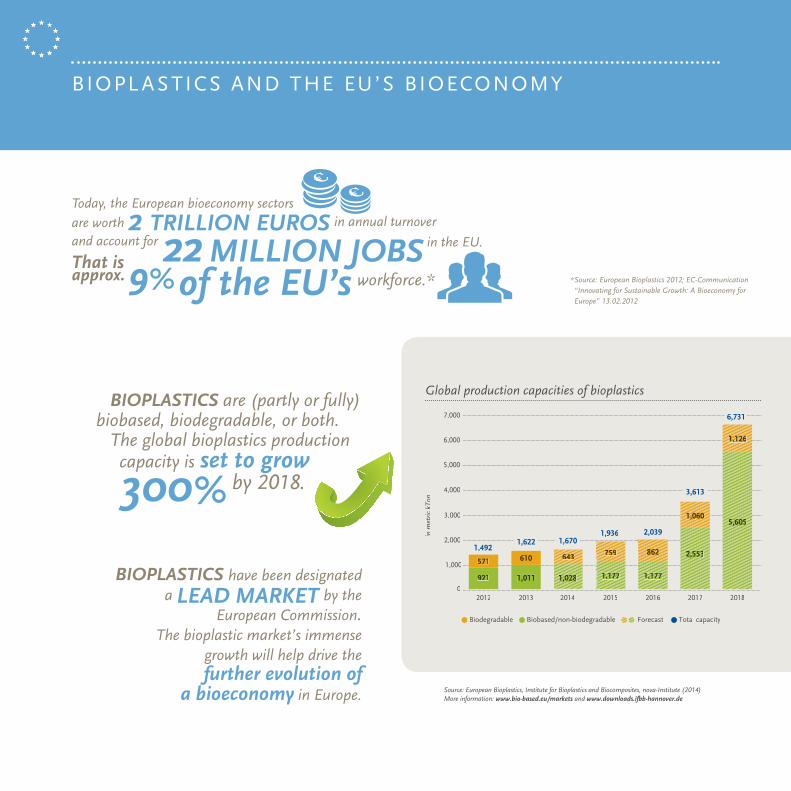
BIOPLASTIC production capacities are growing fastest outside of Europe. In order to attract investments and to secure its place amongst the top-players in the bioplastics market, the EU needs to implement favorable framework conditions.
0.6
18.4
51.4
12.3
17.3
a/Oceania
in %
Biodegradable Biobased/non-biodegradable Total capacityForecast
0
2,000
3,000
2012 2013 2014 2015
in m
etric
kTo
n
Global production capacities of bioplastics
1,000
4,000
5,000
Source: European Bioplastics, Institute for Bioplastics and Biocomposites, nova-Institute (2014)More information: www.bio-based.eu/markets and www.downloads.ifbb-hannover.de
6,000
1,011
571
1,492
921
2016 2017 2018
7,000
610
1,622 1,6701,936 2,039
3,613
6,731
1,1771,028
643 759 862
1,177
1,060
2,553
1,126
5,605
Global production capacities of bioplastics in 2013 (by region) Global production capacities of bioplastics in 2018 (by region)
North America
Europe
Australia/Oceania
Asia
South America
Total: 1.62 million tonnes
0.1
4.3
75.8
12.2
7.6
a/Oceania
in %
Total: 6.73 million tonnes
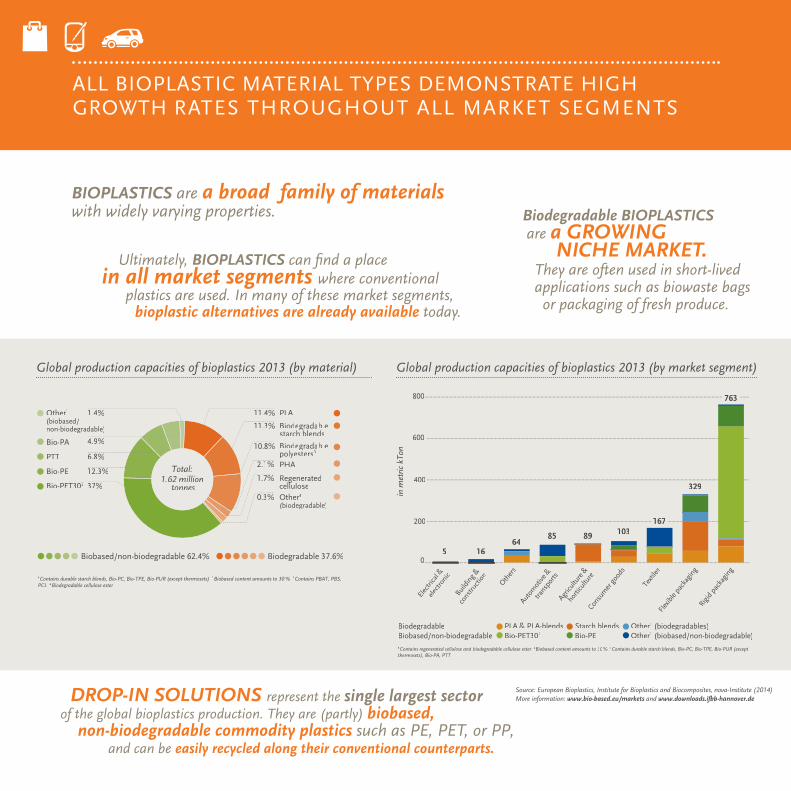
BIOPLASTICS are a broad family of materials with widely varying properties.
Ultimately, BIOPLASTICS can fi nd a place in all market segments where conventional plastics are used. In many of these market segments, bioplastic alternatives are already available today.
ALL BIOPLASTIC MATERIAL TYPES DEMONSTRATE HIGH GROWTH RATES THROUGHOUT ALL MARKET SEGMENTS
0
200
Elec
trica
l &
electr
onic
in m
etric
kTo
n
400
5 1664
1038985
329
Build
ing
&
cons
tructi
on
Consu
mer
goo
ds
Autom
otive
&
trans
ports
Oth
ers
Agricu
lture
&
horti
cultu
re
Texti
lesFl
exib
le pa
ckag
ing
Rigi
d pa
ckag
ing
Biodegradable PLA & PLA-blends Starch blends Other1 (biodegradables)Biobased/non-biodegradable Bio-PEBio-PET302 Other3 (biobased/non-biodegradable)
600
800
167
763
¹Contains regenerated cellulose and biodegradable cellulose ester 2Biobased content amounts to 30% 3Contains durable starch blends, Bio-PC, Bio-TPE, Bio-PUR (except thermosets), Bio-PA, PTT
DROP-IN SOLUTIONS represent the single largest sector of the global bioplastics production. They are (partly) biobased, non-biodegradable commodity plastics such as PE, PET, or PP, and can be easily recycled along their conventional counterparts.
PLA
Biodegradablepolyesters3
grada3
grada
Biodegradablestarch blends
gradastarch blends
grada
PHA
RegeneratedcelluloseRegeneratedcelluloseRegenerated
11.4%
11.3%
10.8%
2.1%
1.7%Bio-PET302 37%
Bio-PE 12.3%
Bio-PA 4.9%
Other1
(biobased/non-biodegradable)
1.4%
Other4
(biodegradable)0.3%
Biobased/non-biodegradable 62.4% Biodegradable 37.6%
¹Contains durable starch blends, Bio-PC, Bio-TPE, Bio-PUR (except thermosets) 2Biobased content amounts to 30 % 3Contains PBAT, PBS, PCL 4Biodegradable cellulose ester
PTT 6.8%
Total: 1.62 million
tonnes
Biodegradable BIOPLASTICS are a GROWING NICHE MARKET. They are often used in short-lived applications such as biowaste bags or packaging of fresh produce.
Biodegradable Biobased/non-biodegradable Total capacityForecast
0
2,000
3,000
2012 2013 2014 2015
in m
etric
kTo
n
Global production capacities of bioplastics
1,000
4,000
5,000
Source: European Bioplastics, Institute for Bioplastics and Biocomposites, nova-Institute (2014)More information: www.bio-based.eu/markets and www.downloads.ifbb-hannover.de
6,000
1,011
571
1,492
921
2016 2017 2018
7,000
610
1,622 1,6701,936 2,039
3,613
6,731
1,1771,028
643 759 862
1,177
1,060
2,553
1,126
5,605
Global production capacities of bioplastics 2013 (by material) Global production capacities of bioplastics 2013 (by market segment)
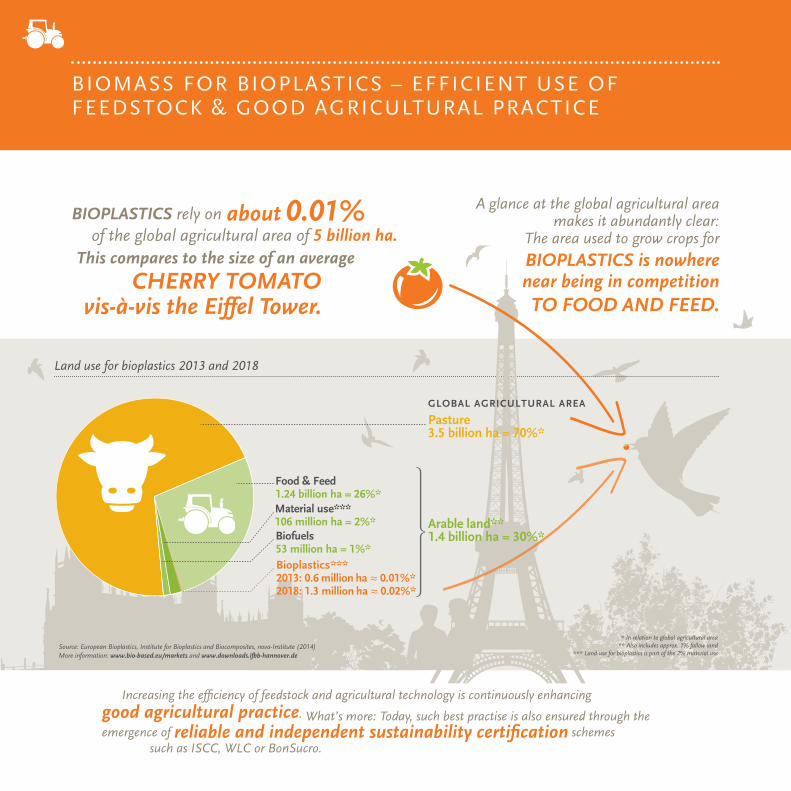
Land use for bioplastics 2013 and 2018
BIOMASS FOR BIOPLASTICS – EFFICIENT USE OF FEEDSTOCK & GOOD AGRICULTURAL PRACTICE
BIOPLASTICS rely on about 0.01% of the global agricultural area of 5 billion ha. This compares to the size of an average
CHERRY TOMATO vis-à-vis the Eiffel Tower.
Increasing the effi ciency of feedstock and agricultural technology is continuously enhancing good agricultural practice. What’s more: Today, such best practise is also ensured through the emergence of reliable and independent sustainability certifi cation schemes such as ISCC, WLC or BonSucro.
A glance at the global agricultural area makes it abundantly clear:
The area used to grow crops for
BIOPLASTICS is nowherenear being in competition TO FOOD AND FEED.
Pasture3.5 billion ha = 70%*
Arable land**1.4 billion ha = 30%* Biofuels
53 million ha = 1%*
Material use*** 106 million ha = 2%*
Bioplastics***2013: 0.6 million ha ≈ 0.01%* 2018: 1.3 million ha ≈ 0.02%*
GLOBAL AGRICULTURAL AREA
Food & Feed1.24 billion ha = 26%*
Land use for bioplastics 2013 and 2018
* In relation to global agricultural area** Also includes approx. 1% fallow land
*** Land-use for bioplastics is part of the 2% material use
Source: European Bioplastics, Institute for Bioplastics and Biocomposites, nova-Institute (2014)More information: www.bio-based.eu/markets and www.downloads.ifbb-hannover.de
Biodegradable Biobased/non-biodegradable Total capacityForecast
0
2,000
3,000
2012 2013 2014 2015
in m
etric
kTo
n
Global production capacities of bioplastics
1,000
4,000
5,000
Source: European Bioplastics, Institute for Bioplastics and Biocomposites, nova-Institute (2014)More information: www.bio-based.eu/markets and www.downloads.ifbb-hannover.de
6,000
1,011
571
1,492
921
2016 2017 2018
7,000
610
1,622 1,6701,936 2,039
3,613
6,731
1,1771,028
643 759 862
1,177
1,060
2,553
1,126
5,605
Pasture3.5 billion ha = 70%*
Arable land**1.4 billion ha = 30%* Biofuels
53 million ha = 1%*
Material use*** 106 million ha = 2%*
Bioplastics***2013: 0.6 million ha ≈ 0.01%* 2018: 1.3 million ha ≈ 0.02%*
GLOBAL AGRICULTURAL AREA
Food & Feed1.24 billion ha = 26%*
Land use for bioplastics 2013 and 2018
* In relation to global agricultural area** Also includes approx. 1% fallow land
*** Land-use for bioplastics is part of the 2% material use
Source: European Bioplastics, Institute for Bioplastics and Biocomposites, nova-Institute (2014)More information: www.bio-based.eu/markets and www.downloads.ifbb-hannover.de

For more information please visit our website: www.european-bioplastics.org
Or follow us on twitter: twitter.com/EUBioplastics
Or subscribe to our channel on youtube: youtube.com/EuropeanBioplastics
CONTAC T
Phone: +49 30 28 48 23 50Email: [email protected]: [email protected]
European BioplasticsMarienstraße 19-2010117 Berlin
You want to learn more about the advantages and applications of bioplastics?