Embed Size (px)
Citation preview
Picture credits: left: biomass power plant in Dangjin, South Korea, with kind permission of Sumitomo SHI FW; upper right: biomass power plant in Faridkot, India, with kind permission of Babcock & Wilcox Vølund A/S, lower right: biomass power plant in Połaniec, Poland, by courtesy of Sumitomo SHI FW.
Biomass to Power
The World Market for Biomass Power Plants 2020/2021
11th edition, 2020 Extract

ecoprog
ecoprog GmbH
Biomass to Power 2020/2021
The standard reference for the global Biomass to Power industry. The 11th edition provides
up-to-date information on:
• more than 4,400 units in almost 4,200 biomass power plants worldwide, including details on
age, feedstock, capacities and competition
• more than 1,000 projects, including developer, status, fuel type and commissioning date
• market development forecast 2020-2029, by country, including new constructions,
shutdowns and investment volumes based on 770 cost examples
• subsidisation schemes (feed-in tariffs, quota systems and auctions), by country, for the
world’s most important markets
• market factors, fuels, treatment technologies, investment and operational costs and
revenues with an exemplary calculation
• important operators and technology providers and their market shares
• In addition to the report, you will receive access to w&b Data (Biomass to Power
module) for one year. The database provides detailed information on all plants and
projects, related to, for instance, capacity, status, start of operation, technology, feedstock,
plant manufacturer and operator. Current projects are described within the scope of a
project tracker. All these data are updated on a weekly basis. Please find a trial version of
w&b Data here.
• Additionally, these detailed data can be purchased as MS Excel file.
The study is available in English language starting from 4,400.- € plus VAT. Subscribers of
ecoprog’s w&b Monitor will receive a discount starting from 600.- €. Further price reductions are
possible with a regular subscription to the study. Please find detailed price and product
information at the end of this extract.
Contact
Richard Mertens
ecoprog GmbH
+49 221 788 03 88 13

Biomass to Power 2020/2021
© ecoprog GmbH, www.ecoprog.com
ecoprog
Contents
Preface ......................................................................................................................................... 17
Management summary ................................................................................................................ 19
1 Highlights 2020 ................................................................................................................... 23
2 Plant portfolio ..................................................................................................................... 25
2.1 Global plant asset 25 2.2 Europe 30 2.3 Asia 34 2.4 South & Central America 37 2.5 North America 40 2.6 Australia & Pacific 43 2.7 Africa & Near East 46
3 Market forecast by 2029 ..................................................................................................... 49
3.1 Global outlook 49 3.2 Europe 54 3.3 Asia 57 3.4 South & Central America 60 3.5 North America 62 3.6 Australia & Pacific 64 3.7 Africa & Near East 65
4 Competition ......................................................................................................................... 67
4.1 Operator segment 67 4.2 Technology provider segment 70
5 Subsidisation of biomass power ....................................................................................... 75
6 National markets ................................................................................................................. 79
6.1 Africa and Near East South Africa 79 Rest of Africa and Near East 84
6.2 Asia China 88 India 114 Indonesia 136 Japan 142 Malaysia 155 Philippines 162 South Korea 171 Taiwan 178 Thailand 182 Vietnam 192 Rest of Asia 199
6.3 Australia and Pacific Australia 204 Rest of Australia and Pacific 211
6.4 Europe Austria 213 Belgium 223
Bulgaria 233 Croatia 237 Czech Republic 244 Denmark 251 Estonia 258 Finland 263 France 275 Germany 288 Hungary 305 Ireland 310 Italy 315 Latvia 328 Lithuania 333 Netherlands 338 Norway 350 Poland 355 Portugal 364 Romania 370 Russia 375 Serbia 381 Slovakia 386

Biomass to Power 2020/2021
© ecoprog GmbH, www.ecoprog.com
ecoprog
Slovenia 391 Spain 396 Sweden 406 Switzerland 417 Turkey 424 Ukraine 430 United Kingdom 436 Rest of Europe 451
6.5 North America Canada 455
USA 465 Rest of North America 481
6.6 South and Central America Argentina 482 Brazil 488 Chile 512 Mexico 519 Uruguay 525 Rest of South and Central America 530
Part 2: Background ................................................................................................................... 535
7 Differentiation ................................................................................................................... 537
7.1 Type, character and minimum size of the plants 537 7.2 Biomass in the energy business 538 7.3 Fuels 539 7.4 Regional breakdown 542
8 Technology ....................................................................................................................... 545
8.1 Delivery and processing of the fuel 545 8.2 Combustion 547 8.3 Energy generation 551 8.4 Flue gas cleaning 552
9 Costs and revenues of biomass power plants ............................................................... 555
9.1 Investment costs 555 9.2 Current costs 560 9.3 Revenues 562
10 Framework/market factors ............................................................................................... 565
10.1 Economic viability and biomass potential 565 10.2 Subsidisation of electricity generation from biomass 569 10.3 Renewable energy policies in the EU 571 10.4 Extra charges on competing technologies 575 10.5 Other types of political support 576 10.6 Ecological criticism of electricity generation from biomass 577
Data origin and methodology ................................................................................................... 579
Glossary ..................................................................................................................................... 583
Annex A List of known projects ............................................................................................... 585
Annex B: Forecast data ............................................................................................................ 587
Extract, Chapter 6, National markets, Argentina
Biomass to Power 2020/2021 482
© ecoprog GmbH, www.ecoprog.com
ecoprog
Argentina
Update: 09-2020
Key figures
Inhabitants 2020 [UN est. in million] 44.78 Number of BMPPs 30
Goal: biomass generation 2025 (2030) [GWh] n/a Installed electrical capacity [MWel] 310
Electricity from biomass 2018 [GWh] 2,095 Share of total electricity generation 2018 [%] 1.44
Forecast 2020-2029
Total invest market [mn EUR] 736
Forecast 2020-2029
Capacity of new commissionings [MWel] 150
Management summary
The RenovAr auction scheme has led to a considerable project pipeline, with most of the projects starting
operations in the next years. However, under the government elected in October 2019, no new auctions
were awarded. Due to the weak economic situation, a market forecast is connected with great uncertainty.
Because of the country’s existing biomass potential in the forestry and the agricultural sector, we have
included a limited number of projects at favourable locations in our forecast after the impact of the auctions
phased out.
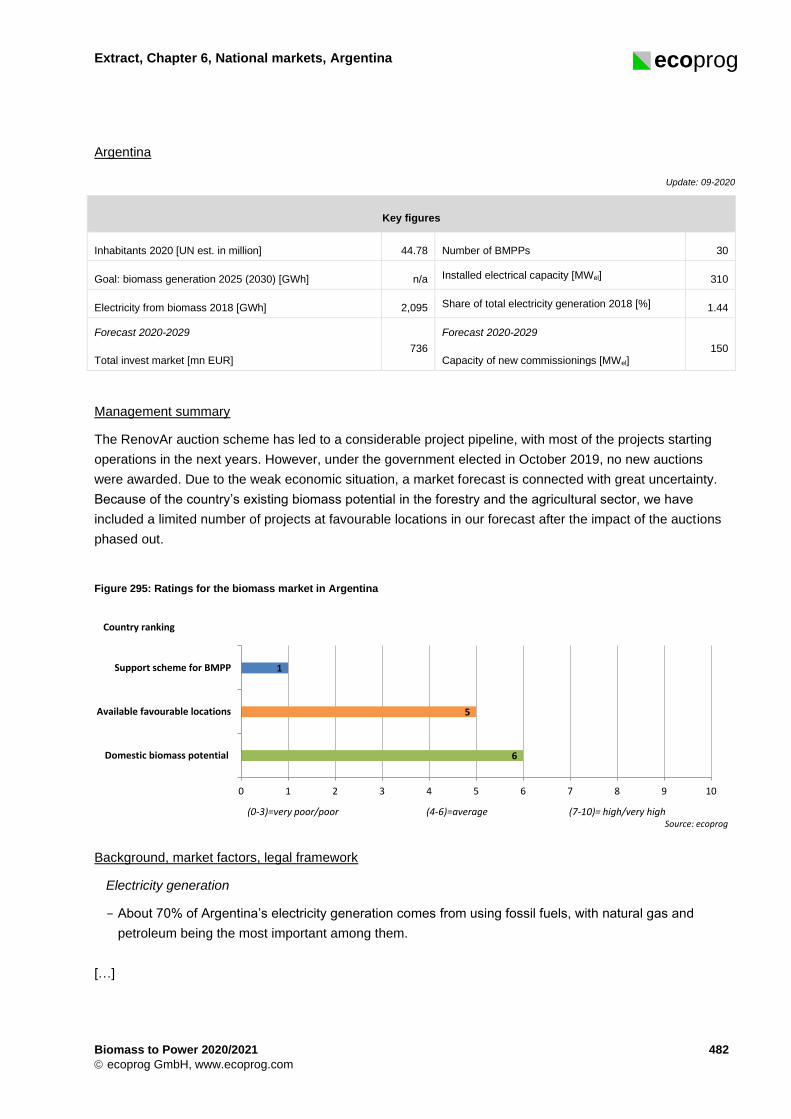
Figure 295: Ratings for the biomass market in Argentina
Background, market factors, legal framework
Electricity generation
- About 70% of Argentina’s electricity generation comes from using fossil fuels, with natural gas and
petroleum being the most important among them.
[…]
6
5
1
0 1 2 3 4 5 6 7 8 9 10
Domestic biomass potential
Available favourable locations
Support scheme for BMPP
Source: ecoprog
Country ranking
(0-3)=very poor/poor (4-6)=average (7-10)= high/very high
Extract, Chapter 6, National markets, Sweden
Biomass to Power 2020/2021 407
© ecoprog GmbH, www.ecoprog.com
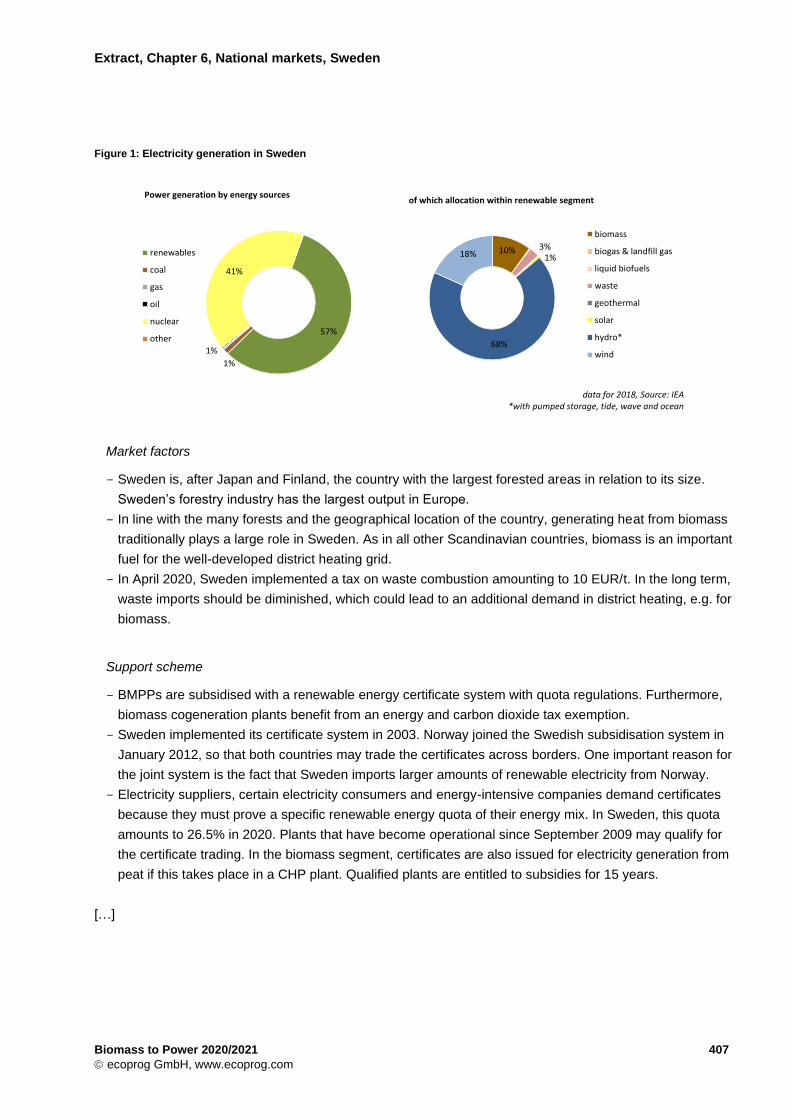
Figure 1: Electricity generation in Sweden
Market factors
- Sweden is, after Japan and Finland, the country with the largest forested areas in relation to its size.
Sweden’s forestry industry has the largest output in Europe.
- In line with the many forests and the geographical location of the country, generating heat from biomass
traditionally plays a large role in Sweden. As in all other Scandinavian countries, biomass is an important
fuel for the well-developed district heating grid.
- In April 2020, Sweden implemented a tax on waste combustion amounting to 10 EUR/t. In the long term,
waste imports should be diminished, which could lead to an additional demand in district heating, e.g. for
biomass.
Support scheme
- BMPPs are subsidised with a renewable energy certificate system with quota regulations. Furthermore,
biomass cogeneration plants benefit from an energy and carbon dioxide tax exemption.
- Sweden implemented its certificate system in 2003. Norway joined the Swedish subsidisation system in
January 2012, so that both countries may trade the certificates across borders. One important reason for
the joint system is the fact that Sweden imports larger amounts of renewable electricity from Norway.
- Electricity suppliers, certain electricity consumers and energy-intensive companies demand certificates
because they must prove a specific renewable energy quota of their energy mix. In Sweden, this quota
amounts to 26.5% in 2020. Plants that have become operational since September 2009 may qualify for
the certificate trading. In the biomass segment, certificates are also issued for electricity generation from
peat if this takes place in a CHP plant. Qualified plants are entitled to subsidies for 15 years.
[…]
10% 3%1%
68%
18%
biomass
biogas & landfill gas
liquid biofuels
waste
geothermal
solar
hydro*
wind
of which allocation within renewable segment
data for 2018, Source: IEA*with pumped storage, tide, wave and ocean
57%
1%
1%
41%
renewables
coal
gas
oil
nuclear
other
Power generation by energy sources
Extract, Chapter 6, National markets, South Korea
Biomass to Power 2020/2021 441
© ecoprog GmbH, www.ecoprog.com
[…]
- Due to the rapid capacity growth especially of solar power, the REC market price amounted to an
average of only 43,854 KRW/REC (32.90 EUR/REC, exchange rate November 2020) between January
and October 2020, compared to an average of 63,784 KRW/REC in 2019. The sale of the certificates on
the market is a surplus payment on the electricity market price.
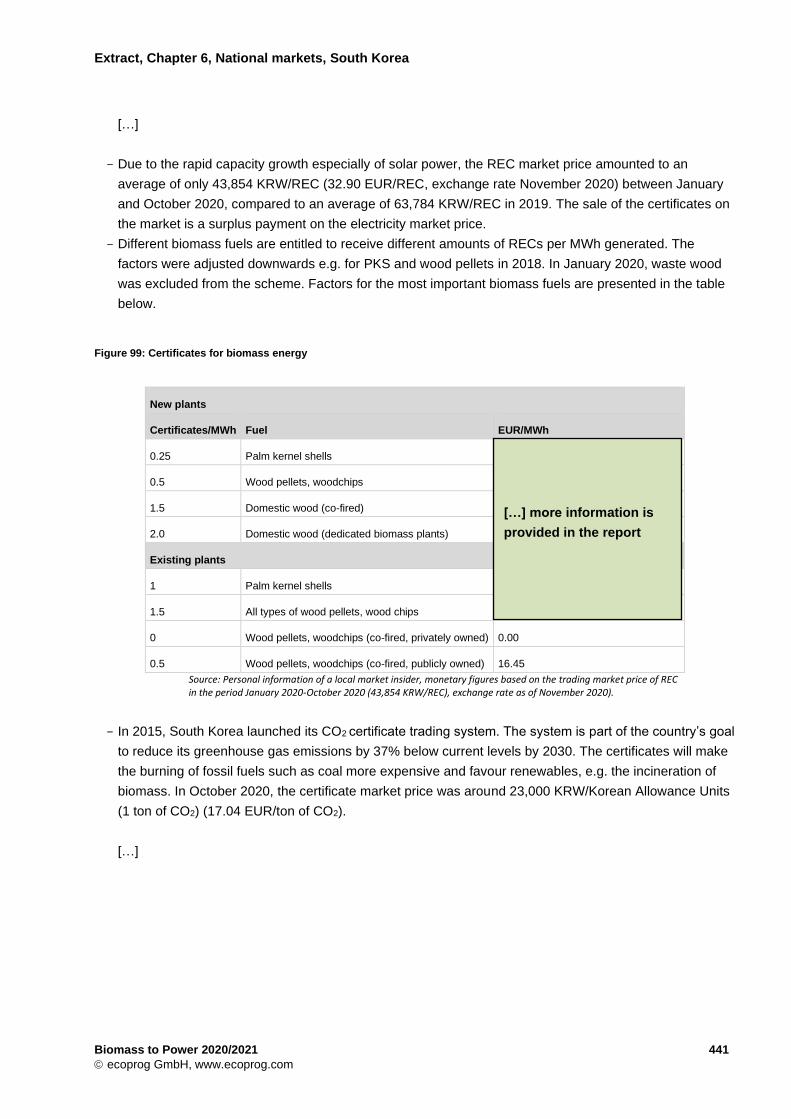
- Different biomass fuels are entitled to receive different amounts of RECs per MWh generated. The
factors were adjusted downwards e.g. for PKS and wood pellets in 2018. In January 2020, waste wood
was excluded from the scheme. Factors for the most important biomass fuels are presented in the table
below.
Figure 99: Certificates for biomass energy
New plants
Certificates/MWh Fuel EUR/MWh
0.25 Palm kernel shells 8.23
0.5 Wood pellets, woodchips 16.45
1.5 Domestic wood (co-fired) 49.35
2.0 Domestic wood (dedicated biomass plants) 65.81
Existing plants
1 Palm kernel shells 32.90
1.5 All types of wood pellets, wood chips 49.35
0 Wood pellets, woodchips (co-fired, privately owned) 0.00
0.5 Wood pellets, woodchips (co-fired, publicly owned) 16.45
Source: Personal information of a local market insider, monetary figures based on the trading market price of REC in the period January 2020-October 2020 (43,854 KRW/REC), exchange rate as of November 2020).
- In 2015, South Korea launched its CO2 certificate trading system. The system is part of the country’s goal
to reduce its greenhouse gas emissions by 37% below current levels by 2030. The certificates will make
the burning of fossil fuels such as coal more expensive and favour renewables, e.g. the incineration of
biomass. In October 2020, the certificate market price was around 23,000 KRW/Korean Allowance Units
(1 ton of CO2) (17.04 EUR/ton of CO2).
[…]
[…] more information is
provided in the report

Extract, Chapter 6, National markets, United Kingdom
Biomass to Power 2020/2021 441
© ecoprog GmbH, www.ecoprog.com
[…]
Plant asset
- As of October 2020, we know of 105 operational biomass mono-incinerators with an electricity generation
capacity of approximately 4,500 MWel.
- […]
- The structure of the mono-incineration plants generally reflects the subsidisation policy. Eight facilities with
a capacity of about 180 MWel had been developed before the ROCs were introduced in 2002.
Figure 275: Commissioned biomass power plant units in the UK
- As the British incentive schemes do not explicitly subsidise small-scale plants, the facilities in the country
are quite large in a European comparison. They have an average size of around 16 MWel (large
conversion projects excluded). As waste heat recovery only played a minor role for many years, heat
recovery is low in the British plants. Some of them are power plants only.
- The UK has the largest mono-incinerator units in the world. British power and wood pellet producer Drax
converted 4 of its 6 units at its formerly coal-fired plant in Selby to biomass. They have a capacity of 645
MWel each and were commissioned between 2013 and 2018. Unit 2, 3 and 4 operate under the ROC
system (while unit 4 does not receive any ROCs through grandfathering) and unit 1 was awarded a so-
called investment contract in the transition phase of the CfD scheme, which follow the same principles as
the CfD scheme. The Lynemouth conversion was awarded such an investment contract as well.
[…]
0
200
400
600
800
1.000
1.200
1.400
0
2
4
6
8
10
12
14
16
2010 2011 2012 2013 2014 2015 2016 2017 2018 2019 2020
MWel
units
units commissoned MWel
Source: ecoprog 2020
[…] more information is
provided in the report
Extract, Chapter 6, National markets, Canada
Biomass to Power 2020/2021 461
© ecoprog GmbH, www.ecoprog.com
Market development
Projects
- Canada’s project pipeline consists of small, individual projects at industrial locations or of indigenous
communities.
- As of October 2020, we know of 12 projects. Four of the projects are of First Nations with smaller
capacities. The 6.6 MWel Meadow Lake and the Whitesand projects will also supply a sawmill or a pellet
plant, respectively.
- Another 4 of the projects are smaller industrial plants at packaging, pulp or pellet facilities.
[…]
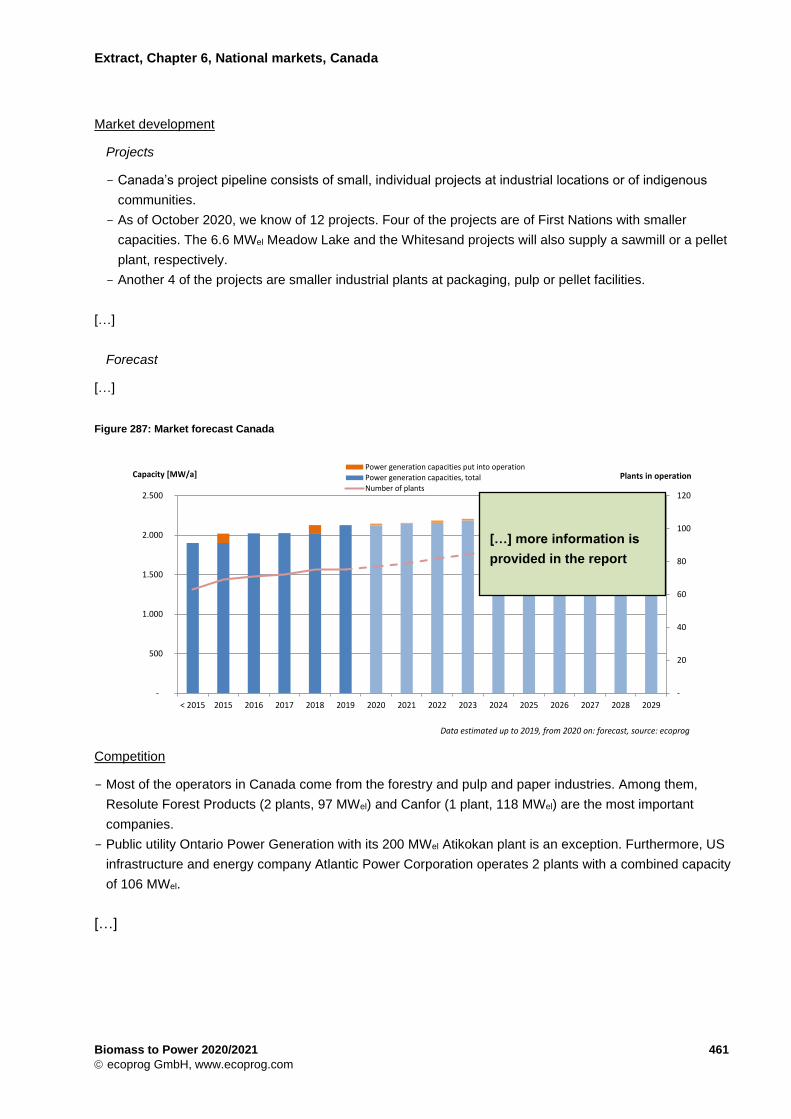
Forecast
[…]
Figure 287: Market forecast Canada
Competition
- Most of the operators in Canada come from the forestry and pulp and paper industries. Among them,
Resolute Forest Products (2 plants, 97 MWel) and Canfor (1 plant, 118 MWel) are the most important
companies.
- Public utility Ontario Power Generation with its 200 MWel Atikokan plant is an exception. Furthermore, US
infrastructure and energy company Atlantic Power Corporation operates 2 plants with a combined capacity
of 106 MWel.
[…]
-
20
40
60
80
100
120
-
500
1.000
1.500
2.000
2.500
< 2015 2015 2016 2017 2018 2019 2020 2021 2022 2023 2024 2025 2026 2027 2028 2029
Power generation capacities put into operationPower generation capacities, totalNumber of plants
Plants in operationCapacity [MW/a]
Data estimated up to 2019, from 2020 on: forecast, source: ecoprog
[…] more information is
provided in the report

Extract, Chapter 6, National markets, Netherlands
Biomass to Power 2020/2021 343
© ecoprog GmbH, www.ecoprog.com
Figure 204: Locations of plants and projects in the Netherlands
[…]
Figure 2: Project outlook Netherlands
Plant Country Type Plant unit Cap. (MWel) Start Status
Heusden 1 Netherlands mono-incinerator 1 n.a. n.a. under construction
Egchel Netherlands mono-incinerator 1 2 2020 approved
[…] more information is provided
in the report
[…] more information is provided in the report
Extract, Chapter 6, National markets, Denmark
Biomass to Power 2020/2021 259
© ecoprog GmbH, www.ecoprog.com 256
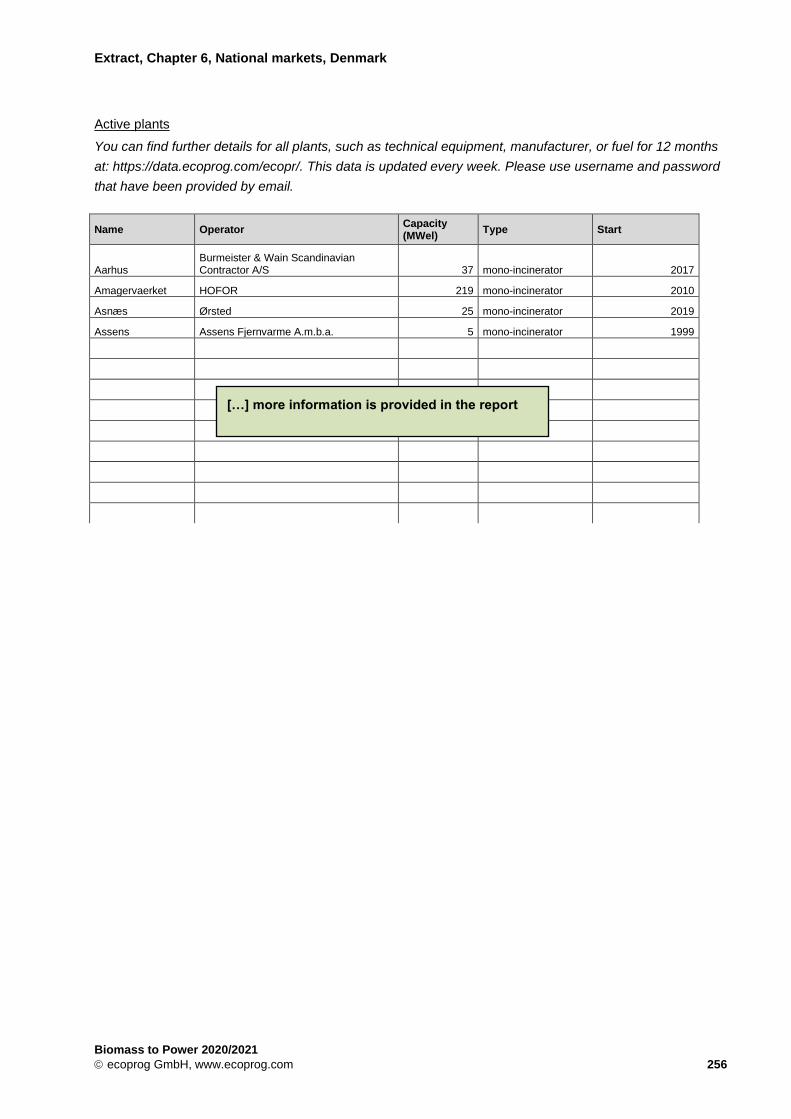
Active plants
You can find further details for all plants, such as technical equipment, manufacturer, or fuel for 12 months
at: https://data.ecoprog.com/ecopr/. This data is updated every week. Please use username and password
that have been provided by email.
Name Operator Capacity (MWel)
Type Start
Aarhus Burmeister & Wain Scandinavian Contractor A/S 37 mono-incinerator 2017
Amagervaerket HOFOR 219 mono-incinerator 2010
Asnæs Ørsted 25 mono-incinerator 2019
Assens Assens Fjernvarme A.m.b.a. 5 mono-incinerator 1999
[…] more information is provided in the report
Extract, w&b Data (Biomass to Power module)
Biomass to Power 2020/2021 259
© ecoprog GmbH, www.ecoprog.com
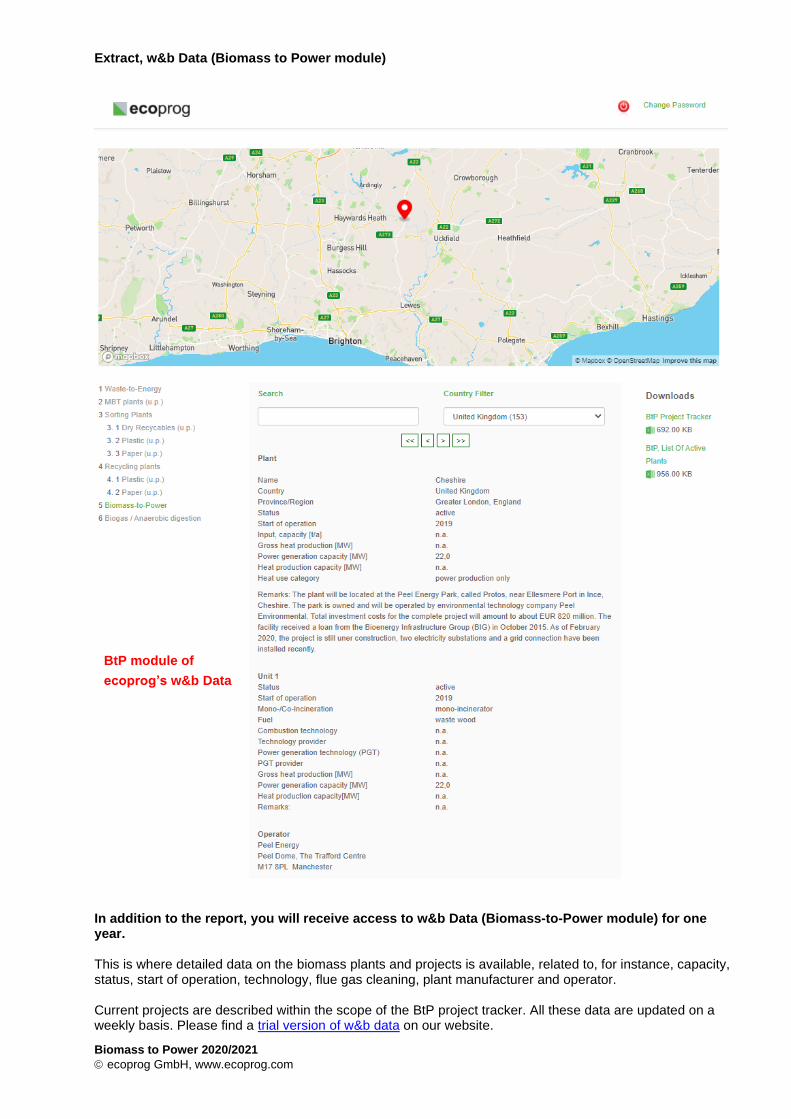
In addition to the report, you will receive access to w&b Data (Biomass-to-Power module) for one year. This is where detailed data on the biomass plants and projects is available, related to, for instance, capacity, status, start of operation, technology, flue gas cleaning, plant manufacturer and operator. Current projects are described within the scope of the BtP project tracker. All these data are updated on a weekly basis. Please find a trial version of w&b data on our website.
BtP module of
ecoprog’s w&b Data

ecoprog GmbH ● Krefelder Str. 18 ● 50670 Cologne, Germany ● +49 221 788 03 88 0 ● District Court Cologne, # HRB 56660 ● Tax number: 215/5813/1709 ● VAT ID: DE814576618 ● www.ecoprog.com
Price and product information
You can order the market report here:
https://www.ecoprog.com/publikationen/energiewirtschaft/biomass-to-power/order-biomass-to-power.htm
Price models: one-time purchase
• Single user copy: 4,400.- €*
• Company version: 8,800.- €*
• Corporate version: POA
Product information:
Single-user version: personal copy (personalised and password-protected PDF file), sent via email
Company version: company-wide copy (legal entity), sent via email
Corporate version: for different, legally connected companies (e.g. sister companies, subsidiaries abroad), price depends on number of companies and employees
Includes 12 month-access to w&b Data (Biomass to Power module) and BtP project tracker.
Subscribers of ecoprog’s waste & bio Infrastructure Monitor (Info | Order) will receive a discount of 600.- € (1,200.- € in case of a company version).
Options: Additionally, you can order all detailed information on plants and projects in MS Excel
(only available in combination with a company or corporate version): 4,400.- €*
Additionally, you can order a printed copy of the study: 150.- €*
Price models: BtP Package (subscription)
• Single-user version: 3,400.- € per year*
• Company version: 6,800.- € per year*
• Corporate version: POA
The BtP Package includes:
a. Study „Biomass to Power“, updated annually
b. w&b Monitor (sent weekly) plus access to the w&b online archive with around 40,000 news since 2009
c. Access to w&b Data (Biomass to Power module) including BtP project tracker
The minimum subscription period is 2 years. The subscription will be renewed for another year if it is not
cancelled at least 4 weeks before the expiration date.
* plus 19% VAT for customers within Germany and EU customers without a VAT ID.