Embed Size (px)
Citation preview

Biomass Thermal: Market Outlook
1
Biomass Thermal Markets Outlook: 2012-2015
This Webinar is brought to you by:
Biomass Thermal Energy Council (BTEC)
With the generous support of the U.S. Forest Service
Wood Education Resource Center
2 PM ET, December 20, 2011
“The work upon which this publication is based was funded in whole or in part through a grant awarded by the Wood Education and Resource Center, Northeastern Area State and Private Forestry, U.S. Forest Service. This institution is an equal
opportunity provider.”

Biomass Thermal: Market Outlook
2
Joseph Seymour - Introductions
Executive Director - Biomass Thermal Energy Council (BTEC)
I. Introduction - Seymour
Biomass Thermal: Market Outlook
Quick notes
Two Audio Options: Streaming Audio and Dial-In.1. Streaming Audio/Computer
Speakers (Default)2. Dial-In: Use the Audio Panel
(right side of screen) to see dial- in instructions. Call-in separately from your telephone.
Ask questions using the Questions Panel on the right side of your screen.
The recording of the webinar and the slides will be available after the event. Registrants will be notified by email.
I. Introduction - Seymour
Biomass Thermal: Market Outlook
4
Speakers
Jeffrey Eppink, President, Enegis LLC Amanda Hamsley Lang, Operations Manager, Forisk ConsultingSeth Walker, Associate Economist, RISI Inc.; presenting for William Perritt, Senior Editor, RISI Inc.
Joseph Seymour, Executive Director, Biomass Thermal Energy Council
Moderator
I. Event Introduction - Seymour
Biomass Thermal: Market Outlook
5
Presentation OutlineI. Introduction – Joe SeymourII. Assessing Biomass Energy Supply – Jeffrey
EppinkIII. Technology and Markets – Amanda Hamsley LangIV. Market Drivers – Seth Walker for William PerrittV. Q&A – Joe SeymourVI. Resources and Future Events - Joe Seymour
[Full presentation will be available online, www.biomassthermal.org/resource/webinars.asp]
I. Event Introduction - Seymour
Biomass Thermal: Market Outlook
6
Introduction BTEC
Introduction to BTEC
The Biomass Thermal Energy Council (BTEC) is the industry trade association dedicated to advancing the use of biomass for heat and other thermal energy applications.
Why was BTEC established?1. To advocate for and promote the industry in the national energy policy debate2. To reach out to and educate the public and decision makers on the benefits
and advantages of using biomass for heat3. To develop biomass energy research and analysis that enables sound
investment and policy decisions
Biomass Thermal: Market Outlook
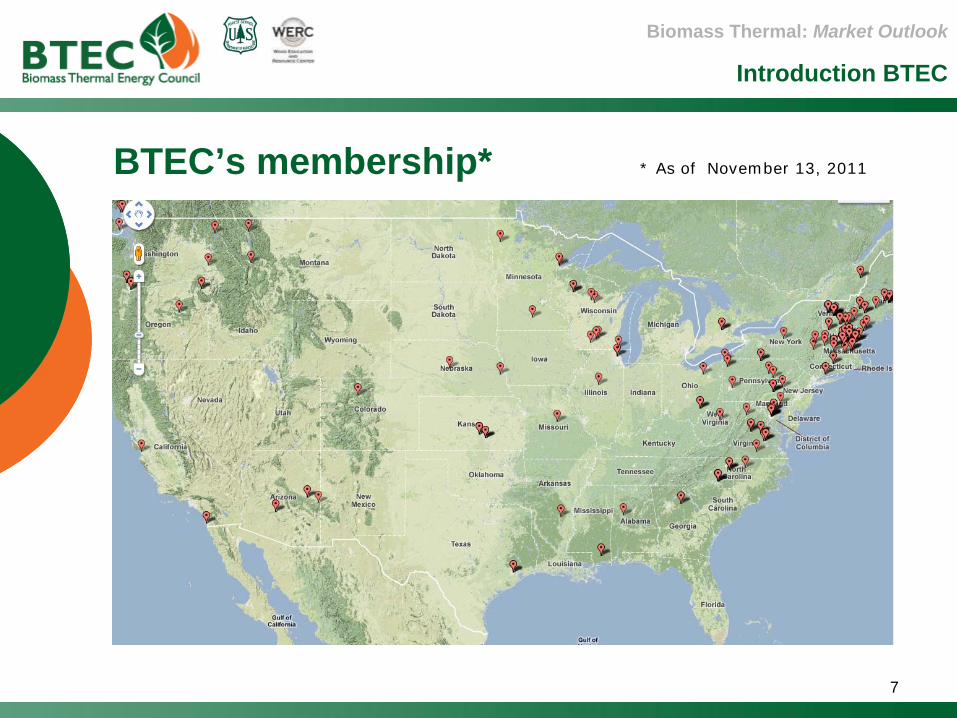
BTEC’s membership* * As of November 13, 2011
7
Introduction BTEC
Biomass Thermal: Market Outlook
8
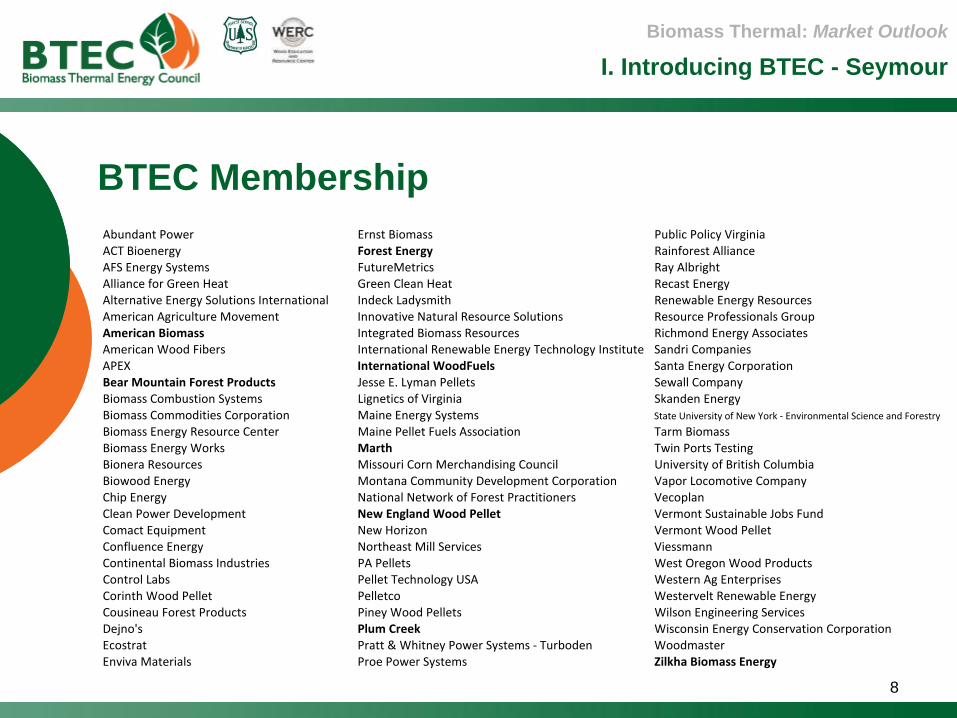
BTEC Membership
I. Introducing BTEC - Seymour
Abundant Power Ernst Biomass Public Policy VirginiaACT Bioenergy Forest Energy Rainforest AllianceAFS Energy Systems FutureMetrics Ray AlbrightAlliance for Green Heat Green Clean Heat Recast EnergyAlternative Energy Solutions International Indeck Ladysmith Renewable Energy ResourcesAmerican Agriculture Movement Innovative Natural Resource Solutions Resource Professionals GroupAmerican Biomass Integrated Biomass Resources Richmond Energy AssociatesAmerican Wood Fibers International Renewable Energy Technology Institute Sandri CompaniesAPEX International WoodFuels Santa Energy CorporationBear Mountain Forest Products Jesse E. Lyman Pellets Sewall CompanyBiomass Combustion Systems Lignetics of Virginia Skanden EnergyBiomass Commodities Corporation Maine Energy Systems State University of New York ‐ Environmental Science and Forestry
Biomass Energy Resource Center Maine Pellet Fuels Association Tarm BiomassBiomass Energy Works Marth Twin Ports TestingBionera Resources Missouri Corn Merchandising Council University of British ColumbiaBiowood Energy Montana Community Development Corporation Vapor Locomotive CompanyChip Energy National Network of Forest Practitioners VecoplanClean Power Development New England Wood Pellet Vermont Sustainable Jobs FundComact Equipment New Horizon Vermont Wood PelletConfluence Energy Northeast Mill Services ViessmannContinental Biomass Industries PA Pellets West Oregon Wood ProductsControl Labs Pellet Technology USA Western Ag EnterprisesCorinth Wood Pellet Pelletco Westervelt Renewable EnergyCousineau Forest Products Piney Wood Pellets Wilson Engineering ServicesDejno's Plum Creek Wisconsin Energy Conservation CorporationEcostrat Pratt & Whitney Power Systems ‐ Turboden WoodmasterEnviva Materials Proe Power Systems Zilkha Biomass Energy

Biomass Thermal: Market Outlook
9
Project made possible by the USDA FS WERCBTEC awarded a grant from the USDA Forest Service’s Wood Education and Resource Center (WERC) in June 2010 to advance education and outreach on biomass thermal energy
The Center's mission is to work with the forest products industry toward sustainable forest products production for the eastern hardwood forest region.
Previous webinars available at: www.biomassthermal.org/resource.
All questions and attendee feedback will help form future activities.
Remember to answer the survey at the webinar’s conclusion!
I. Sponsoring Entity - Seymour

Biomass Thermal: Market Outlook
10
Jeffrey EppinkPresident, Enegis LLC
Assessing Biomass Energy Supply
II. Assessing Supply - Eppink

11
Biomass Energy Analytical Model
Assessing Biomass Energy SupplyPresented to the
Biomass Thermal Energy CouncilDecember 2011
Jeffrey Eppink, Enegis, LLC
Assessing Biomass Energy SupplyAssessing Biomass Energy SupplyPresented to the
Biomass Thermal Energy CouncilBiomass Thermal Energy CouncilDecember 2011
Jeffrey Eppink, Enegis, LLC
12
Biomass Energy Analytical Model
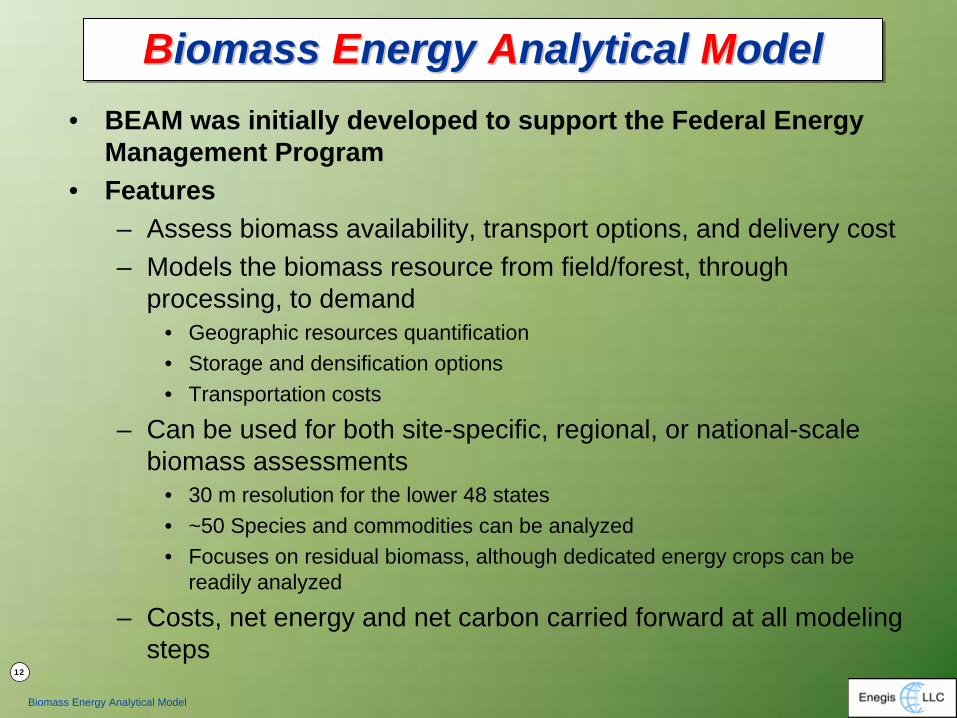
• BEAM was initially developed to support the Federal Energy Management Program
• Features– Assess biomass availability, transport options, and delivery cost– Models the biomass resource from field/forest, through
processing, to demand• Geographic resources quantification• Storage and densification options• Transportation costs
– Can be used for both site-specific, regional, or national-scale biomass assessments
• 30 m resolution for the lower 48 states• ~50 Species and commodities can be analyzed• Focuses on residual biomass, although dedicated energy crops can be
readily analyzed
– Costs, net energy and net carbon carried forward at all modeling steps
Biomass Energy Analytical ModelBBiomass iomass EEnergy nergy AAnalytical nalytical MModelodel

13
Biomass Energy Analytical Model
Species Data Source Species Data SourceAgriculture Residues: Agriculture Residues Cont:Hay All (Dry) USDA NASS Sweet Corn For Processing USDA NASSHay Alfalfa (Dry) USDA NASS Wheat Winter All USDA NASSRice All USDA NASSSorghum For Grain USDA NASSBarley All USDA NASS Woody Residues:Canola USDA NASS Logging Residue ‐ HardWood USDA FSCorn For Grain USDA NASS Logging Residue ‐ SoftWood USDA FSCotton Amer. Pima USDA NASS Forest Management Residue ‐ HardWood BAMF Hazardous FuelsCotton Upland USDA NASS Forest Management Residue ‐ SoftWood BAMF Hazardous FuelsBeans Dry Edible USDA NASS Coarse Wood Residue ‐ Hardwood BAMF Industrial Wood WasteWheat Durum USDA NASS Coarse Wood Residue ‐ Softwood BAMF Industrial Wood WasteFlaxseed USDA NASS Fine Wood Residue ‐ Hardwood BAMF Industrial Wood WastePeanuts for Nuts USDA NASS Fine Wood Residue ‐ Softwood BAMF Industrial Wood WastePotatoes All USDA NASS Urban Wood Waste ‐ Tree clippings Based on US Census Bureau PopulationHay Other (Dry) USDA NASSOats ‐ (Fall) USDA NASS Human Produced Wastes:Rye USDA NASS Wastewater Treatment Plants BAMF Anaerobic WWTPSafflower USDA NASS Landfills Producing Methane EPASoybeans USDA NASSSugarcane For Sugar USDA NASS Animal Manure:Sunflower All USDA NASS All Goats USDA NASS & HSIPSweet Potatoes USDA NASS Milk Cows USDA NASS & HSIPSugarbeets USDA NASS Beef USDA NASS & HSIPWheat Other Spring USDA NASS Hogs All USDA NASS & HSIPTobacco Air‐Cured Light Burley USDA NASS Sheep USDA NASS & HSIPTobacco Flue‐Cured Class 1 USDA NASS Layer USDA NASS & HSIPGreen Peas For Processing USDA NASS Broiler USDA NASS & HSIPSnap Beans For Processing USDA NASS Turkey USDA NASS & HSIP
Species Data Source Species Data SourceAgriculture Residues: Agriculture Residues Cont:Hay All (Dry) USDA NASS Sweet Corn For Processing USDA NASSHay Alfalfa (Dry) USDA NASS Wheat Winter All USDA NASSRice All USDA NASSSorghum For Grain USDA NASSBarley All USDA NASS Woody Residues:Canola USDA NASS Logging Residue ‐ HardWood USDA FSCorn For Grain USDA NASS Logging Residue ‐ SoftWood USDA FSCotton Amer. Pima USDA NASS Forest Management Residue ‐ HardWood BAMF Hazardous FuelsCotton Upland USDA NASS Forest Management Residue ‐ SoftWood BAMF Hazardous FuelsBeans Dry Edible USDA NASS Coarse Wood Residue ‐ Hardwood BAMF Industrial Wood WasteWheat Durum USDA NASS Coarse Wood Residue ‐ Softwood BAMF Industrial Wood WasteFlaxseed USDA NASS Fine Wood Residue ‐ Hardwood BAMF Industrial Wood WastePeanuts for Nuts USDA NASS Fine Wood Residue ‐ Softwood BAMF Industrial Wood WastePotatoes All USDA NASS Urban Wood Waste ‐ Tree clippings Based on US Census Bureau PopulationHay Other (Dry) USDA NASSOats ‐ (Fall) USDA NASS Human Produced Wastes:Rye USDA NASS Wastewater Treatment Plants BAMF Anaerobic WWTPSafflower USDA NASS Landfills Producing Methane EPASoybeans USDA NASSSugarcane For Sugar USDA NASS Animal Manure:Sunflower All USDA NASS All Goats USDA NASS & HSIPSweet Potatoes USDA NASS Milk Cows USDA NASS & HSIPSugarbeets USDA NASS Beef USDA NASS & HSIPWheat Other Spring USDA NASS Hogs All USDA NASS & HSIPTobacco Air‐Cured Light Burley USDA NASS Sheep USDA NASS & HSIPTobacco Flue‐Cured Class 1 USDA NASS Layer USDA NASS & HSIPGreen Peas For Processing USDA NASS Broiler USDA NASS & HSIPSnap Beans For Processing USDA NASS Turkey USDA NASS & HSIP
~50 Species/Commodities Incorporated~50 Species/Commodities Incorporated~50 Species/Commodities IncorporatedJan Feb Mar Apr May Jun Jul Aug Sep Oct Nov Dec Annual Total
Species: % % % % % % % % % % % % %Hay All (Dry) ‐ ‐ ‐ ‐ 10 20 30 20 10 10 ‐ ‐ 100Hay Alfalfa (Dry) ‐ ‐ ‐ ‐ 10 20 30 20 10 5 5 ‐ 100Rice All ‐ ‐ ‐ ‐ ‐ ‐ 10 20 40 30 ‐ ‐ 100Sorghum For Grain ‐ ‐ ‐ ‐ ‐ ‐ ‐ 10 15 45 30 ‐ 100Barley All ‐ ‐ ‐ ‐ ‐ ‐ 25 50 25 ‐ ‐ ‐ 100Canola ‐ ‐ ‐ ‐ 20 30 30 20 ‐ ‐ ‐ ‐ 100Corn For Grain ‐ ‐ ‐ ‐ ‐ ‐ ‐ ‐ 25 50 25 ‐ 100Cotton Amer. Pima ‐ ‐ ‐ ‐ ‐ ‐ ‐ ‐ 20 50 15 15 100Cotton Upland ‐ ‐ ‐ ‐ ‐ ‐ ‐ ‐ 20 50 15 15 100Beans Dry Edible ‐ ‐ ‐ ‐ ‐ ‐ ‐ 25 50 25 ‐ ‐ 100Wheat Durum ‐ ‐ ‐ ‐ ‐ ‐ 25 50 25 ‐ ‐ ‐ 100Flaxseed ‐ ‐ ‐ ‐ ‐ ‐ 50 50 ‐ ‐ ‐ ‐ 100Peanuts for Nuts ‐ ‐ ‐ ‐ ‐ ‐ ‐ ‐ 25 50 25 ‐ 100Potatoes All ‐ ‐ ‐ ‐ ‐ ‐ ‐ ‐ 25 50 25 ‐ 100Hay Other (Dry) ‐ ‐ ‐ ‐ 10 20 30 20 10 10 ‐ ‐ 100Oats ‐ (Fall) ‐ ‐ ‐ ‐ ‐ ‐ 25 50 25 ‐ ‐ ‐ 100Rye ‐ ‐ ‐ ‐ 25 50 25 ‐ ‐ ‐ ‐ ‐ 100Safflower ‐ ‐ ‐ ‐ ‐ ‐ ‐ 50 50 ‐ ‐ ‐ 100Soybeans ‐ ‐ ‐ ‐ ‐ ‐ ‐ 10 10 30 30 20 100Sugarcane For Sugar 15 15 10 5 ‐ ‐ ‐ ‐ ‐ 10 20 25 100Sunflower All ‐ ‐ ‐ ‐ ‐ ‐ ‐ 5 20 50 25 ‐ 100Sweet Potatoes ‐ ‐ ‐ ‐ ‐ ‐ ‐ 25 50 25 ‐ ‐ 100Sugarbeets ‐ ‐ ‐ ‐ ‐ ‐ ‐ ‐ 25 50 25 ‐ 100Wheat Other Spring ‐ ‐ ‐ ‐ ‐ ‐ 25 50 25 ‐ ‐ ‐ 100Tobacco Air‐Cured ‐ ‐ ‐ ‐ ‐ ‐ ‐ 25 50 25 ‐ ‐ 100Tobacco Flue‐Cured ‐ ‐ ‐ ‐ ‐ 20 30 30 20 ‐ ‐ ‐ 100Green Peas For Processing 2 3 5 10 11 15 20 11 10 8 3 2 100Snap Beans For Processing ‐ ‐ 2 5 7 20 30 20 10 3 2 1 100Sweet Corn For Processing ‐ ‐ ‐ ‐ 5 10 30 30 10 10 5 ‐ 100Wheat Winter All ‐ ‐ ‐ ‐ 10 25 30 25 10 ‐ ‐ ‐ 100
Seasonal AvailabilityJan Feb Mar Apr May Jun Jul Aug Sep Oct Nov Dec Annual Total
Species: % % % % % % % % % % % % %Hay All (Dry) ‐ ‐ ‐ ‐ 10 20 30 20 10 10 ‐ ‐ 100Hay Alfalfa (Dry) ‐ ‐ ‐ ‐ 10 20 30 20 10 5 5 ‐ 100Rice All ‐ ‐ ‐ ‐ ‐ ‐ 10 20 40 30 ‐ ‐ 100Sorghum For Grain ‐ ‐ ‐ ‐ ‐ ‐ ‐ 10 15 45 30 ‐ 100Barley All ‐ ‐ ‐ ‐ ‐ ‐ 25 50 25 ‐ ‐ ‐ 100Canola ‐ ‐ ‐ ‐ 20 30 30 20 ‐ ‐ ‐ ‐ 100Corn For Grain ‐ ‐ ‐ ‐ ‐ ‐ ‐ ‐ 25 50 25 ‐ 100Cotton Amer. Pima ‐ ‐ ‐ ‐ ‐ ‐ ‐ ‐ 20 50 15 15 100Cotton Upland ‐ ‐ ‐ ‐ ‐ ‐ ‐ ‐ 20 50 15 15 100Beans Dry Edible ‐ ‐ ‐ ‐ ‐ ‐ ‐ 25 50 25 ‐ ‐ 100Wheat Durum ‐ ‐ ‐ ‐ ‐ ‐ 25 50 25 ‐ ‐ ‐ 100Flaxseed ‐ ‐ ‐ ‐ ‐ ‐ 50 50 ‐ ‐ ‐ ‐ 100Peanuts for Nuts ‐ ‐ ‐ ‐ ‐ ‐ ‐ ‐ 25 50 25 ‐ 100Potatoes All ‐ ‐ ‐ ‐ ‐ ‐ ‐ ‐ 25 50 25 ‐ 100Hay Other (Dry) ‐ ‐ ‐ ‐ 10 20 30 20 10 10 ‐ ‐ 100Oats ‐ (Fall) ‐ ‐ ‐ ‐ ‐ ‐ 25 50 25 ‐ ‐ ‐ 100Rye ‐ ‐ ‐ ‐ 25 50 25 ‐ ‐ ‐ ‐ ‐ 100Safflower ‐ ‐ ‐ ‐ ‐ ‐ ‐ 50 50 ‐ ‐ ‐ 100Soybeans ‐ ‐ ‐ ‐ ‐ ‐ ‐ 10 10 30 30 20 100Sugarcane For Sugar 15 15 10 5 ‐ ‐ ‐ ‐ ‐ 10 20 25 100Sunflower All ‐ ‐ ‐ ‐ ‐ ‐ ‐ 5 20 50 25 ‐ 100Sweet Potatoes ‐ ‐ ‐ ‐ ‐ ‐ ‐ 25 50 25 ‐ ‐ 100Sugarbeets ‐ ‐ ‐ ‐ ‐ ‐ ‐ ‐ 25 50 25 ‐ 100Wheat Other Spring ‐ ‐ ‐ ‐ ‐ ‐ 25 50 25 ‐ ‐ ‐ 100Tobacco Air‐Cured ‐ ‐ ‐ ‐ ‐ ‐ ‐ 25 50 25 ‐ ‐ 100Tobacco Flue‐Cured ‐ ‐ ‐ ‐ ‐ 20 30 30 20 ‐ ‐ ‐ 100Green Peas For Processing 2 3 5 10 11 15 20 11 10 8 3 2 100Snap Beans For Processing ‐ ‐ 2 5 7 20 30 20 10 3 2 1 100Sweet Corn For Processing ‐ ‐ ‐ ‐ 5 10 30 30 10 10 5 ‐ 100Wheat Winter All ‐ ‐ ‐ ‐ 10 25 30 25 10 ‐ ‐ ‐ 100
Seasonal AvailabilitySeasonality ParametersSeasonality ParametersSeasonality Parameters
BtuHHV BtuLHV Ash Avg Ash Min Ash Max Moisture Potassium
(K ) Sodium (Na )
Chlorine (Cl )
Carbon (C )
Mercury (Hg)
Sulfur (S)
Species: MMBtu /Tonne
MMBtu /Tonne
% % % % g/kg (DAF)
g/kg (DAF)
weight % (DAF)
weight %
weight % (DAF)
weight % (DAF)
Logging Residue ‐ HardWood 18.8 17.4 0.9 0.2 2.6 11.3 1.20 0.01 0.0 49.7 0.0 0.1Logging Residue ‐ SoftWood 19.9 18.5 1.6 0.4 4.1 4.7 1.68 0.25 0.0 51.9 0.0 0.0Forest Mgmt. Residue ‐ HardWood 18.8 17.4 0.9 0.2 2.6 11.3 1.20 0.01 0.0 49.7 0.0 0.1Forest Mgmt. Residue ‐ SoftWood 19.9 18.5 1.6 0.4 4.1 4.7 1.68 0.25 0.0 51.9 0.0 0.0Coarse Wood Residue ‐ Hardwood 18.5 17.2 0.9 0.4 2.1 15.2 0.98 0.04 0.0 50.0 0.0 0.1Coarse Wood Residue ‐ Softwood 19.3 18.0 0.3 0.3 0.3 9.3 0.38 0.04 0.0 49.8 0.0 0.0Fine Wood Residue ‐ Hardwood 17.2 16.0 1.5 8.0 ‐ ‐ 50.8 0.0 0.0Fine Wood Residue ‐ Softwood 18.4 17.2 1.1 34.9 0.49 0.03 0.0 49.3 0.0 0.0Urban Wood Waste ‐ Tree clippings 19.5 18.4 15.6 1.4 39.4 35.4 4.15 2.05 0.1 51.1 0.0 0.1
Physical Parameters
Detailed Physical ParametersDetailed Physical ParametersDetailed Physical Parameters
Species-Specific ParametersSpeciesSpecies--Specific ParametersSpecific Parameters
Biomass Residue ConversionsBiomass Residue ConversionsBiomass Residue Conversions
14
Biomass Energy Analytical Model
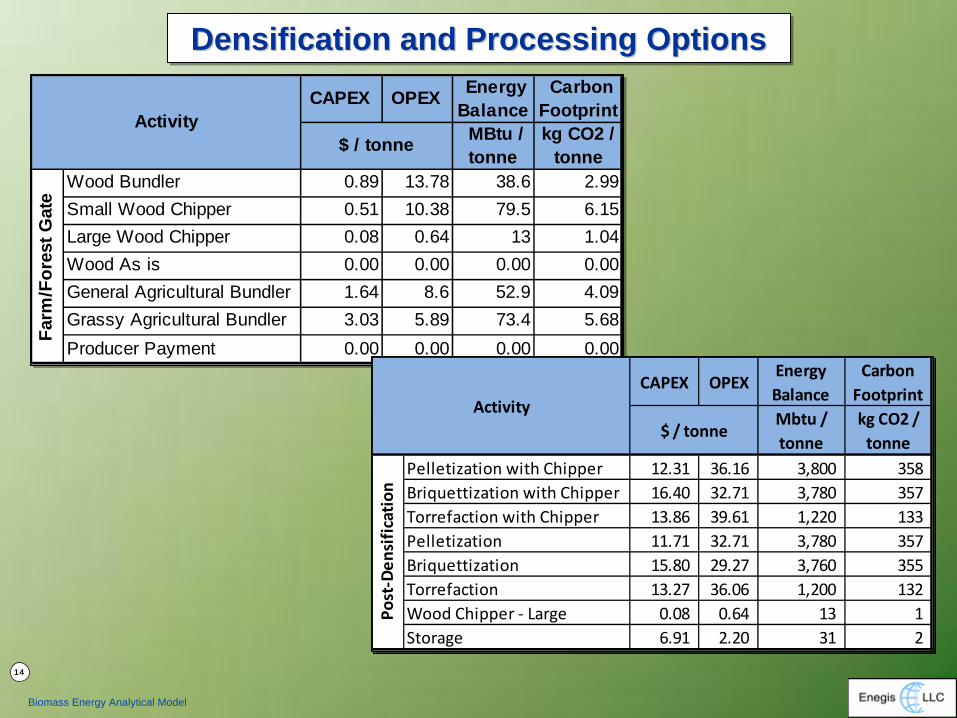
Densification and Processing OptionsDensification and Processing OptionsDensification and Processing OptionsCAPEX OPEX Energy
Balance Carbon
Footprint MBtu / tonne
kg CO2 / tonne
Wood Bundler 0.89 13.78 38.6 2.99Small Wood Chipper 0.51 10.38 79.5 6.15Large Wood Chipper 0.08 0.64 13 1.04Wood As is 0.00 0.00 0.00 0.00General Agricultural Bundler 1.64 8.6 52.9 4.09Grassy Agricultural Bundler 3.03 5.89 73.4 5.68Producer Payment 0.00 0.00 0.00 0.00
Activity$ / tonne
Farm
/For
est G
ate
CAPEX OPEXEnergy Balance
Carbon Footprint
Mbtu / tonne
kg CO2 / tonne
Pelletization with Chipper 12.31 36.16 3,800 358 Briquettization with Chipper 16.40 32.71 3,780 357 Torrefaction with Chipper 13.86 39.61 1,220 133 Pelletization 11.71 32.71 3,780 357 Briquettization 15.80 29.27 3,760 355 Torrefaction 13.27 36.06 1,200 132 Wood Chipper ‐ Large 0.08 0.64 13 1 Storage 6.91 2.20 31 2
$ / tonne
Post‐Den
sification
Activity

15
Biomass Energy Analytical Model
BEAM: Coverage of Lower 48 StatesBEAM: Coverage of Lower 48 StatesBEAM: Coverage of Lower 48 States

16
Biomass Energy Analytical Model
BEAM—Grid Mode: Lower 48 StatesBEAMBEAM——Grid Mode: Lower 48 StatesGrid Mode: Lower 48 States
Agricultural Agricultural ResiduesResidues
Woody Woody ResiduesResidues

17
Biomass Energy Analytical Model
Land cover / useLand cover / useLand cover / use
BEAM: California ExampleBEAM: California ExampleBEAM: California Example

18
Biomass Energy Analytical Model
BEAM calculates transportation costs as function of time…. BEAM calculates transportation costs as function of time….
and functions of Distance.and functions of Distance.
Transportation CostsTransportation CostsTransportation Costs
19
Biomass Energy Analytical Model
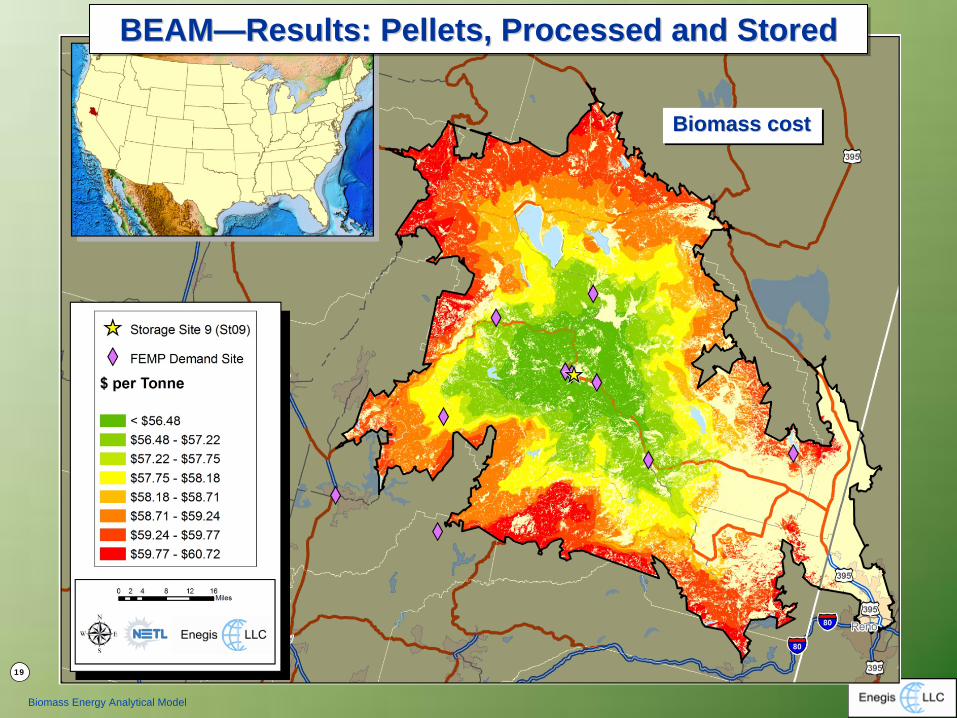
Biomass costBiomass costBiomass cost
BEAM—Results: Pellets, Processed and StoredBEAMBEAM——Results: Pellets, Processed and StoredResults: Pellets, Processed and Stored

20
Biomass Energy Analytical Model
$62.04366.8 kg CO23.97 MMBtu
$62.04$62.04366.8 kg CO2366.8 kg CO23.97 3.97 MMBtuMMBtu
$63.72 366.2 kg CO23.97 MMBtu
$63.72 $63.72 366.2 kg CO2366.2 kg CO23.97 3.97 MMBtuMMBtu
$66.46370.7 kg CO24.02 MMBtu
$66.46$66.46370.7 kg CO2370.7 kg CO24.02 4.02 MMBtuMMBtu
$63.56366.0 kg CO23.96 MMBtu
$63.56$63.56366.0 kg CO2366.0 kg CO23.96 3.96 MMBtuMMBtu
$64.55367.6 kg CO23.98 MMBtu
$64.55$64.55367.6 kg CO2367.6 kg CO23.98 3.98 MMBtuMMBtu
$67.64372.6 kg CO24.05 MMBtu
$67.64$67.64372.6 kg CO2372.6 kg CO24.05 4.05 MMBtuMMBtu
$66.88371.4 kg CO24.03 MMBtu
$66.88$66.88371.4 kg CO2371.4 kg CO24.03 4.03 MMBtuMMBtu
$65.25368.7 kg CO24.00 MMBtu
$65.25$65.25368.7 kg CO2368.7 kg CO24.00 4.00 MMBtuMMBtu
$63.44365.8 kg CO23.96 MMBtu
$63.44$63.44365.8 kg CO2365.8 kg CO23.96 3.96 MMBtuMMBtu
$63.44365.8 kg CO23.96 MMBtu
$63.44$63.44365.8 kg CO2365.8 kg CO23.96 3.96 MMBtuMMBtu
All values per tonne of pelletsAll values per All values per tonnetonne of pelletsof pellets
BEAM—Results: Plant Gate Pellet CostBEAMBEAM——Results: Plant Gate Pellet CostResults: Plant Gate Pellet Cost
21
Biomass Energy Analytical Model
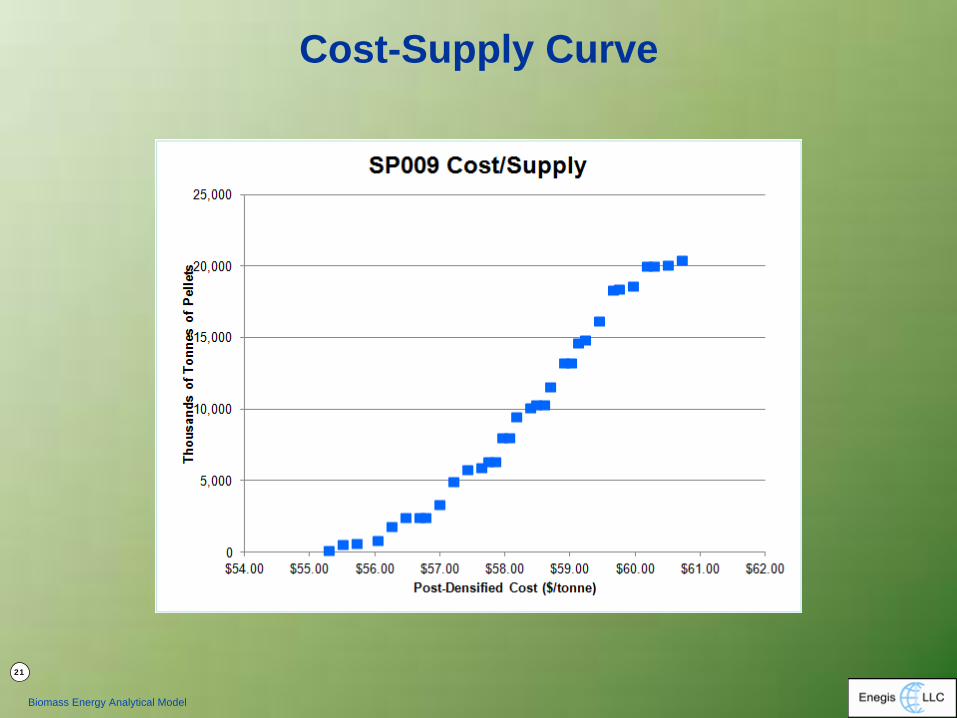
Cost-Supply Curve
22
Biomass Energy Analytical Model
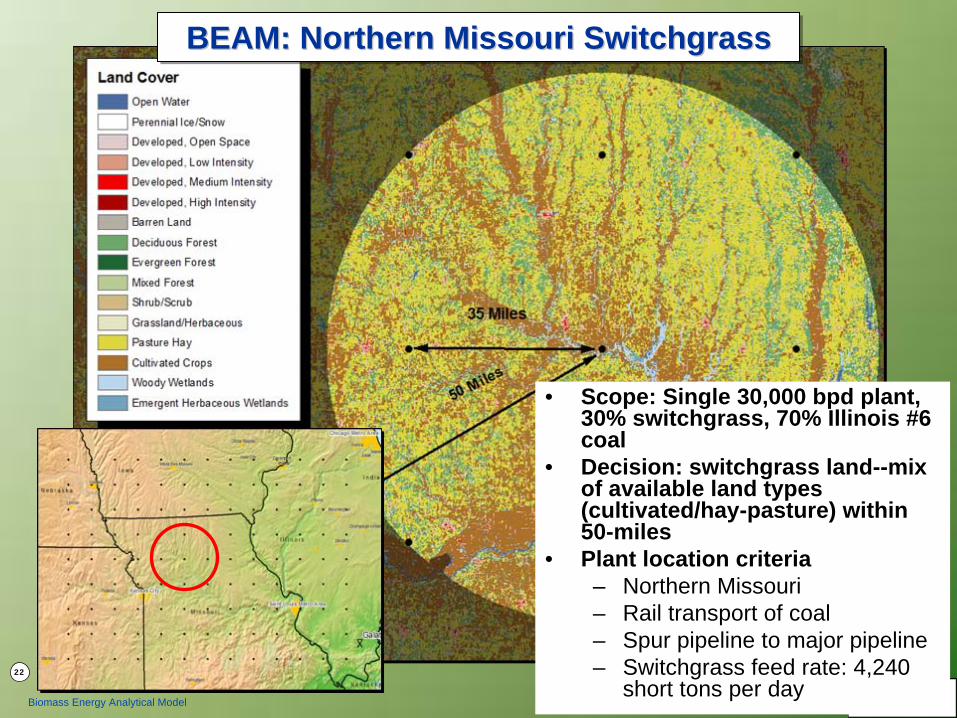
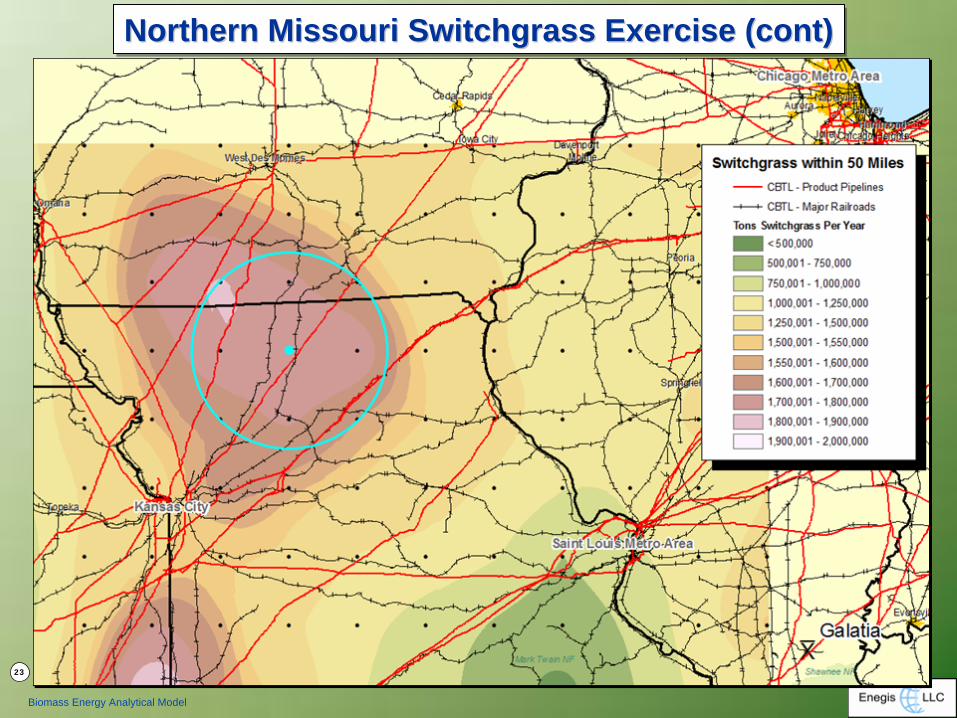
BEAM: Northern Missouri SwitchgrassBEAM: Northern Missouri BEAM: Northern Missouri SwitchgrassSwitchgrass
• Scope: Single 30,000 bpd plant, 30% switchgrass, 70% Illinois #6 coal
• Decision: switchgrass land--mix of available land types (cultivated/hay-pasture) within 50-miles
• Plant location criteria– Northern Missouri– Rail transport of coal– Spur pipeline to major pipeline– Switchgrass feed rate: 4,240
short tons per day
23
Biomass Energy Analytical Model
Northern Missouri Switchgrass Exercise (cont)Northern Missouri Northern Missouri SwitchgrassSwitchgrass Exercise (cont)Exercise (cont)

24
Biomass Energy Analytical Model
Enegis, LLC
3959 Pender Dr. Suite 300
Fairfax, VA 22030
phone: (703) 861.4189
fax: (703) 738.7022
email: [email protected]
www.Enegis.com
This work was funded by the U.S. Department of Energy’s National Energy Technology Laboratory (U.S. DOE/NETL) under Contract No. DE-AC26- 05NT41816. The NETL sponsors for this project, Craig Hustwit and Tim Skone provided guidance and technical oversight for this study. The authors gratefully acknowledge the significant role played by U.S. DOE/NETL in providing the programmatic guidance and review of this study.

Biomass Thermal: Market Outlook
25
Amanda Hamsley LangOperations Manager, Forisk Inc.,Managing Editor, Wood Bioenergy US
Technology and Markets
III. Technology and Markets – Lang

About Forisk
Consulting
• Support investments in timberlands, timber REITs, and wood‐
using energy and manufacturing facilities.
• Conduct research of wood and stumpage markets.– Publish Wood Bioenergy
US
• Founded in 2004.
• Based in Athens, Georgia.
• Staff experience includes forest economics, wood
procurement, business strategy, finance, and equity research.

Bioenergy
Projects: Screen for Success
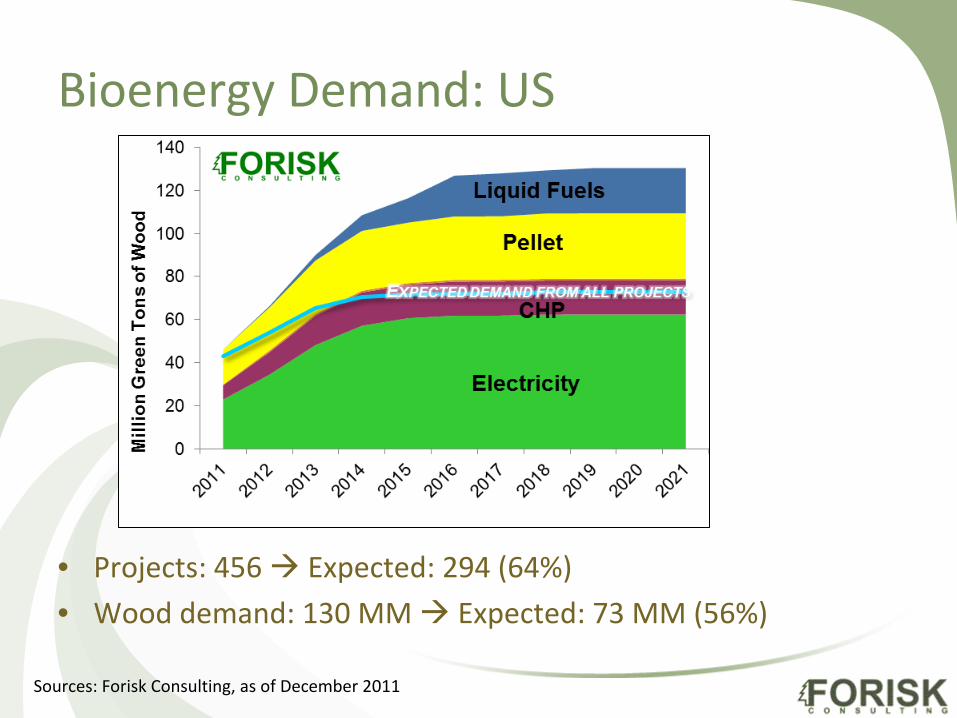
Bioenergy
Demand: US
• Projects: 456 Expected: 294 (64%)
• Wood demand: 130 MM Expected: 73 MM (56%)
Sources: Forisk
Consulting, as of December 2011
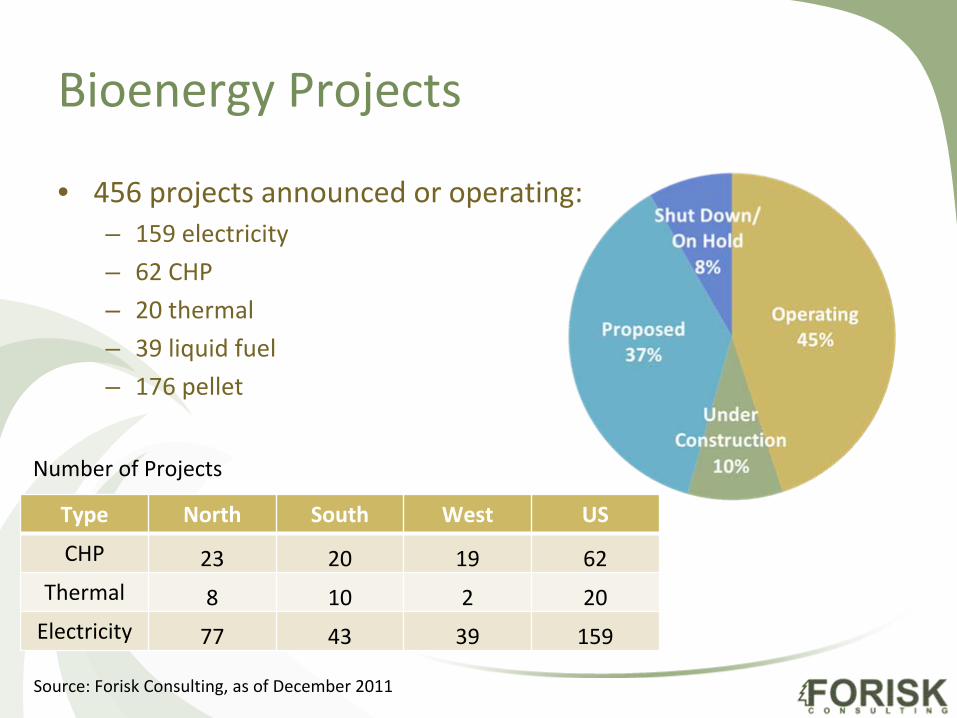
Bioenergy
Projects
• 456 projects announced or operating:– 159 electricity– 62 CHP– 20 thermal
– 39 liquid fuel– 176 pellet
Source: Forisk
Consulting, as of December 2011
Type North South West US
CHP 23 20 19 62Thermal 8 10 2 20Electricity 77 43 39 159
Number of Projects

CHP and Thermal Project Stats
Capacity of thermal projects varies from <1,000 pph
steam to 600,000 pph
steam
CHP Thermal
Avg.
Capacity
North South West US
CHP 29 35 23 29Electricity 122 119 43 101
Project Size (MW)
Source: Forisk
Consulting, as of December 2011
Why Forisk
separated CHP & thermal
• Previously grouped with electricity; separated in Sept. 2011
• Why we separated them:– Technologies– End markets
– Drivers
• Potential data improvements:– Size cut‐off– Commercial vs. industrial tracking
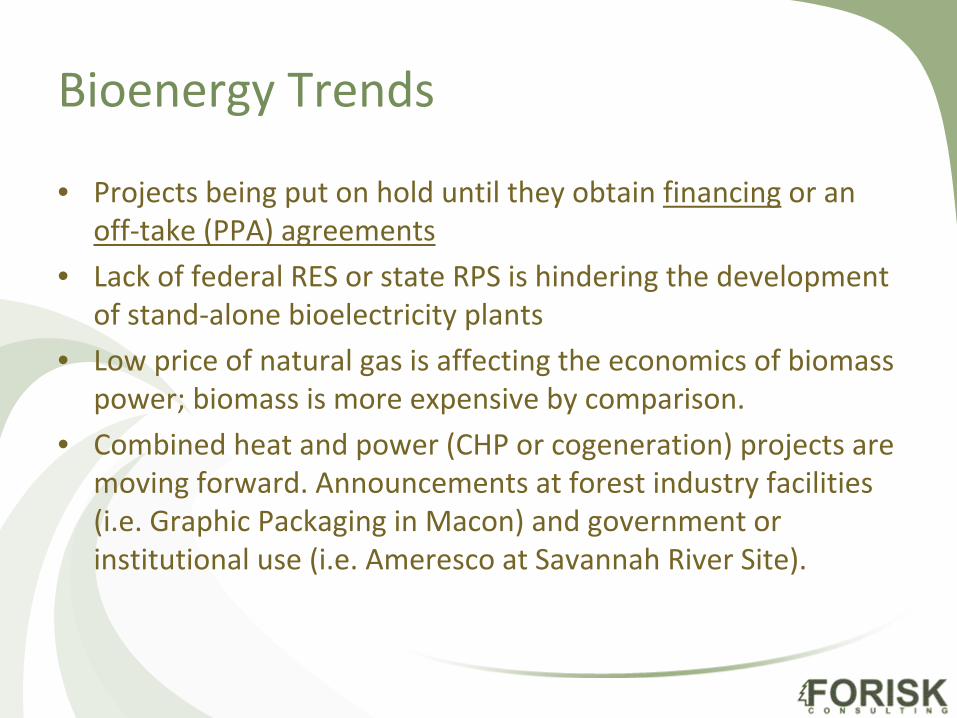
Bioenergy Trends
• Projects being put on hold until they obtain financing
or an
off‐take (PPA) agreements
• Lack of federal RES or state RPS is hindering the development
of stand‐alone bioelectricity plants
• Low price of natural gas is affecting the economics of biomass
power; biomass is more expensive by comparison.
• Combined heat and power (CHP or cogeneration) projects are
moving forward. Announcements at forest industry facilities
(i.e. Graphic Packaging in Macon) and government or
institutional use (i.e. Ameresco
at Savannah River Site).

Bioenergy Trends
• Liquid fuel projects remain speculative. Projects in
development rely heavily on government funding through
grants and loan guarantees. Future funding is uncertain.• Shift in federal funding preference to drop‐in fuels instead of
ethanol projects. – USDA, DOE, and Navy announced partnership to invest $510 MM in
next three years to produce drop‐in aviation and marine biofuels.
• Pellet mills targeting exports to Europe are moving forward
and continue to make announcements (Georgia Biomass,
Enviva)• Torrefied
biomass is still in development.
– A few announcements, but no commercial‐scale plants operating.

Recent CHP Activity / Announcements• Recast Energy is converting a coal‐fired power plant in
Louisville, KY to burn biomass.– The plant will supply steam and power to two
manufacturing plants.• Westervelt
Renewable Energy recently started operating a
power plant at its lumber mill in Moundville, AL.– The 7 MW of electricity generated will be sold to Alabama
Power. The plant began operating in December 2011.• WE Energies is building a 50 MW biomass power plant at the
Domtar Rothschild Paper mill in Wisconsin.– The steam will supply the Domtar paper mill and Domtar
will retire its fossil fuel boilers. The project is targeted to
be operating in Spring 2013.

Biomass Thermal: Market Outlook
36
Seth Walker
Associate Economist, RISI Inc.
Market Drivers
IV. Marker Drivers - Walker
William R. PerrittSenior Editor, Wood Biomass Market ReportBTEC Webinar
December 20, 2011
North American Wood Biomass Market Drivers
38
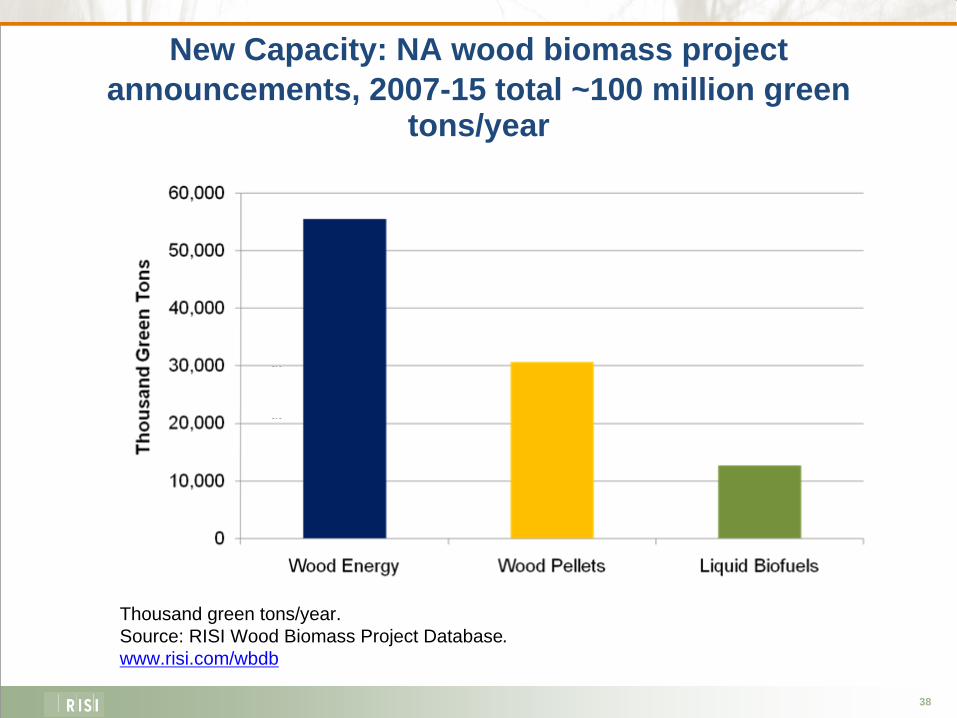
New Capacity: NA wood biomass project announcements, 2007-15 total ~100 million green
tons/year
5 1 3
5 1 3
Thousand green tons/year.Source: RISI Wood Biomass Project Database.www.risi.com/wbdb

39
Where is all this biomass going? Let’s look at the wider 2007-2015 consumption numbers by region…
South Atlantic: 32.4 million tons--60 projectsSouth Central: 16.6 million tons--25 projects– Or 49.0 million tons South-wide, ~50% of the NA total
Northeast: 11.8 million tons--48 projectsPacific Northwest/West: 9.8 million tons--43 projectsLake States: 5.5 million tons-- 18 projectsMidwest: 1.3 million tons--7 projectsBritish Columbia: 10.9 million tons--35 projectsEastern Canada: 9.9 million tons --34 projects
40
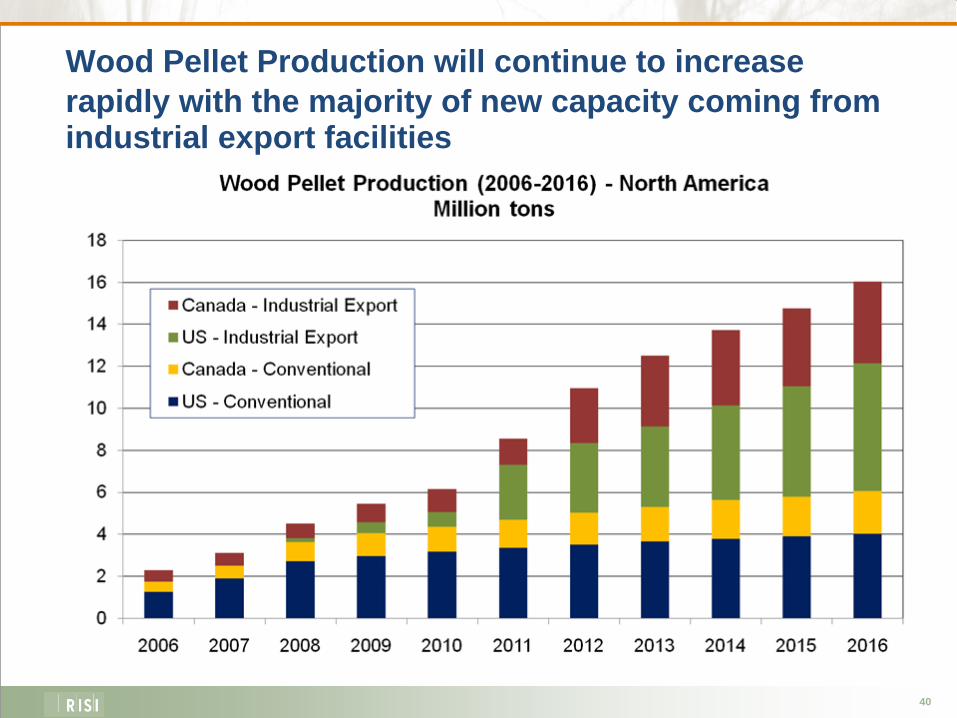
Wood Pellet Production will continue to increase rapidly with the majority of new capacity coming from industrial export facilities

41
European Demand for Biomass
Policy Driven– “20/20/20” goals for 2020:
• 20% reduction in GHGs• 20% renewable• 20% efficiency gains
– BiomassReduction in GHGsRenewable Source
– European Renewable Energy Council• 61% of renewable - biomass • 50% of the growth
– AEBIOM (European Biomass Association):• Europe can supply just over 50% of the biomass
42
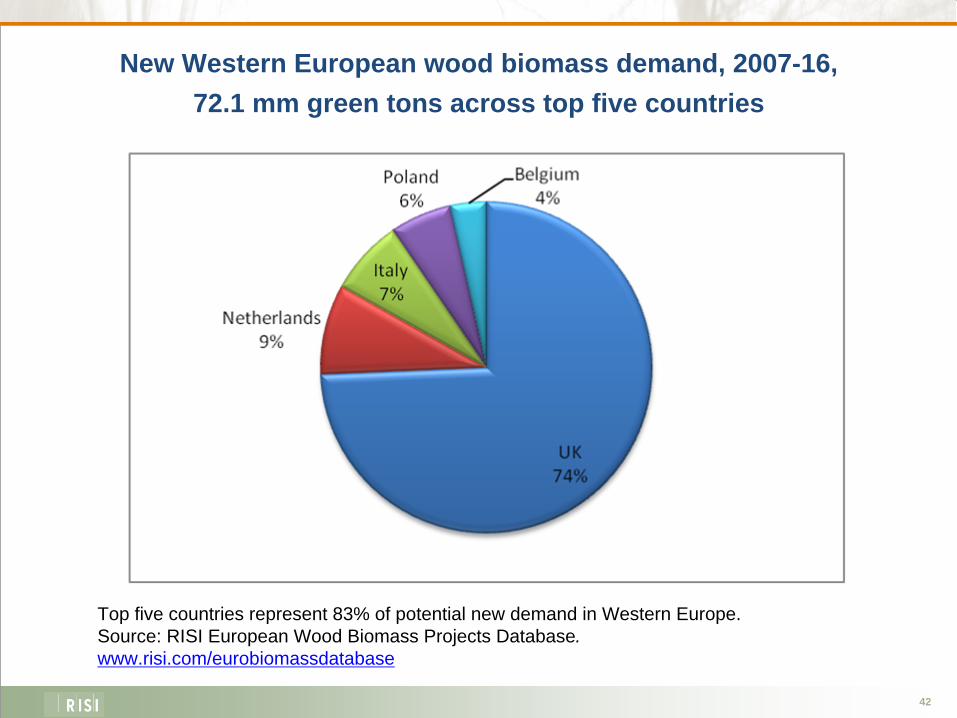
New Western European wood biomass demand, 2007-16, 72.1 mm green tons across top five countries
Top five countries represent 83% of potential new demand in Western Europe.Source: RISI European Wood Biomass Projects Database.www.risi.com/eurobiomassdatabase
43
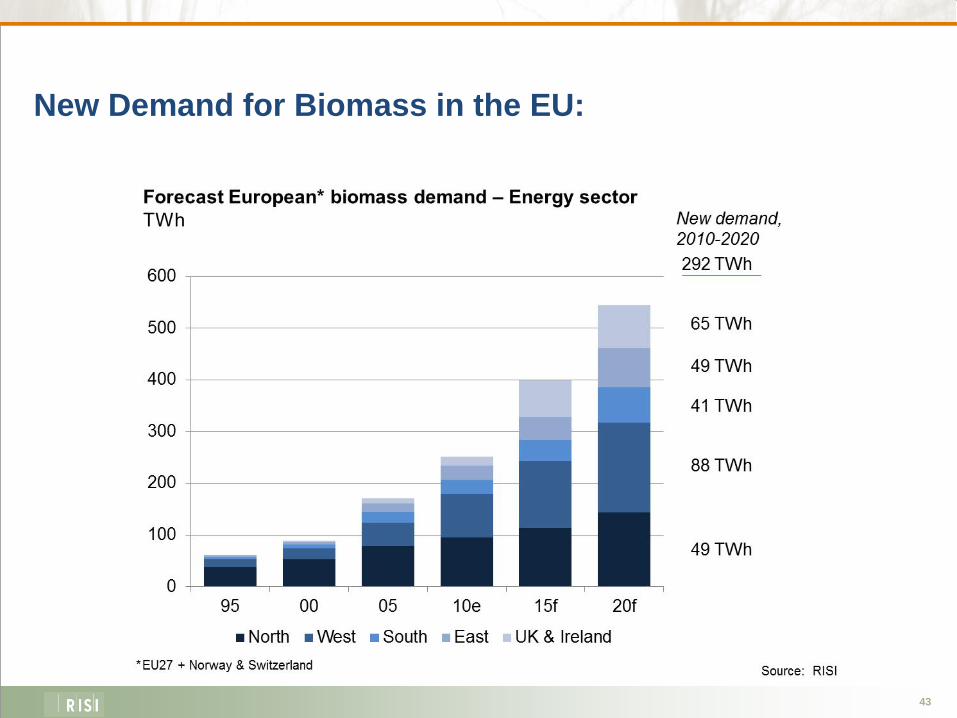
New Demand for Biomass in the EU:
44
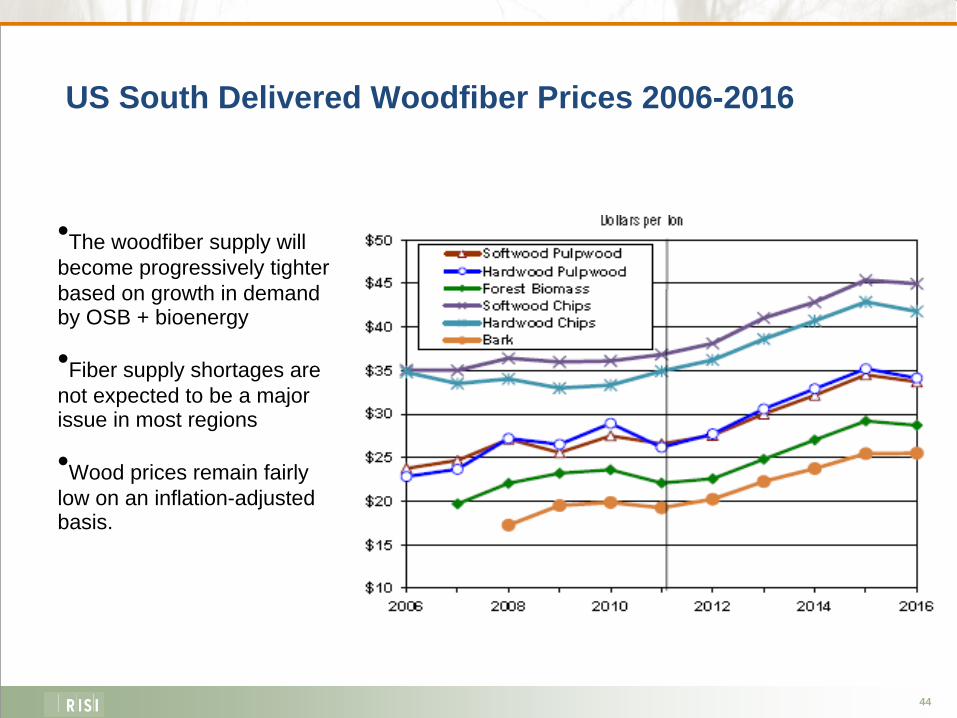
US South Delivered Woodfiber Prices 2006-2016
•The woodfiber supply will become progressively tighter based on growth in demand by OSB + bioenergy
•Fiber supply shortages are not expected to be a major issue in most regions
•Wood prices remain fairly low on an inflation-adjusted basis.

45
How does it all stack up? Low grade wood fiber demand across all industries.

46
Growth of Bioenergy Industries
•Woodfiber consumption by bioenergy industries is projected to more than double over the next five years
•RISI has reduced its forecasted capacity for biomass power generation by 22% compared to last year’s estimates
•Commercialization of cellulosic biofuels appears likely to occur within the next five years – still remains small

Biomass Thermal: Market Outlook
48
Q & A
V. Q & A - Seymour
Ask questions using the Questions Panel on the right side of your screen.
All questions and comments will be recorded and incorporated in the webinar summary report.
Also, please take a few moments to answer the survey questions after the conclusion of the webcast.
Biomass Thermal: Market Outlook
Interviews with key industry leaders (10+, also on iTunes Podcasts)
Factsheets (biomass background, job data, technology, etc.)
Presentation (comprehensive program information)
49
Other Resources
VI. Other Resources - Seymour
All Resources are available here: biomassthermal.org/resources

Biomass Thermal: Market Outlook
50
Upcoming Events
Biomass Research Institute Open House – February 1-2, 2012 in Wichita, Kansas
Join us for a two day open house celebrating the grand opening of our biomass energy demonstration facility!
Featuring guided tours and lessons from the experts
More information is available at: http://www.aesintl.net/bri/bri-open-house
VI. Upcoming Events - Seymour

Biomass Thermal: Market Outlook
51
Upcoming Events
Northeast Biomass Heating Expo –March 21 - 23, 2012 in Saratoga Springs, New York
Come see what Biomass Heat can do for your customers, your clients, and your community!
Increased space for exhibitors, registration open.
More information is available at: www.nebiomassheat.com
VI. Upcoming Events - Seymour
Biomass Thermal: Market Outlook
52
Upcoming Events
Building the Vision Conference and Expo –April 25-27, 2012 in Eau Claire, WI
Sponsored by Heating the Midwest with Renewable Biomass
More information is available at: www.heatingthemidwest.org
VI. Upcoming Events - Seymour
Biomass Thermal: Market Outlook
53
More Information
This Webinar will be available by Wednesday, Dec. 21.
Sign up to receive BTEC news at on our website.
Join BTEC for:
-- Frequent and timely regulatory, policy and market intelligence updates
-- Business Development opportunities and networking with other biomass leaders
-- Visibility as a supporter of the market’s growth
-- Discounts to nearly all major biomass industry events in the U.S.
For more info or to join, go to: www.biomassthermal.org/membership
VI. More Information - Seymour

Biomass Thermal: Market Outlook
54
Thank you!
BTEC Board of Directors
If you want to learn more about the biomass thermal industry, BTEC, or membership, visit
www.biomassthermal.org