Embed Size (px)
Citation preview
Aus dem Department für Veterinärwissenschaften der Tierärztlichen Fakultät der Ludwig-Maximilians-Universität München
Arbeit angefertigt unter der Leitung von Univ.Prof.Dr.med.vet. Eckard Wolf
Angefertigt an der Fakultät für Chemie und Pharmazie
Lehrstuhl für Pharmazeutische Biotechnologie der Ludwig-Maximilians-Universität
München
(Univ.-Prof.DI.Ernst Wagner)
Bioluminescence Imaging of Luciferase Transgenes in Tumor
Metastases Models
Inaugural-Dissertation
zur Erlangung der tiermedizinischen Doktorwürde
der Tierärztlichen Fakultät der
Ludwig-Maximilians-Universität München
von
Katarína Farkašová
aus
Bratislava
München 2011

Gedruckt mit der Genehmigung der Tierärztlichen Fakultät der Ludwig-Maximilians-Universität München
Dekan: Univ.-Prof. Dr. Braun
Berichterstatter: Univ.Prof.Dr.med.vet. Eckard Wolf
Korreferent:Prof.Dr.Dr.Rüdiger Wanke
Tag der Promotion: 30.07.2011

Meinen Eltern und meinem Bruder
„Probleme kann man niemals mit derselben Denkweise lösen,
durch die sie entstanden sind.“
Albert Einstein (1879-1955)

Table of contents
Contents
1. Introduction………………………………………………………………………….....1
1.1 Gene Delivery……………………………………………………………………………………1
1.2 Mouse tumor models…………………………………………………………………………..3
1.2.1 Syngeneic tumor models…………………………………………………………….4
1.2.2 Xenograft models…………………………………………………………………….4
1.2.3 Metastatic tumor models…………………………………………………………….5
1.3 Non invasive imaging………………………………………………………………………….5
1.3.1 Fluorescence imaging………………………………………………………………..6
1.3.2 Bioluminescence imaging……………………………………………………………7
1.4 Aim of the work………………………………………………………………………………….8
2. Material and Methods………………………………………………………………..10
2.1 Material…………………………………………………………………………………………..10
2.1.1 Bacterial culture………………………………………………………………………10
2.1.2 Molecular biology…………………………………………………………………….10
2.1.2.1 Vector amplification………………………………………………………10
2.1.2.2 Restriction enzymes……………………………………………………..11
2.1.3 Cell culture……………………………………………………………………………11
2.1.4 In vivo experiments………………………………………………………………….13
2.1.4.1 Plasmids………………………………………………………………….14
2.1.4.2 Staining…………………………………………………………………...14
2.1.4.3 Laboratory animals………………………………………………………15
2.1.4.4 Instruments……………………………………………………………….15
2.1.5 Software………………………………………………………………………………15
2.2 Methods………………………………………………………………………………………….16
2.2.1 Plasmid amplification………………………………………………………………..16
2.2.2 Cell culture……………………………………………………………………………16
2.2.3 Animal experiments………………………………………………………………….17
3. Results………………………………………………………………………………….24
3.1 Characterization of Neuro2a lenti Luc cells in a subcutaneous tumor
mouse model……………………………………………………………………………………24
3.1.1 Tumorigenicity of the Neuro2a lenti Luc cells…………………………………….24
3.1.2 Firefly luciferase signal stability in vivo……………………………………………25
3.2 Bioluminescence as tool for the characterization off different Neuro2a
cell lines in metastatic tumor mouse models……………………………………………..29
3.2.1 Neuro2a Luc+ cells in the intravenous metastatic tumor model………………..29

Table of contents
3.2.2 Accessibility of the Neuro2a Luc+ tumors for macromolecules………………..31
3.2.3 Neuro2a wild type cells: intravenous metastases tumor model………………..33
3.2.4 Neuro2a lenti Luc cells in the intravenous metastatic tumor model……………34
3.2.5 Neuro2a lenti Luc cells in a liver metastases model……………………………..37
3.3 Dual bioluminescence imaging as tool to monitor the success of non
viral gene delivery in metastatic tumor models…………………………………………..42
3.3.1 Membrane bound Gaussia Luciferase as a novel reporter gene for
gene delivery…………………………………………………………………………..42
3.3.2 Dual bioluminescence imaging in the intravenous Neuro2a lenti
Luc model……………………………………………………………………………..43
3.3.3 Dual bioluminescence imaging in the intrasplenic liver metastases
model…………………………………………………………………………………..44
3.4 Non viral gene delivery into wild type Neuro2a tumor metastases in
vivo……….……………………………………………………………………………………….45
3.4.1 Gene delivery into wild type tumor metastases in the intravenous
model…………………………………………………………………………………..45
3.4.2 Gene delivery into wild type tumor metastases in the intrasplenic
liver metastases model………………………………………………………………46
3.5 Establishment of a metastatic xenograft for gene delivery…………………………….48
3.5.1 Establishment of the LS174T lenti Luc cell line in an intrasplenic
liver metastases model………………………………………………………………48
4. Discussion……………………………………………………………………………...54
4.1 Intravenous metastases model………………………………………………………………54
4.2 Establishment of the Neuro2a lenti Luc cell line………………………………………….55
4.3 Metastatic tumor models using Neuro2a lenti Luc……………………………………….57
4.4 Dual bioluminescence imaging………………………………………………………………58
4.5 Non viral gene delivery into wild type tumor metastases……………………………….59
4.6 Establishment of a metastatic xenograft model for non viral gene
delivery…………………………………………………………………………………………….60
5. Summary………………………………………………………………………………...61
6. Zusammenfassung…………………………………………………………………….63
7. References………………………………………………………………………………65
8. Acknowledgement……………………………………………………………………..69
9. Curriculum vitae………………………………………………………………………..71

1
Chapter 1: Introduction
1. Introduction
1.1 Gene delivery
Gene therapy is based on the addition of genes into the genome of the cells of
interest to correct genetic defects or mediate the expression of specific proteins. To
make this possible, the gene of interest needs to be delivered into target cells using a
delivery system. Friedmann and Roblin describe already in 1972 that gene therapy
could ameliorate some human genetic diseases in the future ([1]).
To date there are more than 1600 clinical trials based on gene therapy, most of them
for cancer diseases ( http://www.wiley.com//legacy/wileychi/genmed/clinical/).
Figure 1.1: Clinical trials based on gene therapy
(http://www.wiley.com//legacy/wileychi/genmed/clinical/)
The most common used vectors for clinical trials are viral vectors because of their
high transfection ability (http://www.wiley.com//legacy/wileychi/genmed/clinical/),

2
Chapter 1: Introduction
but serious concerns exist that their use can cause a strong immune response ([2],
[3]) or lead to insertional mutagenesis ([4]).
To overcome this problem, non viral gene delivery systems might be used.
Hydrodynamic delivery, where a large volume of a DNA solution is rapid injected into
the tail vein of a mouse, can lead to a transfection of approximately 30-40% of the
hepatocytes by a single injection ([5]). Because of the mechanism of the
hydrodynamic delivery no agent is needed to protect the DNA from degradation by
serum and extracellular nucleases. Alternatively non viral vector formulations can be
used as a kind of “transport vehicle” to the targeted cell.
Cationic lipids are amphiphilic structures which are able to self assemble into lamellar
vesicular structures. In aqueous solution their positively charged head-groups
condensate with the negatively charged nucleic acid and built spherical structure
which is protecting the nucleic acid from degradation ([6]). Cationic polymers show as
well the potential to condense nucleic acids. Though they also can cause
inflammatory response ([7]), there are actually many approaches to overcome these
([8], [9], [5]). Ruß et al ([10]) have synthesized a biodegradable polypropylenimine
dendrimer generation 3 modified with branched oligoethylenimine 800Da (G3-HD-
OEI) and applied it in vitro and in vivo. Is was shown that the G3HDOEI has an
advantageous biocompatibility profile compared to the non biodegradable carriers
linear polyethylenimine (LPEI) or branched polyethylenimine (BPEI). The improved
biophysical and biological properties of G3-HD-OEI make it a very attractive vector
for further in vivo experiments.
It has been shown that not only the carrier may cause immune response, but also the
plasmid DNA. Only one CpG-motif in the plasmid DNA can be sufficient to elicit an
inflammatory response, whereas CpG-free pDNA does not ([11], [12]). Novel CpG-
free plasmids were for this purpose cloned in our lab by Dr. Rudolf Haase and
optimized for a stable transgene expression by ideal promoter/enhancer
combinations (see PhD thesis Terese Magnusson, LMU).
3
Chapter 1: Introduction
1.2 Mouse tumor models
Comparative genome studies found that the DNA- sequence of humans and mice
show 85% similarity
(http://www.ornl.gov/sci/techresources/Human_Genome/faq/compgen.shtml). Mice
are a common species used for the investigation of potential drugs and recently a
Knock Out Mouse project was launched so that there is a database of information
that can be used for the development of novel therapeutic strategies
(http://www.knockoutmouse.org/). A retrospective evaluation of the knockout
phenotypes for the targets of the 100 best-selling drugs indicates that effects in these
murine models of human disease correlates well with clinical drug efficacy ([13]). In
cancer research, experimental tumors raised in mice are an important preclinical tool
for the screening of new substances before clinical testing. ([14]). There are different
ways of developing murine tumor models. One of them is genetic engineering
producing a transgenic mouse by the pronuclear injection of new genetic material into
a single cell of the mouse embryo or a knock out mouse by modifying embryonic
stem cells with a DNA construct containing DNA sequences homologous to the target
gene and injecting them into blastocysts ([15], [16]) These methods are time
consuming, high in cost, need well trained people and special equipment.
Nevertheless, they are used as cancer disease models ([17], [18], [19]).Carcinogen
induced tumor models are another possibility to create a tumor bearing mouse. They
have been proven to be useful especially for the study of chemoprevention agents
([20], [21]). Another method is to implant tumor material into the mice. It is lower in
cost and easier to handle. Generally there are syngeneic mouse models, where the
mice bear tumors originating from their own species, or xenografts, where
immunosupressed mice bear tumors originating from humans. In both cases the
tumor can be inoculated on different sites. (reviewed by [14])

4
Chapter 1: Introduction
1.2.1 Syngeneic tumor models
One of the first syngeneic tumor models used for the research of anticancer agents
were the L1210 and P388 leukemias developed in 1948 resp. 1955 ([22], Dawe,C.J.
and Potter,M. Morphologic and biologic progression of a lymphoid neoplasm of the
mouse in vitro and in vivo, Am. J. Pathol., 33: 603, 1957.) Since then a lot of other
syngeneic tumor models in mice were established. An advantage of this tumor
models is that the host is fully immunocompetent, the tumor induction is mostly not
immunogenic (reviewed by [14]), the host is readily available and, because of the
long history of use, a strong baseline of drug response data is available ([23]). The
disadvantage of this model lies in its nature. Because the tumor cells are from murine
origin, thus expressing murine homologues of possible human targets making them
less suitable for targeted therapies.
1.2.2 Xenograft models
Subcutaneous xenogeneic models have been the mainstay of anticancer drug
development over the last 25 years, mostly because they are better predictors of
drug efficacy in human tumors. They are simple, reproducible and homogenous in
their tumor histology and growth rates and there are many human cell lines available
expressing a human target molecule opening the possibility of targeted drug and
gene delivery (reviewed by [14]). The disadvantage of this of these models is that the
stromal component is still rodent and the mice used for these models are
immunodeficient ([23]).
5
Chapter 1: Introduction
1.2.3 Metastatic tumor models
In subcutaneous tumors one has the opportunity to measure the tumor volume and
calculate a tumor growth delay (or inhibition) comparing a treated with a non treated
group. The big disadvantage of this tumor models is that the tumor is growing at an
unnatural site. Therefore metastatic tumor models have been developed implanting
the tumor cells via injecting them into the blood stream (intravenous or intracardiac
injection) as a disseminated tumor model ([24], [25]) or injecting them in the
orthotopic site were the tumor lines were derived from ([26], [27]). There are a few
disadvantages in this tumor model. First surgeries for orthotopic tumor setting are
often complex, and tumor growth and response is difficult to follow leading to the
point, that the survival is the only parameter being measurable. That is the reason
why animal experiments are often done by the conventional way of time-stacked
sacrifice of animals for ex vivo molecular-biological assays which causes high animal
numbers per experiment and does not allow us to follow the disease/treatment
development in real time. This problem can be, at least partially, overcome by
molecular imaging methods ([28], [29], [30]).
1.3 Non invasive imaging
1896 WC Roentgen described his “new kind of rays” ([31]) in Nature and discloses
the possibility of non invasive imaging in human and animals. A variety of other
methods have been established since his discovery. Based on classical X-Ray
imaging, computed X-Ray tomography (CT) has been developed. Another approach
is the magnetic resonance imaging (MRI) based on the magnetic properties of
unpaired nuclear spins. Although the main field of use of these techniques is the
6
Chapter 1: Introduction
anatomic imaging when combined with contrast agents or with other imaging
techniques like positron emission tomography (PET) or single photon emission
computed tomography (SPECT), they can be used for molecular imaging too ([32],
[33], [34]).
Molecular imaging has been developed to follow different processes like
biodistribution ([35]), enzyme activity ([36]), inflammation, tumor spreading and
progress etc. at the cellular level. At sites of diseases, normal gene expression is
alterated to distinct pathobiochemical expression ( [37]). Following gene expression
(for example by monitoring a specific reporter gene) is one approach where imaging
methods are valuable.
1.3.1 Fluorescence imaging
For fluorescence imaging a fluorochrome is excited, by e.g. laser diodes, operating at
a frequency close to that of the detected light and the emitted fluorescent light is than
detected by a CCD camera. GFP, a protein from the jellyfish Aqueorea victoria, is
one of the best known proteins used for this purpose. Wild type GFP emits blue light
which is a disadvantage with regard to autofluorescence of the non targeted tissue,
and also the fluorescence signal of green emitting enhanced GFP (EGFP) can
overlap with autofluorescence of tissue. The use of the near infra red fluoroprobes
(like Cy5.5 or Cy7, Alexa 700 or 750) is therefore the better option because the
absorption of haemoglobin (a major absorber of visible light) absorbs light at lower
wavelength. Zintchenko et al could show that near-intrared emitting CdTe quantum
dots as labeling device for macromolecular drugs can be used for effective screening
of biodistribution events and also could be, incorporated into quantoplexes, a
promising assist in the development and improvement of new macromolecular drug
formulations ([35]).
7
Chapter 1: Introduction
1.3.2 Bioluminescence imaging
Bioluminescence refers to the enzymatic generation of visible light by living
organisms. Light photons at wavelengths between 400 and 1000 nm can be
converted using a CCD camera into an electronic signal. These signal intensities are
correlating with the intensity of the incoming photons, and digitization of these data
allowing us further processing of these data. Luciferases are enzymes often used as
transgene/reporter gene for bioluminescence imaging. The most common used
luciferase is the Photinus pyralis luciferase from the North American firefly. This
enzyme catalyses the transformation of its substrate -luciferin ( -(−)-2-(6′-hydroxy-
2′-benzothiazolyl) thiazone-4-carboxylic acid) into oxyluciferin in an ATP-dependent
process, leading to the emission of light photons at a wavelength of about 560nm.
([38]). Investigators have used Firefly Luciferase for the drug development against
viral or bacterial diseases, ([39], [40], [41], reviewed by [38]) as well as for cancer
research, where it was used to stably transfect tumor cells, which were thereafter
inoculated, or as a reporter gene after intravenous injection, as a plasmid DNA
complexed with a polyplex ([42], [43], [44], [45], [46]). In the last few years another
luciferase has gained in interest for cancer research – the Gaussia Luciferase. Up to
date it is the smallest known (19.9 kDa) and naturally secreted luciferase from the
marine copepod Gaussia princeps. It is emitting light with a peak at 480nm and is
therefore more susceptible to tissue absorption and scattering. It does not require
ATP for the oxidation of its substrate coelenterazine. In contrast to Firefly Luciferase,
it has flash kinetics reaching the maximum of activity within the first 10 seconds after
addition of coelenterazine and drops over the course of 10 minutes significantly
([47]).
Tannous et al ([47]) could also show that the humanized Gaussia Luciferase has a
200-fold higher bioluminescent signal intensity than the humanized Renilla Luciferase
(Luciferase from the sea pansy Renilla reniformis, also using coelenterazine as
substrate) and a comparable intensity with that from the humanized form of Firefly
Luciferase in vivo.
8
Chapter 1: Introduction
1.4 Aim of the work
The aim of this work was to establish a liver tumor metastases model in mice
(syngeneic as well as xenogeneic), using luciferase as reporter gene, which could be
used in further experiments for the development of novel defined and fully synthetic
non viral gene (or siRNA) vectors for the delivery into tumor tissue allowing cancer
treatment.
Amirkhosravi et al ([48]) described a syngeneic tumor model where A/J mice were
intravenously inoculated with Neuro2a, which led to the development of extensive
liver metastases. For the experiments in this thesis the Neuro2a metastases model
has been chosen, as our lab and others could show that subcutaneous Neuro2a
tumors are accessible for intravenously applied synthetic gene delivery vectors
([8],[64],[65]).
It is known for colorectal cancer that hepatic metastases are the major cause of
death in these patients ([49]). For this reason we aimed to establish in our lab a
xenogeneic liver metastasis model using the LS174T human colon carcinoma cell
line, where it is from the literature known that liver metastasis can be achieved by
injecting tumor cells into the spleen ([49], [50], [51]).
For the establishment of the metastatic tumor models we have stably transfected the
tumor cell lines with Firefly Luciferase with the help of a lentiviral vector as a tool so
that we had the possibility of tracking the cells via bioluminescent imaging. The tumor
models achieved this way had to be compared also to tumor metastases achieved by
inoculating wild type Neuro2a tumor cells, to ensure that their growth characteristics
and spreading pattern stays the same. Gaussia Luciferase had been used as
reporter gene to ensure that the tumor metastases are accessible for non viral gene
delivery, enabling dual imaging - real time bioluminescent imaging of the stably
Firefly Luciferase expressing tumor metastases and the via intravenous non viral
gene delivery transfected tumor metastases within the same animal (Fig.1.2).

9
Chapter 1: Introduction
lentiviral transduction
pFLuc
pGLuc
coelenterazine i.v.
d-Luciferin i.p.
d-Luciferin i.p.
Oxyluciferin
Oxyluciferin
coelenterazine i.v.
Coelenteramide
Coelenteramidelightlight
light
light
+ +
+
+
Fig. 1.2 Single and Dual Bioluminescent Imaging
A) The mouse was inoculated with wild type tumor cells and transfected intravenously with a polyplex containing a plasmid encoding either for Firefly Luciferase or for Gaussia Luciferase and was then injected for the bioluminescent imaging either with d-luciferin or with coelenterazine according to the type of luciferase used for the transfection
B) The mouse was inoculated with a stable Firefly Luciferase expressing cell line. Single bioluminescent imaging after d-luciferin injection is possible like in A). After intravenous transfection with a polyplex containing a plasmid encoding for Gaussia Luciferase, dual bioluminescent imaging is possible after intravenous injection of its substrate coelenterazine.
A
A
B
B
B
10
Chapter 2: Material and Methods
2. Material and Methods
2.1 Material
Materials were purchased / prepared as stated below
2.1.1 Bacterial culture
LB – medium - Bacto-Typton (AppliChem, Darmstadt,
Germany) 10g
- Yeast Extract (AppliChem, Darmstadt,
Germany) 5g
- NaCl (Merck Darmstadt, Germany) 5g
- ad 1L with aqua bidest
Zeocin Invitrogen (Karlsruhe, Germany)
2.1.2 Molecular biology
2.1.2.1 Vector amplification
EndoFree plasmid kit (giga) Qiagen (Hilden, Germany)
10x TBE electrophorese - Tris base (SIGMA-Aldrich, Steinheim, Germany)
buffer 108g
- Boric acid (Merck, Darmstadt, Germany) 55g
- ad 700mL with aqua bidest
- 0,5M EDTA (SIGMA-Aldrich, Steinheim, Germany)
40mL
- adjust with NaOH (VWR International, Darmstadt,
Germany) on pH 8
- ad 1L with aqua bidest

11
Chapter 2: Material and Methods
Agarose Invitrogen (Karlsruhe, Germany)
GelRed Nucleic Acid Stain BIOTREND Chemikalien (Köln, Germany)
DNA – Marker New England BioLabs (Ipswich, U.S.A.) / Promega
(Mannheim, Germany)
2.1.2.2 Restriction Enzymes
Nhe I New England BioLabs (Ipswich, U.S.A.) / Promega
(Mannheim, Germany)
Bgl II Promega
(Mannheim, Germany)
2.1.3 Cell culture
Murine Neuroblastoma LGC Standards (ATCC CCI – 131)
Neuro2a cells
Neuro2a Luc+ cells Neuro2a cells stably expressing Photinus pyralis
luciferase were constructed in our lab by Dr. Gelja
Maiwald (LMU)
Neuro2a lenti Luc cells Neuro2a cells stably expressing a fusion protein of
EGFP and Photinus pyralis luciferase were
constructed in our lab by Arzu Cengizeroglu (LMU)
by lentiviral transduction
12
Chapter 2: Material and Methods
LS174T CTP4 lenti Luc cells LS174T cells stably expressing a fusion protein of
EGFP and Photinus pyralis luciferase were
constructed in our lab by Arzu Cengizeroglu
(LMU) by lentiviral transduction
DMEM 1 g glucose - DMEM, 4,5g Glucose/L, with L-Glutamin without
NaHCO3 (Biochrom, Berlin, Germany) 10,15g
- NaHCO3 3,7g
- ad 1L with aqua bidest
GIBCO® RPMI Medium 1640 Invitrogen (Karlsruhe, Germany)
FBS Invitrogen (Karlsruhe, Germany)
L-alanyl-L-glutamine Biochrom (Berlin, Germany)
Cell culture flasks TPP (Trasadingen, Switzerland)
TE Biochrom (Berlin, Germany)
PBS - Phosphat buffered saline (Biochrom, Berlin,
Germany) 9,55g
- ad 1L with aqua bidest
13
Chapter 2: Material and Methods
2.1.4 In vivo experiments
HBG - Hepes (Biomol, Hamburg, Germany) 2,38g
- ad 300mL with aqua bidest
- correct with NaOH (VWR International, Darmstadt,
Germany) on pH 7,4
- Glucose-Monohydrat (Merck, Darmstadt,
Germany) 2,75g
- check pH, ad 500mL with aqua bidest
Luciferin Promega (Mannheim, Germany)
Coelenterazine native SYNCHEM OHG (Felsberg-Altenburg, Germany)
Isoflurane ® cp Pharma (Burgdorf, Germany)
Bepanthene ® Roche (Grenzach-Whylen, Germany)
Syringes Heiland (Hamburg, Germany)
Needles Heiland (Hamburg, Germany)
Rimadyl ® Pfizer (Germany)
Isotonic sodiumchloride B Braun Melsungen AG (Melsungen, Germany)
Solution
Monosyn® Easyslide Heiland (Hamburg, Germany)
G3HDOEI synthesized in our lab by Dr. Verena Ruß
([10])
Braunol® B Braun Melsungen AG (Melsungen, Germany)
14
Chapter 2: Material and Methods
2.1.4.1 Plasmids
pCpG hCMV EF1 Luc cloned in our lab by Dr. Rudolf Haase ([52])
pCpG hCMV EF1 extGLuc cloned in our lab by Dr. Rudolf Haase
2.1.4.2 Staining
Tissue – Tek Cryomold Sakura Finetek (Heppenheim, Germany)
Tissue – Tek O.C.T. Compound Sakura Finetek (Heppenheim, Germany)
Tissue – Tek Mega-Casette Sakura Finetek (Heppenheim, Germany)
Bovine Serum Albumin Sigma Aldrich (Hamburg, Germany)
Dako Pen Dako (Glostrup, Denmark)
VECTASHIELD® Mounting Biozol (Eching, Germany)
Media
Texas Red Dextran 70 000 MW Invitrogen (Karlsruhe, Germany)
FITC Dextran 2 000 000 MW Invitrogen (Karlsruhe, Germany)
CD31 rat anti mouse BD Pharmingen (Heidelberg, Germany)
Alexa 647 goat anti rat Invitrogen (Karlsruhe, Germany)
Goat serum Sigma Aldrich (Hamburg, Germany)
15
Chapter 2: Material and Methods
2.1.4.3 Laboratory animals
A/JOlaHsd (A/J) mice Harlan – Winkelmann (Borchen, Germany)
NMRI-nu (nu/nu) Janvier (Le Genest-St-Isle, France)
2.1.4.4 Instruments
IVIS Lumina Caliper Life Science (Rüsselheim, Germany)
Shaver Philishave C486 Philips (Hamburg, Germany)
Caliper Digi-Met Peisser (Gammertingen, Germany)
Leica CM 3050 S Leica Microsystems (Bensheim, Germany)
Leica EG 1150 H Leica Microsystems (Bensheim, Germany)
2.1.5 Software
Living Image 3.0 Caliper Life Science (Rüsselheim, Germany)
GraphPadPrism4 Graph Pad Software (San Diego, U.S.A.)

16
Chapter 2: Material and Methods
2.2 Methods
2.2.1 Plasmid amplification
From the permanent culture containing pGpG hCMV EF1 extGLuc a pre-culture was
made in 10mL LB-medium containing Zeocin (50µg/mL) by shaking it 6 hours at 37°C
and 280 rpm. There after the pre-culture was transferred into six shaking flasks
containing 500 mL LB-medium and Zeocin (50µg/mL) and shaked over night at 37°C
and 150rpm. The plasmid was than purified using the EndoFree plasmid kit (giga).
2.2.2 Cell culture
Maintenance of cultured cells
All cultured cells were grown at 37 °C in 5% CO2 humidified atmosphere. Neuro2a
wild type cells, Neuro2a Luc+ and Neuro2a lenti Luc cells were cultured in DMEM
(1g/L glucose) supplemented with 10% FCS and L-alanyl-L-glutamine (end
concentration 2mM). LS174T lenti Luc cells were cultured in GIBCO® RPMI Medium
1640 supplemented with 10% FCS.

17
Chapter 2: Material and Methods
2.2.3 Animal experiments
Animal experiments were performed according to guidelines of the German law of
protection of animal life and were approved by the local animal experiments ethical
committee. Mice were kept under specific pathogen free conditions in isolated
ventilated cages with 5 animals per cage. Cages were equipped with wood shaving
litter, a wooden rodent tunnel (except the mice were the tumors were injected into the
spleen), cellulose bedding and a mouse house. Autoclaved standard breeding chow
and water were provided ad libitum. A 12 h day/night cycle, 21° celsius room
temperature and 60% humidity were kept. Mice were allowed to adapt to the housing
conditions for at least one week before experiments were started.
Characterization of the subcutaneous tumor mouse model with Neuro2a lenti
Luc cells- kinetic measurements
A/J mice, female, 6 – 10 weeks old were used (n = 5 per group).
Neuro2a lenti Luc cells were grown in cell culture as described above, being kept in
antibiotic free medium prior to injection. To harvest the cells they were trypsinated,
washed three times with PBS and diluted in ice cooled PBS at a concentration of
106 cells per 150µL. One day prior to tumor cell injection the injection side was
shaved using a Philishave C486 shaver. 150µL of the cell suspension were injected
subcutaneously at the right flank of the mice. Tumor size was measured every
second day by caliper and determined as a*b*c (a = length, b = width, c = height).
Bioluminescence signal was measured every day by a CCD camera (IVIS Lumina).
Mice were anaesthetized by inhalation of isoflurane in oxygen (2.5% (v/v)) at a flow of
1L/min. Bepanthene® was put on the eyes to protect them. Thereafter 100µL luciferin
solution (c = 60mg/mL) were injected intraperitonealy and immediately
bioluminescence sequence measurement was performed. The sequence was
measured for 30 minutes with small binning and 5 seconds exposure time. Results
were evaluated using the Living Image 3.0 software.

18
Chapter 2: Material and Methods
Characterization and permeability of the intravenous tumor metastasis model
with Neuro2a Luc+ cells
A/J mice, female, 6 – 10 weeks old were used (n = 9 per group).
Tumor cells were grown in cell culture as described above, being kept in antibiotic
free medium prior to injection. To harvest the cells they were trypsinated, washed
three times with PBS and diluted in ice cooled PBS at a concentration of 106 cells per
150µL. 150µL of the cell suspension were injected intravenously. The weight of the
animals was measured every 2 to 3 days. Bioluminescence signal was measured 4
hours and 24 hours after tumor cell injection and than every 3 to 4 days by a CCD
camera (IVIS Lumina). For the measurement mice were anaesthetized by inhalation
of isoflurane in oxygen (2.5% (v/v)) at a flow of 1 L/min. Bepanthene® was put on the
eyes to protect them. Thereafter 100µL luciferin solution (c = 60mg/mL) was injected
intraperitonealy and was allowed to distribute 15 minutes prior to bioluminescent
measurement.
For the permeability study of the tumor metastases 6 of the 9 mice were injected 10
minutes before euthanasia with FITC Dextran and Texas Red Dextran and 1 minute
before euthanasia with Hoechst i.v.. After euthanasia the metastases were
harvested, imbed into Tissue Tek® and kept at -20° C. After cryosection of the tumor
metastases using the cryostat a CD31 staining was performed.
CD-31 Staining of the Neuro2a Luc+ tumor metastases for the accessibility
study
7µm cryosections of the tumor metastases were made and fixed in prechilled MeOH.
The remaining Tissue Tek was removed the sections were encircled with Dako Pen
and washed with PBS. The sections were first blocked with 1% BSA in PBS, than
blocked with 10% goat serum in PBS and incubated 1hour with rat anti mouse CD31.
After washing they were incubated for 1 hour with Alexa 647 goat anti rat, washed
and after drying in the dark covered with 1 drop Vectashield Mounting Media.

19
Chapter 2: Material and Methods
Characterization of the intravenous tumor metastasis model with Neuro2a wild
type cells
A/J mice, female, 6 – 10 weeks old were used (n = 10 per group).
Tumor cells were grown in cell culture as described above, being kept in antibiotic
free medium prior to injection. To harvest the cells they were trypsinated, washed
three times with PBS and diluted in ice cooled PBS at a concentration of 106 cells per
150µL. 150µL of the cell suspension were injected intravenously. The weight of the
animals was measured every 2 to 3 days.
Characterization of the intravenous tumor metastasis model with Neuro2a lenti
Luc cells
A/J mice, female, 6 – 10 weeks old were used (n = 6 per group).
Tumor cells were grown in cell culture as described above, being kept in antibiotic
free medium prior to injection. To harvest the cells they were trypsinated, washed
three times with PBS and diluted in ice cooled PBS at a concentration of 106 cells per
150µL. 150µL of the cell suspension were injected intravenously. The weight of the
animals was measured every 2 to 3 days. Bioluminescence signal was measured 4
hours and 24 hours after tumor cell injection and every 3 to 4 days by a CCD camera
(IVIS Lumina). For the measurement mice were anaesthetized by inhalation of
isoflurane in oxygen (2.5% (v/v)) at a flow of 1L/min. Bepanthene® was put on the
eyes to protect them. Thereafter 100 µL luciferin solution (c = 60mg/mL) was injected
intraperitonealy and was allowed to distribute 15 minutes prior to bioluminescent
measurement.

20
Chapter 2: Material and Methods
Establishment of a liver metastases model with Neuro2a lenti Luc cells
Intrasplenic tumor injection
A/J mice (n = 5) were shaved on the left lateral side of the abdomen behind the
costal arch one day prior to tumor injection. For tumor injection the mice were
anaesthetized by inhalation of isoflurane in oxygen (2.5% (v/v)) at a flow of 1L/min.
Bepanthene® was put on the eyes to protect them. Rimadyl® (5mg/kg) was injected
subcutaneously prior to tumor injection. The mouse was positioned on the right
lateral side. The shaved skin was first swabbed with ethanol, after it evaporated, the
skin was swabbed with braunol®. The skin was raised and a vertical cut (ca. 0,5cm)
throw the skin caudal to the costal arch was made. The muscle-layer and the
peritoneum were raised and another vertical cut (ca. 0,5cm) was made to open the
abdominal cavity. The lower part of the spleen was partially displaced out of the
abdomen and 1x10⁶ Neuro2a lenti Luc cells in 50µl PBS were slowly injected using a
27G needle. Using a cotton swab, gentle pressure was made on the injection site to
prevent cell reflux throw the injection channel and bleeding. The spleen was placed
back to the abdomen. The peritoneum and the muscle were sutured in one layer and
the skin in another layer using Monosyn® 5/0. The mice were separately put into
cages with gloves filled with hot water to keep them warm and to recover undisturbed
from the other mice from surgery. 24 and 48 hours after tumor injection the mice
were injected subcutaneously 5mg/kg Rimadyl®.
The mice were weight every two to three days after surgery and the behaviour and
wound healing was monitored. Bioluminescent imaging was performed as single
picture imaging at day 4 after tumor injection and as sequence imaging at day seven
to nine after tumor cell injection. For the bioluminescence imaging the mice were
anaesthetized by inhalation of isoflurane in oxygen (2.5% (v/v)) at a flow of 1
liter/min. Bepanthene® was put on the eyes to protect them. For the single picture
imaging the mice were injected 100µL luciferin solution (c = 60mg/mL)
intraperitonealy and was allowed to distribute 15 minutes prior to bioluminescent
measurement. For the sequence imaging were the mice placed into the IVIS Lumina
directly after intraperitoneal luciferin injection.

21
Chapter 2: Material and Methods
Dual bioluminescence imaging in the intravenous Neuro2a lenti Luc model
A/J mice (n = 7) were injected with 1x10⁶ Neuro2a lenti Luc cells intravenously. The
animals were imaged 15 minutes after intraperitoneal luciferin injection (300mg/kg) 8
days after tumor injection to ensure their tumor burden and 14 days after tumor
injection to localize the tumor metastasis of each animal. There after polyplexes
containing 2,5mg/kg body weight pCpGhCMV EF1 extGLuc and G3HDOEI (Ruß et
al) (w/w: 1:1), as a non viral vector, were injected intravenously. 24h and 48h after
polyplex injection the animals were imaged immediately after intravenous
colenterazine (4mg/kg) injection.
Dual bioluminescence imaging in the intrasplenic liver metastases model with
Neuro2a lenti Luc
A/J mice (n = 7) were injected with 1x10⁶ Neuro2a lenti Luc cells intravenously. The
animals were imaged 15 minutes after intraperitoneal luciferin injection (300mg/kg) 4
days after tumor injection to ensure their tumor burden. At day 6 after tumor injection
polyplexes containing 2,5mg/kg body weight pCpGhCMV EF1 extGLuc and
G3HDOEI (Ruß et al) (w/w: 1:1), as a non viral vector, were injected intravenously.
24h and 48h after polyplex injection the animals were imaged immediately after
intravenous colenterazine (4mg/kg) injection.
Gene delivery into Neuro2a wild type tumor metastases in the intravenous
model
A/J mice (n = 4) were injected with 1x10⁶ Neuro2a wild type cells intravenously.
13days after tumor injection polyplexes containing a CpG free plasmid (pCpG hCMV
EF1 Luc, 2,5mg/kg body weight) encoding for Firefly Luciferase as a reporter gene
([52]) and G3HDOEI (w/w: 1:1) as a non viral gene carrier were injected
intravenously. The animals were imaged 15 minutes after i.p. luciferin injection 24, 48
and 72 hours after polyplex injection.

22
Chapter 2: Material and Methods
Gene delivery into Neuro2a wild type tumor metastases in the intrasplenic liver
metastases model
A/J mice (n = 10) were injected with 1x10⁶ Neuro2a wild type cells into the spleen. At
day 7 after tumor injection polyplexes containing 2,5mg/kg body weight pCpGhCMV
EF1 extGLuc and G3HDOEI (Ruß et al) (w/w: 1/1), as a non viral vector, were
injected intravenously. 24h, 48h and 72h after polyplex injection the animals were
imaged immediately after intravenous colenterazine (4mg/kg) injection.
Establishment of the LS 174T lenti Luc cell line in an intrasplenic liver
metastasis model
NMRI-nude mice (n = 20) were injected with 7,5x10⁵ LS174T lenti Luc cells into the
spleen. For tumor injection the mice were anaesthetized by inhalation of isoflurane in
oxygen (2.5% (v/v)) at a flow of 1 L/min. Bepanthene® was put on the eyes to protect
them. Rimadyl® (5mg/kg) was injected subcutaneously prior to tumor injection. The
mouse was positioned on the right lateral side. The skin was first swabbed with
ethanol, after it evaporated, the skin was swabbed with braunol®. The skin was
raised and a vertical cut (ca. 0,5cm) throw the skin caudal to the costal arch was
made. The muscle-layer and the peritoneum were raised and another vertical cut (ca.
0,5cm) was made to open the abdominal cavity. The lower part of the spleen was
partially displaced out of the abdomen and the cell suspension was slowly injected
using a 27G needle. Using a cotton swab, gentle pressure was made on the injection
site to prevent cell reflux throw the injection channel and bleeding. The spleen was
placed back to the abdomen. The peritoneum and the muscle were sutured in one
layer and the skin in another layer using Monosyn® 5/0. The mice were separately
put into cages with gloves filled with hot water to keep them warm and to recover
undisturbed from the other mice from surgery. 24 and 48 hours after tumor injection
the mice were injected subcutaneously 5mg/kg Rimadyl®.
The mice were weight every two to three days after surgery and the behaviour and
wound healing was monitored. Bioluminescent imaging was performed as single

23
Chapter 2: Material and Methods
picture imaging at day 3 after tumor injection and as sequence imaging at day 6, 8
and 10 after tumor cell injection. For the bioluminescence imaging the mice were
anaesthetized by inhalation of isoflurane in oxygen (2.5% (v/v)) at a flow of 1
liter/min. Bepanthene® was put on the eyes to protect them. For the single picture
imaging the mice were injected 100µL luciferin solution (c = 60mg/mL)
intraperitonealy and was allowed to distribute 15 minutes prior to bioluminescent
measurement. For the sequence imaging the mice were placed into the IVIS Lumina
directly after intraperitoneal luciferin injection.
24
Chapter 3: Results
3. Results
3.1. Characterization of Neuro2a lenti Luc cells in a subcutaneous tumor
mouse model
3.1.1 Tumorigenicity of the Neuro2a lenti Luc cells
To prove the tumorigenicity of the Neuro2a lenti Luc cells, they were inoculated
subcutaneously into the flank of A/J mice.
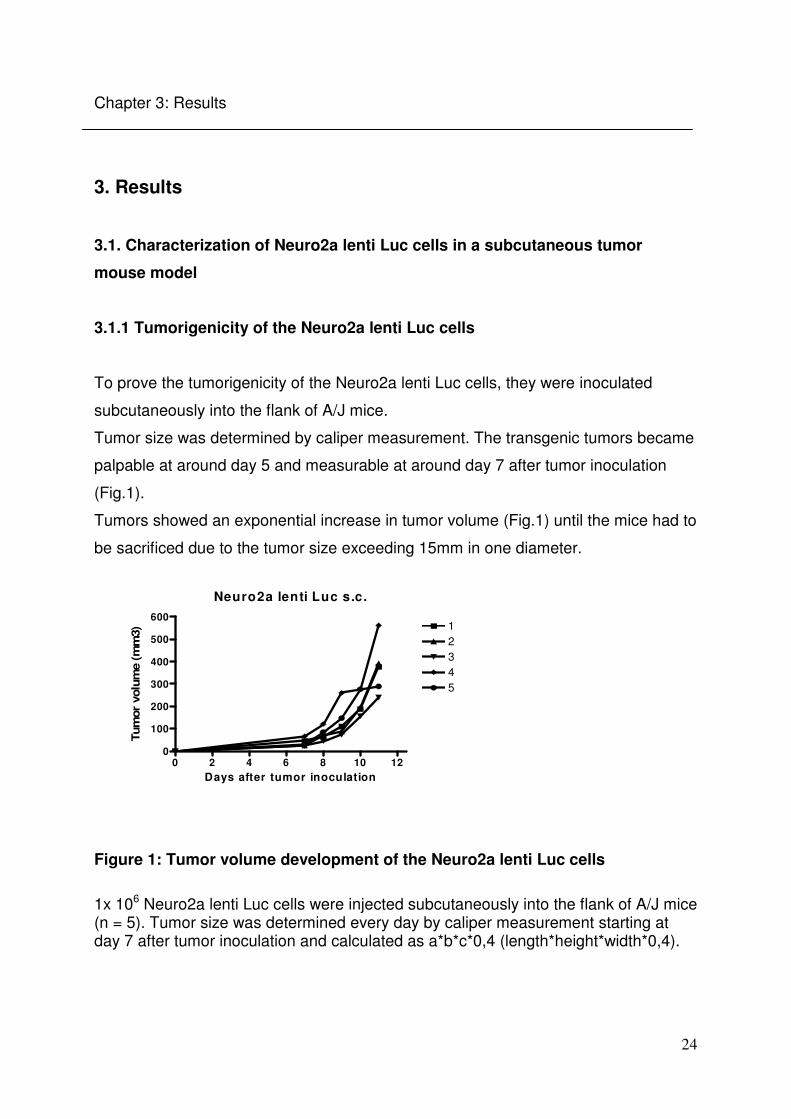
Tumor size was determined by caliper measurement. The transgenic tumors became
palpable at around day 5 and measurable at around day 7 after tumor inoculation
(Fig.1).
Tumors showed an exponential increase in tumor volume (Fig.1) until the mice had to
be sacrificed due to the tumor size exceeding 15mm in one diameter.
Neuro2a lenti Luc s.c.
0 2 4 6 8 10 120
100
200
300
400
500
60012345
Days after tumor inoculation
Tum
or
volu
me (
mm
3)
Figure 1: Tumor volume development of the Neuro2a lenti Luc cells
1x 10⁶ Neuro2a lenti Luc cells were injected subcutaneously into the flank of A/J mice (n = 5). Tumor size was determined every day by caliper measurement starting at day 7 after tumor inoculation and calculated as a*b*c*0,4 (length*height*width*0,4).
25
Chapter 3: Results
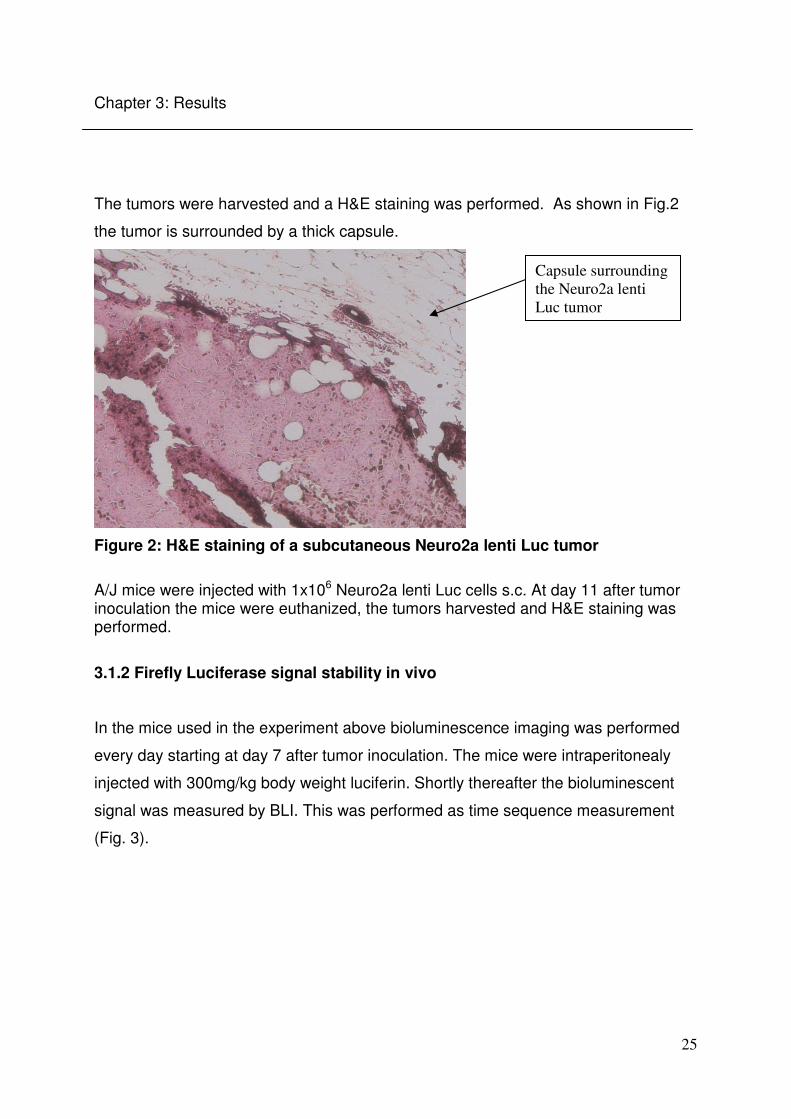
The tumors were harvested and a H&E staining was performed. As shown in Fig.2
the tumor is surrounded by a thick capsule.
Figure 2: H&E staining of a subcutaneous Neuro2a lenti Luc tumor
A/J mice were injected with 1x10⁶ Neuro2a lenti Luc cells s.c. At day 11 after tumor inoculation the mice were euthanized, the tumors harvested and H&E staining was performed.
3.1.2 Firefly Luciferase signal stability in vivo
In the mice used in the experiment above bioluminescence imaging was performed
every day starting at day 7 after tumor inoculation. The mice were intraperitonealy
injected with 300mg/kg body weight luciferin. Shortly thereafter the bioluminescent
signal was measured by BLI. This was performed as time sequence measurement
(Fig. 3).
Capsule surrounding
the Neuro2a lenti
Luc tumor

26
Chapter 3: Results
Sequence measurement mouse # 3
0 500 1000 15000.0
1.0×10¹⁰
2.0×10¹⁰
3.0×10¹⁰
4.0×10¹⁰
5.0×10¹⁰
78
9
10
11
Days aftertumorinoculation
Time (s)
To
tal
flu
x (
p/s
)
a)
b)
c)
Figure 3: Sequence measurement of an A/J mouse bearing a s.c. Neuro2a lenti Luc tumor
BLI of the mice from the experiment above (Fig. 1) was performed as a time sequence measurement. The mice were intraperitonealy injected with 300mg/kg body weight luciferin. Shortly thereafter a series consisting of 90 bioluminescence images with a delay of 15s from image to image was measured using the IVIS Lumina (b)). For the analyses a region of interest was set in the tumor area (c)) and the development of the bioluminescent signal, over days and during the measurement of each day, could be displayed for each animal (a)).
27
Chapter 3: Results
Neuro2a lenti Luc s.c.
0 100 200 300 4000.0
1.0×10¹⁰
2.0×10¹⁰
3.0×10¹⁰
4.0×10¹⁰
5.0×10¹⁰
r² = 0,9342
Mean Tumor volume
Me
an
Bio
lum
ine
sc
en
ce
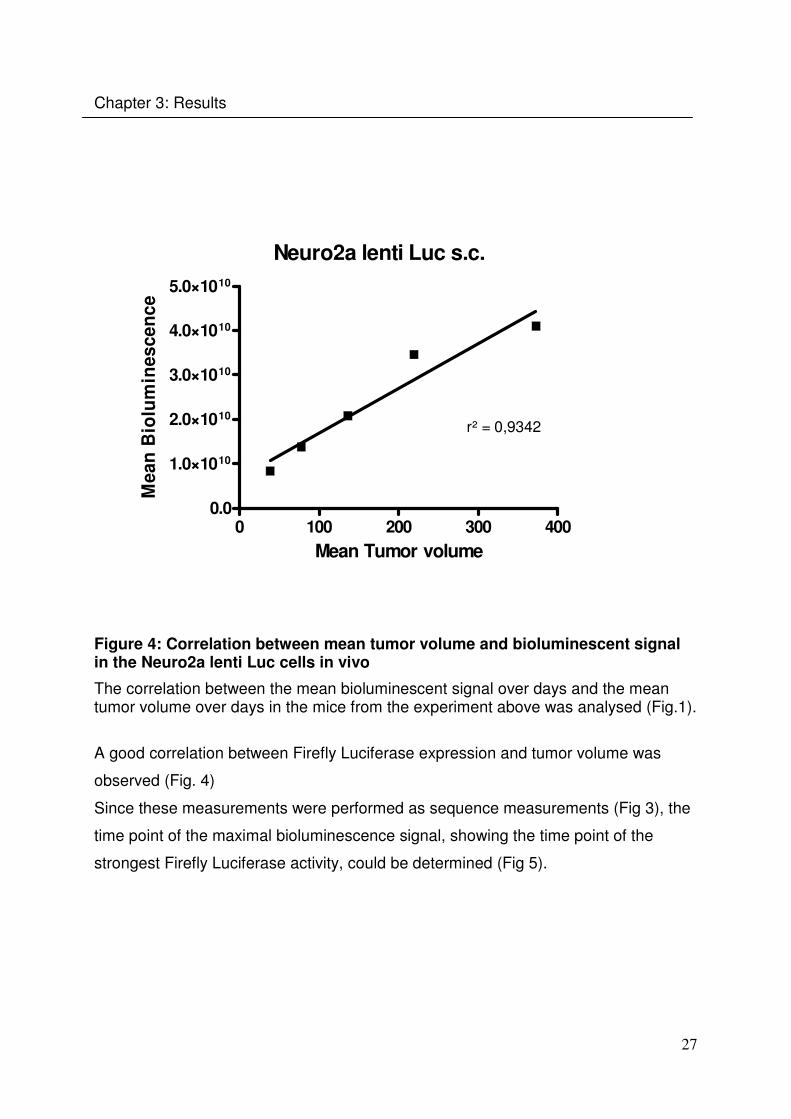
Figure 4: Correlation between mean tumor volume and bioluminescent signal in the Neuro2a lenti Luc cells in vivo
The correlation between the mean bioluminescent signal over days and the mean tumor volume over days in the mice from the experiment above was analysed (Fig.1).
A good correlation between Firefly Luciferase expression and tumor volume was
observed (Fig. 4)
Since these measurements were performed as sequence measurements (Fig 3), the
time point of the maximal bioluminescence signal, showing the time point of the
strongest Firefly Luciferase activity, could be determined (Fig 5).

28
Chapter 3: Results
Time point of max. bioluminescence
500 1000 1500 2000
7
8
9
10
11
Time after luciferin injection (s)
Day a
fter
Tum
or
inje
cti
on
Figure 5: Time point of the maximal bioluminescence signal
The animals (A/J mice n = 5) were injected with 300mg/kg luciferin i.p. and immediately laid into the IVIS Lumina. The bioluminescence measurement of the animals shown in figure 1 was performed as sequence measurement consisting of 90 pictures. The measurement was performed over 5 consecutive days starting at day 7 after s.c. tumor inoculation. The results are given as box plots. The boxes cover the range of 50% of the values above and below the mean. The mark in the box indicates the overall mean. The time point of maximal bioluminescence in this tumor model is between 1100 and
1600 seconds after intraperitoneal luciferin injection (Fig. 5).
29
Chapter 3: Results
3.2 Bioluminescence as tool for the characterization of different
Neuro2a cell lines in metastatic tumor mouse models
3.2.1 Neuro2a Luc+ cells in the intravenous metastatic tumor model
The tumorigenicity of this cell line has been shown before in the PhD thesis of Dr.
Gelja Maiwald (LMU). As a first step of the establishment of a syngenic metastatic
tumor model, the pattern of the tumor metastases (Fig. 7, 14) after intraveneous
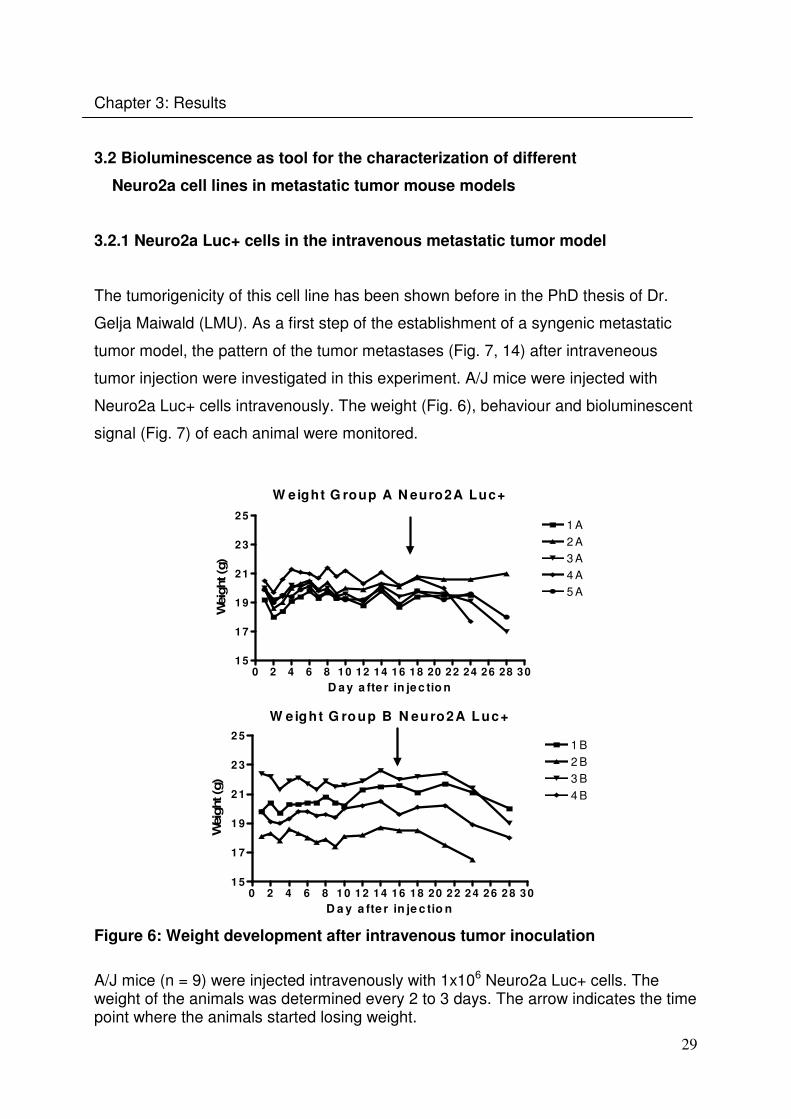
tumor injection were investigated in this experiment. A/J mice were injected with
Neuro2a Luc+ cells intravenously. The weight (Fig. 6), behaviour and bioluminescent
signal (Fig. 7) of each animal were monitored.
W eight G roup A N euro2A Luc+
0 2 4 6 8 10 12 14 16 18 20 22 24 26 28 3015
17
19
21
23
251 A
2 A
3 A
4 A
5 A
D a y a fte r in je c tio n
Weig
ht (g
)
W eight G roup B N euro2A Luc+
0 2 4 6 8 1 0 1 2 1 4 16 18 20 2 2 2 4 2 6 2 8 3 01 5
1 7
1 9
2 1
2 3
2 51 B
2 B
3 B
4 B
D a y a fte r in je c tio n
Weig
ht (g
)
Figure 6: Weight development after intravenous tumor inoculation
A/J mice (n = 9) were injected intravenously with 1x10⁶ Neuro2a Luc+ cells. The weight of the animals was determined every 2 to 3 days. The arrow indicates the time point where the animals started losing weight.

30
Chapter 3: Results
The animals started losing weight at around day 16 (Fig. 6). They started showing
clinical symptoms (depending on the location of the tumor metastases) like torticollis,
hind leg pareses, palpable and later visible tumor masses in the abdomen,
hyperventilation and horrent fur at around day 20 after tumor inoculation.
In the pathological examination tumor metastases were found in the liver and in the
lung. Interestingly, they could be found attached to the net in the abdominal cavity
and, in most of the animals, in the inguinal or axillary area too.
At the day of tumor inoculation the Neuro2a Luc+ could be visualised by
bioluminescent imaging at the lung-area (Fig.7). The first day after tumor inoculation
they could not be visualised anymore and starting at around day 4 the
bioluminescence could be measured again at the site of the body were the tumor
metastases started growing.
4h 24h 4d 7d 13d 15d
Figure 7:Development and distribution of Neuro2a Luc+ cells after i.v. injection
A/J mice (n = 9) were injected with 1x10⁶ Neuro2a Luc+ intravenously. 15 minutes after intraperitoneal injection of
300 mg/kg luciferin bioluminescent pictures were made 4h, 24h, 4d, 7d, 13d and 15d after tumor injection. Here the
bioluminescence pictures of a mouse are shown as a representative example.
31
Chapter 3: Results
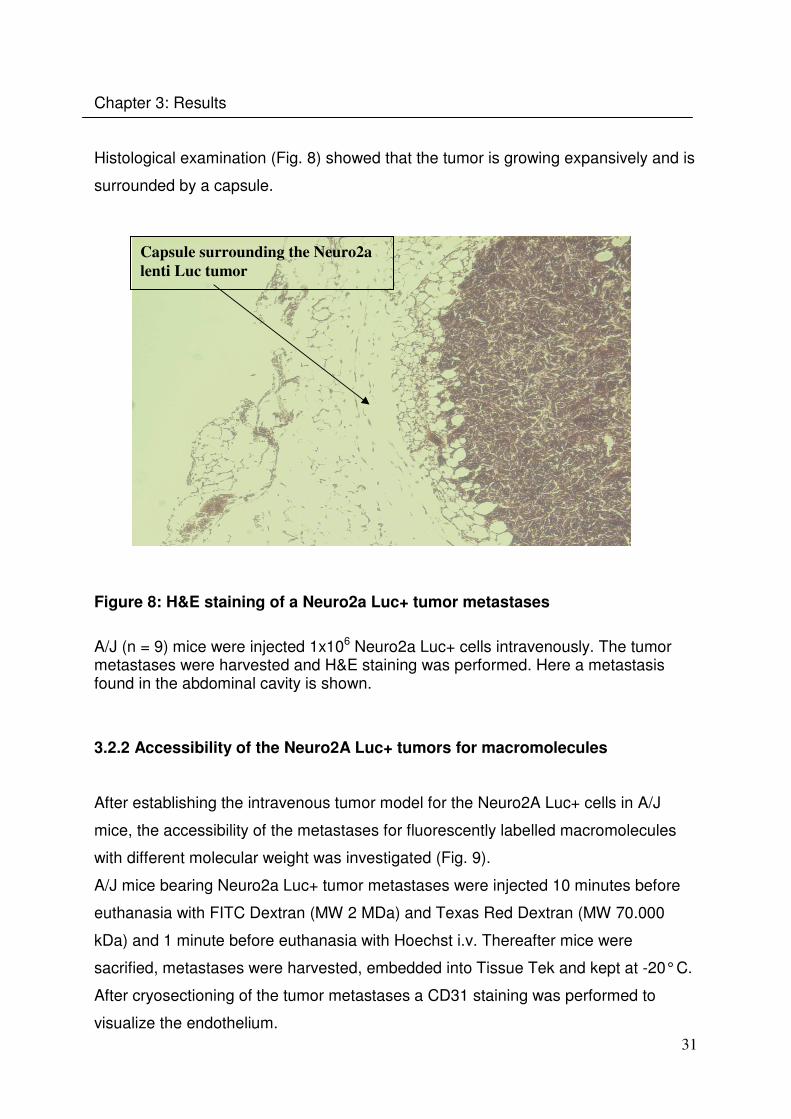
Histological examination (Fig. 8) showed that the tumor is growing expansively and is
surrounded by a capsule.
Figure 8: H&E staining of a Neuro2a Luc+ tumor metastases
A/J (n = 9) mice were injected 1x10⁶ Neuro2a Luc+ cells intravenously. The tumor metastases were harvested and H&E staining was performed. Here a metastasis found in the abdominal cavity is shown.
3.2.2 Accessibility of the Neuro2A Luc+ tumors for macromolecules
After establishing the intravenous tumor model for the Neuro2A Luc+ cells in A/J
mice, the accessibility of the metastases for fluorescently labelled macromolecules
with different molecular weight was investigated (Fig. 9).
A/J mice bearing Neuro2a Luc+ tumor metastases were injected 10 minutes before
euthanasia with FITC Dextran (MW 2 MDa) and Texas Red Dextran (MW 70.000
kDa) and 1 minute before euthanasia with Hoechst i.v. Thereafter mice were
sacrified, metastases were harvested, embedded into Tissue Tek and kept at -20° C.
After cryosectioning of the tumor metastases a CD31 staining was performed to
visualize the endothelium.
Capsule surrounding the Neuro2a
lenti Luc tumor

32
Chapter 3: Results
Hoechst
+ FITC
Hoechst +
Texas Red:
Merge
Hoechst
+ CD31:
Figure 9: Accessibility of Neuro2a Luc+ tumor metastases in the intravenous tumor model
A/J mice (n = 6) were intravenously injected with 1x10⁶ Neuro2a Luc+ cells. At day 14 after tumor inoculation FITC-dextran (green color in the upper left picture) and Texas Red-dextran (orange in the lower left picture) were injected 10 minutes before euthanasia and Hoechst (blue colored nuclei) 1 minute before euthanasia i.v.. The tumor metastases were harvested, cryosections and a CD31 staining (red color in the lower right picture) was performed. The white arrow points at the tumor site. The yellow dots in the upper right picture are showing the co-localisation of the different dyes.
As we show in Fig. 9, Hoechst permeates the tumor tissue. Texas Red Dextran (MW
70.000 kDa) can be found localized at the endothelium and seems not to permeate
deeper into the tumor tissue. FITC Dextran (MW 2 MDa) is localized more outside of
the tumor in the surrounding tissue, but some of it can be found localized also at the
tumor endothelium.
33
Chapter 3: Results
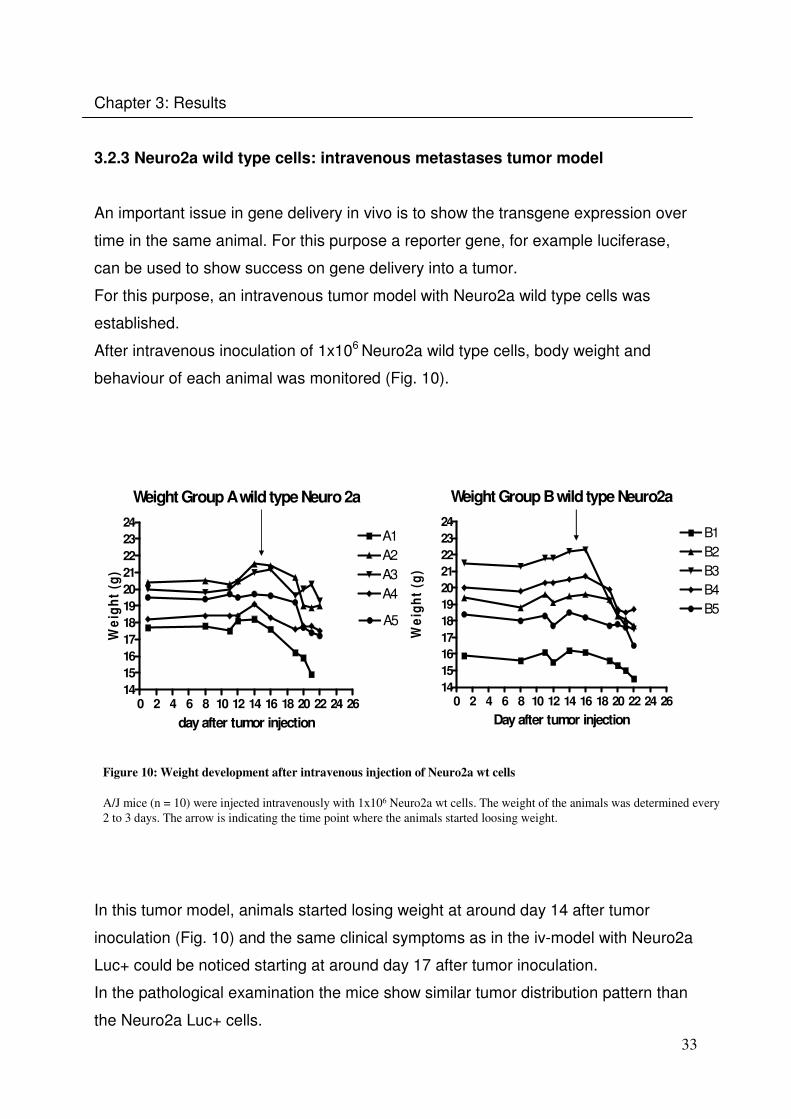
3.2.3 Neuro2a wild type cells: intravenous metastases tumor model
An important issue in gene delivery in vivo is to show the transgene expression over
time in the same animal. For this purpose a reporter gene, for example luciferase,
can be used to show success on gene delivery into a tumor.
For this purpose, an intravenous tumor model with Neuro2a wild type cells was
established.
After intravenous inoculation of 1x10⁶ Neuro2a wild type cells, body weight and
behaviour of each animal was monitored (Fig. 10).
Weight Group B wild type Neuro2a
0 2 4 6 8 10 12 14 16 18 20 22 24 2614
15
16
17
18
19
20
21
22
23
24B1B2B3B4B5
Day after tumor injection
We
igh
t (g
)
Weight Group A wild type Neuro 2a
0 2 4 6 8 10 12 14 16 18 20 22 24 2614
15
16
17
18
19
20
21
22
23
24A1A2A3A4
A5
day after tumor injection
We
igh
t (g
)
Figure 10: Weight development after intravenous injection of Neuro2a wt cells
A/J mice (n = 10) were injected intravenously with 1x10⁶ Neuro2a wt cells. The weight of the animals was determined every
2 to 3 days. The arrow is indicating the time point where the animals started loosing weight.
In this tumor model, animals started losing weight at around day 14 after tumor
inoculation (Fig. 10) and the same clinical symptoms as in the iv-model with Neuro2a
Luc+ could be noticed starting at around day 17 after tumor inoculation.
In the pathological examination the mice show similar tumor distribution pattern than
the Neuro2a Luc+ cells.

34
Chapter 3: Results
Tumor metastases were found in the liver, in the lung, attached to the net in the
abdominal cavity and, in most of the animals, in the inguinal or axillary area.
Histological examination showed that the tumor metastases were well vascularised
(Fig. 11).
Figure 11: H&E staining of a Neuro2a wt tumor metastasis in the intravenous tumor model
A/J (n = 9) mice were injected with 1x10⁶ Neuro2a wild type cells intravenously. The tumor metastases were harvested and H&E staining was performed. 3.2.4 Neuro2a lenti Luc cells in the intravenous metastatic tumor model
In a subcutaneous tumor model using Neuro2a Luc+ cells, high day to day variations
in the bioluminescent imaging signal were found (Dr. Maiwald, PhD thesis). To
investigate if Neuro2a cells marked with a lentiviral Luc encoding vector give more
stable BLI signals, A/J mice have been injected intravenously with Neuro2a lenti Luc
cells. The weight, behaviour and bioluminescent signal of each animal were
monitored (Fig. 12).
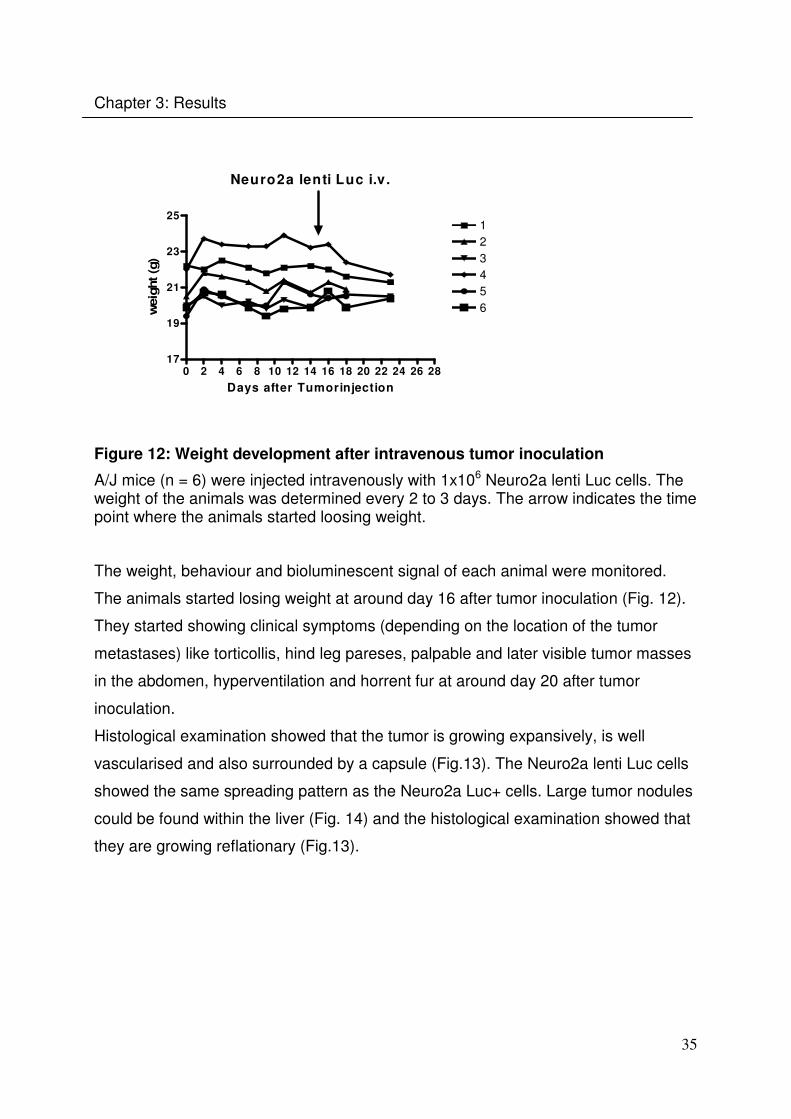
35
Chapter 3: Results
Neuro2a lenti Luc i.v.
0 2 4 6 8 10 12 14 16 18 20 22 24 26 2817
19
21
23
25123456
Days after Tumorinjection
weig
ht (g
)
Figure 12: Weight development after intravenous tumor inoculation
A/J mice (n = 6) were injected intravenously with 1x10⁶ Neuro2a lenti Luc cells. The weight of the animals was determined every 2 to 3 days. The arrow indicates the time point where the animals started loosing weight.
The weight, behaviour and bioluminescent signal of each animal were monitored.
The animals started losing weight at around day 16 after tumor inoculation (Fig. 12).
They started showing clinical symptoms (depending on the location of the tumor
metastases) like torticollis, hind leg pareses, palpable and later visible tumor masses
in the abdomen, hyperventilation and horrent fur at around day 20 after tumor
inoculation.
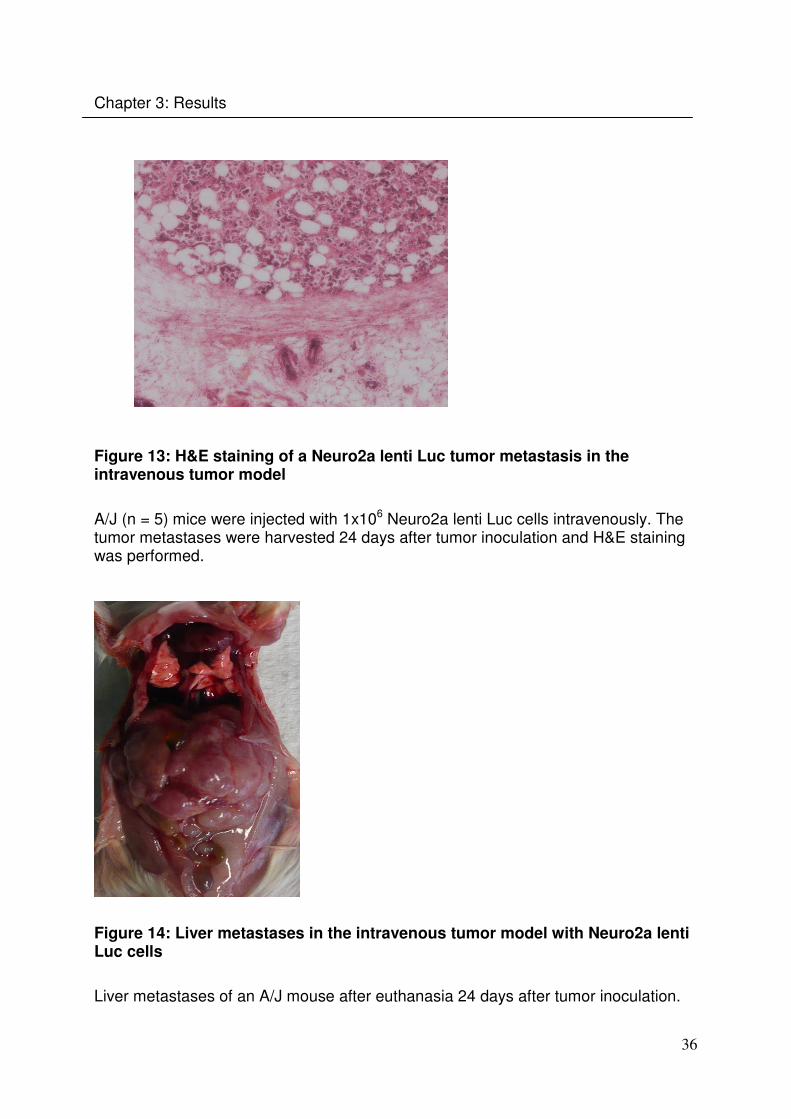
Histological examination showed that the tumor is growing expansively, is well
vascularised and also surrounded by a capsule (Fig.13). The Neuro2a lenti Luc cells
showed the same spreading pattern as the Neuro2a Luc+ cells. Large tumor nodules
could be found within the liver (Fig. 14) and the histological examination showed that
they are growing reflationary (Fig.13).
36
Chapter 3: Results
Figure 13: H&E staining of a Neuro2a lenti Luc tumor metastasis in the intravenous tumor model
A/J (n = 5) mice were injected with 1x10⁶ Neuro2a lenti Luc cells intravenously. The tumor metastases were harvested 24 days after tumor inoculation and H&E staining was performed.
Figure 14: Liver metastases in the intravenous tumor model with Neuro2a lenti Luc cells
Liver metastases of an A/J mouse after euthanasia 24 days after tumor inoculation.

37
Chapter 3: Results
3.2.5 Neuro2a lenti Luc cells in a liver metastases model
A so far not solved issue in cancer therapy is the successful treatment of metastases.
In the previous tumor models, the tumor cells were injected directly into the blood
stream, so they did not need to change their properties to disseminate from a primary
tumor ([53]). To establish a tumor model, where the tumor cells can infiltrate the liver,
Neuro2a lenti Luc cells were inoculated into the spleen, similar as it has been
described for colon carcinoma ([49], [50], [51]).
The weights (Fig.15), behaviour and bioluminescent signal (Fig. 16) of animals were
monitored.
Neuro2a lenti Luc i.s. - weight
0 2 4 6 8 1017
18
19
20
21
22
23
2412345
day after tumor injection
We
igh
t (g
)
Figure 15: Weight development after intrasplenic tumor inoculation
A/J mice (n = 5) were injected with1x106 Neuro2a lenti Luc cells into the spleen. The weight of the individual animals was determined every 2 to 3 days.
38
Chapter 3: Results
The animals started loosing weight at around day 7 after tumor inoculation (Fig. 15).
At around day 9 after tumor inoculation masses in the upper part of the abdominal
cavity became visible. At around day 10 after tumor inoculation we could observe the
animals to arch the back, to walk more with caution and unwillingly stretching the
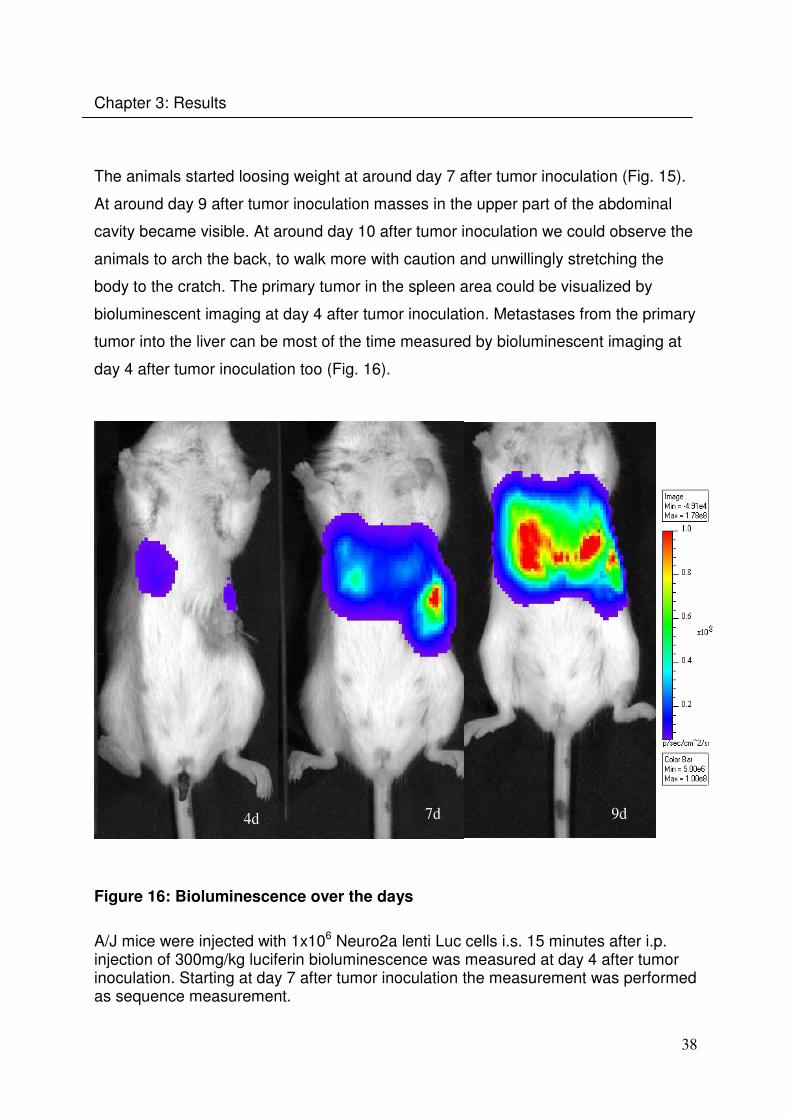
body to the cratch. The primary tumor in the spleen area could be visualized by
bioluminescent imaging at day 4 after tumor inoculation. Metastases from the primary
tumor into the liver can be most of the time measured by bioluminescent imaging at
day 4 after tumor inoculation too (Fig. 16).
4d 7d 9d
Figure 16: Bioluminescence over the days
A/J mice were injected with 1x10⁶ Neuro2a lenti Luc cells i.s. 15 minutes after i.p. injection of 300mg/kg luciferin bioluminescence was measured at day 4 after tumor inoculation. Starting at day 7 after tumor inoculation the measurement was performed as sequence measurement.

39
Chapter 3: Results
Time point of maximal bioluminescence
0 500 1000 1500 2000
7
8
9
Time after luciferin injection (s)
Day a
fter
tum
or
inje
cti
on
Figure 17: Time point of maximal bioluminescence in the intrasplenic liver metastases tumor model
Tumor bearing A/J mice (n = 5) were injected with 300mg/kg luciferin i.p. and immediately laid into the IVIS Lumina. The bioluminescence measurement of the animals was performed as sequence measurement consisting of 90 pictures. The measurement was performed over 3 consecutive days starting at day 7 after tumor inoculation. The results are given as box plots. The boxes cover the range of 50% of the values above and below the mean. The mark in the box indicates the overall mean.
The time point of maximal bioluminescence in this tumor model was between 750 to
1150 seconds after intra peritoneal luciferin injection indicating that the best time
point for the measurement of the Firefly Luciferase expression after luciferase knock
down mediated by a non viral vector lies in this interval (Fig. 17)
The Bioluminescent Imaging signal was increasing over time between day 7 and 9
after tumor inoculation (Fig. 18).

40
Chapter 3: Results
Bioluminescence over days -Neuro2a lenti Luc is
6 7 8 9 100.0
5.0×1009
1.0×10¹⁰
1.5×10¹⁰
2.0×10¹⁰
2.5×10¹⁰
3.0×10¹⁰
3.5×10¹⁰
mouse 1mouse 2mouse 3mouse 4mouse 5
days after tumor injection
me
an t
ota
l fl
ux
(p
/s)
Figure 18: Bioluminescence over days in the intrasplenic liver metastases tumor model with Neuro2a lenti Luc
Tumor bearing A/J mice (n = 5) were injected with 300mg/kg luciferin i.p. and immediately laid into the IVIS Lumina. The bioluminescence measurement of the animals was performed as sequence measurement consisting of 90 pictures (mean value given in the graph). The measurement was performed over 3 consecutive days starting at day 7 after tumor inoculation. The pathological examination of the animals showed a primary tumor on the injection
site in the spleen and a liver which was full with metastases (Fig. 19). No metastases
were found in the abdominal cavity or lymph nodes. Small tumor nodules all over the
liver were found in comparison to the larger nodules found in the i.v. model (Fig. 14).
There are differences also in the histology of the liver metastases of both models. In
the intrasplenic injected one are the tumor nodules not growing expansively anymore,
they are disseminated all over the liver tissue (Fig. 20).
41
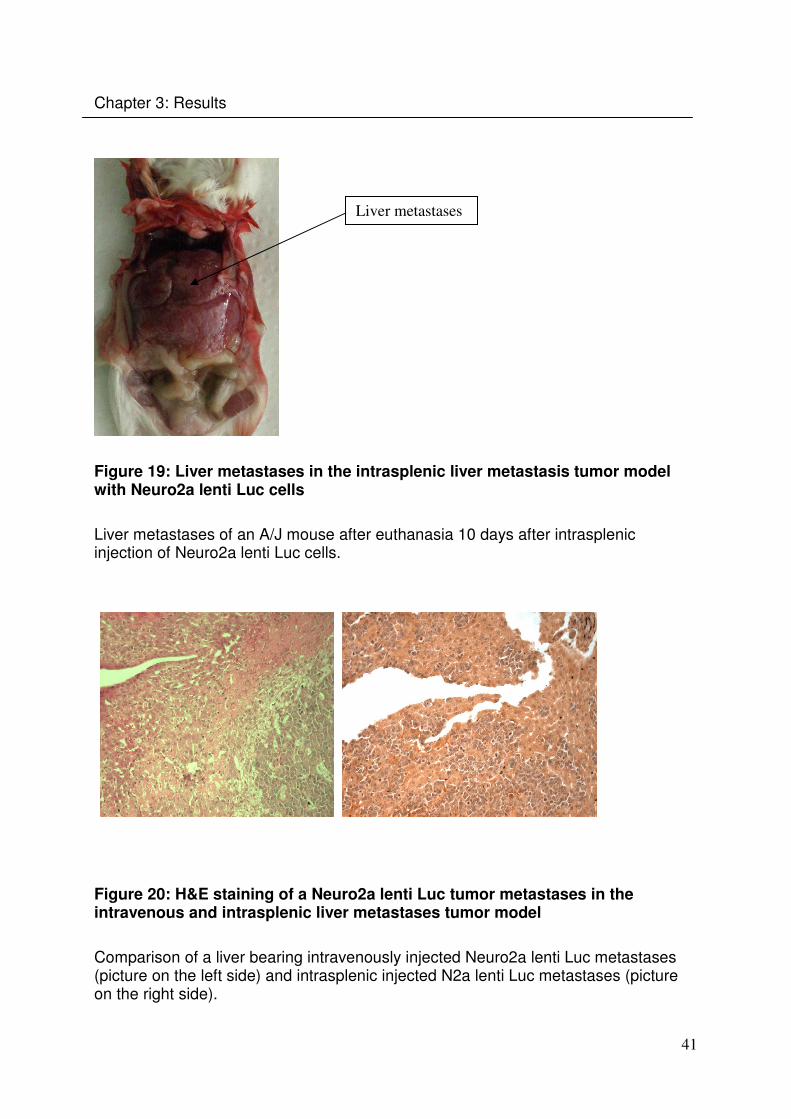
Chapter 3: Results
Figure 19: Liver metastases in the intrasplenic liver metastasis tumor model with Neuro2a lenti Luc cells
Liver metastases of an A/J mouse after euthanasia 10 days after intrasplenic injection of Neuro2a lenti Luc cells.
Figure 20: H&E staining of a Neuro2a lenti Luc tumor metastases in the intravenous and intrasplenic liver metastases tumor model
Comparison of a liver bearing intravenously injected Neuro2a lenti Luc metastases (picture on the left side) and intrasplenic injected N2a lenti Luc metastases (picture on the right side).
Liver metastases
42
Chapter 3: Results
3.3. Dual bioluminescence imaging as tool to monitor the success of non viral
gene delivery in metastatic tumor models
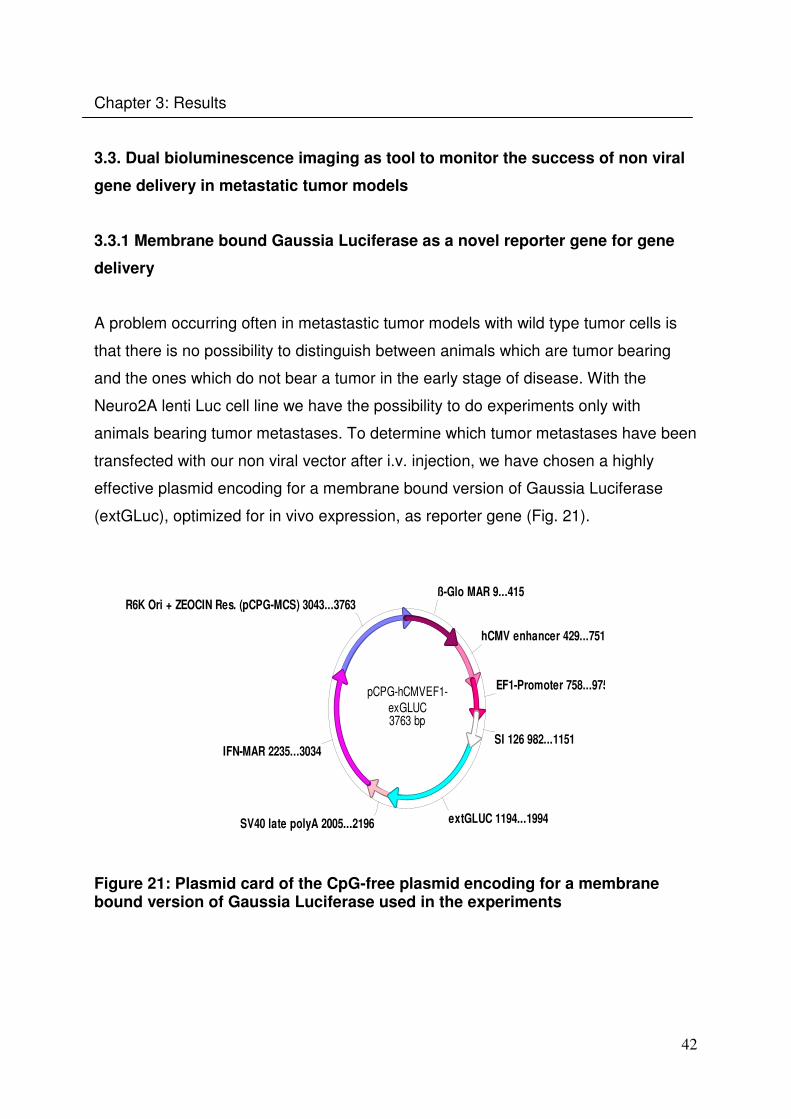
3.3.1 Membrane bound Gaussia Luciferase as a novel reporter gene for gene
delivery
A problem occurring often in metastastic tumor models with wild type tumor cells is
that there is no possibility to distinguish between animals which are tumor bearing
and the ones which do not bear a tumor in the early stage of disease. With the
Neuro2A lenti Luc cell line we have the possibility to do experiments only with
animals bearing tumor metastases. To determine which tumor metastases have been
transfected with our non viral vector after i.v. injection, we have chosen a highly
effective plasmid encoding for a membrane bound version of Gaussia Luciferase
(extGLuc), optimized for in vivo expression, as reporter gene (Fig. 21).
pCPG-hCMVEF1-exGLUC3763 bp
R6K Ori + ZEOCIN Res. (pCPG-MCS) 3043...3763
SV40 late polyA 2005...2196
EF1-Promoter 758...975
SI 126 982...1151
hCMV enhancer 429...751
IFN-MAR 2235...3034
ß-Glo MAR 9...415
extGLUC 1194...1994
Figure 21: Plasmid card of the CpG-free plasmid encoding for a membrane bound version of Gaussia Luciferase used in the experiments

43
Chapter 3: Results
3.3.2 Dual bioluminescence imaging in the intravenous Neuro2a lenti Luc
model
To monitor the ability to transfect disseminated metastases after systemic vector
application, A/J mice were inoculated with Neuro2a lenti Luc cells intravenously. The
animals were imaged 15 minutes after intraperitoneal luciferin injection to localize the
tumor metastases at day 8 and 14 after tumor inoculation (Fig. 22). Thereafter
polyplexes containing pCpGhCMV EF1 extGLuc and G3HDOEI ([10]), as a non viral
vector, were injected intravenously. At 24h and 48h after polyplex injection the
animals were imaged immediately after intravenous coelenterazine injection (Fig. 22).
Firefly Gaussia
24h
48h
Figure 22: Dual bioluminescence imaging in the intravenous Neuro2a lenti Luc model
A/J mice (n = 7) were injected with 1x10⁶ Neuro2a lenti Luc cells intravenously. The mice were imaged 15 minutes after intraperitoneal luciferin (300mg/kg) injection 8 days after tumor inoculation to ensure their tumor burden and 14 days after tumor inoculation to localize the tumor metastases of each animal. 14 days after tumor inoculation polyplexes containing pCpGhCMV EF1 extGLuc and G3HDOEI ([10]), as a non viral vector, were injected intravenously. 24h and 48h after polyplex injection the animals were imaged immediately after intravenous coelenterazine (4mg/kg) injection.

44
Chapter 3: Results
In all animals, we observed a more or less strong reporter gene expression through
bioluminescent imaging indicating that the tumor metastases are well accessible for
our non viral gene delivery system.
3.3.3 Dual bioluminescence imaging in the intrasplenic Neuro2a liver
metastases model
To prove the ability of non viral gene delivery in this model, we injected A/J mice
(n = 6) 1x10⁶ Neuro2a lenti Luc cells into the spleen. The animals were imaged 15
minutes after intraperitoneal luciferin injection at day 4 after tumor inoculation to
monitor tumor burden (Fig. 23). At day 6 after tumor inoculation they have been
injected polyplexes containing pCpGhCMV EF1 extGLuc and G3HDOEI ([10]), as a
non viral vector, intravenously. 24h and 48h after polyplex injection the animals were
imaged immediately after intravenous coelenterazine injection (Fig. 23).
Firefly Gaussia
24h
48h
Figure 23: Dual bioluminescence imaging in the intrasplenic liver metastases model
A/J mice (n = 6) were injected with 1x10⁶ Neuro2a lenti Luc cells into the spleen. The mice were imaged 15 minutes after intraperitoneal luciferin (300mg/kg) injection 4 days after tumor inoculation to ensure their tumor burden. 6 days after tumor inoculation polyplexes containing pCpGhCMV EF1 extGLuc and G3HDOEI ([10]) as a non viral vector, were injected intravenously. 24h and 48h after polyplex injection the animals were imaged immediately after intravenous coelenterazine (4mg/kg) injection.

45
Chapter 3: Results
In all animals, we observed a more or less strong reporter gene expression through
bioluminescent imaging indicating that the tumor metastases are well reachable for
non viral gene delivery.
3.4 Non viral gene delivery into wild type Neuro2a tumor metastases in vivo
3.4.1 Gene delivery into wild type tumor metastases in the intravenous model
To prove the ability to transfect the Neuro2a wild type tumor metastases in the
intravenous model, tumor bearing A/J mice were injected with polyplexes containing
a CpG free plasmid (pCpG hCMV EF1 Luc) encoding for Firefly Luciferase as a
reporter gene ([52]) and G3HDOEI as a non viral gene carrier 13 days after
intravenous tumor inoculation. The animals were imaged 15 minutes after i.p.
luciferin injection. Here the bioluminescent pictures of a mouse are shown as a
representative example (Fig. 24).
24h 48h 72h
Figure 24: Gene delivery into wild type tumor metastases in the intravenous
model
A/J mice (n = 4) were injected with 1x10⁶ Neuro2a wild type cells intravenously. 13 days after tumor inoculation polyplexes containing a CpG free plasmid (pCpG hCMV EF1 Luc) encoding for Firefly Luciferase as a reporter gene ([52]) and G3HDOEI as a non viral gene carrier were injected intravenously. The animals were imaged 15 minutes after i.p. luciferin injection (300mg/kg) 24, 48 and 72 hours after polyplex injection.
46
Chapter 3: Results
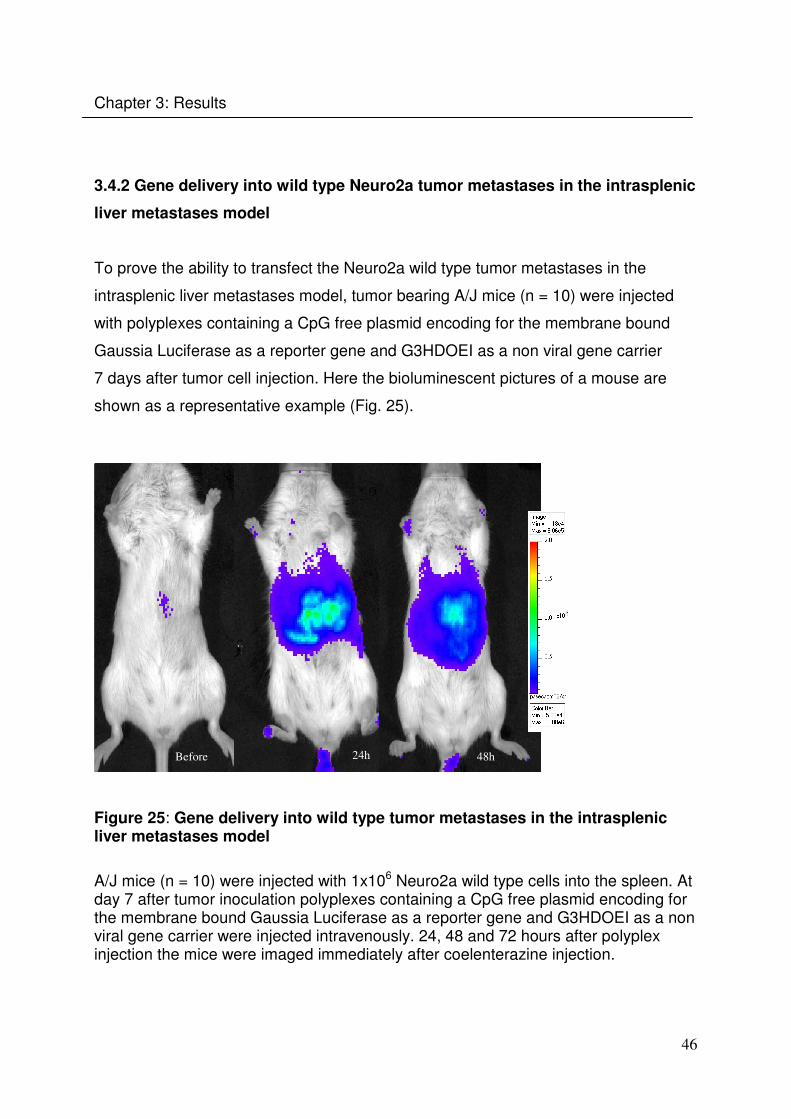
3.4.2 Gene delivery into wild type Neuro2a tumor metastases in the intrasplenic
liver metastases model
To prove the ability to transfect the Neuro2a wild type tumor metastases in the
intrasplenic liver metastases model, tumor bearing A/J mice (n = 10) were injected
with polyplexes containing a CpG free plasmid encoding for the membrane bound
Gaussia Luciferase as a reporter gene and G3HDOEI as a non viral gene carrier
7 days after tumor cell injection. Here the bioluminescent pictures of a mouse are
shown as a representative example (Fig. 25).
Before 24h 48h
Figure 25: Gene delivery into wild type tumor metastases in the intrasplenic liver metastases model
A/J mice (n = 10) were injected with 1x10⁶ Neuro2a wild type cells into the spleen. At day 7 after tumor inoculation polyplexes containing a CpG free plasmid encoding for the membrane bound Gaussia Luciferase as a reporter gene and G3HDOEI as a non viral gene carrier were injected intravenously. 24, 48 and 72 hours after polyplex injection the mice were imaged immediately after coelenterazine injection.
47
Chapter 3: Results
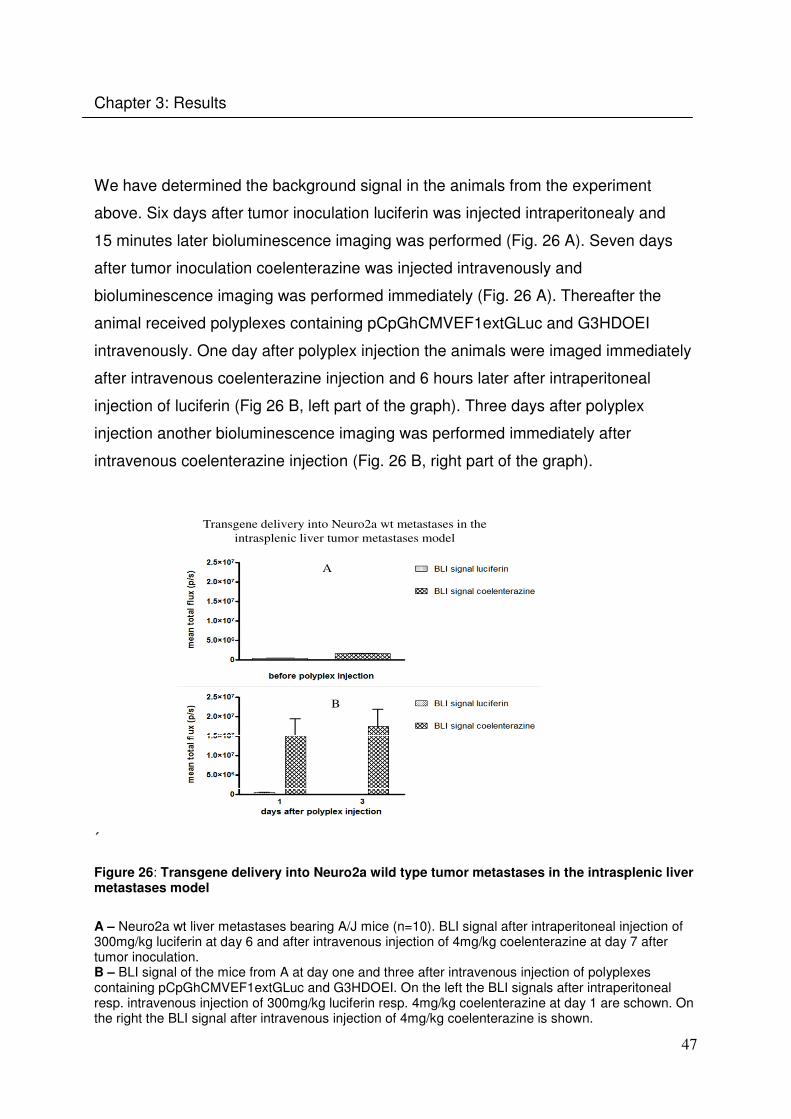
We have determined the background signal in the animals from the experiment
above. Six days after tumor inoculation luciferin was injected intraperitonealy and
15 minutes later bioluminescence imaging was performed (Fig. 26 A). Seven days
after tumor inoculation coelenterazine was injected intravenously and
bioluminescence imaging was performed immediately (Fig. 26 A). Thereafter the
animal received polyplexes containing pCpGhCMVEF1extGLuc and G3HDOEI
intravenously. One day after polyplex injection the animals were imaged immediately
after intravenous coelenterazine injection and 6 hours later after intraperitoneal
injection of luciferin (Fig 26 B, left part of the graph). Three days after polyplex
injection another bioluminescence imaging was performed immediately after
intravenous coelenterazine injection (Fig. 26 B, right part of the graph).
Transgene delivery into Neuro2a wt metastases in the
intrasplenic liver tumor metastases model
A
B
´
Figure 26: Transgene delivery into Neuro2a wild type tumor metastases in the intrasplenic liver metastases model
A – Neuro2a wt liver metastases bearing A/J mice (n=10). BLI signal after intraperitoneal injection of 300mg/kg luciferin at day 6 and after intravenous injection of 4mg/kg coelenterazine at day 7 after tumor inoculation. B – BLI signal of the mice from A at day one and three after intravenous injection of polyplexes containing pCpGhCMVEF1extGLuc and G3HDOEI. On the left the BLI signals after intraperitoneal resp. intravenous injection of 300mg/kg luciferin resp. 4mg/kg coelenterazine at day 1 are schown. On the right the BLI signal after intravenous injection of 4mg/kg coelenterazine is shown.
48
Chapter 3: Results
3.5 Establishment of a metastatic xenograft for gene delivery
3.5.1 Establishment of the LS 174t lenti Luc cell line in an intrasplenic liver
metastases model
It is known for colorectal cancer that hepatic metastasis is the most common cause of
death in these patients ([49]). For this reason it was aimed to establish a xenogeneic
liver metastasis model using the LS174T in our lab, where it is from the literature
known that liver metastasis can be achieved by injecting the tumor cells into the
spleen ([49], [50], [51]).
NMRI-nude mice were injected LS174T lenti Luc cells into the spleen. The animals
were monitored concerning weight (Fig. 27), behaviour and bioluminescent signal
(Fig. 28, 29).
M o u se 1 -5
0 2 4 6 8 10 1218
20
22
24
26
2812345
D ays after tum or in jection
Weig
ht (g
)
M o u se 6 -10
0 2 4 6 8 10 1218
20
22
24
26
28678910
D ays after tum or in ject ion
Weig
ht (g
)
M o us e 1 1-1 5
0 2 4 6 8 10 1218
20
22
24
26
281112131415
D ays after tum or in jection
Weig
ht (g
)
M o u se 1 6-20
0 2 4 6 8 10 1218
20
22
24
26
281617181920
D ays after tum or inject ion
Weig
ht (g
)
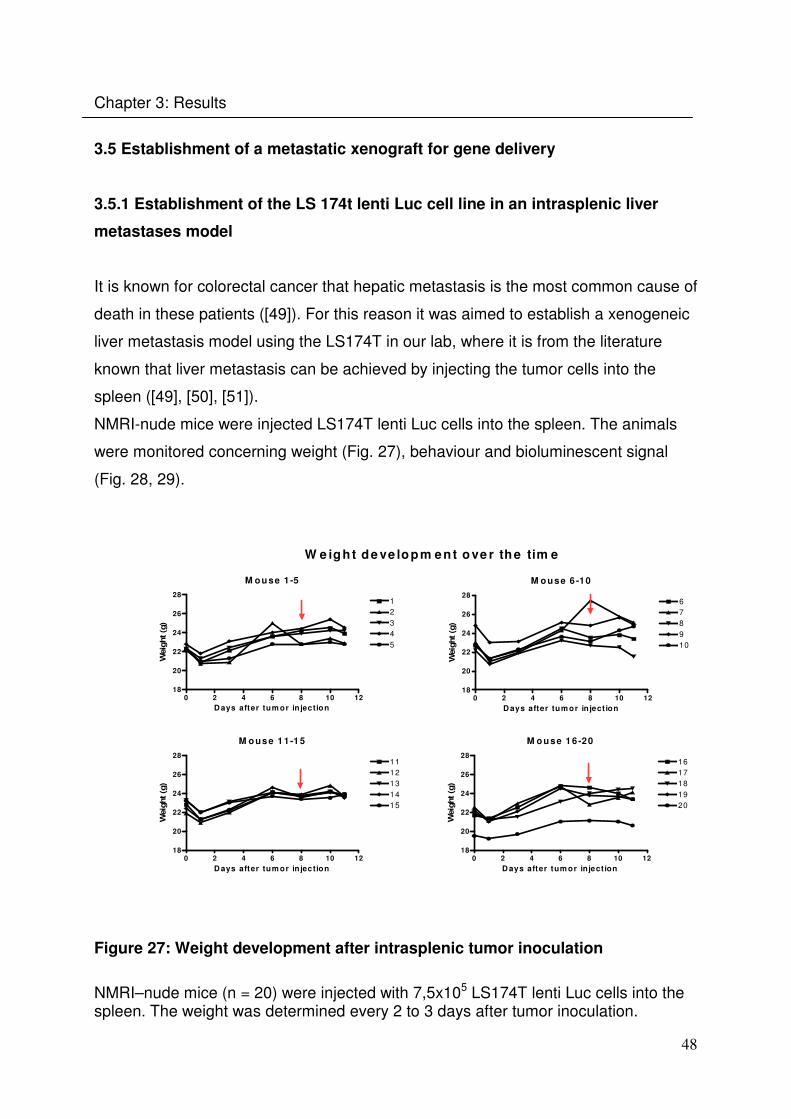
W e ight de ve lopm ent ove r the tim e
Figure 27: Weight development after intrasplenic tumor inoculation
NMRI–nude mice (n = 20) were injected with 7,5x10⁵ LS174T lenti Luc cells into the spleen. The weight was determined every 2 to 3 days after tumor inoculation.

49
Chapter 3: Results
In this tumor model the animals start losing weight at around day 8 after tumor
inoculation (Fig. 27). Approximately at the same time tumor masses in the abdominal
cavity become palpable. At around day 9 after tumor inoculation the mice had shown
an increased girth in the upper part of the abdominal cavity. At around day 10 after
tumor inoculation we could observe the animals to arch the back, to walk more with
caution and unwillingly stretching the body to the cratch.
There is an increase of the bioluminescence signal between day 3 and day 10 after
tumor inoculation, indicating progressive growth of the viable tumor mass (Fig. 28).
Bioluminescence over time -LS174t lenti Luc i.s.
3 6 8 100.0
2.0×10¹⁰
4.0×10¹⁰
6.0×10¹⁰
8.0×10¹⁰
days after tumor injection
tota
l fl
ux (
p/s
)
Figure 28: Bioluminescence development
NMRI–nude mice (n = 20) were injected with 7,5x10⁵ LS174T lenti Luc cells into the spleen. 15 minutes after i.p. injection of 300mg/kg luciferin bioluminescence was measured at day 3 after tumor inoculation. Starting at day 6 after tumor inoculation the measurement was performed as sequence measurement.

50
Chapter 3: Results
Figure 29: Bioluminescence development
NMRI – nude mice (n = 20) were injected with 7,5x10⁵ LS174T lenti Luc cells into the spleen. 15 minutes after i.p. injection of 300mg/kg luciferin bioluminescence was measured at day 3 after tumor inoculation. Starting at day 6 after tumor inoculation the measurement was performed as sequence measurement. Here the pictures of an example mouse are shown at day 3, 6, 8 and 10 after tumor inoculation (from the left to the right).
LS174T tumor metastases can be visualized at day 3 after tumor inoculation in all
animals (Fig. 29).We can find only a bioluminescent signal within the spleen and liver
area. Starting at day six after tumor inoculation, the bioluminescent measurements
were performed as sequence measurement so it was possible to determine the time
point of maximal bioluminescence for this tumor model (Fig. 30).

51
Chapter 3: Results
Time point of maximal bioluminescence -LS174t lenti Luc i.s.
0 500 1000 1500 2000
6
8
10
time (s)
da
y a
fte
r tu
mor
inje
cti
on
Figure 30: Time point of maximal bioluminescence in the intrasplenic liver metastases model with LS174T lenti Luc
NMRI–nude mice (n = 20) were injected with 7,5x10⁵ LS174T lenti Luc cells into the spleen. At day 6, 8 and 10 after tumor inoculation bioluminescence imaging was performed immediately after intraperitoneal injection of 300mg/kg luciferin. The bioluminescence imaging was performed as sequence measurement. The results are given as box plots. The boxes cover the range of 50% of the values above and below the mean. The mark in the box indicates the overall mean . The time point of maximal bioluminescence in this tumor model was found at around
1100 seconds.
The pathological examination showed that all of the animals were tumor bearing. In
all animals a primary tumor in the spleen was found which appeared harder in the
texture than the metastases found in the liver. The liver metastases (Fig. 31) were
macroscopically different than the liver metastases found in the intrasplenic Neuro2a
lenti Luc liver metastases model (Fig. 19).
52
Chapter 3: Results
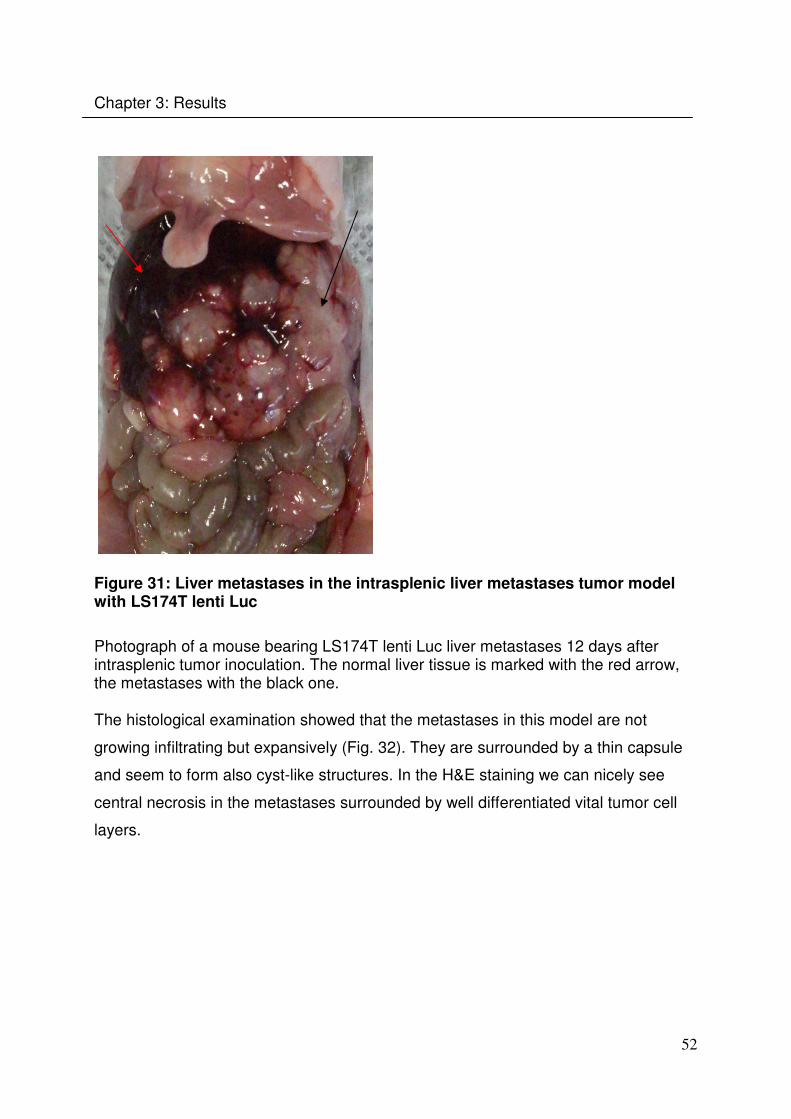
Figure 31: Liver metastases in the intrasplenic liver metastases tumor model with LS174T lenti Luc
Photograph of a mouse bearing LS174T lenti Luc liver metastases 12 days after intrasplenic tumor inoculation. The normal liver tissue is marked with the red arrow, the metastases with the black one. The histological examination showed that the metastases in this model are not
growing infiltrating but expansively (Fig. 32). They are surrounded by a thin capsule
and seem to form also cyst-like structures. In the H&E staining we can nicely see
central necrosis in the metastases surrounded by well differentiated vital tumor cell
layers.
53
Chapter 3: Results
A B
C D
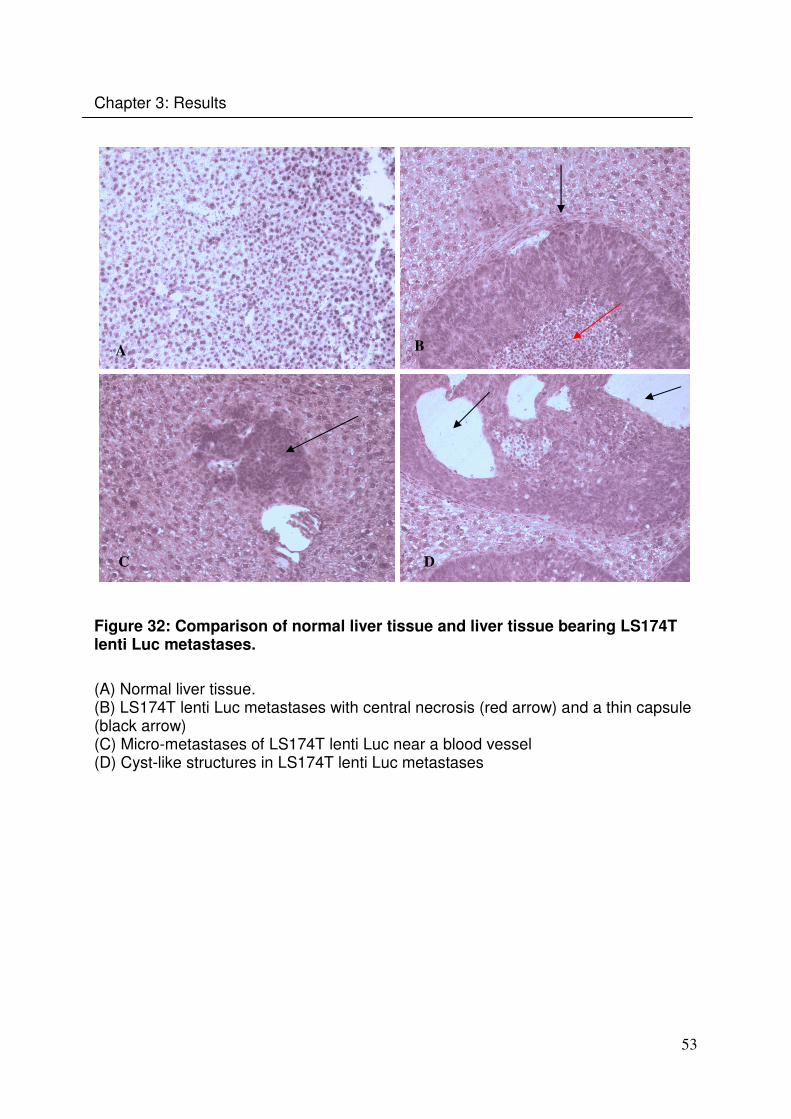
Figure 32: Comparison of normal liver tissue and liver tissue bearing LS174T lenti Luc metastases.
(A) Normal liver tissue. (B) LS174T lenti Luc metastases with central necrosis (red arrow) and a thin capsule (black arrow) (C) Micro-metastases of LS174T lenti Luc near a blood vessel (D) Cyst-like structures in LS174T lenti Luc metastases
54
Chapter 4: Discussion
4. Discussion
4.1 Intravenous metastases model
The aim of this work was to establish liver tumor metastases models in mice
(syngeneic as well as xenogeneic), using luciferase as reporter gene which could be
used in further experiments for the development of novel defined and fully synthetic
non viral gene (or siRNA) vectors for the delivery into tumor tissue allowing cancer
treatment.
The Neuro 2aLuc + cell line had been established in our lab in the PhD thesis of Dr.
Gelja Maiwald (LMU). Based on the publication of Amirkhosravi et al ([48]) we
decided to establish the intravenous liver metastases tumor model using the Neuro2a
Luc+ cells because of the possibility to follow the spreading pattern and metastases
development in real time. Using these cells allowed us to visualize tumor burden in
an early stage of the metastases development (at day four after intravenous tumor
cell injection) opening the possibility of better sectioning of the animals into treatment
groups. If a treatment over a longer time in a fast growing tumor metastases model is
aimed at without using this early stage bioluminescent imaging, one had to do the
distribution of animals into the different treatment groups complete blind; large group
to group variations in the composition of the groups may occur which can lead to
difficult analyses of the experiment (e.g. one group with all animals tumor bearing
and another with just a few tumor bearing animals). The animals injected
intravenously Neuro2a Luc+ cells developed extensively metastases, contrary to the
data publicated by Amirkhosravi et al ([48]), not only in the liver (not in every tumor
inoculated animal) and lung, but also in the axillary/inguinal area, attached to the net
or small intestine. Although the spreading pattern differed from animal to animal, all
mice that were tumor inoculated also developed more or less extensive tumor
metastases.
55
Chapter 4: Discussion
Croce et al ([25]) had shown evidence that IL-21-secreting NB cells are effective as
therapeutic vaccine in mice bearing metastatic NB, through a specific CTL response
involving surviving as antigen, and suggest a potential interest for IL-21 in NB
immuno-gene therapy. The mean tumor free survival time in the non treated animals
was 22 days, similar to the founding we had using the Neuro2a Luc+ cells, indicating
that the modification of the Neuro2a wild type cells into the Neuro2a Luc+ cells had
not changed their spreading patter and metastases development potential in vivo. To
prove this we inoculated Neuro2a wild type cells intravenously. We could confirm in
our experiment that the mice had shown the same mean survival time than the once
inoculated with Neuro2a Luc+ cells and had shown in the pathological examination
after the sacrifice the same spreading pattern.
We also investigated the accessibility of the Neuro2a Luc+ metastases in the
intravenous metastases model for macromolecules using 70.000 kDa Texas-Red
Dextran and 2 MDa FITC-Dextran applied intravenously 10 minutes before the tumor
bearing mice were sacrificed. After cryosectioning and CD31 staining of the tumor
metastases, to visualize the endothelium, we found the Texas-Red Dextran localized
at the endothelium. Although the FITC-Dextran could be also found at the
endothelium, it was more localized in the tumor surrounding tissue.
4.2 Establishment of the Neuro2a lenti Luc cell line
Andrew Fire and Craig Mello won 2006 consequently the Nobel Prize for their work
on RNA interference in Caenorhabditis elegans which was published in the year
1998 ([54]). Delivering small interfering RNA (siRNA) to tumors is the major technical
hurdle that prevents the advancement of siRNA-based cancer therapy. Bartlett et al.
for the first time proved successful siRNA delivery to tumor tissue by directly targeting
luciferase ([55],[56]). One of the difficulties associated with the development of
clinically relevant delivery systems is the lack of reliable tools for monitoring siRNA
delivery to tumors in vivo. Lin et al ([57]) described in his publication a positive read
out system for siRNA delivery by using tet repressor based inducible expression

56
Chapter 4: Discussion
systems, where potent siRNA against TetR, when introduced into cells, serves as an
inducing agent by knocking down the TetR protein, thus allowing up-regulation of the
reporter. For using a luciferase based negative read out system for the detection of
siRNA mediated knock down, it is crucial that the bioluminescence imaging signal in
the reporter gene expressing tumor cells stays stable. This would allow traceability of
the specific siRNA mediated luciferase knock down below normal bioluminescence
imaging signal deviations.
Dr. Maiwald had found in her PhD thesis in a subcutaneous tumor model using
Neuro2a Luc+ cells inoculated into the flank of fully immunocompetent A/J mice, high
day to day variations in the bioluminescent signal. We developed the Neuro2a lenti
Luc tumor cell line via lentiviral transduction (Arzu Cengizeroglu, LMU), to investigate
if Neuro2a cells marked with a lentiviral Firefly Luciferase encoding vector are more
stable in the bioluminescence imaging signal. The tumorigenicity of the cell line had
been proven by establishing this tumor cell line in a subcutaneous model in fully
immunocompetent A/J mice. The experiment had shown an exponential increase in
tumor volume, which also correlated well with the mean bioluminescence imaging
signal over days (r2 = 0,9342). The bioluminescence imaging was performed as a
sequence measurement meaning that the mice were put into anesthesia (using a
chamber floated with isofluran and oxygen) and immediately after luciferin injection
the bioluminescence measurement was performed capturing 90 pictures with a delay
of 30 seconds between the pictures. Performing the measurement this way, we had
the possibility to follow also the time kinetics of light production in the Firefly
Luciferase expressing tumor cells. We have found that in the subcutaneous tumor
model the time point of the strongest bioluminescent imaging signal was between
1100 and 1600 seconds. While evaluating the data of this experiment we have found
no day to day BLI signal deviations, proving that the lentiviral transduced cells are
stable in the BLI signal.

57
Chapter 4: Discussion
4.3 Metastatic tumor models using Neuro2a lenti Luc
Following up the experiments done with the Neuro2a Luc+ and wild type cells, we
compared the Neuro2a lenti Luc cells in the intravenous metastases model and
found the same pattern in metastases development. To establish a tumor model
where the tumor cells can infiltrate the liver, Neuro2a lenti Luc cells were inoculated
into the spleen, similar as it has been described for colon carcinoma ([49], [50], [51]).
Similar as in the intravenous model it was possible to visualize the tumor cells (the
primary tumor as well as the liver metastases) already at day 4 after tumor
inoculation. Different than in the intravenous model the mice started losing weight
much earlier (at about day 7) and masses in the upper abdomen became first visible,
then palpable and shortly thereafter had to be euthanized due to animal welfare (at
around day 10). As we had observed that the tumor metastases are growing much
faster in this tumor model we decided to monitor the time kinetics of light production
in the Firefly Luciferase expressing tumor cells the same way we already did for the
subcutaneous tumors. We observed that the time point of maximal BLI signal in this
tumor model was between 750 to 1150 seconds, so about 500 seconds earlier than
in the subcutaneous model, which could be due to the intraperitoneal luciferin
application allowing it to earlier reach the tumor metastases in the abdominal cavity.
The BLI signals were stronger than in the subcutaneous model, which could be
associated with a higher proliferation rate and there for higher amount of tumor cells
in the metastases with available luciferase, but this aspect needs to be further
evaluated. Comparing the histology in these two tumor models, we have found on the
one hand the subcutaneous tumor surrounded by a capsule growing expansively with
a central necrosis, and on the other hand the tumor metastases in the intrasplenic
model, infiltrating the liver tissue where it is not possible to find a border between
single metastases (like it is possible in the intravenous model). The relationship
between these different growth properties in the tumor models, their BLI signal
intensity and their different time kinetics need to be further evaluated.

58
Chapter 4: Discussion
4.4 Dual Bioluminescence Imaging
Shah et al ([58]) decribes a way to monitor both, gene delivery and efficacy of Tumor
necrosis factor-related apoptosis-inducing ligand (TRAIL)-induced apoptosis in
tumors in vivo in real time by dual enzyme substrate (Rluc/Fluc) imaging in a
subcutaneous xenograft model using human glioma cells (Gli36) stably transfected
with Firefly Luciferase (Gli36fluc+) and a HSV amplicon vector bearing the genes for
TRAIL and Rluc injected directly into Gli36fluc+. Tannous et al is also discussing the
possibility to use a system based on two luciferases ([47]) but using Gaussia
Luciferase instead of Renilla Luciferase. Serganova et al ([59]) could show in a
multimodality imaging approach, that exGluc BLI demonstrates a significantly higher
sensitivity than MicroPET imaging, thereby allowing detection of TGFß activation
much earlier and in more sites of metastatic growth in the mouse. As we had
established tumor metastases models with Neuro2a lenti Luc cells stably expressing
Firefly Luciferase, we decided to use a novel plasmid encoding for the membrane-
bound version of Gaussia Luciferase ([60]) for the monitoring of the gene delivery
efficacy of our non viral gene delivery system via dual bioluminescent imaging in real
time. In both tumor models we were able to localize the Firefly Luciferase labeled
tumor metastases 10 minutes after intraperitoneal luciferin injection and Gaussia
Luciferase transfected tumor metastases immediately after intravenous injection of
coelenterazine. Comparing the BLI signals of Gaussia Luciferase from these
experiments, we found stronger BLI signals in the intrasplenic liver metastases
model, indicating that the metastases developed by infiltrating the liver are easier to
transfect with our non viral vector than the ones derived by intravenous injection.
59
Chapter 4: Discussion
4.5 Non viral gene delivery into wild type tumor metastases
In terms of the development of non viral vectors for gene delivery it is use full to have
a metastatic tumor model, where it is possible to compare different synthetic vectors
due to their ability to deliver a gene functional into a tumor cell. There are few
approaches described in the literature for the use of plasmid DNA delivered into a
tumor in the literature. One approach is delivering a plasmid encoding for Diphteria
toxin into cancer cells leading to tumor growth inhibition ([61,62]). Another approach
is to use a plasmid encoding for TNFα leading to a tumor necrosis ([62]). To prove
the functionality of our non viral vector system we have decided to use our novel
plasmids, encoding either for Firefly Luciferase or for the membrane bound Gaussia
Luciferase, as reporter for a functional gene delivery. We could show that there are
no significant differences between the spreading patterns and growth characteristics
between the Neuro2a wild type cells and the lentiviral transduced Neuro2a lenti Luc
cells. For this reason we decided to use Neuro2a wild type metastases in this
approach. To ensure measurement of the bioluminescent imaging signal from our
gene delivery into the metastases and not the unspecific background signals, we
detected the background signal of each substrate (luciferin and coelenterazine) in the
tumor bearing mice before the injection of the reporter gene complexed with the non
viral vector (G3HDOEI).By BLI 24, 48 and 72 hours after polyplex injection, we found
a BLI signal which was clearly stronger than the background signal, indicating that
this method is suitable for the development of non viral delivery systems.
60
Chapter 4: Discussion
4.6 Establishment of a metastatic xenograft model for non viral
gene delivery
It is known for colorectal cancer that hepatic metastasis is the most common cause of
death in these patients ([49]). Because the LS174T cell line is a human colon
carcinoma cell line, the cells are expressing human target molecules opening the
possibility of targeted gene delivery. For this reason it was aimed to establish in our
lab a xenogeneic liver metastasis model using the LS174T, where it is from the
literature known that liver metastasis can be achieved by injecting the tumor cells into
the spleen ([49], [50], [51]). The aim was to establish this model as negative read out
model for, siRNA mediated knock down via non viral delivery. There are different
informations regarding the cell amount to be injected into the spleen and the
metastases growth kinetics in the literature ([50], [49], [63], [51]). We used 1 milion
LS174T cells stable expressing Firefly Luciferase injected into the spleen. There was
an increase of the BLI signal between day 3 and 10 indicating a progressive growth
of the viable tumor mass and proving the stability of the BLI signal making this model
suitable for non viral gene delivery vector development. Similar to the finding we had
made for the syngeneic Neuro2a lenti Luc metastases model, the tumor metastases
could be visualized via BLI about day 4 after tumor inoculation. Like in the Neuro2a
lenti Luc intrasplenic tumor model the tumor metastases were found at the primary
injection site and as metastases in the liver. We found differences in the growth
characteristics of the tumor metastases in the liver (cyst-like structures with a thin
capsule and necrotic center), but also in the kinetics of light production of the Firefly
Luciferase after luciferin injection. The mean maximal BLI signal was found to be at
around 1100 seconds, which could be due to the different proliferation of the tumor
cells, their growth characteristics and could be specific for this cell line and should be
further evaluated as well as the accessibility of the tumor metastases for non viral
gene delivery.
61
Chapter 5: Summary
5. Summary
Cancer metastases are the main causes of mortality in humans. New treatment
approaches like gene therapy did arise during the last decade. Gene therapy using
plasmid DNA is already in clinical trials. A novel approach is the use of small
interfering RNA (siRNA) acting on translational level without the introduction of genes
into the genome. Due to the fast clearance and degradation of siRNA, when injected
naked into the bloodstream, delivery systems have to be developed. For this purpose
feasible tumor models are needed. We established two different metastatic
syngeneic tumor models based on neuroblastoma Neuro2a lenti Luc, Neuro2a Luc+
and Neuro2a wild type cells in syngeneic A/J mice. Systemic metastases were
established by intravenous injection of tumor cells, liver metastases were generated
by spleen injection.
The tumor models stably expressing Firefly luciferase can be used for tumor
metastases trafficking (in the intravenous model) as well as for knock down
experiments with siRNA, or plasmid delivery to the metastases by in vivo luciferase
imaging.
The wild type tumor models can be used for the evaluation of new fully synthetic
nonviral carrier systems using different luciferases as reporter gene to show
successful delivery of the functional construct into the target cells. For plasmid DNA
delivery we applied a biodegradable polypropylenimine dendrimer generation 3
modified with branched oligoethylenimine 800Da (G3-HD-OEI).
In the current thesis we could show that novel plasmids encoding for Firefly or
Gaussia luciferase are feasible for the purpose of live animal in vivo imaging. The big
advantage of these syngeneic models is the intact immune system of the mice so it is
possible to investigate the interactions between the construct and the immune
system. The big advantage of these models is the possibility to study the effects in a
syngeneic mouse model with a functional immune system.

62
Chapter 5: Summary
In addition the established technology was also applied for setting up a xenograft
model for liver metastases of colon carcinoma using the human LS174T cell line in
luciferase-expressing form.
In conclusion both syngeneic and xenograft models of experimental liver metastases
and/or systemic metastases were established and used in luciferase imaging
experiments to monitor in vivo tumor growth, distribution, and synthetic non viral gene
transfer.
63
Chapter 6: Zusammenfassung
6. Zusammenfassung
Laut dem Statistischen Bundesamt starb im Jahr 2009 jeder 4. Mensch in
Deutschland an einer Krebserkrankung. Tumorentwicklung und die Bildung von
Metastasen spielen deshalb in der pharmazeutischen Forschung eine besondere
Rolle. Insbesondere die Gentherapie sowie die Therapie mit Hilfe von RNA-
Interferenz stehen hierbei im Fokus.
Mit Hilfe von RNA-Interferenz ist es möglich auf der Übersetzungsebene der RNA
einzugreifen ohne das Genom selber zu modifizieren. Ungeschützt in den Blutstrom
appliziert, wird siRNA sehr schnell ausgeschieden und abgebaut, aus diesem Grund
ist es wichtig Transportsysteme zu entwickeln, welche den erfolgreichen siRNA-
/Gentransfer in die Tumorzelle ermöglichen.
Um diese Transportsysteme auf ihre Funktionalität in vivo überprüfen zu können
wurden in dieser Arbeit zwei verschiedene syngene Tumormodelle, basierend auf
den Neuroblastomzelllinien Neuro2a lenti Luc, Neuro2a Luc+ und Neuro2a Wildtyp,
in syngenen A/J Mäusen entwickelt. Systemische Metastasen wurden entweder
durch intravenöse Injektion oder durch Injektion in die Milz etabliert.
Krebsmodelle, welche stabil Firefly Luziferase exprimieren, können sowohl für das
Lokalisieren von den Krebsmetastasen im Körper, als auch für Knockdown-
Experimente mit siRNA genutzt werden oder zur bildgebenden Darstellung von
Plasmid DNA-Transfer durch biolumineszente Messung von Luziferase Aktivität am
lebenden Tier.
Krebsmodelle mit Wildtypzellen können für das Beurteilen neuer voll synthetischer
nicht viraler Transportsysteme genutzt werden, wobei durch den Transfer von
verschiedenen Luziferasen der funktionelle Transfer in die Zielzelle nachgewiesen
werden kann. Für den DNA-Transfer wurde ein biologisch abbaubares
Polypropylenimindendrimer Generation 3, welches mit dem verzweigten
Oligoethylenimin 800Da (G3HDOEI) modifiziert wurde, benutzt.

64
Chapter 6: Zusammenfassung
In dieser Arbeit konnte gezeigt werden, dass neuartige Plasmide, die für Firefly und
Gaussia Luziferase kodieren, für die Nachverfolgung von Metastasen in lebenden
Tieren geeignet sind.
Der große Vorteil von syngenen Krebsmodellen ist, dass die Mäuse ein intaktes
Immunsystem haben, was es ermöglicht neue Transportsysteme direkt auf ihre
Interaktionen mit dem Immunsystem hin zu beobachten.
Zusätzlich wurde die etablierte Methode der Milzinjektion dazu genutzt ein
Xenograftmodel mit der humanen Kolonkarzinomzelllinie LS174T in Firefly Luciferase
stabil exprimierender Form zu entwickeln, welches zu Lebermetastasen führt.
Xenograft als auch syngene Krebsmodelle, wurden für das Beobachten von
Krebswachstum und dessen Verteilung in vivo, als auch für die Verfolgung von nicht
viralen Gentransfer genutzt und das sowohl in experimentellen
Lebermetastasenmodellen als auch im intravenösen Metastasenmodel.
65
7. References
1. Friedmann, T. and R. Roblin, Gene therapy for human genetic disease? Science, 1972.
175(25): p. 949-55.
2. Douglas, K.L., Toward development of artificial viruses for gene therapy: a
comparative evaluation of viral and non-viral transfection. Biotechnol Prog, 2008.
24(4): p. 871-83.
3. Lehrman, S., Virus treatment questioned after gene therapy death. Nature, 1999.
401(6753): p. 517-8.
4. Marshall, E., Gene therapy. What to do when clear success comes with an unclear
risk? Science, 2002. 298(5593): p. 510-1.
5. Li, S.D. and L. Huang, Non-viral is superior to viral gene delivery. J Control Release,
2007. 123(3): p. 181-3.
6. Rao, N.M., Cationic lipid-mediated nucleic acid delivery: beyond being cationic.
Chem Phys Lipids, 2010. 163(3): p. 245-52.
7. Plank, C., et al., Activation of the complement system by synthetic DNA complexes: a
potential barrier for intravenous gene delivery. Hum Gene Ther, 1996. 7(12): p. 1437-
46.
8. Ogris, M., et al., PEGylated DNA/transferrin-PEI complexes: reduced interaction with
blood components, extended circulation in blood and potential for systemic gene
delivery. Gene Ther, 1999. 6(4): p. 595-605.
9. Zintchenko, A., et al., Simple modifications of branched PEI lead to highly efficient
siRNA carriers with low toxicity. Bioconjug Chem, 2008. 19(7): p. 1448-55.
10. Russ, V., et al., Oligoethylenimine-grafted polypropylenimine dendrimers as
degradable and biocompatible synthetic vectors for gene delivery. J Control Release,
2008. 132(2): p. 131-40.
11. Hyde, S.C., et al., CpG-free plasmids confer reduced inflammation and sustained
pulmonary gene expression. Nat Biotechnol, 2008. 26(5): p. 549-51.
12. Yew, N.S., et al., Reduced inflammatory response to plasmid DNA vectors by
elimination and inhibition of immunostimulatory CpG motifs. Mol Ther, 2000. 1(3): p.
255-62.
13. Zambrowicz, B.P. and A.T. Sands, Knockouts model the 100 best-selling drugs--will
they model the next 100? Nat Rev Drug Discov, 2003. 2(1): p. 38-51.
14. de Jong, M. and T. Maina, Of mice and humans: are they the same?--Implications in
cancer translational research. J Nucl Med, 2010. 51(4): p. 501-4.
15. Gordon, J.W., et al., Genetic transformation of mouse embryos by microinjection of
purified DNA. Proc Natl Acad Sci U S A, 1980. 77(12): p. 7380-4.
16. Thomas, K.R. and M.R. Capecchi, Site-directed mutagenesis by gene targeting in
mouse embryo-derived stem cells. Cell, 1987. 51(3): p. 503-12.
17. Varticovski, L., et al., Accelerated preclinical testing using transplanted tumors from
genetically engineered mouse breast cancer models. Clin Cancer Res, 2007. 13(7): p.
2168-77.
18. Parangi, S., et al., Antiangiogenic therapy of transgenic mice impairs de novo tumor
growth. Proc Natl Acad Sci U S A, 1996. 93(5): p. 2002-7.
19. Donehower, L.A., et al., Mice deficient for p53 are developmentally normal but
susceptible to spontaneous tumours. Nature, 1992. 356(6366): p. 215-21.
20. Sporn, M.B. and K.T. Liby, Cancer chemoprevention: scientific promise, clinical
uncertainty. Nat Clin Pract Oncol, 2005. 2(10): p. 518-25.
21. Corpet, D.E. and S. Tache, Most effective colon cancer chemopreventive agents in
rats: a systematic review of aberrant crypt foci and tumor data, ranked by potency.
Nutr Cancer, 2002. 43(1): p. 1-21.
66
22. Law, L.W., T.B. Dunn, and et al., Observations on the effect of a folic-acid antagonist
on transplantable lymphoid leukemias in mice. J Natl Cancer Inst, 1949. 10(1): p. 179-
92.
23. Teicher, B.A., Tumor models for efficacy determination. Mol Cancer Ther, 2006.
5(10): p. 2435-43.
24. Chung, E., et al., Secreted Gaussia luciferase as a biomarker for monitoring tumor
progression and treatment response of systemic metastases. PLoS One, 2009. 4(12): p.
e8316.
25. Croce, M., et al., Immunotherapy of neuroblastoma by an Interleukin-21-secreting cell
vaccine involves survivin as antigen. Cancer Immunol Immunother, 2008. 57(11): p.
1625-34.
26. Schmitz, V., et al., Establishment of an orthotopic tumour model for hepatocellular
carcinoma and non-invasive in vivo tumour imaging by high resolution ultrasound in
mice. J Hepatol, 2004. 40(5): p. 787-91.
27. Lelekakis, M., et al., A novel orthotopic model of breast cancer metastasis to bone.
Clin Exp Metastasis, 1999. 17(2): p. 163-70.
28. Blasberg, R.G. and J. Gelovani, Molecular-genetic imaging: a nuclear medicine-based
perspective. Mol Imaging, 2002. 1(3): p. 280-300.
29. Contag, C.H. and M.H. Bachmann, Advances in in vivo bioluminescence imaging of
gene expression. Annu Rev Biomed Eng, 2002. 4: p. 235-60.
30. Rettig, G.R. and K.G. Rice, Quantitative in vivo imaging of non-viral-mediated gene
expression and RNAi-mediated knockdown. Methods Mol Biol, 2009. 574: p. 155-71.
31. On a new kind of rays. By W.C. Rontgen. Translated by Arthur Stanton from the
Sitzungsberichte der Wurzburger Physic-medic. Gesellschaft, 1895. Nature, January
23, 1896. Radiography, 1970. 36(428): p. 185-8.
32. Townsend, D.W., A combined PET/CT scanner: the choices. J Nucl Med, 2001. 42(3):
p. 533-4.
33. Amirkhanov, N.V., et al., Imaging human pancreatic cancer xenografts by targeting
mutant KRAS2 mRNA with [(111)In]DOTA(n)-poly(diamidopropanoyl)(m)-KRAS2
PNA-D(Cys-Ser-Lys-Cys) nanoparticles. Bioconjug Chem, 2010. 21(4): p. 731-40.
34. Huhtala, T., et al., In vivo SPECT/CT imaging of human orthotopic ovarian carcinoma
xenografts with 111In-labeled monoclonal antibodies. Nucl Med Biol, 2010. 37(8): p.
957-64.
35. Zintchenko, A., et al., Drug nanocarriers labeled with near-infrared-emitting quantum
dots (quantoplexes): imaging fast dynamics of distribution in living animals. Mol
Ther, 2009. 17(11): p. 1849-56.
36. Tung, C.H., et al., In vivo imaging of proteolytic enzyme activity using a novel
molecular reporter. Cancer Res, 2000. 60(17): p. 4953-8.
37. Massoud, T.F. and S.S. Gambhir, Molecular imaging in living subjects: seeing
fundamental biological processes in a new light. Genes Dev, 2003. 17(5): p. 545-80.
38. Luker, K.E. and G.D. Luker, Applications of bioluminescence imaging to antiviral
research and therapy: multiple luciferase enzymes and quantitation. Antiviral Res,
2008. 78(3): p. 179-87.
39. Xiong, Y.Q., et al., Real-time in vivo bioluminescent imaging for evaluating the
efficacy of antibiotics in a rat Staphylococcus aureus endocarditis model. Antimicrob
Agents Chemother, 2005. 49(1): p. 380-7.
40. Steinhuber, A., et al., Bioluminescence imaging to study the promoter activity of hla of
Staphylococcus aureus in vitro and in vivo. Int J Med Microbiol, 2008. 298(7-8): p.
599-605.

67
41. Raaben, M., et al., Non-invasive imaging of mouse hepatitis coronavirus infection
reveals determinants of viral replication and spread in vivo. Cell Microbiol, 2009.
11(5): p. 825-41.
42. Kang, Y., et al., Breast cancer bone metastasis mediated by the Smad tumor
suppressor pathway. Proc Natl Acad Sci U S A, 2005. 102(39): p. 13909-14.
43. Jenkins, D.E., et al., Bioluminescent imaging (BLI) to improve and refine traditional
murine models of tumor growth and metastasis. Clin Exp Metastasis, 2003. 20(8): p.
733-44.
44. Edinger, M., et al., Revealing lymphoma growth and the efficacy of immune cell
therapies using in vivo bioluminescence imaging. Blood, 2003. 101(2): p. 640-8.
45. Toyoshima, M., et al., Generation of a syngeneic mouse model to study the
intraperitoneal dissemination of ovarian cancer with in vivo luciferase imaging.
Luminescence, 2009. 24(5): p. 324-31.
46. Hildebrandt, I.J., et al., Optical imaging of transferrin targeted PEI/DNA complexes in
living subjects. Gene Ther, 2003. 10(9): p. 758-64.
47. Tannous, B.A., et al., Codon-optimized Gaussia luciferase cDNA for mammalian gene
expression in culture and in vivo. Mol Ther, 2005. 11(3): p. 435-43.
48. Amirkhosravi, A., et al., The effect of pentoxifylline on spontaneous and experimental
metastasis of the mouse Neuro2a neuroblastoma. Clin Exp Metastasis, 1997. 15(4): p.
453-61.
49. Harrington, W., et al., HIV Nef-M1 Effects on Colorectal Cancer Growth in Tumor-
induced Spleens and Hepatic Metastasis. Mol Cell Pharmacol, 2009. 1(2): p. 85-91.
50. Li, H., et al., Adenovirus-mediated delivery of a uPA/uPAR antagonist suppresses
angiogenesis-dependent tumor growth and dissemination in mice. Gene Ther, 1998.
5(8): p. 1105-13.
51. Hamada, K., et al., Liver metastasis models of colon cancer for evaluation of drug
efficacy using NOD/Shi-scid IL2Rgammanull (NOG) mice. Int J Oncol, 2008. 32(1): p.
153-9.
52. Navarro, G., et al., Low generation PAMAM dendrimer and CpG free plasmids allow
targeted and extended transgene expression in tumors after systemic delivery. J
Control Release, 2010. 146(1): p. 99-105.
53. Klein, C.A., Cancer. The metastasis cascade. Science, 2008. 321(5897): p. 1785-7.
54. Fire, A., et al., Potent and specific genetic interference by double-stranded RNA in
Caenorhabditis elegans. Nature, 1998. 391(6669): p. 806-11.
55. Bartlett, D.W., et al., Impact of tumor-specific targeting on the biodistribution and
efficacy of siRNA nanoparticles measured by multimodality in vivo imaging. Proc Natl
Acad Sci U S A, 2007. 104(39): p. 15549-54.
56. Bartlett, D.W. and M.E. Davis, Insights into the kinetics of siRNA-mediated gene
silencing from live-cell and live-animal bioluminescent imaging. Nucleic Acids Res,
2006. 34(1): p. 322-33.
57. Lin, X., et al., A robust in vivo positive-readout system for monitoring siRNA delivery
to xenograft tumors. RNA, 2011. 17(4): p. 603-12.
58. Shah, K., et al., Real-time imaging of TRAIL-induced apoptosis of glioma tumors in
vivo. Oncogene, 2003. 22(44): p. 6865-72.
59. Serganova, I., et al., Multimodality imaging of TGFbeta signaling in breast cancer
metastases. FASEB J, 2009. 23(8): p. 2662-72.
60. Santos, E.B., et al., Sensitive in vivo imaging of T cells using a membrane-bound
Gaussia princeps luciferase. Nat Med, 2009. 15(3): p. 338-44.
61. Amit, D. and A. Hochberg, Development of targeted therapy for bladder cancer
mediated by a double promoter plasmid expressing diphtheria toxin under the control
of H19 and IGF2-P4 regulatory sequences. J Transl Med, 2010. 8: p. 134.

68
62. Kircheis, R., et al., Tumor-targeted gene delivery of tumor necrosis factor-alpha
induces tumor necrosis and tumor regression without systemic toxicity. Cancer Gene
Ther, 2002. 9(8): p. 673-80.
63. Brand, K., et al., Treatment of colorectal liver metastases by adenoviral transfer of
tissue inhibitor of metalloproteinases-2 into the liver tissue. Cancer Res, 2000. 60(20):
p. 5723-30.
64. Smrekar, B, et al., Tissue-dependent factors affect gene delivery in tumors in vivo.
Gene Therapy 2003. 10 (13): p. 1079 -88
65. Kircheis, R, et al.,Polycation-based DNA complexes for tumor targeted gene delivery
in vivo. J Gene Med., 1999. 1(2): 111-20

69
8. Acknowledgement
With the end of this thesis another period of my life begins.
At this place I want to thank all the people who supported me during the last two
years in my professional as well as personal life.
First of all I want to thank Prof. Dr. Eckard Wolf for the acceptance of this thesis at
the veterinary faculty of the Ludwig-Maximilian-University Munich.
I want to thank a lot Prof. Dr. Ernst Wagner to give me the chance to perform the
work for this thesis in his lab and standing behind me whenever I need it.
Special thanks to PD Dr. Manfred Ogris for introducing me into the world of
bioluminescent and fluorescent imaging, for nudging me into the right direction and
helping me whenever I had a “Knoten im Gehirn”
The funding by the grants from Roche Kulmbach, DFG SPP1230 and NIM
Excellence Cluster is great fully acknowledged.
Also I want to thank Dr. Martina Rüffer for giving me the opportunity to show the
students the world of histology and microbiology – it was a lot of fun.
A huge thank you goes to all of my colleagues – the former and the present. Lot of
you have become more than “just colleagues”.
A big thank you to Dr. Gelja Surma for helping me to find my way in the world of
animal experiment planning and analysis, without you I would have got lost
somewhere in the deep “Excel-forest” and also thanks for the wonder full weekends
spend with brunching, laughing and rasping horse teeth. And I will never forget our
first rabbit leg surgery ;).
Thanks a lot Arzu Cengizeroglu for kicking me to go boulder with you, for showing
and patiently explaining me the world of plasmids and for being such a great friend.
Special thanks to Rebekka Kubisch for pulling me up on my feet again when I feel
bad, for being the best roommate I ever had, all the wonderful moments we have
spent together and showing me the world of western blotting (I simply love it).
I would also like to thank Christian Dohmen for the fruitful discussions in all respects
in professional but most notably in personal life, simply for being such a good friend.
A huge thank you to Markus Kovac for being there whenever I have needed a hug,
for all octoberfest/skitrips/beer evenings we spent together and simply being the way
you are. Without you I would have never made the animal house running like this.

70
Thanks to all our technicians for the nice talks in the kitchen and Anna for helping me
with the histological preparation and staining of tumor samples.
Special thank to Wolfgang Rödl for the patient technical support helping out with
problems like “my monitor went blue”, “the oxygen flask of the anesthesia device is
making strange sounds”, “the IVIS is making strange sounds and I don´t want to talk
to Pill anymore” and “my computer is doing strange things again” and for sharing with
me the meaning of “a calm weekend duty”.
I will never forget the wonderful greek restaurant evenings, drinking tchai and sago
breakfast with Prajakta Oak. Thanks for introducing me to the Indian culture, talking
such a lot English to me and teaching me words like vacuum cleaner and charger.
I will always remember the time I have spent on octoberfest and the frequency
festival with Christian Marfels, David Schaffert and all the others. Thank you David for
helping me to improve my presentation technique and that you are always speeking
out the truth, I appreciate that a lot. Christian thanks not only for the festivals, but also
that you are such a good friend always having an ear open for the problems causing
me heartache.
And thanks to all others that accompanied me during my lab time - Kerstin Knoop
and Kim Bentrup for the wonderful time in the animal house. Edith Salcher and
Rudolf Haase for the nice talks during the smoking breaks (and Rudi of course for all
the whole plasmid universe), Christina Troiber for sharing with me the feelings of
singletime in Munich, Thomas Fröhlich and Kevin Maier for making me laugh with
their dry kind of humor and of course Florian Kopp, Daniel Edinger, Claudia Scholz ,
Ulrich Lächelt and Petra Kos for having a wonderful Partytime.

![Heterochromatic trandnactivation of Drosophila white Transgenes … · 2002. 7. 5. · these white transgenes to variegate. P[99B]A2,3 contains a stable source of genomically encoded](https://img.pdfslide.us/doc/110x75/6111e5c8043f79505b4807c8/heterochromatic-trandnactivation-of-drosophila-white-transgenes-2002-7-5-these.jpg)