Embed Size (px)
Citation preview

Biology & Combined Science (Biology) Report on 2017 Exam
Ben Tsui Manager (Biology), HKEAA 16 & 22 November 2017

Overview of Exam Statistics Paper Biology CS(Bio)
1A (MC) Mean : 22.8 out of 36
(i.e. 63.4%) Mean : 13.0 out of 24
(i.e. 54.1%)
1 49.9% 40.3%
2 48.5% N.A.
SBA 72.0% 68.4%
Subject 54% (S.D. 16.3%) 45.5% (S.D. 14.2%)
Candidature 14864 550

Marking Panels Biology CS(Bio)
1B-1: Q.4,5,6,9
1B-2: Q.3,7,10
1B-3: Q.1,2,8,11
1B-1: Q.2,3,6
1B-2: Q.5
1B-3: Q.1,4,7 2A: Human Physiology
2B: Applied Ecology
2C: Microorganisms & Humans
2D: Biotechnology
---

Results Biology Level 5** 5*+ 5+ 4+ 3+ 2+ 1+ Percentage 1.9% 7.5% 18.9% 45.6% 71.1% 89.8% 96.9%
Combined Science (Biology) Level 5** 5*+ 5+ 4+ 3+ 2+ 1+ Percentage 0.4% 1.5% 3.8% 17.8% 45.8% 77.8% 92.7%

Number of candidates at top levels (Bio)
Level 2014 2015 2016 2017
DSE 5** 300 (1.7%) 305(1.8%) 288(1.8%) 273(1.9%)
DSE 5* 1183 (6.7%) 1270(7.5%) 1201(7.5%) 1074(7.5%)
DSE 5 2965 (16.8%)
3165 (18.7%)
2980 (18.6%)
2717 (18.9%)
Candidature 17648 16927 16020 14864
Subject mean 47.6 55.4 50.8 54

Performance in MC items (relative to this cohort)
Biology
% of cand. correct >70% 50%-70% <50%
No. of Q 13 19 4
CS Biology
% of cand. correct >70% 50%-70% <50%
No. of Q 4 11 9
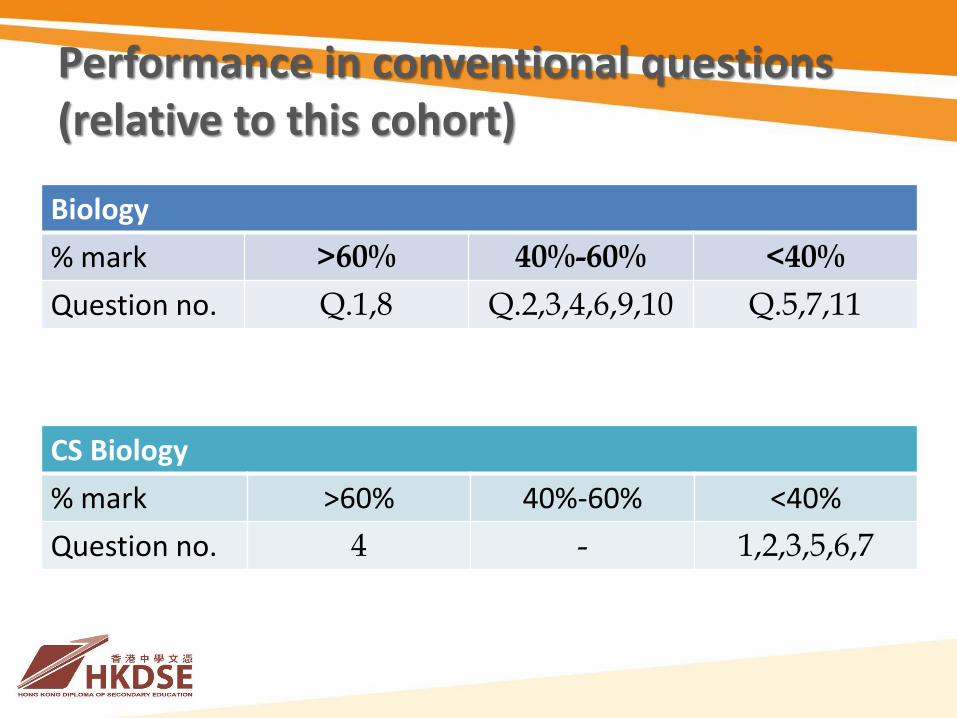
Performance in conventional questions (relative to this cohort)
Biology
% mark >60% 40%-60% <40%
Question no. Q.1,8 Q.2,3,4,6,9,10 Q.5,7,11
CS Biology
% mark >60% 40%-60% <40%
Question no. 4 - 1,2,3,5,6,7

• Mark equating was applied to the 4 questions in Paper 2
• After equating:
Elective Popularity Mean % mark
Human Physiology 95% 49.4
Applied Ecology 66% 46.1
Microorganisms & Humans 7% 39.8
Biotechnology 31% 53.5
Mean marks for Paper 2
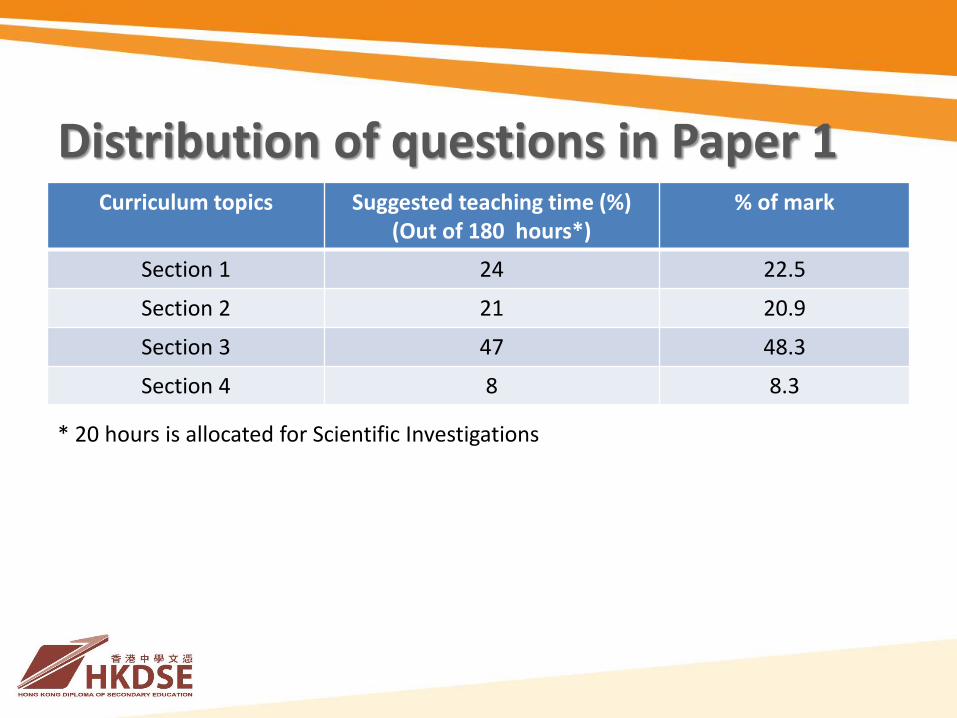
Distribution of questions in Paper 1 Curriculum topics Suggested teaching time (%)
(Out of 180 hours*) % of mark
Section 1 24 22.5
Section 2 21 20.9
Section 3 47 48.3
Section 4 8 8.3
* 20 hours is allocated for Scientific Investigations
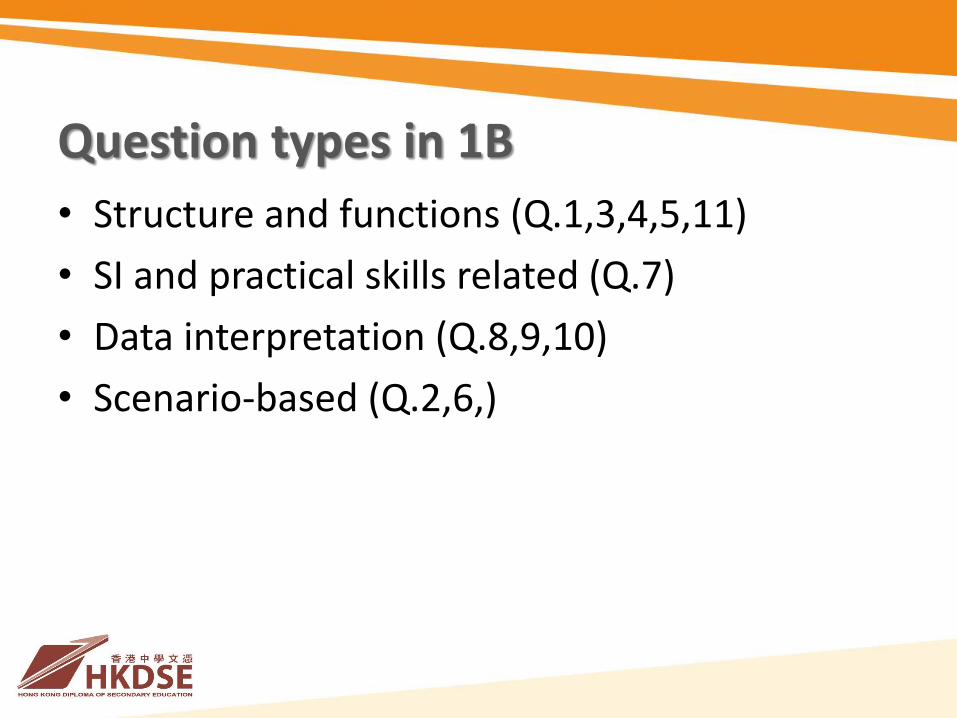
Question types in 1B
• Structure and functions (Q.1,3,4,5,11)
• SI and practical skills related (Q.7)
• Data interpretation (Q.8,9,10)
• Scenario-based (Q.2,6,)

Distribution of questions in Paper 1B according to abilities tested and candidates’ performance
Abilities tested % of mark Mean mark (%)
Recall of facts and knowledge alone 26 47.2
Understanding of knowledge, concepts and principles 13 35.2
Application of knowledge to explain and solve problems 17 36.2
Interpretation, analysis, synthesis and evaluation 29 39.8
Experimental design, NOS and effective communication 15 27.2
Abilities tested % of mark Mean mark (%)
Recall of facts and knowledge alone 23 47.8
Understanding of knowledge, concepts and principles 33 46.8
Application of knowledge to explain and solve problems 19 30.1
Interpretation, analysis, synthesis and evaluation 15 29.2
Experimental design, NOS and effective communication 10 46.6
2017
2016

General comments:
• Candidates can handle questions that require a lower cognitive demand, e.g.
– Recall of biological knowledge
– Simple data description and interpretation

• Candidates had difficulties in handling questions involving reasoning, analysis and inference, often gave irrelevant answers by reciting textbook materials or answers from previous exam
• Candidates used laymen terms in their answers which cannot convey the meanings of specific terms

• In describing process, candidates often mixed up or missed details, e.g. – failed to point out the specific cell types, e.g.
• body develop memory of the antigens
• memory cells produce large amount of antibodies
• pollen tube releases male gametes to fuse with ovule in fertilisation
– missing subjects, e.g. • there are more genetic variation (missing offspring)
• a large amount of antibodies will be produced (missing specific lymphocytes / plasma cells)
• higher blood pressure forces fluid out of the capillaries (missing at the arterial end)

• Cannot distinguish observation / data description from conclusions / inferences, e.g. in Q.8(a)
Inhibits
Promotes
No effects

• Observation / data description – A grows from 20 cm to 22.5 cm, B grows from …
(simply repeating the data with words)
• Comparison of data, but not refer to the aim / design of experiment – A grows 2.5 cm taller, B grows 25 cm taller, C …
(comparison with regard to initial height)
– A has smallest growth, B has greatest growth, C…
(comparison among the three sets of data)

Questions with skills that are common to SBA (Paper 1A)
Qs Skills assessed % Correct
Q.3 Results prediction 34% (Bio); 22% (CS Bio)
Q.4 Experimental design 23% (Bio); 19% (CS Bio)
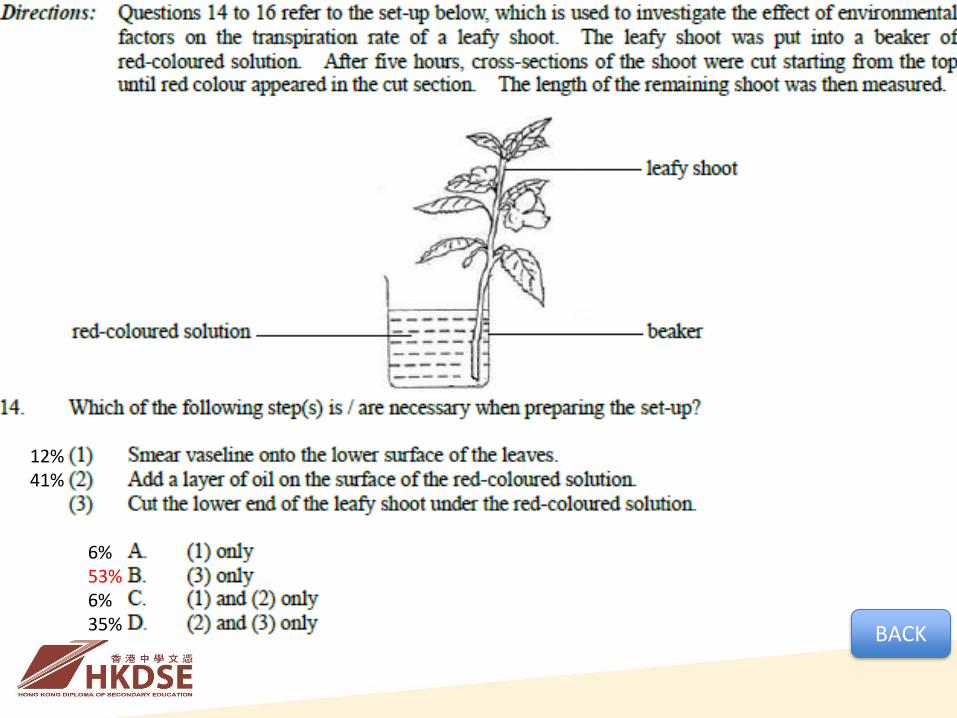
Q.14 Experimental design 53% (Bio); 41% (CS Bio)
Q.15 Results prediction 76% (Bio); 74% (CS Bio)
Q.16 Distribution of stain xylem 61% (Bio); 33% (CS Bio)
Q.21 Photomicrograph of embryo development 53% (Bio); 46% (CS Bio)
Next

BACK
34% 21% 23% 22%
44%
Completely negative?

BACK
23% 37% 23% 17%
Candidates who have chosen C have the highest mean mark among the four groups and more top 20% candidates than other groups.

Benedict’s Test Iodine Test
Pre-test (system check) Post-test Pre-test Post-Test
P -ve → no reducing sugar contamination
-ve →(vs pre-test) no spontaneous breakdown of starch
+ve→ colour reference for comparison
+ve→ (vs pre-test) same colour confirms no breakdown of starch
Q -ve → no reducing sugar contamination
-ve →(vs pre-test) enzyme itself can’t produce sugar
-ve → no starch contamination
-ve → (vs pre-test) enzyme itself can’t alter the result of iodine test
R -ve → no reducing sugar contamination
+ve →(vs pre-test) reducing sugar is formed
+ve→ same colour as P pre-test
+/-ve→ (vs pre-test) lighter blue black = breakdown of starch
S -ve → no reducing sugar contamination
-ve →(vs R post-test) conclusion: results in R is due to enzyme action
+ve→ same colour as P pre-test
+ve→ (vs pre-test) same colour confirms no breakdown of starch
BACK
6% 53% 6% 35%
12% 41%

BACK
76% 5% 3% 15%

BACK
19% 4%
16% 61%

BACK 32% 53% 1% 14%
99% 33% 68%

Questions with skills that are common to SBA (Paper 1B)
Qs Skills assessed
4 Electron micrograph interpretation
7 Experimental design: rate of photosynthesis of an aquatic plant
8 Results interpretation on the effect of bacteria on the growth of plant X
10 Hypothesis, data interpretation, experimental design, NOS (tongue rolling)
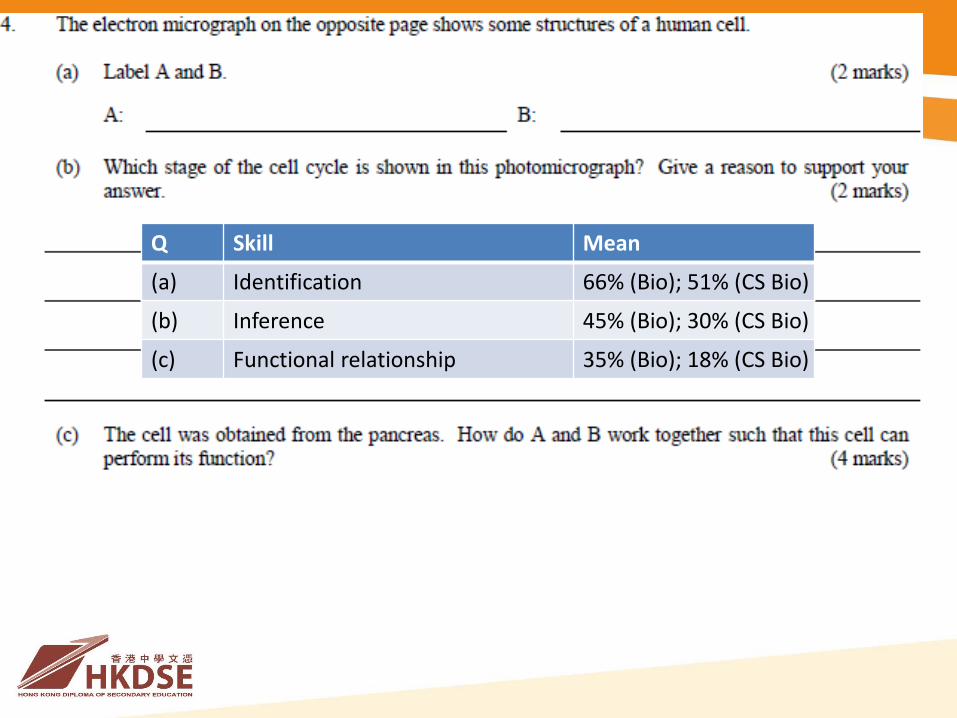
Q Skill Mean
(a) Identification 66% (Bio); 51% (CS Bio)
(b) Inference 45% (Bio); 30% (CS Bio)
(c) Functional relationship 35% (Bio); 18% (CS Bio)

Q Skill Mean
(a) Identification 73%
(b) Inference 45%
(c) Functional relationship 35%
VS 2016

Q Skill Mean
(a) Assumption making 6% (372 scored full mark)
(b) Experimental design (control variables) 14% (1146 scored full mark)
(c) Products and significance 44%

Do not accept increase CO2 to make it not limiting because:
1. The experiment is not aiming at finding the optimum conditions for photosynthesis.
2. Even if CO2 is not limiting, temperature is another limiting factor.

Q Skill Mean
(a) Conclusion 74% (Bio); 72% (CS Bio)
(b) Inference 56% (Bio); 42% (CS Bio)
(c)(i) Read data 96% (Bio); 93% (CS Bio)
(c)(ii) Inference 79% (Bio); 70% (CS Bio)
(d) Prediction using results from (a) and (c) 57% (Bio); 47% (CS Bio)
8.

Q Skill Mean
(a)(i) Identify the type of variation 59% (Bio); 48% (CS Bio)
(a)(ii) Explanation of how a conclusion is arrived at 43% (Bio); 26% (CS Bio)
(b) Hypothesis testing (data did not support hypothesis) 64% (Bio); 52% (CS Bio)
(c)(i) Experimental design 36% (Bio); 24% (CS Bio)
(c)(ii) Data interpretation 52% (Bio); 39% (CS Bio)
(d)(i) Ideas about Science 70% (Bio); 66.5% (CS Bio)
(d)(ii) Nature of Science 4% (Bio); 2% (CS Bio)
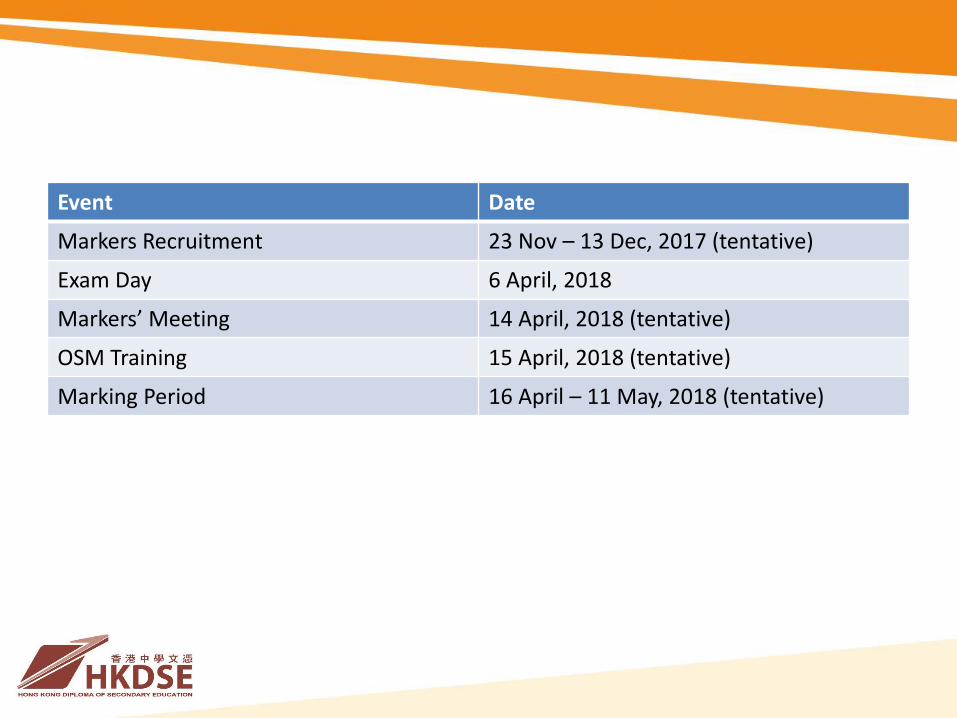
Event Date
Markers Recruitment 23 Nov – 13 Dec, 2017 (tentative)
Exam Day 6 April, 2018
Markers’ Meeting 14 April, 2018 (tentative)
OSM Training 15 April, 2018 (tentative)
Marking Period 16 April – 11 May, 2018 (tentative)