Embed Size (px)
Citation preview

State of Ohio Monitoring and Assessment SectionEnvironmental Protection Agency Division of Surface Water
P.O. Box 1049, 1800 WaterMark Dr., Columbus, Ohio 43216-1049
August 30, 1995
Biological, Sediment and Water QualityStudy of Chapman Run and AssociatedWetlands
Shieldalloy Metallurgical CorporationGuernsey County, Ohio
Creek Chub (Semotilus atromaculatus)
Mayfly (Stenacron sp.)
DSW/MAS 1995-8-10 Chapman Run/ Shieldalloy August 30, 1995
Biological, Sediment and Water Quality Study of
Chapman Runand Associated Wetlands
Shieldalloy Metallurgical Corporation
Guernsey County, Ohio
August 30, 1995
OEPA Technical Report MAS/1995-8-10
prepared for
State of Ohio Environmental Protection AgencyDivision of Emergency and Remedial Response
prepared by
State of Ohio Environmental Protection AgencyDivision of Surface Water
Monitoring & Assessment Section1685 Westbelt Drive
Columbus, Ohio 43228

DSW/MAS 1995-8-10 Chapman Run/ Shieldalloy August 30, 1995
TABLE OF CONTENTS
PageNotice to Users. . . . . . . . . . . . . . . . . . . . . . . . . . . . . . . . . . . . . . . . iiAcknowledgements. . . . . . . . . . . . . . . . . . . . . . . . . . . . . . . . . . . . . .iiiIntroduction. . . . . . . . . . . . . . . . . . . . . . . . . . . . . . . . . . . . . . . . . . . 1Summary / Conclusions. . . . . . . . . . . . . . . . . . . . . . . . . . . . . . . . . . 2Recommendations. . . . . . . . . . . . . . . . . . . . . . . . . . . . . . . . . . . . . . . 4
Status of Aquatic Life Uses. . . . . . . . . . . . . . . . . . . . . . . . . . . . . . . 4Status of Non-aquatic Life Uses. . . . . . . . . . . . . . . . . . . . . . . . . . . . 4Other Recommendations. . . . . . . . . . . . . . . . . . . . . . . . . . . . . . . . . 4
Methods. . . . . . . . . . . . . . . . . . . . . . . . . . . . . . . . . . . . . . . . . . . . . . 8Habitat Assessment. . . . . . . . . . . . . . . . . . . . . . . . . . . . . . . . . . . . 8Surface Water/ Sediment Assessment. . . . . . . . . . . . . . . . . . . . . . . . 9Macroinvertebrate Community Assessment. . . . . . . . . . . . . . . . . . . . 9Fish Assessment. . . . . . . . . . . . . . . . . . . . . . . . . . . . . . . . . . . . . . 9Causal Associations. . . . . . . . . . . . . . . . . . . . . . . . . . . . . . . . . . . . 9
Results and Discussion. . . . . . . . . . . . . . . . . . . . . . . . . . . . . . . . . . . 13Surface Water Chemical Quality. . . . . . . . . . . . . . . . . . . . . . . . . . . 13Sediment Quality. . . . . . . . . . . . . . . . . . . . . . . . . . . . . . . . . . . . . 14Physical habitat. . . . . . . . . . . . . . . . . . . . . . . . . . . . . . . . . . . . . . 19Biological Assessment: Macroinvertebrate Community. . . . . . . . . . . . .21Biological Assessment: Fish Community. . . . . . . . . . . . . . . . . . . . . 24Fish tissue. . . . . . . . . . . . . . . . . . . . . . . . . . . . . . . . . . . . . . . . . 27
References. . . . . . . . . . . . . . . . . . . . . . . . . . . . . . . . . . . . . . . . . . . . 30Appendix Tables. . . . . . . . . . . . . . . . . . . . . . . . . . . . . . . . . . . . . . . 33
i
DSW/MAS 1995-8-10 Chapman Run/ Shieldalloy August 30, 1995
NOTICE TO USERS
Ohio EPA incorporated biological criteria into the Ohio Water Quality Standards (WQS; OhioAdministrative Code 3745-1) regulations in February 1990 (effective May 1990). These criteriaconsist of numeric values for the Index of Biotic Integrity (IBI) and Modified Index of Well-Being(MIwb), both of which are based on fish assemblage data, and the Invertebrate Community Index(ICI), which is based on macroinvertebrate assemblage data. Criteria for each index are specifiedfor each of Ohio's five ecoregions (as described by Omernik 1987), and are further organized byorganism group, index, site type, and aquatic life use designation. These criteria, along with theexisting chemical and whole effluent toxicity evaluation methods and criteria, figure prominently inthe monitoring and assessment of Ohio’s surface water resources.
The following Ohio EPA documents support the use of biological criteria by outlining the rationalefor using biological information, the methods by which the biocriteria were derived and calculated,the field methods by which sampling must be conducted, and the process for evaluating results:
Ohio Environmental Protection Agency. 1987a. Biological criteria for the protection of aquatic life:Volume I. The role of biological data in water quality assessment. Division of WaterQuality Monitoring & Assessment, Surface Water Section, Columbus, Ohio.
Ohio Environmental Protection Agency. 1987b. Biological criteria for the protection of aquatic life:Volume II. Users manual for biological field assessment of Ohio surface waters. Divisionof Water Quality Monitoring & Assessment, Surface Water Section, Columbus, Ohio.
Ohio Environmental Protection Agency. 1989b. Addendum to Biological criteria for the protectionof aquatic life: Volume II. Users manual for biological field assessment of Ohio surfacewaters. Division of Water Quality Planning & Assessment, Ecological AssessmentSection, Columbus, Ohio.
Ohio Environmental Protection Agency. 1989c. Biological criteria for the protection of aquatic life:Volume III. Standardized biological field sampling and laboratory methods for assessingfish and macroinvertebrate communities. Division of Water Quality Planning &Assessment, Ecological Assessment Section, Columbus, Ohio.
Ohio Environmental Protection Agency. 1990. The use of biological criteria in the Ohio EPAsurface water monitoring and assessment program. Division of Water Quality Planning &Assessment, Ecological Assessment Section, Columbus, Ohio.
Rankin, E.T. 1989. The qualitative habitat evaluation index (QHEI): rationale,methods, andapplication. Division of Water Quality Planning & Assessment, Ecological AssessmentSection, Columbus, Ohio.
These documents and this report can be obtained by writing to or calling:
Ohio EPA, Division of Surface WaterMonitoring and Assessment Section
1685 Westbelt DriveColumbus, Ohio 43228-3809
(614) 728-3377
ii
DSW/MAS 1995-8-10 Chapman Run/ Shieldalloy August 30, 1995
ACKNOWLEDGEMENTS
The following persons are acknowledged for their significant contributions to this report.
Report Coordinator, Introduction, and Summary - David AltfaterMethods - Chris Yoder, David AltfaterSediment Quality - David AltfaterSurface Water Quality - David AltfaterPhysical Habitat - David AltfaterMacroinvertebrate Assemblages - Bernie Counts
Fish Assemblages - David AltfaterProgramming and Data Management - Charlie Staudt, Edward T. Rankin, and Dennis Mishne Reviewers - Chris Yoder, Marc Smith, Jeff DeShon
This evaluation and report would not have been possible without the assistance of numerous full andpart time staff in the field and offices. The chemistry analyses (laboratory) were conducted by theOhio EPA, Division of Environmental Services and Ross Analytical Services. Jim Grow and LarryPennington collected the surface water samples. The following college interns provided supportduring field sampling activities: Bret Henninger, Mike Pettegrew, and Brenda Hart.
iii
DSW/MAS 1995-8-10 Chapman Run/ Shieldalloy August 30, 1995
Biological, Sediment and Water Quality Studyof
Chapman Runand Associated Wetlands
Guernsey County (Ohio)
State of Ohio Environmental Protection AgencyDivision of Surface Water
1800 WaterMark Drive Columbus, Ohio 43216-3669
INTRODUCTION
The Chapman Run study area included the lower six miles of Chapman Run. Included in the studywas the collection and evaluation of fish community, macroinvertebrate community, surface water,sediment, and fish tissue data. In addition, sediment samples were collected at numerous wetlandsampling locations and small drainageways adjacent to the East and West Slag Piles, which aresituated on Shieldalloy Metallurgical Corporation (SMC) property. Specific sampling locations aredetailed in Table 2 and Figures 1 and 2. The SMC facility is presently in operation to manufactureferrovanadium alloys. The Vanadium Corporation of America began operations at the SMC site in1953. From the original company through various other owners, the facility was used tomanufacture ferrocolumbium alloys, ferrovanadium alloys and vanadium compounds. During atleast part of the time, radioactive materials (uranium and thorium) were used to produce theferrocolumbium alloys. Radioactive slags were generated, and this slag material has been stored atthe facility from 1953 until the present. Nonradioactive slags and baghouse dust were generatedand deposited in the East and West Slag Piles from 1973 until the present (PRC 1993). Two smalldrainageways (East Slag Ditch and West Slag Ditch) convey surface water runoff from the SMCproperty and adjacent wetlands into Chapman Run in the vicinity of river mile (RM) 0.8 - RM 1.4.
The principal objectives of this study were to:
1) monitor and assess chemical, physical and biological integrity of the lower Chapman Run,
2) determine the extent of hazardous chemical constituents and other constituents in ChapmanRun and the adjacent wetland in the vicinity of Shieldalloy,
3) establish the present aquatic life use status in Chapman Run,
4) evaluate potential impacts associated with nonpoint source runoff (i.e. mine drainage) andinfluences from a sewage lift station located on the Shieldalloy property, and
5) identify the relative significance of Shieldalloy site contaminants on any demonstratedimpairments in Chapman Run.
Standardized methods were used throughout the study area to collect quantitative and qualitativebiological, chemical, and physical data. Other relevant information indicative of potential
1
DSW/MAS 1995-8-10 Chapman Run/ Shieldalloy August 30, 1995
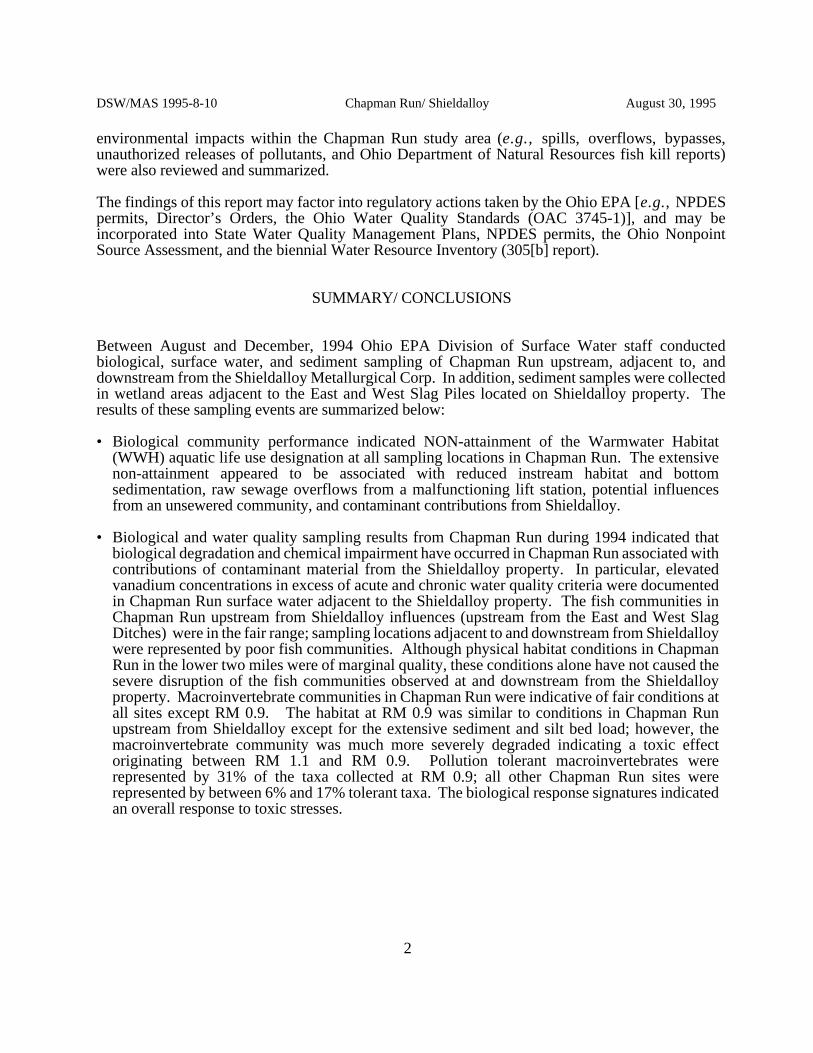
environmental impacts within the Chapman Run study area (e.g., spills, overflows, bypasses,unauthorized releases of pollutants, and Ohio Department of Natural Resources fish kill reports)were also reviewed and summarized.
The findings of this report may factor into regulatory actions taken by the Ohio EPA [e.g., NPDESpermits, Director’s Orders, the Ohio Water Quality Standards (OAC 3745-1)], and may beincorporated into State Water Quality Management Plans, NPDES permits, the Ohio NonpointSource Assessment, and the biennial Water Resource Inventory (305[b] report).
SUMMARY/ CONCLUSIONS
Between August and December, 1994 Ohio EPA Division of Surface Water staff conductedbiological, surface water, and sediment sampling of Chapman Run upstream, adjacent to, anddownstream from the Shieldalloy Metallurgical Corp. In addition, sediment samples were collectedin wetland areas adjacent to the East and West Slag Piles located on Shieldalloy property. Theresults of these sampling events are summarized below:
• Biological community performance indicated NON-attainment of the Warmwater Habitat(WWH) aquatic life use designation at all sampling locations in Chapman Run. The extensivenon-attainment appeared to be associated with reduced instream habitat and bottomsedimentation, raw sewage overflows from a malfunctioning lift station, potential influencesfrom an unsewered community, and contaminant contributions from Shieldalloy.
• Biological and water quality sampling results from Chapman Run during 1994 indicated thatbiological degradation and chemical impairment have occurred in Chapman Run associated withcontributions of contaminant material from the Shieldalloy property. In particular, elevatedvanadium concentrations in excess of acute and chronic water quality criteria were documentedin Chapman Run surface water adjacent to the Shieldalloy property. The fish communities inChapman Run upstream from Shieldalloy influences (upstream from the East and West SlagDitches) were in the fair range; sampling locations adjacent to and downstream from Shieldalloywere represented by poor fish communities. Although physical habitat conditions in ChapmanRun in the lower two miles were of marginal quality, these conditions alone have not caused thesevere disruption of the fish communities observed at and downstream from the Shieldalloyproperty. Macroinvertebrate communities in Chapman Run were indicative of fair conditions atall sites except RM 0.9. The habitat at RM 0.9 was similar to conditions in Chapman Runupstream from Shieldalloy except for the extensive sediment and silt bed load; however, themacroinvertebrate community was much more severely degraded indicating a toxic effectoriginating between RM 1.1 and RM 0.9. Pollution tolerant macroinvertebrates wererepresented by 31% of the taxa collected at RM 0.9; all other Chapman Run sites wererepresented by between 6% and 17% tolerant taxa. The biological response signatures indicatedan overall response to toxic stresses.
2
DSW/MAS 1995-8-10 Chapman Run/ Shieldalloy August 30, 1995
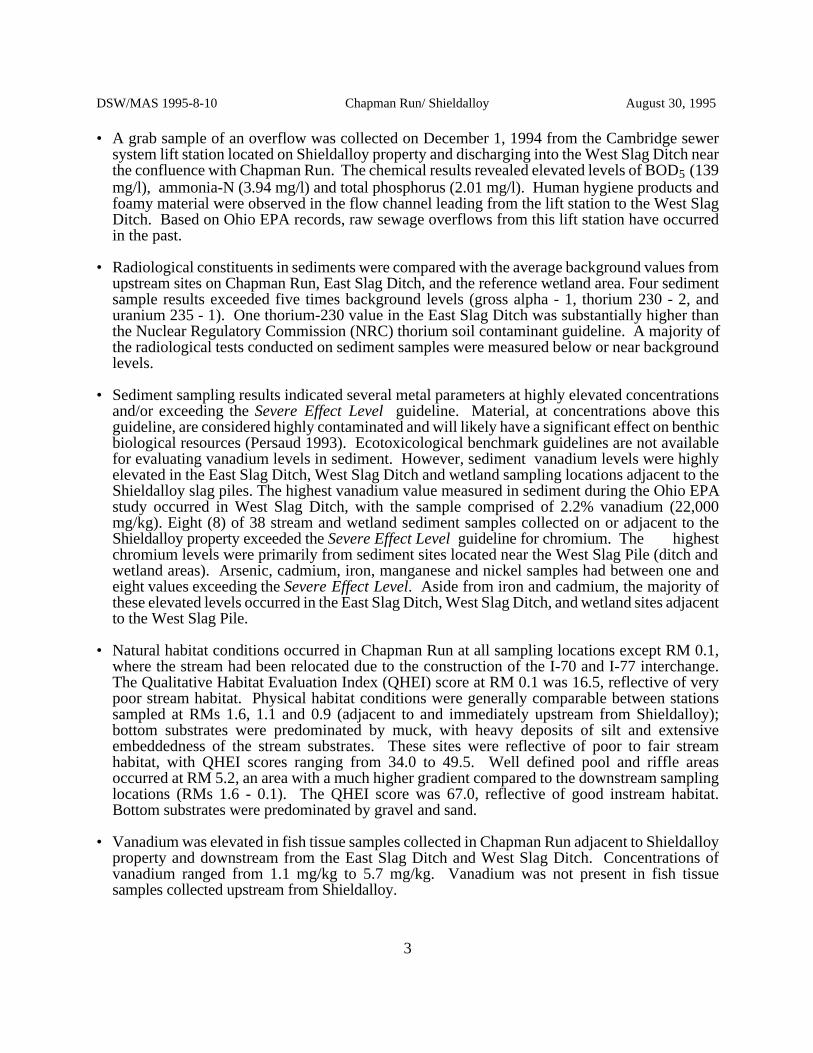
• A grab sample of an overflow was collected on December 1, 1994 from the Cambridge sewersystem lift station located on Shieldalloy property and discharging into the West Slag Ditch nearthe confluence with Chapman Run. The chemical results revealed elevated levels of BOD5 (139mg/l), ammonia-N (3.94 mg/l) and total phosphorus (2.01 mg/l). Human hygiene products andfoamy material were observed in the flow channel leading from the lift station to the West SlagDitch. Based on Ohio EPA records, raw sewage overflows from this lift station have occurredin the past.
• Radiological constituents in sediments were compared with the average background values fromupstream sites on Chapman Run, East Slag Ditch, and the reference wetland area. Four sedimentsample results exceeded five times background levels (gross alpha - 1, thorium 230 - 2, anduranium 235 - 1). One thorium-230 value in the East Slag Ditch was substantially higher thanthe Nuclear Regulatory Commission (NRC) thorium soil contaminant guideline. A majority ofthe radiological tests conducted on sediment samples were measured below or near backgroundlevels.
• Sediment sampling results indicated several metal parameters at highly elevated concentrationsand/or exceeding the Severe Effect Level guideline. Material, at concentrations above thisguideline, are considered highly contaminated and will likely have a significant effect on benthicbiological resources (Persaud 1993). Ecotoxicological benchmark guidelines are not availablefor evaluating vanadium levels in sediment. However, sediment vanadium levels were highlyelevated in the East Slag Ditch, West Slag Ditch and wetland sampling locations adjacent to theShieldalloy slag piles. The highest vanadium value measured in sediment during the Ohio EPAstudy occurred in West Slag Ditch, with the sample comprised of 2.2% vanadium (22,000mg/kg). Eight (8) of 38 stream and wetland sediment samples collected on or adjacent to theShieldalloy property exceeded the Severe Effect Level guideline for chromium. The highestchromium levels were primarily from sediment sites located near the West Slag Pile (ditch andwetland areas). Arsenic, cadmium, iron, manganese and nickel samples had between one andeight values exceeding the Severe Effect Level. Aside from iron and cadmium, the majority ofthese elevated levels occurred in the East Slag Ditch, West Slag Ditch, and wetland sites adjacentto the West Slag Pile.
• Natural habitat conditions occurred in Chapman Run at all sampling locations except RM 0.1,where the stream had been relocated due to the construction of the I-70 and I-77 interchange.The Qualitative Habitat Evaluation Index (QHEI) score at RM 0.1 was 16.5, reflective of verypoor stream habitat. Physical habitat conditions were generally comparable between stationssampled at RMs 1.6, 1.1 and 0.9 (adjacent to and immediately upstream from Shieldalloy);bottom substrates were predominated by muck, with heavy deposits of silt and extensiveembeddedness of the stream substrates. These sites were reflective of poor to fair streamhabitat, with QHEI scores ranging from 34.0 to 49.5. Well defined pool and riffle areasoccurred at RM 5.2, an area with a much higher gradient compared to the downstream samplinglocations (RMs 1.6 - 0.1). The QHEI score was 67.0, reflective of good instream habitat.Bottom substrates were predominated by gravel and sand.
• Vanadium was elevated in fish tissue samples collected in Chapman Run adjacent to Shieldalloyproperty and downstream from the East Slag Ditch and West Slag Ditch. Concentrations ofvanadium ranged from 1.1 mg/kg to 5.7 mg/kg. Vanadium was not present in fish tissuesamples collected upstream from Shieldalloy.
3
DSW/MAS 1995-8-10 Chapman Run/ Shieldalloy August 30, 1995
RECOMMENDATIONS
Status of Aquatic Life Uses
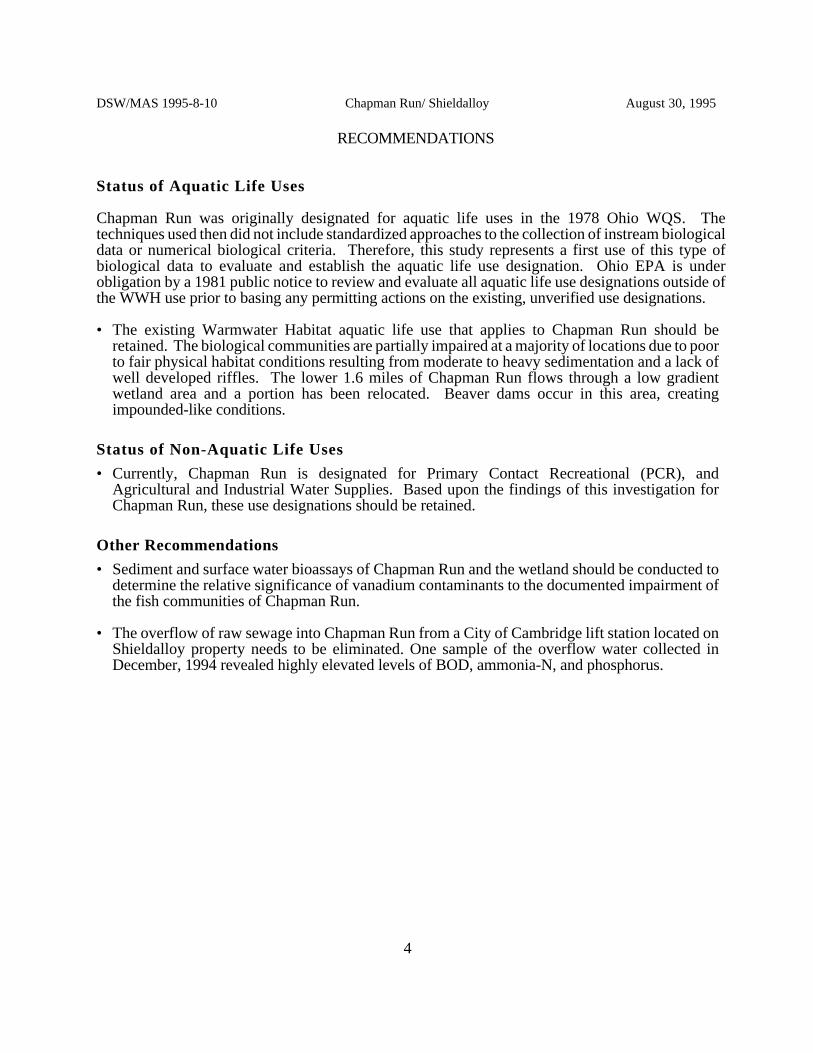
Chapman Run was originally designated for aquatic life uses in the 1978 Ohio WQS. Thetechniques used then did not include standardized approaches to the collection of instream biologicaldata or numerical biological criteria. Therefore, this study represents a first use of this type ofbiological data to evaluate and establish the aquatic life use designation. Ohio EPA is underobligation by a 1981 public notice to review and evaluate all aquatic life use designations outside ofthe WWH use prior to basing any permitting actions on the existing, unverified use designations.
• The existing Warmwater Habitat aquatic life use that applies to Chapman Run should beretained. The biological communities are partially impaired at a majority of locations due to poorto fair physical habitat conditions resulting from moderate to heavy sedimentation and a lack ofwell developed riffles. The lower 1.6 miles of Chapman Run flows through a low gradientwetland area and a portion has been relocated. Beaver dams occur in this area, creatingimpounded-like conditions.
Status of Non-Aquatic Life Uses
• Currently, Chapman Run is designated for Primary Contact Recreational (PCR), andAgricultural and Industrial Water Supplies. Based upon the findings of this investigation forChapman Run, these use designations should be retained.
Other Recommendations
• Sediment and surface water bioassays of Chapman Run and the wetland should be conducted todetermine the relative significance of vanadium contaminants to the documented impairment ofthe fish communities of Chapman Run.
• The overflow of raw sewage into Chapman Run from a City of Cambridge lift station located onShieldalloy property needs to be eliminated. One sample of the overflow water collected inDecember, 1994 revealed highly elevated levels of BOD, ammonia-N, and phosphorus.
4
DSW/MAS 1995-8-10 Chapman Run/ Shieldalloy August 30, 1995
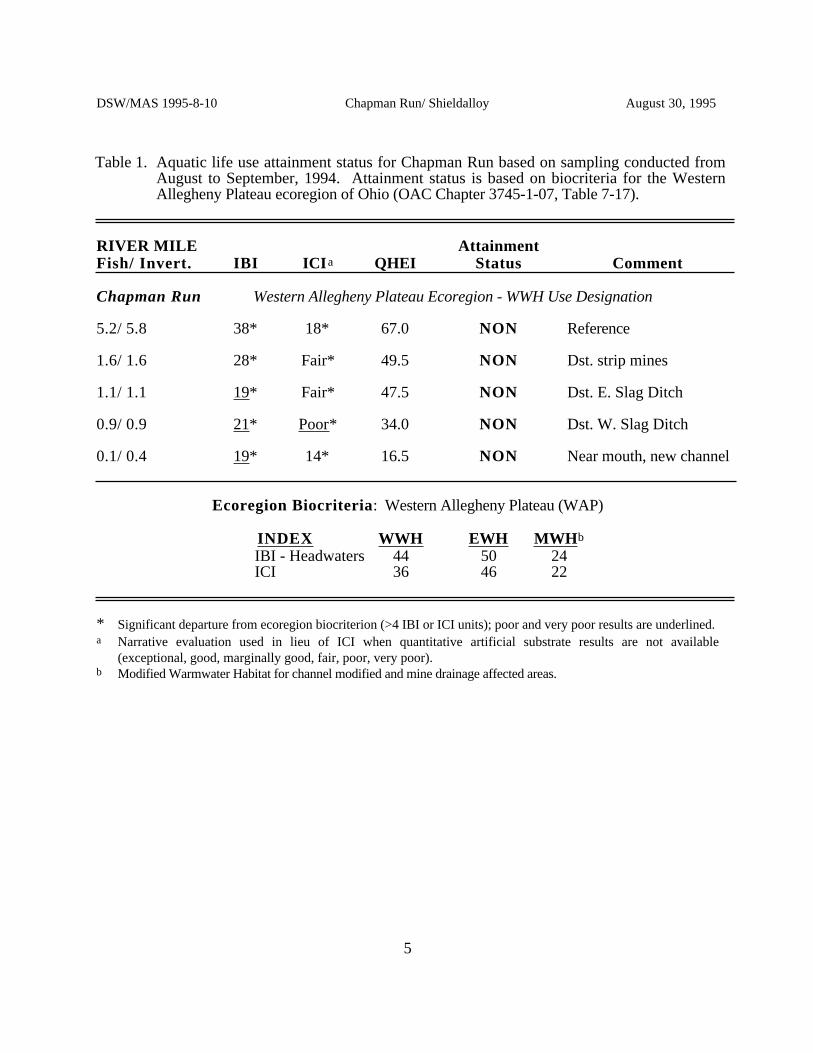
Table 1. Aquatic life use attainment status for Chapman Run based on sampling conducted fromAugust to September, 1994. Attainment status is based on biocriteria for the WesternAllegheny Plateau ecoregion of Ohio (OAC Chapter 3745-1-07, Table 7-17).
RIVER MILE AttainmentFish/ Invert. IBI ICIa QHEI Status Comment
Chapman Run Western Allegheny Plateau Ecoregion - WWH Use Designation
5.2/ 5.8 38* 18* 67.0 NON Reference
1.6/ 1.6 28* Fair* 49.5 NON Dst. strip mines
1.1/ 1.1 19* Fair* 47.5 NON Dst. E. Slag Ditch
0.9/ 0.9 21* Poor* 34.0 NON Dst. W. Slag Ditch
0.1/ 0.4 19* 14* 16.5 NON Near mouth, new channel
Ecoregion Biocriteria: Western Allegheny Plateau (WAP)
INDEX WWH EWH MWHb
IBI - Headwaters 44 50 24ICI 36 46 22
* Significant departure from ecoregion biocriterion (>4 IBI or ICI units); poor and very poor results are underlined.a Narrative evaluation used in lieu of ICI when quantitative artificial substrate results are not available
(exceptional, good, marginally good, fair, poor, very poor).b Modified Warmwater Habitat for channel modified and mine drainage affected areas.
5
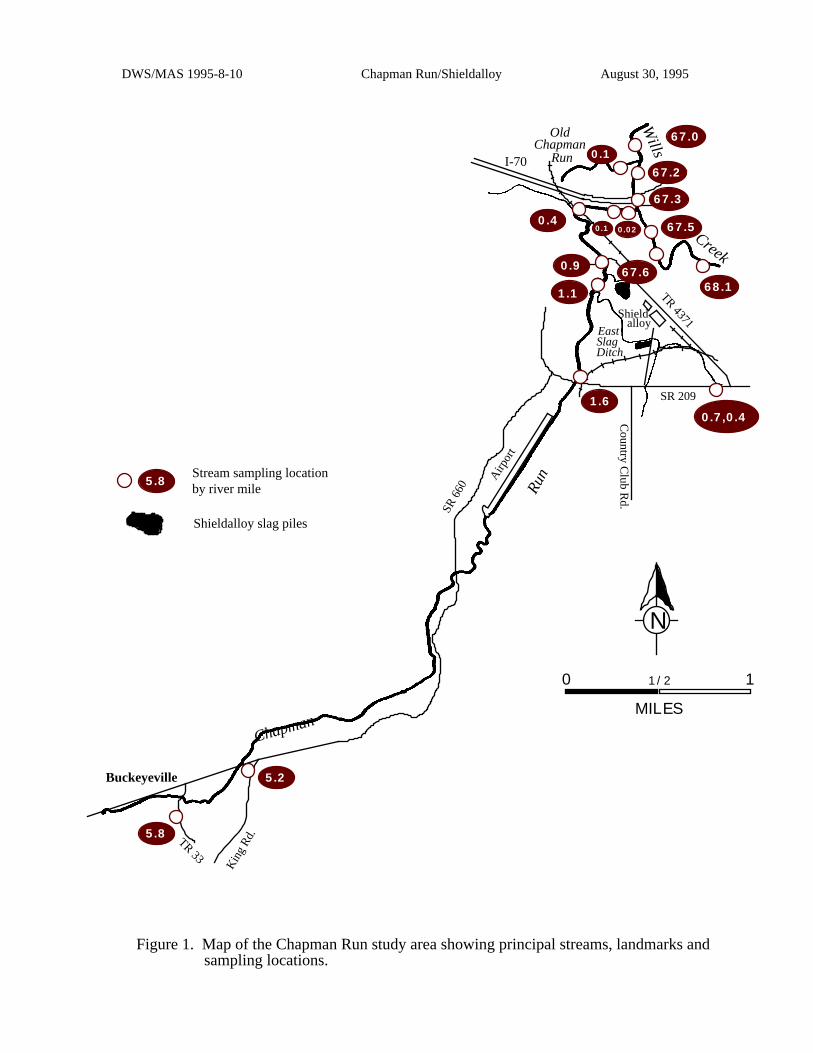
Figure 1. Map of the Chapman Run study area showing principal streams, landmarks and sampling locations.
5.2
5.8
1.1
1.6
0.4
68.1
67.5
0 11/2
MILES
N
Chapman
Run
Wills
Creek
SR 209
I-70 TR 4371
SR 6
60
TR 33
Kin
g R
d.
Airp
ort
Country C
lub Rd.
OldChapman
Run
EastSlagDitch
0.1
0.7,0.4
0.4
Buckeyeville
Shieldalloy
0.9 67.6
67.3
67.2
67.0
0.1 0.02
Stream sampling locationby river mile
5.8
Shieldalloy slag piles
Figure 1. Map of the Chapman Run study area showing principal streams, landmarks and sampling locations.
DWS/MAS 1995-8-10 Chapman Run/Shieldalloy August 30, 1995
DSW/MAS 1995-8-10 Chapman Run/ Shieldalloy August 30, 1995
SR 209
Old TR 4371
Sewage Lift Station
Barren Ground
BaghouseDustArea
Old N
0 500
FEET
WESTSLAGPILE
EASTSLAGPILE
RM 1.50
RM 1.17
RM 0.02
RM 1.05
RM 0.95
RM 0.98
RM 0.86
RM 0.65
RM 0.55
RM 0.42
RM 0.32
RM 0.20
RM 0.12
RM 0.05
LS
N-1N-2
N-3
W-1
W-2
W-3
SW-1
SW-2
SW-3SW-4
S-1
S-2
NW-1
NW-2
B-1
B-2
B-3
Sub-station
Shi
eldal
loy
entr
ance
roa
d
LS
Cha
pman
Run
East
Slag
Ditch
W.
Slag
Ditch
Sediment SamplingLocation - one depth
Sediment SamplingLocation - two depths
Wetland
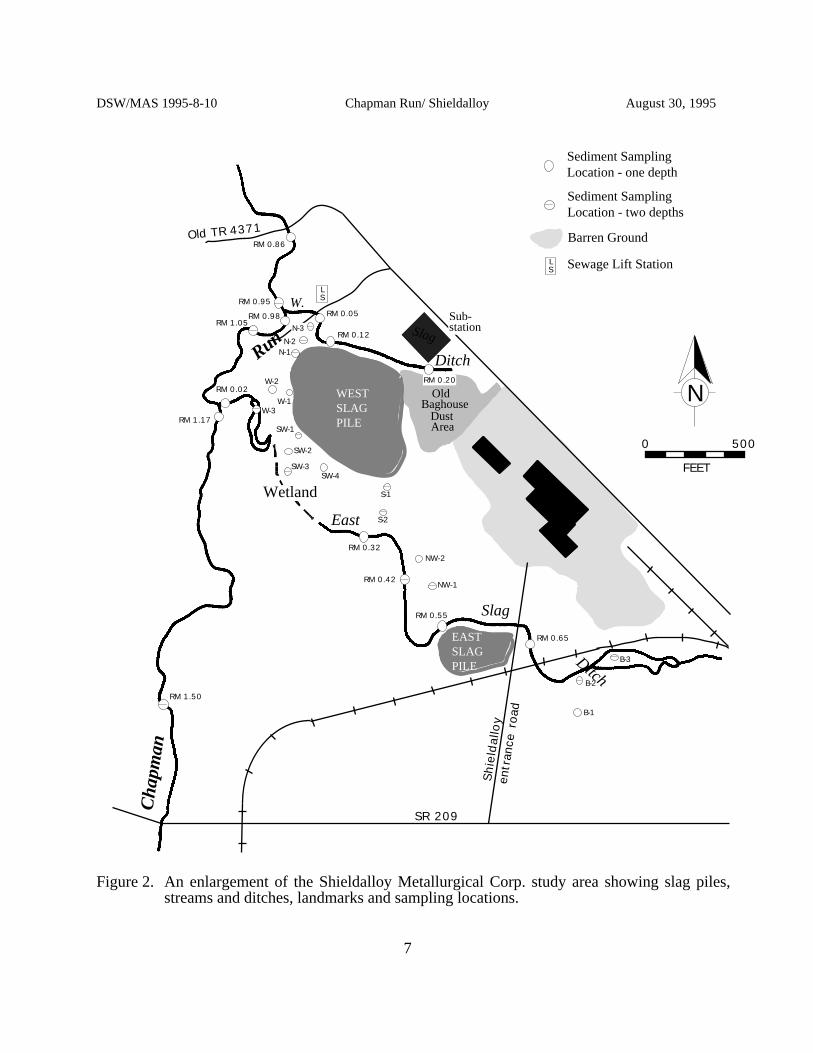
Figure 2. An enlargement of the Shieldalloy Metallurgical Corp. study area showing slag piles,streams and ditches, landmarks and sampling locations.
7

DSW/MAS 1995-8-10 Chapman Run/ Shieldalloy August 30, 1995
METHODS
All chemical, physical, and biological field, laboratory, data processing, and data analysismethodologies and procedures adhere to those specified in the Manual of Ohio EPA SurveillanceMethods and Quality Assurance Practices (Ohio Environmental Protection Agency 1989a) andBiological Criteria for the Protection of Aquatic Life, Volumes I-III (Ohio Environmental ProtectionAgency 1987a, 1987b, 1989b, 1989c), and The Qualitative Habitat Evaluation Index (QHEI):Rationale, Methods, and Application (Rankin 1989) for aquatic habitat assessment. All surfacewater, sediment, fish tissue and biological sampling locations are listed in Table 2.
Determining Use Attainment StatusThe attainment status of aquatic life uses (i.e., FULL, PARTIAL, and NON) is determined byusing the biological criteria codified in the Ohio Water Quality Standards (WQS; OhioAdministrative Code [OAC] 3745-1-07, Table 7-17). The biological community performancemeasures which are used include the Index of Biotic Integrity (IBI), based on fish communitycharacteristics, and the Invertebrate Community Index (ICI) which is based on macroinvertebratecommunity characteristics. The IBI and ICI are multimetric indices patterned after an original IBIdescribed by Karr (1981) and Fausch et al. (1984). The ICI was developed by Ohio EPA (1987b)and further described by DeShon (1995). Qualitative macroinvertebrate sampling consisted of aninventory of taxa at a sampling station with an attempt to field estimate predominant populations.An assessment of the status of the designated aquatic life use was made at several stations utilizingqualitative sample attributes such as taxa richness and EPT (Ephemeroptera - mayfly, Plecoptera -stonefly, and Trichoptera - caddisfly) richness - an indication of the prevalence of pollutionsensitive organisms.
Performance expectations for the principal aquatic life uses in the Ohio WQS (Warmwater Habitat[WWH], Exceptional Warmwater Habitat [EWH], and Modified Warmwater Habitat [MWH]) weredeveloped using the regional reference site approach (Hughes et al. 1986; Omernik 1987). This fitsthe practical definition of biological integrity as the biological performance of the natural habitatswithin a region (Karr and Dudley 1981). Attainment of the aquatic life use is FULL if all threeindices (or those available) meet the applicable biocriteria, PARTIAL if at least one of the indicesdoes not attain and performance at least fair, and NON-attainment if all indices fail to attain or anyindex indicates poor or very poor performance. Partial and non-attainment indicate that thereceiving water is impaired and does not meet the designated use criteria specified by the OhioWQS.
Habitat AssessmentPhysical habitat was evaluated using the Qualitative Habitat Evaluation Index (QHEI) developed bythe Ohio EPA for streams and rivers in Ohio (Rankin 1989, 1995). Various attributes of the habitatare scored based on the overall importance of each to the maintenance of viable, diverse, andfunctional aquatic faunas. The type(s) and quality of substrates, amount and quality of instreamcover, channel morphology, extent and quality of riparian vegetation, pool, run, and riffledevelopment and quality, and gradient are some of the metrics used to determine the QHEI scorewhich generally ranges from 20 to 100. The QHEI is used to evaluate the characteristics of a streamsegment, as opposed to the characteristics of a single sampling site. As such, individual sites mayhave poorer physical habitat due to a localized disturbance yet still support aquatic communitiesclosely resembling those sampled at adjacent sites with better habitat, provided water qualityconditions are similar. QHEI scores from hundreds of segments around the state have indicated thatvalues greater than 60 are generally conducive to the existence of warmwater faunas. Scores
8

DSW/MAS 1995-8-10 Chapman Run/ Shieldalloy August 30, 1995
greater than 75 frequently typify habitat conditions which have the ability to support exceptionalwarmwater faunas.
Surface Water/ Sediment AssessmentFine grain sediment samples were collected in the upper 6-8 inches of bottom material at eachlocation (and at various other depths down to 18 inches at selected locations) using decontaminatedstainless steel scoops or stainless steel core samplers. Decontamination of sediment samplingequipment followed the procedures outlined in FSOP 10.01, DERR Sampling Guidance, Vol. III,Ohio EPA 1992a). Collected sediment (grab samples) was homogenized in stainless steel pans,transferred into clear glass jars with teflon lined lids, placed on ice (to maintain 4O C) in a cooler,and shipped to an Ohio EPA contract lab. Sediment data is reported on a dry weight basis. Surfacewater samples were collected directly into appropriate containers, preserved and delivered to theOhio EPA Environmental Services lab or an Ohio EPA contract lab. Surface water samples wereevaluated using comparisons to Ohio Water Quality Criteria, reference conditions and publishedliterature. Sediment evaluations were conducted using guidelines established by the OntarioMinistry of the Environment (Persaud et al. 1993), reference conditions and published literature.
Macroinvertebrate Community AssessmentMacroinvertebrates were sampled quantitatively in Chapman Run at two locations usingmultiple-plate, artificial substrate samplers (modified Hester/Dendy) in conjunction with aqualitative assessment of the available natural substrates. Macroinvertebrate communities at threelocations were evaluated qualitatively based on sampling all available natural aquatic habitat types ata sampling site. During the present study, macroinvertebrates collected from the natural substrateswere also evaluated using an assessment tool currently in the testing and refinement phase. Thismethod relies on tolerance values derived for each taxon, based upon the abundance data for thattaxon from artificial substrate (quantitative) samples collected throughout Ohio. To determine thetolerance value of a given taxon, ICI scores at all locations where the taxon had been collected wereweighted by its abundance on the artificial substrates. The mean of the weighted ICI scores for thetaxon resulted in a value which represented its relative level of tolerance on the ICI’s 0 to 60 scale.For the qualitative collections in the Chapman Run study area, the median tolerance value of allorganisms from a site resulted in a score termed the Qualitative Community Tolerance Value(QCTV). The QCTV shows potential as a method to supplement existing assessment methodsusing the natural substrate collections. QCTV scores for sampling locations in the Chapman Runstudy area were used in conjunction with other aspects of the community data and were notunilaterally used to interpret quality of the sites or aquatic life use attainment status.
Fish AssessmentFish were sampled using wading or boat method pulsed DC electrofishing gear. The wading andboat methods were used at a frequency of two samples at each site. The boat method was used onlyat the mouth of Chapman Run. The specific electrofishing method and fish community statistics foreach site is listed in Table 6. Whole body fish were collected in September, 1994 for tissueanalysis. Fish tissue sampling procedures are detailed in the Manual of Ohio EPA SurveillanceMethods and Quality Assurance Practices (Ohio EPA 1989a). Fish tissue results are reported on awet weight basis.
Causal AssociationsUsing the results, conclusions, and recommendations of this report requires an understanding of themethodology used to determine the use attainment status and assigning probable causes and sourcesof impairment. The identification of impairment in rivers and streams is straightforward - the
9

DSW/MAS 1995-8-10 Chapman Run/ Shieldalloy August 30, 1995
numerical biological criteria are the principal arbiter of aquatic life use attainment and impairment(partial and non-attainment). The rationale for using the biological criteria in the role of principalarbiter within a weight of evidence framework has been extensively discussed elsewhere (Karr et al.1986; Karr 1991; Ohio EPA 1987a,b; Yoder 1989; Miner and Borton 1991; Yoder 1991; Yoder1995). Describing the causes and sources associated with observed impairments relies on aninterpretation of multiple lines of evidence including water chemistry data, sediment data, habitatdata, effluent data, biomonitoring results, land use data, and the biological response signatures(Yoder and Rankin 1995) within the biological data itself. Thus the assignment of principal causesand sources of impairment in this report do not represent a true “cause and effect” analysis, butrather represent the association of impairments (based on response indicators) with stressor andexposure indicators whose links with the biosurvey data are based on previous research orexperience with analogous situations and impacts. The reliability of the identification of probablecauses and sources is increased where many such prior associations have been identified. Theprocess is similar to making a medical diagnosis in which a doctor relies on multiple lines ofevidence concerning patient health. Such diagnoses are based on previous research whichexperimentally or statistically linked symptoms and test results to specific diseases or pathologies.Thus a doctor relies on previous experience in interpreting symptoms (i.e., multiple lines from testresults) to establish a diagnosis, potential causes and/or sources of the malady, a prognosis, and astrategy for alleviating the symptoms of the disease or condition. As in medical science, where theultimate arbiter of success is the eventual recovery and the well-being of the patient, the ultimatemeasure of success in water resource management is restoration of lost or damaged ecosystemattributes including aquatic community structure and function. While there have been criticisms ofmisapplying the metaphor of ecosystem “health” compared to human patient “health” (Suter 1993)here we are referring to the process for identifying biological integrity and causes/sources associatedwith observed impairment, not whether human health and ecosystem health are analogous concepts.
10
DSW/MAS 1995-8-10 Chapman Run/ Shieldalloy August 30, 1995
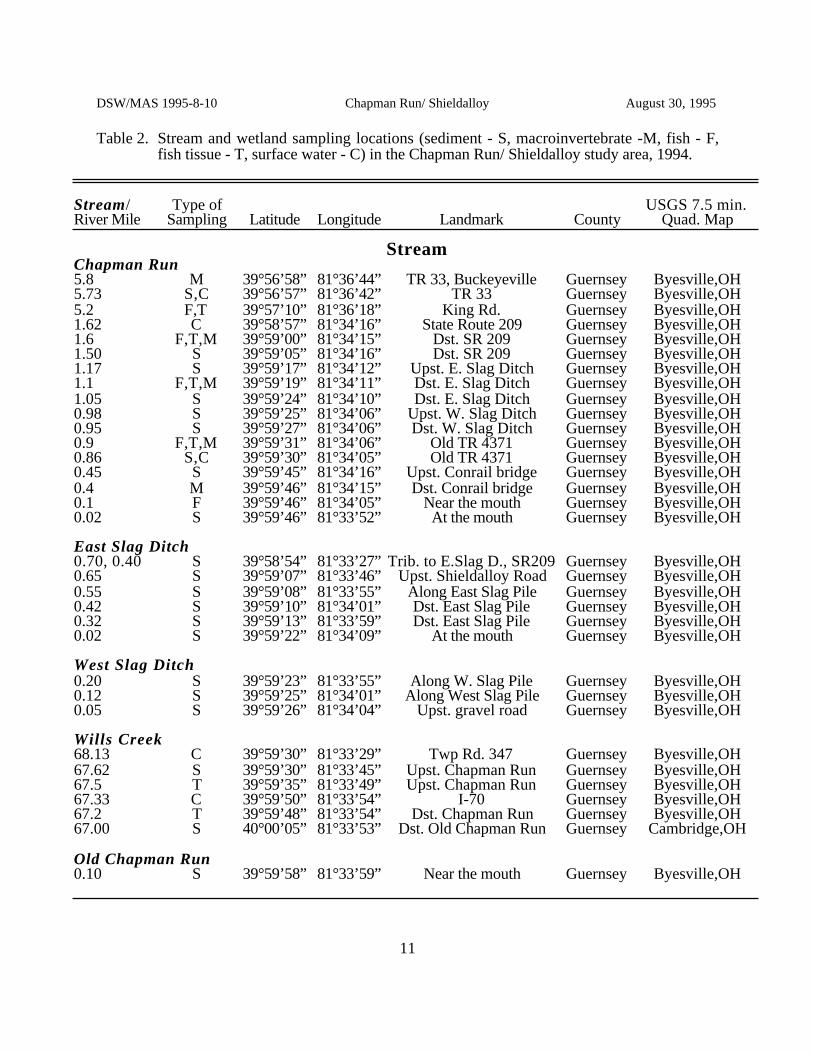
Table 2. Stream and wetland sampling locations (sediment - S, macroinvertebrate -M, fish - F,fish tissue - T, surface water - C) in the Chapman Run/ Shieldalloy study area, 1994.
Stream/ Type of USGS 7.5 min.River Mile Sampling Latitude Longitude Landmark County Quad. Map
Stream Chapman Run5.8 M 39°56’58” 81°36’44” TR 33, Buckeyeville Guernsey Byesville,OH5.73 S,C 39°56’57” 81°36’42” TR 33 Guernsey Byesville,OH5.2 F,T 39°57’10” 81°36’18” King Rd. Guernsey Byesville,OH1.62 C 39°58’57” 81°34’16” State Route 209 Guernsey Byesville,OH1.6 F,T,M 39°59’00” 81°34’15” Dst. SR 209 Guernsey Byesville,OH1.50 S 39°59’05” 81°34’16” Dst. SR 209 Guernsey Byesville,OH1.17 S 39°59’17” 81°34’12” Upst. E. Slag Ditch Guernsey Byesville,OH1.1 F,T,M 39°59’19” 81°34’11” Dst. E. Slag Ditch Guernsey Byesville,OH1.05 S 39°59’24” 81°34’10” Dst. E. Slag Ditch Guernsey Byesville,OH0.98 S 39°59’25” 81°34’06” Upst. W. Slag Ditch Guernsey Byesville,OH0.95 S 39°59’27” 81°34’06” Dst. W. Slag Ditch Guernsey Byesville,OH0.9 F,T,M 39°59’31” 81°34’06” Old TR 4371 Guernsey Byesville,OH0.86 S,C 39°59’30” 81°34’05” Old TR 4371 Guernsey Byesville,OH0.45 S 39°59’45” 81°34’16” Upst. Conrail bridge Guernsey Byesville,OH0.4 M 39°59’46” 81°34’15” Dst. Conrail bridge Guernsey Byesville,OH0.1 F 39°59’46” 81°34’05” Near the mouth Guernsey Byesville,OH0.02 S 39°59’46” 81°33’52” At the mouth Guernsey Byesville,OH
East Slag Ditch0.70, 0.40 S 39°58’54” 81°33’27” Trib. to E.Slag D., SR209 Guernsey Byesville,OH0.65 S 39°59’07” 81°33’46” Upst. Shieldalloy Road Guernsey Byesville,OH0.55 S 39°59’08” 81°33’55” Along East Slag Pile Guernsey Byesville,OH0.42 S 39°59’10” 81°34’01” Dst. East Slag Pile Guernsey Byesville,OH0.32 S 39°59’13” 81°33’59” Dst. East Slag Pile Guernsey Byesville,OH0.02 S 39°59’22” 81°34’09” At the mouth Guernsey Byesville,OH
West Slag Ditch0.20 S 39°59’23” 81°33’55” Along W. Slag Pile Guernsey Byesville,OH0.12 S 39°59’25” 81°34’01” Along West Slag Pile Guernsey Byesville,OH0.05 S 39°59’26” 81°34’04” Upst. gravel road Guernsey Byesville,OH
Wills Creek68.13 C 39°59’30” 81°33’29” Twp Rd. 347 Guernsey Byesville,OH67.62 S 39°59’30” 81°33’45” Upst. Chapman Run Guernsey Byesville,OH67.5 T 39°59’35” 81°33’49” Upst. Chapman Run Guernsey Byesville,OH67.33 C 39°59’50” 81°33’54” I-70 Guernsey Byesville,OH67.2 T 39°59’48” 81°33’54” Dst. Chapman Run Guernsey Byesville,OH67.00 S 40°00’05” 81°33’53” Dst. Old Chapman Run Guernsey Cambridge,OH
Old Chapman Run0.10 S 39°59’58” 81°33’59” Near the mouth Guernsey Byesville,OH
11
DSW/MAS 1995-8-10 Chapman Run/ Shieldalloy August 30, 1995
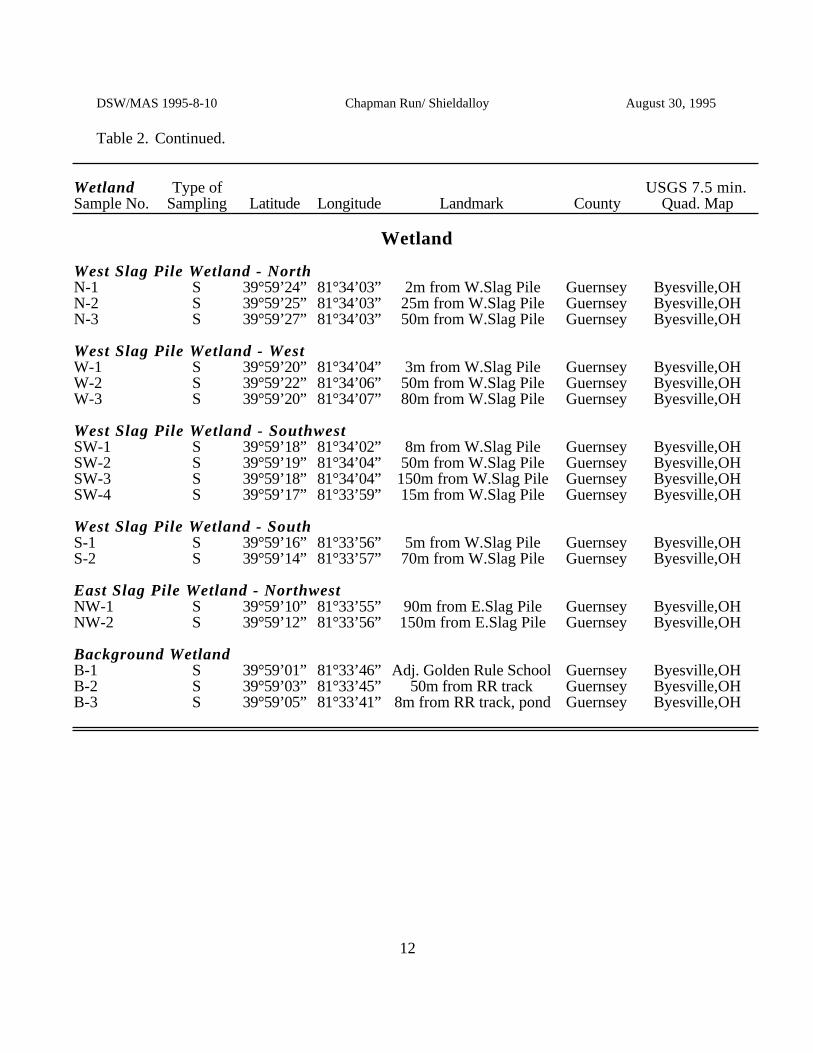
Table 2. Continued.
Wetland Type of USGS 7.5 min.Sample No. Sampling Latitude Longitude Landmark County Quad. Map
Wetland
West Slag Pile Wetland - NorthN-1 S 39°59’24” 81°34’03” 2m from W.Slag Pile Guernsey Byesville,OHN-2 S 39°59’25” 81°34’03” 25m from W.Slag Pile Guernsey Byesville,OHN-3 S 39°59’27” 81°34’03” 50m from W.Slag Pile Guernsey Byesville,OH
West Slag Pile Wetland - WestW-1 S 39°59’20” 81°34’04” 3m from W.Slag Pile Guernsey Byesville,OHW-2 S 39°59’22” 81°34’06” 50m from W.Slag Pile Guernsey Byesville,OHW-3 S 39°59’20” 81°34’07” 80m from W.Slag Pile Guernsey Byesville,OH
West Slag Pile Wetland - SouthwestSW-1 S 39°59’18” 81°34’02” 8m from W.Slag Pile Guernsey Byesville,OHSW-2 S 39°59’19” 81°34’04” 50m from W.Slag Pile Guernsey Byesville,OHSW-3 S 39°59’18” 81°34’04” 150m from W.Slag Pile Guernsey Byesville,OHSW-4 S 39°59’17” 81°33’59” 15m from W.Slag Pile Guernsey Byesville,OH
West Slag Pile Wetland - SouthS-1 S 39°59’16” 81°33’56” 5m from W.Slag Pile Guernsey Byesville,OHS-2 S 39°59’14” 81°33’57” 70m from W.Slag Pile Guernsey Byesville,OH
East Slag Pile Wetland - NorthwestNW-1 S 39°59’10” 81°33’55” 90m from E.Slag Pile Guernsey Byesville,OHNW-2 S 39°59’12” 81°33’56” 150m from E.Slag Pile Guernsey Byesville,OH
Background WetlandB-1 S 39°59’01” 81°33’46” Adj. Golden Rule School Guernsey Byesville,OHB-2 S 39°59’03” 81°33’45” 50m from RR track Guernsey Byesville,OHB-3 S 39°59’05” 81°33’41” 8m from RR track, pond Guernsey Byesville,OH
12
DSW/MAS 1995-8-10 Chapman Run/ Shieldalloy August 30, 1995
RESULTS AND DISCUSSION
Surface Water Chemical Quality
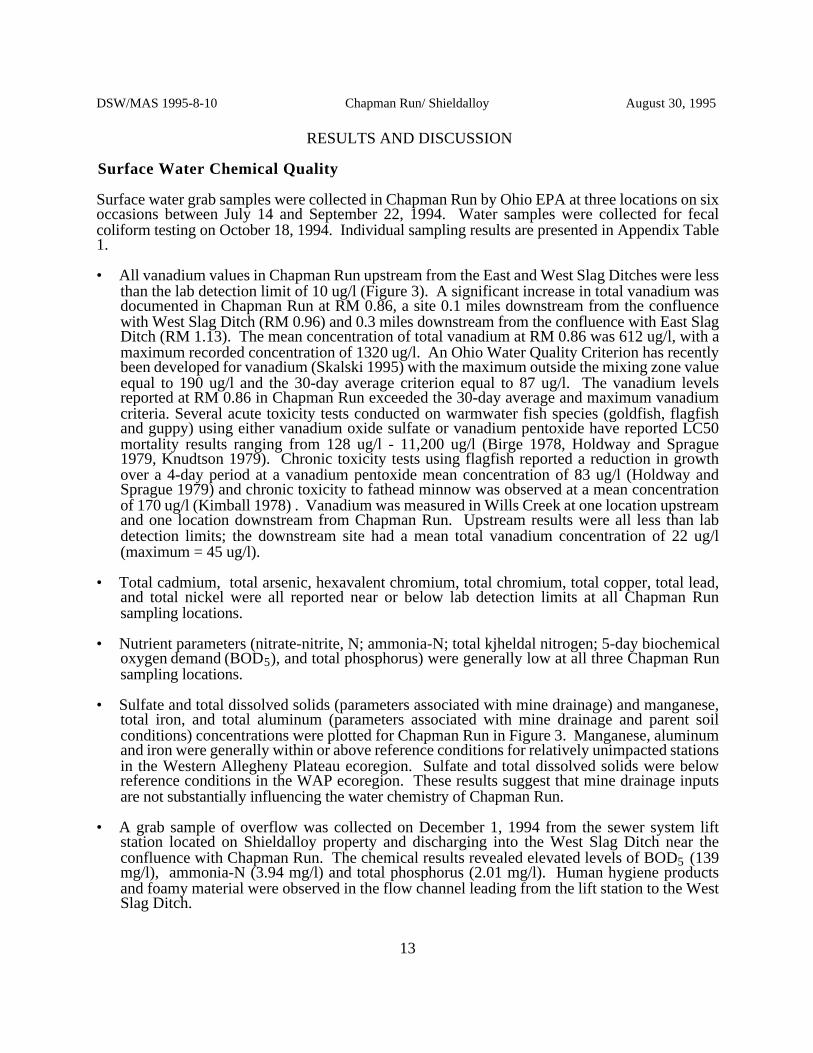
Surface water grab samples were collected in Chapman Run by Ohio EPA at three locations on sixoccasions between July 14 and September 22, 1994. Water samples were collected for fecalcoliform testing on October 18, 1994. Individual sampling results are presented in Appendix Table1.
• All vanadium values in Chapman Run upstream from the East and West Slag Ditches were lessthan the lab detection limit of 10 ug/l (Figure 3). A significant increase in total vanadium wasdocumented in Chapman Run at RM 0.86, a site 0.1 miles downstream from the confluencewith West Slag Ditch (RM 0.96) and 0.3 miles downstream from the confluence with East SlagDitch (RM 1.13). The mean concentration of total vanadium at RM 0.86 was 612 ug/l, with amaximum recorded concentration of 1320 ug/l. An Ohio Water Quality Criterion has recentlybeen developed for vanadium (Skalski 1995) with the maximum outside the mixing zone valueequal to 190 ug/l and the 30-day average criterion equal to 87 ug/l. The vanadium levelsreported at RM 0.86 in Chapman Run exceeded the 30-day average and maximum vanadiumcriteria. Several acute toxicity tests conducted on warmwater fish species (goldfish, flagfishand guppy) using either vanadium oxide sulfate or vanadium pentoxide have reported LC50mortality results ranging from 128 ug/l - 11,200 ug/l (Birge 1978, Holdway and Sprague1979, Knudtson 1979). Chronic toxicity tests using flagfish reported a reduction in growthover a 4-day period at a vanadium pentoxide mean concentration of 83 ug/l (Holdway andSprague 1979) and chronic toxicity to fathead minnow was observed at a mean concentrationof 170 ug/l (Kimball 1978) . Vanadium was measured in Wills Creek at one location upstreamand one location downstream from Chapman Run. Upstream results were all less than labdetection limits; the downstream site had a mean total vanadium concentration of 22 ug/l(maximum = 45 ug/l).
• Total cadmium, total arsenic, hexavalent chromium, total chromium, total copper, total lead,and total nickel were all reported near or below lab detection limits at all Chapman Runsampling locations.
• Nutrient parameters (nitrate-nitrite, N; ammonia-N; total kjheldal nitrogen; 5-day biochemicaloxygen demand (BOD5), and total phosphorus) were generally low at all three Chapman Runsampling locations.
• Sulfate and total dissolved solids (parameters associated with mine drainage) and manganese,total iron, and total aluminum (parameters associated with mine drainage and parent soilconditions) concentrations were plotted for Chapman Run in Figure 3. Manganese, aluminumand iron were generally within or above reference conditions for relatively unimpacted stationsin the Western Allegheny Plateau ecoregion. Sulfate and total dissolved solids were belowreference conditions in the WAP ecoregion. These results suggest that mine drainage inputsare not substantially influencing the water chemistry of Chapman Run.
• A grab sample of overflow was collected on December 1, 1994 from the sewer system liftstation located on Shieldalloy property and discharging into the West Slag Ditch near theconfluence with Chapman Run. The chemical results revealed elevated levels of BOD5 (139mg/l), ammonia-N (3.94 mg/l) and total phosphorus (2.01 mg/l). Human hygiene productsand foamy material were observed in the flow channel leading from the lift station to the WestSlag Ditch.
13
DSW/MAS 1995-8-10 Chapman Run/ Shieldalloy August 30, 1995
• Chemical spills and wild animal kills are additional indications of impacts due to excessivepollutant loadings. Reviews were conducted for discharges and kills in Chapman Run asreported by the Ohio EPA Division of Emergency and Remedial Response and the Ohio DNRDivision of Wildlife. No wildlife kills were reported by ODNR in Chapman Run during thelast five years. Three spills were reported in or near Chapman Run and Wills Creek between1989 and 1994 which were associated with Colgate-Palmolive Co. The material spilled wasfoam and laundry detergent; however, the amount of material was reported as zero. No spillswere reported that were associated with Shieldalloy.
Sediment Quality
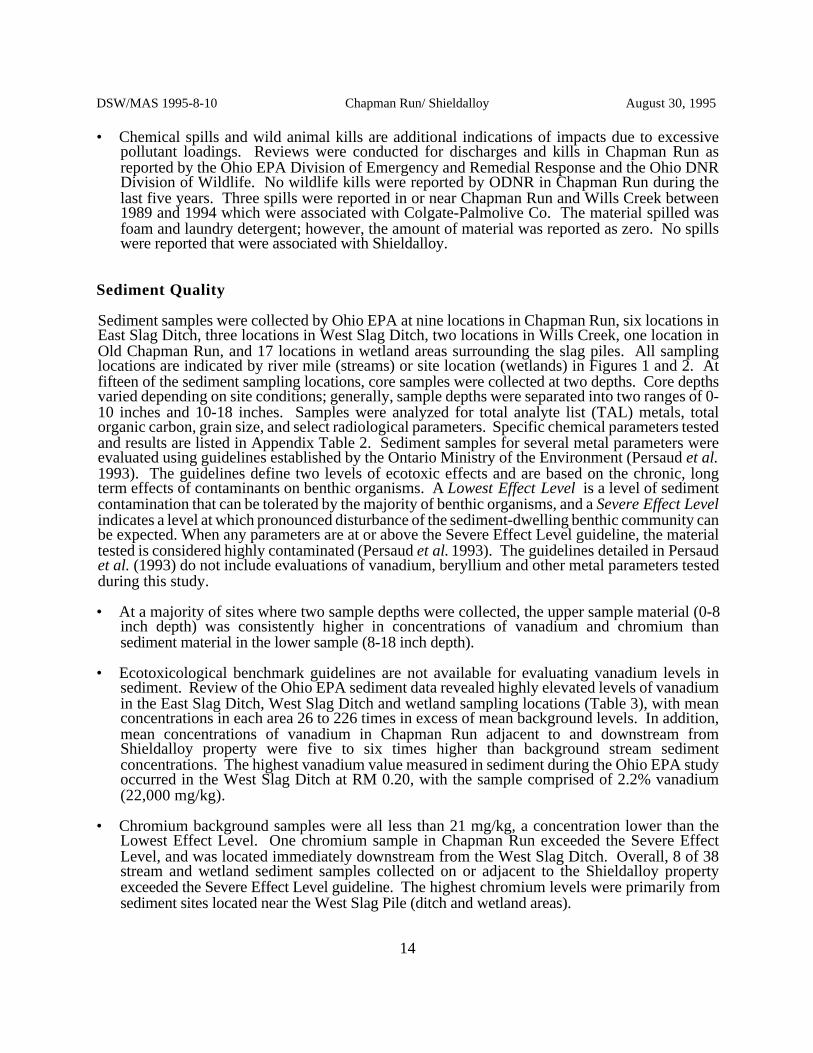
Sediment samples were collected by Ohio EPA at nine locations in Chapman Run, six locations inEast Slag Ditch, three locations in West Slag Ditch, two locations in Wills Creek, one location inOld Chapman Run, and 17 locations in wetland areas surrounding the slag piles. All samplinglocations are indicated by river mile (streams) or site location (wetlands) in Figures 1 and 2. Atfifteen of the sediment sampling locations, core samples were collected at two depths. Core depthsvaried depending on site conditions; generally, sample depths were separated into two ranges of 0-10 inches and 10-18 inches. Samples were analyzed for total analyte list (TAL) metals, totalorganic carbon, grain size, and select radiological parameters. Specific chemical parameters testedand results are listed in Appendix Table 2. Sediment samples for several metal parameters wereevaluated using guidelines established by the Ontario Ministry of the Environment (Persaud et al.1993). The guidelines define two levels of ecotoxic effects and are based on the chronic, longterm effects of contaminants on benthic organisms. A Lowest Effect Level is a level of sedimentcontamination that can be tolerated by the majority of benthic organisms, and a Severe Effect Levelindicates a level at which pronounced disturbance of the sediment-dwelling benthic community canbe expected. When any parameters are at or above the Severe Effect Level guideline, the materialtested is considered highly contaminated (Persaud et al. 1993). The guidelines detailed in Persaudet al. (1993) do not include evaluations of vanadium, beryllium and other metal parameters testedduring this study.
• At a majority of sites where two sample depths were collected, the upper sample material (0-8inch depth) was consistently higher in concentrations of vanadium and chromium thansediment material in the lower sample (8-18 inch depth).
• Ecotoxicological benchmark guidelines are not available for evaluating vanadium levels insediment. Review of the Ohio EPA sediment data revealed highly elevated levels of vanadiumin the East Slag Ditch, West Slag Ditch and wetland sampling locations (Table 3), with meanconcentrations in each area 26 to 226 times in excess of mean background levels. In addition,mean concentrations of vanadium in Chapman Run adjacent to and downstream fromShieldalloy property were five to six times higher than background stream sedimentconcentrations. The highest vanadium value measured in sediment during the Ohio EPA studyoccurred in the West Slag Ditch at RM 0.20, with the sample comprised of 2.2% vanadium(22,000 mg/kg).
• Chromium background samples were all less than 21 mg/kg, a concentration lower than theLowest Effect Level. One chromium sample in Chapman Run exceeded the Severe EffectLevel, and was located immediately downstream from the West Slag Ditch. Overall, 8 of 38stream and wetland sediment samples collected on or adjacent to the Shieldalloy propertyexceeded the Severe Effect Level guideline. The highest chromium levels were primarily fromsediment sites located near the West Slag Pile (ditch and wetland areas).
14

DSW/MAS 1995-8-10 Chapman Run/ Shieldalloy August 30, 1995
• Arsenic, cadmium, iron, manganese and nickel samples had between one and eight valuesexceeding the Severe Effect Level. Aside from iron and cadmium, the majority of theseelevated levels occurred in the East Slag Ditch, West Slag Ditch, and wetland sites adjacent tothe West Slag Pile.
• Radiological constituents in sediments were compared with the average reference values fromupstream sites on Chapman Run, East Slag Ditch, and the reference wetland area. Thesereference values were: gross alpha (23 pCi/g), gross beta (33 pCi/g), radium 226 (1.5 pCi/g),radium 228 (1.2 pCi/g), thorium 228 (1.1 pCi/g), thorium 230 (1.3 pCi/g), thorium 232 (1.1pCi/g), uranium 234 (1.2 pCi/g), uranium 235 (0.07 pCi/g), and uranium 238 (1.2 pCi/g).The reference samples collected from Chapman Run and East Slag Ditch were less than thereference samples collected from the wetland area on the south side of the Shieldalloy property.Below are the constituents and samples which exceeded five times reference levels (a ‘rule ofthumb’ general guidance used by USEPA and Ohio EPA). In addition, the thorium 230sediment sample from the East Slag Ditch at RM 0.42 (66± 1.9 pCi/g) was substantially higherthen the NRC soil contaminant guideline of 5 pCi/g in the upper 5 cm of soil and 15 pCi/g insoil below 5 cm.
gross alpha: East Slag Ditch RM 0.42 (120±15 pCi/g)gross beta: Noneradium 226: Noneradium 228: Nonethorium 228: Nonethorium 230: East Slag Ditch RM 0.42 (66±1.9pCi/g), Wetland SW-1 (8.3 pCi/g)thorium 232: Noneuranium 234: Noneuranium 235: Wetland NW-1 (0.74±0.20 pCi/g)uranium 238: None
A majority of the radiological tests conducted on sediment samples were measured below ornear background levels.
15

DSW/MAS 1995-8-10 Chapman Run/ Shieldalloy August 30, 1995
0
200
400
600
800
1000
1200
1400
ug
/l
VANADIUM
5.73 1.62 0.86 68.13 67.33
East/West Slag Ditches
Chapman Run
Maximum Criteria
30-Day Average Criteria
0
200
400
600
800
1000
1200
mg
/l
TOTAL DISSOLVEDSOLIDS
5.73 1.62 0.86 68.13 67.33
East/West Slag Ditches
Chapman Run
0
5000
10000
15000
20000
ug
/l
IRON
5.73 1.62 0.86 68.13 67.33
East/WestSlag Ditches
Chapman Run
0
100
200
300
400
500
600
mg
/l
SULFATE
5.73 1.62 0.86 68.13 67.33
East/West Slag Ditches
Chapman Run
Chapman Run Wills CreekRiver Mile
0
500
1000
1500
mg
/l
MANGANESE
5.73 1.62 0.86 68.13 67.33
East/WestSlag Ditches
Chapman Run
0
2000
4000
6000
8000
10000
12000
ug
/l
ALUMINUM
5.73 1.62 0.86 68.13 67.33
East/West Slag Ditches Chapman Run
Chapman Run Wills CreekRiver Mile
Figure 3. Mean (circle) and range (bar) of values for total vanadium, sulfate,manganese, total aluminum, total iron, and total dissolved solids recorded in ChapmanRun and Wills Creek by river mile during 1994 by the Ohio EPA. Shaded areasrepresent the range between the median and 75th percentile values for relativelyunimpacted Western Allegheny Plateau ecoregion reference sites (Ohio EPA 1992b).Shading for aluminum was based on data from the Muskingum River basin as reportedin Ohio EPA (1988). Ohio water quality criteria levels for vanadium are indicated byhorizontal lines.
16
DSW/MAS 1995-8-10 Chapman Run/ Shieldalloy August 30, 1995
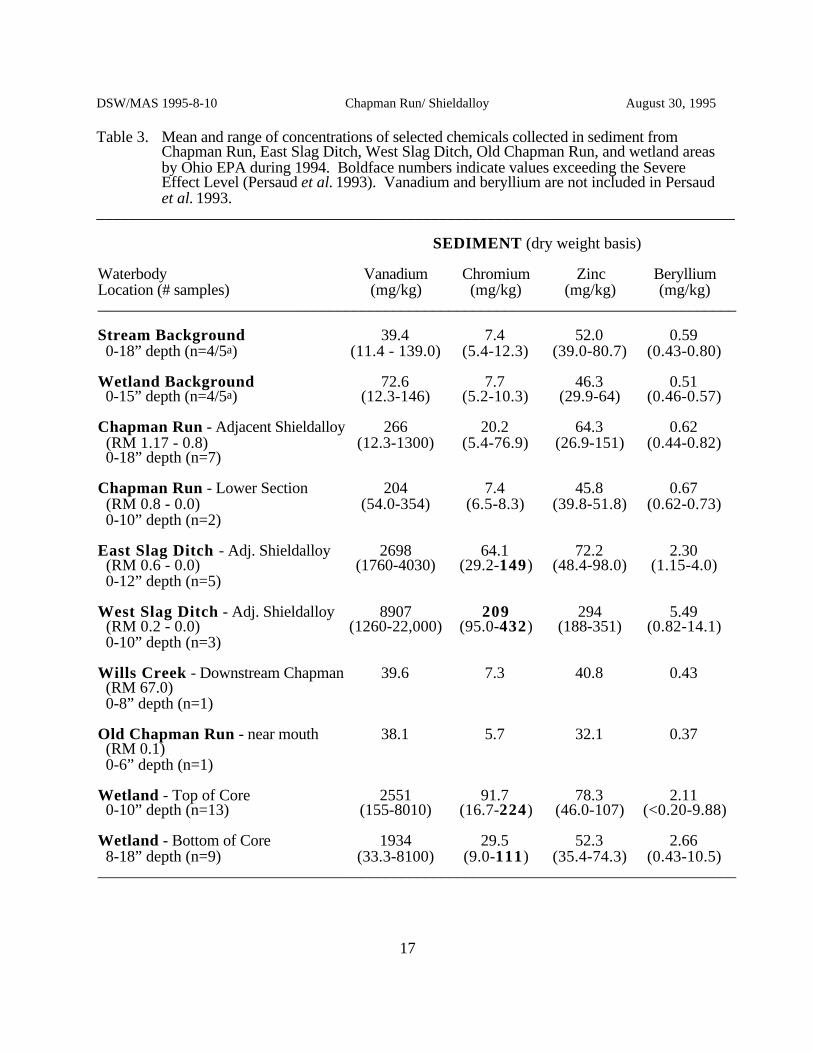
Table 3. Mean and range of concentrations of selected chemicals collected in sediment fromChapman Run, East Slag Ditch, West Slag Ditch, Old Chapman Run, and wetland areasby Ohio EPA during 1994. Boldface numbers indicate values exceeding the SevereEffect Level (Persaud et al. 1993). Vanadium and beryllium are not included in Persaudet al. 1993.
________________________________________________________________________________
SEDIMENT (dry weight basis)
Waterbody Vanadium Chromium Zinc BerylliumLocation (# samples) (mg/kg) (mg/kg) (mg/kg) (mg/kg)________________________________________________________________________________
Stream Background 39.4 7.4 52.0 0.59 0-18” depth (n=4/5a) (11.4 - 139.0) (5.4-12.3) (39.0-80.7) (0.43-0.80)
Wetland Background 72.6 7.7 46.3 0.51 0-15” depth (n=4/5a) (12.3-146) (5.2-10.3) (29.9-64) (0.46-0.57)
Chapman Run - Adjacent Shieldalloy 266 20.2 64.3 0.62 (RM 1.17 - 0.8) (12.3-1300) (5.4-76.9) (26.9-151) (0.44-0.82) 0-18” depth (n=7)
Chapman Run - Lower Section 204 7.4 45.8 0.67 (RM 0.8 - 0.0) (54.0-354) (6.5-8.3) (39.8-51.8) (0.62-0.73) 0-10” depth (n=2)
East Slag Ditch - Adj. Shieldalloy 2698 64.1 72.2 2.30 (RM 0.6 - 0.0) (1760-4030) (29.2-149) (48.4-98.0) (1.15-4.0) 0-12” depth (n=5)
West Slag Ditch - Adj. Shieldalloy 8907 209 294 5.49 (RM 0.2 - 0.0) (1260-22,000) (95.0-432) (188-351) (0.82-14.1) 0-10” depth (n=3)
Wills Creek - Downstream Chapman 39.6 7.3 40.8 0.43 (RM 67.0) 0-8” depth (n=1)
Old Chapman Run - near mouth 38.1 5.7 32.1 0.37 (RM 0.1) 0-6” depth (n=1)
Wetland - Top of Core 2551 91.7 78.3 2.11 0-10” depth (n=13) (155-8010) (16.7-224) (46.0-107) (<0.20-9.88)
Wetland - Bottom of Core 1934 29.5 52.3 2.66 8-18” depth (n=9) (33.3-8100) (9.0-111) (35.4-74.3) (0.43-10.5)________________________________________________________________________________
17
DSW/MAS 1995-8-10 Chapman Run/ Shieldalloy August 30, 1995
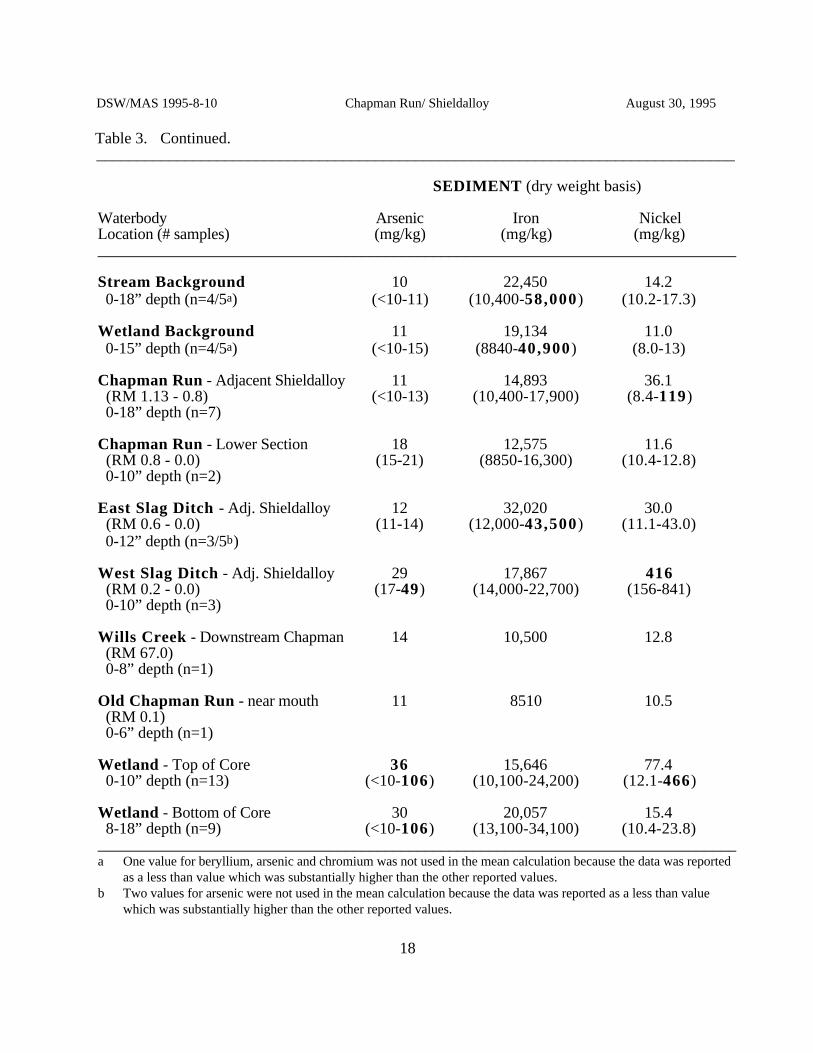
Table 3. Continued.________________________________________________________________________________
SEDIMENT (dry weight basis)
Waterbody Arsenic Iron NickelLocation (# samples) (mg/kg) (mg/kg) (mg/kg)________________________________________________________________________________
Stream Background 10 22,450 14.2 0-18” depth (n=4/5a) (<10-11) (10,400-58,000) (10.2-17.3)
Wetland Background 11 19,134 11.0 0-15” depth (n=4/5a) (<10-15) (8840-40,900) (8.0-13)
Chapman Run - Adjacent Shieldalloy 11 14,893 36.1 (RM 1.13 - 0.8) (<10-13) (10,400-17,900) (8.4-119) 0-18” depth (n=7)
Chapman Run - Lower Section 18 12,575 11.6 (RM 0.8 - 0.0) (15-21) (8850-16,300) (10.4-12.8) 0-10” depth (n=2)
East Slag Ditch - Adj. Shieldalloy 12 32,020 30.0 (RM 0.6 - 0.0) (11-14) (12,000-43,500) (11.1-43.0) 0-12” depth (n=3/5b)
West Slag Ditch - Adj. Shieldalloy 29 17,867 416 (RM 0.2 - 0.0) (17-49) (14,000-22,700) (156-841) 0-10” depth (n=3)
Wills Creek - Downstream Chapman 14 10,500 12.8 (RM 67.0) 0-8” depth (n=1)
Old Chapman Run - near mouth 11 8510 10.5 (RM 0.1) 0-6” depth (n=1)
Wetland - Top of Core 36 15,646 77.4 0-10” depth (n=13) (<10-106) (10,100-24,200) (12.1-466)
Wetland - Bottom of Core 30 20,057 15.4 8-18” depth (n=9) (<10-106) (13,100-34,100) (10.4-23.8)________________________________________________________________________________a One value for beryllium, arsenic and chromium was not used in the mean calculation because the data was reported
as a less than value which was substantially higher than the other reported values.b Two values for arsenic were not used in the mean calculation because the data was reported as a less than value
which was substantially higher than the other reported values.
18

DSW/MAS 1995-8-10 Chapman Run/ Shieldalloy August 30, 1995
Physical Habitat for Aquatic Life
Physical habitat was evaluated in Chapman Run at the 1994 fish sampling locations. QualitativeHabitat Evaluation Index (QHEI) scores are detailed in Table 4.
• Natural habitat conditions occur in Chapman Run at all sampling locations except RM 0.1,where the stream had been moved due to the construction of the I-70 and I-77 interchange.Substantial modification of the lower 0.5 miles of Chapman Run was the result of a completelynew channel constructed along the south side of I-70. Habitat conditions in the lower 0.5miles consist of bottom substrates predominated by silt and artificial material (riprap), nearlyabsent instream cover, no riffle development and poorly defined pool areas. There was analmost complete absence of warmwater habitat attributes in the lower 0.5 miles of ChapmanRun. The QHEI score at RM 0.1 was 16.5, reflective of poor stream habitat.
• Physical habitat conditions were comparable between stations sampled at RMs 1.6, 1.1 and0.9; however, several notable differences were observed. All three locations had bottomsubstrates predominated by muck, with heavy deposits of silt and extensive embeddedness ofthe stream substrates. Instream cover was considered moderate at RMs 1.6 and 1.1 andmoderate to sparse at RM 0.9. Riffles were of fair quality at RMs 1.6 and 1.1 and the oneriffle at RM 0.9 was poorly developed. The appearance of channelized conditions at RM 0.9,along with a significant bedload downstream from the confluence with the West Slag Ditch(RM 0.95) contributed to the lower QHEI score at RM 0.9 (34.0) in comparison to RMs 1.6(49.5) and 1.1 (47.5). The extensive sediment bedload observed at RM 0.9 appeared to be inpart associated with runoff material from the West Slag Pile. Modified warmwater habitatattributes predominated at all of these sites. Overall, these sites were reflective of fair (RMs1.6 and 1.1) to poor (RM 0.9) stream habitat.
• Well defined pool and riffle areas occurred at RM 5.2, an area with a much higher gradient thancompared to the downstream sampling locations (RMs 1.6 - 0.1). The QHEI score was 67.0,reflective of good stream habitat. Bottom substrates were predominated by gravel and sand,instream cover was considered moderate (logs, woody debris, boulders, undercut banks) andwarmwater habitat attributes predominated.
19

Table 4. Qualitative Habitat Evaluation Index (QHEI) matrix showing modified and warmwater habitat characteristics for Chapman Run, 1994.
20
DSW/MAS 1995-8-10 Chapman Run/ Shieldalloy August 30, 1995
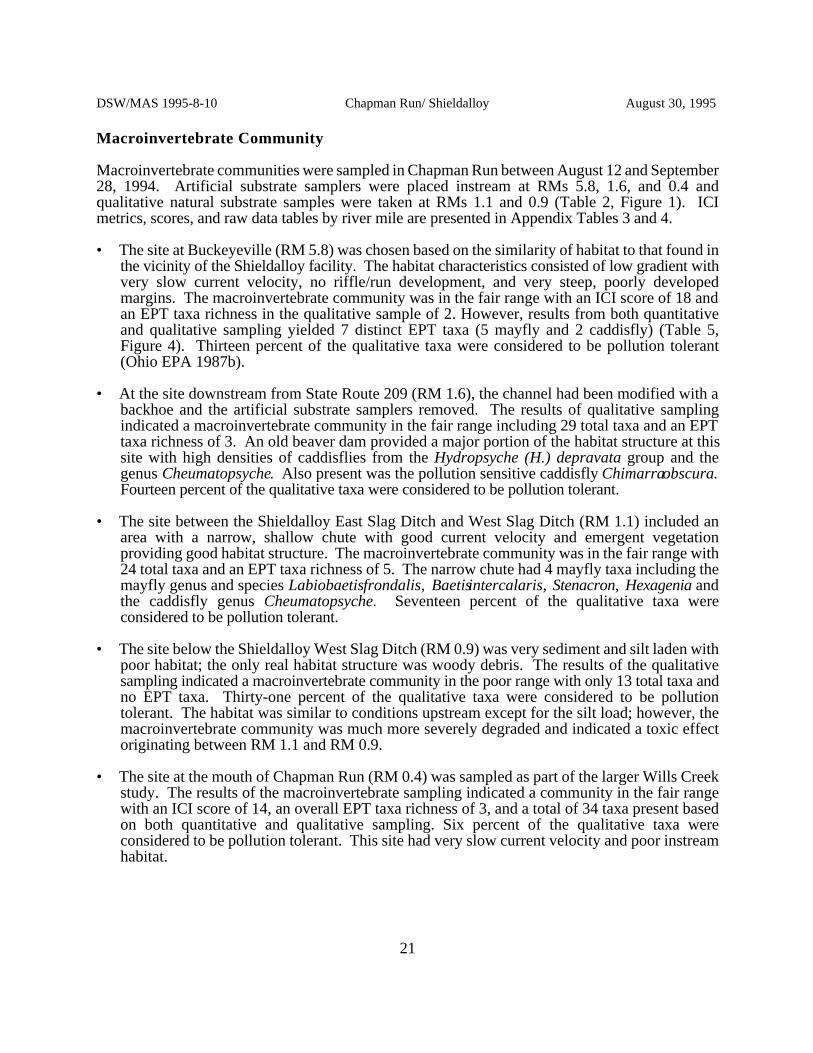
Macroinvertebrate Community
Macroinvertebrate communities were sampled in Chapman Run between August 12 and September28, 1994. Artificial substrate samplers were placed instream at RMs 5.8, 1.6, and 0.4 andqualitative natural substrate samples were taken at RMs 1.1 and 0.9 (Table 2, Figure 1). ICImetrics, scores, and raw data tables by river mile are presented in Appendix Tables 3 and 4.
• The site at Buckeyeville (RM 5.8) was chosen based on the similarity of habitat to that found inthe vicinity of the Shieldalloy facility. The habitat characteristics consisted of low gradient withvery slow current velocity, no riffle/run development, and very steep, poorly developedmargins. The macroinvertebrate community was in the fair range with an ICI score of 18 andan EPT taxa richness in the qualitative sample of 2. However, results from both quantitativeand qualitative sampling yielded 7 distinct EPT taxa (5 mayfly and 2 caddisfly) (Table 5,Figure 4). Thirteen percent of the qualitative taxa were considered to be pollution tolerant(Ohio EPA 1987b).
• At the site downstream from State Route 209 (RM 1.6), the channel had been modified with abackhoe and the artificial substrate samplers removed. The results of qualitative samplingindicated a macroinvertebrate community in the fair range including 29 total taxa and an EPTtaxa richness of 3. An old beaver dam provided a major portion of the habitat structure at thissite with high densities of caddisflies from the Hydropsyche (H.) depravata group and thegenus Cheumatopsyche. Also present was the pollution sensitive caddisfly Chimarra obscura.Fourteen percent of the qualitative taxa were considered to be pollution tolerant.
• The site between the Shieldalloy East Slag Ditch and West Slag Ditch (RM 1.1) included anarea with a narrow, shallow chute with good current velocity and emergent vegetationproviding good habitat structure. The macroinvertebrate community was in the fair range with24 total taxa and an EPT taxa richness of 5. The narrow chute had 4 mayfly taxa including themayfly genus and species Labiobaetis frondalis, Baetis intercalaris, Stenacron, Hexagenia andthe caddisfly genus Cheumatopsyche. Seventeen percent of the qualitative taxa wereconsidered to be pollution tolerant.
• The site below the Shieldalloy West Slag Ditch (RM 0.9) was very sediment and silt laden withpoor habitat; the only real habitat structure was woody debris. The results of the qualitativesampling indicated a macroinvertebrate community in the poor range with only 13 total taxa andno EPT taxa. Thirty-one percent of the qualitative taxa were considered to be pollutiontolerant. The habitat was similar to conditions upstream except for the silt load; however, themacroinvertebrate community was much more severely degraded and indicated a toxic effectoriginating between RM 1.1 and RM 0.9.
• The site at the mouth of Chapman Run (RM 0.4) was sampled as part of the larger Wills Creekstudy. The results of the macroinvertebrate sampling indicated a community in the fair rangewith an ICI score of 14, an overall EPT taxa richness of 3, and a total of 34 taxa present basedon both quantitative and qualitative sampling. Six percent of the qualitative taxa wereconsidered to be pollution tolerant. This site had very slow current velocity and poor instreamhabitat.
21

DSW/MAS 1995-8-10 Chapman Run/ Shieldalloy August 30, 1995
Table 5. Summary of macroinvertebrate data collected from artificial substrates (quantitativesampling) and natural substrates (qualitative sampling) in Chapman Run, 1994. ChapmanRun has a WWH aquatic life use designation in the Ohio Water Quality Standards.
Quantitative EvaluationStream/ Relative Total Quantitative Qualitative Qualitative NarrativeRiver Mile Density Taxa Taxa Taxa EPTa ICI Evaluation
Chapman Run
5.8 256 41 25 24 2 18* Fair
0.4 111 34 28 17 2 14* Fair
Qualitative EvaluationStream/ No. Qual. Qual. Relative Predominant NarrativeRiver Mile Taxa QCTVb EPTa Density Organisms Evaluationc
Chapman Run
1.6 29 37.2 3 Moderately Midges, caddisflies Fairlow
1.1 24 42.9 5 Low Midges, mayflies Fair
0.9 13 30.3 0 Low Midges Poor
Ecoregional Biocriteria: Western Allegheny Plateau (WAP)(from OAC 3745-1-07, Table 7-17)
INDEX WWH EWH MWHd
ICI 36 46 22a EPT= total Ephemeroptera (mayflies), Plecoptera (stoneflies) and Trichoptera (caddisflies) taxa richness.b Qualitative Community Tolerance Value (QCTV) derived as the median of the tolerance values calculated for each qualitative
taxon present. c The qualitative narrative evaluation is based on best professional judgement utilizing sample attributes such as taxa
richness, EPT richness, and QCTV score and is used when quantitative data is not available to calculate the InvertebrateCommunity Index (ICI) scores.
d Modified Warmwater Habitat for channel modified areas.* Significant departure from ecoregional biocriterion (>4 ICI units); poor and very poor results are underlined.
22
DSW/MAS 1995-8-10 Chapman Run/ Shieldalloy August 30, 1995
0
5
10
15
20
25
30
0123456
EPT taxaQualitative taxa
Mac
roin
vert
ebra
te T
axa
RIVER MILE
East Slag Ditch
West Slag Ditch
0
5
10
15
20
25
30
35
0123456
Perc
ent
Tole
rant
Ta
xa
RIVER MILE
East Slag Ditch
West Slag Ditch
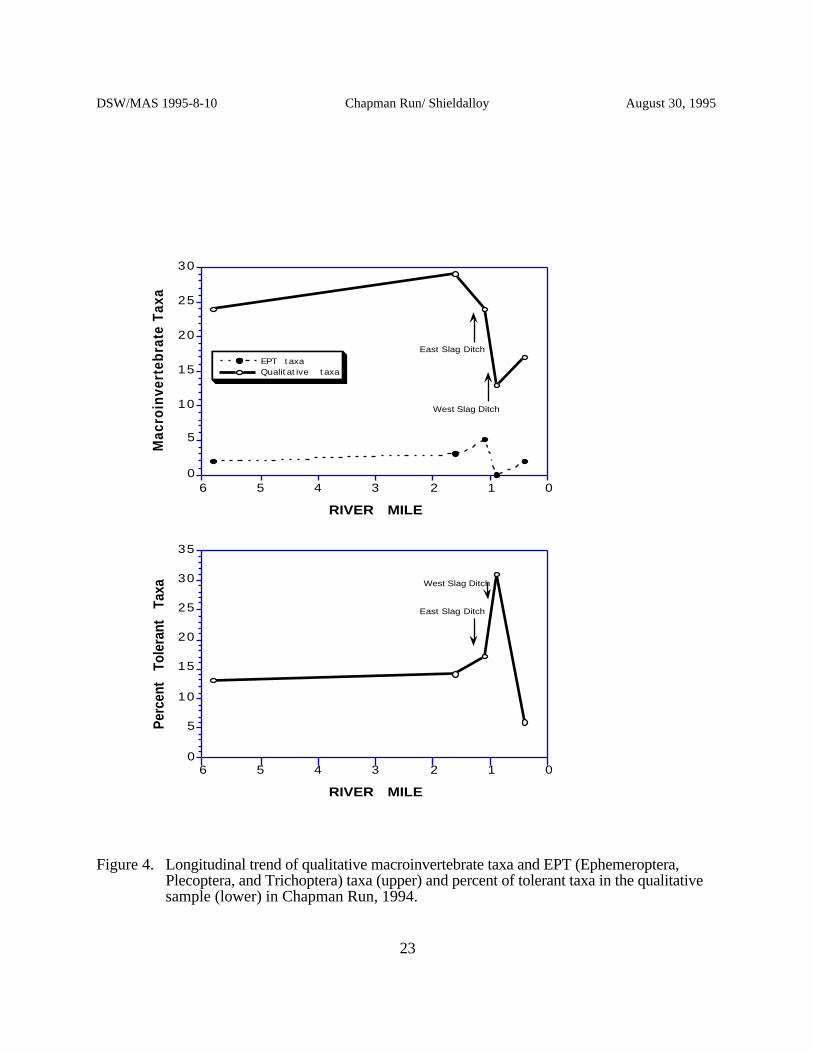
Figure 4. Longitudinal trend of qualitative macroinvertebrate taxa and EPT (Ephemeroptera,Plecoptera, and Trichoptera) taxa (upper) and percent of tolerant taxa in the qualitativesample (lower) in Chapman Run, 1994.
23

DSW/MAS 1995-8-10 Chapman Run/ Shieldalloy August 30, 1995
Fish Community
A total of 2,539 fish representing 32 species and two hybrids were collected from Chapman Runbetween August 10 and October 4, 1994. The sampling effort included a cumulative distancedelectrofished of 2.40 km at five locations (Table 6, Figure 1). Relative numbers, species collected,and IBI metric information per location is presented in Appendix Tables 5 and 6.
• Creek chub (29.2%) and bluntnose minnow (26.6%), two pollution tolerant species,predominated the catch numerically. Sixty-four (64) percent of the relative number of fishfrom the study area were collected from RM 5.2. The lowest number of fish collected occurredat RM 0.1, with less than 2% of the relative number measured in Chapman Run.
• The fish community at the most upstream Chapman Run sampling location (RM 5.2) wasevaluated as fair, with a large proportion of pollution tolerant species present. The IBI score of38 was not achieving the WWH ecoregional biocriterion. Potential causes for the reduced fishcommunity include sedimentation of the stream bottom (moderate level of substrateembeddedness) and water quality influences associated with the unsewered community ofBuckeyeville.
• A decline in the fish community was observed at RM 1.6, a site located upstream from theShieldalloy property. The IBI score was 28 and reflective of marginally fair water resourceconditions. The fish community at RM 1.6 was not achieving the WWH ecoregionalbiocriterion. Reduced instream habitat conditions were noted at RM 1.6, in comparison toupstream locations. These habitat conditions (low gradient, muck bottom, extensiveembeddedness) appeared to be a predominant factor in a fish community reflective of fair waterquality.
• The fish communities in Chapman Run from RMs 1.1, 0.9 and 0.1 were reflective of poorwater quality. IBI scores at these stations varied between 19 and 21, showing significantdeparture from the WWH ecoregion biocriterion. As was observed at the upstream samplinglocations, pollution tolerant species predominated at RMs 1.1, 0.9 and 0.1. The greatestvariability in species richness between the two sampling passes occurred at RMs 1.1 and 0.9(Figure 5). Chemical water quality sampling results from Chapman Run revealed that withinthe area of RM 0.9, vanadium concentrations exceeded chronic and acute water quality criteria.These elevated vanadium levels appear to be at least a partial contributor to the poor fishcommunities observed in the lower 1.1 miles of Chapman Run. Other potential influencesinclude raw sewage discharged sporadically from a Cambridge sanitary sewer lift station andreduced instream physical habitat conditions.
24
DSW/MAS 1995-8-10 Chapman Run/ Shieldalloy August 30, 1995
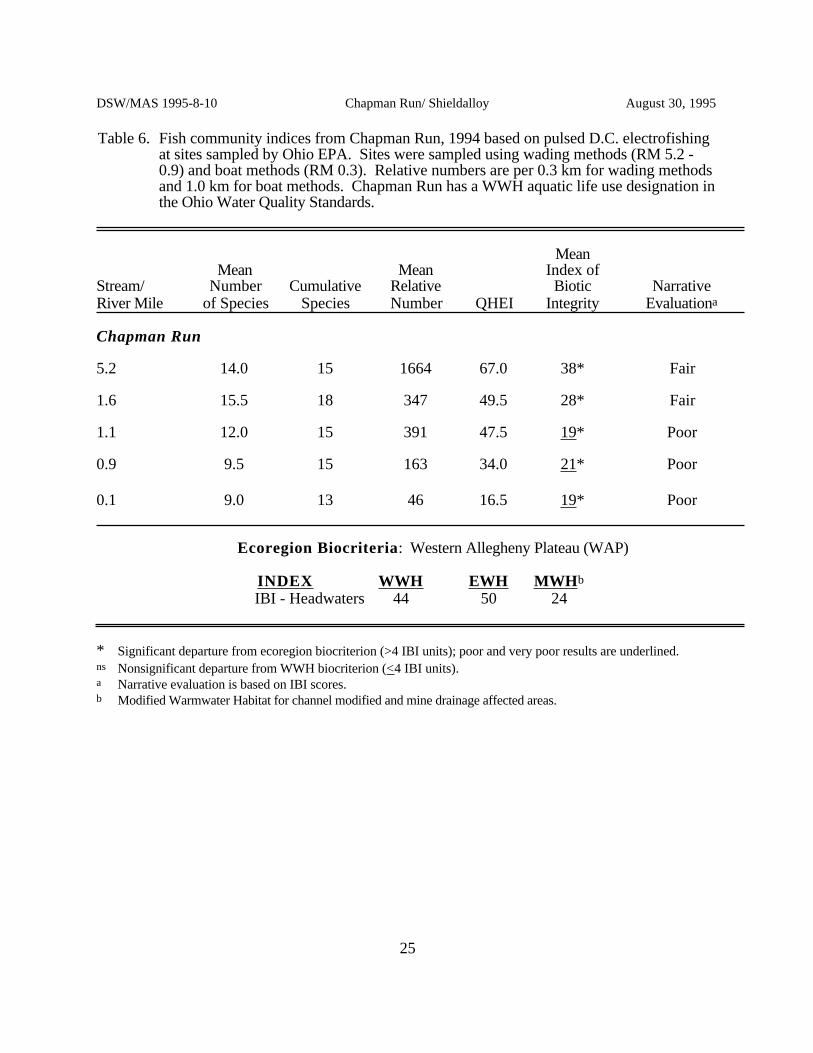
Table 6. Fish community indices from Chapman Run, 1994 based on pulsed D.C. electrofishingat sites sampled by Ohio EPA. Sites were sampled using wading methods (RM 5.2 -0.9) and boat methods (RM 0.3). Relative numbers are per 0.3 km for wading methodsand 1.0 km for boat methods. Chapman Run has a WWH aquatic life use designation inthe Ohio Water Quality Standards.
MeanMean Mean Index of
Stream/ Number Cumulative Relative Biotic NarrativeRiver Mile of Species Species Number QHEI Integrity Evaluationa
Chapman Run
5.2 14.0 15 1664 67.0 38* Fair
1.6 15.5 18 347 49.5 28* Fair
1.1 12.0 15 391 47.5 19* Poor
0.9 9.5 15 163 34.0 21* Poor
0.1 9.0 13 46 16.5 19* Poor
Ecoregion Biocriteria: Western Allegheny Plateau (WAP)
INDEX WWH EWH MWHb
IBI - Headwaters 44 50 24
* Significant departure from ecoregion biocriterion (>4 IBI units); poor and very poor results are underlined.ns Nonsignificant departure from WWH biocriterion (<4 IBI units).a Narrative evaluation is based on IBI scores.b Modified Warmwater Habitat for channel modified and mine drainage affected areas.
25
DSW/MAS 1995-8-10 Chapman Run/ Shieldalloy August 30, 1995
0
10
20
30
40
50
60
012345
IBI
RIVER MILE
CHAPMAN RUN
WWH Criterion (IBI=44)
East Slag Ditch West Slag Ditch
0
5
10
15
20
012345
First Pass
Second Pass
Fis
h
Sp
ecie
s
RIVER MILE
East Slag Ditch West Slag Ditch
0
500
1000
1500
2000
012345
Rel
ativ
e N
um
ber
RIVER MILE
East Slag Ditch West Slag Ditch
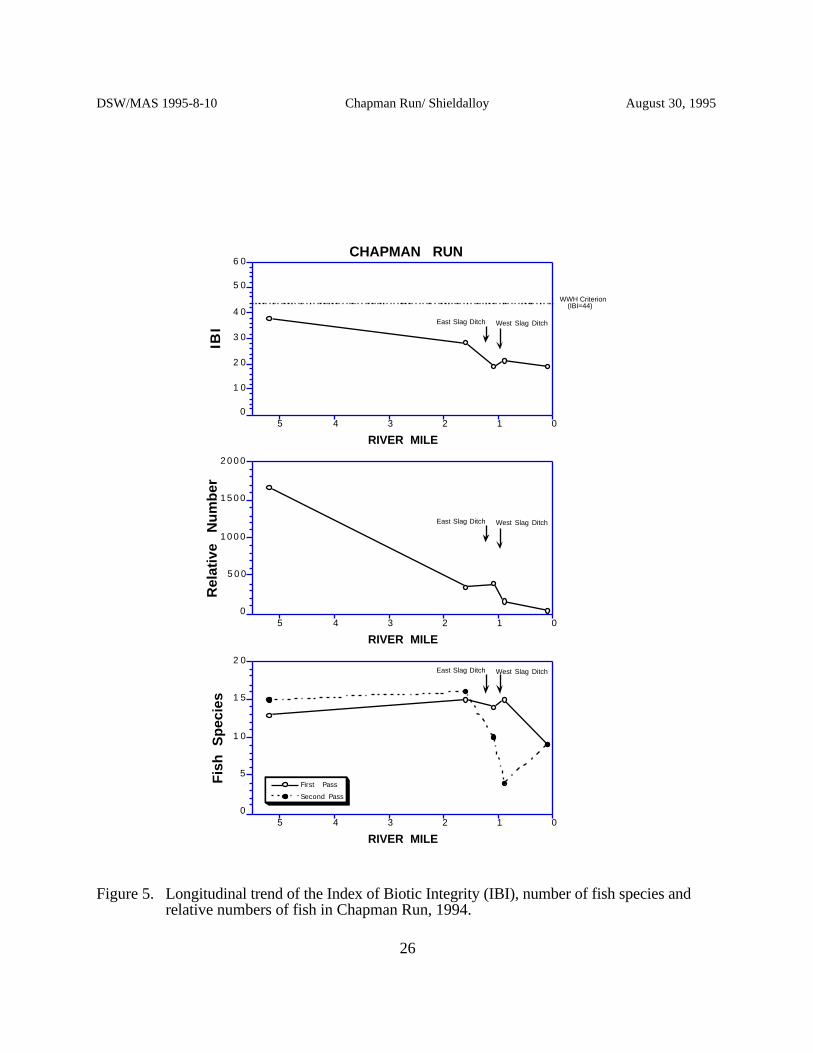
Figure 5. Longitudinal trend of the Index of Biotic Integrity (IBI), number of fish species andrelative numbers of fish in Chapman Run, 1994.
26
DSW/MAS 1995-8-10 Chapman Run/ Shieldalloy August 30, 1995
Fish Tissue
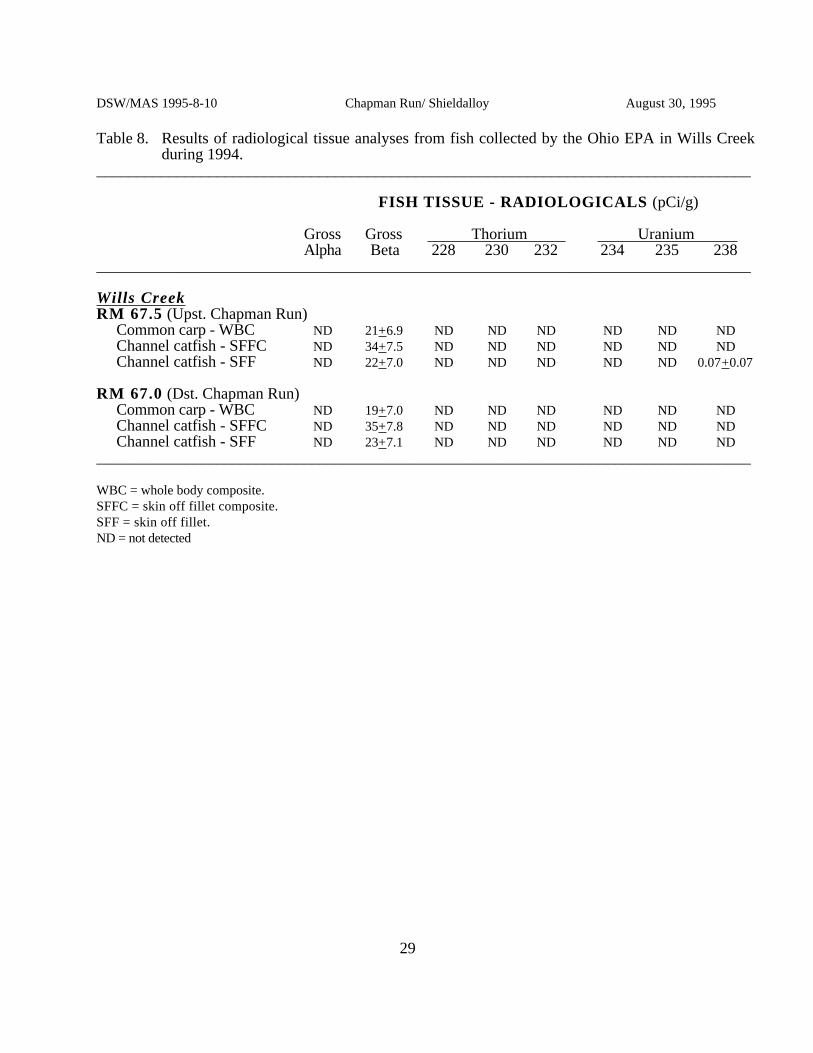
Fish tissue samples were collected from Chapman Run at four locations and Wills Creek at twolocations by the Ohio EPA during 1994 (Tables 7 and 8). Whole body composite samplesrepresenting four fish species were collected in Chapman Run and analyzed for vanadium,mercury, chromium, cadmium, lead, and percent lipids. Whole body composite and fillet samplesrepresenting two species were collected in Wills Creek immediately upstream and downstreamfrom Chapman Run and analyzed for the above parameters as well as radiologicals. At onelocation in Chapman Run (RM 0.9), two fish species were composited into one sample because ofa lack of adequate sample material.
• Vanadium was detected in fish tissue samples from Chapman Run collected at RMs 1.1 and0.9, sites located adjacent to Shieldalloy property and receiving surface runoff from the EastSlag Ditch and West Slag Ditch. Concentrations of vanadium detected ranged from 1.1 mg/kgto 5.7 mg/kg. Fish tissue samples collected upstream from Shieldalloy had no detectablevanadium (measurements were reported as below the estimated quantitation limit - EQL of 0.2mg/kg or 0.4 mg/kg). The fish tissue vanadium results for samples from Wills Creek reportedno difference between the two sites, with concentrations reported at 0.6 mg/kg for commoncarp and less than the EQL of 0.2 mg/kg for channel catfish.
• Fish tissue concentrations of mercury, chromium, cadmium and lead were comparable amongall sites sampled in Chapman Run. All values were low, with a majority of the measurementsbelow the estimated quantitation limits. Similar results were recorded in Wills Creek.Mercury, the only parameter of those listed above with a Food and Drug Administration (FDA)Consumption Action Level (1 mg/kg), was detected in six of sixteen samples at low levels (i.e.well below the 1 mg/kg level).
• All gross alpha, thorium 228, 230, and 232 isotopes, and uranium 234 and 235 isotopes werebelow laboratory detection limits. Five of six uranium 238 samples were less than labdetection limits; the one detected sample was very low (0.7± 0.7 pCi/g). All samples haddetectable levels of gross beta, with values ranging from 19 to 35 pCi/g. The levels of grossbeta - in the absence of detectable levels of gross alpha, thorium, and uranium - were probablydue to potassium40 or other naturally occurring beta emitters. No detectable difference inradiological parameters was observed between fish sampling results upstream and downstreamfrom Chapman Run.
27

DSW/MAS 1995-8-10 Chapman Run/ Shieldalloy August 30, 1995
Table 7. Results of metal and lipid tissue analyses from fish collected by the Ohio EPA in ChapmanRun and Wills Creek during 1994.
__________________________________________________________________________________
FISH TISSUE -METALSStreamRiver Mile Lipid Vanadium Mercury Chromium Cadmium LeadFish Species (%) (mg/kg) (mg/kg) (mg/kg) (mg/kg) (mg/kg)__________________________________________________________________________________
Chapman Run
RM 5.2 (Adj. King Rd.)White sucker - WBC 0.70 <0.2 0.14 0.05 <0.04 <0.10White sucker - lab duplicate 1.62 <0.2 0.10 0.05 <0.04 <0.10Creek chub - WBC 1.65 <0.2 <0.08 <0.04 <0.04 <0.10
RM 1.6 (SR 209)White sucker - WBC 1.34 <0.2 <0.08 0.10 <0.04 0.12Creek chub - WBC 0.85 <0.2 <0.08 0.05 <0.04 <0.10Grass pickerel - WB 1.61 <0.4 <0.08 0.09 <0.07 <0.17
RM 1.1 (Dst. E. Slag Ditch)White sucker - WBC 0.98 1.7 <0.08 0.14 <0.04 0.20Creek chub - WBC 1.05 1.1 <0.08 <0.04 <0.04 <0.10Grass pickerel - WBC 1.31 4.6 <0.08 0.10 <0.04 <0.10
RM 0.9 (Dst. W. Slag Ditch)White sucker/ green sunfish - WBC 2.43 5.7 <0.08 0.14 <0.04 0.26
Wills Creek
RM 67.5 (Upst. Chapman Run)Common carp - WBC 2.5 0.6 <0.08 0.05 0.73 <0.10Channel catfish - SFFC 0.62 <0.2 0.11 0.05 <0.04 <0.10Channel catfish - SFF 1.6 <0.2 0.16 <0.04 <0.04 <0.10
RM 67.0 (Dst. Chapman Run)Common carp - WBC 4.2 0.6 <0.08 0.06 0.14 0.15Channel catfish - SFFC 1.4 <0.2 0.10 <0.04 <0.04 <0.10Channel catfish - SFF 1.0 <0.2 0.10 <0.04 <0.04 <0.10
__________________________________________________________________________________
28
DSW/MAS 1995-8-10 Chapman Run/ Shieldalloy August 30, 1995
Table 8. Results of radiological tissue analyses from fish collected by the Ohio EPA in Wills Creekduring 1994.
__________________________________________________________________________________
FISH TISSUE - RADIOLOGICALS (pCi/g)
Gross Gross Thorium Uranium Alpha Beta 228 230 232 234 235 238
__________________________________________________________________________________
Wills CreekRM 67.5 (Upst. Chapman Run)
Common carp - WBC ND 21+6.9 ND ND ND ND ND NDChannel catfish - SFFC ND 34+7.5 ND ND ND ND ND NDChannel catfish - SFF ND 22+7.0 ND ND ND ND ND 0.07+0.07
RM 67.0 (Dst. Chapman Run)Common carp - WBC ND 19+7.0 ND ND ND ND ND NDChannel catfish - SFFC ND 35+7.8 ND ND ND ND ND NDChannel catfish - SFF ND 23+7.1 ND ND ND ND ND ND
__________________________________________________________________________________
WBC = whole body composite. SFFC = skin off fillet composite. SFF = skin off fillet. ND = not detected
29

DSW/MAS 1995-8-10 Chapman Run/ Shieldalloy August 30, 1995
REFERENCES
Birge W.J. 1978. Aquatic toxicology of trace elements of coal and fly ash, in J.H. Thorp and J.W.Gibbons (eds.). Dept. Energy Symp. Ser. Vol. 48, Energy and environmental stress in aquaticsystems, Augusta, GA: 219-240.
DeShon, J.D. 1995. Development and application of Ohio EPA’s invertebrate community index (ICI),in W.S. Davis and T. Simon (eds.). Biological Assessment and Criteria: Tools for Risk-basedPlanning and Decision Making. CRC Press/Lewis Publishers, Ann Arbor.
Fausch, D.O., Karr, J.R. and P.R. Yant. 1984. Regional application of an index of biotic integritybased on stream fish communities. Trans. Amer. Fish. Soc. 113:39-55.
Holdway, D.A. and J.B. Sprague. 1979. Chronic toxicity of vanadium to flagfish. Wat. Res. 13(9):905-910.
Hughes, R. M., D. P. Larsen, and J. M. Omernik. 1986. Regional reference sites: a method forassessing stream pollution. Env. Mgmt. 10(5): 629-635.
Karr, J.R. 1981. Assessment of biotic integrity using fish communities. Fisheries 6 (6): 21-27.
Karr, J.R. 1991. Biological integrity: a long-neglected aspect of water resource management. EcologicalApplications 1(1):66-84.
Karr, J.R. and D.R. Dudley. 1981. Ecological perspective on water quality goals. Env. Mgmt. 5(1):55-68.
Karr, J.R., K.D. Fausch, P.L. Angermier, P.R. Yant, and I.J. Schlosser. 1986. Assessing biologicalintegrity in running waters: a method and its rationale. Ill. Nat. Hist. Surv. Spec. Publ. 5. 28 pp.
Kimball, G. 1978. The effects of lesser known metals and one organic to fathead minnows(Pimephales promelas) and Daphnia magna. Manuscript, Dept. of Entomology, Fisheries andWildlife, Univ. of Minnesota, Minneapolis, MN: 88p.
Knudtson, B.K. 1979. Acute toxicity of vanadium to two species of freshwater fish. Bull. Environ.Contam. Toxicol. 23(1/2): 95-99.
Miner R. and D. Borton. 1991. Considerations in the development and implementation of biocriteria,Water Quality Standards for the 21st Century, U.S. EPA, Offc. Science and Technology,Washington, D.C., 115.
Ohio Environmental Protection Agency. 1987a. Biological criteria for the protection of aquatic life:Volume I. The role of biological data in water quality assessment. Division of Water QualityMonitoring and Assessment, Surface Water Section, Columbus, Ohio.
Ohio Environmental Protection Agency. 1987b. Biological criteria for the protection of aquatic life:Volume II. Users manual for biological field assessment of Ohio surface waters. Division ofWater Quality Monitoring and Assessment, Surface Water Section, Columbus, Ohio.
Ohio Environmental Protection Agency. 1988. Analysis of unimpacted stream data for the State ofOhio. Division of Water Quality Monitoring and Assessment, Water Quality Modeling Section,Columbus, Ohio.
30
DSW/MAS 1995-8-10 Chapman Run/ Shieldalloy August 30, 1995
Ohio Environmental Protection Agency. 1989a. Ohio EPA manual of surveillance methods and qualityassurance practices, updated edition. Division of Environmental Services, Columbus, Ohio.
Ohio Environmental Protection Agency. 1989b. Addendum to biological criteria for the protection ofaquatic life, Vol.II: Users manual for biological field assessment of Ohio surface waters. Divisionof Water Quality Planning and Assessment, Surface Water Section, Columbus, Ohio.
Ohio Environmental Protection Agency. 1989c. Biological criteria for the protection of aquatic life:Volume III. Standardized biological field sampling and laboratory methods for assessing fish andmacroinvertebrate communities. Division of Water Quality Planning and Assessment, Columbus,Ohio.
Ohio Environmental Protection Agency. 1990. The use of biocriteria in the Ohio EPA surface watermonitoring and assessment program. Division of Water Quality Planning and Assessment,Ecological Assessment Section, Columbus, Ohio. 52 pp.
Ohio Environmental Protection Agency.1992a. DERR sampling guidance, Vol. III. Field standardoperating procedures. Division of Emergency and Remedial Response, Columbus, Ohio.
Ohio Environmental Protection Agency.1992b. Ohio water resource inventory - 1992 305b report.Volume I. Edward T. Rankin, editor. Division of Water Quality Planning and Assessment,Surface Water Section, Columbus, Ohio.
Omernik, J. M. 1987. Ecoregions of the conterminous United States. Ann. Assoc. Amer. Geogr.77(1): 118-125.
PCR. 1993. Screening site inspection report. Shieldalloy Metallurgical Corporation, Cambridge, Ohio.PRC Environmental Management, Inc. Chicago, IL. 36 p.
Persaud D., J. Jaagumagi, and A. Hayton. 1993. Guidelines for the protection and management ofaquatic sediment quality in Ontario. Ontario Ministry of the Environment. Toronto. 24 pp.
Rankin, E.T. 1989. The qualitative habitat evaluation index (QHEI): rationale, methods, andapplication. Division of Water Quality Planning and Assessment, Columbus, Ohio.
Rankin, E.T. 1995. Habitat indices in water resource quality assessments, in W.S. Davis and T.Simon (eds.). Biological Assessment and Criteria: Tools for Risk-based Planning and DecisionMaking. CRC Press/Lewis Publishers, Ann Arbor.
Skalski, C.J. 1995. Vanadium criteria development fact sheet. Ohio EPA, Division of Surface Water,Program Development Section, Columbus, Ohio. 3p.
Suter, G.W. 1993. A critique of ecosystem health concepts and indexes. Environmental Toxicologyand Chemistry, 12: 1533-1539.
Weston. 1990. Site assessment for Shieldalloy Metallurgical Corporation, Cleveland, Ohio. Preparedfor USEPA, Region V, Chicago, IL. Prepared by Weston-Major Programs, Technical AssistanceTeam, Region V. 19 p.
Yoder, C.O. 1989. The development and use of biological criteria for Ohio surface waters. U.S. EPA,Criteria and Standards Div., Water Quality Stds. 21st Century, 1989: 139-146.
31
DSW/MAS 1995-8-10 Chapman Run/ Shieldalloy August 30, 1995
Yoder, C. O. 1991. Answering some concerns about biological criteria based on experiences in Ohio.In: Gretchin H. Flock, editor. Water quality standards for the 21st century. Proceedings of aNational Conference, U. S. EPA, Office of Water, Washington, D.C.
Yoder, C.O. 1995. Policy issues and management applications of biological criteria, in W.S. Davisand T. Simon (eds.). Biological Assessment and Criteria: Tools for Risk-based Planning andDecision Making. CRC Press/Lewis Publishers, Ann Arbor.
Yoder, C.O. and E.T. Rankin. 1995. Biological response signatures and the area of degradation value:new tools for interpreting multi-metric data, in W.S. Davis and T. Simon (eds.). BiologicalAssessment and Criteria: Tools for Risk-based Planning and Decision Making. CRC Press/LewisPublishers, Ann Arbor.
32
DSW/MAS 1995-8-10 Chapman Run/ Shieldalloy August 30, 1995
APPENDIX TABLES
33
DSW/MAS 1995-8-10 Chapman Run/ Shieldalloy August 30, 1995
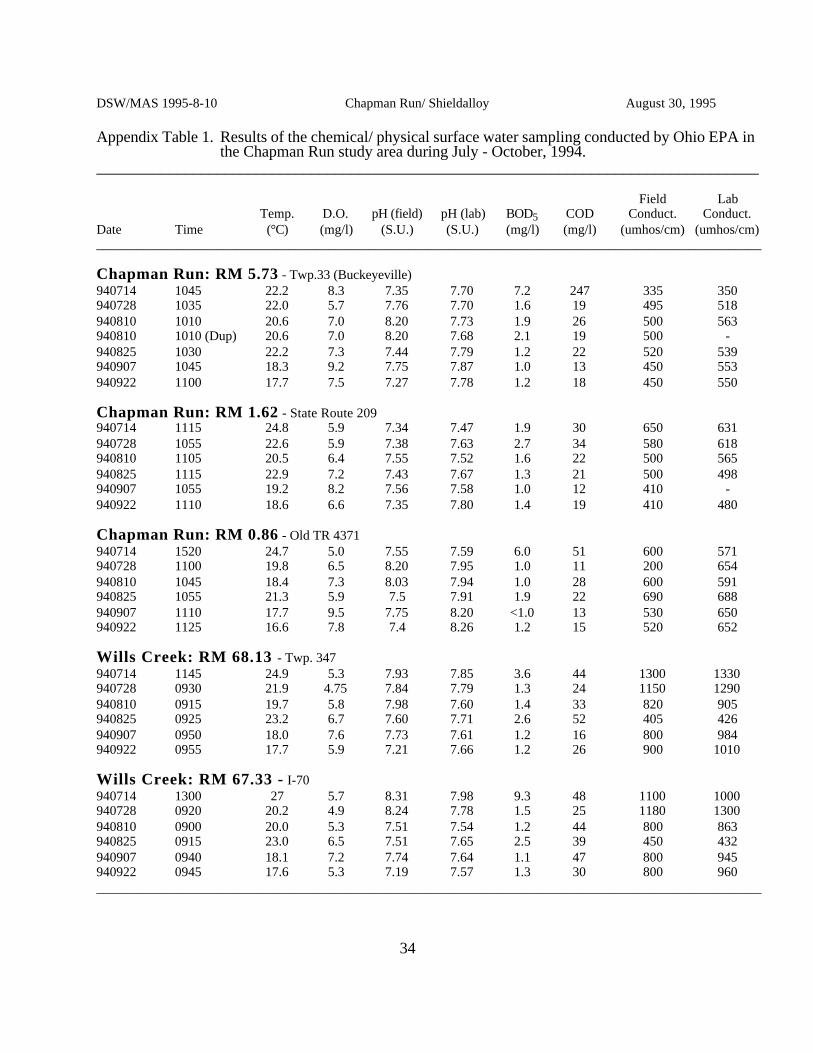
Appendix Table 1. Results of the chemical/ physical surface water sampling conducted by Ohio EPA inthe Chapman Run study area during July - October, 1994.
___________________________________________________________________________________
Field LabTemp. D.O. pH (field) pH (lab) BOD5 COD Conduct. Conduct.
Date Time (°C) (mg/l) (S.U.) (S.U.) (mg/l) (mg/l) (umhos/cm) (umhos/cm)____________________________________________________________________________________________________
Chapman Run: RM 5.73 - Twp.33 (Buckeyeville)940714 1045 22.2 8.3 7.35 7.70 7.2 247 335 350940728 1035 22.0 5.7 7.76 7.70 1.6 19 495 518940810 1010 20.6 7.0 8.20 7.73 1.9 26 500 563940810 1010 (Dup) 20.6 7.0 8.20 7.68 2.1 19 500 -940825 1030 22.2 7.3 7.44 7.79 1.2 22 520 539940907 1045 18.3 9.2 7.75 7.87 1.0 13 450 553940922 1100 17.7 7.5 7.27 7.78 1.2 18 450 550
Chapman Run: RM 1.62 - State Route 209940714 1115 24.8 5.9 7.34 7.47 1.9 30 650 631940728 1055 22.6 5.9 7.38 7.63 2.7 34 580 618940810 1105 20.5 6.4 7.55 7.52 1.6 22 500 565940825 1115 22.9 7.2 7.43 7.67 1.3 21 500 498940907 1055 19.2 8.2 7.56 7.58 1.0 12 410 -940922 1110 18.6 6.6 7.35 7.80 1.4 19 410 480
Chapman Run: RM 0.86 - Old TR 4371940714 1520 24.7 5.0 7.55 7.59 6.0 51 600 571940728 1100 19.8 6.5 8.20 7.95 1.0 11 200 654940810 1045 18.4 7.3 8.03 7.94 1.0 28 600 591940825 1055 21.3 5.9 7.5 7.91 1.9 22 690 688940907 1110 17.7 9.5 7.75 8.20 <1.0 13 530 650940922 1125 16.6 7.8 7.4 8.26 1.2 15 520 652
Wills Creek: RM 68.13 - Twp. 347940714 1145 24.9 5.3 7.93 7.85 3.6 44 1300 1330940728 0930 21.9 4.75 7.84 7.79 1.3 24 1150 1290940810 0915 19.7 5.8 7.98 7.60 1.4 33 820 905940825 0925 23.2 6.7 7.60 7.71 2.6 52 405 426940907 0950 18.0 7.6 7.73 7.61 1.2 16 800 984940922 0955 17.7 5.9 7.21 7.66 1.2 26 900 1010
Wills Creek: RM 67.33 - I-70940714 1300 27 5.7 8.31 7.98 9.3 48 1100 1000940728 0920 20.2 4.9 8.24 7.78 1.5 25 1180 1300940810 0900 20.0 5.3 7.51 7.54 1.2 44 800 863940825 0915 23.0 6.5 7.51 7.65 2.5 39 450 432940907 0940 18.1 7.2 7.74 7.64 1.1 47 800 945940922 0945 17.6 5.3 7.19 7.57 1.3 30 800 960____________________________________________________________________________________________________
34

DSW/MAS 1995-8-10 Chapman Run/ Shieldalloy August 30, 1995
Appendix Table 1. Continued.___________________________________________________________________________________
Chloride NO3-NO2 NH3-N TKN T-Phos. TSS TDS SulfateDate Time (mg/l) (mg/l) (mg/l) (mg/l) (mg/l) (mg/l) (mg/l) (mg/l)____________________________________________________________________________________________________
Chapman Run: RM 5.73 - Twp.33 (Buckeyeville)940714 1045 16 0.47 0.05 0.4 0.14 415 236 61940728 1035 25 0.15 0.06 0.3 <0.05 26 312 85940810 1010 25 0.12 0.06 0.4 <0.05 31 360 97940810 1010 (Dup) 25 0.12 0.06 0.4 <0.05 31 362 102940825 1030 21 0.80 0.11 0.3 <0.05 19 348 101940907 1045 18 0.96 0.12 0.3 <0.05 20 339 97940922 1100 18 0.24 <0.05 0.4 <0.05 18 348 96
Chapman Run: RM 1.62 - State Route 209940714 1115 43 <0.10 <0.05 - 0.09 35 386 98940728 1055 29 <0.10 0.10 0.3 <0.05 27 374 110940810 1105 31 <0.10 <0.05 0.4 <0.05 25 362 88940825 1115 25 <0.10 <0.05 0.3 <0.05 13 312 76940907 1055 21 <0.10 <0.05 0.2 <0.05 12 296 82940922 1110 25 <0.10 <0.05 0.4 <0.05 <5 308 73
Chapman Run: RM 0.86 - Old TR 4371940714 1520 34 0.20 <0.05 0.4 0.07 97 359 98940728 1100 28 <0.10 0.08 0.3 <0.05 19 414 130940810 1045 39 <0.10 0.10 0.4 <0.05 33 428 111940825 1055 43 0.14 0.22 0.5 <0.05 10 440 128940907 1110 40 <0.10 <0.05 0.3 <0.05 6 410 115940922 1125 37 <0.10 <0.05 0.5 <0.05 5 410 110
Wills Creek: RM 68.13 - Twp. 347940714 1145 17 0.28 <0.05 0.4 0.06 54 1010 500940728 0930 15 0.42 0.12 0.4 0.11 46 896 483940810 0915 14 0.28 0.14 0.5 0.09 56 632 310940825 0925 8 <0.10 <0.05 0.5 0.13 82 292 96940907 0950 17 0.28 0.07 0.3 0.16 46 694 370940922 0955 18 0.30 <0.05 0.4 0.12 32 730 450
Wills Creek: RM 67.33 - I-70940714 1300 20 <0.10 <0.05 0.4 0.06 90 710 390940728 0920 14 0.30 0.10 0.4 <0.05 41 937 524940810 0900 14 0.24 0.10 0.50 0.05 47 609 290940825 0915 11 <0.10 <0.05 0.4 0.08 63 296 97940907 0940 16 0.23 <0.05 0.3 0.10 43 664 338940922 0945 16 0.18 <0.05 0.4 0.05 30 690 299____________________________________________________________________________________________________
35
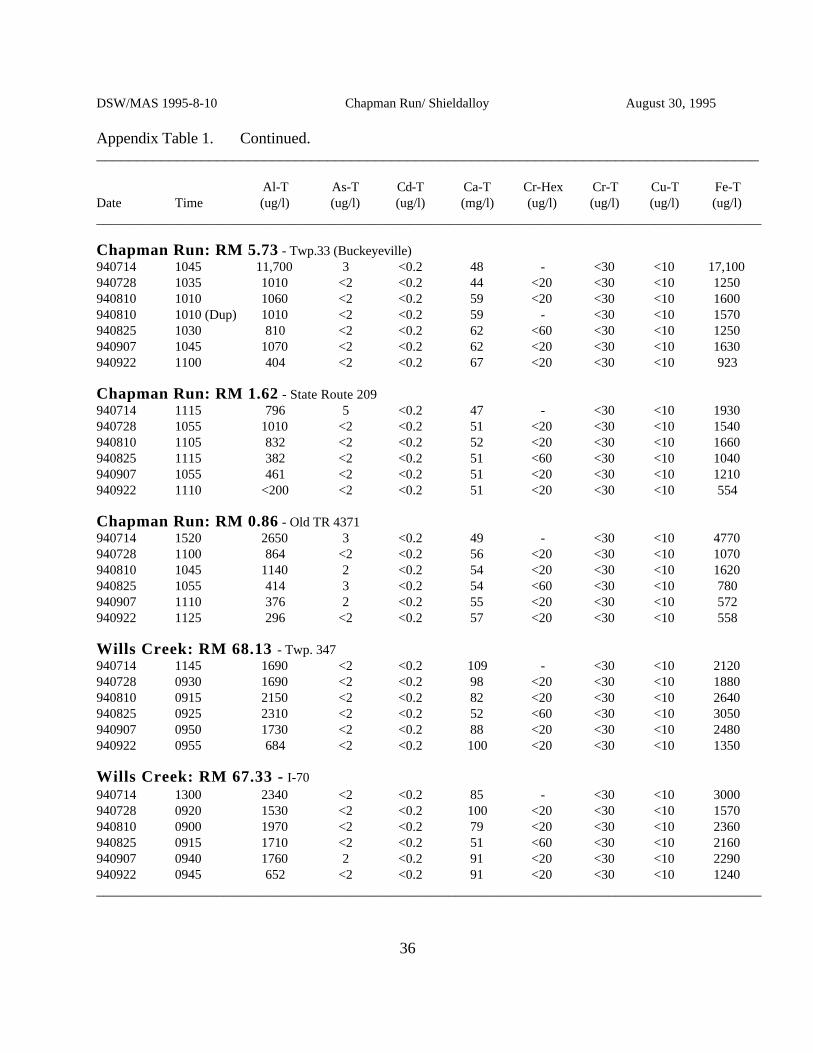
DSW/MAS 1995-8-10 Chapman Run/ Shieldalloy August 30, 1995
Appendix Table 1. Continued.___________________________________________________________________________________
Al-T As-T Cd-T Ca-T Cr-Hex Cr-T Cu-T Fe-TDate Time (ug/l) (ug/l) (ug/l) (mg/l) (ug/l) (ug/l) (ug/l) (ug/l)____________________________________________________________________________________________________
Chapman Run: RM 5.73 - Twp.33 (Buckeyeville)940714 1045 11,700 3 <0.2 48 - <30 <10 17,100940728 1035 1010 <2 <0.2 44 <20 <30 <10 1250940810 1010 1060 <2 <0.2 59 <20 <30 <10 1600940810 1010 (Dup) 1010 <2 <0.2 59 - <30 <10 1570940825 1030 810 <2 <0.2 62 <60 <30 <10 1250940907 1045 1070 <2 <0.2 62 <20 <30 <10 1630940922 1100 404 <2 <0.2 67 <20 <30 <10 923
Chapman Run: RM 1.62 - State Route 209940714 1115 796 5 <0.2 47 - <30 <10 1930940728 1055 1010 <2 <0.2 51 <20 <30 <10 1540940810 1105 832 <2 <0.2 52 <20 <30 <10 1660940825 1115 382 <2 <0.2 51 <60 <30 <10 1040940907 1055 461 <2 <0.2 51 <20 <30 <10 1210940922 1110 <200 <2 <0.2 51 <20 <30 <10 554
Chapman Run: RM 0.86 - Old TR 4371940714 1520 2650 3 <0.2 49 - <30 <10 4770940728 1100 864 <2 <0.2 56 <20 <30 <10 1070940810 1045 1140 2 <0.2 54 <20 <30 <10 1620940825 1055 414 3 <0.2 54 <60 <30 <10 780940907 1110 376 2 <0.2 55 <20 <30 <10 572940922 1125 296 <2 <0.2 57 <20 <30 <10 558
Wills Creek: RM 68.13 - Twp. 347940714 1145 1690 <2 <0.2 109 - <30 <10 2120940728 0930 1690 <2 <0.2 98 <20 <30 <10 1880940810 0915 2150 <2 <0.2 82 <20 <30 <10 2640940825 0925 2310 <2 <0.2 52 <60 <30 <10 3050940907 0950 1730 <2 <0.2 88 <20 <30 <10 2480940922 0955 684 <2 <0.2 100 <20 <30 <10 1350
Wills Creek: RM 67.33 - I-70940714 1300 2340 <2 <0.2 85 - <30 <10 3000940728 0920 1530 <2 <0.2 100 <20 <30 <10 1570940810 0900 1970 <2 <0.2 79 <20 <30 <10 2360940825 0915 1710 <2 <0.2 51 <60 <30 <10 2160940907 0940 1760 2 <0.2 91 <20 <30 <10 2290940922 0945 652 <2 <0.2 91 <20 <30 <10 1240____________________________________________________________________________________________________
36

DSW/MAS 1995-8-10 Chapman Run/ Shieldalloy August 30, 1995
Appendix Table 1. Continued.___________________________________________________________________________________
Hardness FecalPb-T Mg-T Mn-T Ni-T Vn-T Zn-T T-CaCO3 Coliform
Date Time (ug/l) (mg/l) (ug/l) (ug/l) (ug/l) (ug/l) (mg/l) (#/100ml)____________________________________________________________________________________________________
Chapman Run: RM 5.73 - Twp.33 (Buckeyeville)940714 1045 10 13 875 <40 - 109 173 -940728 1035 <2 18 193 <40 <10 <10 184 -940810 1010 <2 20 309 <40 <10 <10 230 -940810 1010 (Dup) <2 20 310 <40 - <10 230 -940825 1030 <2 19 205 <40 <10 <10 233 -940907 1045 <2 18 163 <40 <10 <10 229 -940922 1100 <2 21 204 <40 <10 <10 254 -941018 1230 - - - - - - - <10
Chapman Run: RM 1.62 - State Route 209940714 1115 2 17 1460 <40 - 23 187 -940728 1055 <2 19 638 <40 <10 30 206 -940810 1105 <2 19 527 <40 <10 <10 208 -940825 1115 <2 17 320 <40 <10 <10 197 -940907 1055 <2 17 464 <40 <10 <10 197 -940922 1110 <2 17 351 <40 <10 <10 197 -941018 1235 - - - - - - - 10
Chapman Run: RM 0.86 - Old TR 4371940714 1520 4 17 1100 <40 - 18 192 -940728 1100 <2 22 364 <40 386 <10 230 -940810 1045 <2 21 350 <40 390 14 221 -940825 1055 <2 20 323 <40 1320 <10 217 -940907 1110 <2 20 253 <40 426 <10 220 -940922 1125 <2 21 256 <40 540 <10 229 -941018 1240 - - - - - - - 255
Wills Creek: RM 68.13 - Twp. 347940714 1145 <2 51 1185 <40 - <10 482 -940728 0930 <2 50 269 <40 <10 <10 450 -940810 0915 10 36 325 <40 <10 27 353 -940825 0925 <2 11 254 <40 <10 20 175 -940907 0950 <2 39 321 <40 <10 11 380 -940922 0955 <2 47 325 <40 <10 <10 443 -
Wills Creek: RM 67.33 - I-70940714 1300 <2 37 441 <40 - 18 365 -940728 0920 <2 52 294 <40 11 <10 464 -940810 0900 <2 35 319 <40 10 12 341 -940825 0915 2 17 213 <40 45 <10 197 -940907 0940 <2 40 355 <40 19 56 392 -940922 0945 <2 45 333 <40 24 <10 413 -____________________________________________________________________________________________________
37

DSW/MAS 1995-8-10 Chapman Run/ Shieldalloy August 30, 1995
Appendix Table 2. Inorganic target analyte list (TAL) parameters (metals), select radiologicals, totalorganic carbon, and grain size analyses of sediment collected from the Chapman Runstudy area, 1994. Included in the table are results of tests conducted during 1990(Weston 1990) and 1993 (PRC 1993). Depth of sediment sample is noted inparentheses. D = duplicate sediment sample.
__________________________________________________________________________________Sampling Location - by River Mile
Chapman Run OEPA Weston OEPA OEPA PRC PRC5.73 1.55 1.50 1.50 1.44 1.27
Parameter (0-6”) (0-6”) (12-18”)__________________________________________________________________________________Metals Aluminum (mg/kg) 4300 3920 3760 3870 7760 5350Antimony (mg/kg) <10 <5 <10 <10 - -Arsenic (mg/kg) <10 0.1 10 11 9.0 9.8Barium (mg/kg) 51.7 35.8 38.1 41.3 85.3 84.8Beryllium (mg/kg) 0.46 <0.5 0.76 0.80 2.0 2.3Cadmium (mg/kg) 2.57 <0.5 2.93 4.63 - -Calcium (mg/kg) 6530 - 1390 3430 2230 3520Chromium (mg/kg) 6.8 <3.0 6.2 6.3 13.6 16.1Cobalt (mg/kg) 6.9 - 11.2 17.6 19.8 17.3Copper (mg/kg) 11.1 7.3 8.6 11.5 15.2 23.8Iron (mg/kg) 13,600 - 15,100 25,000 31,800 30,900Lead (mg/kg) 10.1 6.4 8.9 17.5 14.6 15.2Magnesium (mg/kg) 1750 - 886 1210 2000 1750Manganese (mg/kg) 425 - 352 866 1310 1100Mercury (mg/kg) <0.08 0.07 <0.08 <0.08 0.38 NDNickel (mg/kg) 10.2 12.5 13.1 17.3 21.6 24.2Potassium (mg/kg) 487 - 346 292 365 257Selenium (mg/kg) <10 0.14 <10 <10 - -Silver (mg/kg) <5.0 0.96 <5.0 <5.0 3.8 4.5Sodium (mg/kg) 70 - 58 74 243 365Thallium (mg/kg) <80 <5 <80 <80 - -Vanadium (mg/kg) 12.4 19.3 11.4 14.6 31.0 36.4Zinc (mg/kg) 44.5 36.1 45.7 61.1 75.2 77.2T. Organic Carbon (mg/kg) 8680 - 9610 5390 - -Grain size % Gravel 10.1 - 2.2 6.9 - - % Sand 33.8 - 38.9 37.8 - - % Silt 41.7 - 43.7 41.7 - - % Clay 14.4 - 15.2 13.6 - -RadiologicalsRadium 226 (pCi/g) 1.1+0.29 - - - - -Radium 228 (pCi/g) 1.0+0.41 - - - - -Gross Alpha (pCi/g) 18+6.9 0+57.8 - - - -Gross Beta (pCi/g) 22+7.1 5.9+3.8 - - - -Thorium-228 (pCi/g) ND - - - - -Thorium-230 (pCi/g) 1.0+0.23 - - - - -Thorium-232 (pCi/g) ND - - - - -Uranium 234 (pCi/g) ND - - - - -Uranium 235 (pCi/g) ND - - - - -Uranium 238 (pCi/g) ND - - - - -___________________________________________________________________________________________________
38
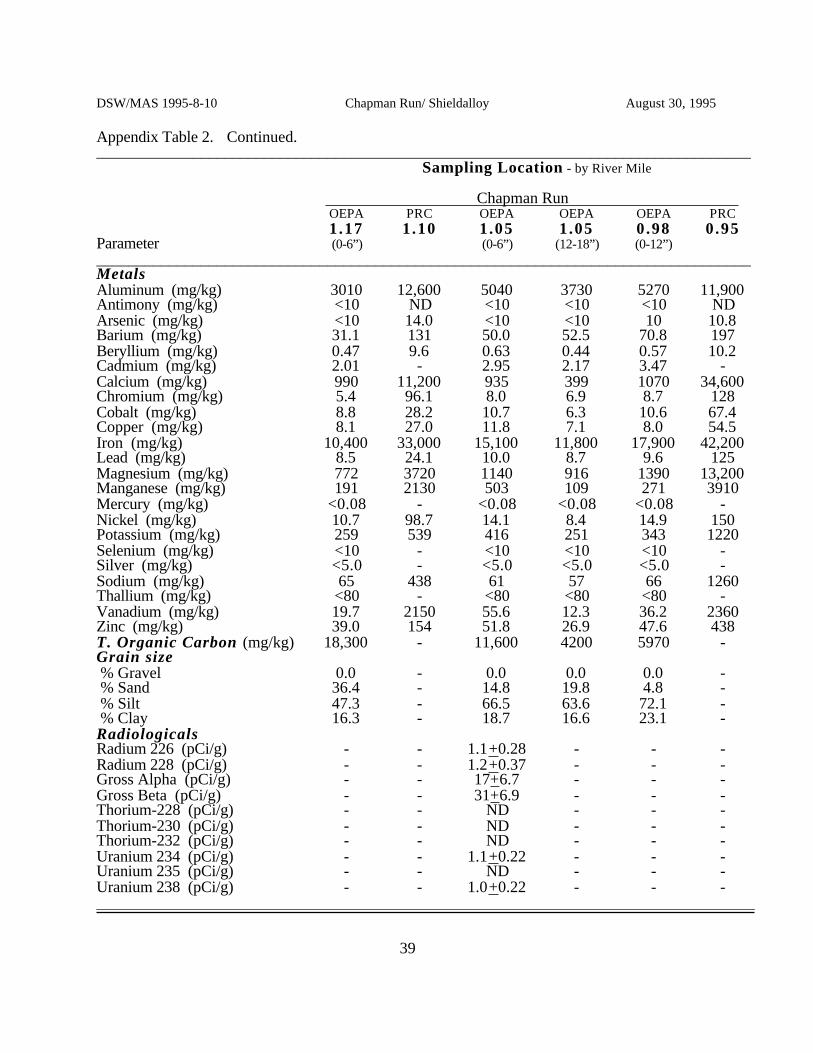
DSW/MAS 1995-8-10 Chapman Run/ Shieldalloy August 30, 1995
Appendix Table 2. Continued.__________________________________________________________________________________
Sampling Location - by River Mile
Chapman Run OEPA PRC OEPA OEPA OEPA PRC1.17 1.10 1.05 1.05 0.98 0.95
Parameter (0-6”) (0-6”) (12-18”) (0-12”)__________________________________________________________________________________Metals Aluminum (mg/kg) 3010 12,600 5040 3730 5270 11,900Antimony (mg/kg) <10 ND <10 <10 <10 NDArsenic (mg/kg) <10 14.0 <10 <10 10 10.8Barium (mg/kg) 31.1 131 50.0 52.5 70.8 197Beryllium (mg/kg) 0.47 9.6 0.63 0.44 0.57 10.2Cadmium (mg/kg) 2.01 - 2.95 2.17 3.47 -Calcium (mg/kg) 990 11,200 935 399 1070 34,600Chromium (mg/kg) 5.4 96.1 8.0 6.9 8.7 128Cobalt (mg/kg) 8.8 28.2 10.7 6.3 10.6 67.4Copper (mg/kg) 8.1 27.0 11.8 7.1 8.0 54.5Iron (mg/kg) 10,400 33,000 15,100 11,800 17,900 42,200Lead (mg/kg) 8.5 24.1 10.0 8.7 9.6 125Magnesium (mg/kg) 772 3720 1140 916 1390 13,200Manganese (mg/kg) 191 2130 503 109 271 3910Mercury (mg/kg) <0.08 - <0.08 <0.08 <0.08 -Nickel (mg/kg) 10.7 98.7 14.1 8.4 14.9 150Potassium (mg/kg) 259 539 416 251 343 1220Selenium (mg/kg) <10 - <10 <10 <10 -Silver (mg/kg) <5.0 - <5.0 <5.0 <5.0 -Sodium (mg/kg) 65 438 61 57 66 1260Thallium (mg/kg) <80 - <80 <80 <80 -Vanadium (mg/kg) 19.7 2150 55.6 12.3 36.2 2360Zinc (mg/kg) 39.0 154 51.8 26.9 47.6 438T. Organic Carbon (mg/kg) 18,300 - 11,600 4200 5970 -Grain size % Gravel 0.0 - 0.0 0.0 0.0 - % Sand 36.4 - 14.8 19.8 4.8 - % Silt 47.3 - 66.5 63.6 72.1 - % Clay 16.3 - 18.7 16.6 23.1 -RadiologicalsRadium 226 (pCi/g) - - 1.1+0.28 - - -Radium 228 (pCi/g) - - 1.2+0.37 - - -Gross Alpha (pCi/g) - - 17+6.7 - - -Gross Beta (pCi/g) - - 31+6.9 - - -Thorium-228 (pCi/g) - - ND - - -Thorium-230 (pCi/g) - - ND - - -Thorium-232 (pCi/g) - - ND - - -Uranium 234 (pCi/g) - - 1.1+0.22 - - -Uranium 235 (pCi/g) - - ND - - -Uranium 238 (pCi/g) - - 1.0+0.22 - - -___________________________________________________________________________________________________
39
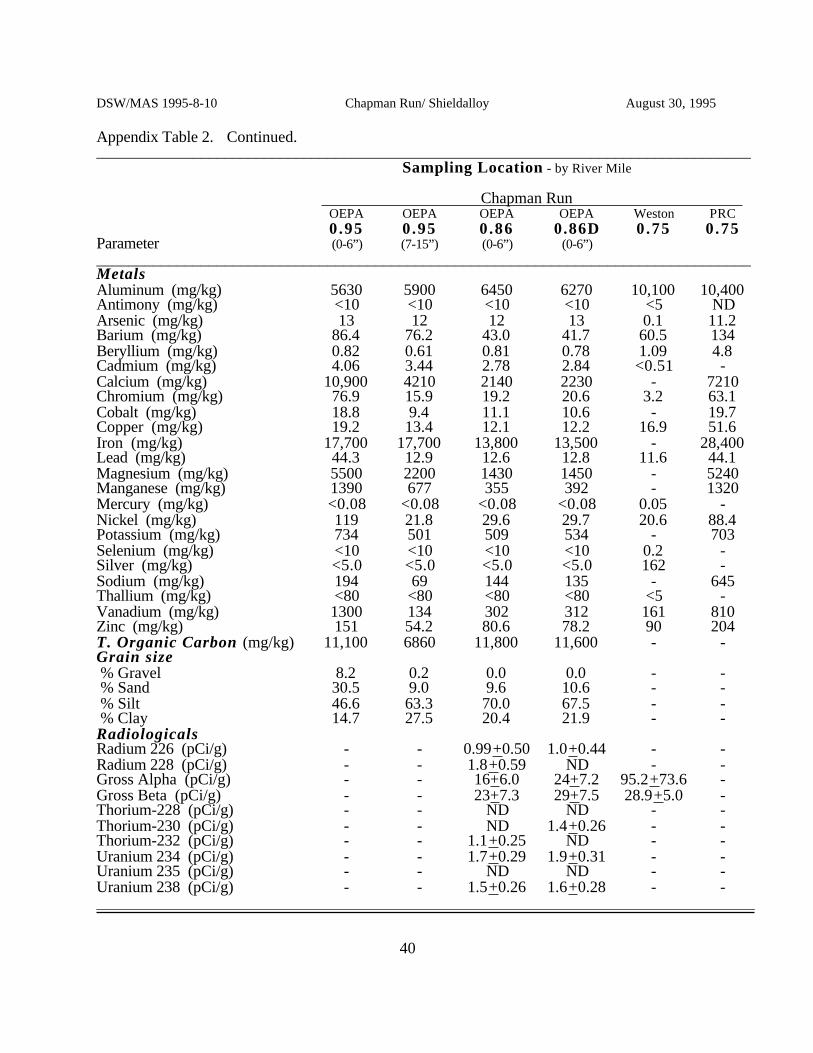
DSW/MAS 1995-8-10 Chapman Run/ Shieldalloy August 30, 1995
Appendix Table 2. Continued.__________________________________________________________________________________
Sampling Location - by River Mile
Chapman Run OEPA OEPA OEPA OEPA Weston PRC0.95 0.95 0.86 0.86D 0.75 0.75
Parameter (0-6”) (7-15”) (0-6”) (0-6”)__________________________________________________________________________________Metals Aluminum (mg/kg) 5630 5900 6450 6270 10,100 10,400Antimony (mg/kg) <10 <10 <10 <10 <5 NDArsenic (mg/kg) 13 12 12 13 0.1 11.2Barium (mg/kg) 86.4 76.2 43.0 41.7 60.5 134Beryllium (mg/kg) 0.82 0.61 0.81 0.78 1.09 4.8Cadmium (mg/kg) 4.06 3.44 2.78 2.84 <0.51 -Calcium (mg/kg) 10,900 4210 2140 2230 - 7210Chromium (mg/kg) 76.9 15.9 19.2 20.6 3.2 63.1Cobalt (mg/kg) 18.8 9.4 11.1 10.6 - 19.7Copper (mg/kg) 19.2 13.4 12.1 12.2 16.9 51.6Iron (mg/kg) 17,700 17,700 13,800 13,500 - 28,400Lead (mg/kg) 44.3 12.9 12.6 12.8 11.6 44.1Magnesium (mg/kg) 5500 2200 1430 1450 - 5240Manganese (mg/kg) 1390 677 355 392 - 1320Mercury (mg/kg) <0.08 <0.08 <0.08 <0.08 0.05 -Nickel (mg/kg) 119 21.8 29.6 29.7 20.6 88.4Potassium (mg/kg) 734 501 509 534 - 703Selenium (mg/kg) <10 <10 <10 <10 0.2 -Silver (mg/kg) <5.0 <5.0 <5.0 <5.0 162 -Sodium (mg/kg) 194 69 144 135 - 645Thallium (mg/kg) <80 <80 <80 <80 <5 -Vanadium (mg/kg) 1300 134 302 312 161 810Zinc (mg/kg) 151 54.2 80.6 78.2 90 204T. Organic Carbon (mg/kg) 11,100 6860 11,800 11,600 - -Grain size % Gravel 8.2 0.2 0.0 0.0 - - % Sand 30.5 9.0 9.6 10.6 - - % Silt 46.6 63.3 70.0 67.5 - - % Clay 14.7 27.5 20.4 21.9 - -RadiologicalsRadium 226 (pCi/g) - - 0.99+0.50 1.0+0.44 - -Radium 228 (pCi/g) - - 1.8+0.59 ND - -Gross Alpha (pCi/g) - - 16+6.0 24+7.2 95.2+73.6 -Gross Beta (pCi/g) - - 23+7.3 29+7.5 28.9+5.0 -Thorium-228 (pCi/g) - - ND ND - -Thorium-230 (pCi/g) - - ND 1.4+0.26 - -Thorium-232 (pCi/g) - - 1.1+0.25 ND - -Uranium 234 (pCi/g) - - 1.7+0.29 1.9+0.31 - -Uranium 235 (pCi/g) - - ND ND - -Uranium 238 (pCi/g) - - 1.5+0.26 1.6+0.28 - -___________________________________________________________________________________________________
40

DSW/MAS 1995-8-10 Chapman Run/ Shieldalloy August 30, 1995
Appendix Table 2. Continued.__________________________________________________________________________________
Sampling Location - by River Mile
Chapman Run East Slag Ditch OEPA OEPA Weston OEPA Weston Weston0.45 0.02 0.02 0 .7 ,0 .40 0 .7 ,0 .2 0.75
Parameter (0-10”) (0-6”) (0-6”)__________________________________________________________________________________Metals Aluminum (mg/kg) 306 4820 7250 4690 2880 5500Antimony (mg/kg) <10 <10 <5 <100 <5 <5Arsenic (mg/kg) 15 21 <0.1 <100 0.2 <0.1Barium (mg/kg) 32.7 73.5 97.8 45.0 27.1 85.3Beryllium (mg/kg) 0.73 0.62 0.58 <2.0 <0.5 <0.5Cadmium (mg/kg) 1.85 3.21 <0.5 11.0 <0.5 <0.5Calcium (mg/kg) 1300 1240 - 863 - -Chromium (mg/kg) 8.3 6.5 5.6 <40.0 <3.0 3.9Cobalt (mg/kg) 6.7 9.2 - <10.0 - -Copper (mg/kg) 8.5 12.7 12.1 <20.0 3.85 7.1Iron (mg/kg) 8850 16,300 - 58,000 - -Lead (mg/kg) 6.3 9.7 35.9 <50.0 23.4 9.4Magnesium (mg/kg) 791 1390 - 685 - -Manganese (mg/kg) 240 667 - 83.0 - -Mercury (mg/kg) <0.08 <0.08 0.04 <0.08 0.04 0.02Nickel (mg/kg) 10.4 12.8 20.8 <20.0 13.7 11.9Potassium (mg/kg) 238 390 - 381 - -Selenium (mg/kg) <10 <10 0.18 <100 0.15 0.21Silver (mg/kg) <5.0 <5.0 19.2 <50.0 <1.0 14.1Sodium (mg/kg) 92 76 - <500 - -Thallium (mg/kg) <80 <80 <5 <800 <5 <5Vanadium (mg/kg) 354 54.0 19.9 22.0 21.0 22.9Zinc (mg/kg) 51.8 39.8 82.5 <50.0 13.7 52T. Organic Carbon (mg/kg) 33,700 5100 - 14,000 - -Grain size % Gravel 0.0 0.0 - 1.0 - - % Sand 8.2 24.8 - 11.5 - - % Silt 70.6 56.9 - 58.5 - - % Clay 21.2 18.3 - 29.0 - -RadiologicalsRadium 226 (pCi/g) 1.1+0.47 - - 1.5+0.41 - -Radium 228 (pCi/g) ND - - 0.97+0.58 - -Gross Alpha (pCi/g) 20+8.6 - 289+93.0 8.6+5.8 1.7+6.4 86.5+72.6Gross Beta (pCi/g) 34+7.1 - 30.2+5.0 24+6.6 8.3+3.9 16.6+4.4Thorium-228 (pCi/g) ND - - ND -Thorium-230 (pCi/g) 1.2+0.22 - - ND -Thorium-232 (pCi/g) 1.1+0.22 - - ND -Uranium 234 (pCi/g) 1.0+0.23 - - ND -Uranium 235 (pCi/g) ND - - ND -Uranium 238 (pCi/g) 1.1+0.22 - - ND -___________________________________________________________________________________________________
41
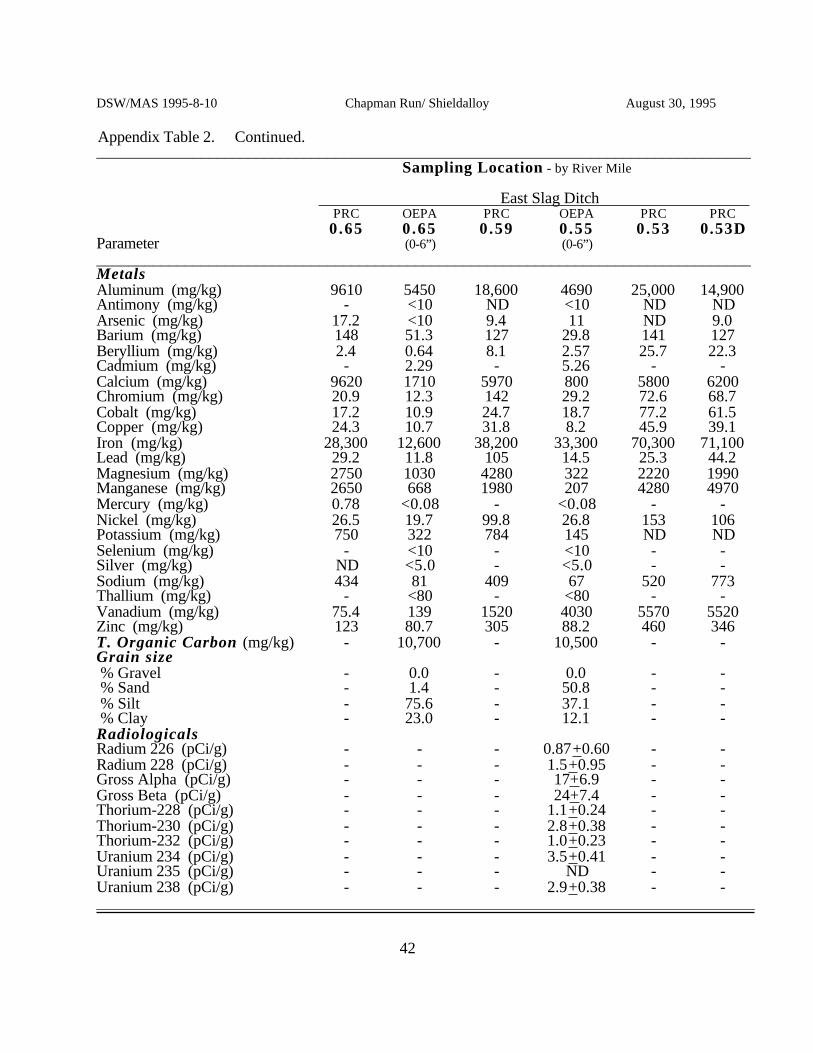
DSW/MAS 1995-8-10 Chapman Run/ Shieldalloy August 30, 1995
Appendix Table 2. Continued.__________________________________________________________________________________
Sampling Location - by River Mile
East Slag Ditch PRC OEPA PRC OEPA PRC PRC0.65 0.65 0.59 0.55 0.53 0.53D
Parameter (0-6”) (0-6”)__________________________________________________________________________________Metals Aluminum (mg/kg) 9610 5450 18,600 4690 25,000 14,900Antimony (mg/kg) - <10 ND <10 ND NDArsenic (mg/kg) 17.2 <10 9.4 11 ND 9.0Barium (mg/kg) 148 51.3 127 29.8 141 127Beryllium (mg/kg) 2.4 0.64 8.1 2.57 25.7 22.3Cadmium (mg/kg) - 2.29 - 5.26 - -Calcium (mg/kg) 9620 1710 5970 800 5800 6200Chromium (mg/kg) 20.9 12.3 142 29.2 72.6 68.7Cobalt (mg/kg) 17.2 10.9 24.7 18.7 77.2 61.5Copper (mg/kg) 24.3 10.7 31.8 8.2 45.9 39.1Iron (mg/kg) 28,300 12,600 38,200 33,300 70,300 71,100Lead (mg/kg) 29.2 11.8 105 14.5 25.3 44.2Magnesium (mg/kg) 2750 1030 4280 322 2220 1990Manganese (mg/kg) 2650 668 1980 207 4280 4970Mercury (mg/kg) 0.78 <0.08 - <0.08 - -Nickel (mg/kg) 26.5 19.7 99.8 26.8 153 106Potassium (mg/kg) 750 322 784 145 ND NDSelenium (mg/kg) - <10 - <10 - -Silver (mg/kg) ND <5.0 - <5.0 - -Sodium (mg/kg) 434 81 409 67 520 773Thallium (mg/kg) - <80 - <80 - -Vanadium (mg/kg) 75.4 139 1520 4030 5570 5520Zinc (mg/kg) 123 80.7 305 88.2 460 346T. Organic Carbon (mg/kg) - 10,700 - 10,500 - -Grain size % Gravel - 0.0 - 0.0 - - % Sand - 1.4 - 50.8 - - % Silt - 75.6 - 37.1 - - % Clay - 23.0 - 12.1 - -RadiologicalsRadium 226 (pCi/g) - - - 0.87+0.60 - -Radium 228 (pCi/g) - - - 1.5+0.95 - -Gross Alpha (pCi/g) - - - 17+6.9 - -Gross Beta (pCi/g) - - - 24+7.4 - -Thorium-228 (pCi/g) - - - 1.1+0.24 - -Thorium-230 (pCi/g) - - - 2.8+0.38 - -Thorium-232 (pCi/g) - - - 1.0+0.23 - -Uranium 234 (pCi/g) - - - 3.5+0.41 - -Uranium 235 (pCi/g) - - - ND - -Uranium 238 (pCi/g) - - - 2.9+0.38 - -___________________________________________________________________________________________________
42

DSW/MAS 1995-8-10 Chapman Run/ Shieldalloy August 30, 1995
Appendix Table 2. Continued.__________________________________________________________________________________
Sampling Location - by River Mile
East Slag Ditch OEPA OEPA OEPA PRC PRC OEPA0.42 0.42 0.32 0.31 0.20 0.02
Parameter (0-6”) (8-12”) (0-6”) (0-6”)__________________________________________________________________________________Metals Aluminum (mg/kg) 8880 7080 5600 25,300 9510 4690Antimony (mg/kg) <100 <10 <100 21.2 ND <10Arsenic (mg/kg) <100 14 <100 9.7 6.2 12Barium (mg/kg) 31.0 49.9 133 148 103 38.1Beryllium (mg/kg) 4.0 1.76 2.0 59.8 3.9 1.15Cadmium (mg/kg) 7.0 4.75 8.0 - - 2.43Calcium (mg/kg) 1050 1050 1880 35,300 6590 1500Chromium (mg/kg) 149 46.5 50.0 129 73.4 46.2Cobalt (mg/kg) <10 5.6 29.0 17.9 13.4 9.0Copper (mg/kg) 24.0 11.0 26.0 19.0 16.8 9.1Iron (mg/kg) 38,900 32,400 43,500 22,600 16,400 12,000Lead (mg/kg) <50.0 14.2 <50.0 96.1 25.4 12.9Magnesium (mg/kg) 934 1280 788 23,800 4770 1300Manganese (mg/kg) 114 140 7430 1160 1490 603Mercury (mg/kg) 0.80 0.89 0.48 - - <0.08Nickel (mg/kg) 43.0 11.1 37.0 626 39.0 32.1Potassium (mg/kg) 512 547 370 823 1060 335Selenium (mg/kg) <100 <10 <100 - - <10Silver (mg/kg) <50 <5 <50 - - <5Sodium (mg/kg) <500 79 <500 687 1470 115Thallium (mg/kg) <800 <80 <800 - - <80Vanadium (mg/kg) 3950 1900 1760 16,000 740 1850Zinc (mg/kg) 55.0 48.4 98.0 134 112 71.4T. Organic Carbon (mg/kg) 13,400 10,200 8900 - - 20,700Grain size % Gravel 0.0 0.0 5.3 - - 0.0 % Sand 22.2 7.6 37.9 - - 6.8 % Silt 47.6 39.7 45.1 - - 71.8 % Clay 30.2 52.7 11.7 - - 21.4RadiologicalsRadium 226 (pCi/g) 2.3+0.59 - - - - 1.4+0.57Radium 228 (pCi/g) 1.9+0.85 - - - - 1.4+0.74Gross Alpha (pCi/g) 120+15 - - - - 15+7.0Gross Beta (pCi/g) 51+8.4 - - - - 26+7.7Thorium-228 (pCi/g) 1.3+0.27 - - - - 1.2+0.25Thorium-230 (pCi/g) 66+1.9 - - - - 1.4+0.27Thorium-232 (pCi/g) 1.5+0.29 - - - - 1.1+0.24Uranium 234 (pCi/g) 2.8+0.37 - - - - 1.5+0.26Uranium 235 (pCi/g) ND - - - - NDUranium 238 (pCi/g) 3.6+0.42 - - - - 1.2+0.23___________________________________________________________________________________________________
43
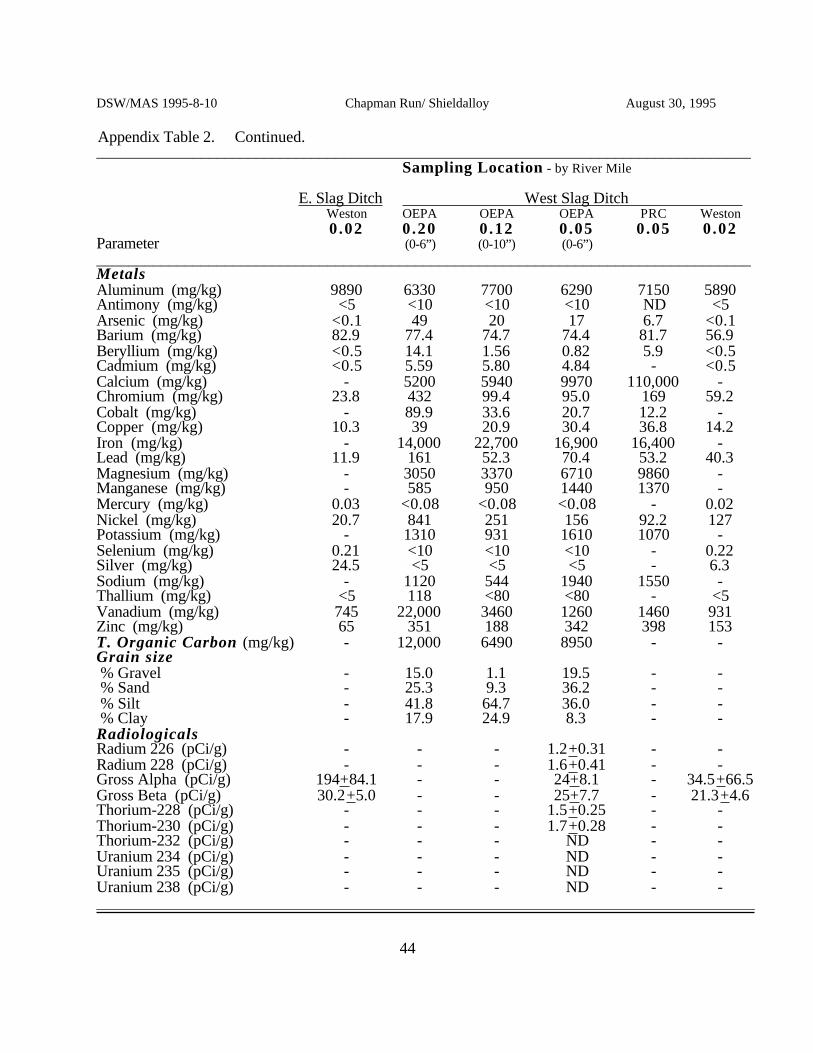
DSW/MAS 1995-8-10 Chapman Run/ Shieldalloy August 30, 1995
Appendix Table 2. Continued.__________________________________________________________________________________
Sampling Location - by River Mile
E. Slag Ditch West Slag Ditch Weston OEPA OEPA OEPA PRC Weston0.02 0.20 0.12 0.05 0.05 0.02
Parameter (0-6”) (0-10”) (0-6”)__________________________________________________________________________________Metals Aluminum (mg/kg) 9890 6330 7700 6290 7150 5890Antimony (mg/kg) <5 <10 <10 <10 ND <5Arsenic (mg/kg) <0.1 49 20 17 6.7 <0.1Barium (mg/kg) 82.9 77.4 74.7 74.4 81.7 56.9Beryllium (mg/kg) <0.5 14.1 1.56 0.82 5.9 <0.5Cadmium (mg/kg) <0.5 5.59 5.80 4.84 - <0.5Calcium (mg/kg) - 5200 5940 9970 110,000 -Chromium (mg/kg) 23.8 432 99.4 95.0 169 59.2Cobalt (mg/kg) - 89.9 33.6 20.7 12.2 -Copper (mg/kg) 10.3 39 20.9 30.4 36.8 14.2Iron (mg/kg) - 14,000 22,700 16,900 16,400 -Lead (mg/kg) 11.9 161 52.3 70.4 53.2 40.3Magnesium (mg/kg) - 3050 3370 6710 9860 -Manganese (mg/kg) - 585 950 1440 1370 -Mercury (mg/kg) 0.03 <0.08 <0.08 <0.08 - 0.02Nickel (mg/kg) 20.7 841 251 156 92.2 127Potassium (mg/kg) - 1310 931 1610 1070 -Selenium (mg/kg) 0.21 <10 <10 <10 - 0.22Silver (mg/kg) 24.5 <5 <5 <5 - 6.3Sodium (mg/kg) - 1120 544 1940 1550 -Thallium (mg/kg) <5 118 <80 <80 - <5Vanadium (mg/kg) 745 22,000 3460 1260 1460 931Zinc (mg/kg) 65 351 188 342 398 153T. Organic Carbon (mg/kg) - 12,000 6490 8950 - -Grain size % Gravel - 15.0 1.1 19.5 - - % Sand - 25.3 9.3 36.2 - - % Silt - 41.8 64.7 36.0 - - % Clay - 17.9 24.9 8.3 - -RadiologicalsRadium 226 (pCi/g) - - - 1.2+0.31 - -Radium 228 (pCi/g) - - - 1.6+0.41 - -Gross Alpha (pCi/g) 194+84.1 - - 24+8.1 - 34.5+66.5Gross Beta (pCi/g) 30.2+5.0 - - 25+7.7 - 21.3+4.6Thorium-228 (pCi/g) - - - 1.5+0.25 - -Thorium-230 (pCi/g) - - - 1.7+0.28 - -Thorium-232 (pCi/g) - - - ND - -Uranium 234 (pCi/g) - - - ND - -Uranium 235 (pCi/g) - - - ND - -Uranium 238 (pCi/g) - - - ND - -___________________________________________________________________________________________________
44
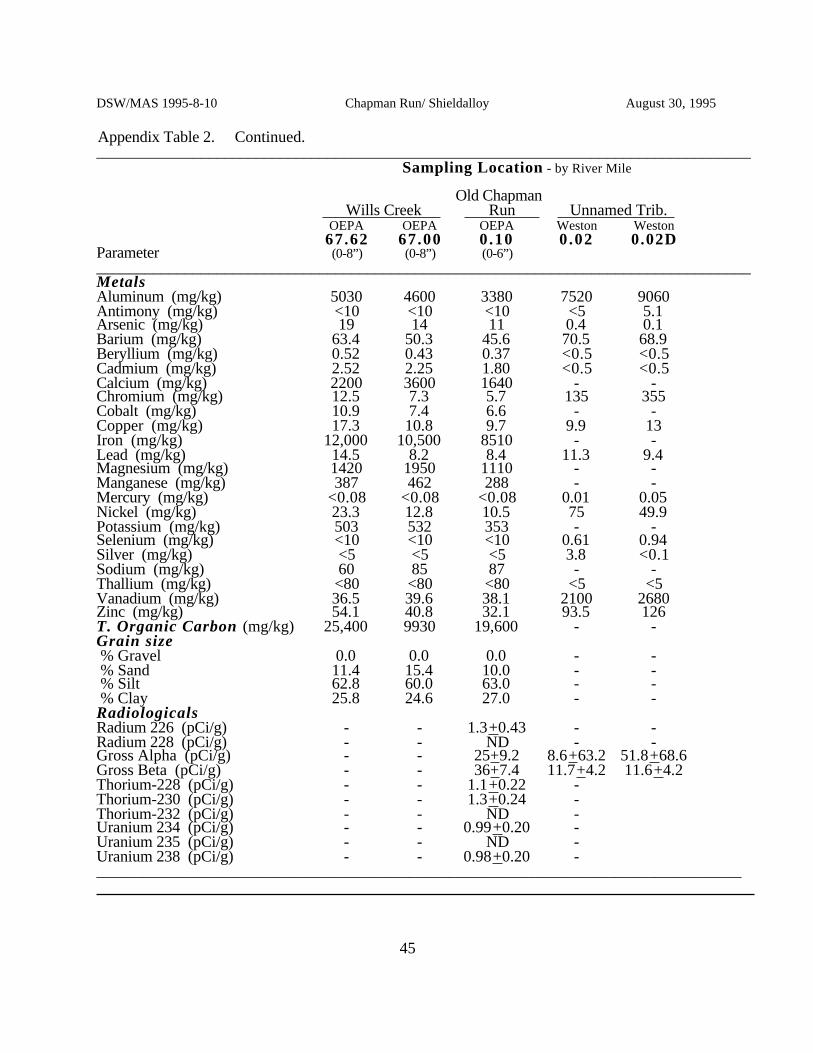
DSW/MAS 1995-8-10 Chapman Run/ Shieldalloy August 30, 1995
Appendix Table 2. Continued.__________________________________________________________________________________
Sampling Location - by River Mile
Old Chapman Wills Creek Run Unnamed Trib. OEPA OEPA OEPA Weston Weston67.62 67.00 0.10 0.02 0.02D
Parameter (0-8”) (0-8”) (0-6”)__________________________________________________________________________________Metals Aluminum (mg/kg) 5030 4600 3380 7520 9060Antimony (mg/kg) <10 <10 <10 <5 5.1Arsenic (mg/kg) 19 14 11 0.4 0.1Barium (mg/kg) 63.4 50.3 45.6 70.5 68.9Beryllium (mg/kg) 0.52 0.43 0.37 <0.5 <0.5Cadmium (mg/kg) 2.52 2.25 1.80 <0.5 <0.5Calcium (mg/kg) 2200 3600 1640 - -Chromium (mg/kg) 12.5 7.3 5.7 135 355Cobalt (mg/kg) 10.9 7.4 6.6 - -Copper (mg/kg) 17.3 10.8 9.7 9.9 13Iron (mg/kg) 12,000 10,500 8510 - -Lead (mg/kg) 14.5 8.2 8.4 11.3 9.4Magnesium (mg/kg) 1420 1950 1110 - -Manganese (mg/kg) 387 462 288 - -Mercury (mg/kg) <0.08 <0.08 <0.08 0.01 0.05Nickel (mg/kg) 23.3 12.8 10.5 75 49.9Potassium (mg/kg) 503 532 353 - -Selenium (mg/kg) <10 <10 <10 0.61 0.94Silver (mg/kg) <5 <5 <5 3.8 <0.1Sodium (mg/kg) 60 85 87 - -Thallium (mg/kg) <80 <80 <80 <5 <5Vanadium (mg/kg) 36.5 39.6 38.1 2100 2680Zinc (mg/kg) 54.1 40.8 32.1 93.5 126T. Organic Carbon (mg/kg) 25,400 9930 19,600 - -Grain size % Gravel 0.0 0.0 0.0 - - % Sand 11.4 15.4 10.0 - - % Silt 62.8 60.0 63.0 - - % Clay 25.8 24.6 27.0 - -RadiologicalsRadium 226 (pCi/g) - - 1.3+0.43 - -Radium 228 (pCi/g) - - ND - -Gross Alpha (pCi/g) - - 25+9.2 8.6+63.2 51.8+68.6Gross Beta (pCi/g) - - 36+7.4 11.7+4.2 11.6+4.2Thorium-228 (pCi/g) - - 1.1+0.22 -Thorium-230 (pCi/g) - - 1.3+0.24 -Thorium-232 (pCi/g) - - ND -Uranium 234 (pCi/g) - - 0.99+0.20 -Uranium 235 (pCi/g) - - ND -Uranium 238 (pCi/g) - - 0.98+0.20 -_________________________________________________________________________________________________
45
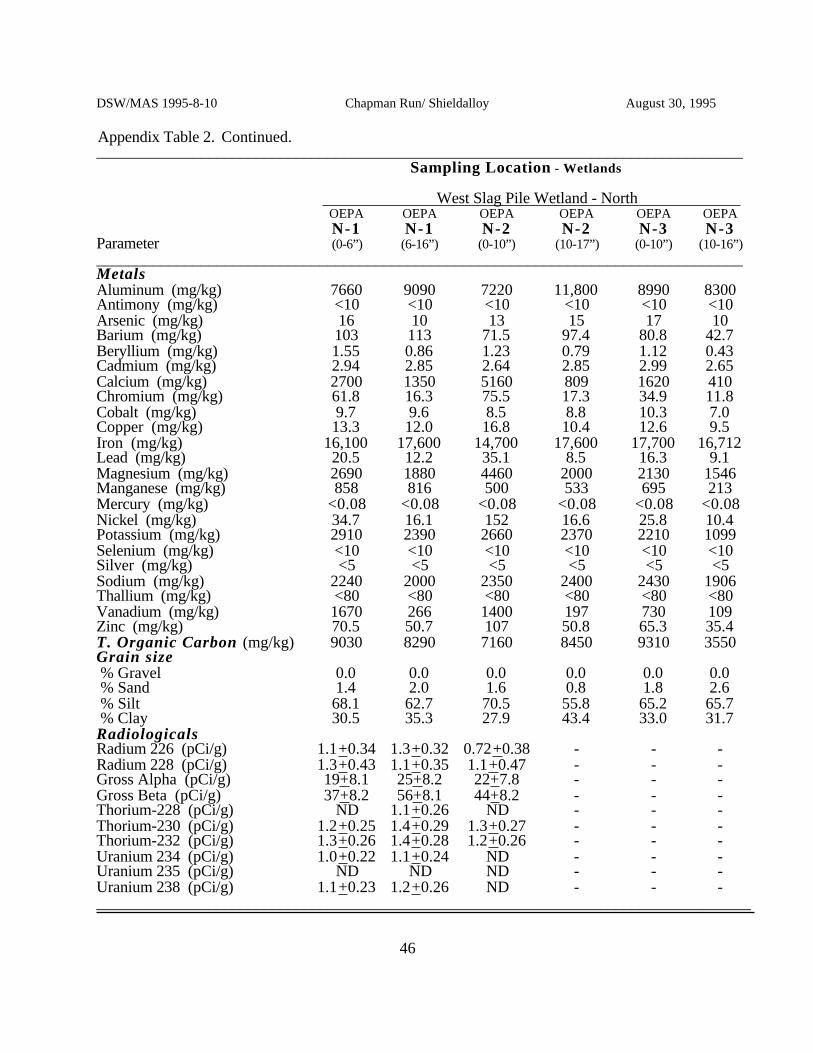
DSW/MAS 1995-8-10 Chapman Run/ Shieldalloy August 30, 1995
Appendix Table 2. Continued._________________________________________________________________________________
Sampling Location - Wetlands
West Slag Pile Wetland - North OEPA OEPA OEPA OEPA OEPA OEPAN-1 N-1 N-2 N-2 N-3 N-3
Parameter (0-6”) (6-16”) (0-10”) (10-17”) (0-10”) (10-16”)_________________________________________________________________________________Metals Aluminum (mg/kg) 7660 9090 7220 11,800 8990 8300Antimony (mg/kg) <10 <10 <10 <10 <10 <10Arsenic (mg/kg) 16 10 13 15 17 10Barium (mg/kg) 103 113 71.5 97.4 80.8 42.7Beryllium (mg/kg) 1.55 0.86 1.23 0.79 1.12 0.43Cadmium (mg/kg) 2.94 2.85 2.64 2.85 2.99 2.65Calcium (mg/kg) 2700 1350 5160 809 1620 410Chromium (mg/kg) 61.8 16.3 75.5 17.3 34.9 11.8Cobalt (mg/kg) 9.7 9.6 8.5 8.8 10.3 7.0Copper (mg/kg) 13.3 12.0 16.8 10.4 12.6 9.5Iron (mg/kg) 16,100 17,600 14,700 17,600 17,700 16,712Lead (mg/kg) 20.5 12.2 35.1 8.5 16.3 9.1Magnesium (mg/kg) 2690 1880 4460 2000 2130 1546Manganese (mg/kg) 858 816 500 533 695 213Mercury (mg/kg) <0.08 <0.08 <0.08 <0.08 <0.08 <0.08Nickel (mg/kg) 34.7 16.1 152 16.6 25.8 10.4Potassium (mg/kg) 2910 2390 2660 2370 2210 1099Selenium (mg/kg) <10 <10 <10 <10 <10 <10Silver (mg/kg) <5 <5 <5 <5 <5 <5Sodium (mg/kg) 2240 2000 2350 2400 2430 1906Thallium (mg/kg) <80 <80 <80 <80 <80 <80Vanadium (mg/kg) 1670 266 1400 197 730 109Zinc (mg/kg) 70.5 50.7 107 50.8 65.3 35.4T. Organic Carbon (mg/kg) 9030 8290 7160 8450 9310 3550Grain size % Gravel 0.0 0.0 0.0 0.0 0.0 0.0 % Sand 1.4 2.0 1.6 0.8 1.8 2.6 % Silt 68.1 62.7 70.5 55.8 65.2 65.7 % Clay 30.5 35.3 27.9 43.4 33.0 31.7RadiologicalsRadium 226 (pCi/g) 1.1+0.34 1.3+0.32 0.72+0.38 - - -Radium 228 (pCi/g) 1.3+0.43 1.1+0.35 1.1+0.47 - - -Gross Alpha (pCi/g) 19+8.1 25+8.2 22+7.8 - - -Gross Beta (pCi/g) 37+8.2 56+8.1 44+8.2 - - -Thorium-228 (pCi/g) ND 1.1+0.26 ND - - -Thorium-230 (pCi/g) 1.2+0.25 1.4+0.29 1.3+0.27 - - -Thorium-232 (pCi/g) 1.3+0.26 1.4+0.28 1.2+0.26 - - -Uranium 234 (pCi/g) 1.0+0.22 1.1+0.24 ND - - -Uranium 235 (pCi/g) ND ND ND - - -Uranium 238 (pCi/g) 1.1+0.23 1.2+0.26 ND - - -__________________________________________________________________________________
46

DSW/MAS 1995-8-10 Chapman Run/ Shieldalloy August 30, 1995
Appendix Table 2. Continued.__________________________________________________________________________________
Sampling Location - Wetlands
West Slag Pile Wetland West Southwest OEPA OEPA OEPA OEPA OEPA OEPAW-1 W-2 W-3 W-3 SW-1 SW-1
Parameter (0-10”) (0-7”) (0-7”) (7-18”) (0-9”) (9-18”)__________________________________________________________________________________Metals Aluminum (mg/kg) 8220 8770 8680 8690 10,100 12,500Antimony (mg/kg) <10 <10 <10 <10 <10 <10Arsenic (mg/kg) 37 31 87 89 98 106Barium (mg/kg) 110 102 59.6 40.5 35.0 19.4Beryllium (mg/kg) 2.02 1.69 7.48 8.89 9.92 10.5Cadmium (mg/kg) 3.70 4.58 3.29 5.81 2.50 5.52Calcium (mg/kg) 3470 2170 44,300 9830 17,700 3160Chromium (mg/kg) 224 128 215 111 168 63.1Cobalt (mg/kg) 9.7 10.3 9.6 7.9 10.1 7.8Copper (mg/kg) 16.4 13.8 14.7 15.9 12.8 12.4Iron (mg/kg) 17,700 16,600 14,900 34,100 11,200 33,600Lead (mg/kg) 18.1 14.1 19.8 21.1 19.2 15.6Magnesium (mg/kg) 3190 2450 8550 2750 6900 563Manganese (mg/kg) 938 1010 1450 849 1520 272Mercury (mg/kg) <0.08 <0.08 <0.08 0.10 0.21 0.09Nickel (mg/kg) 19.6 21.1 61.8 23.8 63.0 11.2Potassium (mg/kg) 2460 2050 440 525 331 367Selenium (mg/kg) <10 <10 <10 <10 <10 <10Silver (mg/kg) <5 <5 <5 <5 <5 <5Sodium (mg/kg) 1640 1120 309 271 489 621Thallium (mg/kg) <80 <80 <80 <80 <80 <80Vanadium (mg/kg) 1140 854 6130 7250 8060 8100Zinc (mg/kg) 83.1 67.8 96.7 74.3 98.4 61.9T. Organic Carbon (mg/kg) 10,200 8240 22,100 20,400 14,700 14,600Grain size % Gravel 0.0 0.0 0.0 0.0 0.0 0.0 % Sand 3.0 3.0 15.0 13.6 56.2 52.0 % Silt 61.4 60.8 67.6 71.5 31.7 33.6 % Clay 35.6 36.2 17.4 14.9 12.1 14.4RadiologicalsRadium 226 (pCi/g) 1.6+0.34 0.99+0.30 - - ND NDRadium 228 (pCi/g) 1.7+0.40 1.5+0.66 - - ND NDGross Alpha (pCi/g) 19+8.5 19+9.3 - - 24+9.5 39+10Gross Beta (pCi/g) 62+8.3 45+8.4 - - 35+7.4 54+10Thorium-228 (pCi/g) 1.1+0.22 1.1+0.22 - - ND 1.4+0.26Thorium-230 (pCi/g) 1.3+0.23 1.2+0.23 - - 1.9+0.3 12+0.76Thorium-232 (pCi/g) 1.1+0.22 1.2+0.23 - - ND 1.3+0.26Uranium 234 (pCi/g) 0.94+0.20 1.0+0.21 - - 2.8+0.33 4.9+0.46Uranium 235 (pCi/g) ND ND - - ND NDUranium 238 (pCi/g) 1.2+0.22 1.1+0.21 - - 2.6+0.32 5.0+0.47__________________________________________________________________________________
47
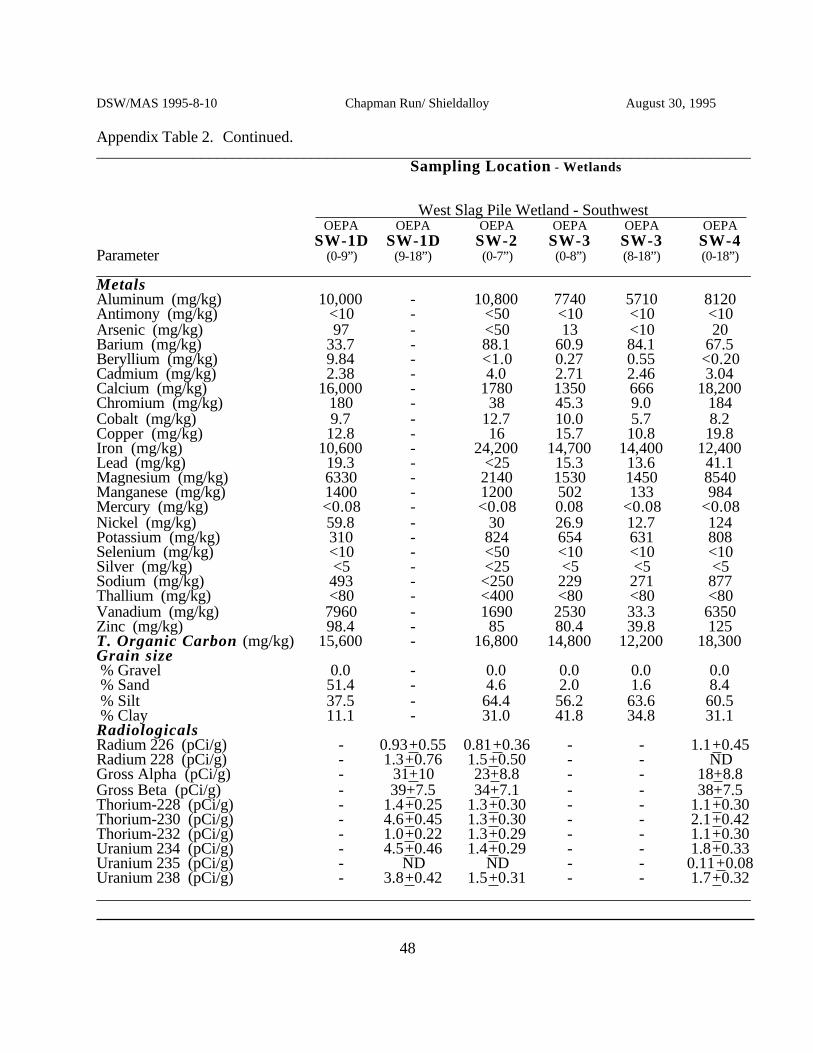
DSW/MAS 1995-8-10 Chapman Run/ Shieldalloy August 30, 1995
Appendix Table 2. Continued.__________________________________________________________________________________
Sampling Location - Wetlands
West Slag Pile Wetland - Southwest OEPA OEPA OEPA OEPA OEPA OEPA
SW-1D SW-1D SW-2 SW-3 SW-3 SW-4Parameter (0-9”) (9-18”) (0-7”) (0-8”) (8-18”) (0-18”)__________________________________________________________________________________Metals Aluminum (mg/kg) 10,000 - 10,800 7740 5710 8120Antimony (mg/kg) <10 - <50 <10 <10 <10Arsenic (mg/kg) 97 - <50 13 <10 20Barium (mg/kg) 33.7 - 88.1 60.9 84.1 67.5Beryllium (mg/kg) 9.84 - <1.0 0.27 0.55 <0.20Cadmium (mg/kg) 2.38 - 4.0 2.71 2.46 3.04Calcium (mg/kg) 16,000 - 1780 1350 666 18,200Chromium (mg/kg) 180 - 38 45.3 9.0 184Cobalt (mg/kg) 9.7 - 12.7 10.0 5.7 8.2Copper (mg/kg) 12.8 - 16 15.7 10.8 19.8Iron (mg/kg) 10,600 - 24,200 14,700 14,400 12,400Lead (mg/kg) 19.3 - <25 15.3 13.6 41.1Magnesium (mg/kg) 6330 - 2140 1530 1450 8540Manganese (mg/kg) 1400 - 1200 502 133 984Mercury (mg/kg) <0.08 - <0.08 0.08 <0.08 <0.08Nickel (mg/kg) 59.8 - 30 26.9 12.7 124Potassium (mg/kg) 310 - 824 654 631 808Selenium (mg/kg) <10 - <50 <10 <10 <10Silver (mg/kg) <5 - <25 <5 <5 <5Sodium (mg/kg) 493 - <250 229 271 877Thallium (mg/kg) <80 - <400 <80 <80 <80Vanadium (mg/kg) 7960 - 1690 2530 33.3 6350Zinc (mg/kg) 98.4 - 85 80.4 39.8 125T. Organic Carbon (mg/kg) 15,600 - 16,800 14,800 12,200 18,300Grain size % Gravel 0.0 - 0.0 0.0 0.0 0.0 % Sand 51.4 - 4.6 2.0 1.6 8.4 % Silt 37.5 - 64.4 56.2 63.6 60.5 % Clay 11.1 - 31.0 41.8 34.8 31.1RadiologicalsRadium 226 (pCi/g) - 0.93+0.55 0.81+0.36 - - 1.1+0.45Radium 228 (pCi/g) - 1.3+0.76 1.5+0.50 - - NDGross Alpha (pCi/g) - 31+10 23+8.8 - - 18+8.8Gross Beta (pCi/g) - 39+7.5 34+7.1 - - 38+7.5Thorium-228 (pCi/g) - 1.4+0.25 1.3+0.30 - - 1.1+0.30Thorium-230 (pCi/g) - 4.6+0.45 1.3+0.30 - - 2.1+0.42Thorium-232 (pCi/g) - 1.0+0.22 1.3+0.29 - - 1.1+0.30Uranium 234 (pCi/g) - 4.5+0.46 1.4+0.29 - - 1.8+0.33Uranium 235 (pCi/g) - ND ND - - 0.11+0.08Uranium 238 (pCi/g) - 3.8+0.42 1.5+0.31 - - 1.7+0.32__________________________________________________________________________________
48

DSW/MAS 1995-8-10 Chapman Run/ Shieldalloy August 30, 1995
Appendix Table 2. Continued.__________________________________________________________________________________
Sampling Location - Wetlands
West Slag Pile Wetland East Slag Pile Wetland South Northwest
OEPA OEPA OEPA OEPA OEPA OEPAS-1 S-1 S-2 S-2 NW-1 NW-1
Parameter (0-10”) (10-17”) (0-7”) (7-12”) (0-8”) (8-14”)__________________________________________________________________________________Metals Aluminum (mg/kg) 8840 10,400 7320 8000 5290 6980Antimony (mg/kg) <10 <10 <10 <10 <10 <10Arsenic (mg/kg) 14 15 11 10 <10 <10Barium (mg/kg) 132 104 99.7 129 55.3 123Beryllium (mg/kg) <0.20 0.60 <0.20 0.73 0.27 0.59Cadmium (mg/kg) 2.10 3.22 2.23 2.69 2.88 2.26Calcium (mg/kg) 13,100 1540 62,100 2060 1430 817Chromium (mg/kg) 99.4 14.1 36.8 11.7 42.4 11.4Cobalt (mg/kg) 9.1 12.2 5.2 7.5 6.4 5.9Copper (mg/kg) 17.5 10.9 18.4 9.7 17.3 12.0Iron (mg/kg) 10,100 18,200 10,400 15,200 16,900 13,100Lead (mg/kg) 45.1 14.3 17.7 10.2 12.3 10.0Magnesium (mg/kg) 7190 2130 4030 2160 914 1520Manganese (mg/kg) 1200 732 843 313 232 148Mercury (mg/kg) <0.08 <0.08 <0.08 <0.08 <0.08 <0.08Nickel (mg/kg) 466 16.9 79.6 17.7 12.1 13.2Potassium (mg/kg) 713 957 613 471 281 429Selenium (mg/kg) <10 <10 <10 <10 <10 <10Silver (mg/kg) <5 <5 <5 <5 <5 <5Sodium (mg/kg) 1190 644 643 465 66 70Thallium (mg/kg) <80 <80 <80 <80 <80 <80Vanadium (mg/kg) 6130 1220 2220 196 503 37Zinc (mg/kg) 79.8 56.4 88.0 51.6 46.0 49.7T. Organic Carbon (mg/kg) 13,000 12,300 28,200 15,700 20,900 10,400Grain size % Gravel 0.0 0.0 0.0 0.0 0.4 0.0 % Sand 7.2 4.2 4.0 2.4 16.3 1.4 % Silt 62.7 59.0 59.0 55.3 58.7 61.7 % Clay 30.1 36.8 37.0 42.3 24.6 36.9RadiologicalsRadium 226 (pCi/g) 1.2+0.38 1.4+0.31 1.5+0.39 - 1.0+0.49 1.5+0.32Radium 228 (pCi/g) 1.7+0.46 1.8+0.43 ND - 1.6+0.61 1.3+0.36Gross Alpha (pCi/g) 40+11 24+9.4 25+9.5 - 32+10 27+9.8Gross Beta (pCi/g) 38+7.3 35+7.4 40+7.6 - 40+7.6 43+7.5Thorium-228 (pCi/g) 1.3+0.30 1.0+0.27 0.81+0.26 - 1.7+0.41 1.0+0.28Thorium-230 (pCi/g) 1.3+0.30 3.2+0.47 2.5+0.45 - 2.0+0.46 1.3+0.32Thorium-232 (pCi/g) 1.1+0.29 1.3+0.30 1.0+0.29 - 1.2+0.35 1.0+0.29Uranium 234 (pCi/g) 1.1+0.26 1.2+0.26 1.2+0.23 - 2.4+0.37 1.4+0.27Uranium 235 (pCi/g) ND ND ND - 0.13+0.09 0.74+0.20Uranium 238 (pCi/g) 1.1+0.26 1.5+0.29 1.0+0.21 - 2.4+0.35 1.9+0.31__________________________________________________________________________________
49

DSW/MAS 1995-8-10 Chapman Run/ Shieldalloy August 30, 1995
Appendix Table 2. Continued.__________________________________________________________________________________
Sampling Location - Wetlands
East Slag Pile WetlandNorthwest Background Wetland
OEPA OEPA OEPA OEPA OEPA OEPANW-2 B-1 B-2 B-2 B-2D B-2D
Parameter (0-8”) (0-8”) (0-8”) (8-15”) (0-8”) (8-15”)__________________________________________________________________________________Metals Aluminum (mg/kg) 7840 6170 5980 3660 - 3910Antimony (mg/kg) <10 <10 <10 <10 - <10Arsenic (mg/kg) 12 <10 15 <10 - <10Barium (mg/kg) 134 93.5 74.7 97.1 - 86.2Beryllium (mg/kg) 0.54 0.54 0.46 0.50 - 0.44Cadmium (mg/kg) 3.19 2.18 3.72 1.93 - 1.56Calcium (mg/kg) 1070 1170 897 699 - 700Chromium (mg/kg) 16.7 8.8 10.3 4.8 - 5.6Cobalt (mg/kg) 5.7 5.6 5.9 4.6 - 4.8Copper (mg/kg) 10.2 9.4 15.6 8.7 - 7.4Iron (mg/kg) 18,200 12,700 21,100 10,300 - 8840Lead (mg/kg) 10.6 11.6 15.0 8.7 - 6.6Magnesium (mg/kg) 1480 1410 1130 807 - 927Manganese (mg/kg) 230 257 195 204 - 199Mercury (mg/kg) <0.08 <0.08 <0.08 <0.08 - <0.08Nickel (mg/kg) 13.8 12.2 11.8 7.5 - 8.4Potassium (mg/kg) 575 368 281 163 - 193Selenium (mg/kg) <10 <10 <10 <10 - <10Silver (mg/kg) <5 <5 <5 <5 - <5Sodium (mg/kg) 70 54 58 59 - 61Thallium (mg/kg) <80 <80 <80 <80 - <80Vanadium (mg/kg) 155 55.9 146 12.7 - 11.9Zinc (mg/kg) 50.2 44.6 47.7 29.4 - 30.4T. Organic Carbon (mg/kg) 18,600 13,200 19,300 10,300 - 7300Grain size % Gravel 0.0 0.0 0.0 0.0 0.0 - % Sand 4.4 2.6 5.8 2.6 3.4 - % Silt 68.1 66.8 58.7 71.6 59.3 - % Clay 27.5 30.6 35.5 25.8 37.3 -RadiologicalsRadium 226 (pCi/g) 1.5+0.39 - 1.8+0.44 1.5+0.33 - -Radium 228 (pCi/g) 1.1+0.03 - ND 1.5+0.41 - -Gross Alpha (pCi/g) 19+8.3 - 38+11 26+9.4 - -Gross Beta (pCi/g) 32+7.0 - 41+7.6 36+7.2 - -Thorium-228 (pCi/g) 0.92+0.24 - 1.5+0.33 0.88+0.23 - -Thorium-230 (pCi/g) 1.3+0.28 - 1.7+0.35 1.2+0.26 - -Thorium-232 (pCi/g) 1.2+0.27 - 1.6+0.34 1.0+0.24 - -Uranium 234 (pCi/g) 1.5+0.30 - 1.5+0.25 1.1+0.24 - -Uranium 235 (pCi/g) 0.09+0.07 - 0.08+0.06 0.05+0.05 - -Uranium 238 (pCi/g) 1.1+0.25 - 1.6+0.26 1.1+0.23 - -__________________________________________________________________________________
50
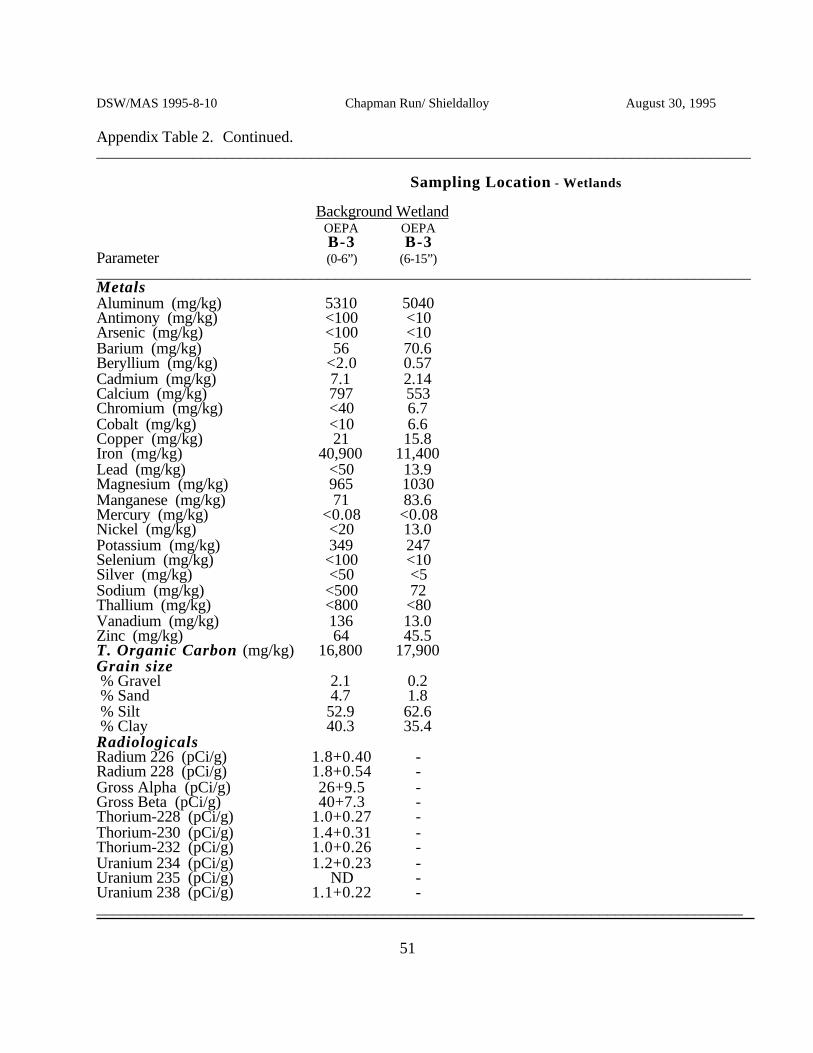
DSW/MAS 1995-8-10 Chapman Run/ Shieldalloy August 30, 1995
Appendix Table 2. Continued.__________________________________________________________________________________
Sampling Location - Wetlands
Background WetlandOEPA OEPAB-3 B-3
Parameter (0-6”) (6-15”)__________________________________________________________________________________Metals Aluminum (mg/kg) 5310 5040Antimony (mg/kg) <100 <10Arsenic (mg/kg) <100 <10Barium (mg/kg) 56 70.6Beryllium (mg/kg) <2.0 0.57Cadmium (mg/kg) 7.1 2.14Calcium (mg/kg) 797 553Chromium (mg/kg) <40 6.7Cobalt (mg/kg) <10 6.6Copper (mg/kg) 21 15.8Iron (mg/kg) 40,900 11,400Lead (mg/kg) <50 13.9Magnesium (mg/kg) 965 1030Manganese (mg/kg) 71 83.6Mercury (mg/kg) <0.08 <0.08Nickel (mg/kg) <20 13.0Potassium (mg/kg) 349 247Selenium (mg/kg) <100 <10Silver (mg/kg) <50 <5Sodium (mg/kg) <500 72Thallium (mg/kg) <800 <80Vanadium (mg/kg) 136 13.0Zinc (mg/kg) 64 45.5T. Organic Carbon (mg/kg) 16,800 17,900Grain size % Gravel 2.1 0.2 % Sand 4.7 1.8 % Silt 52.9 62.6 % Clay 40.3 35.4RadiologicalsRadium 226 (pCi/g) 1.8+0.40 -Radium 228 (pCi/g) 1.8+0.54 -Gross Alpha (pCi/g) 26+9.5 -Gross Beta (pCi/g) 40+7.3 -Thorium-228 (pCi/g) 1.0+0.27 -Thorium-230 (pCi/g) 1.4+0.31 -Thorium-232 (pCi/g) 1.0+0.26 -Uranium 234 (pCi/g) 1.2+0.23 -Uranium 235 (pCi/g) ND -Uranium 238 (pCi/g) 1.1+0.22 -_________________________________________________________________________________
51
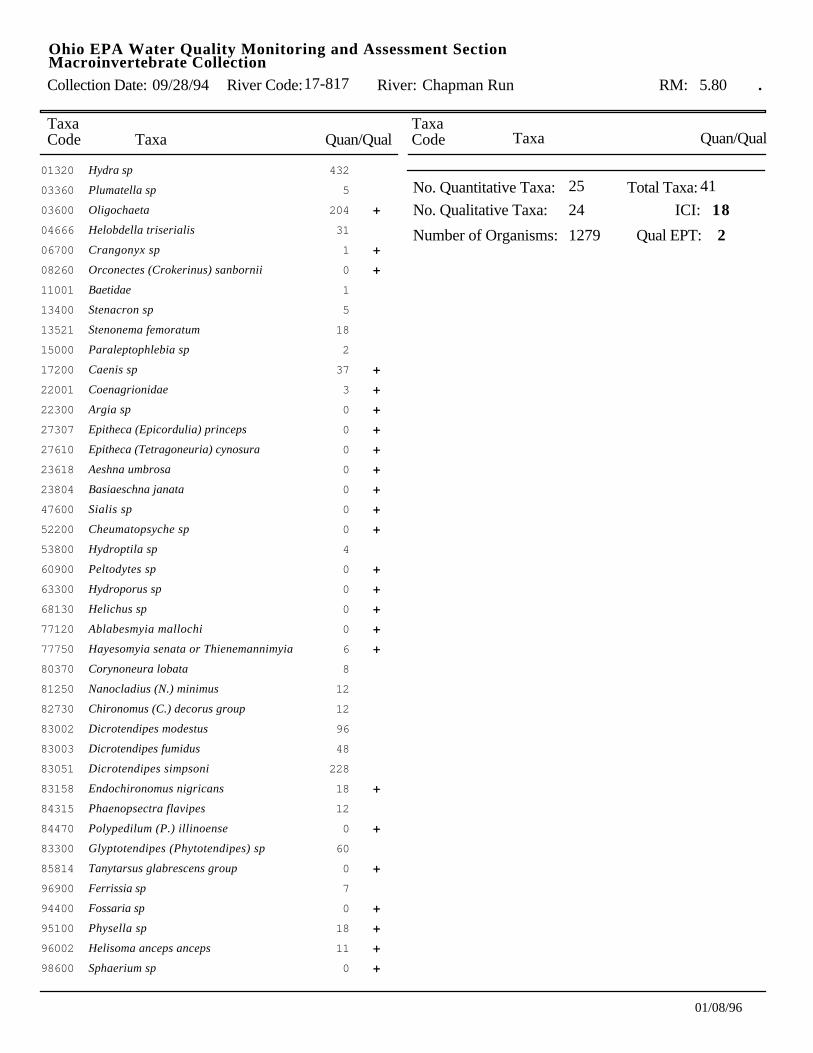
Collection Date: River Code: River:09/28/94 17-817 Chapman Run
TaxaCode Taxa Quan/Qual
RM: 5.80
Taxa Quan/QualTaxaCode
.
Ohio EPA Water Quality Monitoring and Assessment SectionMacroinvertebrate Collection
01320 Hydra sp 432
03360 Plumatella sp 5
03600 Oligochaeta 204 +
04666 Helobdella triserialis 31
06700 Crangonyx sp 1 +
08260 Orconectes (Crokerinus) sanbornii 0 +
11001 Baetidae 1
13400 Stenacron sp 5
13521 Stenonema femoratum 18
15000 Paraleptophlebia sp 2
17200 Caenis sp 37 +
22001 Coenagrionidae 3 +
22300 Argia sp 0 +
27307 Epitheca (Epicordulia) princeps 0 +
27610 Epitheca (Tetragoneuria) cynosura 0 +
23618 Aeshna umbrosa 0 +
23804 Basiaeschna janata 0 +
47600 Sialis sp 0 +
52200 Cheumatopsyche sp 0 +
53800 Hydroptila sp 4
60900 Peltodytes sp 0 +
63300 Hydroporus sp 0 +
68130 Helichus sp 0 +
77120 Ablabesmyia mallochi 0 +
77750 Hayesomyia senata or Thienemannimyia 6 +
80370 Corynoneura lobata 8
81250 Nanocladius (N.) minimus 12
82730 Chironomus (C.) decorus group 12
83002 Dicrotendipes modestus 96
83003 Dicrotendipes fumidus 48
83051 Dicrotendipes simpsoni 228
83158 Endochironomus nigricans 18 +
84315 Phaenopsectra flavipes 12
84470 Polypedilum (P.) illinoense 0 +
83300 Glyptotendipes (Phytotendipes) sp 60
85814 Tanytarsus glabrescens group 0 +
96900 Ferrissia sp 7
94400 Fossaria sp 0 +
95100 Physella sp 18 +
96002 Helisoma anceps anceps 11 +
98600 Sphaerium sp 0 +
No. Quantitative Taxa:
No. Qualitative Taxa:
Total Taxa:
ICI: 18
25
24
41
Number of Organisms: Qual EPT: 21279
01/08/96
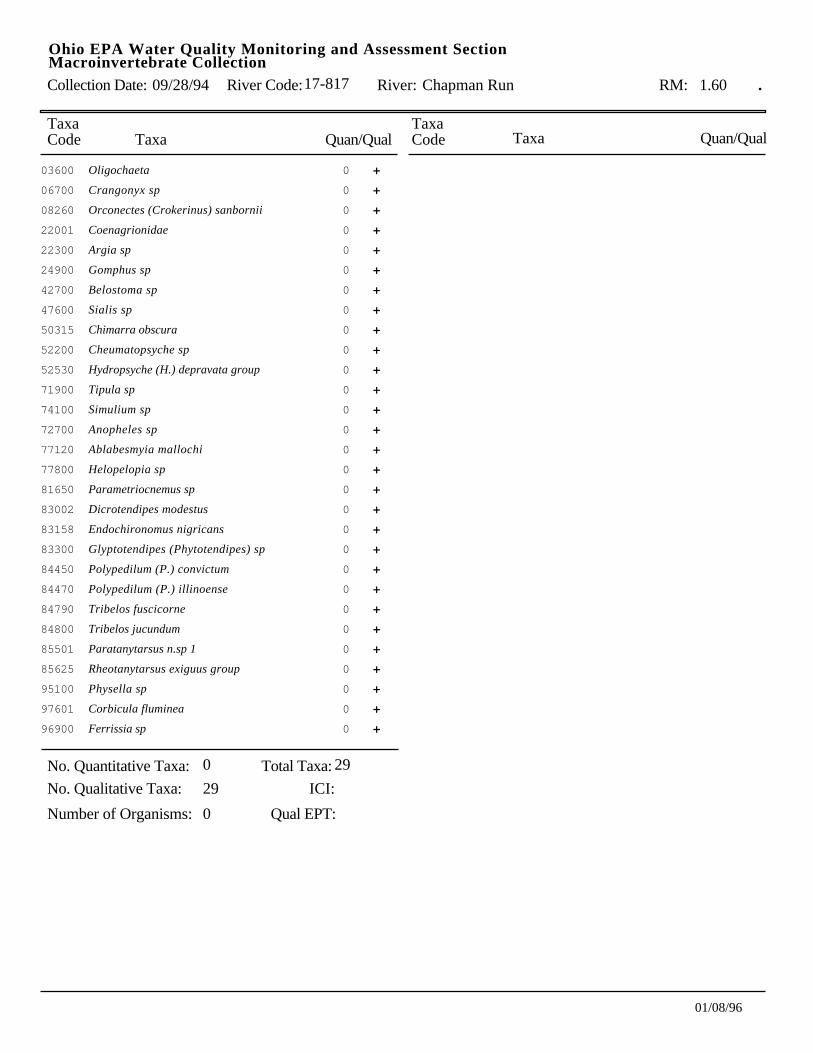
Collection Date: River Code: River:09/28/94 17-817 Chapman Run
TaxaCode Taxa Quan/Qual
RM: 1.60
Taxa Quan/QualTaxaCode
.
Ohio EPA Water Quality Monitoring and Assessment SectionMacroinvertebrate Collection
03600 Oligochaeta 0 +
06700 Crangonyx sp 0 +
08260 Orconectes (Crokerinus) sanbornii 0 +
22001 Coenagrionidae 0 +
22300 Argia sp 0 +
24900 Gomphus sp 0 +
42700 Belostoma sp 0 +
47600 Sialis sp 0 +
50315 Chimarra obscura 0 +
52200 Cheumatopsyche sp 0 +
52530 Hydropsyche (H.) depravata group 0 +
71900 Tipula sp 0 +
74100 Simulium sp 0 +
72700 Anopheles sp 0 +
77120 Ablabesmyia mallochi 0 +
77800 Helopelopia sp 0 +
81650 Parametriocnemus sp 0 +
83002 Dicrotendipes modestus 0 +
83158 Endochironomus nigricans 0 +
83300 Glyptotendipes (Phytotendipes) sp 0 +
84450 Polypedilum (P.) convictum 0 +
84470 Polypedilum (P.) illinoense 0 +
84790 Tribelos fuscicorne 0 +
84800 Tribelos jucundum 0 +
85501 Paratanytarsus n.sp 1 0 +
85625 Rheotanytarsus exiguus group 0 +
95100 Physella sp 0 +
97601 Corbicula fluminea 0 +
96900 Ferrissia sp 0 +
No. Quantitative Taxa:
No. Qualitative Taxa:
Total Taxa:
ICI:
0
29
29
Number of Organisms: Qual EPT:0
01/08/96
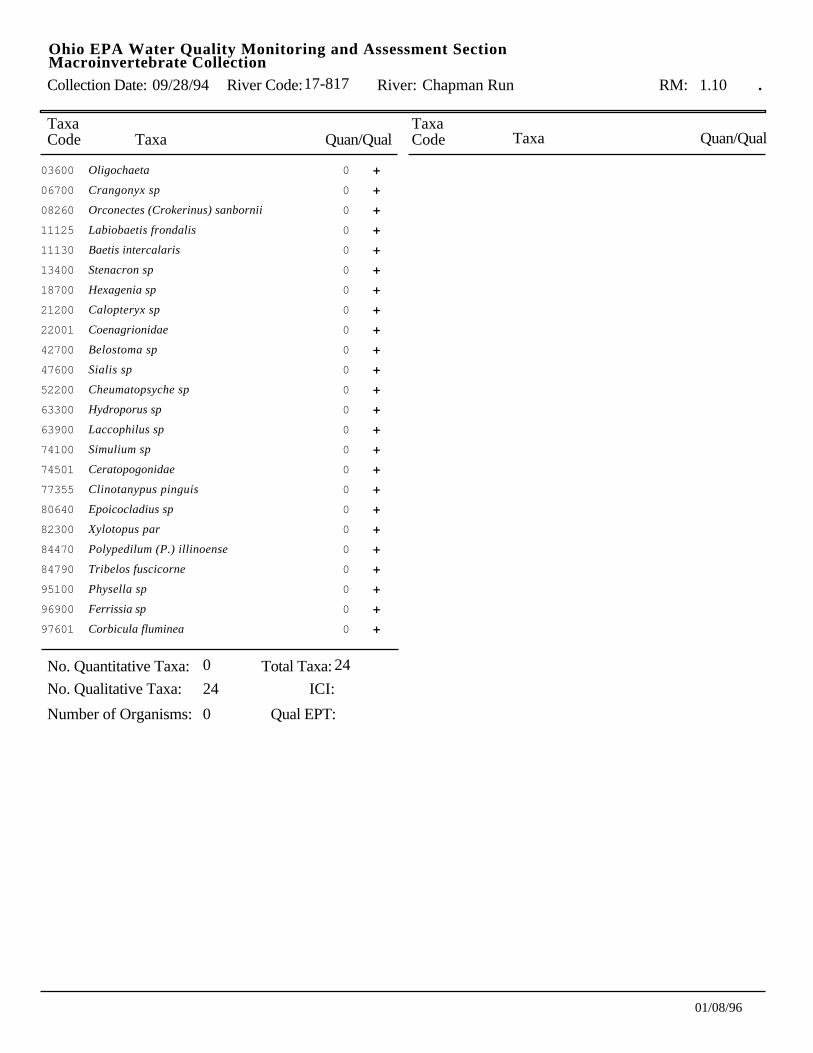
Collection Date: River Code: River:09/28/94 17-817 Chapman Run
TaxaCode Taxa Quan/Qual
RM: 1.10
Taxa Quan/QualTaxaCode
.
Ohio EPA Water Quality Monitoring and Assessment SectionMacroinvertebrate Collection
03600 Oligochaeta 0 +
06700 Crangonyx sp 0 +
08260 Orconectes (Crokerinus) sanbornii 0 +
11125 Labiobaetis frondalis 0 +
11130 Baetis intercalaris 0 +
13400 Stenacron sp 0 +
18700 Hexagenia sp 0 +
21200 Calopteryx sp 0 +
22001 Coenagrionidae 0 +
42700 Belostoma sp 0 +
47600 Sialis sp 0 +
52200 Cheumatopsyche sp 0 +
63300 Hydroporus sp 0 +
63900 Laccophilus sp 0 +
74100 Simulium sp 0 +
74501 Ceratopogonidae 0 +
77355 Clinotanypus pinguis 0 +
80640 Epoicocladius sp 0 +
82300 Xylotopus par 0 +
84470 Polypedilum (P.) illinoense 0 +
84790 Tribelos fuscicorne 0 +
95100 Physella sp 0 +
96900 Ferrissia sp 0 +
97601 Corbicula fluminea 0 +
No. Quantitative Taxa:
No. Qualitative Taxa:
Total Taxa:
ICI:
0
24
24
Number of Organisms: Qual EPT:0
01/08/96
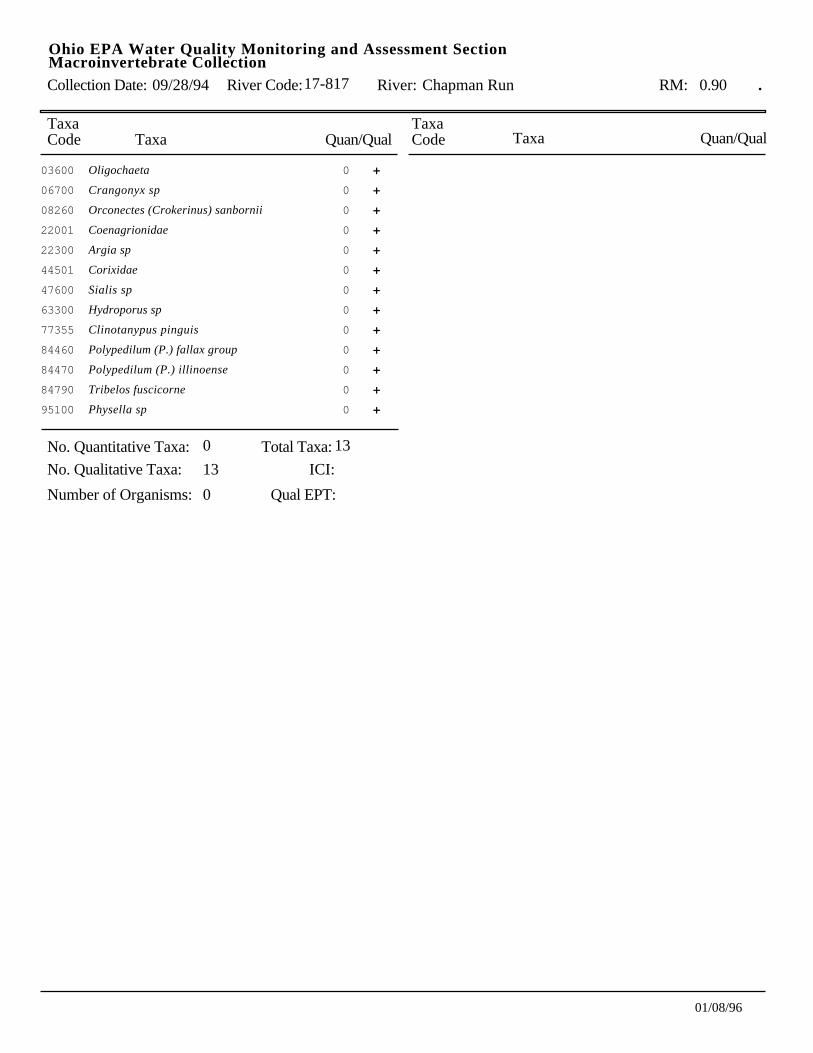
Collection Date: River Code: River:09/28/94 17-817 Chapman Run
TaxaCode Taxa Quan/Qual
RM: 0.90
Taxa Quan/QualTaxaCode
.
Ohio EPA Water Quality Monitoring and Assessment SectionMacroinvertebrate Collection
03600 Oligochaeta 0 +
06700 Crangonyx sp 0 +
08260 Orconectes (Crokerinus) sanbornii 0 +
22001 Coenagrionidae 0 +
22300 Argia sp 0 +
44501 Corixidae 0 +
47600 Sialis sp 0 +
63300 Hydroporus sp 0 +
77355 Clinotanypus pinguis 0 +
84460 Polypedilum (P.) fallax group 0 +
84470 Polypedilum (P.) illinoense 0 +
84790 Tribelos fuscicorne 0 +
95100 Physella sp 0 +
No. Quantitative Taxa:
No. Qualitative Taxa:
Total Taxa:
ICI:
0
13
13
Number of Organisms: Qual EPT:0
01/08/96
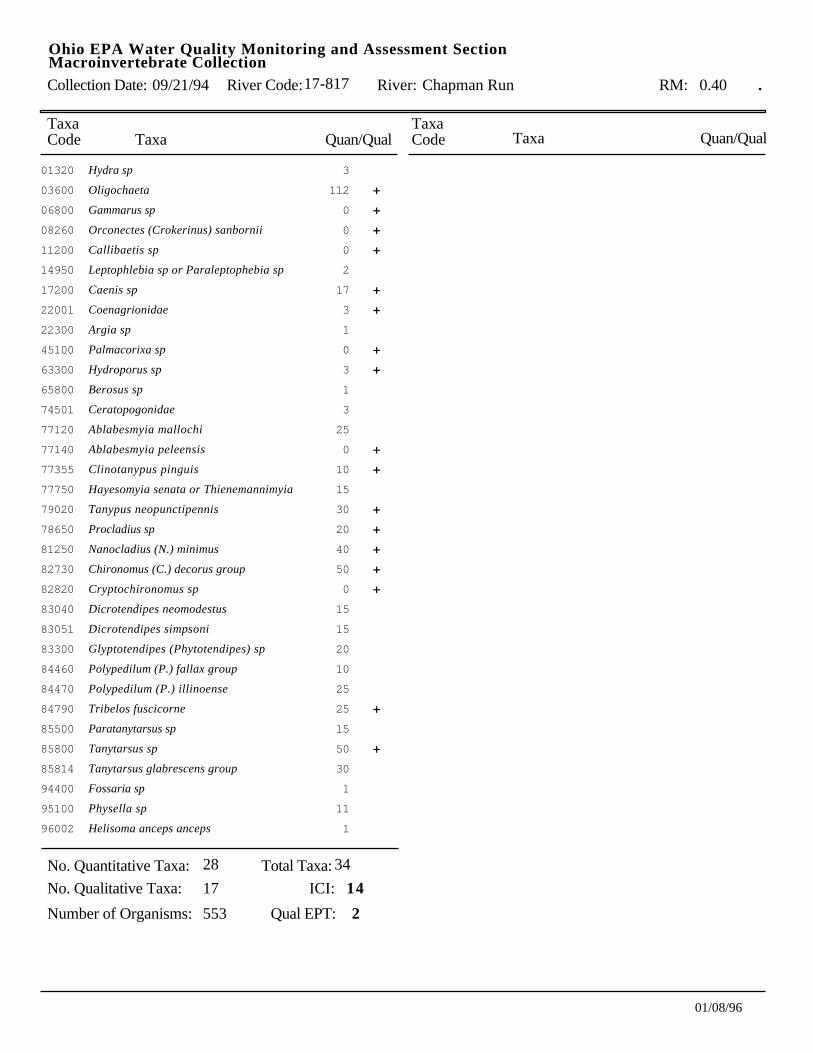
Collection Date: River Code: River:09/21/94 17-817 Chapman Run
TaxaCode Taxa Quan/Qual
RM: 0.40
Taxa Quan/QualTaxaCode
.
Ohio EPA Water Quality Monitoring and Assessment SectionMacroinvertebrate Collection
01320 Hydra sp 3
03600 Oligochaeta 112 +
06800 Gammarus sp 0 +
08260 Orconectes (Crokerinus) sanbornii 0 +
11200 Callibaetis sp 0 +
14950 Leptophlebia sp or Paraleptophebia sp 2
17200 Caenis sp 17 +
22001 Coenagrionidae 3 +
22300 Argia sp 1
45100 Palmacorixa sp 0 +
63300 Hydroporus sp 3 +
65800 Berosus sp 1
74501 Ceratopogonidae 3
77120 Ablabesmyia mallochi 25
77140 Ablabesmyia peleensis 0 +
77355 Clinotanypus pinguis 10 +
77750 Hayesomyia senata or Thienemannimyia 15
79020 Tanypus neopunctipennis 30 +
78650 Procladius sp 20 +
81250 Nanocladius (N.) minimus 40 +
82730 Chironomus (C.) decorus group 50 +
82820 Cryptochironomus sp 0 +
83040 Dicrotendipes neomodestus 15
83051 Dicrotendipes simpsoni 15
83300 Glyptotendipes (Phytotendipes) sp 20
84460 Polypedilum (P.) fallax group 10
84470 Polypedilum (P.) illinoense 25
84790 Tribelos fuscicorne 25 +
85500 Paratanytarsus sp 15
85800 Tanytarsus sp 50 +
85814 Tanytarsus glabrescens group 30
94400 Fossaria sp 1
95100 Physella sp 11
96002 Helisoma anceps anceps 1
No. Quantitative Taxa:
No. Qualitative Taxa:
Total Taxa:
ICI: 14
28
17
34
Number of Organisms: Qual EPT: 2553
01/08/96
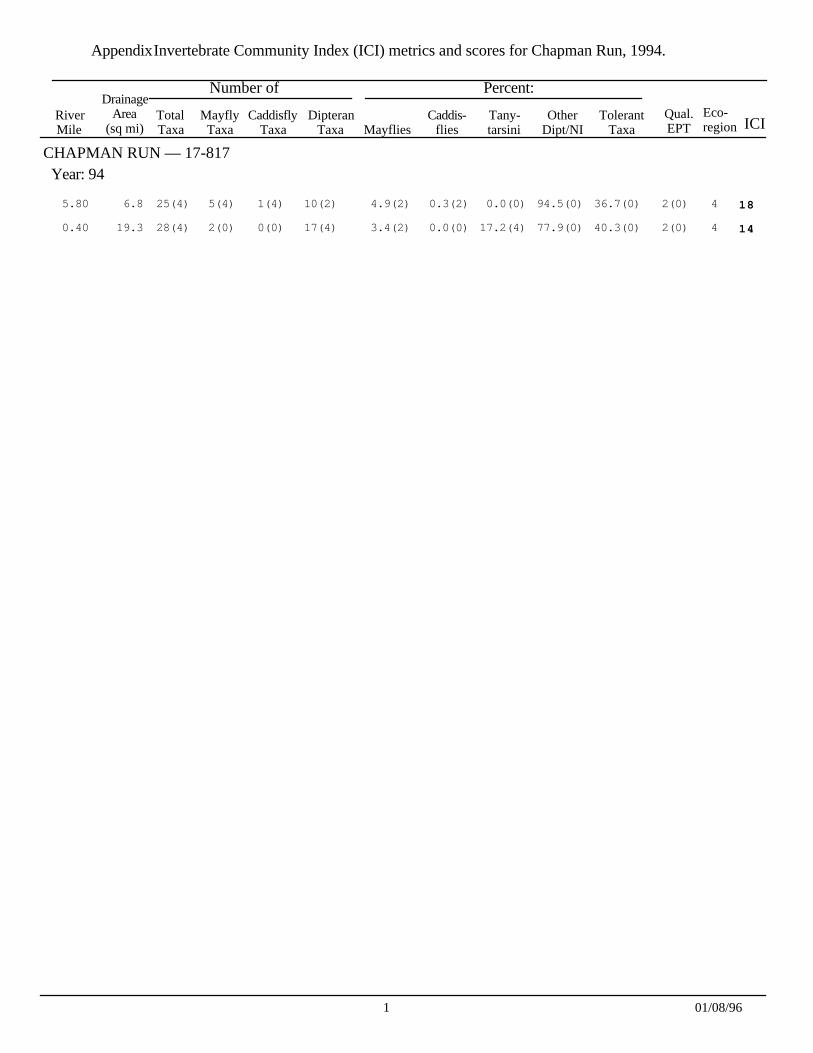
RiverMile
DrainageArea
(sq mi)TotalTaxa
MayflyTaxa
CaddisflyTaxa
DipteranTaxa Mayflies
Caddis-flies
Tany-tarsini
OtherDipt/NI
TolerantTaxa
Qual.EPT
Eco-region ICI
Number of Percent:
Invertebrate Community Index (ICI) metrics and scores for Chapman Run, 1994.Appendix
CHAPMAN RUN — 17-817Year: 94
18 5.80 6.8 25(4) 5(4) 1(4) 10(2) 4.9(2) 0.3(2) 0.0(0) 94.5(0) 36.7(0) 2(0) 4
14 0.40 19.3 28(4) 2(0) 0(0) 17(4) 3.4(2) 0.0(0) 17.2(4) 77.9(0) 40.3(0) 2(0) 4
1 01/08/96
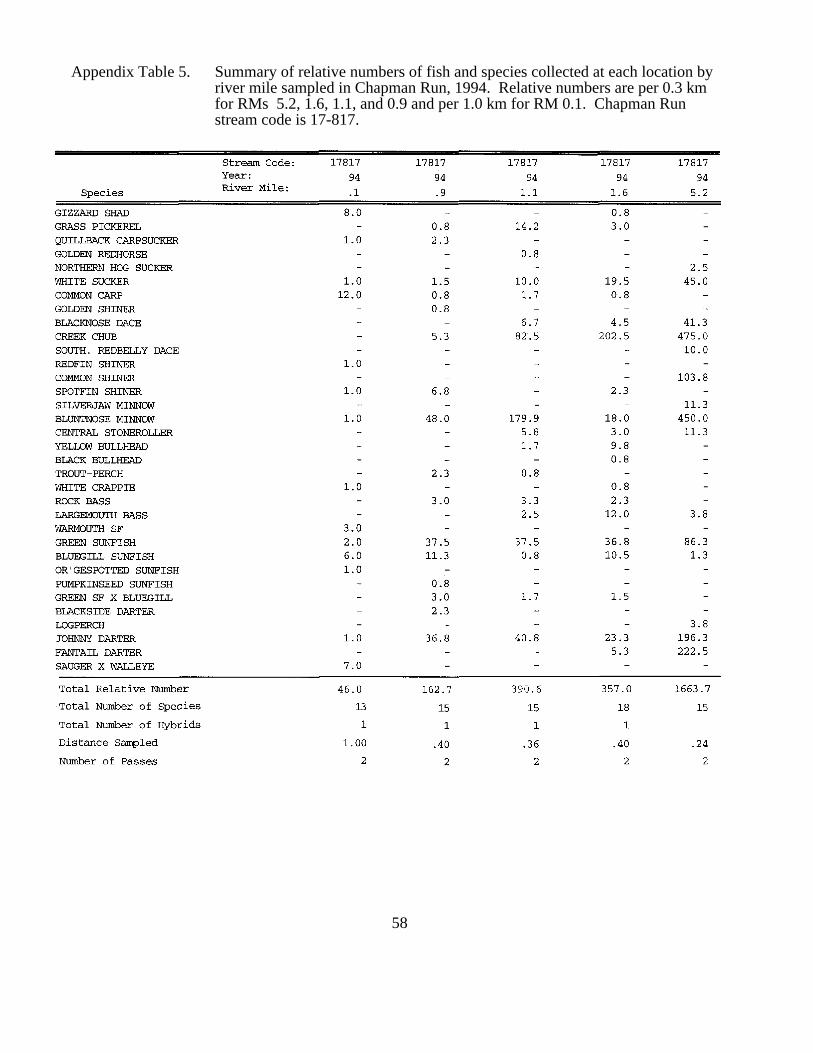
Appendix Table 5. Summary of relative numbers of fish and species collected at each location by river mile sampled in Chapman Run, 1994. Relative numbers are per 0.3 km for RMs 5.2, 1.6, 1.1, and 0.9 and per 1.0 km for RM 0.1. Chapman Run stream code is 17-817.
58

RiverMile Date
Drainagearea (sq mi)
Totalspecies
Sunfishspecies
Suckerspecies
Intolerantspecies
Darterspecies
SimpleLithophils
Tolerantfishes
Omni-vores
Topcarnivores
Insect-ivores
DELTanomalies
Rel.No.minus
tolerants/(0.3km) IBI
ModifiedType
Number of Percent of Individuals
Appendix Table 6. Index of Biotic Integrity (IBI) metrics and scores by river mile for locations sampled in Chapman Run, 1994
Chapman Run - (17817)
Year: 94
5.20 08/11/94 13(5) 6 1(0) 1(0) 0(1) 3(0) 13(3) 63(1) 25(3) 0.3(0) 41(5) 0.0(5)E 40730(5)
5.20 09/28/94 15(5) 6 2(0) 2(0) 0(1) 3(0) 11(5) 70(1) 36(1) 0.2(0) 33(3) 0.0(5)E 36403(3)
1.60 08/11/94 14(3) 13 4(0) 1(0) 0(1) 2(0) 6(1) 84(1) 11(5) 4.8(0) 21(1) 0.0(5)E 2690(1)
1.60 09/28/94 16(5) 13 3(0) 1(0) 0(1) 2(0) 10(1) 74(1) 12(5) 4.8(0) 40(3) 0.0(5)E 3041(1) *
1.10 08/11/94 13(3) 15 3(0) 1(0) 0(1) 1(0) 3(1) 82(1) 53(1) 5.7(0) 16(1) 0.0(5)E 2098(1)
1.10 09/28/94 9(3) 15 2(0) 2(0) 0(1) 1(0) 7(1) 81(1) 39(1) 3.6(0) 33(3) 0.7(3)E 1843(1)
0.90 08/12/94 14(3) 16 4(0) 2(0) 0(1) 2(0) 2(1) 53(3) 37(1) 2.8(0) 55(5) 0.0(5)E 26126(1)
0.90 09/28/94 4(1) 16 2(0) 1(0) 0(1) 0(0) 3(1) 78(1) 11(1) 0.0(0) 86(1) 0.0(5)E 1612(1) *
na - Qualitative data, Modified Iwb not applicable. 1 01/08/96▲ - IBI is low-end adjusted.
- One or more species excluded from IBI calculation.●
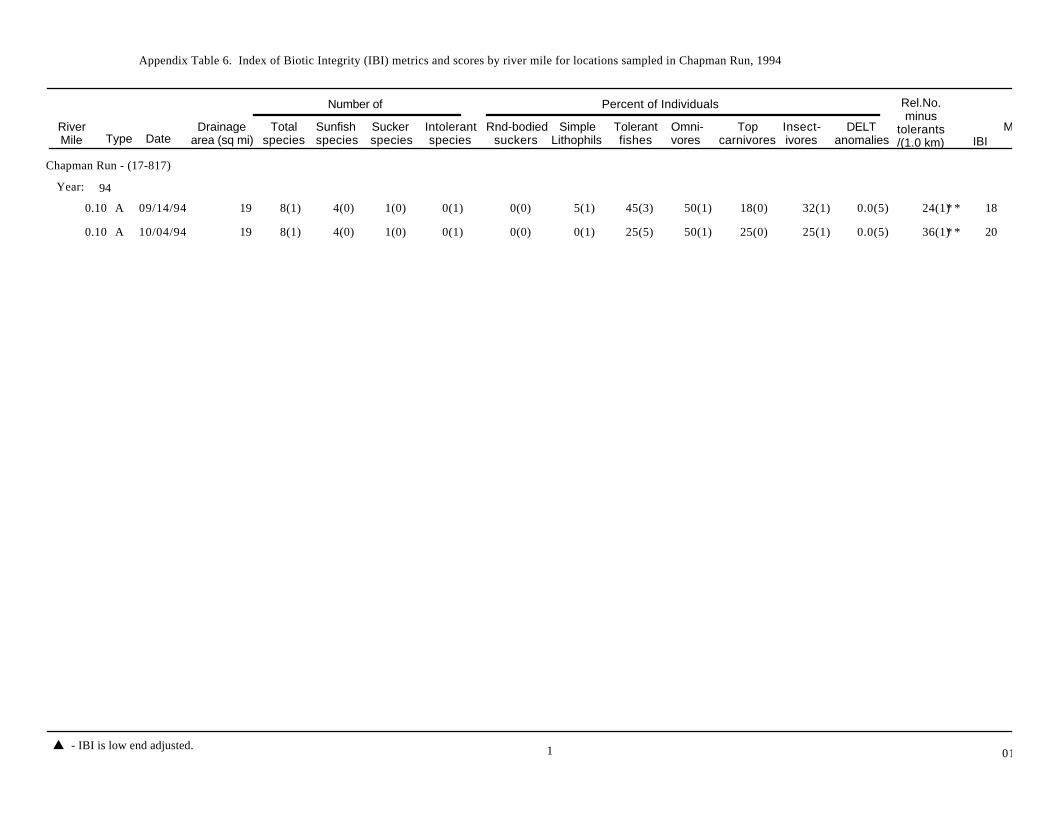
RiverMile Date
Drainagearea (sq mi)
Totalspecies
Sunfishspecies
Suckerspecies
Intolerantspecies
Rnd-bodiedsuckers
SimpleLithophils
Tolerantfishes
Omni-vores
Topcarnivores
Insect-ivores
DELTanomalies
Rel.No.minus
tolerants/(1.0 km) IBI
ModifiedType
Number of Percent of Individuals
Appendix Table 6. Index of Biotic Integrity (IBI) metrics and scores by river mile for locations sampled in Chapman Run, 1994
Chapman Run - (17-817)
Year: 94
0.10 09/14/94 8(1) 19 4(0) 1(0) 0(1) 0(0) 5(1) 45(3) 50(1) 18(0) 32(1) 0.0(5)A 1824(1) **
0.10 10/04/94 8(1) 19 4(0) 1(0) 0(1) 0(0) 0(1) 25(5) 50(1) 25(0) 25(1) 0.0(5)A 2036(1) **
1 01/08/96▲ - IBI is low end adjusted.