Embed Size (px)
Citation preview
Meet the Management, 2 February 2017
Thomas Dalsgaard, Executive Vice President
BIOENERGY &THERMAL POWER
57
Thomas DalsgaardEVPBioenergy & Thermal Power
2011 – Executive Vice President, Bioenergy & Thermal Power
2010 – 11 DONG Energy, Senior Vice President
2008 – 10 DONG Energy, Vice President
2004 – 08 IMF, Washington D.C., USA, Senioreconomist
2003 – 04 DONG Energy, Head of Management and Board Secretariat
2001 – 03 Danish Ministry of Finance, Head of Division
1998 – 01 OECD, Paris, France, Senior economist
1993 – 98 Danish Ministry of Finance, Economist
DONG Energy
Wind Power
Distribution & Customer Solutions
Bioenergy & Thermal Power
Oil & Gas
58
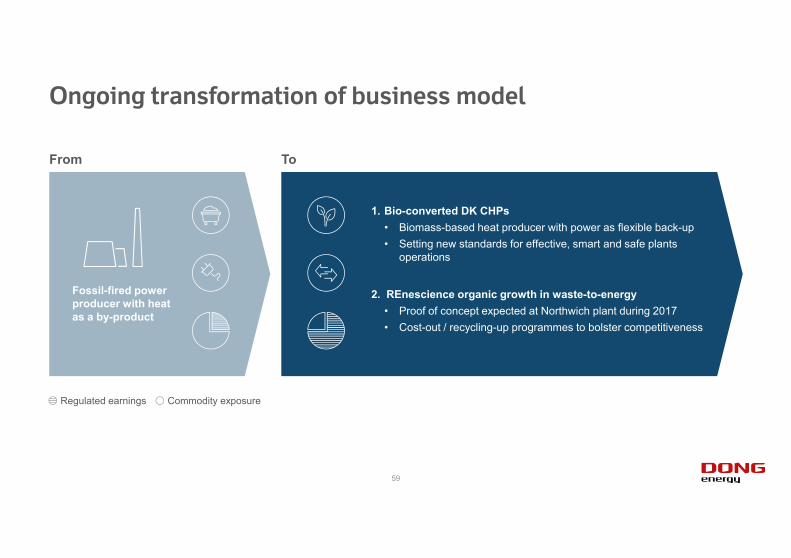
Ongoing transformation of business model
2. REnescience organic growth in waste-to-energy• Proof of concept expected at Northwich plant during 2017• Cost-out / recycling-up programmes to bolster competitiveness
From To
1. Bio-converted DK CHPs• Biomass-based heat producer with power as flexible back-up • Setting new standards for effective, smart and safe plants
operations
Fossil-fired power producer with heat as a by-product
Commodity exposureRegulated earnings
59
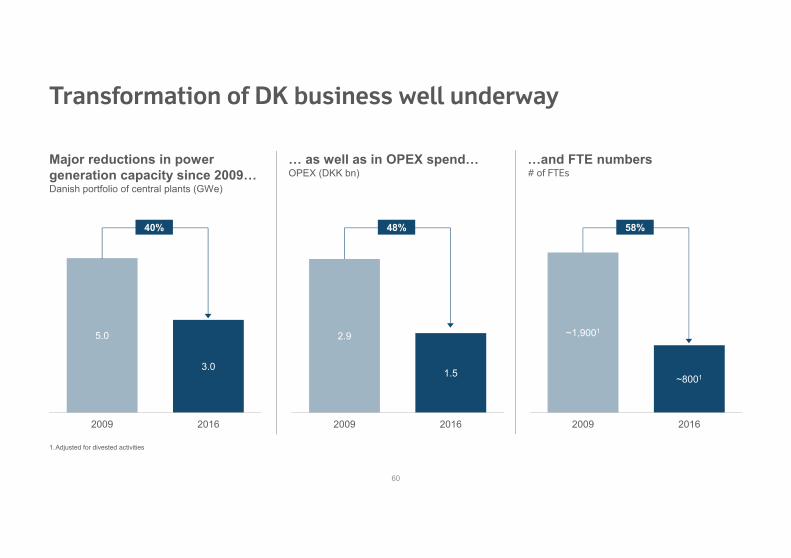
Transformation of DK business well underway
…and FTE numbers# of FTEs
… as well as in OPEX spend…OPEX (DKK bn)
Major reductions in power generation capacity since 2009… Danish portfolio of central plants (GWe)
5.0
3.0
2009 2016
40%
2.9
1.5
2009 2016
48%
~1,9001
~8001
2009 2016
58%
1.Adjusted for divested activities
60
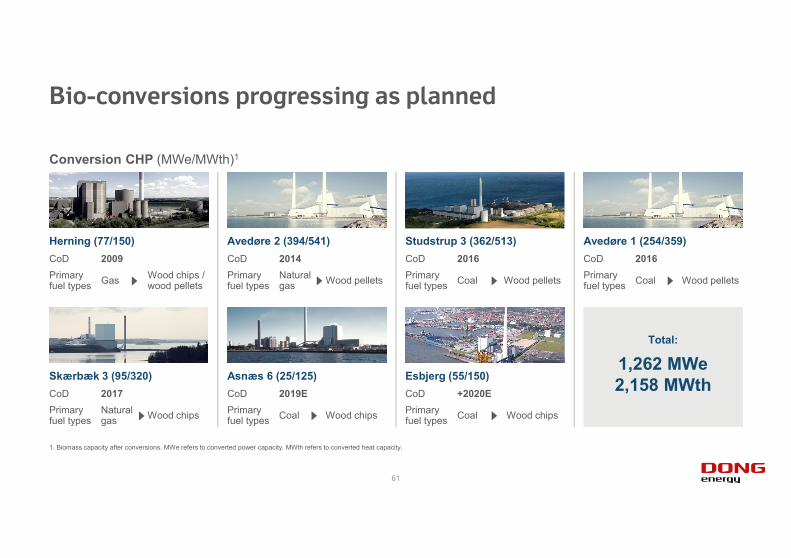
Bio-conversions progressing as planned
Conversion CHP (MWe/MWth)1
1. Biomass capacity after conversions. MWe refers to converted power capacity. MWth refers to converted heat capacity.
Herning (77/150) Avedøre 2 (394/541) Studstrup 3 (362/513) Avedøre 1 (254/359)CoD 2009Primary fuel types Gas Wood chips /
wood pellets
CoD 2014Primary fuel types
Naturalgas Wood pellets
CoD 2016Primary fuel types Coal Wood pellets
CoD 2016Primary fuel types Coal Wood pellets
Skærbæk 3 (95/320) Asnæs 6 (25/125) Esbjerg (55/150)CoD 2017Primary fuel types
Naturalgas Wood chips
CoD 2019EPrimary fuel types Coal Wood chips
CoD +2020EPrimary fuel types Coal Wood chips
Total:
1,262 MWe2,158 MWth
61
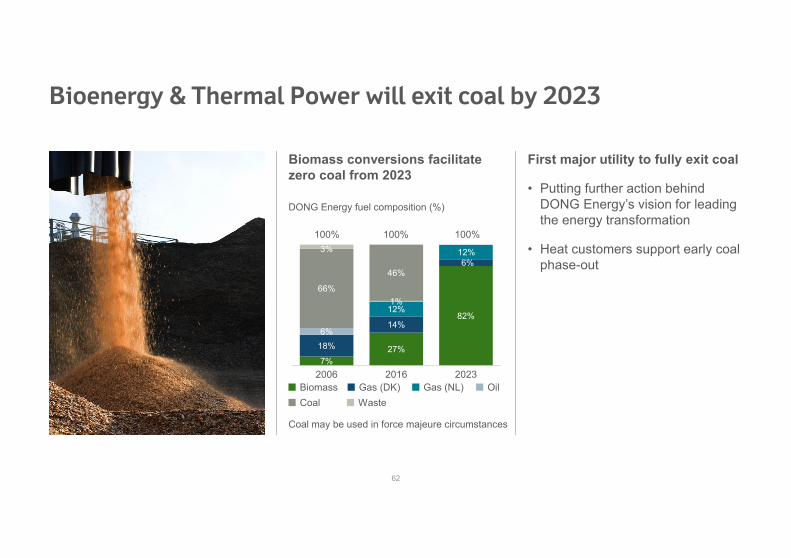
Bioenergy & Thermal Power will exit coal by 2023
First major utility to fully exit coal
• Putting further action behind DONG Energy’s vision for leading the energy transformation
• Heat customers support early coal phase-out
Biomass conversions facilitate zero coal from 2023
DONG Energy fuel composition (%)
Coal may be used in force majeure circumstances
7%27%
82%
18%
14%
6%
12%
12%
6%
1%66%
46%
3%
2006 2016 2023
100% 100% 100%
Biomass Gas (DK) Oil Waste
Gas (NL)Coal
62
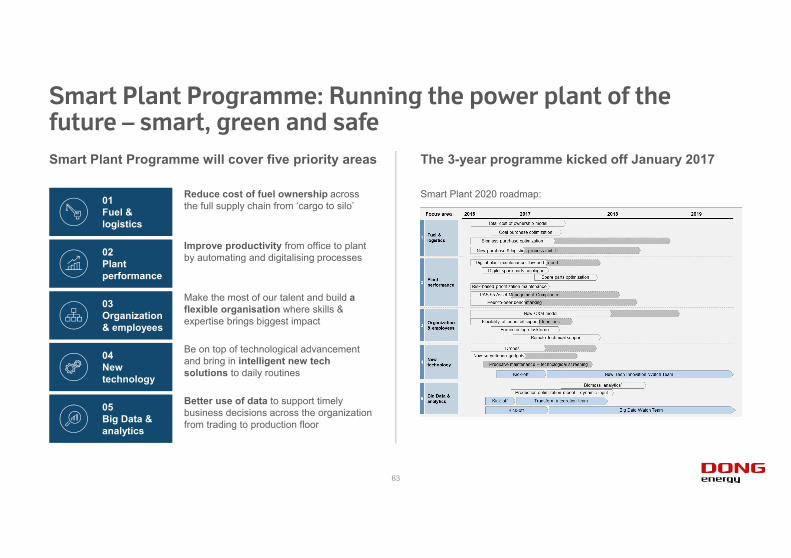
Smart Plant Programme: Running the power plant of the future – smart, green and safe
Reduce cost of fuel ownership across the full supply chain from ‘cargo to silo’ 01
Fuel & logistics
Better use of data to support timely business decisions across the organization from trading to production floor
05Big Data & analytics
Improve productivity from office to plant by automating and digitalising processes02
Plant performance
Be on top of technological advancement and bring in intelligent new tech solutions to daily routines
04New technology
Make the most of our talent and build a flexible organisation where skills & expertise brings biggest impact
03Organization & employees
Smart Plant 2020 roadmap:
The 3-year programme kicked off January 2017Smart Plant Programme will cover five priority areas
63
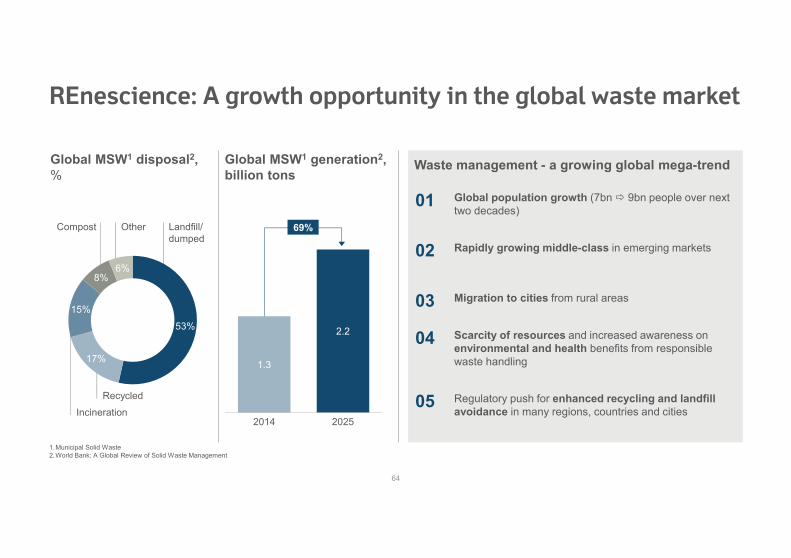
Waste management - a growing global mega-trend
REnescience: A growth opportunity in the global waste market
Global MSW1 generation2, billion tons
01 Global population growth (7bn 9bn people over next two decades)
Rapidly growing middle-class in emerging markets
Migration to cities from rural areas
Scarcity of resources and increased awareness on environmental and health benefits from responsible waste handling
Regulatory push for enhanced recycling and landfill avoidance in many regions, countries and cities
02
03
04
05
1.3
2.2
2014 2025
69%Landfill/dumped
Incineration
Compost
Recycled
Other
53%
17%
15%
8%6%
Global MSW1 disposal2, %
1.Municipal Solid Waste2.World Bank: A Global Review of Solid Waste Management
64
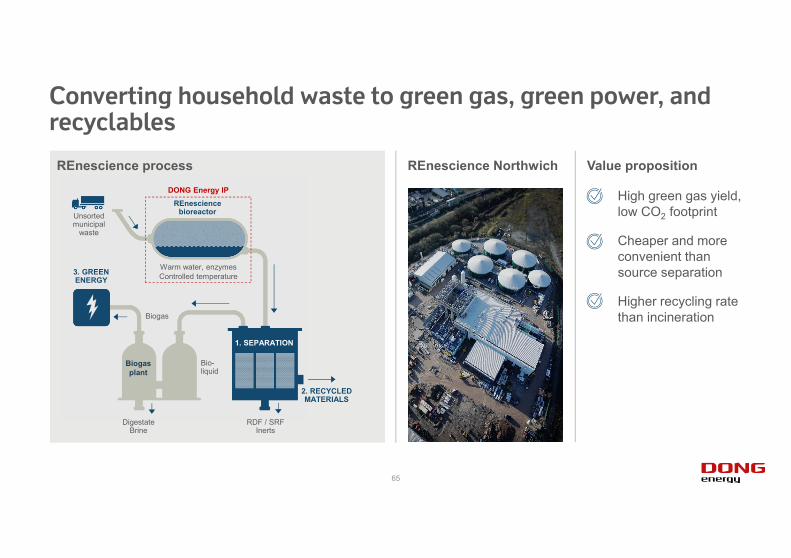
Converting household waste to green gas, green power, and recyclables
REnescience process
RDF / SRFInerts
DigestateBrine
Unsorted municipal
waste
REnescience bioreactor
Biogasplant
Bio-liquid
Warm water, enzymesControlled temperature
1. SEPARATION
2. RECYCLED MATERIALS
3. GREEN ENERGY
Biogas
DONG Energy IP
Value propositionREnescience Northwich
High green gas yield, low CO2 footprint
Cheaper and more convenient than source separation
Higher recycling rate than incineration
65
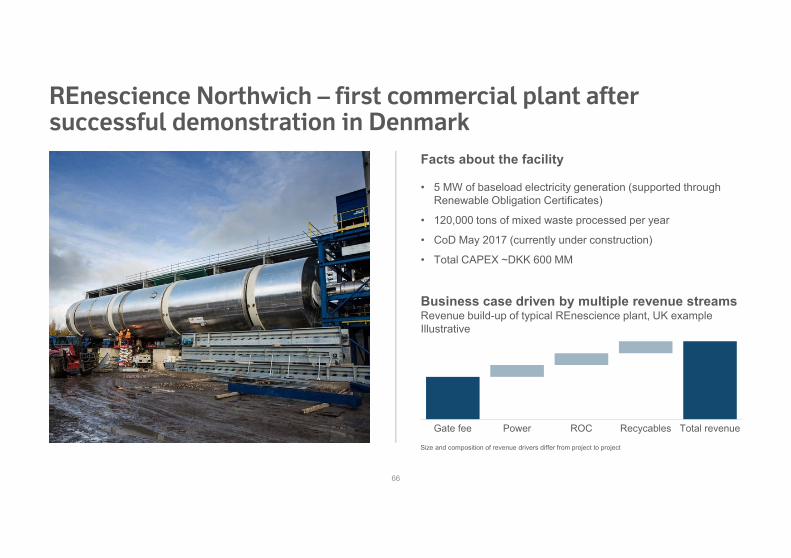
REnescience Northwich – first commercial plant after successful demonstration in Denmark
• 5 MW of baseload electricity generation (supported through Renewable Obligation Certificates)
• 120,000 tons of mixed waste processed per year
• CoD May 2017 (currently under construction)
• Total CAPEX ~DKK 600 MM
Business case driven by multiple revenue streamsRevenue build-up of typical REnescience plant, UK exampleIllustrative
Gate fee Power ROC Recycables Total revenue
Size and composition of revenue drivers differ from project to project
Facts about the facility
66
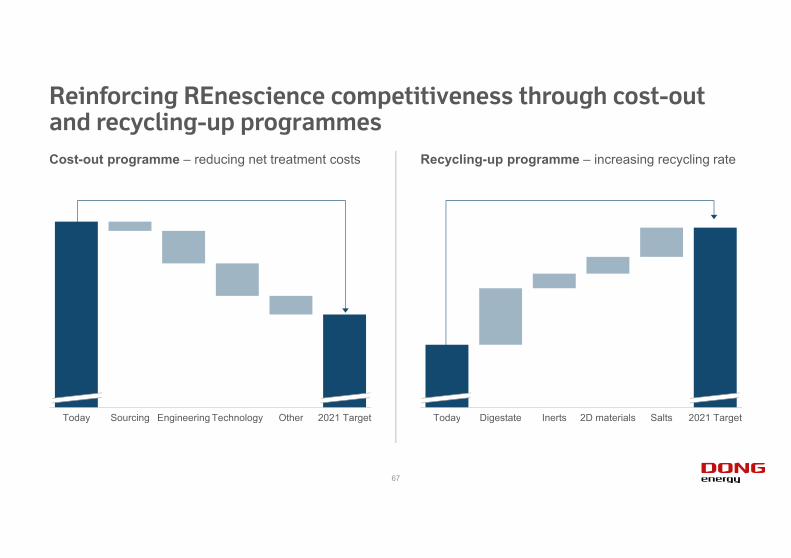
Reinforcing REnescience competitiveness through cost-out and recycling-up programmes
Recycling-up programme – increasing recycling rateCost-out programme – reducing net treatment costs
1.000.70
1.2020
Today Sourcing Engineering Technology Other 2021 Target
1.00
0.701.20
72
Today Digestate Inerts 2D materials Salts 2021 Target
67
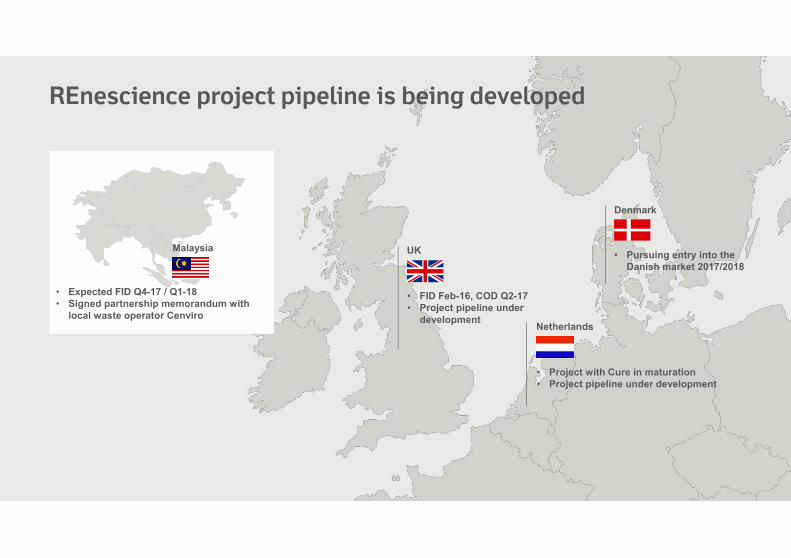
REnescience project pipeline is being developed
• Pursuing entry into the Danish market 2017/2018
• FID Feb-16, COD Q2-17• Project pipeline under
development
• Project with Cure in maturation• Project pipeline under development
• Expected FID Q4-17 / Q1-18• Signed partnership memorandum with
local waste operator Cenviro
Malaysia UK
Denmark
Netherlands
68
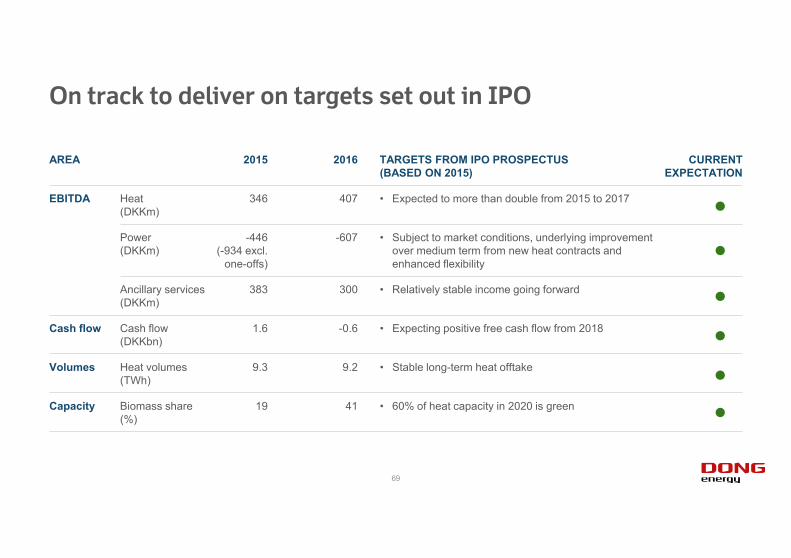
On track to deliver on targets set out in IPO
AREA 2015 2016 TARGETS FROM IPO PROSPECTUS (BASED ON 2015)
CURRENT EXPECTATION
EBITDA Heat (DKKm)
346 407 • Expected to more than double from 2015 to 2017
Power (DKKm)
-446 (-934 excl.
one-offs)
-607 • Subject to market conditions, underlying improvement over medium term from new heat contracts and enhanced flexibility
Ancillary services (DKKm)
383 300 • Relatively stable income going forward
Cash flow Cash flow (DKKbn)
1.6 -0.6 • Expecting positive free cash flow from 2018
Volumes Heat volumes (TWh)
9.3 9.2 • Stable long-term heat offtake
Capacity Biomass share (%)
19 41 • 60% of heat capacity in 2020 is green
69
70

71
Appendix
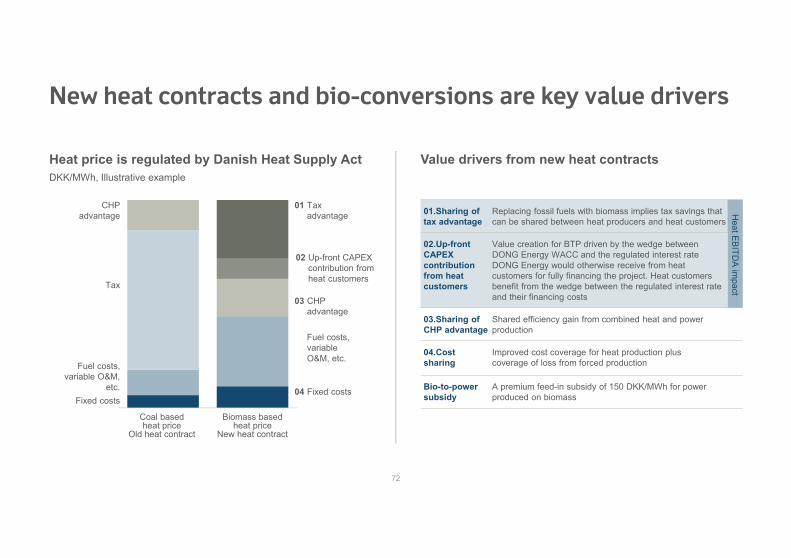
New heat contracts and bio-conversions are key value drivers
Value drivers from new heat contracts Heat price is regulated by Danish Heat Supply ActDKK/MWh, Illustrative example
Coal based heat price
Old heat contract
Biomass based heat price
New heat contract
04 Fixed costs
Fuel costs, variable O&M, etc.
01 Taxadvantage
03 CHP advantage
Fixed costs
Fuel costs, variable O&M,
etc.
Tax
CHP advantage
02 Up-front CAPEX contribution from heat customers
01.Sharing of tax advantage
Replacing fossil fuels with biomass implies tax savings that can be shared between heat producers and heat customers
02.Up-front CAPEX contribution from heat customers
Value creation for BTP driven by the wedge between DONG Energy WACC and the regulated interest rate DONG Energy would otherwise receive from heat customers for fully financing the project. Heat customers benefit from the wedge between the regulated interest rate and their financing costs
03.Sharing of CHP advantage
Shared efficiency gain from combined heat and power production
04.Cost sharing
Improved cost coverage for heat production pluscoverage of loss from forced production
Bio-to-power subsidy
A premium feed-in subsidy of 150 DKK/MWh for power produced on biomass
Heat EBITD
A impact
72
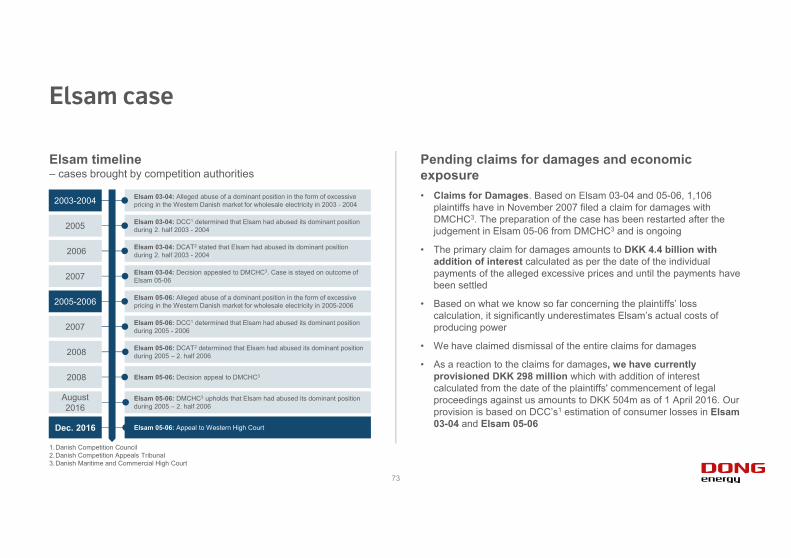
Elsam case
Pending claims for damages and economic exposure• Claims for Damages. Based on Elsam 03-04 and 05-06, 1,106
plaintiffs have in November 2007 filed a claim for damages with DMCHC3. The preparation of the case has been restarted after the judgement in Elsam 05-06 from DMCHC3 and is ongoing
• The primary claim for damages amounts to DKK 4.4 billion with addition of interest calculated as per the date of the individual payments of the alleged excessive prices and until the payments have been settled
• Based on what we know so far concerning the plaintiffs’ loss calculation, it significantly underestimates Elsam’s actual costs of producing power
• We have claimed dismissal of the entire claims for damages
• As a reaction to the claims for damages, we have currently provisioned DKK 298 million which with addition of interest calculated from the date of the plaintiffs' commencement of legal proceedings against us amounts to DKK 504m as of 1 April 2016. Our provision is based on DCC’s1 estimation of consumer losses in Elsam03-04 and Elsam 05-06
Elsam timeline – cases brought by competition authorities
Elsam 05-06: DMCHC3 upholds that Elsam had abused its dominant position during 2005 – 2. half 2006
Elsam 03-04: Alleged abuse of a dominant position in the form of excessive pricing in the Western Danish market for wholesale electricity in 2003 - 2004
Elsam 05-06: Alleged abuse of a dominant position in the form of excessive pricing in the Western Danish market for wholesale electricity in 2005-2006
Elsam 03-04: DCC1 determined that Elsam had abused its dominant position during 2. half 2003 - 2004
Elsam 03-04: Decision appealed to DMCHC3. Case is stayed on outcome of Elsam 05-06
Elsam 03-04: DCAT2 stated that Elsam had abused its dominant position during 2. half 2003 - 2004
Elsam 05-06: DCC1 determined that Elsam had abused its dominant position during 2005 - 2006
Elsam 05-06: DCAT2 determined that Elsam had abused its dominant position during 2005 – 2. half 2006
Elsam 05-06: Decision appeal to DMCHC3
Elsam 05-06: Appeal to Western High Court
2003-2004
2007
2005
August2016
2006
2007
2008
2008
2005-2006
Dec. 2016
1.Danish Competition Council 2.Danish Competition Appeals Tribunal3.Danish Maritime and Commercial High Court
73
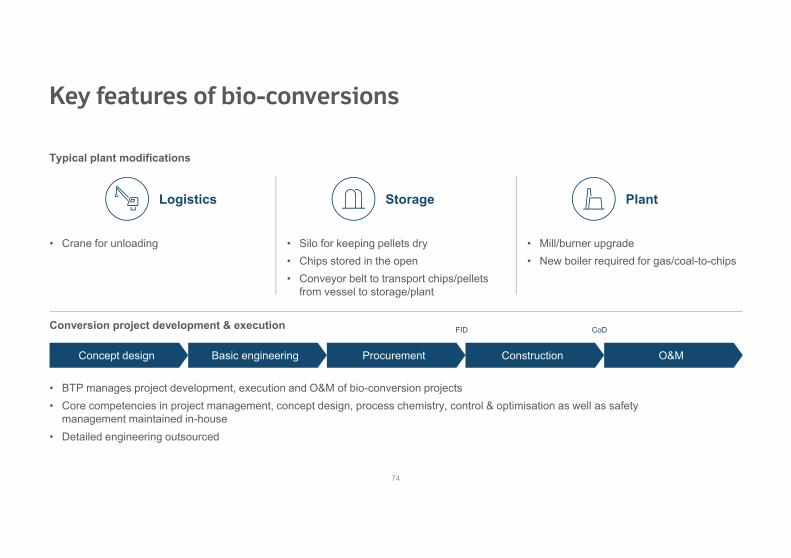
Key features of bio-conversions
Typical plant modifications
• Mill/burner upgrade• New boiler required for gas/coal-to-chips
• Silo for keeping pellets dry• Chips stored in the open• Conveyor belt to transport chips/pellets
from vessel to storage/plant
• Crane for unloading
Conversion project development & execution
• Detailed engineering outsourced
• Core competencies in project management, concept design, process chemistry, control & optimisation as well as safety management maintained in-house
• BTP manages project development, execution and O&M of bio-conversion projects
Logistics Plant
Concept design Basic engineering Procurement Construction O&M
FID CoD
Storage
74
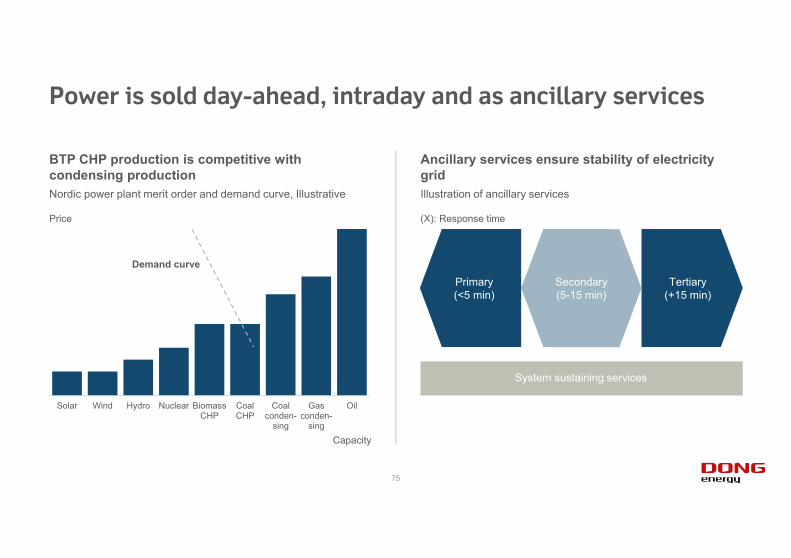
Power is sold day-ahead, intraday and as ancillary services
Ancillary services ensure stability of electricity gridIllustration of ancillary services
BTP CHP production is competitive with condensing productionNordic power plant merit order and demand curve, Illustrative
Primary(<5 min)
Secondary(5-15 min)
Tertiary(+15 min)
System sustaining services
(X): Response time
Solar Wind Hydro Nuclear BiomassCHP
CoalCHP
Coalconden-
sing
Gasconden-
sing
Oil
Demand curve
Price
Capacity
75
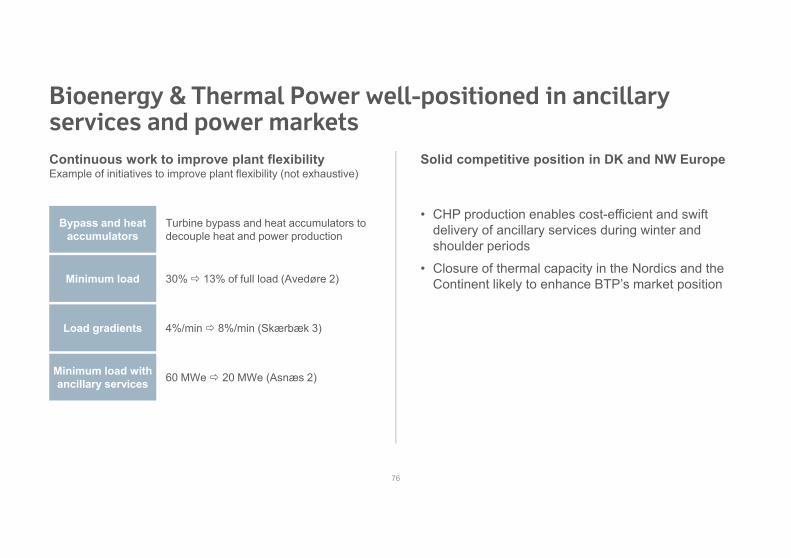
Bioenergy & Thermal Power well-positioned in ancillary services and power markets
Solid competitive position in DK and NW EuropeContinuous work to improve plant flexibilityExample of initiatives to improve plant flexibility (not exhaustive)
Load gradients 4%/min 8%/min (Skærbæk 3)
60 MWe 20 MWe (Asnæs 2)Minimum load with ancillary services
30% 13% of full load (Avedøre 2)Minimum load
Bypass and heat accumulators
Turbine bypass and heat accumulators to decouple heat and power production
• CHP production enables cost-efficient and swift delivery of ancillary services during winter and shoulder periods
• Closure of thermal capacity in the Nordics and the Continent likely to enhance BTP’s market position
76
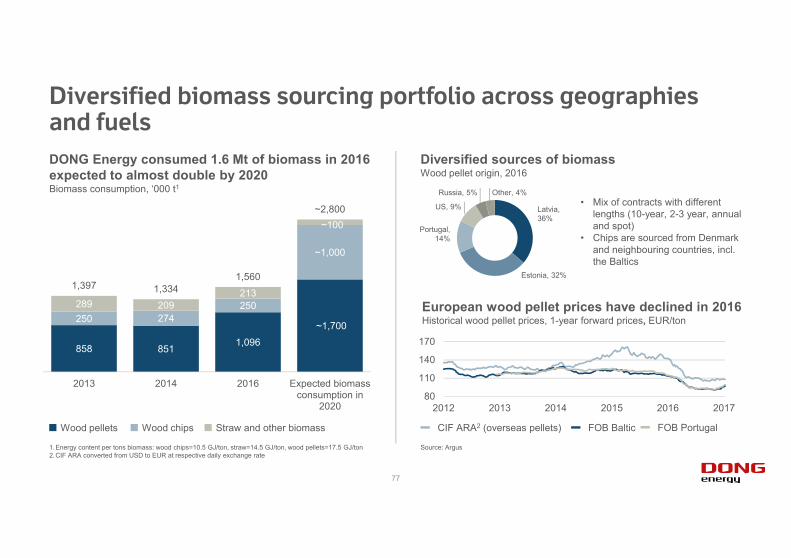
858 8511,096
~1,700250 274
250
~1,000
289 209213
~100
1,397 1,3341,560
~2,800
2013 2014 2016 Expected biomassconsumption in
2020
European wood pellet prices have declined in 2016Historical wood pellet prices, 1-year forward prices, EUR/ton
Diversified biomass sourcing portfolio across geographies and fuels
Diversified sources of biomassWood pellet origin, 2016
DONG Energy consumed 1.6 Mt of biomass in 2016 expected to almost double by 2020Biomass consumption, ‘000 t1
• Mix of contracts with different lengths (10-year, 2-3 year, annual and spot)
• Chips are sourced from Denmark and neighbouring countries, incl. the Baltics
80
110
140
170
2012 2013 2014 2015 2016 2017
Source: Argus
Wood pellets Wood chips Straw and other biomass
1.Energy content per tons biomass: wood chips=10.5 GJ/ton, straw=14.5 GJ/ton, wood pellets=17.5 GJ/ton2.CIF ARA converted from USD to EUR at respective daily exchange rate
CIF ARA2 (overseas pellets) FOB Baltic FOB Portugal
US, 9%
Russia, 5%
Portugal,14%
Latvia,36%
Estonia, 32%
Other, 4%
77
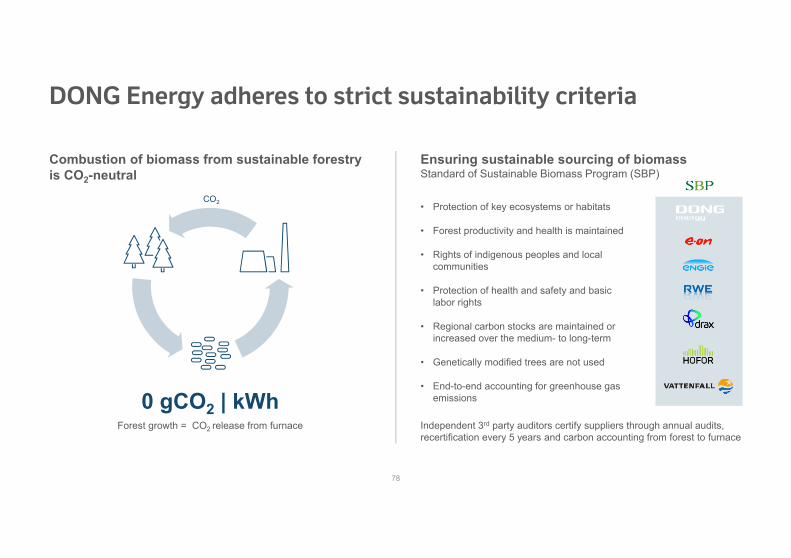
DONG Energy adheres to strict sustainability criteria
Ensuring sustainable sourcing of biomassStandard of Sustainable Biomass Program (SBP)
Combustion of biomass from sustainable forestry is CO2-neutral
• Protection of key ecosystems or habitats
• Forest productivity and health is maintained
• Rights of indigenous peoples and local communities
• Protection of health and safety and basic labor rights
• Regional carbon stocks are maintained or increased over the medium- to long-term
• Genetically modified trees are not used
• End-to-end accounting for greenhouse gas emissions
Independent 3rd party auditors certify suppliers through annual audits, recertification every 5 years and carbon accounting from forest to furnace
0 gCO2 | kWh Forest growth = CO2 release from furnace
CO2
78
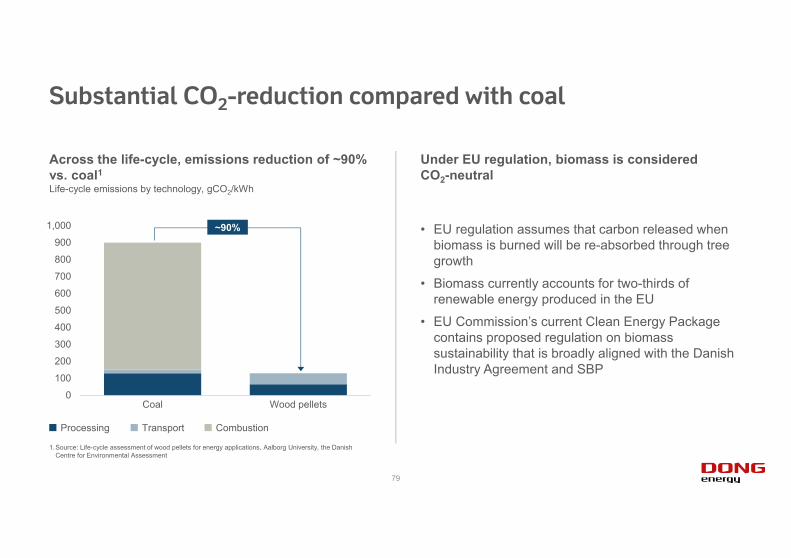
Substantial CO2-reduction compared with coal
Under EU regulation, biomass is considered CO2-neutral
• EU regulation assumes that carbon released when biomass is burned will be re-absorbed through tree growth
• Biomass currently accounts for two-thirds of renewable energy produced in the EU
• EU Commission’s current Clean Energy Package contains proposed regulation on biomass sustainability that is broadly aligned with the Danish Industry Agreement and SBP
Across the life-cycle, emissions reduction of ~90% vs. coal1Life-cycle emissions by technology, gCO2/kWh
0
100
200
300
400
500
600
700
800
900
1,000
Coal Wood pellets
~90%
Processing Transport Combustion
1.Source: Life-cycle assessment of wood pellets for energy applications, Aalborg University, the Danish Centre for Environmental Assessment
79
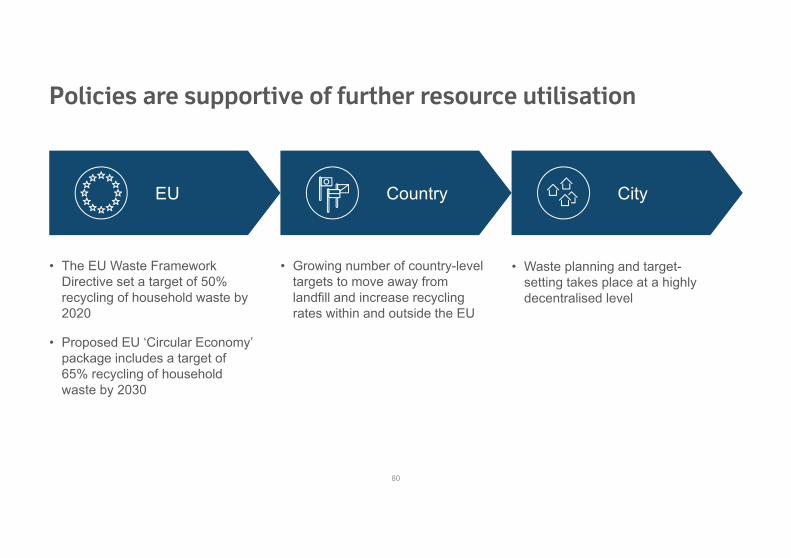
EU Country City
Policies are supportive of further resource utilisation
• The EU Waste Framework Directive set a target of 50% recycling of household waste by 2020
• Proposed EU ‘Circular Economy’ package includes a target of 65% recycling of household waste by 2030
• Growing number of country-level targets to move away from landfill and increase recycling rates within and outside the EU
• Waste planning and target-setting takes place at a highly decentralised level
80
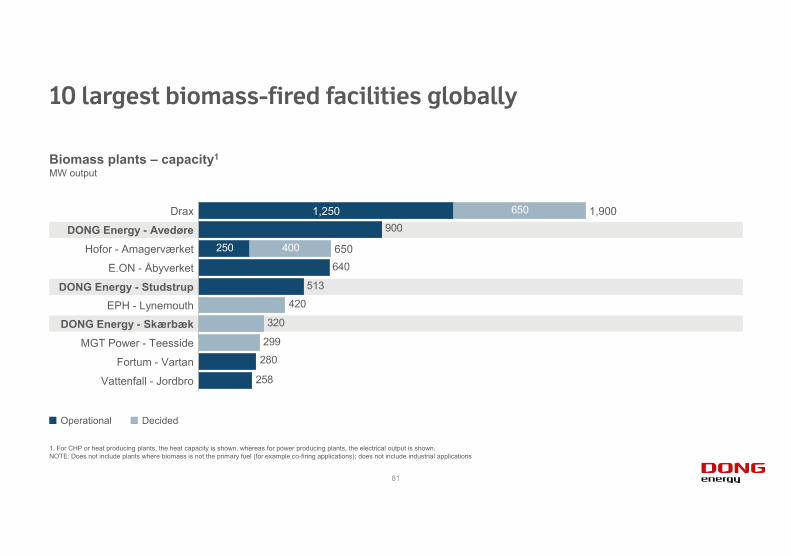
10 largest biomass-fired facilities globally
Biomass plants – capacity1
MW output
1. For CHP or heat producing plants, the heat capacity is shown, whereas for power producing plants, the electrical output is shown.NOTE: Does not include plants where biomass is not the primary fuel (for example co-firing applications); does not include industrial applications
258
280
299
320
420
513
640
900
250 400
6501,250
DONG Energy - Avedøre1,900Drax
EPH - Lynemouth
DONG Energy - Studstrup
650
E.ON - Åbyverket
Hofor - Amagerværket
Fortum - Vartan
Vattenfall - Jordbro
DONG Energy - SkærbækMGT Power - Teesside
Operational Decided
81