Embed Size (px)
Citation preview

© OECD/IEA 2014
Translating Bioenergy Global Analysis into National Policies, Strategies and Roadmaps
Asia Pacific Regional Workshop on Biomass Energy Resource Assessment
Bangkok, Thailand - 6 July 2015
Simone LandolinaActing Head, International Partnerships and Initiatives

© OECD/IEA 2014
Key role of bioenergy to reduce CO2 emissions globally
Reaching the 2DS will require 42 Gt CO2 annual emissions reduction by 2050
Biomass is the only renewable energy source that can make a contribution in all sectors, providing around 10% of total CO2 emissions reduction
Source: Energy Technology Perspectives 2015
6°C Scenario emissions: 58 Gt ------------>
2°C Scenario emissions: 16 Gt ------------>
Bioenergytechnologies
Emissions reduction in 2050
Bioenergy power 1.0 Gt CO2-eq
Bio-power + CCS 0.3 Gt CO2-eq
Bioenergy heat (industry)
0.5 Gt CO2-eq
Bioenergy heat (buildings)
0.1 Gt CO2-eq
Biofuels 2.1 Gt CO2-eq
Total 4.1 Gt CO2-eq
© OECD/IEA 2015
2

© OECD/IEA 2014
Renewable electricity projected to scale up by 45% from 2013 to 2020
Renewable Energy Medium-Term Forecast
Source: Medium-Term Renewable Energy
Market Report 2014
© OECD/IEA 2015
0%
5%
10%
15%
20%
25%
30%
500
1 000
1 500
2 000
2 500
3 000
3 500
4 000
4 500
5 000
5 500
6 000
6 500
7 000
7 500
2005 2006 2007 2008 2009 2010 2011 2012 2013 2014 2015 2016 2017 2018 2019 2020
TWh
Hydropower Bioenergy Onshore wind
Offshore wind Solar PV Geothermal
STE/CSP Ocean % total generation (right axis)
Historical data and estimates Forecast
3

© OECD/IEA 2014
Bioenergy currently provides some 2% of global electricity production, and generation is expected to rise by 55% by 2020.
Significant increase expected in China and other non-OECD Asian countries
Bioenergy Medium-Term Forecast
Source: Medium-Term Renewable Energy Market Report 2014
0
100
200
300
400
500
600
700
2006 2007 2008 2009 2010 2011 2012 2013 2014 2015 2016 2017 2018 2019 2020
TWh
OECD Americas OECD Asia Oceania OECD Europe Africa Non-OECD Asia China Non-OECD Europe Non-OECD Americas Middle East MTRMR 2013
World bioenergy power generation and projection by region
© OECD/IEA 2015
4
© OECD/IEA 2014
Bioenergy by far the most important source of renewable heat.
Traditional use of biomass continues to dominate the production of heat. Modern uses of biomass for heating are increasing and are expected to rise from ca. 13 EJ today to around 15EJ by 2020.
Bioenergy Medium-Term Forecast
Source: Medium-Term Renewable Energy Market Report 2014
World final renewable energy use for heat by source
© OECD/IEA 2015
5

© OECD/IEA 2014
Non‐OECD countries account for more than 90% of global bioenergy used for heat.
In Asia, China and India are the biggest consumers of bioenergy for heat in the buildings sector, however significant use of bioenergy in ASEAN countries in general (particularly for water heating).
Bioenergy Medium-Term Forecast
Source: Medium-Term Renewable Energy Market Report 2014
Share of RE in total final energy consumption for heating by world regions (2012)
© OECD/IEA 2015
6
© OECD/IEA 2014© OECD/IEA 2015
0
20
40
60
80
100
120
140
160
2007 2009 2011 2013 2015 2017 2019
billio
n litr
es
volumetric
United States biofuels Brazil biofuelsOECD Europe biofuels Rest of the world biofuels
0%
1%
2%
3%
4%
0
20
40
60
80
100
120
2007 2009 2011 2013 2015 2017 2019
billio
n litr
es oil
equiv
alent
adjusted for energy content
Biofuels supply (adj. for energy content)As % of global road transport fuel demand
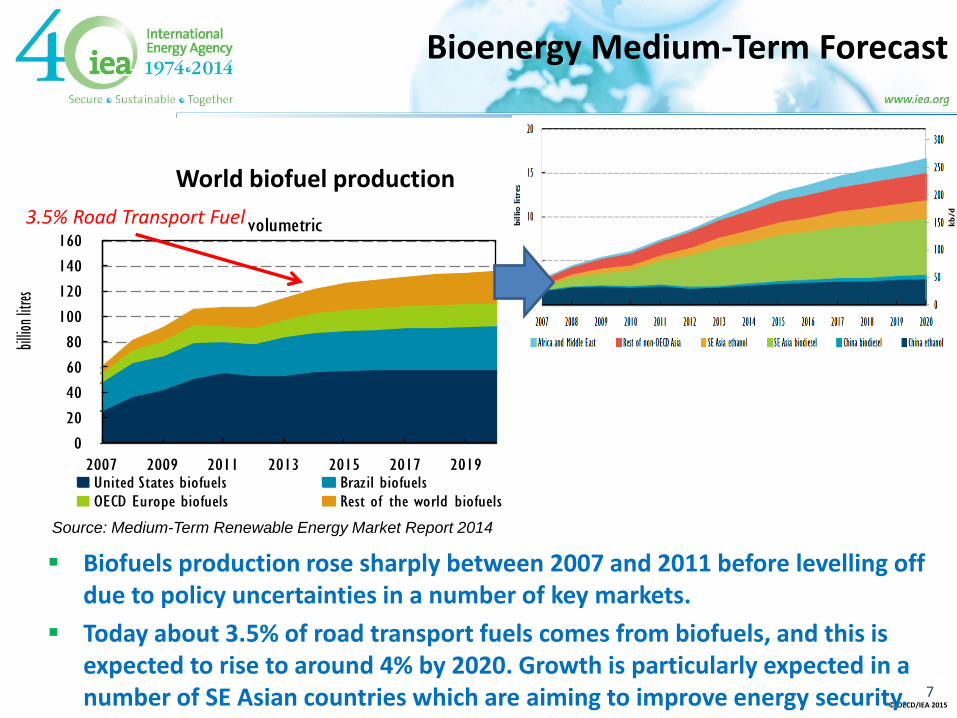
Biofuels production rose sharply between 2007 and 2011 before levelling off due to policy uncertainties in a number of key markets.
Today about 3.5% of road transport fuels comes from biofuels, and this is expected to rise to around 4% by 2020. Growth is particularly expected in a number of SE Asian countries which are aiming to improve energy security.
Source: Medium-Term Renewable Energy Market Report 2014
Bioenergy Medium-Term Forecast
3.5% Road Transport Fuel
World biofuel production
7

© OECD/IEA 2014
Biofuels production falling behind targets of IEA Biofuel Roadmap
In a low CO2 scenario (IEA 2DS) biofuels’ share in total transport increases to 27% in 2050
Without significant improvements of the policy framework for advanced biofuels, targets in the 2DS will not be met!
Source: IEA (2014) Tracking Clean Energy Progress
© OECD/IEA 2015
8

© OECD/IEA 2014
Even with growing competitiveness, policies remain vital to stimulating investments
The right support depends on the maturity of the technology and the degree of market uptake
Supporting bioenergy deployment (I)
Solid biomass boilersHousehold biogas systems
Combustion and steam cycle Direct co-firing
Advanced biomass cookstovesConventional biofuels
GasificationTorrefaction
Advanced biofuelsBioenergy CCS
© OECD/IEA 2015
Source: adapted from
Energy Technology
Perspectives 2015
9

© OECD/IEA 2014
Better understanding innovation can increase confidence in its outcomes
In order to accelerate technological progress in low-carbon technologies, innovation policies should be systemic
10

© OECD/IEA 2014
Bioenergy provides numerous examples of technologies which no longer require high levels of financial support, if resource and appropriate market and regulatory framework in place (affects system prices and financing)
So, the focus of policies should shift away from economic incentives towards creating the conditions by: Providing a long term stable policy framework that leads to a predictable market
Provide certainty of income through long term PPAs
Dynamic policy approach differentiating by sector (industry / buildings / transport)
Develop regulation and business models for distributed generation (heat / power)
Tackle non-economic barriers
Address system integration issues
Supporting bioenergy deployment (II)
IEA Bioenergy Technology Roadmaps provide global vision and guidance on deployment pathways, however there is no “one size fits all”…
© OECD/IEA 2015
11

© OECD/IEA 2014
Operative since 2010 upon mandate of the IEA Ministers to foster international collaboration on low-carbon energy technologies
Mission:
Disseminating IEA analysis and policy recommendations aimed at accelerating the deployment of low-carbon energy technologies, in line with 2DS efforts
Enhancing multilateral engagement with emerging and developing economies
Adapting IEA global analysis to regional and local contexts
International Low-Carbon Energy Technology Platform
© OECD/IEA 2011© OECD/IEA 201412

© OECD/IEA 2014
Defines the process of developing and implementing a bioenergy technology roadmap
Collaboration between the IEA and the FAO, with IRENA and GBEP key contributors
Roadmap methodology guidance through four steps, illustrated by case studies
Case studies from IEA Member and Partner countries (Southern Africa, Southeast Asia, South America)
Comprehensive decision support toolbox, including and referencing work of other international/regional organisations
© OECD/IEA 2014
13
How2Guide for Bioenergy
© OECD/IEA 2015

© OECD/IEA 2014
South East Asia Bioenergy Expert Workshop
23-24 July 2014 – Bangkok, Thailand
Jointly organised by IEA, FAO and IRENA in collaboration with the Ministry of Energy of Thailand
Thematic focus on sustainability of bioenergy
Over 60 participants including 7 countries in the ASEAN region as well as the European Commission and other int. orgs.
Information we sought to capture:
© OECD/IEA 2014 14
• How and to what extent have policy makers and regulators in SEA
undertaken/supported bioenergy technology roadmaps?
• Which are the drivers for bioenergy roadmaps in the different
countries? Are drivers in SEA different from those in other world
regions?
• Have project developers participated (and how) in the development
of bioenergy technology policies and roadmaps?
• Which indicators have been used to track progress in the region?
Were roadmaps adjusted in light of experiences gained through
implementation?

© OECD/IEA 2014© OECD/IEA 2014 15
Ind
ica
tive
str
uct
ure
of
the
rep
ort
0
• Introduction• Background and context
• Bioenergy outlook and technology perspectives
1
• Planning and preparation• Conducting baseline research
• Identifying bioenergy stakeholders
2
• Visioning• Strategic considerations in bioenergy policy (e.g. drivers)
• Assessing bioenergy sustainability
3
• Roadmap Development• Identifying barriers and action options to the deployment of bioenergy
• Setting milestones and responsible actors
4• Implementation, monitoring and adjustment• Qualitative and quantitative indicators for monitoring progress
Short ‘signposting’ document (40-50 pages)

© OECD/IEA 2014
Building capacity is key to successful technology deployment
Collaboration between international organisations can help maximising the impact of capacity building 16
© OECD/IEA 2014
Conclusions
Bioenergy has the potential to provide a growing contribution to energy needs and plays a very important role in low-carbon energy scenarios in each energy sector
To deliver this enhanced contribution will be challenging. A supportive, long-term policy framework which allows the next generation of plants to be built and operated is essential
Key issues that must be addressed include:
• Ways to reduce costs of the energy delivered so as to reduce the need for financial support
• The resolution of outstanding sustainability uncertainties
• The development of cost effective and sustainable supply chains
• The development of supportive policy and regulatory frameworks appropriate to the maturity of the technologies and markets
© OECD/IEA 2015
17

© OECD/IEA 2014© OECD/IEA 2015
Thank you for your attention!