Embed Size (px)
Citation preview

86 |
CHAPTER 11
Biodiversity Natural capital to be
wisely used
Bob Scholes,1 Amanda Driver,2 Reinette Biggs3 and Greg Forsyth4
IntroductionThe biodiversity section in the first edition of SARVA (Midgely 2011) introduced the exceptionally rich biota of South Africa. It included maps of the main areas of endemism (i.e. places where there are concentrations of species that do not occur naturally anywhere else in the world) and of the protected area network that has been established to conserve biodiversity. Furthermore, it outlined the threat to biodiversity posed by land use and climate change, and presented a case study of the Kruger-to-Canyons area in the north-east of the country. This chapter builds on that foundation without repeating the information.
© South African Tourism, Bourke's Luck Potholes, Mpumalanga, South Africa. https://www.flickr.com/photos/south-african-tourism
1 University of the Witwatersrand – Global Change and Sustainability Research Institute (GCRSI)2 South Africa National Biodiversity Institute (SANBI)3 University of Stellenbosch – Centre for Studies in Complexity4 Council for Scientific and Industrial Research (CSIR) – Natural Resources and the Environment

Bob Scholes, Amanda Driver, Reinette Biggs and Greg Forsyth | 87
Climate change-related risks to biodiversity
All species have a tolerance range with respect to climate variables such as temperature and moisture, known as their ‘climate niche’. Interactions with other species in ecosystems and non-climate factors cause the ‘realised niche’ which they occupy to become smaller than this potential niche. When the climate changes, species must either adapt physiologically or genetically, or migrate to places where the climate meets their needs. The climate changes projected for southern Africa in the 21st century are sufficient to put a large fraction of South African species outside their preferred climate niches (Midgley et al. 2002; Thomas et al. 2004; Midgley et al. 2011). Species with slow adaptation and migration rates, those whose migration pathway is blocked by hostile land uses or topography, those which are dependent on other species that are not able to adapt or migrate rapidly enough, or species for which suitable future climate combinations simply do not exist, face an increased risk of extinction. Clearly the climate risks interact with the risks involved in a change in land use.
0.75
0.8
0.85
0.9
0.95
1900 1920 1940 1960 1980 2000
Bio
dive
rsity
Inta
ctne
ss In
dex
Figure 11.1 The terrestrial Biodiversity intactness index for South Africa over the period
1900-2000 (Biggs & Scholes 2007)
Measuring changes in biodiversityThe modern understanding of the term ‘biodiversity’ involves much more than just a list of plants and animals. It includes the genetic variability within species (including the species we have domesticated, such as maize or cattle), the abundance and distribution of populations of species, and the pattern and condition of various ecosystems. Therefore, various measures of biodiversity are possible – some biodiversity indicators may suggest that the status of biodiversity is improving, while others show it to be declining. This can be quite confusing if one merely wants to know the general state in which biodiversity currently is.
One way of combining the several aspects of biodiversity is through the Biodiversity Intactness Index (BII) (Scholes & Biggs 2005). This index estimates the average abundance of organisms within a particular area – across a wide range of plant and vertebrate species – for all the ecosystems in the area, regardless of whether they are protected, semi-natural, or transformed. It acts as a robust measure of the ‘average biodiversity’ that underpins our wellbeing as humans. Tracking ‘rare and threatened biodiversity’ in a sensitive way requires a different approach, such as the Red List of Threatened Species or ecosystems.
The BII indicates a relatively steady loss of biodiversity for South Africa during the 20th century, with some steeper loss associated with periods of rapid land use change, for example in the 1950s (see Figure 11.1). Ecosystems heavily affected by cultivation (such as the grasslands) or urban expansion (such as the coast) show the greatest loss of biodiversity, especially if such ecosystems coincide with areas of high species richness and endemism. Overall, it has been calculated that cultivation is the cause of 52% of the total decline in BII, while extensive livestock farming accounts for 25%, land degradation for 12%, urbanisation for 6% and plantation forestry for 5% (Biggs et al. 2006).
Notwithstanding these losses, South Africa, unlike many other countries, still has a lot of its original biodiversity. This is a national asset to be used sustainably. Biodiversity assets and ecological infrastructure can contribute to national goals such as job creation, poverty alleviation and rural development. These assets can also play a key role in helping us cope with the impacts of climate and other changes – often more effectively and at a lesser cost than technology-based solutions.

88 | CHAPTER 11 | Biodiversity Natural capital to bewisely used
Biodiversity priority areas and climate change resilience
In order to make the most of the national biodiversity asset, South Africa’s approach to managing and conserving it is two-fold: (1) Expanding and linking the network of protected areas; and (2) ensuring biodiversity-compatible management and resource use in priority areas outside the protected area network.
‘Protected areas’ are those that are formally recognised in terms of the Protected Areas Act of 2003. They include not only state-owned parks and reserves, but also private or communally-owned protected areas in which landowners have entered into a contractual agreement with a conservation authority. The land-based protected area network currently makes up about 7% of the country’s land area, and the marine protected area network less than 1% of our marine territory, which is, in fact, much larger than the land area.
Biodiversity-compatible land use can take many forms, e.g. appropriately managed extensive livestock grazing or wildlife ranching, sustainable harvesting of wild resources from the land or sea, or a range of recreational and ecotourism activities. Even cultivation, plantation forestry, mining and urban development can take less damaging forms, if carefully executed.
South Africa has a strong tradition of identifying spatial priority areas to guide biodiversity management and conservation action, and we always aim toward getting the best possible outcome from the resources available for biodiversity protection. Priority areas – including those intended for conserving a representative sample of ecosystems and species, for maintaining ecological processes, and for delivering ecosystem services – are identified using systematic biodiversity planning. The National Biodiversity Assessment of 2011 (Driver et al. 2012) consolidated all spatial biodiversity priority areas into a single national map for the first time (shown in Figure 11.2, with the categories described in Box 1). In some priority areas the objective is to keep the landscape in a natural or near-natural condition; in others the focus is mainly to maintain key ecological functions while permitting compatible land uses. Information on all biodiversity priority areas is available on the South African National Biodiversity Institute’s website (http://bgis.sanbi.org).
Box 1: Biodiversity priority areas in South Africa
Biodiversity priority areas include the following categories (as shown in Figure 11.2):
• Protected areas are areas of land or sea that are formally protected by law and managed mainly for biodiversity conservation.
• Critically endangered ecosystems are ecosystem types that have very little of their original extent left in natural or near-natural condition.
• Endangered ecosystems are ecosystem types that are close to becoming critically endangered.
• Critical Biodiversity Areas (CBAs) are areas required to meet biodiversity targets for ecosystems, species or ecological processes, as identified in a systematic biodiversity plan.*
• Ecological Support Areas (ESAs) play an important role in supporting the ecological functioning of CBAs or in delivering ecosystem services.*
• Freshwater Ecosystem Priority Areas (FEPAs) are rivers and wetlands required to meet biodiversity targets for freshwater ecosystems (see Nel et al. 2011).
• High water yield areas are sub-catchments where mean annual runoff is at least three times more than the average for the related primary catchment (see Nel et al. 2011).
• Priority estuaries are those required to meet biodiversity targets for estuarine ecosystems, habitats and estuarine-dependent species.
• Focus areas for land-based protected area expansion are large, intact and unfragmented areas of high biodiversity importance, suitable for the creation or expansion of large protected areas.
• Focus areas for offshore protection are areas identified as priorities for representing offshore marine biodiversity, for protecting vulnerable marine ecosystems for contributing to fisheries’ sustainability, for supporting management of by-catch, or for a combination of these (see Sink et al. 2011).
* CBAs and ESAs are yet to be identified in some provinces (Free State and parts of the Northern Cape) as well as in the marine environment.
The need to promote resilience to climate change is one of several considerations in identifying priority areas for biodiversity protection. For example, the National Protected Area Expansion Strategy (PSA 2010) identified 42 focus areas for land-based protected area expansion. These not only contain those ecosystems that are under-represented in the current protected area network, but also those landscape features necessary to allow species to disperse and migrate in response to climate change. Temperature and rainfall gradients, topographic and habitat variability, centres of floral endemism, coastal ecological processes, and river-associated movement corridors, were all favoured in their selection.

Bob Scholes, Amanda Driver, Reinette Biggs and Greg Forsyth | 89
Figure 11.2 Biodiversity priority areas in South Africa (Driver et al. 2012). This map is used for guiding land use planning and natural resource management decisions
CHAPTER 11 | Biodiversity Natural capital to bewisely used 90 |
It is now standard practice in biodiversity planning in South Africa to build features such as climatic and altitudinal gradients, ecological corridors of various types, and climate refuge sites into the identification of biodiversity priority areas. This helps to maintain the country’s natural capital base and the supply of ecosystem services.
Ecosystem services and natural capitalEcosystem services are the benefits that humans obtain from nature (MA 2003), including tangible things such as fresh water, food, timber and clean air. They also include the foundation for our growing nature-based tourism sector, and many unseen ecological processes that support our existence, such as nutrient cycling, climate regulation, pollination and the control of diseases (Summers et al. 2012). The sustained and reliable supply of ecosystem services depends on sufficient, healthy biodiversity – broadly defined, as above, to include ecosystems and functioning ecological processes (Reyers et al. 2012). Ecosystem services can be measured and mapped (e.g. for southern Africa by Scholes & Biggs 2004), and in some cases even quantified in terms of money. ‘Natural capital’ can be defined in a similar way as ‘financial capital’: An asset that generates future income, in this case in the form of ecosystem goods or services.
Wealth creation is the process of using various forms of capital, including natural capital, to generate flows of goods and services that people need. A decline in natural capital is a sign of unsustainability if it is not accompanied by larger increases in other forms of capital (Ekins et al. 2003). Human activities – including those aimed at meeting demands for food, water, timber or fuel – can disrupt the functioning of ecosystems, reducing the delivery of ecosystem services (Summers et al. 2012). While some ecosystem processes can be partly substituted with human technology (e.g. water can be purified in a treatment plant if wetlands no longer perform that function), there are many ecosystem services which simply cannot be substituted at all. If we allow the ecosystems that provide these services to deteriorate due to unsustainable land management (e.g. over-grazing, soil erosion, invasion by alien plants and water pollution), our wellbeing also suffers and our development opportunities will be hampered (MA 2005). Over-exploiting a resource can temporarily alleviate poverty; however, because it is unsustainable, it will limit socio-economic development in the future.
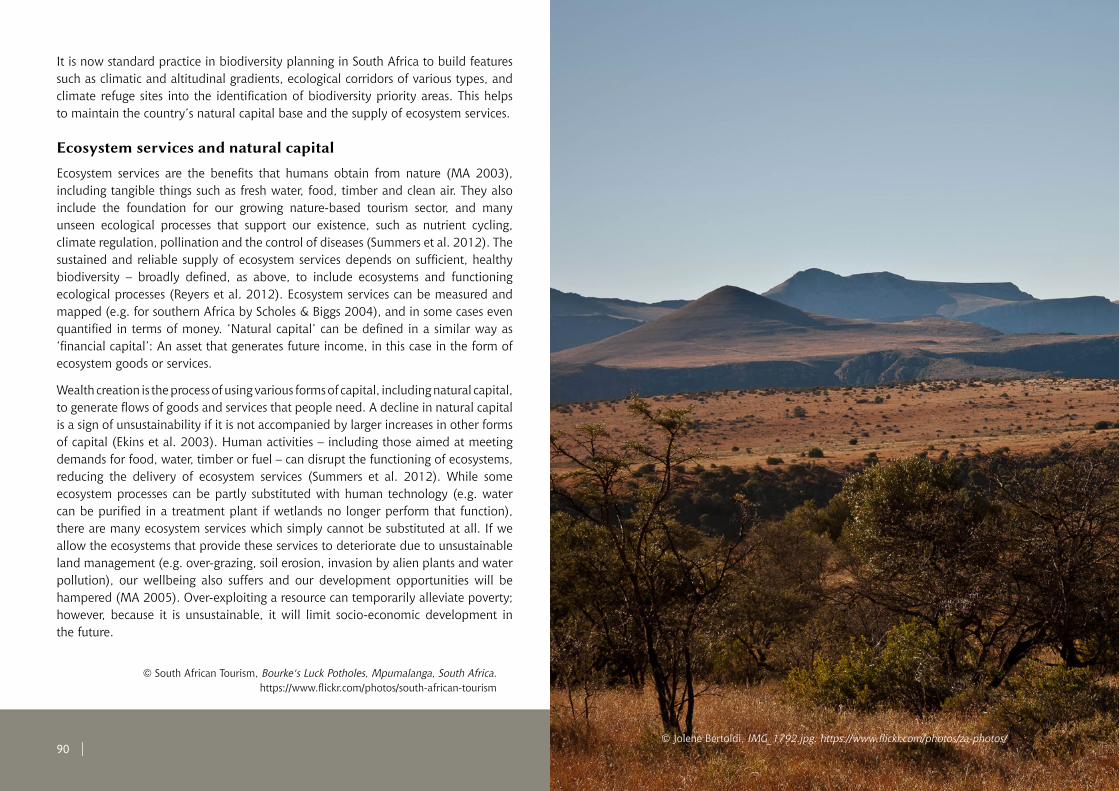
© South African Tourism, Bourke's Luck Potholes, Mpumalanga, South Africa. https://www.flickr.com/photos/south-african-tourism
© Jolene Bertoldi, IMG_1792.jpg. https://www.flickr.com/photos/za-photos/

Bob Scholes, Amanda Driver, Reinette Biggs and Greg Forsyth | 91
Case Study
Ecosystem services in the Little Karoo
The Little Karoo (see Figure 1) is a semi-arid biodiversity hot spot in the south-east part of South Africa’s Western Cape province (Reyers et al. 2009). Like in many other dry areas, the people living in this region face declining ecosystem services (MA 2005), threatened biodiversity, high unemployment, and deteriorating future social and economic options. The economy of the Little Karoo is mainly based on agriculture and tourism, both of which depend a great deal on ecosystem services. The key services in this region are the production of forage for domestic livestock, the capturing and storage of atmospheric carbon dioxide in vegetation and soils (which helps to mitigate climate change), erosion control, freshwater flow regulation, and offering a landscape that is attractive to tourism. It is self-evident that a disruption of these services negatively affects the livelihoods of all those who reside within the region.
Figure 1 The ecosystem service of carbon storage in the Little Karoo – one of several services
mapped and quantified in this area
The greatest relative negative change within the Little Karoo’s key ecosystem services, is in erosion control, while water flow regulation is still at over 80% of its potential (see Figure 2). Forage production, carbon storage and tourism view sheds have also declined by 28%, 27% and 25% respectively.
Figure 2 Changes in the supply of the five most important ecosystem services produced in the Little Karoo. Data labels indicate the current levels of ecosystem services as a percentage of the potential, prior to European settlement (Source: Reyers et al. 2009)
Over-grazing, together with the clearing of land to plant crops to supplement forage production, have been the main drivers of these declines in ecosystem services. This has mainly occurred in the lowlands and foothills, where land transformation has been more severe than in the high water-yielding, mountainous areas. Declines in the ecosystem services delivered in the Little Karoo match similar biodiversity losses in the area (Rouget et al. 2006; Gallo et al. 2009) – such declines tend to reduce the region’s resilience to economic and climatic shocks, such as droughts and floods.
Maintaining a sustainable Little Karoo requires that the condition of its natural capital be improved. Future land uses must promote maximum sustained water yields and quality, as well as the efficient use of water. In addition, actions taken to secure the water-related and climate-related ecosystem services (by restoring and conserving the natural vegetation) will also benefit biodiversity conservation and the wellbeing of people in the region.

CHAPTER 11 | Biodiversity Natural capital to bewisely used 92 |
ReferencesBiggs, R., Reyers, B. & Scholes, R.J. 2006. A biodiversity intactness score for South Africa. South African Journal of Science, 102(7/8): 277-283.
Biggs, R. & Scholes, R.J. 2007. Historical changes in natural capital in South Africa: An approach using changes in biodiversity In: S.J. Milton & J. Aronson (eds), Restoring natural capital in the 21st century. Emerging countries of the South. Washington, D.C.: Island Press.
Driver, A., Sink, K.J., Nel, J.L., Holness, S.H., van Niekerk, L., Daniels, F. et al. 2012. National biodiversity assessment 2011: An assessment of South Africa’s biodiversity and ecosystems. Synthesis report. South African National Biodiversity Institute and Department of Environmental Affairs, Pretoria.
Ekins, P., Simon, S., Duetsch, L., Folke, C. & de Groot, R. 2003. A framework for the practical application of the concepts of critical natural capital and strong sustainability. Ecological Economics, 44(2 3): 165-185.
Gallo, J.A., Pasquini, L., Reyers, B. & Cowling, R.M. 2009. The role of private
conservation areas in biodiversity representation and target achievement within the Little Karoo region, South Africa. Biological Conservation, 142(2): 446-454.
MA (Millennium Ecosystem Assessment). 2003. Ecosystems and human well-being: A framework for assessment. Washington, D.C.: Island Press.
MA (Millennium Ecosystem Assessment). 2005. Millennium ecosystem assessment synthesis report. Washington, D.C.: Island Press.
Midgley, G.F., Hannah, L., Millar, D., Rutherford, M.C. & Powrie, L.W. 2002. Assessing the vulnerability of species richness to anthropogenic climate change in a biodiversity hotspot. Global Ecology and Biogeography, 11(6): 445-451.
Midgely, G.F. 2011. In: C. Davis (ed), Biodiversity. South African risk and vulnerability atlas. Pretoria, South Africa: Council for Scientific and Industrial Research.
Nel, J.L., Driver, A., Strydom, W.F., Maherry, A., Petersen, C., Hill, L. et al. 2011. Atlas of freshwater ecosystem
priority areas in South Africa. WRC Report No.TT 500/11. Pretoria, South Africa: Water Research Commission.
Reyers, B., O’Farrell, P.J., Richard, M., Cowling, R.M., Egoh, B.N., le Maitre, D.C. et al. 2009. Ecosystem services, land cover change, and stakeholders: Finding a sustainable foothold for a semiarid biodiversity hotspot. Ecology and Society, 14(1): 38.
Reyers, B., Polasky, S., Tallis, H., Mooney, H.A. & Larigauderie, A. 2012. Finding common ground for biodiversity and ecosystem services. BioScience, 62(5): 503-507.
Rouget, M., Cowling, R.M., Vlok, J.H.J., Thompson, M. & Balmford, A. 2006. Getting the biodiversity intactness index right: The importance of habitat degradation data. Global Change Biology, 12: 2032-2036.
RSA (Republic of South Africa). 2010. National Protected Area Expansion Strategy 2008: Priorities for expanding the protected area network for ecological sustainability and climate change
adaptation. Pretoria, South Africa: Government Printer.
Scholes, R.J. & Biggs, R. 2004. Ecosystem services in South Africa: A regional assessment. Pretoria, South Africa: Council for Scientific and Industrial Research.
Scholes, R.J. & Biggs, R. 2005. A biodiversity intactness index. Nature, 434: 45-49.
Sink, K.J., Attwood, C.G., Lombard, A.T., Grantham, H., Leslie, R., Samaai, T. et al. 2011. Spatial planning to identify focus areas for offshore biodiversity protection in South Africa. Final Report for the Offshore Marine Protected Area Project. Pretoria, South Africa: South African National Biodiversity Institute.
Summers, J.K., Smith, L.M., Case, J.L. & Linthurst, R.A. 2012. A review of the elements of human well-being with an emphasis on the contribution of ecosystem services. AMBIO, 41: 327-340.
Thomas, C.D., Cameron, A., Green, R.E., Bakkenes, M., Beaumont, L.J., Collingham, Y.C. et al. 2004. Extinction risk from climate change. Nature, 427(6970): 145-148.