Embed Size (px)
Citation preview
BIODIVERSITY LOSS
By: Michelle Reaney
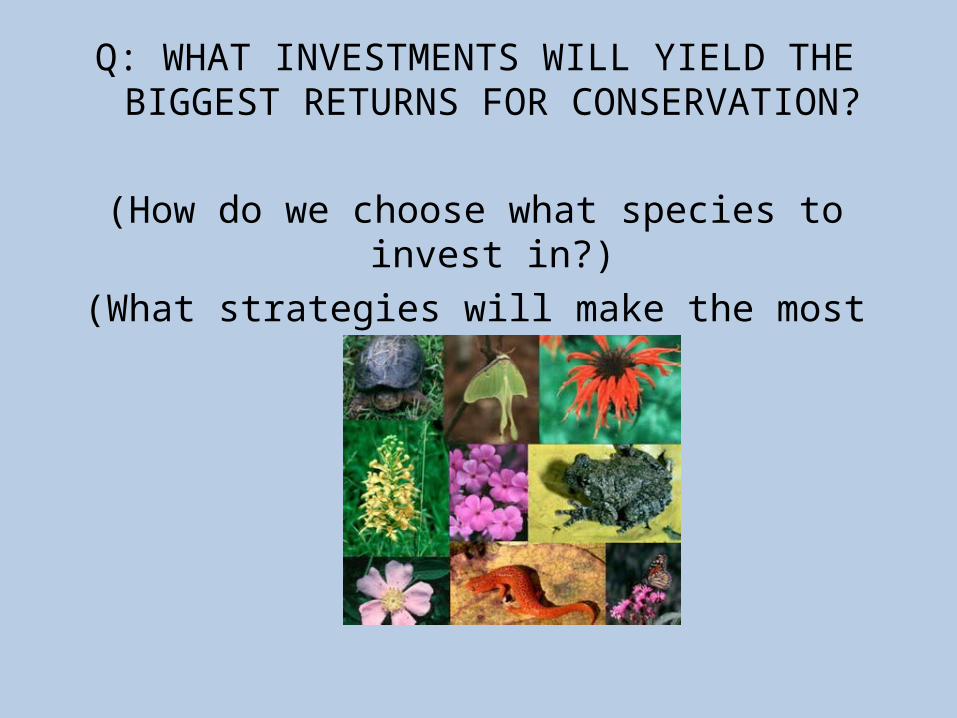
Q: WHAT INVESTMENTS WILL YIELD THE BIGGEST RETURNS FOR CONSERVATION?
(How do we choose what species to invest in?)(What strategies will make the most difference?)
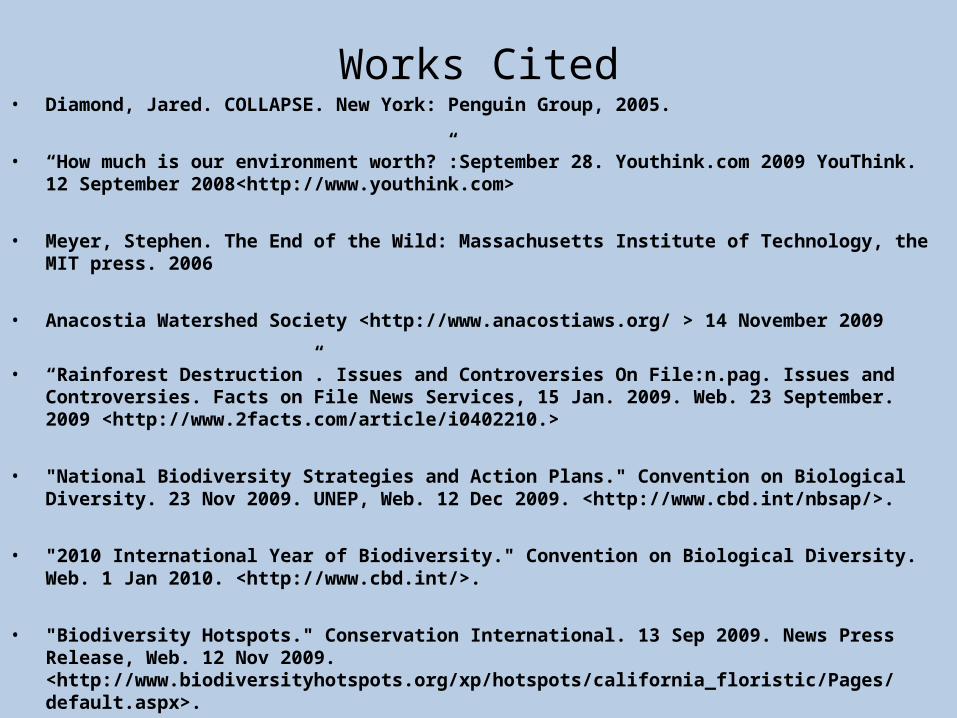
Works Cited• Diamond, Jared. COLLAPSE. New York: Penguin Group, 2005.
• “How much is our environment worth?”:September 28. Youthink.com 2009 YouThink. 12 September 2008<http://www.youthink.com>
• Meyer, Stephen. The End of the Wild: Massachusetts Institute of Technology, the MIT press. 2006
• Anacostia Watershed Society <http://www.anacostiaws.org/ > 14 November 2009
• “Rainforest Destruction”. Issues and Controversies On File:n.pag. Issues and Controversies. Facts on File News Services, 15 Jan. 2009. Web. 23 September. 2009 <http://www.2facts.com/article/i0402210.>
• "National Biodiversity Strategies and Action Plans." Convention on Biological Diversity. 23 Nov 2009. UNEP, Web. 12 Dec 2009. <http://www.cbd.int/nbsap/>.
• "2010 International Year of Biodiversity." Convention on Biological Diversity. Web. 1 Jan 2010. <http://www.cbd.int/>.
• "Biodiversity Hotspots." Conservation International. 13 Sep 2009. News Press Release, Web. 12 Nov 2009. <http://www.biodiversityhotspots.org/xp/hotspots/california_floristic/Pages/default.aspx>.
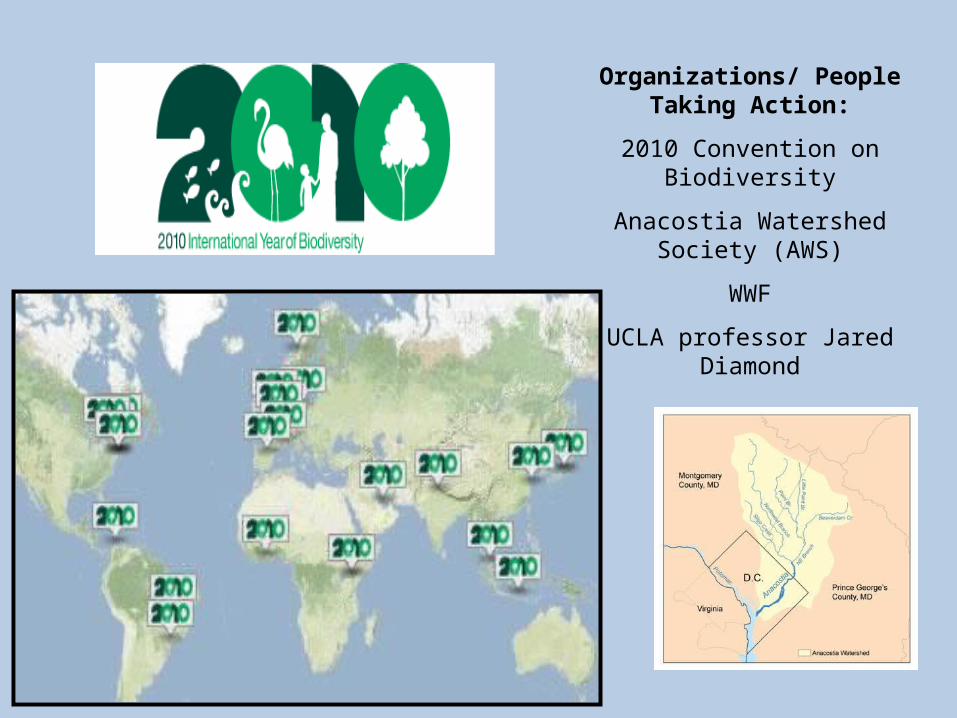
Organizations/ People Taking Action:
2010 Convention on Biodiversity
Anacostia Watershed Society (AWS)
WWF
UCLA professor Jared Diamond
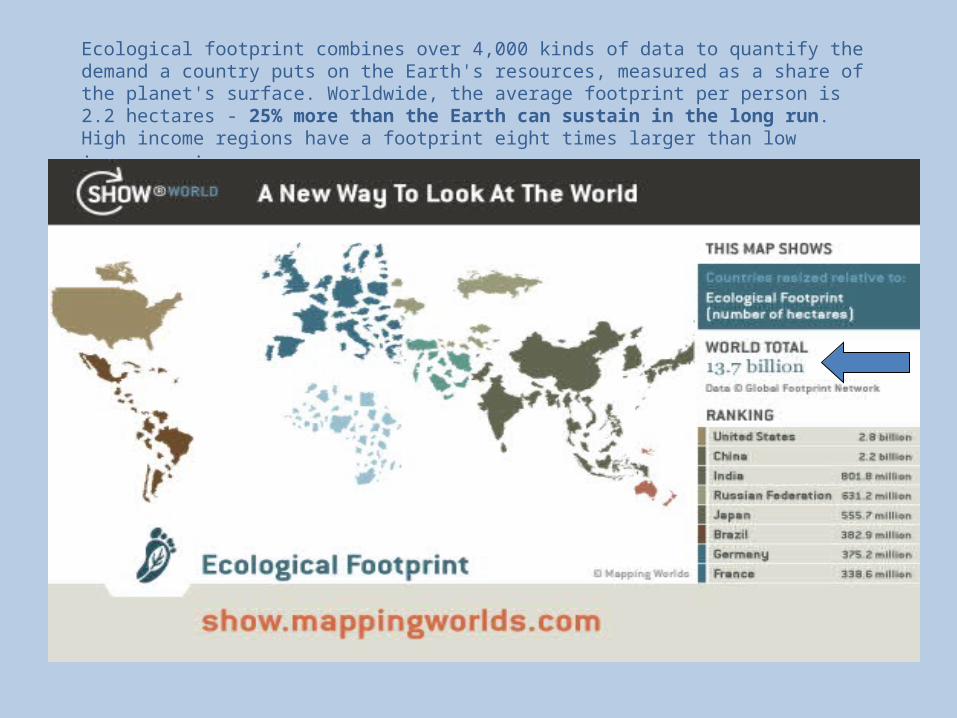
Ecological footprint combines over 4,000 kinds of data to quantify the demand a country puts on the Earth's resources, measured as a share of the planet's surface. Worldwide, the average footprint per person is 2.2 hectares - 25% more than the Earth can sustain in the long run. High income regions have a footprint eight times larger than low income regions.
1 Hectare= 10,000 square meters (2.471 acres)
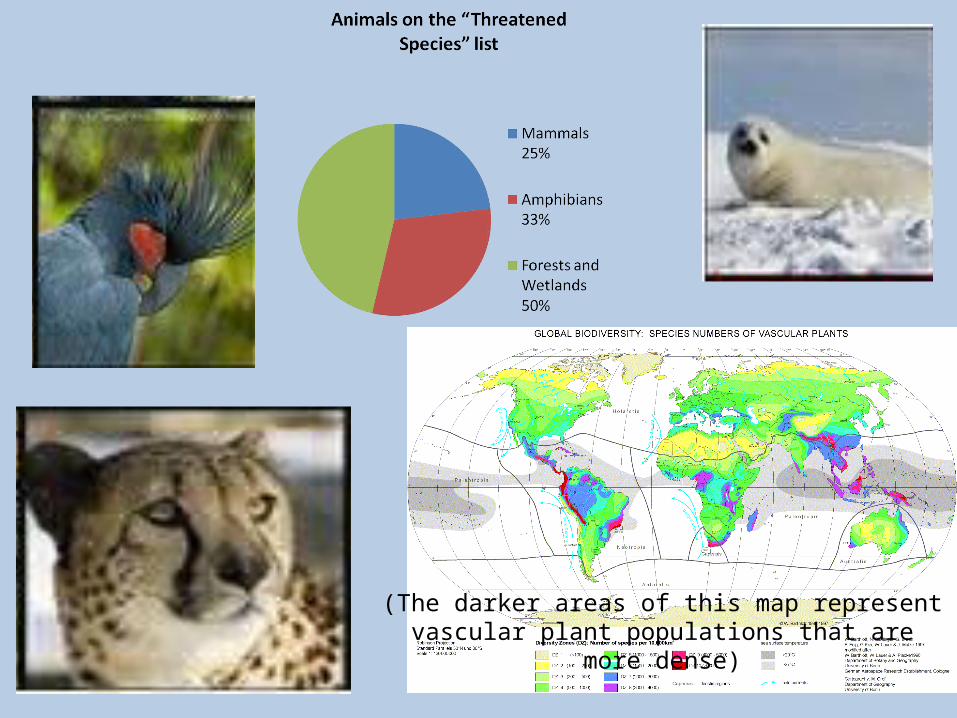
(The darker areas of this map represent vascular plant populations that are more dense)
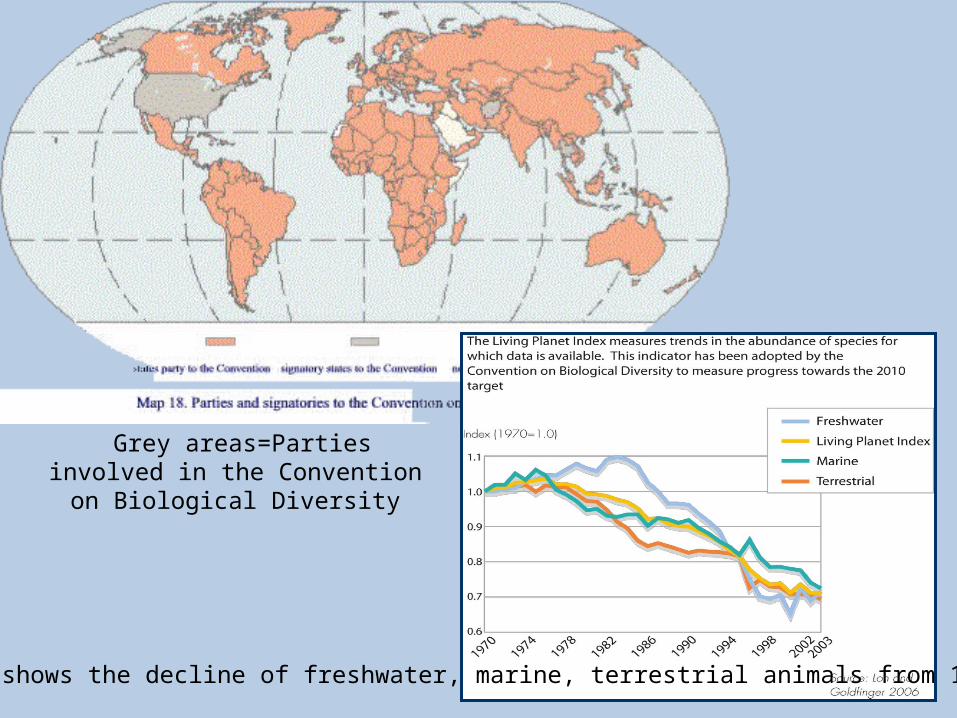
Grey areas=Parties involved in the Convention on Biological Diversity
This chart shows the decline of freshwater, marine, terrestrial animals from 1970-2003
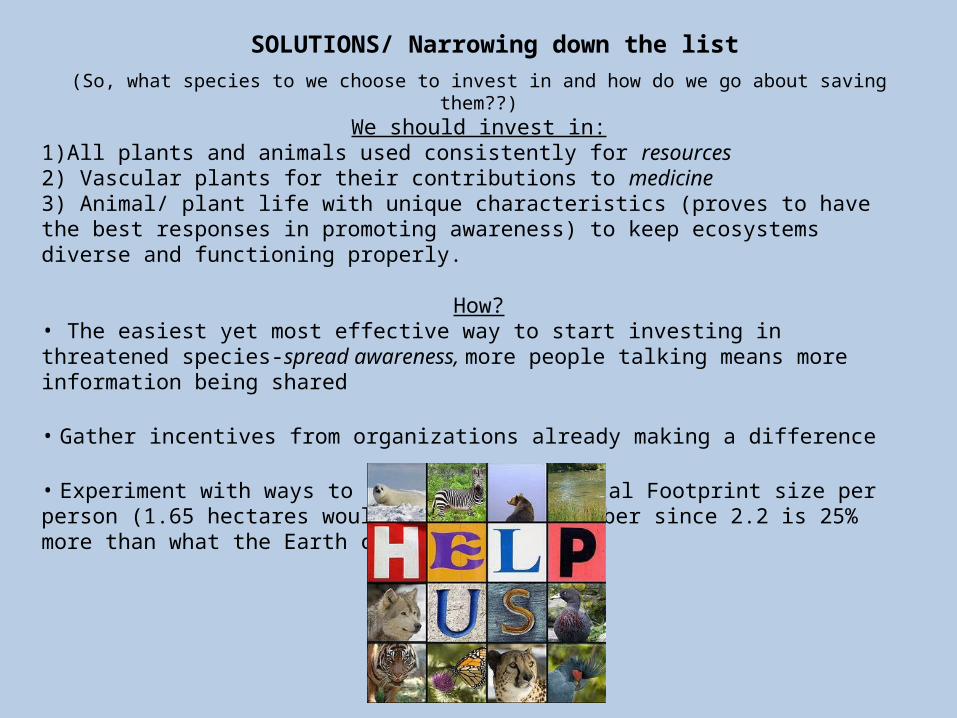
SOLUTIONS/ Narrowing down the list
(So, what species to we choose to invest in and how do we go about saving them??)We should invest in:
1)All plants and animals used consistently for resources2) Vascular plants for their contributions to medicine3) Animal/ plant life with unique characteristics (proves to have the best responses in promoting awareness) to keep ecosystems diverse and functioning properly.
How?• The easiest yet most effective way to start investing in threatened species-spread awareness, more people talking means more information being shared
• Gather incentives from organizations already making a difference
• Experiment with ways to reduce the Ecological Footprint size per person (1.65 hectares would be a healthy number since 2.2 is 25% more than what the Earth can sustain..


![Multimodal Communication in the Classroom: What …ccl.northwestern.edu/~michelle/Multimodal.pdf · Multimodal Communication in the Classroom: What does it mean for us? ... [7], an](https://img.pdfslide.us/doc/110x75/5b783f3e7f8b9a805c8ed442/multimodal-communication-in-the-classroom-what-ccl-michellemultimodalpdf.jpg)

![CASE UPDATES · Reaney v (1) University Hospital of North Staffordshire NHS Trust (2) Mid Staffordshire NHS Foundation Trust [2015] EWCA Civ 1119. Reaney: Care Needs C aged 61 contracted](https://img.pdfslide.us/doc/110x75/5f5c5e727216801820376ca8/case-updates-reaney-v-1-university-hospital-of-north-staffordshire-nhs-trust-2.jpg)