Embed Size (px)
Citation preview

Biodiversity and ecosystem services
Atlantic Forest and Global Change: Ecosystem
functioning along environmental gradients
Simone VieiraCarlos A. Joly, Luis Martinelli, Lu Alves, Marco Assis, Luis Bernacci, Jorge Tamashiro, Flavio dos Santos,
Andre Rochelle, Marcos Scaranello, Yvonne Bakker, Cinthia Silva, Luis Quimbayo, Rafael Ramos, Edson
Junior, Ataliba Alboin, Eliana Ramos, Valeria Martins, Juliano Van Mellis.........


Gradient:
Latitudinal
Longitudinal
Altitudinal

Gradiente:
Latitudinal
Longitudinal
Altitudinal

Gradiente:
Latitudinal
Longitudinal
Altitudinal
Sparovek et al. 2010

Gradiente:
Latitudinal
Longitudinal
Altitudinal
Sparovek et al. 2010 Ribeiro et al. 2009

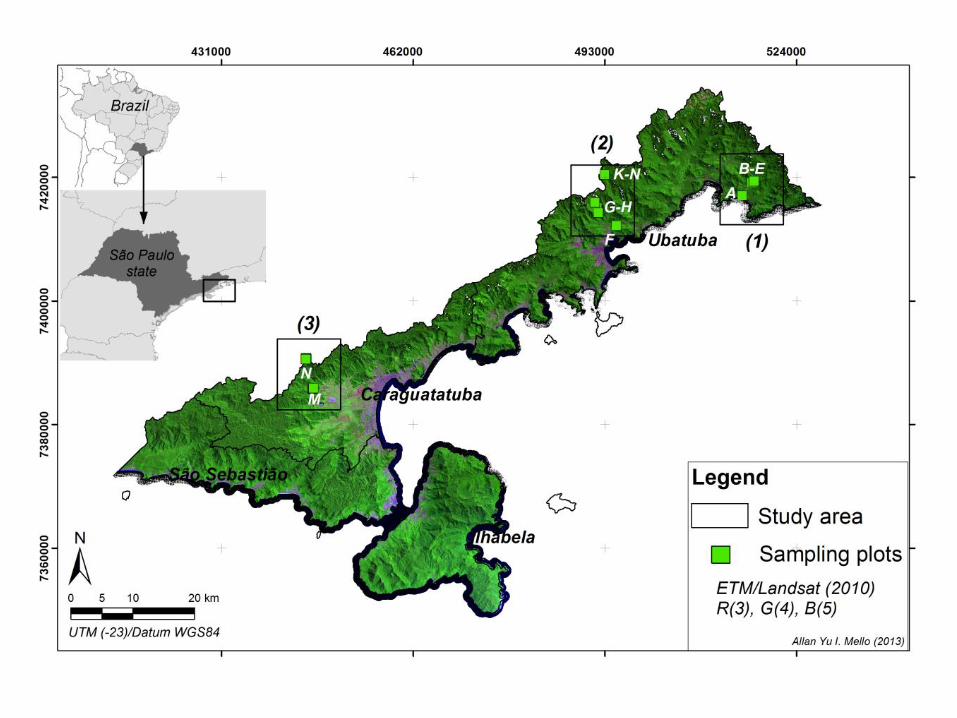
• 22 permanent plots (100x100 m)
• DBH ≥ 4.8 cm

◼ Restinga Forest
10 m a.s.l.


◼ Lowland
50 m a.s.l.

Lowland

AB
CD
EF
GH
IJ
K
0
3
6
9 320
330
340
350
360
370
380
390
400
m
topografia da parcela J - Capricórnio
1
2
3
4
5
6
7
8
9
10
11
S1
S2S3
S4S5
S6S7
S8S9
S10S11
80000
90000
100000
110000
120000
130000
Topografia da parcela F- Capricórnio
◼ Submontane

Submontane


Montane

~54000 stems sampled
~ 600 species
Species
Restinga
Lowland1
Lowland2
Lowland3
Submontane1
Submontane2
Submontane3
Submontane4
Montane1
Montane2

Species

Species

Species

350
300
250
200
150
100
50
0
50
100
150
200
Sea level
forest*
100 m 400 m 1,000 m Lowland
flooded
Lowland
Manaus
Lowland
Santarém
Atlantic Forest Amazon forest
To
tal a
bo
ve
an
d b
elo
w g
rou
nd
ca
rbo
n s
tora
ge
(Mg
C
ha
-1)
Site
Live Biomass Fallen and Standing CWD Litter layer Soil (0-100 cm) Root
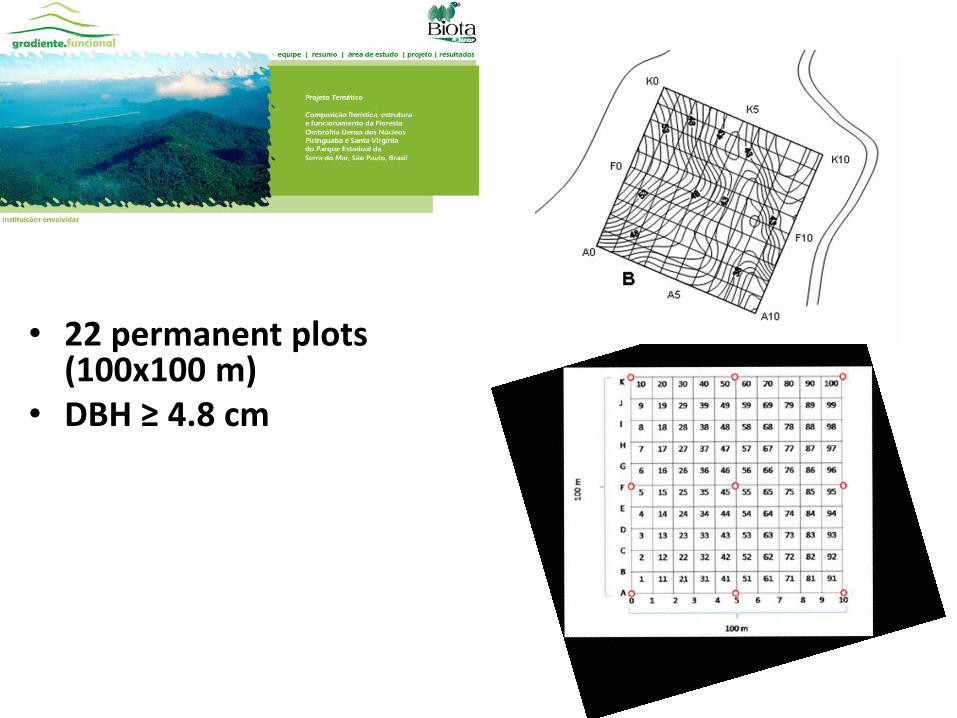
38%
28%
12%
10%
6%4%
1% 1%
Árvores
Solo
Galhos
Raizes Finas
Raizes grossas
Liteira Grossa
Folhas
Liteira Fina
Amazon
Atlantic Forest
28%
58%
1%
1%
6%4%
1%1%
Árvores
Solo
Galhos
Raizes Finas
Raizes grossas
Liteira Grossa
Folhas
Liteira Fina

Palm
~10 Mg ha-1Bamboo
~17 Mg ha-1
Fern
~1 Mg ha-1
Epiphytes
~3 Mg ha-1
Liana
~5 Mg ha-1
CWD
~16 Mg ha-1Fine Root
~10 Mg ha-1
Litterlayer
~2 Mg ha-1
~ 64 Mg ha-1

1,2
1,4
1,1
1,0
2,0
1,5
Restinga Lowland Submontane Montane
Tree growth rate along an altitudinal Atlantic Forest(mm year-1)

0,9
0,6
1,6
1,9
Restinga Lowland Submontane Montane
Carbon balance along an altitudinal gradient of Atlantic Forest
(Mg ha-1 year-1)

Carbon balance along an altitudinal gradient of Atlantic Forest
(Mg ha-1 year-1)
0,9
0,6
1,6
1,9
Restinga Lowland Submontane Montane

0,9
0,6
1,6
1,9
2,9
1,3
Restinga Lowland Submontane Montane
Carbon balance along an altitudinal gradient of Atlantic Forest
(Mg ha-1 year-1)


y = 1.4133x + 26.846R² = 0.7771
0
50
100
150
200
250
300
350
0 50 100 150 200 250
Liv
e B
iom
as
s (
Mh
ha
-1)
Number of Species (ha-1)
Altitudinal Gradient


0
20
40
60
80
100
120
1
20
39
58
77
96
11
5
13
4
15
3
17
2
19
1
21
0
22
9
24
8
26
7
28
6
30
5
32
4
34
3
36
2
38
1
40
0
41
9
43
8
45
7
47
6
49
5
51
4
53
3
55
2
57
1
59
0
60
9
62
8
64
7
66
6
Bio
ma
ss
(%
)
Species
Chrysophyllum viride
Hieronyma alchorneoides
Virola bicuhyba
Licania hoehnei
Sloanea guianensis
Guapira opposita
Eriotheca pentaphylla
Cryptocarya mandioccana
Micropholis crassipedicellata
Alchornea triplinervia
Ecclinusa ramiflora
Rustia formosa
Ocotea catharinensis
Virola gardneri
Calyptranthes strigipes
Calyptranthes lucida
Bathysa australis
Cupania oblongifolia
Terminalia januarensis
Pouteria psammophila
Hymenaea courbaril var. altissima
Myrcia brasiliensis
Alchornea glandulosa
Bathysa mendoncae
Top 20 moist dominat species by above ground woody biomass


Figura 1. Mapa com a localização das parcelas nos municípios de Cunha, São Luís do Paraitinga e Ubatuba nasdependências do PESM.
Undisturbed Forest
• Plots K, L, M.
Disturbed
• Plot N (selective logging)
• Plot T (secundary forest);
• Parcela R (initial secundary forest).
Cunha
Natividade da
Serra
São Luís do Paraitinga
Ubatuba
R
T
L
KM
N
Parati


0
20
40
60
80
100
120
140
160
180
200
Connected Isolated Connected Isolated
Large Small
Bio
ma
ss
(M
g h
a-1
)
Core Edge

ECOFOR in Ubatuba area - history
Caraguatatub
2014
ECOFOR
8 0.25ha plots in Cunha
1-ha in S.L.P
64 0.25-ha fragments S.L.P.
area
Detailed carbon cycling 6 1-ha
plots along forest disturbance
gradient
and trait data in 14 fragments
and 4 1-ha plots

ECOFOR in Ubatuba area - history
Caraguatatub
2014
ECOFOR
8 0.25ha plots in Cunha
1-ha in S.L.P
64 0.25-ha fragments S.L.P.
area
Detailed carbon cycling 6 1-ha
plots along forest disturbance
gradient
and trait data in 14 fragments
and 4 1-ha plots

ECOFOR in Ubatuba area - history
Caraguatatub
2014
ECOFOR
8 0.25ha plots in Cunha
1-ha in S.L.P
64 0.25-ha fragments S.L.P.
area
Detailed carbon cycling 6 1-ha
plots along forest disturbance
gradient
and trait data in 14 fragments
and 4 1-ha plots

ECOFOR in Ubatuba area - history
Caraguatatub
2014
ECOFOR
8 0.25ha plots in Cunha
1-ha in S.L.P
64 0.25-ha fragments S.L.P.
area
Detailed carbon cycling 6 1-ha
plots along forest disturbance
gradient
and trait data in 14 fragments
and 4 1-ha plots

ECOFOR in Ubatuba area - history
Caraguatatub
2014
ECOFOR
8 0.25ha plots in Cunha
1-ha in S.L.P
64 0.25-ha fragments S.L.P.
area
Detailed carbon cycling 6 1-ha
plots along forest disturbance
gradient
and trait data in 14 fragments
and 4 1-ha plots

ECOFOR in Ubatuba area - history
Caraguatatub
2014
ECOFO
R
8 0.25ha plots in Cunha
1-ha in S.L.P
64 0.25-ha fragments S.L.P.
area
Detailed carbon cycling 6 1-ha
plots along forest disturbance
gradient
and trait data in 14 fragments
and 4 1-ha plots

ECOFOR in Ubatuba area - history
Caraguatatub
2014
ECOFOR
8 0.25ha plots in Cunha
1-ha in S.L.P
64 0.25-ha fragments S.L.P.
area
Detailed carbon cycling 6 1-ha
plots along forest disturbance
gradient
and trait data in 14 fragments
and 4 1-ha plots

2007-2009 2009-2012
2012-2015 2015-2016
3.1 0.8
-2.1 -2.0
4.4 -0.7
-1.9 -7.6