Embed Size (px)
Citation preview


Biochemie
Expression, purification and characterization of
hMRP3 in heterologous host Pichia pastoris
Inaugural–Dissertation
zur Erlangung des Doktorgrades
der Naturwissenschaften
in der NRW Graduate School of Chemistry
im Fachbereich Chemie und Pharmazie
der Mathematisch–Naturwissenschaftlichen Fakultät
der Westfälischen Wilhelms-Universität Münster
vorgelegt von
Prachee Bele
aus Bhainsa, Indien
-2013-

Dekan: Prof. Dr. B. J. Ravoo
Erster Gutachter: Prof. Dr. H.-J. Galla
Zweiter Gutachter: Prof. Dr. K.-H. Klempnauer
Tag der mündlichen Prüfung:
Tag der Promotion:
15.05.2013
15.05.2013

Amit and my both families


Abstract
Multidrug resistance (MDR) is often the major cause for the failure of chemotherapy
against cancers. Though the cancer cells can achieve MDR through various
mechanisms, most common among them is the drug efflux mediated by ATP-binding
cassette (ABC) transporters which utilizes energy derived from adenosine
triphosphate (ATP) for the transport. These ABC transporters are ubiquitous and are
involved in many physiological functions in various organisms. They also transport a
diverse range of substrates across different cellular membranes. Some of these
transporters have been found to be overexpressed in various cancer cell lines when
treated with anticancer drugs. Multidrug resistance protein 3 (MRP3) is one of such
ABC transporter in humans. This thesis aimed to characterize this transporter with
respect to the functions of its different domains and the transport mechanism.
Therefore various truncated versions of the protein lacking one or more of its
functional and structural domains were designed.
The transporter and its different truncated versions were successfully
overexpressed into the yeast Pichia pastoris for their characterization. For
purification, a poly-His tail and a Strep tag were incorporated in the recombinant
proteins. It is shown here for the first time that the MRP3 transporter can
successfully be expressed even after removal of TMD0 and the linker region L0 in
yeast. The purification of the full transporter was analyzed on different affinity
columns. While the binding and elution on the Ni-NTA column was successful, the
purity of the protein was not sufficient for further reconstitution experiments to
analyze the transport activity. Further purification on Strep-tactin and Reactive Red
column led to insufficient results.
The protein was unable to bind to the Strep-tactin column efficiently in its native or
denatured state irrespective of the position of the tag. Though the protein was
binding to the Reactive Red column, it could not be eluted even with high
concentrations of salts. These results suggest that the choice of affinity tag for the
heterologous expression and purification of the protein is of prime importance and
the binding of the tag to the column material may vary from protein to protein.

The present thesis demonstrates the successful expression of the MRP3 and its
truncated versions in yeast. Membrane vesicles prepared from these expressing
clones can be used to study the transport and ATPase activities of the full
transporter and its truncated versions. The results obtained from such activity
measurements can be useful in understanding the role of TMD0 and L0 in the drug
specificity and the activity of the protein. However such a system of measurements
needs to be optimized.
In conclusion, this study has demonstrated a successful expression of truncated
versions of MRP3 in yeast for the first time and opened the doors for further
characterization of the protein.
Contents I
Contents
1 Introduction .................................................................................................. 1
1.1 ABC transporters ........................................................................................... 2
1.1.1 Structure of ABC transporters ................................................................................. 4
1.1.2 Mechanism of substrate transport by ABC transporters .............................. 6
1.1.3 ABC superfamily in humans ..................................................................................... 9
1.1.4 The ABCC (MRP) family............................................................................................ 12
1.1.4.1 Structure of ABCC family proteins .............................................................. 12
1.1.4.2 Physiological role of ABCC family proteins .............................................. 14
1.1.5 The human ABCC3 (MRP3) transporter ............................................................ 15
1.1.6 Transport mechanism of ABCC3 ........................................................................... 16
1.2 Heterologous expression of proteins ................................................... 19
1.2.1 Prokaryotic expression system ............................................................................. 19
1.2.2 Eukaryotic expression systems ............................................................................. 20
1.2.2.1 Mammalian cells ................................................................................................. 20
1.2.2.2 Insect cells............................................................................................................. 21
1.2.2.3 Yeast ........................................................................................................................ 21
1.3 Expression in the yeast P. pastoris ........................................................ 23
1.3.1 Autonomously replicating pPicholi vector ....................................................... 24
1.3.2 Genome integrating pPICZ vector ........................................................................ 25
1.4 Artificial liposomes as a tool for transport studies ......................... 26
2 Objectives of the project ......................................................................... 27
3 Results and Discussion ............................................................................ 29
3.1 Cloning and expression of hMRP3 using autonomously
replicating pPicholi vector .................................................................................. 29
3.1.1 Aims and rationale ..................................................................................................... 29
3.1.2 Results ............................................................................................................................. 30
3.1.2.1 Vector and hMRP3 sequence modification .............................................. 30

II Contents
3.1.2.2 Amplification of insert and ligation into the vector .............................. 32
3.1.2.3 Transformation into P. pastoris and expression analysis of all
constructs .................................................................................................................... 34
3.1.2.4 Expression of MRP3 construct 2 on small and large scale ................. 38
3.1.3 Discussion ...................................................................................................................... 40
3.2 Expression and purification of hMRP3 using genome integration
method ....................................................................................................................... 43
3.2.1 Expression and purification using C-terminal purification tag ................ 43
3.2.1.1 Aims and rationale ............................................................................................. 43
3.2.1.2 Results .................................................................................................................... 44
3.2.1.2.1 Linearization, genome integration of the pPicholi vector and
selection of MRP3 expressing clones...................................................... 44
3.2.1.2.2 Large scale fermentation of clone 1000-1 ............................................ 46
3.2.1.2.3 Isolation, Solubilization and purification on Ni-NTA column ....... 47
3.2.1.2.4 Purification on Strep-tactin column ........................................................ 48
3.2.1.2.5 Purification of a control protein on Strep-tactin column ................ 49
3.2.1.2.6 Purification on Strep-tactin column after removal of His tag ....... 51
3.2.1.2.7 Purification on Strep-tactin column after mild denaturation by
SDS ....................................................................................................................... 53
3.2.1.3 Discussion ............................................................................................................. 54
3.2.2 Expression and purification using N and C-terminal purification tags . 59
3.2.2.1 Aims and rationale ............................................................................................. 59
3.2.2.2 Results .................................................................................................................... 60
3.2.2.2.1 Modification of pPICZ A vector and ligation of MRP3 gene
sequences into new vector ......................................................................... 60
3.2.2.2.2 High throughput screening of P. pastoris clones for expression of
MRP3 ................................................................................................................... 61
3.2.2.2.3 High throughput screening of P. pastoris clones for expression
truncated versions of MRP3 ....................................................................... 62
3.2.2.2.4 Large scale fermentation and purification of clone 100-5 on Ni-
NTA column ...................................................................................................... 64
3.2.2.2.5 Purification on Strep-tactin column ........................................................ 66

Contents III
3.2.2.2.6 Purification on Strep-tactin column after mild denaturation ....... 66
3.2.2.2.7 Purification on different Strep-tactin resins and detection of Strep
tag II with antibody ....................................................................................... 68
3.2.2.2.8 Purification on Reactive red column ...................................................... 69
3.2.2.3 Discussion ............................................................................................................. 70
4 General discussion ................................................................................... 75
5 Experimental .............................................................................................. 79
5.1 Cell Biology .................................................................................................... 79
5.1.1 Pichia pastoris .............................................................................................................. 79
5.1.1.1 Cell culturing and induction .......................................................................... 79
5.1.1.2 Competent cell Preparation ........................................................................... 80
5.1.1.2.1 Conventional Protocol .................................................................................. 80
5.1.1.2.2 Condensed Protocol ...................................................................................... 81
5.1.1.3 Transformation ................................................................................................... 82
5.1.1.4 Cell storage ........................................................................................................... 82
5.1.2 Escherichia coli ............................................................................................................. 82
5.1.2.1 Cell culturing ........................................................................................................ 82
5.1.2.2 Competent cell preparation ........................................................................... 83
5.1.2.3 Transformation ................................................................................................... 83
5.1.2.4 Cell storage ........................................................................................................... 84
5.2 Molecular Biology ........................................................................................ 85
5.2.1 Isolation of plasmid-DNA from E.coli .................................................................. 85
5.2.2 Isolation of genomic DNA from P. pastoris ....................................................... 85
5.2.3 Quantification of nucleic acids ............................................................................... 86
5.2.4 Enzymatic Restriction of DNA ............................................................................... 86
5.2.5 Agarose gel electrophoresis ................................................................................... 87
5.2.6 Extraction of DNA from agarose gel .................................................................... 88
5.2.7 Cleaning of DNA for ligation ................................................................................... 89
5.2.7.1 Using a commercial cleaning kit ................................................................... 89
5.2.7.2 Precipitation with sodium acetate and ethanol ..................................... 89

IV Contents
5.2.8 Ligation ........................................................................................................................... 90
5.2.9 PCR methods ................................................................................................................. 90
5.2.9.1 Preparatory PCR reactions ............................................................................. 91
5.2.9.2 Analytical PCR reactions ................................................................................. 92
5.2.10 Site-Directed Mutagenesis....................................................................................... 94
5.2.11 DNA sequencing .......................................................................................................... 95
5.2.12 Annealing and Phosphorylation of oligonucleotides .................................... 95
5.4 Protein biochemistry ................................................................................. 97
5.4.1 Small scale preparation of microsomes from P. pastoris ............................. 97
5.4.2 High throughput screening of P. pastoris clones for protein expression ...
............................................................................................................................................ 98
5.4.3 Determination of protein concentrations ......................................................... 98
5.4.3.1 Absorbance Assay (280 nm) .......................................................................... 98
5.4.3.2 Bradford assay .................................................................................................... 99
5.4.3.3 Bichinchoninic acid solution (BCA) test ................................................. 100
5.4.4 SDS-Polyacrylamide gel electrophoresis ........................................................ 101
5.4.5 Protein staining ........................................................................................................ 103
5.4.5.1 Coomassie staining ......................................................................................... 103
5.4.5.1.1 Gel staining .................................................................................................... 103
5.4.5.1.2 Membrane staining ..................................................................................... 104
5.4.5.2 Silver staining ................................................................................................... 104
5.4.6 Western blot .............................................................................................................. 105
5.4.7 Proteolytic cleavage of peptides ........................................................................ 107
5.4.7.1 Cleavage by 3C protease ............................................................................... 107
5.4.7.2 Cleavage by Factor Xa .................................................................................... 109
5.5 Large scale fermentation, Protein Isolation and purification ... 110
5.5.1 Large scale fermentation of P. pastoris ............................................................ 110
5.5.2 Preparation of microsomes from P. pastoris ................................................. 113
5.5.2.1 Disruption using BeadBeaterTM ................................................................. 114
5.5.2.2 Disruption using Emulsifier ........................................................................ 114
5.5.2.3 Centrifugation after mechanical disruption ......................................... 115
5.5.3 Solubilization of microsomal membrane vesicles ....................................... 116

Contents V
5.5.4 Ni (II)-NTA Affinity Chromatography .............................................................. 117
5.5.4.1 Purification on small scale ........................................................................... 118
5.5.4.2 Purification on large scale ........................................................................... 119
5.5.4.3 Regeneration of Ni (II) NTA column ........................................................ 120
5.5.5 Strep tag II Affinity Chromatography .............................................................. 121
5.5.6 Purification on Reactive red columns .............................................................. 122
6 Appendix ................................................................................................... 125
6.1 Abbreviations ............................................................................................. 125
6.2 Materials and devices .............................................................................. 128
6.3 Clone charts ................................................................................................ 131
6.3.1 Modified and Unmodified pPicholi vector ..................................................... 131
6.3.2 Map of the pGEM7-MRP3 vector........................................................................ 133
6.3.3 Modified and Unmodified pPICZ A vector ...................................................... 134
6.4 Bacterial and yeast strains used in the project .............................. 136
6.4.1 Escherichia coli .......................................................................................................... 136
6.4.2 Pichia pastoris ........................................................................................................... 136
6.5 Figure captions .......................................................................................... 138
6.6 Sequence of hMRP3 used for cloning and expression .................. 141
6.7 Primer sequences ..................................................................................... 148
7 References ................................................................................................ 150


Introduction 1
1 Introduction
Cell membranes are important for the life of the cell; it not only encloses the cell and
defines its boundaries but also maintains the differences between the cytosol and
the extracellular environment which is essential for its functions. (Bruce Alberts
2002) The hydrophobic lipid membranes play a key role in the integrity of the cells
by limiting the movement of substances across the living cells. However transport of
specific substances across this barrier is essential for the survival of the cells. For
this purpose, membranes have specialized proteins associated with the membrane
transport systems. These transport systems allow uptake of specific molecules and
removal of unwanted compounds from the cell. Such transport systems render the
membranes selectively permeable for the substances (Jeremy M Berg 2002).
Depending on the characteristics of the substance being transported and the
direction of transport, there are two principal mechanisms by which molecules can
pass though the boundary of cellular membranes. The transport mechanisms are
passive (by simple diffusion or facilitated diffusion) and active transport.
a. Simple diffusion
Simple diffusion is the spontaneous movement of a substance down its concentra-
tion gradient from higher to lower concentration. In simple diffusion, small non
charged molecules or lipid soluble hydrophobic molecules pass between the
membrane lipids to enter or leave the cell, moving from areas of high concentration
to low concentration. Small molecules like oxygen, nitrogen, carbon dioxide and
most hydrophobic compounds are transported across the membrane by simple
diffusion (Jeremy M Berg 2002).
b. Facilitated diffusion
Passive diffusion is a very slow process and hence not efficient enough for the
transport of many substances across the lipid membranes which are necessary to
sustain life processes (Reginald H. Garrett 2010). Therefore, transport of inorganic

2 Introduction
ions and small water-soluble organic molecules across the lipid bilayer is achieved
by specialized transmembrane proteins called ‘Channels’. These channels provide an
alternative path through the bilayer for specific solutes and transport them down
their concentration gradient.
In both, simple and facilitated diffusion the transport is driven solely by the
concentration (or electrochemical) gradient, therefore no metabolic energy is
required for both the processes (Bruce Alberts 2002).
c. Active transport
Simple and facilitated diffusion transport the substances down their concentration
gradient. But in order to maintain this concentration gradient across the membranes
and drive many cellular processes, molecules sometimes have to be transported
against their concentration gradient (from low to high concentration). To carry out
this type of transport, an external energy source is required. Thus referred to as
active transport (David L. Nelson 2008).
In active transport, movement of molecules across membranes is mediated by
specialized membrane proteins that are known as transporters. These transporters
are further divided into different families and classes, based on the nature of
transport, the substrates and the source of energy utilized to drive the transport.
Although this energy can come from various sources like electron movement or
from light, the most common energy input is ATP hydrolysis (Reginald H. Garrett
2010).
One of the largest protein families of integral membrane proteins that utilize the
energy of ATP hydrolysis to translocate solutes across cellular membranes is formed
by the ATP-binding cassette (ABC) transporters.
1.1 ABC transporters
ATP-binding cassette (ABC) transporters are a large superfamily of membrane
proteins which includes a variety of active transporters with diverse functions
(Higgins 1992). They are ubiquitous in biology and power the translocation of large

Introduction 3
number of structurally different substrates across the membrane using the energy
derived from ATP hydrolysis.
ABC transporters are widespread in archaea, eubacteria and eukaryotes and play a
wide variety of physiological roles in all species of living organisms such as
maintenance of osmotic homeostasis, nutrient uptake, resistance to xenotoxins,
antigen processing, cell division, bacterial immunity, pathogenesis and sporulation,
cholesterol and lipid trafficking and in the development of stem cells (Jones and
George 2004). Apart from these physiological roles, ABC transporters are also
associated with a variety of clinical problems such as cystic fibrosis (a chronic, life-
threatening lung disease) and multidrug resistance (resistance to chemotherapy
drugs) (Higgins 1992).
The designation ‘ABC transporter’ recognizes a highly conserved ATP-binding
cassette, which is the most characteristic feature of this superfamily. These
transporters function as either importers or exporters. The importers bring
necessary nutrients and other molecules into cells whereas the exporters pump
toxins, drugs and lipids outside across membranes. Whereas exporters are found in
both eukaryotes and prokaryotes, importers seem to be present exclusively in
prokaryotic organisms (Rees, Johnson et al. 2009).
Recently, two ABC transporters in yeast associated with transport of sterols were
shown to promote either influx or efflux of a cholesterol derivative depending on the
sterol context of the cell. This is a rare example of an ABC transporter mediating bi-
directional transport, suggesting that direction of transport is not a static inherent
property of the transporter, but rather that it is mutable and influenced by
surrounding sterols and proteins (Gulati 2011).
Although most of the ABC transporters exhibit relatively tight substrate specificity,
some are multispecific. The oligopeptide transporter for example, handles
essentially all di- and tripeptides (Tame, Murshudov et al. 1994) while others have
an extremely broad specificity for hydrophobic compounds, such as the multidrug
transporter LmrA from Lactococcis lactis (van Veen, Callaghan et al. 1998).

4 Introduction
1.1.1 Structure of ABC transporters
Despite the large variety of substrates and physiological processes in which they are
involved, ABC transporters comprise a conserved core structure of two highly
hydrophobic transmembrane domains (TMDs) and two ATP-binding cassettes
(ABCs), also commonly known as nucleotide-binding domains (NBDs). The TMDs
normally consists of six membrane-spanning segments and the NBDs are
peripherally located at the cytoplasmic face of the membrane. In prokaryotes, four
separate subunits usually provide the four domains, whereas in higher organisms
these domains are normally fused together (Schmitt and Tampe 2002).
Eukaryotes only have ABC transporters that are involved in the export of substrates,
which commonly have a single polypeptide for the core structure with each NBD
being C-terminal localized to each TMD. Exceptions to this scheme are the half-
transporters found in both prokaryotes and eukaryotes. In these half transporters
TMD is fused covalently to either C- or N-terminus of the NBD. The complete core
structure for half-transporters can be homo- or heterodimers or sometimes a higher
order oligomer. (Jones and George 2004).
In prokaryotic ABC importers, the vital function of substrate translocation is carried
out by a high-affinity binding protein. This protein specifically associates with the
ligand in the periplasm for delivery to the appropriate ABC transporter. (Figure 1-1)
(Ames 1986). These binding proteins are released following an osmotic shock.
(Heppel 1969)
Apart from this typical four domain structure, sometimes additional elements can
fuse to the TMDs and/or NBDs of ABC transporters. The exact function of these extra
domains is mostly unclear. Most of them are believed to be associated with some
regulatory functions (Biemans-Oldehinkel, Doeven et al. 2006).

Introduction 5
Figure 1-1: Molecular architecture of ABC transporters. A schematic representation of ATP-binding cassette (ABC) transporters, which are composed of two transmembrane domains (TMDs) and two ABC domains (or nucleotide-binding domains). The binding protein component that is required by importers is also shown. Two conformational states of the ABC transporter — outward facing and inward facing, with the substrate-binding site orientated towards the periplasmic (extracellular) and cytoplasmic (intracellular) regions, respectively — are depicted to show the alternating access mechanism of transport.(Rees, Johnson et al. 2009)
The NBDs can be further divided into two constituent domains: a catalytic core
domain and a more structurally diverse α-helical domain. The NBDs of all the ABC
transporters irrespective of their origin, function and substrate share extensive
amino acid sequence similarities and several conserved motifs. The catalytic core
domain contains the conserved P-loop or Walker A motif (GXXGXGK(S/T) where X
could be any amino acid residue), a Walker B motif (ϕϕϕϕD, of which ϕ is a
hydrophobic residue), a Q-loop and an H-motif (or switch region). The α-helical
domain contains a conserved LSGGQ sequence also known as “C” signature motif
which is characteristic for the ABC ATPases. (Higgins and Linton 2004; Deeley,
Westlake et al. 2006; Rees, Johnson et al. 2009)
Unlike the NBDs, TMDs of the ABC transporters are not conserved. The primary
sequences of ABC transporter TMDs are markedly variable compared to those of the
NBDs. These membrane spanning α helical segments provide a translocation
pathway through which the substrate crosses the membrane. Due to their variable
sequences, these domains are also believed to be involved in the substrate binding of

6 Introduction
the transporter, which explains the enormous substrate diversity of the ABC
transporters. (Higgins 1992)
Using the experimental data available for a number of ABC transporter studies and
different computer-assisted algorithms, the topology of a typical ABC transporter is
predicted. (Figure 1-2)
Figure 1-2: The schematic representation of structure of a typical ABC transporter predicted using different computer-assisted algorithms. Most of the transporters consist of two membrane associated domains called as transmembrane domains (TMDs) with six membrane-spanning regions each followed by a cytoplasmic nucleotide binding domain (NBDs). Each NBD has several highly conserved motifs, which include the Walker A motif (GXXGXGKS/T), involved in the phosphate-binding, Walker B motif (ϕϕϕϕD, where ‘ϕ’is a hydrophobic residue) which maintains the geometry of the active site and a highly conserved ‘‘LSGGQ’’ signature sequence or C-motif, involved in ATP hydrolysis. (Deeley, Westlake et al. 2006).
Because of these structural similarities, it is generally assumed that all ABC
transporters bind and hydrolyze ATP in a similar fashion and use a common
mechanism to power the translocation of the substrate though the transmembrane
domains.
1.1.2 Mechanism of substrate transport by ABC transporters
In recent years, the ABC transporter research has gained high attention and the
number of ABC transporters studied is drastically increasing. In spite of all the
practical difficulties working with membrane proteins, crystallographic structures of
many ABC transporters have been solved and many biochemical assays have been
designed to study their transport mechanism.

Introduction 7
Following the crystallographic structure and the biochemical studies many
predictions have been made for the mechanism of transport. Some of these
predictions are further supported by concrete experimental evidences and have
helped to propose a model for substrate transport.
Different models have been proposed for the transport mechanism of various ABC
transporters studied so far. All of them share some common predictions owing to
the structural similarities of all ABC transporters.
The TMDs form the membrane spanning channel and are thought to contain the
substrate binding sites, while the NBDs are molecular motors which drive the
transport by transforming the chemical potential energy of ATP into protein
conformational changes.
The Walker A motif (GXXGXGKS/T) is involved in the phosphate-binding (hence
called P-loop). This glycine rich loop is generally followed by an uncapped α helix.
This structure binds the triphosphate moiety of ATP through electrostatic
interactions. Walker B motif (ϕϕϕϕD, where ‘ϕ’ s a hydrophobic residue) assists in
establishing and maintaining the geometry of the active site as the highly conserved
aspartate residue at its C-terminus coordinates with the catalytic Mg2+ ion. Other
ABC motifs like LSGGQ (C motif), Q-loop and the H-motif are known to coordinate
with the bound nucleotide; their precise role in the transport mechanism is unclear.
(Higgins and Linton 2004; Jones and George 2004)
In a typical ABC transporter, the two NBDs assemble such that the Walker A (P-
loops) of one NBD and the LSGGQ motif of the other come closer and generate two
ATP binding and hydrolysis sites. In the absence of a nucleotide, there is a gap at the
domain interface and the nucleotide binding sites are accessible to free water
molecules. When ATP is bound, the interface closes and the nucleotides are
sandwiched between the NBDs. The gap between the NBD closes, which brings the
coupling helices closer together. As a consequence, the TMDs are transformed from
a facing inward to a facing outward conformation (Figure 1-3).
8 Introduction
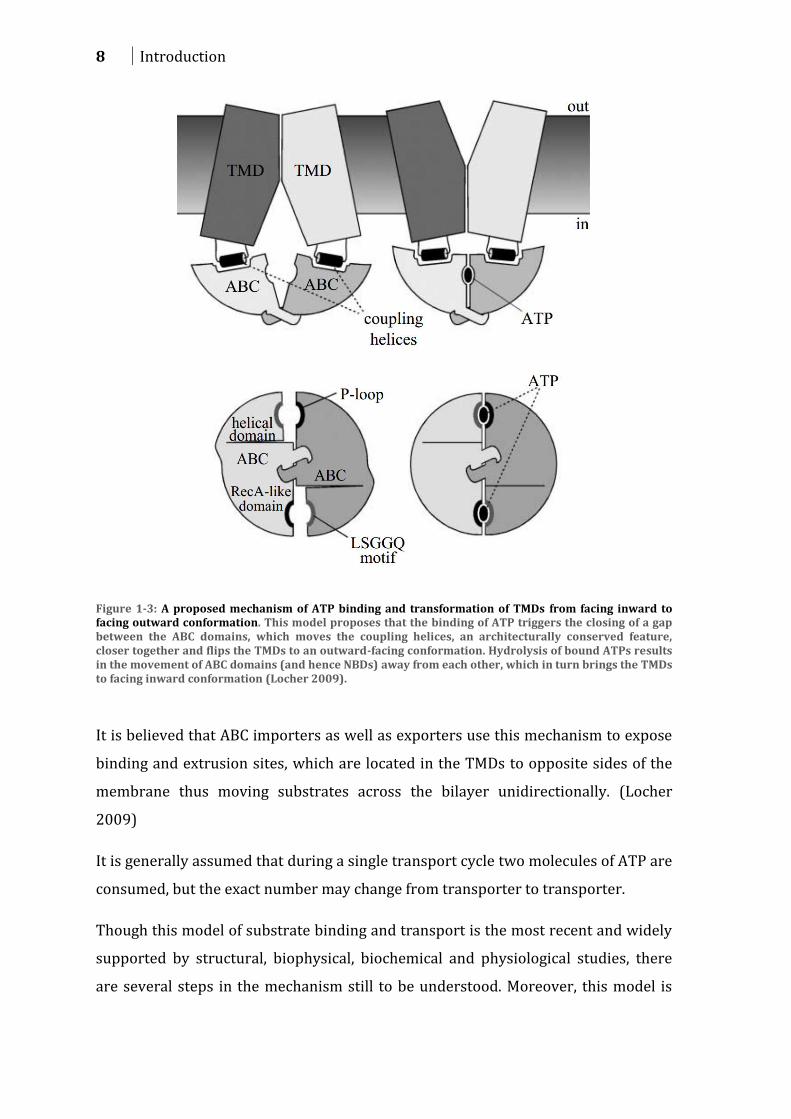
Figure 1-3: A proposed mechanism of ATP binding and transformation of TMDs from facing inward to facing outward conformation. This model proposes that the binding of ATP triggers the closing of a gap between the ABC domains, which moves the coupling helices, an architecturally conserved feature, closer together and flips the TMDs to an outward-facing conformation. Hydrolysis of bound ATPs results in the movement of ABC domains (and hence NBDs) away from each other, which in turn brings the TMDs to facing inward conformation (Locher 2009).
It is believed that ABC importers as well as exporters use this mechanism to expose
binding and extrusion sites, which are located in the TMDs to opposite sides of the
membrane thus moving substrates across the bilayer unidirectionally. (Locher
2009)
It is generally assumed that during a single transport cycle two molecules of ATP are
consumed, but the exact number may change from transporter to transporter.
Though this model of substrate binding and transport is the most recent and widely
supported by structural, biophysical, biochemical and physiological studies, there
are several steps in the mechanism still to be understood. Moreover, this model is
Introduction 9
not applicable to the ABC transporters consisting of ‘atypical’ structures, e.g.
containing mutations in the conserved motifs.
1.1.3 ABC superfamily in humans
In humans, ABC transporters are widely distributed in every tissue and involved in a
variety of physiological processes such as cholesterol and lipid transport, multidrug
resistance, antigen presentation, mitochondrial Fe homeostasis and the ATP-
dependent regulation of ion channels (including the cystic fibrosis transmembrane
conductance regulator and the sulfonyl urea receptors)(Dean, Hamon et al. 2001).
The role of ABC transporters is sometimes so important to the system that it is
difficult to characterize the physiological system in depth without identifying the
role for a particular ABC transporter involved. Apart from the usual physiological
processes, these ABC transporters also protect cells from cytotoxins and can confer
resistance to antibiotics and anticancer drugs (Dean 2009) .
In humans, the ABC transporter superfamily includes 49 genes that have been
classified into 7 different subfamilies designated A to G depending on their substrate
specificities and sequence similarities (Vasiliou, Vasiliou et al. 2009).
Members of this diverse transporter family play pivotal roles in many cellular
processes. Mutations in the ABC transporter genes cause many genetic disorders in
humans, including Tangier disease (cardiovascular), persistent hyperinsulinemic
hypoglycemia of infancy (pancreas), Stargardt disease (eye), Wegener's
granulomatosis (immune system), cystic fibrosis (lung and gut) and Dubin-Johnson
syndrome or hypercholesterolaemia (liver). (Higgins and Linton 2004)
The details of each ABC subfamily in humans are listed here (Vasiliou, Vasiliou et al.
2009).
1. Subfamily A (ABCA)
This subfamily contains 12 genes expressing some of the largest of the ABC
transporters. Most of these appear to be involved in lipid trafficking in many diverse
organs and cell types. Mutations in specific ABCA genes are associated with genetic

10 Introduction
disorders such as Tangier disease T1, familial high-density lipoprotein (HDL)
deficiency, Stargardt disease-1, retinitis pigmentosa (serious eye diseases), andage-
related mascular degeneration and (Oram and Lawn 2001; Koenekoop 2003; Ayuso
and Millan 2010).
2. Subfamily B (ABCB)
This subfamily of 11 genes is unique to mammals and includes both full-transporters
and half-transporters. Members of this subfamily are known to confer multidrug
resistance in cancer cells; hence, subfamily B has also been called the ‘MDR family of
ABC transporters’. Mutations in ABCB genes are associated with diseases like
ankylosing spondylitis (disease that involves inflammation of the joints between the
spinal bones), diabetes type 2, coeliac disease, lethal neonatal syndrome, X-linked
sideroblastic anaemia with ataxia (blood disorder with problems in movement) and
several cholestatic liver diseases of infancy (Dean, Rzhetsky et al. 2001; Vasiliou,
Vasiliou et al. 2009).
3. Subfamily C (ABCC)
Subfamily C includes 13 other genes which include transporters associated with
multidrug resistance, cystic fibrosis (Cystic fibrosis transmembrane conductance
regulator (CFTR), also called ABCC7) and ATP-dependent potassium channel
regulators such as the sulfonylurea receptors SUR1/ABCC8 and SUR2/ABCC9.
Mutations in ABCC genes have been implicated in multidrug resistance, Dubin –
Johnson syndrome, congenital bilateral aplasia of the vas deferens, diabetes type 2
and paroxysmal kinesigenic choreoathetosis and autosomal recessive diseases such
as cystic fibrosis, pseudoxanthoma elasticum (accumulation of deposits of calcium
and other minerals in elastic fibers) and hyperinsulinaemic hypoglycaemia of
infancy (low blood glucose caused by excessive insulin) (Le Saux, Urban et al. 2000;
Yabuuchi, Takayanagi et al. 2002; Kapoor, Flanagan et al. 2011).
This class is described further in detail under section 1.1.4.

Introduction 11
4. Subfamily D (ABCD)
This subfamily contains 4 genes that encode half-transporters which form
homodimers or heterodimers to make a functional unit. These 4 human genes
encode several distinct proteins by means of alternative splicing mechanism.
Mutations in ADBD genes are known to cause adrenoleukodystrophy (ALD) and
Zellweger syndrome (peroxisome biogenesis disorders), hence the members are
also known as the peroxisomal or ALD transporters (Tanaka, Tanabe et al. 2002).
5. Subfamily E (ABCE)
ABCE subfamily contains a single gene that encodes ABCE1 which is an organic
anion-binding protein (its trivial name is OABP). Because of alternatively spliced
transcripts, the ABCE1 gene encodes five distinct proteins. This member of the ABC
superfamily has an ATP-binding domain but lacks the transmembrane domain, thus
making it unlikely to function as a transporter. ABCE1 functions indirectly to
promote interferon activity. Recent studies have demonstrated the potential role of
ABCE1 in human lung adenocarcinoma and in eukaryotic posttermination ribosomal
recycling (Pisarev, Skabkin et al. 2010; Ren, Li et al. 2012).
6. Subfamily F (ABCF)
Subfamily F contains 3 ABCF genes which encode 26 distinct proteins. Just like
ABCE1, ABCF members also have ATP-binding domains, but no transmembrane
domains, rendering transporter function unlikely. The ABCF genes appear to be
upregulated by tumour necrosis factor-α and therefore are believed to be involved
in inflammatory processes (Ota, Katsuyama et al. 2007).
7. Subfamily G (ABCG)
Subfamily G comprises 5 genes that encode ‘reverse half-transporters’, meaning the
NBDs precede to the TMDs. Due to alternative splicing, the 5 ABCG genes encode 18
distinct subunit proteins.
Members of this family are involved in diverse physiological functions which include
regulation of cellular lipids, transport of steroids (cholesterol, estradiol,

12 Introduction
progesterone and testosterone), chlorophyll metabolites, organic anions, peptides
and multidrug resistance (Adachi, Suzuki et al. 2005; Sharom 2008).
Mutations in ABCG genes have been implicated in sterol accumulation disorders and
atherosclerosis (Higashikuni, Sainz et al. 2012).
1.1.4 The ABCC (MRP) family
The subfamily C is one of the largest of the 7 branches among the ABC families in
humans, comprising of 13 ABC proteins. Along with 10 multidrug resistance-
associated proteins (MRPs) this family also includes CFTR and the sulfonylurea
receptors SUR1 and SUR2A/B as mentioned previously. MRPs 1– 6 and MRPs 7–10
have been designated ABCC1– 6 and ABCC10 – 13, respectively, while CFTR, SUR1
and SUR2A/2B are designated ABCC7, ABCC8 and ABCC9, respectively(Dean, Hamon
et al. 2001).
1.1.4.1 Structure of ABCC family proteins
Based on the predicted structure of the TMDs, the ABCC proteins (with the exception
of MRP9) are divided into two groups. First group of ABCC proteins having a
“typical” ABC transporter structure with two TMDs (TMD1 and TMD2), each of
which is predicted to contain six TM helices (Figure 1-2), includes CFTR (ABCC7),
MRPs 4, 5, 8 and the second group includes the remaining MRPs and the SURs
(ABCC8 and ABCC9) that have an additional NH2-terminal region comprised of ~200
amino acids termed as TMD0 (Figure 1-4). The TMD0 of the “long” ABCC proteins
are relatively poorly conserved. However, they are all hydrophobic and predicted to
contain from four to six transmembrane helices. The function of TMD0 in the “long”
MRPs remains poorly defined (Deeley, Westlake et al. 2006).
So far studies with different members of the ABCC family in different systems have
led to sometimes contradictory results. While some postulated that the TMD0 region
is not required for the transport function or proper routing to the plasma membrane
(Bakos, Evers et al. 1998), others believe that it is important for transport activity
(Gao, Yamazaki et al. 1998; Ito, Weigl et al. 2003; Leslie, Letourneau et al. 2003). In
some members, TMD0 has been shown to interact with other proteins (Otonkoski,

Introduction 13
Ammala et al. 1999; Babenko and Bryan 2003; Chan, Zhang et al. 2003), while in
others it is required for localization to the membranes (Fernandez, Hollo et al.
2002).
It could be possible that the functions of TMD0 are protein specific and may vary
from transporter to transporter.
Figure 1-4: Schematic structure of the “long” ABC transporters from ABCC subfamily. Apart from the typical two TMDs and two NBDs, some members of the ABCC family possess and extra N-terminal transmembrane region called TMD0. The TMD0 containing 4-6 (usually five) transmembrane helices is extended with the cytoplasmic linker L0 (Deeley, Westlake et al. 2006).
The entire ABCC family shares certain highly conserved features in their NBDs,
particularly in NBD1, regardless of whether the MRPs have two or the three TMDs
suggesting a common ancestor of all members of the family (Deeley and Cole 1997;
Dean, Hamon et al. 2001).
The Walker A, Walker B motifs and the LSGGQ sequence (‘C’ motif) as well as the
signature of ABC NBDs are also present in ABCC proteins. However, these elements
deviate in some cases from the form commonly found in other ABC proteins (Cole,
Bhardwaj et al. 1992).
For example, the glutamate residue following the Walker B motif in most ABC
transporters is present at the appropriate location in NBD2 of the ABCC proteins,
but in the NBD1 it is replaced either by aspartate (in MRP1 and other ABCC
proteins) or serine residue (in CFTR). As the glutamate residue plays a critical role
in cleavage of the γ-phosphodiester bond of ATP, this replacement of amino acid
14 Introduction
residue has a profound effect on the ATP binding and hydrolysis characteristics of
the NBD1 and as a consequence on the catalytic cycle of members of ABCC subfamily
(Moody, Millen et al. 2002; Smith, Karpowich et al. 2002; Payen, Gao et al. 2003;
Verdon, Albers et al. 2003).
In addition, the ABC signature sequence LSGGQ is also modified in NBD2 of the ABCC
proteins. While the two NBDs in most prokaryotic ABC transporters are identical, in
many eukaryotic ABC proteins the two NBDs are at least very similar in their
structure. Unlike this typical ABC protein scheme, the two NBDs of the ABCC family
proteins are both structurally and functionally nonequivalent, supporting the
concept of a different catalytic cycle for ABCC subfamily proteins. (Deeley, Westlake
et al. 2006)
1.1.4.2 Physiological role of ABCC family proteins
The MRPs widely present in a number of tissue/blood barriers and are associated
with distribution and elimination pathways for a wide range of both anti-cancer and
non-anti-cancer drugs and metabolites. In addition, these MRPs can influence the
pharmacokinetics of drugs and thereby affect their disposition in the body. Many
drugs are detoxified by conjugation with glutathione, glucuronate or sulfate, which
results in acidified conjugates that cannot diffuse though cell membranes. Members
of the MRP family mediate the export of these conjugates (Borst and Elferink 2002).
The subcellular localization and substrate specificities of different long and short
MRPs are shown in Figure 1-5.
Though it is widely accepted that multidrug resistance is multifactorial, several
MRPs together with ABCB1 (P-gp/MDR1) and ABCG2 (BCRP) have been recognized
as major components of multidrug resistance, especially at the blood-brain-barrier
(BBB) (Eisenblatter, Huwel et al. 2003; Deeley, Westlake et al. 2006; Wittgen, van
den Heuvel et al. 2011)

Introduction 15
Figure 1-5: Subcellular localization and substrate specificities of long (left) and short (right) MRPs. The question marks indicate that the subcellular localization is not known. (Deeley, Westlake et al. 2006)
1.1.5 The human ABCC3 (MRP3) transporter
ABCC3 or MRP3 belongs to the “long” transporter group of the ABCC family,
comprising the extra NH2-terminal domain. Though the transporter shares the
highest (~56 %) sequence similarity with MRP1 (ABCC1), the well-studied member
of the family although the substrate specificity of these two transporters varies
drastically. On the other hand there is a large overlap in the substrate specificity of
ABCC2, ABCC3 and ABCG2. Whereas ABCC2 and ABCG2 are expressed at the apical
membranes of the cells, transporting their substrates into bile, feces and urine,
ABCC3 is expressed basolaterally, especially in hepatocytes and enterocytes and it
generally transports its substrates into the blood circulation. (Borst and Elferink
2002; Vlaming, Pala et al. 2008)
MRP3 is expressed in almost all the tissues in the body which includes the adrenal
gland, pancreas, gut, gall bladder and placenta, with lower levels being found in liver,
kidney and prostate. In contrast to MRP1 and MRP2, the in vivo functions of MRP3

16 Introduction
are not yet clearly understood, though in many cellular models ectopic expression of
human MRP3 has been shown to confer resistance to etoposide and methotrexate,
which suggests its potential role in the protection of normal tissues against
chemotherapeutic agents.(Belinsky, Dawson et al. 2005)
Under cholestatic conditions, when the presence of ABCC2 in the canalicular
membrane markedly decreases, ABCC3 is upregulated and allows increased
basolateral efflux of bilirubin glucuronides from the liver. Thus there appears to be a
reciprocal relationship between the two transporters which are presumed to protect
the liver from accumulation of potentially toxic bile constituents. (Donner and
Keppler 2001). Both transporters are expressed in various tumors and can transport
a wide range of (anticancer) drugs.
1.1.6 Transport mechanism of ABCC3
ABC transporters are large membrane proteins and it has been technically difficult
to get crystals suitable for X-ray crystallographic analysis. Therefore obtaining a
crystal structure of an ABC transporter in different binding states is rather
challenging. Moreover, only the crystal structure itself is not sufficient to predict the
exact mechanism of the transport and various steps involved. A crystal structure
always has to be supported by enough biochemical evidences in order to unravel the
exact order of sequences in which the actual mechanism of transport takes place.
Our present knowledge of the mechanism of transport of MRP3 is mostly based on
comparative hypotheses. As the MRP3 possesses the highest sequence and
structural similarity with that of MRP1, results obtained from the experiments done
with MRP1 are usually generalized for MRP3 (and other MRPs consisting of the extra
TMD).
As mentioned earlier, the NBDs of most prokaryotic ABC transporters are identical
and in many eukaryotic ABC proteins, the two NBDs are structurally and functionally
equivalent and can be exchanged with little or no effect on function (Chen, Chin et al.
1986; Beaudet and Gros 1995; Hrycyna, Ramachandra et al. 1999). However, the
two NBDs of the ABCC family members are less conserved indicating that the two
NBDs play distinct functional roles in the catalytic cycle of the ABCC proteins.

Introduction 17
On the basis of some initial experimental evidence, Deeley in his review has
proposed a hypothetical model of substrate transport cycle for MRP1 (and other
MRPs), which possibly is applicable for MRP3 (and other proteins with non-identical
NBDs) as well. (Figure 1-6)
Figure 1-6: Model of the hypothetical transport cycle of MRP1 for the transport of LTC4. This model predicts the steps involved in the transport of substrate in which the transporter shuttles between the high affinity and low affinity states. (Deeley, Westlake et al. 2006) Step 1) Binding of substrate: it is assumed that the binding of substrate to a high-affinity site(s) induces conformational changes that stimulate binding of ATP to NBD1. It is also predicted that the ATP is already bound to the NBD1 and this binding is necessary to maintain the high affinity states of the transporter. Step 2) Binding of second molecule of ATP: The initial ATP binding of by NBD1 triggers the binding of a second molecule of ATP by stabilizing the interaction between NBDs. This stabilization is achieved by establishing contacts with the C signature of NBD2. Step 3) Release of substrate: Binding of ATP molecules on both the NBDs, causes the conformational changes in the TMDs thereby changing the state of the transporter from high affinity binding to low affinity binding state. These conformational changes release the substrate on the opposite side of the membrane. Step 4) Hydrolysis of ATP at NBD2: In order to retain the high affinity state, after the release of substrate, the ATP molecule bound at NBD2 is hydrolyzed. Step 5) Release of ADP from NBD2: After the hydrolysis of ATP, release of ADP from NBD2 drives the conformational changes necessary to regain the high affinity state. Step 6) Hydrolysis of ATP and release of ADP from NBD1: It is also postulated that the hydrolysis of ATP is also required to reset the high affinity state and onset of new transport cycle.

18 Introduction
As seen from the Figure 1-6, in this hypothetical model, many steps are yet to be
understood. The hydrolysis of ATP by NBD1 is still unclear though and mutations
that increase ADP trapping at NBD1 are shown to lock MRP1 in a high affinity state
for substrate, even when ATP is bound by NBD2 (Gao, Cui et al. 2000; Payen, Gao et
al. 2003)
But the questions still to be answered are; i) whether the substrate binding or the
binding of first ATP is the initial step; ii) whether mere binding of both the ATP
molecules to the NBDs or the hydrolysis of ATP molecule drives the transport by
shifting the conformation from high to low affinity substrate binding state; iii)
whether ATP hydrolysis is required to regain the high affinity substrate binding
state or not. These and many other steps in the transport cycle of ABCC proteins
remain speculative and need much more structural and functional evidences to be
understood clearly.
The ATPase activities of purified ABCC proteins are about two orders of magnitude
lower than some prokaryotic ABC transporters and P-gp/MDR1. Consequently,
performing different assays with the protein using crude membranes, in order to
study the transport mechanism have proven to be difficult.
After the successful heterologous expression and purification of MRP3 from the
yeast P. pastoris in its active state by the working group of Prof. Urbatsch
(Chloupkova, Pickert et al. 2007), the protein was available in sufficient quantities
for the biochemical assays in order to understand the function of the protein in
detail.
In our working group, the heterologously expressed MRP3 was successfully
reconstituted into artificial liposomes which are an adequate model for systematic
characterization of substrate specificities and transport process of a protein
(Zehnpfennig, Urbatsch et al. 2009). Using these artificial proteoliposomes, our
group has recently shown that ATP hydrolysis and substrate translocation show
positive cooperativity and are half-coupled in MRP3 (Seelheim, Wullner et al. 2013).
Though initial results obtained from the studies in these artificial proteoliposomes
support the model proposed by Deeley, there is still a lot to be done to understand
the transport process completely.

Introduction 19
1.2 Heterologous expression of proteins
Functional characterization of any protein involves several biochemical assays,
which in turn require large amounts of active protein in hand. But the protein being
studied need not necessarily be a highly expressed protein in its native organism.
Expression of a particular protein can be sometimes induced by specific substances.
But in most cases such increase in the protein expression is limited and sometimes
toxic to the native host, thereby making the use of native host for overexpression
unsuitable (Khlistunova, Biernat et al. 2006; Xie, Nair et al. 2008). In such cases
expression of the desired protein in another suitable host system is the only choice.
Several prokaryotic and eukaryotic expression systems have been developed over
the last decades for such heterologous expression of proteins.
The choice of the host for overexpression is of prime importance as the expressed
protein must be in the right conformation and active after the purification. Here are
some of the existing systems available for recombinant gene expression.
1.2.1 Prokaryotic expression system
Escherichia coli has been the most frequently used prokaryotic expression system
for the high-level production of heterologous proteins (Makrides 1996; Baneyx
1999). Easy methods for genetic manipulation, low cost of production, high yield of
protein, ease of scaling and short turnaround time are the advantages that make this
system a first choice for any recombinant protein expression (Sorensen and
Mortensen 2005). However, most eukaryotic proteins such as large multimeric
membrane proteins, are not correctly folded when expressed in E. coli (and other
prokaryotic systems) (Baneyx and Mujacic 2004).
Moreover, prokaryotic expression systems cannot perform the post-translational
modifications like glycosylation (addition of sugars to the protein), phosphorylation
(addition of phosphate group), lipidation (addition of lipid group), sulfation
(addition of sulfate group) etc., which are essential for the activity and/or trafficking
of the eukaryotic proteins. These facts limit the types of protein(s) that can be
expressed heterologously in the prokaryotic systems (Brondyk 2009).

20 Introduction
Prokaryotic homologues are frequently used for obtaining structural information on
membrane proteins because they can easily be expressed in bacteria in large
quantities (Doyle, Morais Cabral et al. 1998). However, this method cannot easily be
applied to mammalian MPs, because when expressed in prokaryotes these proteins
are mostly directed to inclusion bodies, from which they are usually impossible to
purify without denaturation (Mus-Veteau 2002).
1.2.2 Eukaryotic expression systems
In order to overcome the disadvantages of the prokaryotic expression system, many
eukaryotic expression systems have been developed having the capability of
performing post translational modifications and expressing the protein in its active
form. This include mammalian, insect and yeast expression systems.
1.2.2.1 Mammalian cells
Mammalian cell expression systems comprise a large number of different cell lines
used for protein expression. Chinese hamster ovary (CHO) cells (Kim, Kim et al.
2012), human embryonic kidney (HEK) 293 cells (Thomas and Smart 2005), murine
erythroleukemia (MEL) cells (Needham, Gooding et al. 1992; Shelton, Davies et al.
1993; Needham, Egerton et al. 1995), baby hamster kidney (BHK) cells (Wirth, Bode
et al. 1988), mouse L-cells (Kavathas and Herzenberg 1983; Gopal, Polte et al. 1989)
are few examples.
Many mammalian cell lines have been used for large-scale commercial production of
therapeutically important proteins. But the major disadvantages of mammalian cells
are difficulties in achieving stable transfection, their lower production yield
compared to other eukaryotic systems, their slow growth rate and the higher cost
due to the need for complex growth media.
Hence, the system is not very useful for the production of sufficient amounts of
protein for structural and biochemical analysis.

Introduction 21
1.2.2.2 Insect cells
Protein production in insect cells such as Spodoptera frugiperda (SF9) using
Baculovirus-mediated infections is another popular method for the production of
proteins. Insect cells are grown in suspension in serum free media. Apart from the
expression of intracellular, surface bound or secreted proteins, this system has been
also successfully used for the production of membrane proteins (Possee, Thomas et
al. 1999; Hitchman, Possee et al. 2009) .
Many mammalian transporters and receptors are functionally overexpressed by
using this system (Sievert, Thiriot et al. 1998). Optimized expression vectors, easy
scale up and high yield of protein are the advantages. (Mus-Veteau 2002; Hitchman,
Locanto et al. 2011) (Mus-Veteau 2002).
But the post translational modifications done by the insect systems are not as
complicated and precise as seen in human cells (Geisse, Gram et al. 1996). Moreover,
the viral proteases present in the recombinant insect cells can sometimes degrade
the protein of interest.
To summarize, though the mammalian and insect cells ensure the expression of
eukaryotic proteins with right folding and all the post translational modifications,
requirement of a complex growth medium and culture conditions makes the system
highly expensive. Moreover, comparatively difficult methods of genetic
manipulations make it tedious.
1.2.2.3 Yeast
This simple eukaryotic cell combines the advantages of both, prokaryotic and
eukaryotic expression systems. Like the prokaryotic systems, the yeast expression
system also has a short turnaround time, can easily be scaled up and needs relatively
simpler techniques for genetic manipulation. On the other hand, it can also perform
many of the post-translational modifications seen in higher eukaryotic cells.
(Romanos, Scorer et al. 1992)

22 Introduction
A variety of studies like protein-protein interactions, mutagenesis or protein folding
can be performed in yeast. Apart from that, yeasts are also used as a model for
studies of membrane proteins (Petschnigg, Moe et al. 2011). But the most popular
use of yeasts is for cloning and heterologous overexpression of eukaryotic proteins
in large amounts sufficient for biochemical, biophysical and structural analysis. For
this purpose, yeasts are studied and genetically modified to achieve optimized
expression of foreign proteins (Choi, Bobrowicz et al. 2003; Hartner, Ruth et al.
2008). Two yeast species have been most successfully used for heterologous
expression of foreign proteins including large multi domain mammalian MPs:
Saccharomyces cerevisiae and P. pastoris.
Though Saccharomyces cerevisiae has been used as a heterologous expression
system for many years, low production yield and the tendency of hyperglycosylation
makes the system unfavorable in many instances (Sandy B. Primrose 2009).
Secreted proteins expressed in S. cerevisiae are often retained in the periplasm
thereby making the purification difficult (Buckholz and Gleeson 1991; Romanos,
Scorer et al. 1992). Most importantly, S. cerevisiae produces ethanol when grown at
high cell densities, which is toxic to the cells and lowers the quantity of recombinant
protein being expressed.
In order to solve these problems, P. pastoris is used as the alternative species for
protein production. Simple methods of genetic manipulations, growth to higher
densities, successful expression of secreted protein, strong inducible promoters and
requirement of simple defined media for growth makes this system the most
economical and useful for the foreign gene expression.
Details of this system are discussed further in detail in 1.3.

Introduction 23
1.3 Expression in the yeast P. pastoris
The expression in yeast P. pastoris has many advantages over the other expression
systems. As an eukaryotic systems expression in P. pastoris can perform the
modifications like other eukaryotic expression systems, especially post-translational
modifications such as protein processing, protein folding and protein secretion into
the medium (Cregg, Tolstorukov et al. 2009). Isolation of secreted proteins is much
easier from P. pastoris by the fact that it does not secrete a lot of its own proteins.
(Bora 2012).
Contrary to S. cerevisiae, P. pastoris does not produce toxic levels of ethanol when
grown to high cell density cultures. Being a poor fermenter, it favors preference for
respiratory growth and can be cultured at extremely high densities in the controlled
environment (Gellissen 2006) .
P. pastoris shares genetic manipulation methods and growth conditions to
Saccharomyces cerevisiae, with the added advantage of higher levels of expression
which leads to rapid development of this system (Cereghino and Cregg 2000). Easy
maintenance, easy scale-up, inexpensive growth requirements and higher
expression levels make P. pastoris a very useful protein expression system
(Balamurugan 2006).
Because of these and many other advantages, P. pastoris has been extensively used
for large scale production of many human vaccines and therapeutic proteins. Being
unicellular yeast, the glycosylation pattern of the proteins expressed in P. pastoris
differs in many respects to the higher organisms. This, in many instances can be
antigenic (Sinclair and Elliott 2005; Jacobs and Callewaert 2009; Sola and Griebenow
2009). In order to solve these problems, genetically engineered strains of P. pastoris
have been developed, which impart humanized glycosylation to the proteins
expressed (Li, Sethuraman et al. 2006; Jacobs, Geysens et al. 2009; Zha 2012).
The other advantage of the P. pastoris expression system is the strong inducible
promoter. As a methylotrophic yeast, it is capable of metabolizing methanol as its
sole carbon source.

24 Introduction
The enzyme alcohol oxidase (AOX), which catalyzes oxidation of methanol to
formaldehyde using molecular oxygen, has a very poor affinity for oxygen. This
difficulty is compensated by generating large amounts of enzyme (Cregg, Cereghino
et al. 2000). This enzyme is coded by two genes AOX1 and AOX2. However, the AOX1
gene is responsible for the majority of alcohol oxidase activity in the cell when
induced by methanol (Cregg, Madden et al. 1989). Among the two genes, AOX1 is
tightly regulated at transcriptional level (Tschopp, Brust et al. 1987). The strong and
highly regulated promoter of the AOX1 gene can be utilized for heterologous gene
expression.
In order to perform the genetic manipulations in P. pastoris using this strong
promoter, many vector systems have been designed. Two of them which are used in
this project, are discussed below.
1.3.1 Autonomously replicating pPicholi vector
pPicholi is a dual expression vector, designed for heterologous gene expression in
the yeast P. pastoris as well as in the prokaryote E. coli. The vector contains the AOX1
promoter from P. pastoris and an E. coli T7 promoter, allowing expression in both
the systems. The vector also has sequences for autonomous replication in P. pastoris
and E. coli. The integrated P. pastoris autonomous replication sequence (PARS) not
only allows autonomous replication of the vector in the P. pastoris cells but also
enables simple recovery of plasmids from yeast.
This vector contains a Zeocin resistance gene which imparts resistance against the
antibiotic Zeocin to the cells and could thus be used as a selection marker.
As the vector can replicate autonomously, the copy number can be increased or
decreased by simply changing the concentration of antibiotic Zeocin in the media.
Moreover, only small amounts of DNA are sufficient and no vector linearization is
required to successfully transform this vector into P. pastoris cells (MoBiTec 2003).
A detail description of the plasmid’s clone chart is given in appendix 3.3.

Introduction 25
1.3.2 Genome integrating pPICZ vector
pPICZ vectors also comprise parts of the strong and highly regulated AOX1 gene
with the AOX1 promoter (5’AOX1) and transcription terminator (TT) along with
other elements like Zeocin resistance gene and elements for replication in E. coli
(details appendix 3.3). The gene of interest can be inserted into the multiple cloning
site (MCS) which is placed in between the AOX1 promoter and terminator sequence
(TT).
The AOX sequences in the vector can recombine with AOX1 gene from the
P. pastoris genome, because of the sequence homology, resulting in the insertion of
one or more copies of the vector into the genome (Cregg, Barringer et al. 1985;
Cregg, Madden et al. 1989).
This generates stable P. pastoris transformants expressing the desired protein. As
the gene of interest is integrated inside the genome, addition of Zeocin is not
required in the media to retain the plasmid inside the P. pastoris cells. Figure 1-7
shows the mechanism of insertion of the vector into the P. pastoris genome
(Invitrogen 2010).
Figure 1-7: Schematic representation of the insertion of the pPICZ plasmid to the intact AOX1 locus from the P. pastoris genome. This insertion results in the integration of 5’PAOX1(AOX1 promoter sequence from plasmid), gene of interest, TT (transcription terminator sequence of AOX1 gene) and the Zeocin resistance gene. The 5’PAOX1 is induced by methanol and drives the transcription of the gene of interest (Invitrogen 2010).

26 Introduction
1.4 Artificial liposomes as a tool for transport studies
Biological membranes function as a barrier to define cell boundaries and to protect
the integrity of the interior of the cell (Brown 1996). These fluidic bilayers of lipid
sheets are associated with numerous peripheral and integral membrane proteins
(Singer and Nicolson 1972). The integral membrane proteins perform numerous
functions as transporters, channels, receptors, enzymes or as structural membrane
anchoring domains.
Despite their diverse cellular functions and roles in processes like multidrug
resistance, these proteins remained the least studied owing to the fact that these
membrane proteins are notoriously difficult to handle and to study because of their
highly hydrophobic nature. Since they are designed to sit within the hydrophobic
environment of the lipid bilayer, they tend to be unstable when extracted from their
native environment and aggregate rapidly (Ryan, Souda et al. 2010).
As the extraction of these proteins is difficult and tricky, most of the studies done so
far are performed by overexpressing the protein of interest in a heterologous host
and preparing vesicles from the host membranes to characterize the protein. Based
on these vesicle preparation methods, different assay types have been developed to
understand biochemical characteristics of a particular membrane protein and
transport processes associated with it (Glavinas, Mehn et al. 2008).
But use of these membrane vesicles could sometimes provide misleading results, as
the activity or transport seen for a protein could be a result of some other intrinsic
proteins of the host organism. In such cases, reconstitution of the protein into
artificial membrane systems provides reliable information about the protein.
Different methods are available for efficient reconstitution and solubilization of
membrane proteins by using appropriate detergents (Seddon, Curnow et al. 2004).
In our lab, reconstitution of MRP3 into artificial liposomes has been successfully
performed with the use of the nonionic detergent n-dodecyl β-D-Maltopyranoside
(DDM) (Zehnpfennig, Urbatsch et al. 2009). We aim to use this powerful tool to
further analyze functions of this ABC transporter.
Objectives of the project 27
2 Objectives of the project
The mechanism of ATP hydrolysis and transport of substrates by ABC transporters
remains elusive even after intensive research. Recent developments in the
crystallization combined with biochemical studies of some bacterial and eukaryotic
ABC transporters led to the establishment of the most convincing model of
transport, which indicate towards the equal affinity and binding of both the NBDs
and the conserved domains in ATP binding followed by conformational changes to
drive the transport (Jones and George 2012). However, these transport models
cannot be applied to the members of the ABCC (MRP) family of human ABC proteins
and other ABC transporters which comprises functionally nonequivalent NBDs (Gao,
Cui et al. 2000). Apart from the non-identical NBDs, several members of the ABCC
family also deviate from the typical ABC protein structure due to their extra TMD of
which the exact role is still not clear.
The aim of this thesis was to understand the role of the extra N-terminal TMD in the
“long” MRPs and study the role of each domain of the transporter in the mechanism
of substrate transport. For this, we focused on one member of the “long” ABC
transporter group of the ABCC family, called ABCC3 (MRP3).
Our group has successfully reconstituted purified MRP3 into artificial liposomes and
hence provided a reliable model for systematic characterization of substrate
specificities and transport process mechanism of the protein (Zehnpfennig, Urbatsch
et al. 2009; Seelheim, Wullner et al. 2013). To study the function and mechanism of
transport of MRP3 in detail, we aimed to express in addition to the full transporter 7
different truncated versions (called constructs) into yeast P. pastoris. In order to
enable the purification of the expressed proteins, a C-terminal sequence encoding a
tandem affinity purification tag composed of a Strep tag II sequence and Poly-His tag
was fused with the protein sequences.
The following constructs comprising MRP3 as a full transporter and different
truncated versions were considered (Figure 2-1).

28 Objectives of the project
Reconstitution of these MRP3 constructs into proteoliposomes would considerably
help to understand the role of the different protein domains for the drug transport
and the related ATP hydrolysis.
MRP3 MRP3-ΔTMD2NBD2
ΔTMD0-MRP3 ΔTMD0-MRP3-ΔTMD2NBD2
ΔTMD0L01/2-MRP3 ΔTMD0L0-MRP3-ΔTMD2NBD2
ΔTMD0L0-MRP3 ΔTMD0L0TMD1NBD1-MRP3
Figure 2-1: Schematic representation of MRP3 full transporter and its different truncated versions proposed for cloning and expression in P. pastoris. The pictures were modified using an original picture from (Deeley, Westlake et al. 2006). The truncated versions ΔTMD0-MRP3, ΔTMD0L01/2-MRP3, ΔTMD0L0-MRP3 (2nd ,3rd and 4th row on left side) were lacking the extra N terminal domain TMD0, TMD0 and half of the linker region L0 and TMD0 and L0 complete respectively. In MRP3- ΔTMD2NBD2 (1st row on right side), the TMD2 and NBD2 (C-terminal TMD and NBD) were removed. ΔTMD0-MRP3-ΔTMD2NBD2 (2nd row on right side) was the N terminal half of the core domain (TMD1NBD1) retaining the linker region L0. While ΔTMD0L0-MRP3-ΔTMD2NBD2 and ΔTMD0L0TMD1NBD1 -MRP3 (3rd and 4th row on right side) were half transporters expressing only a single TMD and NBD.

Results and Discussion 29
3 Results and Discussion
3.1 Cloning and expression of hMRP3 using autonomously
replicating pPicholi vector
3.1.1 Aims and rationale
The first step to achieve the heterologous gene expression in the yeast P. pastoris
was to select the right vector for cloning and expression from a number of
expression vectors available commercially.
In order to purify the recombinant protein after the expression in the heterologous
host, the expression vector had to be modified so as to add a purification tag to the
protein sequence. For this purpose, a tandem affinity purification tag containing poly
histidine tag (8xHis) and a peptide sequence exhibiting intrinsic affinity towards
Streptavidin (Strep tag II ) was designed. This dual affinity tag provides high purity
of the protein after the purification procedure. The schematic representation of the
expression cassette with the purification tag is shown in Figure 3-1.
Figure 3-1: Schematic representation of the expression cassette for ligation of ABCC3 and its constructs in pPicholi for expression in P. pastoris. After cloning, the modified pPicholi plasmid encodes a protein bearing a C-terminal sequence consisting of Factor Xa protease cleavage site, Strep tag II affinity tag, site 3C-protease cleavage site (3C) and Poly-His tag (8xHis). In addition, the vector contains Kozak-like bases (P. pastoris Kozak) in the region around the ATG start codon, which is important for high-level expression in P. pastoris.
So, it was necessary to construct a library of E. coli cell lines containing the modified
pPicholi vector with sequences encoding MRP3 protein or its truncated versions to
generate a stable source of plasmids for transformation into P. pastoris.

30 Results and Discussion
The aim of this part was to construct a pPicholi vector library with different
truncated forms and a full sequence of MRP3 gene to transform these pPicholi
vectors containing different MRP3 sequences into P. pastoris and to choose the best
expression clone for every MRP3 truncated form among the transformants. An
expression clone showing the expression of the protein consistently and in sufficient
quantities would then be used for large scale culturing and purification.
3.1.2 Results
3.1.2.1 Vector and hMRP3 sequence modification
The modified pPicholi vector containing the C-terminal purification tag with Factor
Xa-Strep tag II-3C Protease-8xHis sequence was a kind gift from Dr. Markus Seidl
(Institute of Biochemistry, Muenster).
The pGEM7-MRP3 vector containing cDNA insert encoding hMRP3 was kindly
provided by Prof. P. Borst (The Netherlands Cancer Institute, Amsterdam). The clone
chart of the pGEM7 vector containing the MRP3 sequence is shown in section 6.3.
As given in Figure 3-1 for the ligation and cloning of MRP3 sequence, AscI and SacII
restriction sites were chosen. But the hMRP3 cDNA sequence also has an intrinsic
SacII site. So, it was necessary to mutate the SacII site inside the MRP3 sequence in
order to achieve the successful cloning and ligation.
The SacII site within the MRP3 sequence was eliminated by site directed
mutagenesis (SDM) as described in section 0. The site CCGCGG was mutated to
CTGCGG; which leads to a silent mutation in the MRP3 sequence without changing
the amino acid sequence. This silent mutation was designed considering the codon
usage of P. pastoris to ensure the optimal expression of the protein. The sequences of
primer pairs used SDM in SacII site, labeled as MRP3_Mut_Sac_For and
MRP3_Mut_Sac_Rev, are mentioned in Appendix 0.
The SDM product was transformed into competent Top10F’ E. coli cells as described
in 5.1.2.3 and the transformed clones were picked for plasmid isolation as described
in section 5.2.1. The isolated plasmid from each clone was analyzed for the SacII

Results and Discussion 31
mutation. A virtual cutting of the pGEM7-MRP3 vector, before and after SDM in SacII
site showed results as described in Table 3-1.
Fragments size in kb after restriction
+SacII +SacII +EcoRI
+SacII +SacII
+EcoRI
pGEM7-MRP3 original
7757 7040 pGEM7-MRP3 SacII site deleted
7757 7757
linear 717 Uncut linear
Table 3-1: Expected size of pGEM7-MRP3 vector fragments when restricted with different enzymes, before and after deletion of SacII site.
Plasmid DNA from the clones selected for SacII mutation analysis were restricted
with SacII and EcoRI and the restricted samples were analyzed on 1 % agarose gel as
described in sections 5.2.4 - 5.2.5. The comparison between positive and negative
clones after mutagenesis is shown in Figure 3-2.
Figure 3-2: pGEM7-MRP3 plasmid showing different restriction pattern before and after deletion of SacII site. The DNA bands were separated on 1 % agarose gel and 1 kb DNA ladder from NEB was used as a reference. –K designates a negative control for restriction without addition of any restriction enzymes.

32 Results and Discussion
As seen from the restriction analysis, the pGEM7-MRP3 plasmid before SDM was
able to be restricted by both SacII and EcoRI enzymes. When restricted by the SacII
enzyme alone, the circular plasmid migrated at a different rate than the plasmid
without restriction (-K). On the other hand restriction with both SacII and EcoRI
enzymes showed 2 distinct bands.
After the SDM and deletion of SacII site, the plasmid showed the same band pattern
before and after restriction by SacII enzyme. The plasmid showed multiple
conformations (open circular, supercoiled) on the agarose gel with or without
restriction by SacII enzyme, indicating the deletion of this site. When restricted by
both SacII and EcoRI enzymes together, the plasmids after SDM showed only a single
band. This confirmed that the plasmid was linearized by EcoRI and had no SacII site
anymore. The clones showing positive results by restriction pattern analysis were
sent for sequencing to confirm the mutation (section 5.2.11). Results for the
sequence alignment showing the point mutation in the SacII site are shown in Figure
3-3.
Figure 3-3: Screenshot of the sequence alignment done using BioEdit sequence alignment editor, after the sequencing of the positive clones from SDM of the SacII site within the MRP3 sequence.
3.1.2.2 Amplification of insert and ligation into the vector
After the SDM in the SacII site in the MRP3 sequence, the modified pGEM7-MRP3
vector was used as a template for all the further PCR amplifications. The desired
open reading frame (ORF) encoding specified domain(s) from hMRP3 cDNA
template were amplified with appropriate pair of primers by polymerase chain
reaction (PCR). The amplification was performed using the high fidelity polymerase
as described in section 5.2.9.1. Sequences and combination of all the primers used
for different MRP3 constructs are mentioned in 0.
The amplified fragments were cleaned, restricted, ligated with modified pPicholi
vector and transformed in Top10F’ E. coli (section 5.2.7.2, 5.2.4, 5.2.8 and 5.1.2.3).
10 20 30 40 50 60 70 80....|....|....|....|....|....|....|....|....|....|....|....|....|....|....|....|
MRP3 in pGEM7 TTTACAGTGATGCCGATATTTTCTTGCTGGATGACCCACTGTCCGCGGTGGACTCTCATGTGGCCAAGCACATCTTTGAC
157mQ-3_M1_904_rev ...........................................T....................................
157mQ-4_M1_904_rev ...........................................T....................................
157mQ-5 M1 904 rev ...........................................T....................................

Results and Discussion 33
Positive clones were selected by colony PCR (5.2.9.2). The results from a colony PCR
performed after the ligation of modified pPicholi vector with the full MRP3 sequence
are shown in Figure 3-4. The same procedure was followed for selection of positive
clones for other constructs for the insertion into the empty vector (data not shown).
Figure 3-4: Results from a colony PCR performed to select the clones after ligation of amplified MRP3 fragments into modified pPicholi vector. The sequence between the AOX1 promoter and terminator was amplified using Taq DNA polymerase. The DNA bands were separated on 1 % agarose gel and 1 kb DNA TriDye™ ladder from NEB was used as a reference. –K designates a negative control for amplification in which the empty vector without any insert was used as a template. The numbers indicates the clones selected for colony PCR.
DNA Protein
No. Construct Insert pPicholi Plasmid Amino acids
Size in kDa
1 MRP3 4799 3355 8154 1567 174.06 2 ΔTMD0-MRP3 4226 3355 7581 1379 152.80 3 ΔTMD0L01/2-MRP3 4106 3355 7461 1336 147.77 4 ΔTMD0L0-MRP3 3956 3355 7311 1284 141.72 5 MRP3-ΔTMD2NBD2 2927 3355 6282 943 105.79 6 ΔTMD0-MRP3-ΔTMD2NBD2 2369 3355 5724 757 84.86 7 ΔTMD0L0-MRP3-ΔTMD2NBD2 2084 3355 5439 662 73.77 8 ΔTMD0L0TMD1NBD1-MRP3 2090 3355 5445 664 73.04
Table 3-2 : Size of the MRP3 and its truncated version genes after ligation with the vector (modified pPicholi). The constructs are referred by the numbers instead of full names for convenience in the descriptions. The detail description of each construct is given in Figure 2-1.

34 Results and Discussion
The positive clones were sequenced and analyzed as described in 5.2.11. Positive
clones without any mutation were used for transformation into P. pastoris (5.2). The
sizes of all the 8 constructs generated are shown in Table 3-2.
A gel picture showing the relative plasmid sizes of all the 8 constructs is given in
Figure 3-5.
Figure 3-5: Relative size of the plasmids containing different constructs of MRP3. The DNA bands were separated on 1 % agarose gel and 1 kb DNA TriDye™ ladder from NEB was used as a reference. Empty vector designates the modified pPicholi vector without any insert. Other bands indicate the construct of MRP3 inserted into this empty vector. The gel contains the 100 ng of plasmid in each well. All the plasmids were linearized with AscI restriction enzyme to compare the sizes.
3.1.2.3 Transformation into P. pastoris and expression analysis of all
constructs
The plasmid for each MRP3 construct was isolated and transformed into electro
competent P. pastoris cells without linearization as described in sections 5.1.1.2,
5.1.1.2 and 5.1.1.3. The transformed P. pastoris cells were inoculated in the MGYH
(minimal glycerol + histidine) media for culturing and induction on a small scale
(section 5.1.1.1).

Results and Discussion 35
A clone transformed with the empty vector was cultured as a negative control (-K)
and a clone of P. pastoris KM71 expressing MRP3 was used as an internal control
clone (+K) for all the experiments performed. The positive control clone was kindly
provided by Prof. Urbatsch (Texas Tech University, USA).
The OD600 and pH of these cultures were measured before starting the induction
with methanol in order to equalize the relative cell densities of all the cultures and
to compare the differences in pH. Results from one such culture measurements are
summarized in Table 3-3.
Cultures in Buffered MGYH media
Cultures in Buffered MM media
after 48 h incubation at 29 °C
after 48 h incubation at 29 °C
Cultures OD600 of Culture
pH of Culture
Cultures OD600 of Culture
pH of Culture
-K 3.43 4.86
-K 2.39 4.88 +K 5.24 4.42
+K 3.19 5.08
1B-1 6.39 3.68
1B-1 2.81 4.85 1B-2 4.09 4.65
1B-2 3.05 4.93
2D-1 5.45 4.78
2D-1 2.19 5.02 2D-2 7.01 4.25
2D-2 2.35 4.99
4A-1 6.64 4.31
4A-1 3.55 4.60 4A-2 4.84 4.20
5C-1 3.87 4.99
5C-1 6.23 4.02
5C-2 3.91 5.03 5C-2 3.27 4.84
6A-1 2.99 5.10
6A-1 5.14 4.45
6A-2 3.98 5.03 6A-2 5.75 4.18
7A-1 2.98 5.03
7A-1 5.61 4.01
7A-2 4.20
5.07 7A-2 7.21 4.38
8G-1 No growth 5.10 8G-2 No growth 5.10
Table 3-3: Values of OD600 and pH for small scale cultures after 48 h of culturing in MGYH media and MM media. The culturing was performed in 3 ml media in culture tubes. The constructs are referred by the numbers as mentioned in Table 3-2, instead of full names for convenience. The letters A, B, C etc. refers to the E. coli clones used for plasmid isolation and last number designates the internal P. pastoris clone number. The cultures for construct 8 were discarded as they showed no growth in MGYH media.
The cultures were harvested and the crude microsomes were prepared from the
pellets as described in section 5.4.1. Total protein concentrations of each sample
were measured by Bicinchoninic acid (BCA) assay (section 5.4.2).

36 Results and Discussion
Figure 3-6: Western blot analysis of small scale (3 ml) microsomal preparations from different clones of P. pastoris expressing various constructs of MRP3. The protein expression was determined after 48 h after of methanol induction. Control (-K and +K) clones were cultured, induced and harvested along with the sample clones. Equal amount (20 µg) of total protein from each sample was used for loading on 8 % SDS gel for Western blotting. The proteins were detected using Anti-MRP3 antibody (1:1000).
Equal amounts of protein samples from each clone were used for loading on SDS gel.
Protein samples were separated by SDS-PAGE, transferred to nitrocellulose
membranes via Western blot and detected by using a specific antibody against MRP3
(sections 5.4.4 and 5.4.6).
In Figure 3-6, it can be seen that the +K sample shows a band around 150 kDa, which
is the expected size of MRP3 on Western blots when detected by Anti-MRP3
antibody. The antibody also recognized a band around 130 kDa in samples 2D-1 and
2D-2, which are the clones for construct-2 (refer Table 3-2).
The same set of clones was cultured again by scaling up the culture volume (10 ml)
to reproduce the expression (Culture data for OD600 for pH value not shown).
Results obtained from two such small scale (10 ml) independent culturing and
induction experiments are summarized in Figure 3-7. Here the detection was
performed with two different lots of Anti-MRP3 antibody (with same catalog
number).
The results obtained for all the clones from three independent culturing and
induction is shown in and Figure 3-8.

Results and Discussion 37
(a)
(b)
Figure 3-7: Western blot analysis of small scale microsomal preparations from different clones of P. pastoris expressing various constructs of MRP3 from two independent culturing and induction experiments. The culturing was performed in 10 ml media in culture flasks .Equal amount (20 µg) of total protein from each sample was used for loading on 8 % SDS gel for Western blotting. The proteins were detected using Anti-MRP3 antibody (1:1000) (a) Constructs 1, 2 and 3 show overexpression of protein comparable to the positive control (+K). (b) New lot of Anti-MRP3 primary antibody showing unspecific bands at 150 kDa.
As seen in Figure 3-7 (a), the clones expressing full length MRP3, construct 2 and
construct 3 (refer chapter 2), showed the protein expression on scaling up the
cultures. The band intensities of 150kDa band in, 1B-1, 1B-2 and the 130 kDa band
in, 2D-2, 3C-1 and 3C-2 samples were comparable to +K.
But the comparative band intensities for the same set of clones changed in the next
culturing and induction attempt. In Figure 3-7 (b), the band intensity of 150 kDa
band seen in +K sample is much higher than the respective bands in 1B-1, 1B-2, 2D-
1, 2D-2, 3C-1 and 3C-1 samples.
It was also seen that during the experiments different lots of the same Anti-MRP3
primary antibody (1° AB) showed difference in the binding. As seen from Figure 3-7
(a), one lot recognizes bands at ~70 and ~90 kDa. On the other hand, a new batch of
the same AB with the same lot number showed unspecific bands at 150 kDa. So,
further Western blotting was performed using Anti-6xHis 1° AB. Results from the

38 Results and Discussion
third attempt to reproduce the expression experiments from the same clones are
shown in Figure 3-8.
Figure 3-8: Western blot analysis of protein expression from different clones of P. pastoris expressing various constructs of MRP3. Equal amount (20 µg) of total protein from each sample was used for loading on 8 % SDS gel for Western blotting. The proteins were detected using Anti-6xHis antibody (1:1000).
The expression of protein by P. pastoris clones under observation was not consistent
and reproducible. Though clones expressing constructs 1, 2 and 3 showed the
protein expression, only expression from a clone of construct 2 (2D-2) was
reproducible to some extent. So the P. pastoris clone expressing 2D-2 was sub-
cloned on YPD-100 and YPD-1000 agar plates (containing of Zeocin concentration
100 and 1000 µg/ml respectively) and used for expression analysis.
3.1.2.4 Expression of MRP3 construct 2 on small and large scale
The sub clones of clone 2D-2 were used for small scale (10 ml) culturing along with -
K and +K and expression analysis was performed again as described in section
3.1.2.3. The results for the expression of protein from sub clones were as shown in
Figure 3-9.
As seen in the Figure 3-9, different sub clones of 2D-2 selected from YPD plates with
different Zeocin concentration (100 and 1000 µg/ml), showed different band
intensities, when equal amount (20 µg) of total protein from each sample was used
for comparison. The bands for construct 2 are seen at 130 kDa while the +K band is
at 150 kDa.

Results and Discussion 39
Figure 3-9: Western blot analysis of protein expression from the sub-clones clone 2D-2 expressing construct 2. The clone 2D-2 was plated on YPD agar plates with 100 and 1000 µg/ml Zeocin concentration and the sub clones were cultured and induced for protein expression. Same amount (20 µg) of total protein from each sample was applied on 8 % SDS gel for comparison. The proteins were detected using Anti-6xHis antibody (1:1000).
The sub clone 2D-2.5 was selected for culturing and fermentation on large scale. The
fermentation was performed as described in section 5.5.1 with addition of Zeocin.
Culture samples were taken during each phase of fermentation and the protein
expression was analyzed from these samples by small scale microsomal preparation
and Western blotting as described in 5.4.1 and 5.4.6. A fermentation sample of
internal control clone (+K), was used as positive control. The Western blotting
results for the large scale fermentation are shown in Figure 3-10
Figure 3-10: Western blot analysis of large scale fermentation of clone 2D-2.5. Large scale fermentation culture samples were taken during each phase of large scale fermentation after 4 h intervals. Same amount (20 µg) of total protein from each sample was applied on 8 % SDS gel for comparison. The proteins were detected using Anti-6xHis antibody (1:1000).
.

40 Results and Discussion
3.1.3 Discussion
As seen from Figure 3-2, Figure 3-4 and Figure 3-5, the modification in the hMRP3
sequence and insertion of various DNA sequences encoding different domains of
MRP3 into the modified pPicholi expression vector was successfully done. The
expression vectors were transformed in P. pastoris for the expression of protein.
As mentioned earlier, the autonomously replicating pPicholi vector comprises many
advantages over the traditional genome integrating vectors used for cloning in
P. pastoris (MoBiTec 2003). The expression of a protein is usually proportional to its
gene copy number. As the pPicholi vector contains the P. pastoris autonomously
replicating sequences (PARS), the plasmid copy number can be controlled by
increasing or decreasing the selection pressure (Wittrup, Bailey et al. 1990). This
eliminates the need of screening of large number of P. pastoris clones after
transformation, in order to select the clone containing high copy number of plasmid.
The selection pressure can be generated by addition of sufficient quantities of the
antibiotic Zeocin to the culture media (Paulina Balbás 2004).
However, results obtained from small scale cultures of different clones containing
this expression vector were disappointing. The protein expression by these clones
was not reproducible under exact culture conditions, which can be seen in Figure
3-6, Figure 3-7 and Figure 3-8. Only a single clone (2D-2) showed a constant
expression of protein in these three independent experiments.
The reasons could be either failure to maintain the exact culture conditions or to
load equal amount of protein on SDS gels for Western blotting.
In order to maintain the similar conditions during induction, the MGYH cultures
grown to different cell densities (measured by OD600 measurements) were diluted
to equal OD600 values at the beginning of the induction. Probably, the measurement
and adjusting the OD600 to equalize the number of cells was not enough to maintain
constant culture conditions for methanol induction. This is because OD600 values
give only a rough estimate of the number of cells present in the media, irrespective
of their growth state or viability. So, the ‘health’ of the cultures before induction
could not be measured by this method, which may vary for different cultures. Many

Results and Discussion 41
factors affect the viability and growth of the culture which include the age of the
colony picked for culturing, number of viable cells from the picked colony, growth
phase of the cells growing in the culture etc. These factors cannot be controlled with
the OD600 measurements and equalizing the values for cultures leads to a difference
in the methanol utilization among the cultures grown under similar culture
conditions (Evans 1996).
Another reason could be the incorrect loading of the samples for Western blot
analysis. The protein amounts on each crude preparation of microsomes for
different clones were measured by BCA assay. This assay provides better tolerance
to commonly encountered interfering agents in the cell lysate preparations such as
nonionic detergents and simple buffer salts (Smith, Krohn et al. 1985), but this assay
is highly sensitive towards reducing agents and other commonly found sugars in the
cells (Brown, Jarvis et al. 1989). Moreover, it is already shown that the presence of
lipids in samples can cause a significant error in the analysis of proteins by this
procedure (Kessler and Fanestil 1986). This reduces the accuracy of the method for
the total protein concentration measurements from yeast cell lysates, which could
be a possible reason for the non-reproducibility of the Western blot experiments
performed for the detection of the protein of interest.
Moving on with the single clone showing slightly reproducible results, the
expressing clone 2D-2 was sub cloned on YPD agar plates with different
concentration of Zeocin and these sub-clones were analyzed for protein expression.
The sub-clones showed a large difference in the expression of protein, which was
unexpected (Figure 3-9). As these sub-clones were obtained from a single parent
clone, they were expected to show a similar expression profile of the protein under
similar culturing conditions and selection pressure. But the large difference in the
protein amounts expressed under similar conditions indicates that the copy number
of this autonomously replicating vector may vary among the sub-clones as well.
From Figure 3-9, it can also be concluded that the increasing selection pressure
might not always maintain a high copy number of a plasmid. The sub-clones 2D-2.1
and 2D-2.2 grown on an YPD plate containing 1000 µg/ml Zeocin were expected to
show a high expression of protein like the other three (2D-2.3, 2D-2.4 and 2D-2.5)
42 Results and Discussion
clones. But surprisingly the expression levels in these two sub-clones were lower
than the sub-clones grown on the same YPD agar plate. This may be because the
plasmid might have been lost from the cells randomly during the growth on YPD
plate or during the culturing in MGYH media.
Even the clone 2D-2.5 from YPD-1000 plate which showed high expression of
protein on small scale culturing, expressed no protein at all when scaled up (refer
3.1.2.4). This may be because the 100 µg/ml concentration of Zeocin in the
fermenter was not enough to retain the plasmid inside the P. pastoris cells grown to
a high density in the fermenter. So the loss of this autonomously replicating plasmid
from the cells was possible. It is known from the literature that the autonomously
replicating plasmids are unstable when the selection pressure is not maintained
(Stearns, Ma et al. 1990). Unfortunately, use of further higher concentrations of
Zeocin in the fermenter is not possible for economic reasons.
To summarize, the autonomously replicating plasmids were not suitable for the
large scale protein expression in yeast.

Results and Discussion 43
3.2 Expression and purification of hMRP3 using genome
integration method
The expression of MRP3 and its constructs using the autonomously replicating
pPicholi vector led to non-sufficient results, showing a non-reproducible expression
pattern in small scale cultures and complete lack of expression in large scale
fermenter cultures, even when fermented under controlled conditions. After the
unsuccessful attempt to express the protein using autonomously replicating pPicholi
vector, the next step was to test the expression using a genome integration method.
The genome integration method was performed with two different vectors (pPicholi
and pPICZ A) with the different positions of the purification tag.
3.2.1 Expression and purification using C-terminal purification tag
3.2.1.1 Aims and rationale
As the expression of proteins using autonomously replicating vector was
unsuccessful, it was absolutely essential to develop another method to express the
protein. Because genome integration method is a routinely used method for
expression of heterologous proteins in yeast, we decided to proceed with this
method.
Aim of this part was to integrate the existing autonomously replicating expression
vector pPicholi into P. pastoris genome and generate clones which can express MRP3
protein in detectable amounts and purify the expressed protein by affinity
chromatography using the Strep tag II and 8xHis purification tags inserted in the
protein sequence.

44 Results and Discussion
3.2.1.2 Results
3.2.1.2.1 Linearization, genome integration of the pPicholi vector and
selection of MRP3 expressing clones
The modified pPicholi vectors with MRP3 sequence and its truncated versions were
linearized with the FastDigest restriction enzyme MssI (Fermentas), cleaned and
transformed into competent P. pastoris KM71H cells ( see appendix 6.3.3) following
the steps described in 5.2.1, 5.2.3., 5.2.4, 5.2.7.2, 5.1.1.2 and 5.1.1.3. The restriction
site for MssI (PmeI) lies in the AOX1 promoter sequence of the plasmid. Exact
position of the restriction site is shown in the vector map in the appendix 6.3.
From the many P. pastoris clones grown after transformation, clones from YPD
plates with different Zeocin concentration were chosen and cultured for screening
the expressing clones (section 5.1.1.1). A clone transformed with empty vector (-K)
and the internal control clone (+K) were cultured as negative and positive controls
for expression respectively. The culturing was performed without addition of Zeocin
to the media. The OD600 values were adjusted to be equal for all cultures in order to
keep methanol concentration fairly constant during the induction.
The methanol induced cultures were harvested and crude microsomes were
prepared as described in section 5.4.1. Total protein concentrations of each sample
were measured by BCA assay (section 5.4.2).
Protein samples were separated by SDS-PAGE, transferred to nitrocellulose
membranes via Western blot and the proteins of interest were detected by using a
specific antibody against the 6xHis tag (sections 5.4.4 and 5.4.6). The results for
protein expression by different clones from three independent culturing
experiments are summarized in Figure 3-11.
As seen from the Western blot for three independent culturing experiments, the
clones were able to express the protein even in absence of the selection pressure
(Zeocin) in the MGYH media.
The clone 1000-1 showed a light band at around 150 kDa in all the experiments,
which was comparable to the size of the protein expressed by the +K. The clone

Results and Discussion 45
1000-1 showed reproducible results with respect to the expression, though the
amount of protein expressed in equal amount of total protein was sometimes lower
(Figure 3-11 a, c) and sometimes higher (Figure 3-11 b) than the positive control +K.
Other two clones 1000-6 and 1000-7 also showed a band around 150 kDa in both
the experiments in which they were tested (Figure 3-11 b, c). The intensities of the
150 kDa band varied for all the clones in comparison to the +K in independent
culturing, even when same amount of total protein (20 µg) was loaded. In all the
blots the negative control –K did not show any band around 150 kDa.
Figure 3-11: Western blot analysis of small scale microsomal preparations from three independent culturing and induction experiments with different clones of P. pastoris. The clones were transformed with linearized pPicholi plasmids containing MRP3 gene insert. Total induction time and addition of 0.5 % methanol for each cultured is mentioned on right side. Controls (-K and +K) clones were cultured, induced and harvested along with the sample clones. The number 1000 in the clone name refers to the concentration of Zeocin in µg/ml in the YPD agar plate from which the clone was selected. Same amount (20 µg) of total protein from each sample was applied on 8 % SDS gel for comparison. The proteins were detected using Anti-6xHis primary antibody.
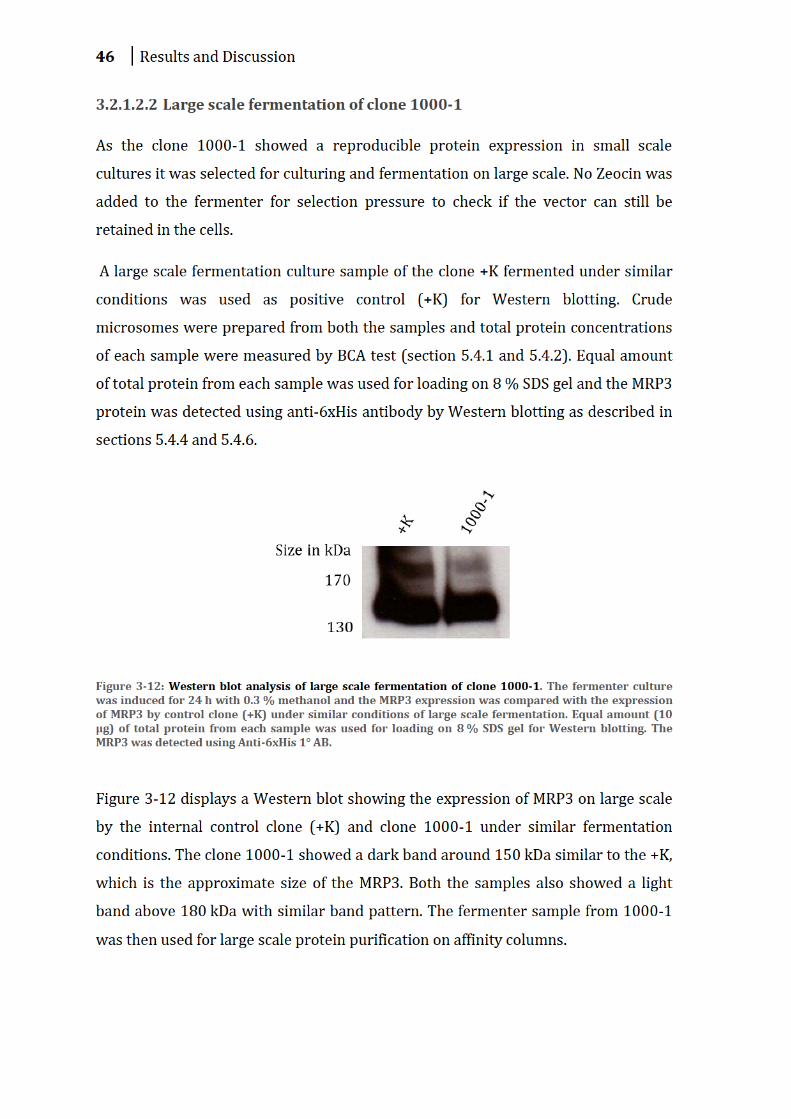
46 Results and Discussion
3.2.1.2.2 Large scale fermentation of clone 1000-1
As the clone 1000-1 showed a reproducible protein expression in small scale
cultures it was selected for culturing and fermentation on large scale. No Zeocin was
added to the fermenter for selection pressure to check if the vector can still be
retained in the cells.
A large scale fermentation culture sample of the clone +K fermented under similar
conditions was used as positive control (+K) for Western blotting. Crude
microsomes were prepared from both the samples and total protein concentrations
of each sample were measured by BCA test (section 5.4.1 and 5.4.2). Equal amount
of total protein from each sample was used for loading on 8 % SDS gel and the MRP3
protein was detected using anti-6xHis antibody by Western blotting as described in
sections 5.4.4 and 5.4.6.
Figure 3-12: Western blot analysis of large scale fermentation of clone 1000-1. The fermenter culture was induced for 24 h with 0.3 % methanol and the MRP3 expression was compared with the expression of MRP3 by control clone (+K) under similar conditions of large scale fermentation. Equal amount (10 µg) of total protein from each sample was used for loading on 8 % SDS gel for Western blotting. The MRP3 was detected using Anti-6xHis 1° AB.
Figure 3-12 displays a Western blot showing the expression of MRP3 on large scale
by the internal control clone (+K) and clone 1000-1 under similar fermentation
conditions. The clone 1000-1 showed a dark band around 150 kDa similar to the +K,
which is the approximate size of the MRP3. Both the samples also showed a light
band above 180 kDa with similar band pattern. The fermenter sample from 1000-1
was then used for large scale protein purification on affinity columns.

Results and Discussion 47
3.2.1.2.3 Isolation, Solubilization and purification on Ni-NTA column
The culture obtained from the large scale fermentation of yeast cells was harvested
and disrupted with glass beads as described in section 0. The microsomal fractions
after the disruption were solubilized and ultracentrifuged to get the soluble fraction
(section 5.5.3).
The soluble fraction was directly loaded on a Ni-NTA (nitrilotriacetic acid) column
for affinity purification followed by concentration on 100 kDa and 30 kDa exclusion
size Amicon membrane filters (Section 0).
Equal volumes of samples from ultracentrifugation and purification steps were
analyzed by SDS-PAGE and subsequent silver staining (sections 5.4.4 and 5.4.5.2).
Figure 3-13: Silver staining of SDS-PAGE for analysis of the collected samples during the ultrafiltration. The samples UC-S and UC-P (Ultracentrifugation – Supernatant and Ultracentrifugation – Pellet) are the soluble and insoluble fractions after ultracentrifugation of the solubilized microsomes. FT is the unbound fraction dripped from Ni-NTA column after overnight binding of the soluble fraction on the column. W1 and W2 are the samples from washing of the columns with washing buffer containing 30 mM and 40 mM Imidazole respectively. F-100 and F-30 are filtrates taken during the ultrafiltration with the 100 kDa and 30 kDa Amicon membranes respectively. In the Elution lane is the final product of the Ni-NTA purification process, the concentrated protein solution of MRP3.
In Figure 3-13, lanes UC-S and UC-P (Ultracentrifugation – Supernatant and
Ultracentrifugation – Pellet) show the fractions obtained after ultracentrifugation of
the solubilized sample. The flow through in the third lane (FT) is the unbound
protein from the UC-S loaded on the column. A subsequent washing step with

48 Results and Discussion
washing buffer containing 30 mM Imidazole W1 eluted proteins of various sizes,
which can be seen as light bands around 120, 80 and 38 kDa. Next washing step W2
(with 40 mM Imidazole) also eluted a single protein with a band of 38 kDa.
The filtrate sample after ultrafiltration with the 100 kDa Amicon membrane (F-100)
showed a light band around 150, 80 and 55 kDa while filtrate after ultrafiltration
with the 30 kDa membrane (F-30) showed no visible band of protein. The elution
fraction containing concentrated protein showed many protein bands including dark
bands at around 80, 70, 55 and 40 kDa. This also showed a large band scattered
between 130 and 150 kDa, which probably is the concentrated MRP3.
The amount of MRP3 in the concentrated sample was calculated by measuring the
absorption at 280 nm (A280) on Nanodrop and the elution sample was used for
purification on a Strep-tactin affinity column.
3.2.1.2.4 Purification on Strep-tactin column
The expressed MRP3 protein also contained the purification tag Strep tag II which
was used for the binding and purification on Strep-Tactin affinity column.
The purification was performed by using spin columns and all the washing and
elution steps were performed as described in section 5.5.5.
Same volume from each fraction of purification was loaded on 8 % SDS gel and the
proteins were separated by SDS-PAGE. The separated proteins were transferred to
nitrocellulose membranes and MRP3 was detected in each lane by Western blotting
with Anti-MRP3 antibody [M3II-9] Sections 5.4.4 and 5.4.6).
The lane Ni-NTA elution is the concentrated protein sample obtained after
purification on Ni-NTA column (Figure 3-13), which was used for loading on the
Strep-tactin column. This lane shows a dark band spread over 70 to 200 kDa and
also till the starting point of the SDS gel. FT is the unbound fraction, which also
shows approximately same bands and intensity as the first lane. The samples W1-
W5 are the fractions obtained after washing the column with wash buffer. The lane
W1 was also crowded with different bands of various sizes (70 to 200 kDa) while the
sample W2 showed only 2 bands at 150 and around 200 kDa. The Elution sample is

Results and Discussion 49
the mixture of all the elution fractions. This elution fraction did not show any band
for MRP3.
Figure 3-14: Western blotting of the Strep-tactin purified MRP3 protein sample. The sample Ni-NTA Elution is the purified and concentrated protein after the Ni-NTA column purification, directly loaded on the Strep-tactin spin column for binding. FT is the unbound fraction after 2 h of incubation. W1 to W5 are the samples from washing of the columns with washing buffer. Elution is the mixed sample of all the eluted fractions. Same volume (20 µl) of each sample was applied on 8 % SDS gel for comparison. The proteins were detected using Anti-MRP3 antibody [M3II-9] (1:2000).
3.2.1.2.5 Purification of a control protein on Strep-tactin column
In order to solve the problem of purification on Strep-tactin column it was necessary
to know the factors affecting the binding of protein to the column. To check, if the
detergent n-dodecyl β-D-Maltopyranoside (DDM), used for solubilization of the
protein, is the problem in binding, we decided to test the binding of a protein known
to have a Strep tag II sequence under the similar detergent concentrations.
For this purpose, a 40 kDa pure and soluble protein expressed in from E. coli was
provided by Julian Matern (Prof. Mootz’s group, Institute of Biochemistry,
Muenster). This protein also had Strep tag II.

50 Results and Discussion
This control protein was mixed with bovine serum albumin (BSA) in equal amount
and dissolved in Ni-NTA elution buffer to mimic the final buffer composition and
DDM concentration as the Ni-NTA eluted MRP3. This protein mixture was loaded on
the same Strep-tactin spin column (regenerated before use as described in 5.5.5)
purified exactly as described in 3.2.1.2.4.
The Strep-tactin column purification was analyzed by SDS-PAGE and subsequent
Coomassie staining (sections 5.4.4 and 5.4.5.1.1)
Figure 3-15 shows the SDS-PAGE analysis results of the purification of the control
protein on Strep-tactin column. The sample is the mixture of the control protein and
BSA. The lane loaded with this mixture showed an expected band at 40 kDa and
around 67 kDa for control protein and BSA respectively. Apart from these two bands
the lane also showed various bands around 70, 88, 140, 200 kDa and at the starting
of the separating gel. The lane FT (flow through) shows two dark bands at 40 and
68 kDa and a really light band at 88 kDa. The bands seen in FT get lighter in W1 and
W2 and completely disappear W3, W4 and W5 (W=Wash). The elution fraction
shows only the dark 40 kDa band and a very light protein band around 80 kDa.
Figure 3-15: Coomassie staining of SDS-PAGE analysis of Strep-tactin column purification of the control protein. The sample Protein mixture is the equal amount mixture of BSA and the control protein known to have Strep tag II. FT is the unbound fraction dripped from the spin column after incubation for 2 h. W1 to W5 are the samples from washing of the columns with washing buffer. Elution is the mixed sample of all the eluted fractions. Same volume (20 µl) of each sample was applied on 8 % SDS gel for comparison .The control protein is seen in the elution fraction.

Results and Discussion 51
3.2.1.2.6 Purification on Strep-tactin column after removal of His tag
In order to check if the middle position of the Strep tag II was affecting the
interaction between the Strep tag II and the column material, we decided to cleave
off the poly-His tag from the MRP3 protein and check for the binding and
purification again.
As shown in Figure 3-1, the C-terminal purification tag contains a 3C protease
cleavage site between Strep tag II and 8xHis sequence. So, the His tag could be
removed from the protein by cleavage with 3C protease.
The protease cleavage reaction was set up with different amounts of Protein purified
on Ni-NTA column as described in section 5.4.7.1.
The removal of His tag was checked by SDS-PAGE and subsequent Western blotting
with Anti-MRP3 and Anti 6xHis antibody (5.4.4 and 5.4.6).
Figure 3-16: Western blot analysis of the overnight 3C protease cleaved MRP3 protein samples. The values 5, 10, 20 and 50 µg indicates the amount of purified MRP3 used for cleavage of 3C protease in a 100 µl reaction. –K represents the reaction mixtures except without 3C protease and 3C denotes the mixtures with the addition of proteases. In the picture same membrane was stripped after 6xHis antibody treatment and incubated with Anti-MRP3 antibody [M3II-9] (1:2000) afterwards to visualize the protein.
In Figure 3-16 (a), all lanes labeled as 3C showed a single sharp band around 35 kDa
when treated with Anti-6xHis antibody while the same samples without 3C protease
treatment (labeled as –K) showed a distinct band at 150 kDa along with other bands
around 55, 60, 65, 70,180 and 200 kDa. The band pattern was same in all the lanes

52 Results and Discussion
with 10, 20 and 50 µg of protein sample while no protein was detectable in the lane
with 5 µg sample lane except the sharp band at 35 kDa.
Figure 3-16 (b) shows the same blot stripped and incubated with Anti-MRP3
antibody [M3II-9] to visualize the protein. All the lanes in this blot show dark bands
around 80, 130, 150 and 170 kDa. The band intensities increase from left to right as
the concentration of the Ni-NTA purified MRP3 increases in the sample. At all the
concentrations, lanes –K and 3C show the same band pattern and intensities.
All the samples used to load 3C lanes were mixed and diluted 1:1 with 2x Ni-NTA
elution buffer applied to the Strep-Tactin spin columns and the purification was
performed exactly as described in section 3.2.1.2.4.
Equal volume of samples from various purification steps were analyzed by SDS-
PAGE and subsequent Western blotting by Anti-MRP3 antibody [M3II-9] (1:2000) as
described in sections 5.4.4 and 5.4.6.
Figure 3-17: Western blotting of the 3C protease cleaved MRP3 protein purified on Strep-tactin spin column. The sample after 3C protease cleavage was diluted 1:1 with 2x Ni-NTA elution buffers and directly applied to the Strep-tactin spin column for binding. FT is the unbound fraction after 2 h of incubation. W1 to W5 are the samples from washing of the columns with 1 CV washing buffer. E1-E3 are the elution fractions which are 4x concentrated compared to the sample used for loading. Same volume of each sample was applied on 8 % SDS gel for comparison. The proteins were detected using Anti-MRP3 antibody [M3II-9] (1:2000).
Figure 3-17 shows dark bands around 70, 90 and 150 kDa in the lane FT (flow
through). Lanes W1, W2 (wash samples) also show similar bands, but less intense

Results and Discussion 53
than in FT. A 150 kDa band with almost equal intensity is seen in W3, W4, W5 and
E1, E2, E3 sample.
3.2.1.2.7 Purification on Strep-tactin column after mild denaturation by SDS
In order to check if the mild denaturation of the expressed MRP3 could improve the
purification on Strep-tactin column, we decided to denature the protein under mild
denaturing conditions.
To do so, the microsomal fractions after the disruption of the cells (section 0) were
solubilized and ultracentrifuged as described in 5.5.3. In order to denature the
protein, the solubilization was performed at room temperature (RT) with 1 %
denaturing detergent sodium dodecyl sulfate (SDS).
Figure 3-18: Western blotting of the denatured MRP3 protein purified on Strep-tactin spin column. The microsomal fractions of P. pastoris were solubilized at RT with 1 % SDS for mild denaturation. The soluble fraction of the denatured sample obtained after ultracentrifugation was loaded on Strep-tactin column for purification. FT is the unbound fraction after 2 h of incubation on Strep-tactin column at RT. W1 to W5 are the samples from washing of the columns with 1 CV (column volume) washing buffer. E1-E3 are the elution fractions which are 4x concentrated compared to the sample used for loading. Same volume of each sample was applied on 8 % SDS gel for comparison. The proteins were detected using Anti-MRP3 antibody [M3II-9] (1:2000).
The soluble fraction after ultracentrifugation was directly loaded on Strep-Tactin
spin column and purification was performed at RT exactly as described under
section 5.5.5 The results after SDS-PAGE and subsequent Western blotting analysis

54 Results and Discussion
by Anti-MRP3 antibody [M3II-9] (sections 5.4.4 and 5.4.6) after Strep-tactin
purification are shown in Figure 3-18.
In the Figure 3-18, dark bands around 75, 90, 130, 150 and 200 kDa can be seen in
samples FT, W1 and W2. The bands in FT and W2 are much more intense and almost
black. These three lanes also show light bands around 38, 40 and 55 kDa. Other
lanes containing washing and elution samples (W3, W4, W5 and E1, E2, E3) show
only very light bands at 200 kDa (may be just at beginning of wells). W3 lane also
shows a very light band at 90 kDa.
3.2.1.3 Discussion
It was obvious from section 3.1.3, that the pPicholi vector is unable to express
recombinant protein on large scale when allowed to replicate autonomously in the
cells. This is probably because the vector is lost from the P. pastoris cells when the
selection pressure is not high enough (Duret, Andre et al. 2005; Colin Ratledge
2006).
It is known from the literature that the genetic modification in the genome of any
organism is possible by insertion of foreign DNA which contains a homologous
region with the genomic DNA sequence(s). This allows the transfer of any
modification of the cloned gene into the genome of a living cell (Stearns, Ma et al.
1990; San Filippo, Sung et al. 2008).
The pPicholi vector, though originally designed for autonomous replication, also
contains elements which can drive the homologous recombination events with the
P. pastoris genome. The AOX1 promoter sequence or the AOX1 transcription
termination region (TT) from pPicholi vector can recombine with the aox1::ARG4
gene sequence from the KM71H strain (details in section 6.3.3) of P. pastoris via
single crossover or multiple event resulting in the insertion of one or more copies of
the vector upstream or downstream of the aox1::ARG4 gene (Cregg, Barringer et al.
1985; Cregg, Tolstorukov et al. 2009).

Results and Discussion 55
This recombination event may also occur with non-linearized plasmid, but at a lower
frequency. Linearization of plasmids at a restriction enzyme site located in the AOX1
sequence facilitates such gene insertion events (Invitrogen 2010).
The plasmid was linearized by restriction at MssI (PmeI) enzyme site which lies
inside the AOX1 promoter sequence (MoBiTec 2003). As seen from Figure 3-11 and
Figure 3-12 the expression of MRP3 after linearization of the plasmid was successful
and reproducible without addition of Zeocin to the media on both small and large
scale.
This supports the possibility of stable integration of the plasmid. In any case, the
protein was now successfully expressed on large scale and was available for further
purification steps.
After the successful production on large scale (Figure 3-12), the next step was to
solubilize and purify the protein for biochemical measurements. For the
solubilization step the nonionic detergent DDM was selected as it was shown
previously to solubilize the protein without affecting activity of the protein.
Following the solubilization, the protein was purified on Ni-NTA column with a
known protocol for purification. (Chloupkova, Pickert et al. 2007; Zehnpfennig,
Urbatsch et al. 2009).
Figure 3-13 shows the result for Ni-NTA column purification. It is seen in the picture
that apart from the recombinant protein containing His tag, many other proteins
were bound to the column, which were eluted either with mild washing steps (W1,
W2) or with strong elution buffer (Elution lane). In the elution sample many bands
were seen at different sizes showing that the protein was not pure and was
contaminated with other proteins. So, further purification was mandatory to achieve
highly pure protein needed for reconstitution in liposomes and ATPase activity or
transport measurements.
The subsequent purification on the Strep-tactin column was performed, but the
purification led to disappointing results. In Figure 3-14, the dark bands seen in at
150 kDa in FT, W1 and W2 lanes indicate that the MRP3 was lost in the flow through
and subsequent washing steps. Other smaller bands recognized by antibody could

56 Results and Discussion
be the fractions of protein generated by action of proteases or by random
disintegration during freeze thaw cycles. As no band was seen in the elution fraction,
it was clear that the purification did not work indicating the incapability of protein
to bind to the column.
To confirm that the conditions like buffer composition and presence of detergent are
not affecting the binding of protein to the column, purification was performed under
similar conditions with a control protein expressing Strep tag II (Figure 3-15). The
protein was mixed with BSA to ‘contaminate’ and then test the purification. The
protein mixture on the gel shows the expected 40 kDa band for the protein and the
69 kDa band for BSA. Other bands seen at 70 kDa, 140 kDa and 200 kDa could be
impurities, dimers and aggregates of BSA respectively, as these bands are seen in FT
and other washes (W1, W2), which indicates that these are not binding to the
column. On the other hand, a band seen at 88 kDa in the protein mixture lane does
not appear in the FT or washes, which implies that this could be a dimer of the
control protein which bound to the column and did not wash away in the washing
steps.
The 40 kDa and 80 kDa bands reappeared in the elution fraction, concluding that the
control protein was able to bind to the Strep-tactin column under similar conditions
of buffer and detergent. A notable part of the control protein was also seen in in FT
and W1 samples, showing a large unbound fraction. It is already known from the
literature that the efficiency of the Strep-tactin column is around 50-60 % and so
some protein loss was expected (De Giuseppe, Forti et al. 2010).
In the literature, the combination of His and Strep tag II was often used successfully
for the purification of many mammalian proteins (Li 2010). So, the possibility of His
tag affecting the binding of Strep tag II with the Strep-tactin resin was almost
negligible. Still in order to check if this could be a problem, the purification was
repeated after successful removal of the His tag from the protein (Figure 3-16 and
Figure 3-17).
In Figure 3-16 (a), the blot was developed using Anti-6xHis antibody. In this blot all
the samples labeled as 3C (in which the protein was treated with 3C protease) show
a strong band at 35 kDa, which is the size of recombinant, His tagged HRV 3C

Results and Discussion 57
protease. The –K samples (without protease) show the expected MRP3 band at
150 kDa which are not seen in 3C samples. This indicates that the His tag was
removed from the MRP3 and was not detectable by the Anti-6xHis antibody
anymore. Bands seen at 55 and 60 kDa could be other proteins from P. pastoris as
these appear in both, 3C and –K lanes. However, the 65 kDa band seen in –K lane
could be a degradation product of MRP3, as this band is not seen after the 3C
protease treatment.
In order to confirm that the failure to recognize MRP3 bands by the 6xHis antibody
is caused by the removal of the tag and not by the absence of protein itself, the
membrane was stripped and treated with Anti-MRP3 antibody [M3II-9] Figure 3-16
(b)). The antibody is very strong and detects the protein even when present in
smaller amounts. The antibody showed many smaller and larger bands than
150 kDa (size of MRP3), which possibly could be various degradation and
aggregation products of the protein caused by the storage at 4 °C for longer time.
The possibility of unspecific cleavage by 3C protease is ruled out as both, –K and 3C
samples, show the same the band pattern. The 65 kDa band seen in –K sample in
Figure 3-16 (a) is also seen in Figure 3-16 (b), indicating this to be a degradation
product and not another protein from P. pastoris. In summary, all the samples
labeled as 3C contained MRP3 without His tag.
The MRP3 samples with removed His tag were again purified on Strep-tactin column
(5.5.5). The results shown in Figure 3-17 indicate that the removal of the His tag did
not improve the binding of the protein to the Strep-tactin column. The lane FT shows
a very dark band when treated with Anti-MRP3 antibody [M3II-9], showing the loss
of protein. Subsequent washes (W1, W2) removed the protein completely from the
column which can be seen as dark bands in the lanes. Remaining lanes (W1, W2, W3
and E1, E2, E3) show only a small quantity of protein, which is seen as a light band at
150 kDa. A slightly darker band in E2 compared to E1 indicates a very poor binding
to the column. To summarize even the removal of His tag did not improve the
binding.
As it was confirmed that removal of His tag had no effect on the binding of protein to
the Strep-tactin column, the protein was denatured with SDS. This treatment will

58 Results and Discussion
change the protein conformation and may expose the Strep tag II, if hidden inside
and unavailable for the interaction with Strep-tactin column. As seen from the Figure
3-18, even the denaturation of the protein did not improve the binding. This can be
seen from dark bands in first three lanes FT, W1 and W2 in which most of the
protein was seen. Again a slightly darker band in E2 fraction compared to E1
indicates very little binding. But when compared to the amount of protein lost in FT,
W1 and W2 the light band in concentrated E2 fraction had negligible protein, which
means that the purification on the Strep-tactin column was unsuccessful even after
denaturation of the protein.
Further attempts were not performed with stronger denaturation conditions as this
probably would lead to protein aggregation and even if it would be successful, such a
purification product could not be used for further experiments. So, finding the
reasons behind the non-binding of purification tag and solving the purification
problem was essential to proceed.
The Strep tag II is a small 8 amino acid peptides with no known effect on the
trafficking, activity and/or the folding of the protein (IBA 2011). In the light of these
facts, any conclusion made about the interactions would be futile.
Considering the observations made so far, it was assumed, that the yield of protein
after Strep tag II purification is different for different proteins. However, sometimes
altering the position of the tag (C or N terminal) could help to improve the binding
(Volkmann 2011). So the cloning strategy was changed for the constructs and it was
decided to use an N- terminal Strep tag II for MRP3 purification.

Results and Discussion 59
3.2.2 Expression and purification using N and C-terminal purification
tags
3.2.2.1 Aims and rationale
As the tandem affinity purification tag on C-terminus of the expressed protein did
not work, a new system had to be designed for the expression and purification.
From the experiments with pPicholi vector and literature it was clear that the
genome integration method was a better choice for stable integration of the insert
gene into the genome of P. pastoris (Romanos, Scorer et al. 1992). For the new
cloning strategy, a more commonly used genome integrating vector pPICZ A was
chosen for cloning which has been extensively used for expression of soluble and
membrane protein expression (Obiezu, Soosaipillai et al. 2002; Chloupkova, Pickert
et al. 2007; Wetterholm, Martinez Molina et al. 2008).
Figure 3-19: Schematic representation of the expression cassette for ABCC3 and its truncated versions for expressing in P. pastoris. This strategy encodes Strep tag II affinity tag at N-terminal of the protein separated by a Factor Xa protease cleavage site. The C-terminal sequence consists of 3C-protease cleavage site (3C) and poly-His (6xHis) tag. In addition, the vector contains Kozak-like bases (P. pastoris Kozak), important for high-level expression in P. pastoris, in the region before Strep tag II sequence.
Aim of this part was to perform all the cloning work by changing the vector and
purification tag system and express the MRP3 and its truncated versions into
P. pastoris again. The expressed protein would then be purified with a Ni-NTA and a
Strep-tactin column. To achieve this expression, the pPICZ A vector had to be
modified in order to insert the Strep tag II and the protease cleavage sites.

60 Results and Discussion
3.2.2.2 Results
3.2.2.2.1 Modification of pPICZ A vector and ligation of MRP3 gene sequences
into new vector
As the cDNA sequence of MRP3 and its truncated versions were already cloned and
sequenced in pPicholi vector, this time a new strategy was utilized for modification
of vector and transfer of constructs from pPicholi to pPICZ A vector.
The multiple cloning site (MCS) in the commercial pPICZ A vector has the c-myc
epitope and a 6xHis tag for the addition of a tandem affinity tag at the C-terminal
end of the protein (Figure 3-20). To replace the c-myc epitope by Strep tag II
sequence along with the protease cleavage sites designed for the cloning (Figure
3-19), a custom oligonucleotide pair was used (Figure 3-20).
Figure 3-20: Schematic representation of the modification of in the multiple cloning site (MCS) of the pPICZ A vector. A complementary oligonucleotide pair containing Kozak-like bases (P. pastoris Kozak), Strep tag II affinity tag, a Factor Xa protease cleavage site and the 3C-protease cleavage site was used for the modification. Annealing of the two complementary oligonucleotide would result in a dsDNA fragment with KpnI restriction like cohesive end at 5’ and SalI restriction like cohesive end at 3’. These cohesive ends can be used for the replacement of the c-myc epitope of the pPICZ A vector with the new oligonucleotide sequence. The AscI and SacII restriction sites in the oligonucleotide, between Factor Xa site and 3C protease site would allow the cloning of MRP3 sequences from old vector (pPicholi) into new vector.

Results and Discussion 61
The two single stranded DNA oligonucleotides were annealed and phosphorylated
as described in 5.2.12. The pPICZ A vector restricted with KpnI and SalI enzymes,
cleaned as described in 5.2.4 and 5.2.7. The restricted plasmid was ligated with the
annealed oligonucleotides and was transformed into TOP10F’ E. coli cells (5.2.8 and
5.1.2.3).
The positive clones with modified vector were selected by colony PCR as described
in section 5.2.9.2. After modification, the vector was sequenced (5.2.11) before using
it for further experiments.
The pPicholi vectors containing old sequenced MRP3 DNA sequences and the
modified pPICZ A vector were restricted with AscI and SacII enzymes (5.2.4). The
restricted samples were cleaned, ligated and transformed in Top10F’ E. coli
(sections 5.2.5 , 5.2.6, 5.2.4, 5.2.7.2, 5.2.8 and 5.1.2.3). The positive clones with
modified vector were selected by colony PCR (section 5.2.9.2) and were transformed
into P. pastoris as described in 3.2.2.2.1 and 5.1.1.3. A primer pair of ‘Strep tag II For’
and ‘AOX1 3’ Rev’ was used for all colony PCRs performed in order to differentiate
from the old vector.
3.2.2.2.2 High throughput screening of P. pastoris clones for expression of
MRP3
The high throughput screening of clones was performed as described in section
5.4.2. A constitutively expressed protein, glyceraldehyde-3-phosphate
dehydrogenase (GAPDH), was detected by a GAPDH specific antibody and used as
loading control. Results from two independent high throughput screening
experiments are summarized in Figure 3-21.
Figure 3-21, shows the results from two independent culturing and induction
experiments performed in 24 well plates for high throughput screening of clones
expressing MRP3 (5.4.2). After running of the samples on SDS gel and wet transfer,
the membranes were cut at 90 kDa horizontally; the upper and lower halves were
treated with different antibodies (Sections 5.4.4 and 5.4.6).

62 Results and Discussion
In both, the upper blots of figures (a) and (b), many clones show a band around
150 kDa, similar to a band shown by control protein (+K), which is the expected size
of MRP3. The GAPDH antibody recognized a band around 72 kDa.
Figure 3-21: Western blot analysis of high throughput screening of different clones of P. pastoris transformed with modified pPICZ A plasmids with MRP3 gene insert. The protein expression was determined after 24 h of methanol induction. The controls -K and +K (as described in 3.1.2.3), clones were cultured, induced and harvested along with the sample clones in the same 24 well plate. The numbers 100 or 500 refers to the concentration of Zeocin in µg/ml in the YPD agar plate from which the clone was selected. 15 µl samples from each cell lysate were loaded on 8 % SDS gel and analyzed by Western blotting. The MRP3 was detected using either Anti-6xHis AB (1:1000) (a) or Anti-MRP3 antibody [M3II-9] (1:2000) (b) (both upper blots) and GAPDH was detected by Anti-GAPDH antibody (1:4000).
The amount of MRP3 expressed per cell was calculated by comparing the intensities
of bands shown by MRP3 and GAPDH antibodies with ImageJ software and
normalized to the MRP3 expressed by the internal control clone (+K) (data not
shown). The amount of protein expressed by identical clones varied in independent
cultures, so the clone showing moderate expression in all the cultures (100-5) was
chosen for large scale fermentation.
3.2.2.2.3 High throughput screening of P. pastoris clones for expression
truncated versions of MRP3
Apart from the full length MRP3, the other truncated versions were also checked for
expression using high throughput screening method (sections 5.4.2, 5.4.4 and 5.4.6).
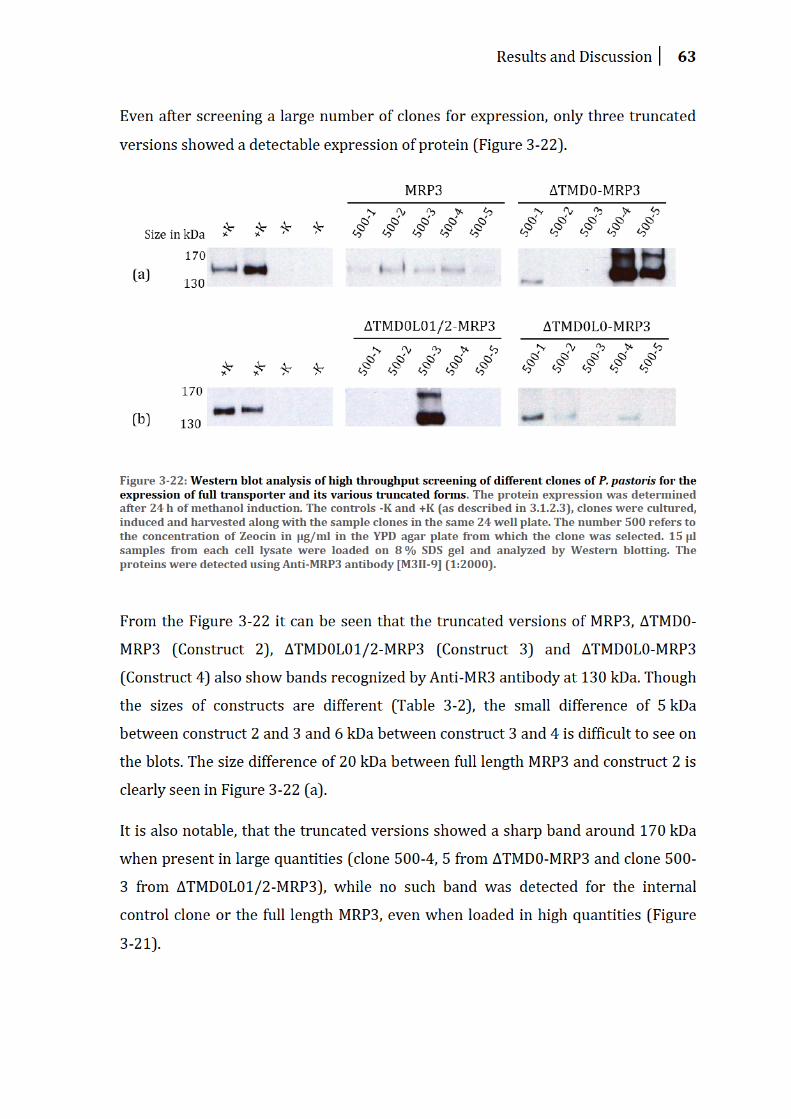
Results and Discussion 63
Even after screening a large number of clones for expression, only three truncated
versions showed a detectable expression of protein (Figure 3-22).
Figure 3-22: Western blot analysis of high throughput screening of different clones of P. pastoris for the expression of full transporter and its various truncated forms. The protein expression was determined after 24 h of methanol induction. The controls -K and +K (as described in 3.1.2.3), clones were cultured, induced and harvested along with the sample clones in the same 24 well plate. The number 500 refers to the concentration of Zeocin in µg/ml in the YPD agar plate from which the clone was selected. 15 µl samples from each cell lysate were loaded on 8 % SDS gel and analyzed by Western blotting. The proteins were detected using Anti-MRP3 antibody [M3II-9] (1:2000).
From the Figure 3-22 it can be seen that the truncated versions of MRP3, ΔTMD0-
MRP3 (Construct 2), ΔTMD0L01/2-MRP3 (Construct 3) and ΔTMD0L0-MRP3
(Construct 4) also show bands recognized by Anti-MR3 antibody at 130 kDa. Though
the sizes of constructs are different (Table 3-2), the small difference of 5 kDa
between construct 2 and 3 and 6 kDa between construct 3 and 4 is difficult to see on
the blots. The size difference of 20 kDa between full length MRP3 and construct 2 is
clearly seen in Figure 3-22 (a).
It is also notable, that the truncated versions showed a sharp band around 170 kDa
when present in large quantities (clone 500-4, 5 from ΔTMD0-MRP3 and clone 500-
3 from ΔTMD0L01/2-MRP3), while no such band was detected for the internal
control clone or the full length MRP3, even when loaded in high quantities (Figure
3-21).

64 Results and Discussion
3.2.2.2.4 Large scale fermentation and purification of clone 100-5 on Ni-NTA
column
The MRP3 expressing clone 100-5 was fermented on a large scale under controlled
conditions as described in section 3.2.1.2.2 Culture samples were taken during
different time intervals of induction and the protein expression was analyzed from
these samples by small scale microsomal preparation and Western blotting as
described in 5.4.1 and 5.4.6. A large scale fermentation culture sample of an internal
control clone induced for 24 h was used as positive control (+K).
Figure 3-23: Western blot analysis of large scale fermentation of clone 100-5. Culture samples from the fermenter were taken during induction after 4 h intervals and analyzed for protein expression. Equal amount of wet cell mass was used for small scale microsomal preparation. 15 µl samples from each cell lysate was loaded on 8 % SDS gel and analyzed by Western blotting. The proteins were detected using Anti-MRP3 antibody [M3II-9] (1:2000).
As seen from Figure 3-23, the clone 100-5 overexpressed the protein in sufficient
quantities for purification.
The large scale fermentation samples were harvested and lysed as described in
5.5.2.2. A small amount (10 g) from the cell lysate was solubilized and
ultracentrifuged as described in 5.5.3. The Figure 3-24 (a) shows the result after
solubilization with DDM. The soluble fraction after ultracentrifugation was loaded

Results and Discussion 65
on a small Ni-NTA column and the purification was performed as described in
5.5.4.1.
The Figure 3-24 (b) shows the Ni-NTA column purification of solubilized fraction
(UC-S). It can be seen that the concentration of unbound MRP3 decreases in the flow
through (FT1 to FT5) fraction with increasing incubation time on the column. The
10x concentrated elution fractions (E1-E5) showed higher concentrations of the
protein, as expected. The elution fractions E2-E5 were combined and used for
further purification on Strep-tactin column.
(a)
(b)
Figure 3-24: Western blotting pictures showing Solubilization and purification MRP3 expressed by P. pastoris clone 100-5 in fermenter culture. (a) DDM solubilized samples of the crude cell lysates from fermenter culture. The samples UC-S and UC-P (Ultracentrifugation – Supernatant and Ultracentrifugation – Pellet) are the soluble and insoluble fractions after ultracentrifugation of the solubilized samples. (b) Purification of UC- S samples on small (5 ml) Ni-NTA column. FT1-FT5 are the unbound 5 ml fractions after 5, 10, 15, 20 and 25 min incubation on the column respectively. W1 and W2 are the samples from washing of the columns with 1 CV (column volume) washing buffer containing 30 mM and 40 mM Imidazole respectively. E1-E5 are the elution fractions of 500 µl each. Same volume (15 µl) of each sample was applied on 8 % SDS gel for comparison. The proteins were detected using Anti-MRP3 antibody [M3II-9] (1:2000).

66 Results and Discussion
3.2.2.2.5 Purification on Strep-tactin column
The protein purified on Ni-NTA column was loaded on a Strep-tactin spin column
and the purification was performed as described in 5.5.5.
Figure 3-25: Western blotting of purification of the Ni-NTA purified MRP3 on Strep-tactin spin column. 800 µl of the purified protein (Ni-NTA lane) was directly applied to the Strep-tactin spin column for binding. FT1-FT5 are the unbound fractions after 5, 10, 15, 20 and 25 min incubation on the column. W1-W3 are the samples after washing the column with 800 µl of washing buffer. E1-E5 are the elution fractions of 200 µl each. Same volume of each sample was applied on 8 % SDS gel for comparison. The proteins were detected using Anti-MRP3 antibody [M3II-9] (1:2000).
The blot shows a slight difference between the band intensities of the 150 kDa of Ni-
NTA eluted samples loaded on the Strep-tactin column and the flow through samples
(FT1-FT5). Elution of the first washing step (W1) also shows the dark band at
150 kDa, while all the other samples show almost no detectable amount of protein. A
light band in the elution sample (E3) indicates a weaker binding of the protein to the
column. But the elution samples were 4x concentrated (as the elution was
performed in 200 µl of elution buffer) and a lighter band in this concentrated
fraction indicates really small amount of protein.
3.2.2.2.6 Purification on Strep-tactin column after mild denaturation
In order to check the binding of the N terminal Strep tag II from the MRP3 to the
Strep-tactin column after denaturation of the protein, the preparation of crude
microsomes (cell lysate from section 3.2.2.2.4) was solubilized with 1 % SDS and
ultracentrifuged at RT to separate the soluble and insoluble fractions (section 5.5.3).
The soluble fraction was diluted 1:5 with Strep wash buffer and purified on the
Strep-tactin columns at RT exactly as described in 5.5.5.

Results and Discussion 67
Figure 3-26: (a) Western blotting of the SDS solubilized sample of the crude cell lysates of P. pastoris clone 100-5 from fermenter culture. The samples UC-S and UC-P (Ultracentrifugation – Supernatant and Ultracentrifugation – Pellet) are the soluble and insoluble fractions after ultracentrifugation of the solubilized microsomes. (b) Purification of the 1:5 diluted UC- S sample on 1 ml Strep-tactin column. FT is the unbound 25 ml fraction let run slowly from the column to allow efficient binding. W1, W2, W3 are the samples from washing of the columns with 800 µl of washing buffer. E1-E5 are the elution fractions of 800 µl each. Same volume (10 µl) of each sample was applied on 8 % SDS gel for comparison. The proteins were detected using Anti-MRP3 antibody [M3II-9] (1:2000).
Figure 3-26 shows the results after purification on the Strep-tactin column. In Figure
3-26 (a) the dark band at 150 kDa is visible in UC-S (Ultracentrifugation –
Supernatant) samples, which is the soluble fraction after SDS solubilization and
ultracentrifugation. The insoluble fraction from the pellet (UC-P) shows no band at
150 kDa. Figure 3-26 (b) shows the purification of the UC-S samples on the Strep-
tactin column. UC-S 1:5 is the 5x diluted UC-S sample with Strep washing buffer in
order to dilute the protein sample for direct purification on Strep-tactin column. FT
is the flow through containing unbound proteins from the loaded sample on the
column using a slow flow for efficient binding. This lane shows a dark band at
150 kDa with similar intensity as the UC-S 1:5. W1-W3 are the washes with washing
buffer. A band at 150 kDa can also be seen in the W1 and W2 samples, which
disappears in W3. E1-E5 are the elution fractions, in which elution was performed in
very small quantities of the elution buffer. The concentrated elutions E1 and E2
show a weaker band at 150 kDa.

68 Results and Discussion
3.2.2.2.7 Purification on different Strep-tactin resins and detection of Strep tag
II with antibody
In order to check if the resin used for the purification is the problem for the low
affinity of the binding, the purification was also performed on different resins from
the Strep-Tactin® Mini-Column Evaluation Set (IBA), as instructed by the
manufacturer. Apart from the affinity to check if the capacity of the resin is the
problem, purification was performed on Strep-Tactin Superflow High Capacity resin
from IBA, in Prof. Tampé’s Laboratory of the University of Frankfurt under the
guidance of Dr. David Parcej.
In all the cases, the purification on different Strep-tactin columns yielded results
similar to those shown in Figure 3-26, with very little binding to the column.
To check, if the Strep tag has been modified by yeast, the protein was detected on
Western blots by Strep tag II specific antibody. The detection was performed as
described in 5.4.4 and 5.4.6.
Figure 3-27: Western blotting picture showing the detection of MRP3 expressed in P. pastoris with Strep tag II at N terminal and C terminal positions. In the left picture, sample Ni-NTA elution from N terminal Strep tag II protein is a small scale preparation sample purified on 5 ml Ni-NTA column. Sample FT in the next lane is the flow through from Strep-tactin column when Ni-NTA elution was loaded and let run after incubation for 2 h. On the right side the sample Ni-NTA elution is taken from a large scale Protein purified on Ni-NTA column concentrated on 100 and 30 kDa membranes. Same volume (20 µl) of each sample was applied on 8 % SDS gel for comparison. The proteins were detected by Anti Strep tag II primary antibody (Strep MAB classic, IBA).

Results and Discussion 69
Figure 3-27, shows a light band around 150 kDa in the samples containing MRP3
with N terminal Strep tag II. These are the samples prepared by small scale
purification on the Ni-NTA column (section 3.2.2.2.4). Both Ni-NTA protein, (sample
purified on Ni-NTA column) and FT (flow through from Strep-tactin column) showed
light bands around 150, 70 and 40 kDa. On the right side of Figure 3-27, a WB is
given for a sample of MRP3 with C terminal Strep tag II, purified and concentrated
on large scale (section 3.2.1.2.3). This sample shows many dark bands of different
sizes like 170, 100, 70, 55 and 40 kDa.
3.2.2.2.8 Purification on Reactive red column
As the purification on Strep-tactin columns was unsuccessful, the protein was
attempted to be purified on a Reactive Red column which has affinity towards all the
ATPases.
Figure 3-28: Western blotting of purification on reactive red column. The sample UC-S (Ultracentrifugation – Supernatant) is the soluble fraction after Solubilization and ultracentrifugation used for purification. FT is the unbound fraction which came out of the column after incubation. W1, W2 are the samples from washing of the columns with 1 CV washing buffer. E1, E2 are the fractions eluted in 0.5 CV elution buffer with 500 mM NaCl. E3, E4 and E5 are the fractions eluted in 0.5 CV elution buffer with 1 M NaCl. Same volume (15 µl) of each sample was applied on 8 % SDS gel for comparison. The proteins were detected using Anti-MRP3 antibody [M3II-9] (1:2000).

70 Results and Discussion
The purification of protein was performed as described in 5.5.6. Same amount of
samples from each purification steps was taken and analyzed by SDS-PAGE and
subsequent Western blotting to monitor the purification (sections 5.4.4 and 5.4.6).
Figure 3-28 shows the Western blot of the purification performed on the Reactive
Red column. The sample UC-S is the soluble fraction obtained after
ultracentrifugation, which was loaded on the column to check the binding and
elution. This lane shows a dark band scattered around 70 kDa until 220 kDa and
above (the starting of the gel). Lanes FT, W1-W2 and E1-E5 are the flow through,
wash and elution fractions of the purification, which show no band of any size.
3.2.2.3 Discussion
For the screening of large numbers of P. pastoris clones for the detection of protein
expression, a high throughput screening method was used. In this, all the clones are
cultured in 24 well plates, in smaller amount (3 ml) of media. Advantage of this
method is that it enables screening of a large number of clones at once (Boettner,
Prinz et al. 2002). Detection of GAPDH has been used in P. pastoris as a loading
control (Wan, Cai et al. 2008). This eliminates the need of protein measurements by
BCA test before loading thereby minimizing the errors due to unequal loading of
samples.
But even the high throughput method did not lead to a reproducible pattern of
expression of protein by identical clones (Figure 3-21). Probably because this
method only ensures equal physical parameters of culture (Rotation speed, culture
volume, size of vessel (well) etc.) but does not provide any tool to maintain the
culture’s intrinsic parameters for each clone (like methanol concentration per cell,
cell viability, pH etc.) which affect the protein expression (Mayson, Kilburn et al.
2003; Zhao, Xue et al. 2008; Ling, Ithoi et al. 2010; Sreekrishna 2010). This leads to a
variable expression of protein by identical clones in independent cultures.
The same high throughput screening was performed in order to find expressing
P. pastoris clones for truncated versions of MRP3 (Figure 3-22). As seen from the
results, many clones chosen for constructs 2, 3 and 4 (ΔTMD0-MRP3, ΔTMD0L01/2-
MRP3 and ΔTMD0L0-MRP3 respectively) showed expression in small scale cultures.

Results and Discussion 71
The dark bands at around 120-130 kDa, which was the expected size of these three
truncated versions, were recognized by MRP3 antibody. This indicates that these
were the expected proteins.
The expression of the truncated versions lacking TMD0 (ΔTMD0-MRP3), lacking
TMD0 and only half of the linker region L0 (ΔTMD0L01/2-MRP3) and lacking TMD0
and linker region L0 (ΔTMD0L0-MRP3) indicates that the TMD0 and the L0 region in
the MRP3 are not necessary, at least for the proper folding. Because it is known from
the literature that any misfolded protein in P. pastoris is not tolerated and is
subjected to proteasomal degradation (Gasser, Saloheimo et al. 2008). So, if the
protein was misfolded after removal of TMD0 and the L0 region, it would have been
degraded by the P. pastoris cells.
It would be very interesting to purify these expressed, truncated versions and study
the transport activity and substrate recognition for each truncate in artificial
liposomes.
It is notable, that all the three truncated versions showing protein expression so far
exhibited the ‘core region’ of the protein (refer section 2). While the other truncated
version expressing only the ‘half transporter’ form of MRP3 did not show any
expression even after multiple attempts of culturing and induction and screening of
large number of clones.
There could be many reasons behind the missing expression of these truncated
versions. Firstly, it could be that the clones selected so far for the expression were
unfortunately the ‘non-expressing’ ones. As it is already known that it is often
necessary to screen a large number of transformants of P. pastoris to find a well
expressing clone (Brooks, Morrison et al. 2013).
Another possibility could be weak binding of the antibody. The Anti-MRP3 antibody
[M3II-9] recognizes the amino acids 830-949 of hMRP3, which lie somewhere in the
TMD2 region. Thus an Anti-6xHis tag antibody was used for the screening of
constructs lacking TMD2 region of the protein. As seen from Figure 3-16, the Anti-
6xHis tag antibody is much weaker than the Anti-MRP3 antibody [M3II-9]. The Anti-
MRP3 antibody [M3II-9] (1:2000) could detect even a small amount of protein like 5

72 Results and Discussion
µg on the same membrane, while the Anti-6xHis tag antibody could not recognize
even 20 µg of protein on the same blot. So it is possible that the clones selected for
the other truncated versions expressing only ‘half’ of the MRP3 yielded protein
expression but below the detection level of Anti-6xHis tag antibody.
In the case that the clones were actually not expressing the truncated forms, the
problem could also be found at transcriptional level. It is already known that the
stability of the mRNA is crucial for the expression of a protein. The transcriptional
regulation of mRNAs in eukaryotes is a complex process which sometimes involves
extracellular signaling (Mitchell and Tollervey 2000). Moreover, specific sequence
elements in mRNA are known to modulate the stability of different mRNAs (Shim
and Karin 2002). It could be possible that the shortening of MRP3 gene would have
led to removal of these specific sequences. Also short mRNAs are shown to have less
stability than average (Hoen, Hirsch et al. 2011). Keeping all these points in mind,
the reason for the low expression could be the instability at transcriptional level.
Moving on to the expressed truncates, it can be seen from Figure 3-22 that the MRP3
truncates without TMD0 and TMD0L01/2 showed a sharp band detectable by Anti-
MRP3 antibody [M3II-9] at around 170 kDa. This band was only detectable when the
samples were overloaded (clone 500-4, 5 from ΔTMD0-MRP3 and clone 500-3 from
ΔTMD0L01/2-MRP3). These bands were not seen in any sample from internal
control clone or full length MRP3 even when loaded in high quantities (Figure 3-21).
These bands cannot be random protein aggregates seen during SDS-PAGE, as the
random aggregates are generally smeared and stuck at the beginning of the
separating gel. Moreover, aggregates could have been seen in all the wells, as the
other wells were also loaded with high amount of cell lysate.
The other possibility could be dimerization, but the size of the band (170-180 kDa)
was too small to be a dimer of these truncated proteins (120-130 kDa). It could also
be possible that the truncated forms of MRP3 interact with native P. pastoris
proteins, but this cannot be confirmed without further work.
As the expression of MRP3 full transporter and at least some of its truncated forms
was successful, the next attempt was to express them on large scale and to purify

Results and Discussion 73
them for further biochemical analysis. The large scale expression was started with
the full transporter.
From the MRP3 expressing P. pastoris clones a clone showing moderate expression
in all the high throughput experiments (clone 100-5, Figure 3-21) was chosen for
fermentation. This approach lead to an expected high protein expression in large
scale fermentation under controlled conditions (Figure 3-23). This protein was
subjected to further solubilization and purification procedures (3.2.2.2.4).
Attempts to solubilize and to purify the protein on Ni-NTA column were successful
on small scale (Figure 3-24). The decreasing concentration of protein in the flow
through sample with increasing time of incubation (sample FT1-FT5, Figure 3-24
(b)) confirms the binding of protein to the Ni-NTA column. The bound protein was
eluted successfully which can be seen in the lanes E1-E5. These results were
expected as similar protocols were used by other workers for MRP3 expressed in
P. pastoris. (Chloupkova, Pickert et al. 2007; Zehnpfennig 2008)
However purification of the protein obtained from the Ni-NTA, on Strep-tactin
column again led to disappointing results. In Figure 3-25, the concentration of
unbound protein seems to be decreasing with increased incubation time on the
column (FT1-FT5) as the bands get lighter with increasing incubation time. But a
significant amount of protein was lost after the first washing step (W1) and a
negligible amount of protein was found in the concentrated elution fraction (E2).
Repeated attempts of the experiments led to the same results, indicating that the
Strep tag II at the N-terminus was not able to bind to the column under native
conditions.
In order to check if the protein binds to the column under denaturing conditions, the
SDS solubilization was performed followed by purification on Strep-tactin column at
RT (Figure 3-26). Similar band intensities in lane 1 and 2 (UC-S 1:5 and FT) indicate
that almost all protein was unbound and was lost in the flow through.
Purification performed with altered conditions of buffer and detergents and
different resins (data not shown) also led to similar results confirming that the

74 Results and Discussion
problem was not the implication of the experiment, but seems to be intrinsic to the
protein structure of this transporter.
As Strep tag II has been used previously in P. pastoris by many workers (Boettner,
Prinz et al. 2002; Parcej and Eckhardt-Strelau 2003), we assumed that P. pastoris
does not modify the Strep tag II. To rule out the possibility of any modification by
P. pastoris, the Strep tag II was detected using a Strep tag II specific antibody (Figure
3-27). Since the antibody was able to recognize the protein (seen at 150 kDa), it
must be concluded, that there was no modification in the Strep tag II sequence by
P. pastoris. Other bands in the blot could be the degradation products of the protein
as the protein samples used for the loading went through many freeze thaw cycles.
As it was confirmed that the Strep tag II was neither modified nor deleted from the
protein, it was assumed that some internal interactions within the protein makes the
Strep tag II unavailable for binding. Despite the manufacturers claim that the Strep
tag II does not interact with proteins (IBA 2011), it must be taken into consideration
that the highly hydrophobic and charged tag might have some internal interactions
with this protein. Such interactions are more likely for large membrane proteins
thereby the tag becomes unavailable for binding to the column (Parcej 2012). Thus
further attempts to purify the protein on Strep-tactin were stopped and search was
started for some other method of purification.
Such an alternative method might be the Reactive Red column which has been used
for the purification of many ATPases including ABC transporters (Urbatsch, al-Shawi
et al. 1994; Ambudkar, Lelong et al. 1998). As seen from Figure 3-28, the protein was
able to bind to the column but the elution was not possible, even at salt
concentrations as high as 1 M sodium chloride. Also slight changes in the pH did not
improve the elution. In summary, the Reactive Red seems not to be useful for
purification of this protein.

General discussion 75
4 General discussion
MRP3 is a member of the ABCC subfamily of human ABC transporters and is
involved primarily in the export of bile acids and glucuronides from cholestatic
hepatocytes (Belinsky, Dawson et al. 2005). Its ability to confer resistance e.g.
against etoposide and methotrexate indicates, that the transporter is involved in
protection of normal tissues against chemotherapeutic agent making it
therapeutically important (Kool, van der Linden et al. 1999; Zeng, Liu et al. 2000;
Jiang, Chen et al. 2009).
The MRP3 possesses the extra N-terminal transmembrane domain (TMD0) which is
characteristic for some of the members of the ABCC subfamily. The function of this
domain is highly debated and thus not clear. Studies with truncated versions of
MRP1 in various systems showed contradictory results. While some believe that the
TMD0 region is neither required for the transport function of MRP1 nor for its
proper routing to the plasma membrane (Bakos, Evers et al. 1998) others have
shown that point mutation or deletion in TMD0 either decrease or completely
eliminate the transport activity of MRP1 (Gao, Yamazaki et al. 1998; Ito, Weigl et al.
2003; Leslie, Letourneau et al. 2003). On the other hand the function of TMD0 for
other members of the ABCC family has been already characterized. The interaction
between TMD0 of SUR1 and the potassium channel Kir6.2 is known to be required
for the function of KATP-channel. (Otonkoski, Ammala et al. 1999; Babenko and Bryan
2003; Chan, Zhang et al. 2003). The TMD0 in MRP2 is involved in the localization of
the protein to the apical membranes in MDCKII cells (Fernandez, Hollo et al. 2002).
The TMD0 in MRP3 remains poorly studied for its functions and localization. The
fact that many of the other ABCC family proteins (MRP4, 5, 8, 9) lacking the TMD0
makes the prediction of its function in MRP3 even more difficult.
Apart from the functions of TMD0, the role of each domain of the protein in the
transport mechanism is also unclear, which is true for the entire ABCC subfamily.
Among the other closely related members of this family, MRP3 remains least
studied, because the protein expression level in the normal cells is relatively low

76 General discussion
(Zeng, Bain et al. 1999) but the transporter expression is upregulated in the
cancerous tissue (Konig, Hartel et al. 2005).
Recently, overexpression and purification of this protein in yeast P. pastoris in an
active form provided sufficient amounts of protein for its biochemical and
biophysical analyses (Chloupkova, Pickert et al. 2007). The successful reconstitution
of MRP3 into artificial liposomes provided a reliable and powerful tool to analyze its
substrate specificity and transport activity (Zehnpfennig, Urbatsch et al. 2009;
Seelheim, Wullner et al. 2013).
This thesis aimed to continue the work with this transporter by heterologous
expression of designed truncated versions of the protein to characterize each
domain in detail (Figure 2-1). The reconstitution and measurement of ATPase and
drug transport activity by each truncated domain would have helped to predict the
probable function of each domain and thereby provide evidence for the mechanism
of transport cycle. However a prerequisite is the successful isolation and purification
of the corresponding proteins in amounts that allow successful reconstitution.
In order to express the protein in P. pastoris, we selected an autonomously
replicating plasmid pPicholi. Though the clones containing this plasmid were able to
express the protein and its truncated forms on small scale, the large scale cultures
lacked protein expression completely, even when cultured under controlled
conditions. We assume that this is because of the instability of the autonomously
replicating plasmids under insufficient selection pressure (Romanos, Scorer et al.
1992).
The genome integration of the plasmid proved to be a better method for expression
of the protein, being more reproducible. However, the amount of protein expressed
per cell varied for identical clones in independent culturing experiments. This made
selection of the ‘best’ expression clone among P. pastoris transformants too time
consuming.
For rapid detection of clones with multiple gene copies, Real-Time (quantitative)
PCR can be used. This method would detect the clones with highest number of
copies of a heterologous gene. But it is known, that in P. pastoris the gene copy
number has no significant effect on the production of the protein (Sreekrishna

General discussion 77
2010). In many cases a single copy expression cassette is sufficient for optimal
production (Cregg, Barringer et al. 1985), while sometimes multiple copies are
necessary for high level expression (Clare, Rayment et al. 1991; Romanos, Makoff et
al. 1991). In some cases, an increase in copy number has even a negative effect on
the protein level (Higgins 2001).
It became clear that selection of suitable clones is possible only by protein
expression analysis. Thus a high throughput screening method was used in order to
screen large numbers of clones at once. Identical clones showing relatively constant
protein expression in multiple attempts were thought to be the ideal clones for large
scale expression.
Large scale protein expression was successful with genome integrated plasmids.
Attempts to solubilize the expressed protein and to purify it on Ni-NTA columns
were successful, but the purity was not high enough for further experiments.
Subsequent purification on Strep-tactin columns showed insufficient binding of
Strep tag II-protein to the column material. The binding was poor irrespective of the
position of the tag either on the C or the N-terminal end. Moreover it was
independent from the structure of the protein in a native or denatured state.
The reasons for the inability of the Strep tag II to bind to the column material
remained obscure. The interaction between the Strep tag II and the column resin
(engineered Streptavidin) is highly specific and involves a salt bridge formation
between the free carboxylate group of the glutamate side-chain of the tag
(WSHPQFEK) and an arginine of Streptavidin (Strep-tactin) (Schmidt, Koepke et al.
1996). The small eight amino acids long tag is said to be non-interacting with any
protein. It is also claimed that the Strep tag II is able to purify any protein including
large membrane proteins (IBA 2011).
We then tested the possible factors affecting this interaction in the buffer conditions
that we were using. The addition of low concentrations of detergents n-dodecyl β-D-
maltopyranoside (DDM) or sodium dodecyl sulfate (SDS) in the binding and washing
buffers should not affect this interaction, as the detergents mostly disrupts the
hydrophobic interactions. SDS to some extent disrupts the electrostatic interactions
in a protein owing to its ionic nature. But both these detergents do not affect the salt

78 General discussion
bridge formation necessary for binding of the Strep tag II to the column resin. So the
addition of these detergents into the buffers used for the purification cannot be the
reason for the inefficient binding.
The possibility of modification of Strep tag II by P. pastoris was ruled out as the tag
was detectable by an antibody specific for Strep tag II.
Because of these findings, we assume, that in contrast to the manufacturer’s claim
the Strep tag II might have some strong internal interactions with our protein,
irrespective of its position. But further presumptions about the details of this
interaction cannot be made as the crystal structure of the protein is not known.
Purification of the protein on another affinity column named Reactive Red was also
not successful, as the protein could not be eluted from the column even using high
salt concentrations upto 1M. Further increased concentrations of salt for elution
would have a detrimental effect on the protein stability and activityand thus were
not tested.
In summary the expression of the MRP3 and its truncated versions with intact core
domain was successful indicating that TMD0 and L0 are not necessary for at least
structural stability of the protein. However, the purification step became the
bottleneck for subsequent reconstitution experiments. Thus the transport and
ATPase activity could not be further investigated and is a challenge for future work.

Experimental 79
5 Experimental
5.1 Cell Biology
All the equipment used for cell biology experiments were sterilized by routine
sterilization procedures.
5.1.1 Pichia pastoris
P. pastoris strain KM71H was used for all the experiments.
5.1.1.1 Cell culturing and induction
Frozen stocks or newly transformed cells of the prepared cell lines were streaked on
YPD agar plates containing 100 mg/ml Zeocin and incubated at 30 °C for 3-4 days. A
single distinct colony was picked and grown in 2, 10 or 25 ml of MGYH media,
depending on the type of experiment. After 24 or 48 h of culturing at 29 °C and at a
shaking speed of 250 rpm, the culture was centrifuged at 3000 g for 15 min at RT.
The cell pellet was then resuspended in equal amount of MM media and the culture
was induced with 0.5 % methanol for 24 or 48 h, with further occasional addition of
0.5 % methanol after 12 h of induction occasionally. Shaking speed was increased to
350 rpm during induction phase for better aeration.
The composition of different media used was as listed in the following tables.
YPD agar plates
1 % (w/v) Yeast extract 2 % (w/v) Peptone 2 % (w/v) Dextrose 2 % (w/v) Agar 100 µg/ml Zeocin Autoclave glucose separately from yeast extract/peptone and aseptically combine
the solutions. Let cool to less than 50 °C before aseptically adding Zeocin. [Pour into petri dishes and let cool.] Store upto 1 month in the dark at 4 °C

80 Experimental
MGYH media (pH 5.0)
0.34 % (w/v) Yeast nitrogen base 2 % (w/v) Glycerol
1 % (w/v) (NH4)2SO4
0.0004 % (w/v) Biotin 0.05 % (w/v) Histidine 0.1 M Phosphate buffer Autoclave and store up to 6 months at 4 °C
MM media (pH 5.0) 0.34 % (w/v) Yeast nitrogen base
1 % (w/v) (NH4)2SO4
0.0004 % (w/v) Biotin 0.05 % (w/v) Histidine 0.1 M Phosphate buffer 0.5 % Methanol Autoclave and store up to 6 months at 4 °C
5.1.1.2 Competent cell Preparation
Competent P. pastoris cells for transformation were prepared by two different
methods.
5.1.1.2.1 Conventional Protocol
10 ml YPD media was inoculated with frozen glycerol stock or with a single fresh
colony from an agar plate of P. pastoris KM71H and incubated overnight at 30 °C in a
shaking incubator. Next day the culture was diluted to an OD600 of 0.1-0.2 with
500 ml of freshly prepared YPD media and the culturing was continued in a 2000 ml
culture flask at 30 °C in a shaker incubator. When the OD600 reached between 1.3-
1.5, the culture was centrifuged at 2000 g for 4 °C. The supernatant was discarded
and the pellet was resuspended in 100 ml YPD media supplemented with 2 ml
sterile-filtered 1 M HEPES (pH 8.0) and 2.5 ml 1.0 M dithiotheitol (DTT) was added
dropwise. The cells were incubated for 15 minutes at 30 °C with gentle shaking. The
suspension was diluted with 400 ml of sterile, ice cold water and centrifuged at

Experimental 81
2000 g for 10 min at 4 °C. Subsequent washings were done with 400 and 250 ml ice
cold water at 2000 g for 10 min at 4 °C. The pellet after the third wash was dissolved
in 20 ml of ice cold 1 M sorbitol and centrifuged at 2000 g for 10 min at 4 °C. The
supernatant was decanted carefully and the pellet was resuspended in 1 ml of ice
cold 1 M sorbitol solution. The competent cells concentrated in 1 M sorbitol were
divided into 50 µl aliquots in 0.5 ml microcentrifuge tube and stored at -70 °C in a
styrofoam box.
5.1.1.2.2 Condensed Protocol
5 ml YPD media was inoculated with frozen glycerol stock of P. pastoris KM71H and
incubated overnight at 30 °C in a shaking incubator. Next day the culture was diluted
to an OD600 of 0.15-0.20 with 50 ml of freshly prepared YPD media and the
culturing was continued in a 500 ml culture flask at 30 °C in a shaker incubator.
When the OD600 reached between 0.8-1.0, the culture was centrifuged at 500 g for
5 min at RT. The supernatant was discarded and the pellet was washed with 9 ml of
ice cold BEDS solution supplemented with 1 ml 1.0 M dithiotheitol (DTT). The cell
suspension was incubated at 30 °C for 5 min in a shaker incubator at 100 rpm and
centrifuged again at 500 g for 5 min at RT. The supernatant was decanted carefully
and the pellet was resuspended in 1 ml of ice cold BEDS solution without DTT. The
competent cells concentrated in BEDS solution were divided into 50 µl aliquots in
0.5 ml microcentrifuge tube and stored at -70 °C in a styrofoam box.
YPD media
1 % (w/v) Yeast extract 2 % (w/v) Peptone 2 % (w/v) Dextrose
BEDS solution (pH 8.3)
10 mM Bicine-NaOH 3 % (v/v) Ethylene glycol 5 % (v/v) Dimethyl sulfoxide 1 M Sorbitol

82 Experimental
5.1.1.3 Transformation
The competent cells stored at -70 °C were thawed on ice just before the
transformation. 1 µg of the desired DNA, linearized and cleaned, was mixed with
50 µl of the competent cells in a precooled 2 mm electroporation cuvette and
incubated on ice for 2 min. The cells were electroporated at 1.5 kV for 4-5 ms in ECM
399 Electro cell manipulator. Immediately after transformation 500 µl 1 M Sorbitol
was added to the electroporation cuvette and the cells were collected in a sterile
1.5 ml microcentrifuge tube. 500 µl YPD media was added to the cell suspension in
sorbitol and incubated at 30 °C for 30 or 60 min with gentle shaking. 100 or 200 µl
from the sorbitol-YPD culture was plated on YPD agar plates containing increasing
concentrations of Zeocin (100, 250, 500, or 1000 µg/ml) for the selection of
multicopy integrants.
5.1.1.4 Cell storage
A fresh back up of each P. pastoris clone into consideration was taken on YPD agar
plate containing 100 mg/ml Zeocin and incubated at 30 °C for 3-4 days. The plate
was sealed with parafilm and stored at 4 °C for short term storage.
For long term storage, each clone was cultured in freshly prepared YPD media
containing 100 mg/ml Zeocin and incubated at 30 °C overnight in a shaker
incubator. Cultures in their exponential growth phase were mixed with sterile
glycerol at a final concentration of 15 % and stored at -70 °C.
5.1.2 Escherichia coli
E. coli TOP10F’ strain was used for all the experiments.
5.1.2.1 Cell culturing
In order to isolate plasmid DNA or to make glycerol stocks, a single distinct colony of
the desired clone was picked and inoculated into 5 ml LB-medium. Antibiotics were
added to the media at a concentration of 25 or 50 µg/ml. Concentration of the salt
was reduced when antibiotic Zeocin was used in the media (Low salt LB). The

Experimental 83
cultures were grown overnight at 37 °C and at shaking speed of 180 rpm until the
culture was saturated.
5.1.2.2 Competent cell preparation
A frozen stock culture of TOP10F’ E. coli cells was streaked on a pre-warmed LB agar
plate (without any antibiotic) and incubated overnight at 37 °C. A distinct colony
was picked from the plate, the next day and inoculated into 20 ml LB media. The
culture was incubated at 37 °C in a shaker incubator for 5-6 h, till all the cells were in
exponential phase. After 6 h of incubation, the 20 ml culture was diluted with 800 ml
of freshly prepared LB media and incubated at 18 °C overnight. When the OD600
reached between 0.4-0.6, the culture was centrifuged at 4500 g using a JA-10 rotor
for 30 min at 4 °C. The supernatant was discarded and the pellet was dissolved in
400 ml of sterile, ice cold water and centrifuged at 4500 g using a JA-10 rotor for
15 min at 4 °C. Subsequent washings were done with 200 and 100 ml ice cold water.
The pellet after the third wash was dissolved in 40 ml of ice cold 10 % glycerol and
centrifuged at 3000 g for 30 min. The supernatant was decanted carefully and the
pellet was resuspended in 1 ml of ice cold 10 % glycerol. The resuspended pellet was
divided into 50 µl aliquots in 0.5 ml microcentrifuge tube and blast frozen in liquid
nitrogen immediately. The frozen competent cells were then stored at -70 °C in a
plastic box.
5.1.2.3 Transformation
The competent cells stored at -70 °C were thawed on ice just before the
transformation. 100 ng of the desired DNA was mixed with 50 µl of the competent
cells in a precooled, 2 mm electroporation cuvette and the cells were electroporated
immediately at 2.5 kV for 4-5 ms in ECM 399 Electro cell manipulator. After
LB media
1 (w/v) Tryptone 0.5 (w/v) Yeast Extract 1 (w/v) Sodium Chloride 1.5 (w/v) Agar (only for plates)

84 Experimental
transformation 500 µl LB media was added to the electroporation cuvettes
aseptically and the cells were collected in a sterile 1.5 ml microcentrifuge tube. The
cell suspension is then incubated at 37 °C for 30 or 60 min with gentle shaking. 100
or 200 µl from this culture was plated on LB agar plates containing appropriate
antibiotic at a concentration of 25 or 50 µg/ml. The plates were incubated at 37 °C
overnight and the colonies were screened for the positive clones.
5.1.2.4 Cell storage
For long term storage, freshly prepared cultures, grown overnight at 37 °C were
mixed with sterile glycerol at a final concentration of 30 % and stored at -70 °C.

Experimental 85
5.2 Molecular Biology
5.2.1 Isolation of plasmid-DNA from E.coli
Colonies from the desired clones were cultured in 5 ml LB medium supplemented
with 50 µg/ml of appropriate antibiotic. After culturing overnight at 37 °C in a
shaker incubator, the saturated cultures were centrifuged at the maximum speed in
a table top centrifuge for 2 min. The supernatant was discarded and plasmid
isolation was performed using GeneJET Plasmid Miniprep Kit from Thermo Scientific
according to manufacturer’s instructions. Pelleted bacterial cells were resuspended
in 250 µl of the Resuspension Solution (supplemented with RNase A) by vortexing
until no cell clumps remain. The bacterial suspension was then subjected to
SDS/alkaline lysis to liberate the plasmid DNA by adding 250 µl of the Lysis Solution
and mixing thoroughly by inverting the tube 4-6 times. 350 µl of the Neutralization
Solution was added to the viscous and slightly clear lysate and immediately mixed
thoroughly by inverting the tube 4-6 times. This neutralization step creates
appropriate conditions for binding of plasmid DNA on the silica membrane in the
spin column. Cell debris, chomosomal DNA and SDS precipitate were pelleted by
centrifugation at 12000 g for 5 min and the supernatant containing the plasmid DNA
was loaded onto the spin column membrane. The columns were centrifuged for
1 min and the flow though was discarded. The adsorbed DNA was washed twice
with 500 µl of the Wash Solution to remove contaminants and the flow though was
discarded. The columns were centrifuged for 1 min at 12000 g to remove the
residual Wash solution. The spin columns were transferred into a fresh 1.5 ml
microcentrifuge tube and 50 µl of the ultrapure water added to the spin column
membrane to elute the plasmid DNA. This was then incubated for 2 min at room
temperature and centrifuged at 12000 g for 2 min. The isolated plasmids were
stored at -20 °C.
5.2.2 Isolation of genomic DNA from P. pastoris
Isolation of genomic DNA was performed from P. pastoris for subsequent PCR and
sequencing. The conventional heat shock, Chelex and glass bead methods were

86 Experimental
combined to get better for DNA isolation. A large, distinct colony was picked from
YPD-agar plate and dissolved in 200 µl ultrapure water in a 1.5 ml microcentrifuge
tube. 150 µl of 10 % Chelex suspension and 50 µl of Proteinase K was added to the
cell suspension. 100 µl of 0.45 mm glass beads were added to the tube and vortexed
at the maximum speed for 2-3 min at RT. The supernatant was collected in a new
microcentrifuge tube. The glass beads were washed with 100 µl of Chelex
suspension and the wash was collected in the same tube. These tubes were then
incubated at -70 °C for 10 min and transferred to the heating block at 99 °C for
2 min. The sample was centrifuged at 12,000 g for 2 min and the supernatant was
collected and stored at -20 °C. This crude genomic DNA was used as a template for
PCR.
5.2.3 Quantification of nucleic acids
The concentration and purity of DNA for all the experiments was measured with
NanoDrop™ Micro Volume Spectrophotometer (Nanodrop ND-2000, Peqlab). The
NanoDrop spectrophotometer uses short path lengths between 1.0 mm to 0.05 mm
to enable measurement of concentrated samples without dilution. The Nucleic Acid
application absorbance values are then normalized by the software automatically to
a 1.0 cm (10.0 mm) path for all the measurements. The device accurately measures
the concentration of DNA in a given sample using UV/Vis analysis at 260 nm which
is the most suitable for RNA/DNA quantification due to the absorbance of purine
and pyrimidine bases. The optical density at 260 nm (OD260) corresponds to 50
μg/ml of double stranded DNA. The purity of isolated DNA was determined by
measuring the optical density at 280 nm where the aromatic amino acids of proteins
show the highest degree of absorbance. The ratio OD260/OD280 is supposed to be
around 1.8 for DNA dissolved in buffer with pH > 7. Sample volumes as low as 0.5 µl,
can be used for the measurement.
5.2.4 Enzymatic Restriction of DNA
1 to 5 µg of either plasmid DNA or amplified PCR fragments were restricted either
by 1 µl (1 FDU) of FastDigest restriction enzymes from Thermo scientific for 15-

Experimental 87
20 min or by 10 U of restriction enzymes from National England Biolabs for 60-
90 min, with gentle shaking and at a temperature specific for a given enzyme. The
reaction mixtures were prepared in 0.5 ml, thin walled microcentrifuge tubes as
mentioned in the table.
In case of plasmid DNA, the restriction was monitored by agarose gel
electrophoresis and the fragments of right size were extracted by the method
mentioned in section 2.6 whereas the restricted PCR fragments were directly
cleaned by one of the methods mentioned in section 2.7.
Restriction reactions with NEB enzymes
DNA x µl x µl NEB enzyme y µl y µl 10 x NEB buffer 2 µl 5 µl Ultrapure water 18-(x+y) µl 45-(x+y) µl Total 20 µl 50 µl
30-60 min at specified temperature
Restriction reactions with FastDigest enzymes
DNA x µl x µl FastDigest enzyme 0.5 µl 2 µl 10 x FD green buffer 2 µl 5 µl Ultrapure water 17.5-x µl 43-x µl Total 20 µl 50 µl
15-20 min at specified temperature
5.2.5 Agarose gel electrophoresis
Agarose gel electrophoresis is used to separate nucleic acids according to their size
in a solid matrix under the influence of electric field. The gel electrophoresis was
used routinely to visualize isolated plasmids, monitor restriction of DNAs and to
analyze the PCR reactions. To ensure the movement of negatively charged DNA to
the anode, the electrophoresis must be performed at pH close to neutral. Therefore,
0.5 x TAE buffer was used for gel preparation and electrophoresis. In order to obtain
optimal separation, variable concentration of agarose was used for gel preparation
as per the table.

88 Experimental
The calculated amount of agarose was dissolved in 50 ml 0.5 x TAE buffer by directly
heating microwave for 1-2 min until the agarose is completely melted, poured into a
casting tray containing a sample comb and allowed to solidify at room temperature.
The samples were diluted with loading buffer to increase the density of the solution
for better loading and tracking the running front. Apart from 10 x loading buffer
prepared in lab, commercial loading buffers, like 6X orange loading dye from
Thermo Scientific, 6 x blue loading dye from National England Biolabs were also
used to treat the samples. Sometimes 10 x FastDigest green buffer from Thermo
Scientific was used for this purpose. To determine size of the separated DNA
fragments, a ready-to-load TriDye™ 1 kb DNA Ladder from National England Biolabs
was also loaded in one of the wells.
Gel electrophoresis was performed at 100 V. After the electrophoresis the gel slab
was bathed in ethidiumbromide solution (1 ml of 0.5 mg/ml stock solution in
1000 ml of 0.5 x TAE buffer) for 20-30 min and the bands were visualized under UV-
light (254 nm).
Table: Concentration of standard agarose used for separating DNA of different size
Agarose concentration (% w/v) 0.5 0.7 1.0 1.2 1.5 2.0 Nucleic acid fragment range (kb) 1.0-30 0.8-12 0.5-10 0.4-7 0.2-3 0.1-2
50 x TAE buffer (pH 7.4)
2 M Tris 2 M Sodium acetate 0.05 M EDTA
10 x DNA loading buffer
0.25 % (w/v) Bromophenol blue 0.25 % (w/v) Xylene cyanole 15 % (v/v) Ficoll
5.2.6 Extraction of DNA from agarose gel
The extraction of desired DNA fragments from agarose gels was performed by using
Zymoclean™ Gel DNA Recovery Kit from Zymoresearch. The DNA fragment was
excised from the agarose gel using a scalpel and transferred into a 1.5 ml

Experimental 89
microcentrifuge tube. The excised gel slice was weighed (1 mg ≈ 1 µl) and dissolved
in 3 volumes of ADB (agarose digestion buffer) by heating at 55 °C for 10 min, until
the gel slice was completely dissolved. The melted agarose solution was then
transferred to a Zymo-Spin™ Column in a collection tube and centrifuged for 30-
60 seconds. DNA is adsorbed to the silica membrane in the presence of a high
concentration of chaotropic salts and at acidic pH while contaminants pass though
the column and are washed away. The flow though was discarded and the column
was washed twice with 200 µl DNA Wash Buffer. 10-20 µl ultrapure water was
added to the column and incubated for 1-2 min. The column was placed into a 1.5 ml
tube and centrifuged for 30-60 seconds to elute pure DNA.
Concentration of purified DNA was determined as described in section 2.3.
5.2.7 Cleaning of DNA for ligation
The restricted or gel extracted DNA was cleaned before ligation. The cleaning was
performed by one of the following methods.
5.2.7.1 Using a commercial cleaning kit
For quick cleaning of samples, DNA Clean & Concentrator TM kit from Zymoresearch
was used. All the steps were performed according to the manufacturer’s instruction
except the last step where the elution was always done in sterile, ultrapure water.
However the amount of DNA in the eluted samples was always lower than the other
method.
5.2.7.2 Precipitation with sodium acetate and ethanol
In order to get large quantities of purified DNA for transformation, the samples were
cleaned by this method. To the ‘dirty’ DNA sample, appropriate quantities of 3 M
sodium acetate and ice cold, 100 % Ethanol were added so that the final ethanol
concentration was 70 % and the final salt concentration was 0.3 M. The
microcentrifuge containing the sample was vortexed briefly and centrifuged at
12000 g for 10 min at RT. The supernatant was aspirated with a vacuum pump and
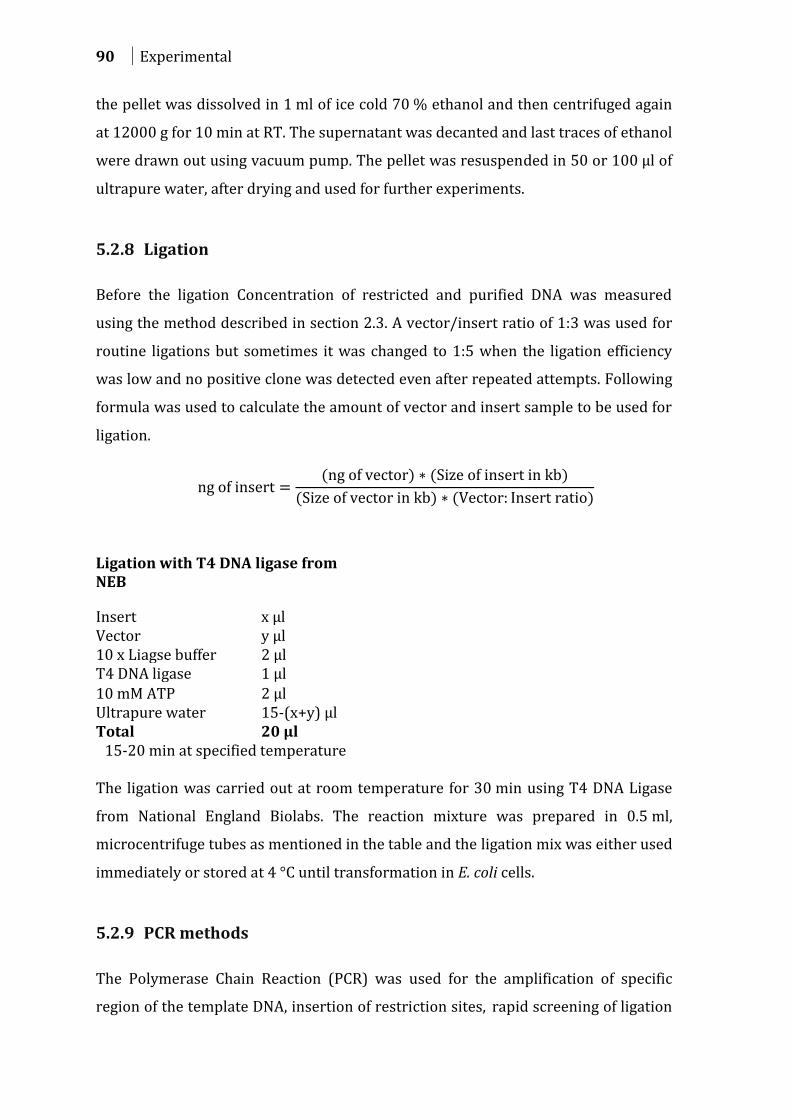
90 Experimental
the pellet was dissolved in 1 ml of ice cold 70 % ethanol and then centrifuged again
at 12000 g for 10 min at RT. The supernatant was decanted and last traces of ethanol
were drawn out using vacuum pump. The pellet was resuspended in 50 or 100 µl of
ultrapure water, after drying and used for further experiments.
5.2.8 Ligation
Before the ligation Concentration of restricted and purified DNA was measured
using the method described in section 2.3. A vector/insert ratio of 1:3 was used for
routine ligations but sometimes it was changed to 1:5 when the ligation efficiency
was low and no positive clone was detected even after repeated attempts. Following
formula was used to calculate the amount of vector and insert sample to be used for
ligation.
Ligation with T4 DNA ligase from NEB
Insert x µl Vector y µl 10 x Liagse buffer 2 µl T4 DNA ligase 1 µl
10 mM ATP 2 µl Ultrapure water 15-(x+y) µl Total 20 µl
15-20 min at specified temperature
The ligation was carried out at room temperature for 30 min using T4 DNA Ligase
from National England Biolabs. The reaction mixture was prepared in 0.5 ml,
microcentrifuge tubes as mentioned in the table and the ligation mix was either used
immediately or stored at 4 °C until transformation in E. coli cells.
5.2.9 PCR methods
The Polymerase Chain Reaction (PCR) was used for the amplification of specific
region of the template DNA, insertion of restriction sites, rapid screening of ligation

Experimental 91
reactions for positive clones, mutation at specific bases, amplification of genome
integrated plasmid for sequencing and quick screening of plasmid inserts in
transformed E. coli and P. pastoris cells. The PCR reaction was set up according to
the nature of the experiment. Sequences of all the primers used for various reactions
are enlisted in section. Annealing temperatures and secondary structures, for the
different primer pairs used were calculated by using NetPrimer, free primer analysis
software from Premier Biosoft. For the primers used for insertion of restriction site
i.e. those containing non complementary regions, the optimum PCR conditions were
found experimentally by performing a gradient PCR.
5.2.9.1 Preparatory PCR reactions
High fidelity polymerases like Pfu and Phusion from Thermo Scientific were used
when the PCR was performed for amplification of insert and further cloning or for
sequencing. The enzymes exhibit lower processivity but high accuracy resulting in
much lower error rates during amplification. The PCR was set up according to
manufacturer’s instruction. The reaction mixtures were prepared in 0.5 ml or 0.2 ml,
thin walled PCR tubes and the reaction was performed according to the program
mentioned in the tables. The amplicon was then restricted, purified, quantified and
ligated into the vector as described previoiusly. On the other hand, if the PCR was
performed for sequencing, the product was cleaned and sent for sequencing.
Phusion Polymerase reaction mixture
5x Phusion Buffer 10 µl 10 mM dNTPs 1 µl MgCl2 1 µl 10 µM Forward Primer 0.5 µl 10 µM Reverse Primer 0.5 µl Template 2.5 µl Phusion Polymerase 0.5 µl Ultrapure water 34 µl Total 50 µl

92 Experimental
Pfu Polymerase reaction mixture
10x Pfu Buffer with MgSO4 10 µl dNTP mix (2 mM each) 1 µl 10 µM Forward Primer 0.1 µl 10 µM Reverse Primer 0.1 µl Template 0.2 µl Pfu Polymerase 1 µl Ultrapure water 37.6 µl Total 50 µl
Pfu Polymerase PCR reaction
1 Initial Activation 95 °C 30 sec 2 Denaturation 95 °C 10 sec 3 Annealing x°C 30 sec 4 Extension 72 °C y*2 min 5 Final Extension 72 °C 10 min
Hold 4 °C
repeat 2-4 for 18 cycles
x= calculated/ found experimentally
y= size of the target in kb
5.2.9.2 Analytical PCR reactions
The PCR method was also used to screen the transformed E. coli colonies for
plasmids containing a desired insert, thereby checking if the ligation was successful.
Individual colonies from a transformation plate were picked using a sterile
toothpick and dipped into separate microfuge tubes containing 20 µl of ultrapure
water. The cloudy suspension was heated at 99 °C for 2 min and centrifuged at the
Phusion Polymerase PCR reaction
1 Initial Activation 98 °C 30 sec 2 Denaturation 98 °C 10 sec 3 Annealing x °C 15-20 sec 4 Extension 72 °C y*30 sec 5 Final Extension 72 °C 5 min
Hold 4 °C
repeat 2-4 for 18 cycles
x= calculated/ found experimentally
y= size of the target in kb

Experimental 93
maximum speed for 2 min in a table top centrifuge. 5 µl of of the supernatant was
used as a template for PCR. Transformants from P. pastoris were also sometimes
screened by colony PCR. The template for PCR was prepared by the method
described in section 1.3.2.
Taq Pol PCR components
10x ThermoPol® Buffer 2 µl 10 mM dNTPs 0.4 µl 10 µM Forward Primer 0.4 µl 10 µM Reverse Primer 0.4 µl Template 5 µl Taq DNA Polymerase 0.4 µl Ultrapure Water 11.4 µl Total 20 µl
Taq Polymerase PCR reaction
1 Initial Activation 95 °C 30 sec 2 Denaturation 95 °C 10 sec 3 Annealing x°C 10-20 sec 4 Extension 68 °C y*1 min 5 Final Extension 68 °C 10 min
Hold 4 °C
repeat 2-4 for 30 cycles
x= calculated/ found experimentally
y= size of the target in kb
Taq DNA Polymerase from National England Biolabs was used for all the pure
analytical PCRs. The PCR was set up according to manufacturer’s instruction. The
reaction mixture was prepared in 0.5 ml or 0.2 ml thin walled PCR tubes and the
reaction was performed according to the program mentioned in the table in a
Mastercycler gradient thermocycler from Eppendorf. The amplified products from
different colonies were then analyzed on agarose gel as mentioned previously.

94 Experimental
5.2.10 Site-Directed Mutagenesis
Site directed mutagenesis was used to make point mutations in hMRP3 sequence
and in the 3C protease site sequence from the purification tag. The mutations were
designed to match the codon usage in P. pastoris for optimal expression.
All the site directed mutagenesis methods were performed using QuikChange site-
directed mutagenesis kit from Stratagene. The method was performed according to
the manufacturer’s instruction. The reaction mixtures were prepared in 0.5 ml or
0.2 ml thin walled PCR tubes and the reaction was performed according to the
program mentioned in the tables.
The kit includes a high fidelity PfuTurbo® DNA polymerase which replicates both
plasmid strands without displacing the mutant oligonucleotide primers. The
oligonucleotide primers containing desired mutation, each complementary to
opposite strands of the vector, are extended during temperature cycling by
PfuTurboDNA polymerase. Incorporation of the oligonucleotide primers generates a
mutated plasmid containing staggered nicks. High fidelity of the polymerase and the
low number of thermal cycles all contribute to the high mutation efficiency and
decreased error rate during the reaction.
After the temperature cycling, the product is treated with DpnI endonuclease which
is specific for methylated and hemimethylated DNA (target sequence: 5´-GmATC-3´).
The enzyme is used to digest the parental DNA template, which is susceptible to
DpnI digestion and to select for mutation-containing synthesized DNA.
The nicked vector DNA containing the desired mutations is then transformed into
Top10F’ competent E. coli cells as mentioned in section 1.1.1.2.

Experimental 95
QuickChange Mutagenesis PCR components
10x reaction buffer 10 µl dNTP Mix 1 µl 10 µM Forward Primer 0.5 µl 10 µM Reverse Primer 0.5 µl 50 ng of dsDNA template x µl PfuTurbo® DNA polymerase 1 µl Ultrapure water 36-x µl Total 50 µl
QuickChange Mutagenesis PCR reaction
1 Initial Activation 95 °C 30 sec 2 Denaturation 95 °C 30 sec 3 Annealing 55 °C 1 min 4 Extension 68 °C y*1 min 5 Final Extension 68 °C 10 min
Hold 4 °C
repeat 2-4 for 12 cycles
y= size of the target in kb
5.2.11 DNA sequencing
DNA samples (~ 100 ng/μl) diluted in ultrapure water were submitted for
sequencing to the company GATC, biotech. The obtained sequencing data was
analyzed using BioEdit biological sequence alignment editor (Version BioEdit v7.0.9)
from NCBI.
5.2.12 Annealing and Phosphorylation of oligonucleotides
The Lyophilized samples obtained after upon arrival were dissolved in sterile
ultrapure water and stored at -20 °C in 50 µl aliquots. The complementary
oligonucleotides were mixed in equimolar proportions and heated and cooled
together as mentioned in the table for the generation of a dsDNA fragments with
cohesive ends.
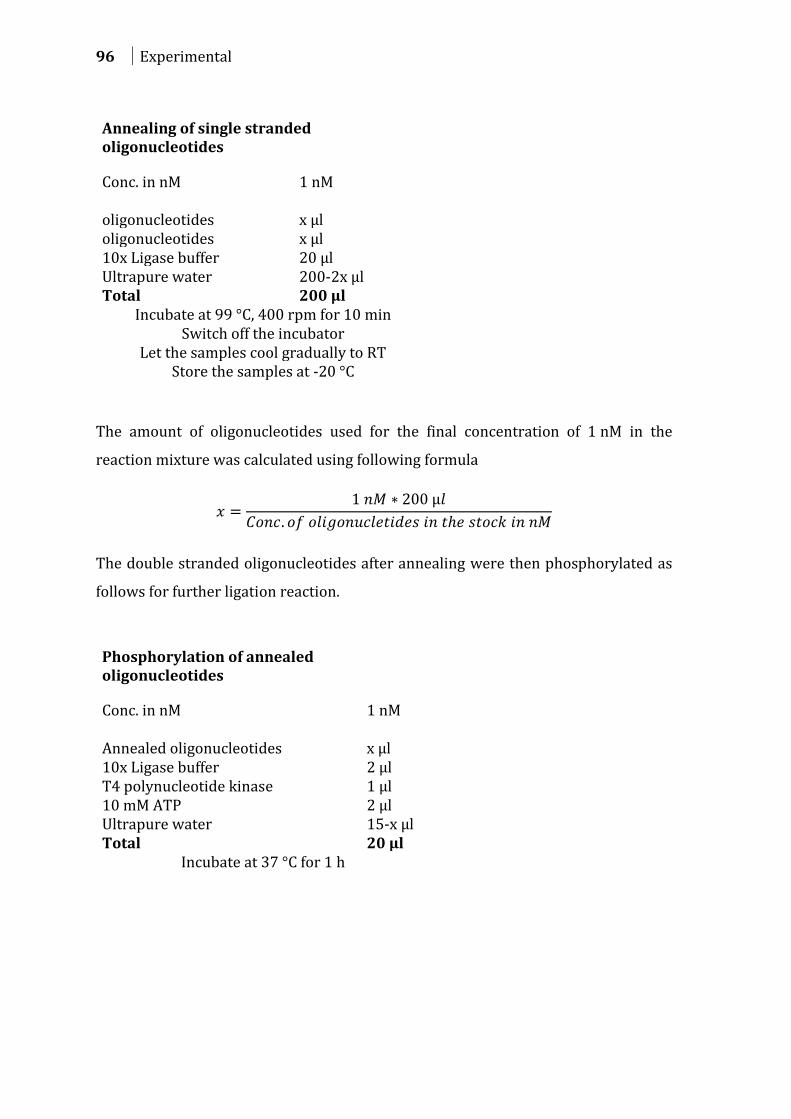
96 Experimental
Annealing of single stranded oligonucleotides
Conc. in nM 1 nM
oligonucleotides x µl oligonucleotides x µl 10x Ligase buffer 20 µl Ultrapure water 200-2x µl Total 200 µl
Incubate at 99 °C, 400 rpm for 10 min Switch off the incubator
Let the samples cool gradually to RT Store the samples at -20 °C
The amount of oligonucleotides used for the final concentration of 1 nM in the
reaction mixture was calculated using following formula
The double stranded oligonucleotides after annealing were then phosphorylated as
follows for further ligation reaction.
Phosphorylation of annealed oligonucleotides
Conc. in nM 1 nM
Annealed oligonucleotides x µl 10x Ligase buffer 2 µl T4 polynucleotide kinase 1 µl 10 mM ATP 2 µl Ultrapure water 15-x µl Total 20 µl
Incubate at 37 °C for 1 h
Experimental 97
5.4 Protein biochemistry
5.4.1 Small scale preparation of microsomes from P. pastoris
The harvested or frozen yeast cells, after culturing and induction were thawed on ice
and resuspended in 500 µl- 1 ml homogenization buffer (~1 g cells /ml),
supplemented with protease inhibitors (PI) Pepstatin A (PepA), Leupeptin (Leu),
Chymostatin (Chym) and Phenylmethylsulfonylfluorid (PMSF). The concentrations
of the PI are as mentioned in the table. Two-third volume of 0.45 mm cold glass
beads were added to the resuspended cells and were vortexed in the 4 °C room for
15 minutes at the maximum speed using Vibrax VXR mixer vortexer from IKA. The
crude lysate was taken in a new 1.5 ml microcentrifuge tube and the glass beads
were washed with 200 µl-500 µl homogenization buffer and the wash collected in
same tube. 500 µl from each crude lysate was taken in a new microcentrifuge tube
and 500 µl of 2 % SDS was added to it. The sample was heated at 65 °C for 15 min
700-1000 rpm and centrifuged at 1000 g for 10 min. The supernatant was treated
with SDS sample buffer and used for Western blotting.
Homogenization buffer (pH 7.4)
330 mM Sucrose 300 M Tris 1 mM EGTA 1 mM EDTA 100 mM 6-Aminocaproic acid
2 mM DTT (add fresh)
Protease inhibitor Concentration in 100 ml Homogenization buffer
Leupeptin (Leu) 10 mg/ml in Ultrapure water 80 µl Pepstatin A (PepA) 10 mg/ml in DMSO 80 µl Chymostatin (Chym) 2,5 mg/ml in DMSO 40 µl Phenylmethylsulfonychlorid
(PMSF) 1 M in DMSO 200 µl

98 Experimental
5.4.2 High throughput screening of P. pastoris clones for protein
expression
For the high throughput screening of clones for the protein expression, after
transformation 20 clones from each YPD plate were picked and cultured in 2 ml
MGYH media in a 24 deep well plate (HJ-Bioanalytik GmbH). Two sub-clones of the
internal control clone and two clones transformed with Empty vector were also
cultured in the same plate. The 24 well plate was covered with two layers of sterile
Kim wipes and a tight fitting perforated lid and incubated at 29 °C at 250-350 rpm
for either 24 or 48 h (till the cultures are dense enough for induction). After 24 or
48 h the plates the perforated lid and the Kim wipes were removed and the plate
was sealed with a cellophane tape. The sealed plate was centrifuged at 3200 g for
20 min in Eppendorf centrifuge 5415 D. The supernatants from the wells were
aspirated under ascetic conditions and the pellets were redissolved in 2 ml MM
media with 0.5 % methanol. The plate was again covered with the Kim wipes and
perforated lid and incubated at 29 °C at 350-400 rpm for 24 h. Occasionally, the MM
media with 0.5 % methanol was supplemented with 0.5 % methanol after 12 h of
culturing if the cultures were too thick. After the induction, the plate was again
sealed and centrifuged as mentioned earlier and the supernatant was aspirated. The
plate containing the cell pellets was either stored at -20 °C or directly used for the
cell lysis. The subsequent cell lysis was performed in the same plate as described in
5.4.1
5.4.3 Determination of protein concentrations
The protein concentrations in the samples were determined by one of the following
methods.
5.4.3.1 Absorbance Assay (280 nm)
Quantitation of the amount of protein in a solution is possible by measuring the
absorbance of the light at 280 nm (A280). Absorbance assay is a rapid and
convenient method for the measurement of amount of protein as no additional
reagents or incubations are required and no protein standards need to be prepared.

Experimental 99
The absorption at 280 nm depends on the aromatic acids like Tyr and Trp content of
the protein (and to a lesser extent on the amount of Phe and disulfide bonds).
Because different proteins have different amino acid compositions, the A280 value
varies greatly between different proteins. Hence there may be considerable errors in
the measurement of unknown proteins or protein mixtures. However this assay
provides reliable results for the purified protein solutions such as fractions from
chromatography columns.
To measure the A280 of the protein sample on the Nanodrop (NanoDrop 2000,
Peqlab), 1 µl of the buffer solution in which protein was diluted was placed on the
pedestal and set as blank. The blank sample was removed from the pedestals using a
Kimwipe before making the measurement. 1 µl of the sample (usually elution
fractions from a chromatography column) was placed on the pedestal and the A280
of the sample was measured. The concentration of protein in the sample was
determined using following formula.
5.4.3.2 Bradford assay
The Bradford assay uses a colorimetric reagent Coomassie Brilliant Blue G-250 dye
for the detection and quantitation of total protein (Bradford 1976). The assay is
based on the specific binding properties of the dye to the arginine, tryptophan,
tyrosine, histidine and phenyl alanine residues in proteins. In solution the dye is in
the cationic form (see Figure 5-1) and has an absorption maximum at 470 nm (red
region). In the acidic environment of the reagent, protein binds to the Coomassie
and renders the dye anionic which shifts the absorption maximum to 595 nm. This
results in a spectral shift causing a visible color change from reddish/brown form of
the dye to the blue form. Thus the protein concentration of the sample can be
assayed by measuring the absorption in the spectrophotometer at 595 nm.
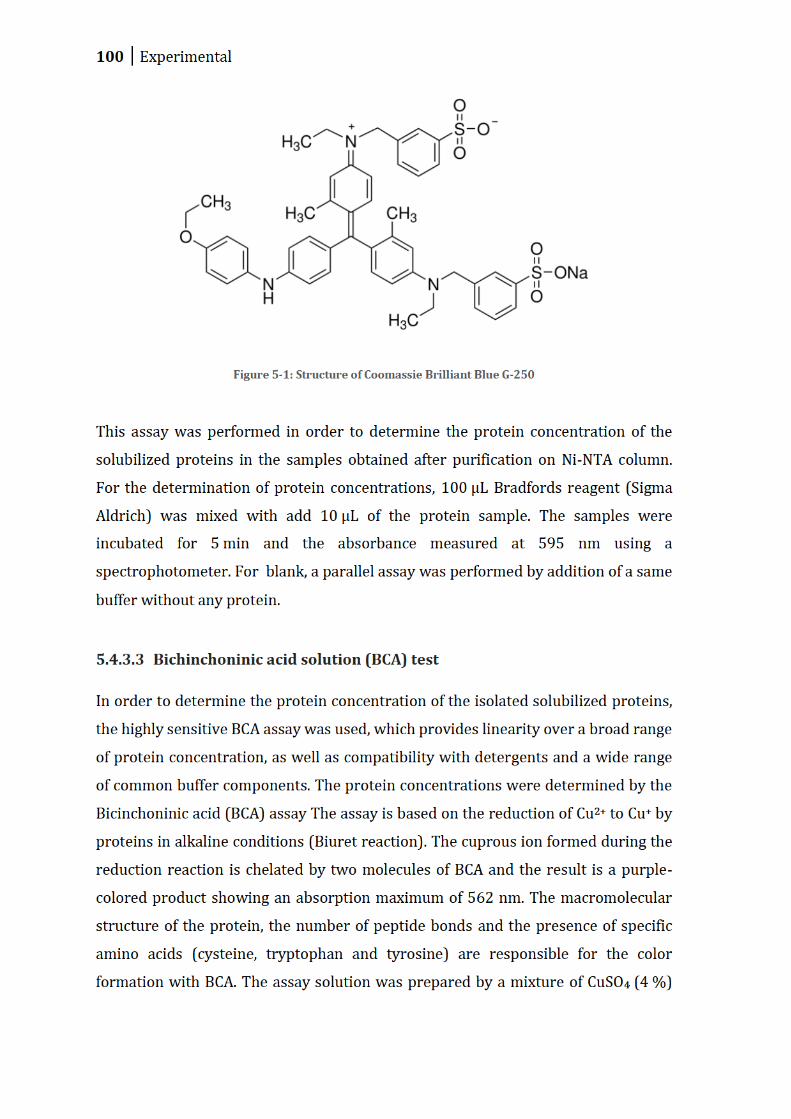
100 Experimental
Figure 5-1: Structure of Coomassie Brilliant Blue G-250
This assay was performed in order to determine the protein concentration of the
solubilized proteins in the samples obtained after purification on Ni-NTA column.
For the determination of protein concentrations, 100 μL Bradfords reagent (Sigma
Aldrich) was mixed with add 10 μL of the protein sample. The samples were
incubated for 5 min and the absorbance measured at 595 nm using a
spectrophotometer. For blank, a parallel assay was performed by addition of a same
buffer without any protein.
5.4.3.3 Bichinchoninic acid solution (BCA) test
In order to determine the protein concentration of the isolated solubilized proteins,
the highly sensitive BCA assay was used, which provides linearity over a broad range
of protein concentration, as well as compatibility with detergents and a wide range
of common buffer components. The protein concentrations were determined by the
Bicinchoninic acid (BCA) assay The assay is based on the reduction of Cu2+ to Cu+ by
proteins in alkaline conditions (Biuret reaction). The cuprous ion formed during the
reduction reaction is chelated by two molecules of BCA and the result is a purple-
colored product showing an absorption maximum of 562 nm. The macromolecular
structure of the protein, the number of peptide bonds and the presence of specific
amino acids (cysteine, tryptophan and tyrosine) are responsible for the color
formation with BCA. The assay solution was prepared by a mixture of CuSO4 (4 %)

Experimental 101
and BCA (1:50). A BSA dilution series (1 mg/ml-0 mg/ml) was used as a standard
calibration to quantify the protein concentrations of the samples.
20 μl of the protein samples and 20 μl of BSA solutions in serial dilutions used as
standard calibration were applied into a 96-well microtiter plate in duplicates. 200
μl of the CuSO4-BSA-reagent was added to each well and the reaction was allowed to
proceed at 60 °C for 30 min. Subsequently the extinction was determined by means
of a microplate reader MR700 from Dynatech. The protein concentration was
calculated by comparing the optical density (OD) with the standard.
The protein samples were treated with 2 % SDS and diluted with 10 times if the
samples to be quantified contained a reducing agent.
5.4.4 SDS-Polyacrylamide gel electrophoresis
The separation and detection of expressed proteins was performed by means of
discontinuous sodium dodecyl sulfate-polyacrylamide gel electrophoresis (SDS-
PAGE) in combination with staining or Western blot analysis, using the Mini-Protean
3 system (BioRad). Discontinuous gels contain a short stacking gel with a low
percentage of acrylamide and low pH (6.8) to concentrate the sample followed by a
resolving gel with a higher percentage of acrylamide and pH (8.8). The
concentration of acrylamide used for the resolving gel depends on the size of the
proteins to be analyzed. The SDS in the sample buffer denatures the proteins to a
random-coil conformation and the reducing agent β-mercaptoethanol disrupts the
tertiary structure of proteins by breaking the disulfide bonds. SDS also masks the
intrinsic protein charge and gives all proteins a net negative charge which is
proportional to their molecular weight. Hence, the proteins migrate towards the
anode and are separated solely by a molecular sieving effect.
A separating gel of desired thickness and percentage of acrylamide was poured in
the gel cassette and layered with 70 % ethanol. Before casting the stacking gel, the
residual ethanol was poured off and blot dried using a paper towel. The polymerized
gels were stored in humid filter papers for a maximum of 7 days.
102 Experimental
The chamber and gels were assembled as described by the manufactures protocol.
Before loading, the protein samples were denatured for 15 min at 65 °C. 5 µl of
prestained PageRuler Protein Ladder from Fermentas was loaded on each gel as a
molecular weight standard and to monitor electroblotting. A maximum of 25 μl
denatured protein sample was loaded in a single well. The electrophoresis was
performed in 1x electrophoresis buffer at 80 V per gel. The voltage was increased to
130-150 V when the proteins arrived at the resolving gel. The composition of the
SDS gels is listed in the table:
Stacking gel 4 % Resolving gel 8 %
ddH2O 1.85 ml 2.9 ml
Stacking gel buffer (pH 6.8) 0.75 ml -
0.4 % (w/v) SDS 0.5 M Tris/HCl
Resolving gel buffer (pH 8.8)
- 1.5 ml 0.4 % (w/v) SDS
1.5 M Tris/HCl 30 % (w/v) acrylamide / 0.8 % (w/v) biSacrylamide TEMED 20 µl 20 µl
10 % APS 12 µl 12 µl
Electrophoresis buffer
0.1 M Tris 0.1 M Glycine 0.1 % (w/v) SDS
4x Sample buffer
252 mM Tris/HCl 8 % (w/v) SDS 4 mM EDTA 40 % (v/v) Glycerol 0.01 % (w/v) Bromphenol blue 5 % (v/v) β-ME (add fresh)
Experimental 103
5.4.5 Protein staining
In order to detect the proteins in the polyacrylamide gels or on the membranes, the
following staining procedures were used.
5.4.5.1 Coomassie staining
The Coomassie dyes bind to proteins though ionic interactions between sulfonic acid
groups of the dye and positive amine groups of the proteins as well as though Van
der Waals interactions. This staining procedure can be used for detection of proteins
in a gel or on a membrane.
5.4.5.1.1 Gel staining
The polyacrylamide gel with separated proteins was rinsed for 3-5 minutes with
ultrapure water to remove SDS and buffer salts, which interfere with binding of the
dye to the protein and then stained in the staining solution with gentle agitation till
the bands were visible (usually overnight). The gel was washed in a destaining
solution until the background of the gelwas fully destained. The destaining solution
was replenished several times. When the background was clear, the gel was washed
once with ultrapure water, transferred in a clear polypropene cover, scanned and
analyzed.
Staining solution
50 % (v/v) Methanol 10 % (v/v) Glacial acetic acid 0.1 % (w/v)
Coomassie Brilliant Blue R-250
Destaining solution
15 % (v/v) Methanol 10 % (v/v) Glacial acetic acid

104 Experimental
5.4.5.1.2 Membrane staining
The blot transfer membranes were placed in a plastic box and washed with
ultrapure water 3 times for 5 min each. The membrane was stained with the
membrane staining solution for 5-20 min until the protein bands were visible. Once
the bands were visible and dark, the membrane was washed in destaining solution
until the background of the membrane was fully destained. The membrane was
washed several times with ultrapure water, transferred in a clear polypropene
cover, scanned and analyzed.
Membrane Staining solution
40 % (v/v) Methanol 7 % (v/v) Glacial acetic acid 0.025 % (w/v)
Coomassie Brilliant Blue R-250
Membrane Destaining solution
50 % (v/v) Methanol 7 % (v/v) Glacial acetic acid
5.4.5.2 Silver staining
Silver staining is about 50 to 100 times more sensitive than Coomassie blue staining.
Silver staining relies on the binding of silver to amino acid side chains, primarily
sulfhydryl and carboxyl groups of proteins. After electrophoresis the gels were
placed in a plastic container and washed with ultrapure water for 5 min on a
platform shaker with continuous, gentle agitation. The water was removed and gel
was fixed by incubating in 10 to 20 gel volumes of fixing solution for 10 min. After
the fixation step, the gel was washed with 50 % methanol for 10 min and briefly
immersed in a freshly prepared 0.02 % sodium thiosulfate solution (~1 min). The
solution was removed and the gel was washed 2 times in ultrapure water for 5 min
each and incubated in 0.2 % silver nitrate solution in dark at 4 °C for 30 min. the gel
was then washed 3 times for 1 min with ultrapure water and incubated in the
developing solution till the protein bands were visible. The gel was washed with

Experimental 105
ultrapure water for 1 min and transferred to the stopping solution for 2 min. The gel
was covered in a clear polypropene bag, scanned and analyzed.
Fixing solution
50 % (v/v) Methanol 5 % (v/v) Glacial acetic acid
Developing solution
3 % (w/v) Sodium carbonate 0.01(v/v) Formaldehyde
Stopping solution
5 % (v/v) Glacial acetic acid
5.4.6 Western blot
For Western blot analysis, the protein samples separated by SDS-polyacrylamide gel
electrophoresis were transferred onto either nitrocellulose membranes (HybondTM
ECL, GE Healthcare Biosciences) or PVDF membranes (Roth) by wet blotting
method. This method is applied to transfer the proteins on the gels to the membrane
and to ensure their accessibility for antibodies.
For wet blotting, the membrane, gel and 2 layers of WhatmanTM paper were soaked
with wet blot transfer buffer and placed between a platinum-coated titanium anode
and a stainless steel cathode of the Trans-Blot® Electrophoretic Transfer Cell (Bio-
Rad) with the membrane facing the anodic side. A horizontal electrical field (80 V)
was applied for 1.5 h to transfer the proteins from the gel to the membrane.
After the transfer, the membranes were washed with tris buffered salin (TBS) and
then fixed with Ponceau-S fixing solution or 3 % (w/v) TCA in ultrapure water for
10-15 min. Thereafter, the membranes were washed 3 times with ddH2O, once with
TBS and blocked with 5 % (w/v) milk powder in TBS or TBS-T (TBS with 0.1 %
(v/v) Tween20) buffer for 30-60 min to cover unspecific binding sites. After the
blocking step, the membranes were washed twice with TBS-T and TBS for 5 min

106 Experimental
each and were subsequently incubated with the primary antibody diluted in TBS
with 0.5 % (w/v) milk powder overnight at 4 °C.
In order to determine the protein loading GAPDH expression was analysed on each
blot in addition. The list of primary antibodies used for various experiments is
shown in the following table.
Primary antibodies
His tag 1:1000 Anti-6X His tag® antibody ab14923 Abcam
MRP3 1:2000 Anti-MRP3 antibody [M3II-9] ab3375 Abcam
1:1000 Anti-MRP3 antibody ab84887 Abcam
Strep tag II 1:500 StrepMAB-Classic 2-1507-001 Iba
GAPDH 1:2000 GAPDH Antibody (1D4) NB300-221 Novus Biologicals
Next day, the membranes were washed again 2 times for 10 minutes with TBS-T and
2 times with TBS for 5 min each and incubated (1-2 h) with an appropriate
secondary horseradish peroxidase-conjugated antibody diluted in TBS containing
0.5 % (w/v) milk powder. The secondary antibodies used and their concentrations
in various experiments are listed the tables.
Secondary antibodies
mouse 1:2000 Rb anti Mouse Immunoglobulins / HRP P026002-2 Dako
rabbit 1:1000 Sw anti Rabbit Immunoglobulins / HRP P021702-2 Dako
For Strep tag II primary antibody, instead of Milk powder 3 % (w/v) BSA in TBS was
used as a blocking reagent. As the 3 % (w/v) BSA solution poorly covers unspecific
binding sites, the secondary antibody was diluted in TBS containing 5 % (w/v) milk
powder for simultaneous blocking and binding.
After the treatment with secondary antibody, the washing step with TBS-T and TBS
(3 washing steps, each 5 min) was repeated and the proteins were detected by

Experimental 107
enhanced chemiluminescence with the ECL Kit (Amersham Biosciences) according
to the manufacturer’s instructions and exposed to Hyperfilms (GE Healthcare
Biosciences).
Densitometric analysis was performed by means of the Argus XI program (Biostep
GmbH) and quantification was carried out with the ImageJ Software (NIH).
Wet blot transfer buffer
25 mM Tris 192 mM Glycine 20 % (v/v) Methanol
TBS buffer (pH 8)
10 mM Tris 150 mM NaCl
Ponceau S fixing solution
0.25 % (w/v) Ponceau S 3 % (w/v) TCA
5.4.7 Proteolytic cleavage of peptides
The protein purified on Ni-NTA column was subjected to one of the following
proteolytic cleavage.
5.4.7.1 Cleavage by 3C protease
In order to keep the protein in soluble state, it was necessary that a minimum
concentration of 0.1 % DDM was maintained in the buffers. So, the 10x buffer
supplied by the manufacturer was diluted to 5x as follows.
This diluted buffer was then used for the further protease reactions. The
composition of buffer A used for the dilution of DDM was as follows.

108 Experimental
Dilution of 3C protease buffer
10x 3C protease buffer 5 ml 10 % (w/v) DDM in buffer A 500 µl Ultrapure water 4.5 ml Total 10 ml
Buffer A
50 mM Tris 20 % Glycerol 50 mM NaCl
The protein purified on Ni-NTA column was quantified for its protein concentration
as described in section 5.4.3.1 and used for the cleavage by the 3C protease. The
reaction was set up in a 1.5 ml microcentrifuge tube as mentioned in the table. A
negative control of the reaction was set up with only 5x buffer (with 0.5 % DDM)
and the protein. 5 µl of ultrapure water was added to the negative control instead of
3C protease.
3C protease reaction
Protein x µl 5x buffer (with 0.5 % DDM) 40 µl HRV 3C protease 5 µl Ultrapure water 155-x µl Total 200 µl
Incubated at 4 °C overnight at 200 rpm
x = volume of protein sample used for the reaction
The protease cleavage was performed using 5, 10, 20, 50 and 100 µg of protein
purified on the Ni-NTA column. The volume of protein used in the reaction was
calculated using following formula.

Experimental 109
The cleavage by 3C protease was monitored by subsequent western blotting as
described in 5.4.6, by using a suitable antibody which can differentiate the protein
before and after the cleavage.
5.4.7.2 Cleavage by Factor Xa
The 10x buffer supplied by the manufacturer was diluted to 5x with ultrapure water
and 10 % DDM in buffer A, as mentioned in the table. This dilution was made to
maintain 0.1 % DDM in the final protease reaction in order to keep the protein in
soluble state.
Dilution of Factor Xa protease buffer
10x Factor Xa protease buffer 5 ml 10 % (w/v) DDM in buffer A 500 µl Ultrapure water 4.5 ml Total 10 ml
The protein purified on Ni-NTA column was used for the cleavage by the Factor Xa
protease. The amount of protein in the sample was quantified as described in section
5.4.3. The reaction was set up in a 1.5 ml microcentrifuge tube as mentioned in the
table. A negative control of the reaction was set up with only 5x buffer (with 0.5 %
DDM) and the protein. 5 µl of ultrapure water was added to the negative control
instead of Factor Xa protease.
Factor Xa protease reaction
Protein x µl 5x buffer (with 0.5 % DDM) 40 µl HRV 3C protease 5 µl Ultrapure water 155-x µl Total 200 µl
Incubated at 4 °C overnight at 200 rpm
x = volume of protein sample used for the reaction The volume of protein used in the reaction was calculated as mentioned in section
5.4.7.1

110 Experimental
5.5 Large scale fermentation, Protein Isolation and
purification
5.5.1 Large scale fermentation of P. pastoris
The large scale fermentation was performed under control conditions in Infors HT
Minifors bench top fermenter. The clones which have shown reproducible
expression of high amounts of protein in small scale cultures were used for the large
scale production of protein. The fermentation involved following steps.
d. Creating the pre-culture
The selected clone plated on a fresh YPD agar plate supplemented with 100 µg/ml
Zeocin and was incubated at 30 °C for 3-4 days. A distinct colony from this plate was
picked and inoculated in 50 ml MGY medium in a 250 ml baffled flask. The culture
was incubated for 24 h at 29 °C at 200 rpm. The OD600 of 1 for a 50 ml culture
refers to a mass of about 1.32 g of yeast cells. The culture was grown till the OD600
reached at least 2.5 as the inoculation with 3 g of viable cells was found to be
optimal for the fermentation (Spruth 2011 ).
e. Fermentation process
For the large scale fermentation and production of the protein, a protocol
established by our working group for MRP3 expressing clone obtained from Prof.
Urbatsch (Texas Tech University, USA) was used.
The fermentation process involved three different phases. The first phase, also
known as glycerol-batch phase, involved the exponential growth of yeasts. For the
production of biomass, glycerol was used in the growth media as a carbon source.
When the glycerol from the media was consumed, the linear feeding of glycerol was
continued to generate a large amount of biomass. This second phase of feeding
glycerol was referred to as the glycerol –feed phase. This is followed by the third so-
called methanol-feed phase. The methanol is provided at constant rate in order to
induce the culture for the expression of MRP3.

Experimental 111
The bench top fermenter Infors HT Minifors used for the fermentation includes a
cooling jacket for the reaction vessel, probes for pH, temperature, dissolved oxygen
and foam control. To ensure the optimal fermentation, these parameters were
monitored and controlled using a computer program. The time periods and volumes
of glycerol-batch phase, glycerol-feed phase and the methanol feed phase were
calculated by Monod model and simulated with software IRIS V5.2 (Infors HT). The
computer program and the protocol were established by our coworker Patrick
Seelheim.
f. Preparation
The fermenter was assembled and the fermenter vessel was filled with 1 L of non-
sterile fermentation medium. The composition of the media used was taken from
Current Protocols in Protein Science (Romanos et al., 2001) and have been slightly
modified. The appropriate reagent flasks labeled as feed and AF (Antifoam) was
filled with 50 % (w / v) glycerol and antifoam agent respectively. The reagent flask
labeled as base was filled with 170 ml of ultrapure water while the reagent flask for
methanol (labeled as acid) was kept empty. Then all the electrodes, filters and the
rotor were covered with aluminum foil and the fermenter was steam-sterilized at
121 ° C for 30 min.
The sterile fermenter assembly of the fermenter vessel and the reagent flasks were
then connected to the base unit and the fermenter was switched on. The heat shield,
tempertaure sensor and all the electrodes were connected. After the temperature
reached the set point, 50 ml of sodium hexametaphosphate solution of (2.5 % (w/v))
and 4.35 ml sterile PTM (Pichia trace metals) were aseptically added to the
fermenter vessel. The reagent flasks labeled as base and acid were filled with 30 %
(v / v) solution of ammonia and methanol (pa) under sterile conditions respectively.
The reagent flasks with glycerol and methanol were supplemented with 12 ml /L
PTM aseptically.

112 Experimental
g. Fermentation
The 50 ml pre-culture was inoculated in the fermenter vessel when the fermentation
medium showed a constant pH value of 5 and a temperature of
29 ° C. Immediately after the inoculation the glycerol-batch phase starts which takes
around 12–18 h. The glycerol feed phase automatically started after the completion
of glycerol-batch phase. During the feed phase 200-250 ml of glycerol (20 ml / h)
was added to the culture to generate the biomass (about 24-28 h). Subsequently,
after the generation of biomass, the culture was supplemented with methanol at a
constant rate (3 ml/h). This methanol feed phase was continued for 24, 36 or 48 h
and the culture was harvested after this induction phase.
After the completion of fermentation, the yeast suspension from the fermenter was
collected and culture was centrifuged for 15 min at 6,000 rpm (3500 g) in a JA14
rotor (Beckman) at 4 °C. The supernatant after this centrifugation step was
discarded and the pellet was dissolved in ultrapure water. The resuspended pellet
was again centrifuged for 15 min at 6,000 rpm (3500 g) and the pellet containing
yeast cells was stored at -70 °C until further processing. The composition of different
solutions and media used for the fermentation are listed in the following tables.
MGY media (pH 5.0)
0.34 % (w/v) Yeast nitrogen base 2 % (w/v) Glycerol
1 % (w/v) (NH4)2SO4
0.0004 % (w/v) Biotin 0.1 M Phosphate buffer Autoclaved and stored up to 6 months at 4 °C
Fermentation media (1 L)
1.14 g CaSO4.2H2O
18.2 g K2SO4
14.9 g MgSO4·7 H2O
9.0 g (NH4)2SO4
40.0 g Glycerol ad 1 L Ultrapure water

Experimental 113
Sodium hexametaphosphate solution
25 g Sodium hexametaphosphate 50 ml Ultrapure water
PTM 24 mg/ml CuSO4·5H2O
0.32 mg/ml NaI
12 mg/ml MnSO4·H2O
0.8 mg/ml Na2MoO4·2 H2O
0.08 mg/ml H3BO3
2 mg/ml CoCl2
80 mg/ml ZnCl2
260 mg/ml FeSO4·7 H2O
0.8 mg/ml D-(+)-Biotin
0.02 ml/L H2SO4
Autoclaved and stored indefinitely at room temperature.
5.5.2 Preparation of microsomes from P. pastoris
For the isolation and purification of the expressed protein, it is necessary to disrupt
the yeast cells. But the yeast cells are difficult to lyse due to the highly complex and
stable yeast cell wall. Mild methods such as chemical lysis or osmotic shock are not
sufficient for efficient lysis of the cells o large scale. On the other hand, enzymatic
digestion of the cell wall generates the protoplasts which usually require lysis with
detergents that denatures the proteins and render them inactive. Therefore,
mechanical cracking/fracturing of the yeast cell is most commonly used to break the
rigid cell wall.
The mechanical cell lysis of the MRP3 expressing Pichia pastoris cells from the
fermenter was performed by one of the following methods. In order to protect the
expressed protein from denaturation and proteolytic degradation, all the steps were
performed at 4 °C and different protease inhibitors were added to the buffers at
various steps.

114 Experimental
5.5.2.1 Disruption using BeadBeaterTM
A mass of 70-80 g of wet cells from the MRP3 expressing Pichia culture harvested
from the fermenter was dissolved in 100 ml of ice cold homogenization buffer
supplemented with protease inhibitors (PIs) and DTT. The composition of
homogenization buffer and concentration of the various PIs was as described in
section 5.4.1. The cell suspension was mixed with 130 ml of cold glass beads (∅ =
0.45 mm, BioSpec Products) and transferred into BeadBeater chamber
(BeadBeaterTM, Model 1107900, BioSpec Products). The chamber filled with the cell
suspension and glass beads was assembled in the cooling jacket and in the jacket a
mixture of isopropanol and dry ice was filled.
The cells were agitated in the BeadBeater 1 5 times for 1 minute, each time keeping
the cells on ice for 1 minute in between. After the complete disruption for 15 min the
lysed cell suspension was transferred to a 250 ml centrifuge bottle and 200 μL fresh
PMSF was added to it. The glass beads were washed with approximately 100 ml of
homogenization buffer and the wash was collected in the same centrifuge bottle. The
lysed cell suspension was centrifuged at different rotation speeds as described in
section 0 in order to obtain the microsomal fraction.
5.5.2.2 Disruption using Emulsifier
The mechanical disruption was performed in high pressure emulsifier (EmulsiFlex-
C5, Avestin) in order to get better yield of disruption. The homogenizer (emulsifier)
has an air/gas driven high pressure pump and lyses the cells by pressurizing the cell
suspension and suddenly releasing the pressure. This sudden change in the pressure
creates a liquid shear which is capable of lysing the yeast cells. For yeast cell lysis
operating pressure of 20,000 psi was used.
The wet cells from the MRP3 expressing Pichia culture harvested from the fermenter
were dissolved in ice cold homogenization buffer supplemented with protease
inhibitors (PIs) and DTT at a concentration of 1.2-1.5 ml homogenization buffer/g
cells. The cells were suspended carefully till the solution was free of any cell clumps
or the ice crystals. The homogenizer was cleaned and precooled by flushing through
10 ml of ice cold ultrapure water 2x by releasing the pressure. The apparatus was

Experimental 115
also rinsed with 10 ml of ice cold homogenization buffer supplemented with PIs
(section 5.4.1) before applying the cell suspension. The homogenous cell suspension
(10-20 ml) was then poured into the homogenizer and passed through the dynamic
homogenizing valve under high pressure (20,000 psi). The high operating pressures
resulted in a rise in the temperature of the cell suspension after lysis. The lysed cells
were collected and cooled on ice. The cell suspension was passed through the
homogenizing valve multiple (at least 3) times in order to achieve a reasonable
degree of lysis. The lysed cell suspension was then centrifuged at different rotation
speeds as described in section 0 to separate the membrane fractions.
5.5.2.3 Centrifugation after mechanical disruption
The disrupted cells were centrifuged at 4 °C using various rotors and different
rotation speeds in order to separate the membrane fractions. The first step of
centrifugation was performed with JA14 rotor (Beckman) at 6000 rpm (5,520 g) for
15 min for the removal of cell debris, nuclei and of other large cell components. The
turbid and slimy supernatant obtained after the first centrifugation step was
separated and centrifuged again for 30 min at 12000 rpm (22,100 g). The
supernatant obtained after the second centrifugation step was clear and contained
the membrane fractions. In order to pellet down the microsomal fractions, the
supernatant was centrifuged for 60 min at 48000 rpm (278,400 g) in Ultracentrifuge
L-70 (Beckmann) with Ti 50.2 rotor. The pellet obtained after ultracentrifugation
was dissolved in 1-3 ml of washing buffer supplemented with PIs (25 μL Pepstatin A,
Leupeptin and Chymostatin and 75 μL of Phenylmethylsulfonylfluorid was added to
30 ml washing buffer). The composition of washing buffer was as mentioned in the
table and concentrations of PIs as similar to as mentioned in section 5.4.1.
Washing buffer
50 mM Tris 10 % Glycerol
The resuspended pellets were diluted with washing buffer to fill up the tubes and
ultracentrifuged again for 60 min at 48000 rpm (278,400 g) in Ultracentrifuge L-70

116 Experimental
(Beckmann) with Ti 50.2 rotor. The supernatant after this washing step was
discarded and each pellet was resuspended in 1-3 ml of buffer A supplemented with
PIs and homogenized 10x in a Dounce homogenizer (30 ml of buffer A supplemented
with 25 μL Pepstatin A, Leupeptin and Chymostatin and 75 μL of
Phenylmethylsulfonylfluorid). The composition of buffer A was as mentioned in the
table.
Buffer A
50 mM Tris 20 % Glycerol 50 mM NaCl
The resuspended and homogenized microsomal fractions from all the pellets were
collected. The microsomal fraction was either directly used for solubilization or
blast-frozen in liquid nitrogen and stored at -70 °C.
5.5.3 Solubilization of microsomal membrane vesicles
Chromatographic purification requires the protein of interest to be in a soluble state.
The solubilization involves extraction of the protein of interest from its native
membranes which can be performed by using various detergents. The dissociation
of the membrane by using suitable detergent results in formation of small protein-
lipid clusters. The micelles formed by the aggregation of detergent molecules are
analogous to the biological membranes and can incorporate the proteins by
hydrophobic interactions. In these clusters the hydrophobic regions of membrane
protein, which are normally embedded in the membrane lipid bilayer, are
surrounded by a layer of hydrophobic tails of detergent molecules and the
hydrophilic portions are exposed to the aqueous medium. This property allows the
protein-lipid clusters to stay soluble in aqueous solutions. This soluble protein can
then be used for purification and further analysis.
The MRP3 was solubilized using a mild, non-ionic detergent n-dodecyl β-D-
maltopyranoside (DDM). The frozen microsomal fractions from section 5.5.2.3 were
carefully thawed at 29 °C in a water bath and then kept on ice. The microsomal

Experimental 117
fraction was diluted with buffer A to get a final concentration of ~4 mg microsomal
protein/ml. Equal volume of solubilization buffer was added to the microsomal
suspension and carefully stirred twice at RT for 15 min with incubation on ice for
1 min in between. The composition of solubilization buffer was as follows.
Solubilization buffer
Buffer A
0. 5 % (w/v) DDM
0.5 mM β-ME
The solubilized protein was centrifuged in Ultracentrifuge L-70 (Beckmann) with Ti
50.2 rotor at 28000 rpm (94,700 g) for 30 min at 4 °C, in order to remove undesired
components. The supernatant containing soluble protein was used for purification
on affinity columns.
5.5.4 Ni (II)-NTA Affinity Chromatography
The Ni (II)-NTA Affinity Chromatography is based on the concept of immobilized-
metal affinity chromatography (IMAC). It uses the affinity of transition metal ions
such as Cu2+, Zn2+ or Ni2+ to histidine and cysteine in aqueous solutions.
In the Ni (II)-NTA affinity resin, the Ni2+ is immobilized on agarose beads by
chelation using nitroloacetic acid (NTA). The poly His sequence from the
recombinant protein binds to the immobilized Ni2+cations from the column and
other proteins pass through the matrix (Figure 5-2). The bound protein can be
eluted from the column under mild conditions by adding 100–250 mM imidazole or
by reducing the pH.
The purification of MRP3 on Ni-NTA column was performed either on small scale or
large scale. In both the cases all the steps were carried out at 4 ° C. The compositions
of different buffers used for the purification are mentioned in a table after the
description of both small and large scale procedures.

118 Experimental
Figure 5-2: The complex formation between the poly-His tag of the protein and the immobilized a Ni2+
cations on from the Ni-NTA agarose (Block, Maertens et al. 2009).
5.5.4.1 Purification on small scale
For small scale purification, 1 or 5 ml of the Ni (II)-NTA Agarose (Qiagen) was filled
in a column and used under gravity flow. The column material was washed several
times with 1 column volume (CV) of equilibration buffer before loading the
solubilized protein onto the column. This was necessary to prevent the aggregation
of the protein on the column. After the equilibration, the 1-5 CV of the solubilized
sample was loaded and incubated on the column for 5 min. The unbound fraction
called flow through (FT) after 5 min was let run from the column under the influence
of gravity. The FT was again reloaded on the column and incubated again. This
process was repeated 4x for efficient binding of the protein. After the binding step,
the column with the bound protein fraction was washed with different washing
buffers (WB). Following the washing steps with 1 CV of WB1 and WB2, 0.5 CV of
elution buffer was loaded on the column and incubated for 5 min. The sample after
5 min incubation was collected and labeled as elution fraction (E). The elution step
was repeated 3-5x in order to elute all the bound protein from the column. The
column was washed and regenerated as described in section 5.5.4.3.

Experimental 119
5.5.4.2 Purification on large scale
The large scale purification was performed by using 25 ml Ni (II)-NTA-Agarose
(Quiagen) in glass columns operated by a High-precision multi-channel (IPC,
Ismatec).
Before loading the sample, the column was washed 2x with 75 ml ultrapure water (3
CVs), let drip at maximum pump speed. The column was equilibrated with 50 ml (2
CVs) of equilibration buffer and let drip until liquid level is 2 mm above resin. The
solubilized protein sample was loaded onto equilibrated Ni-NTA resin column and
let circulate overnight at a pump speed of 60. Next day the overnight incubated
sample was let drip at maximum pump speed and labeled as FT. The column was
washed with 6 CVs of WB1 and 4 CVs of WB2 at maximum pump speed and the
samples were collected as W 1 and W2. After the washings, 2 CVs of the
elution buffer (EB) was loaded on the column and two fractions of 0.2 CV were
collected at a pump speed of 60. The EB was incubated for 15 min and next fraction
of 0.2 CV was collected. The elution fractions were collected till the EB from the
column was over. The amount of protein in different elution fractions was
determined by Bradford’s assay as described in section 5.4.3.2. The fractions
containing highest amount of protein were collected and concentrated by
ultrafiltration by using membrane filters with different cut off size (Amicon).
The collected elution fractions from the Ni-NTA purification were transferred in an
ultrafiltration cell (Model 8200, Millipore) and concentrated using Amicon
membrane filter of 100 kDa cut off size. The sample was concentrated to 10 ml by
ultrafiltration under a pressure of maximum 2 bars from a nitrogen pressure source.
The concentrated sample was diluted to 25 ml with buffer A supplemented with
0.1 % DDM and again concentrated to 5 ml. The process was repeated 2x. The
concentrates sample was collected and transferred to ultrafiltration cell assembled
with Amicon membrane filter of 30 kDa cut off size. The sample was diluted to 25 ml
with buffer A containing 0.1 % DDM and concentrated to 5 ml under a pressure of
maximum 4 bars. The dilution and ultrafiltration was repeated 3x and the protein
was concentrated to 1-2 ml. The concentration of the protein was determined by
measuring the absorption at 280 nm as described in section 5.4.3.1. The
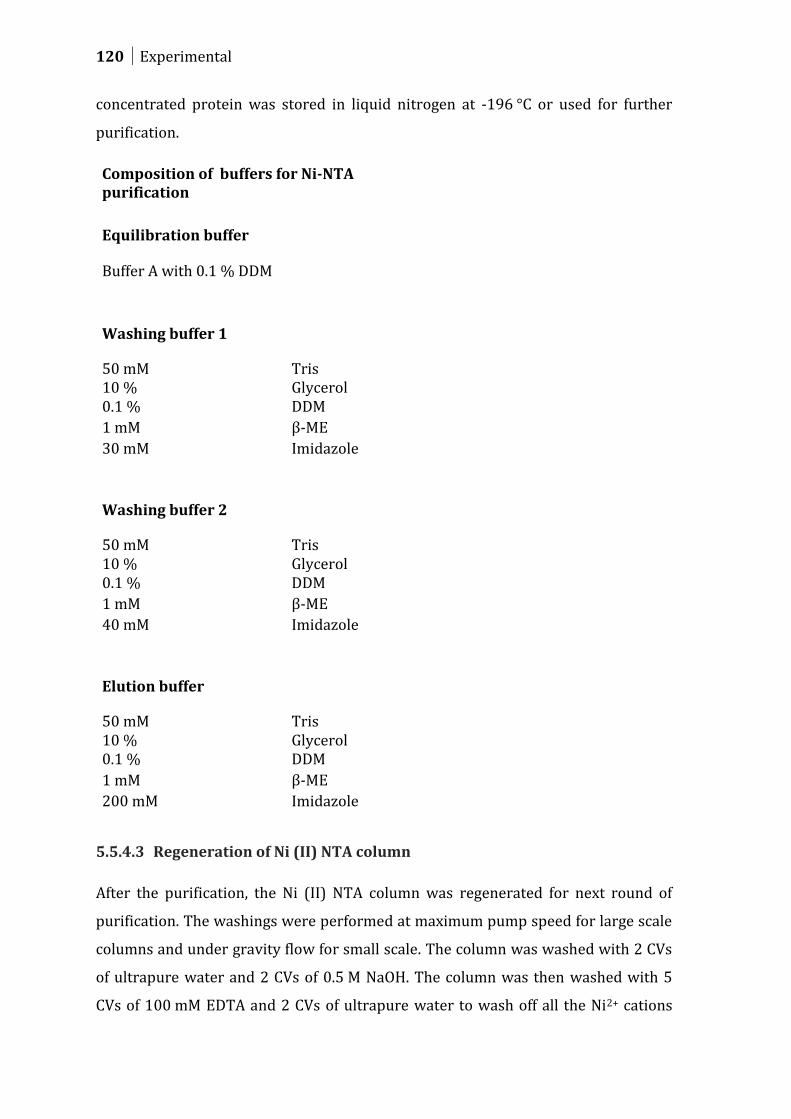
120 Experimental
concentrated protein was stored in liquid nitrogen at -196 °C or used for further
purification.
Composition of buffers for Ni-NTA purification
Equilibration buffer
Buffer A with 0.1 % DDM
Washing buffer 1
50 mM Tris 10 % Glycerol 0.1 % DDM
1 mM β-ME
30 mM Imidazole
Washing buffer 2
50 mM Tris 10 % Glycerol 0.1 % DDM
1 mM β-ME
40 mM Imidazole
Elution buffer
50 mM Tris 10 % Glycerol 0.1 % DDM
1 mM β-ME
200 mM Imidazole
5.5.4.3 Regeneration of Ni (II) NTA column
After the purification, the Ni (II) NTA column was regenerated for next round of
purification. The washings were performed at maximum pump speed for large scale
columns and under gravity flow for small scale. The column was washed with 2 CVs
of ultrapure water and 2 CVs of 0.5 M NaOH. The column was then washed with 5
CVs of 100 mM EDTA and 2 CVs of ultrapure water to wash off all the Ni2+ cations

Experimental 121
bound to the resin. The column was recharged for next round of purification by
washing with 2 CVs100 mM NiSO4 and drained until close to surface. The recharged
column was washed with 10 CVs of ultrapure water and 2 CVs of 30 % ethanol and
stored at 4 °C in 30 % ethanol.
5.5.5 Strep tag II Affinity Chromatography
The Strep tag II affinity purification is based on the principle of the well known
binding of biotin to streptavidin. The Strep tag II peptide is capable of binding to the
biotin binding pocket of streptavidin and hence serves as purification tag. The
column resin uses an engineered streptavidin called Strep-Tactin which has high
affinity to the Strep tag. The Strep-tagged proteins bind to the column with high
affinity and specificity while other proteins pass through the matrix. The bound
proteins are eluted using low concentrations of biotin or desthiobiotin (a stable,
reversibly binding biotin analog) in the elution buffer.
The purification on Strep-tactin column was performed on small scale by using
either 200 µl, 500 µl or 1 ml of Strep-tactin resin (Strep-Tactin Superflow®, IBA).
The purification with 200 µl of resin was performed in spin columns and the
washing and elution was performed in a microcentrifuge for short time. For 500 µl
or 1 ml columns, the washing and elutions were performed in 5 ml syringes and
under the influence of gravity. In both the cases the purification involved following
steps.
The column material was washed 5x with 1 column volume (CV) of Strep wash
buffer supplemented with 0.1 % DDM, before loading the solubilized protein onto
the column. This was necessary to prevent the aggregation of the protein on the
column. After the equilibration, the 1-5 CV of the solubilized sample or the protein
purified on Ni-NTA column (before concentration) was loaded and incubated on the
column for 5 min. The unbound fraction called flow through (FT) after the
incubation was let run and reloaded on the column and incubated again. This
binding step was repeated 5x for efficient binding of the protein (in case or spin
columns, the columns were incubated with gentle shaking for 60 min). Following the
binding step, the column with the bound protein fraction was washed 3x with 1 CV

122 Experimental
of the Strep wash buffer (with 0.1 % DDM). After washing of the column, 0.5 CV of
Strep elution buffer (EB) was loaded on the column and incubated for 5 min. The
sample after 5 min incubation was collected and labeled as elution fraction (E). The
elution step was repeated 3-5x in order to elute all the bound protein from the
column. The compositions of different buffers used for the purification are
mentioned in the table.
After the purification, the Strep-tactin column was washed 3x with 1 CV of the Strep
wash buffer (without 0.1 % DDM) and regenerated by washing the column 2x with 1
CV of 1x BufferR (regeneration buffer, IBA) containing HABA (2-[4'-hydroxy-
benzeneazo]benzoic acid). The HABA displaces desthiobiotin (from the elution
buffer) at the biotin-binding site and regenerate of immobilized Strep-Tactin for the
next round of purification. The columns were stored at 4 °C in 1x R-buffer until next
use.
Composition of buffers for Strep-tactin purification
Strep washing buffer 100 mM Tris 10 % Glycerol 0.1 % DDM
150 mM NaCl
1 mM EDTA
Strep elution buffer 100 mM Tris 10 % Glycerol 0.1 % DDM
150 mM NaCl
1 mM EDTA 2.5 mM Desthiobiotin
5.5.6 Purification on Reactive red columns
Reactive Red is a polyaromatic textile dye which binds to proteins with affinities to
various nucleotides (Figure 5-3). The reactive chloro groups allow immobilization of
this dye onto a support matrix such as sepharose or agarose. This immobilized dye

Experimental 123
can then be used for the affinity purification of any ATP binding protein including
ABC transporters (Worrall 1996). The bound protein can be eluted from the column
either by using high salt concentration or by competitive replacement by using a
substrate of the protein or by nucleotide cofactor.
Figure 5-3: Structure of Reactive Red 120
A batch-purification method was used for the purification of MRP3 with Reactive
Red column material (Reactive Red-120, Sigma). 500 µl of the column material was
taken in a spin column and washed 5x with the binding buffer for the equilibration.
The solubilized protein sample or the protein purified on Ni-NTA column (before
concentration) was prepared for the loading by mixing 500 µl of the sample with
equal volume of 2x Binding buffer. The 1 ml protein sample and was then mixed
with 500 µl of the equilibrated column material and incubated in 2 ml
microcentrifuge tube on a shaker for 1 h at 4 °C. After incubation the column
material was loaded on spin columns and washed 2x with 1 CV of the binding buffer.
The protein was eluted 2x with 1CV of Elution buffer 1 (EB1) and 3x with 1CV of
Elution buffer 2 (EV2). The washing and elution steps were performed in a
microcentrifuge by spinning down the spin column for short time (30 Sec).
After the purification the column material was washed 5-10x with 1 CV binding
buffer (without DDM) and was regenerated by washing 3x with regeneration buffer.
The resin was stored in storage buffer at 4 °C until the next use.

124 Experimental
The purification was repeated with different pH values for binding and elution
buffers. Compositions of different buffers used for the purification of Reactive Red
column were as mentioned in the table.
Composition of buffers for Reactive Red purification
Binding buffer
10 mM Tris-HCl adjust to pH 7 or 8
0.1 % DDM
Elution buffer 1
10 mM Tris-HCl
500 mM NaCl adjust the pH same as binding buffer 0.1 % DDM
Elution buffer 2
10 mM Tris-HCl
1 M NaCl adjust the pH same as binding buffer 0.1 % DDM
Regeneration buffer
100 mM Borate
1 M NaCl adjust the pH to 9.8 using 1M NaOH
Storage buffer
2 M NaCl

Appendix 125
6 Appendix
6.1 Abbreviations
AB Antibody ABC ATP-binding cassette AOX alcohol dehydrogenase ATP adenosine triphosphate BBB blood-brain barrier BCRP breast cancer resistance protein BSA bovine serum albumin
CaCl2 calcium chloride
cDNA complementary DNA cm centimetre conc. concentration
CuSO4 copper(II) sulfate
ddH2O double distilled water
DDM n-Dodecyl β-D-Maltopyranoside DMSO dimethyl sulfoxide DNA deoxyribonucleic acid EDTA ethylenediaminetetraacetic acid GAPDH Glyceraldehyde 3-phosphate dehydrogenase h hour hMRP3 human MRP3 KCl potassium chloride kDa kilodalton kg kilogram
KH2PO4 potassium dihydrogen phosphate
M molar mA milliampere MDR multidrug resistance
MgCl2 magnesium chloride
ml millilitre mRNA messenger RNA MRP Multridrug resistant protein MRP multidrug resistance-associated protein
Na2HPO4 disodium hydrogen phosphate
NaCl sodium chloride NaOH sodium hydroxide NBD nucleotide binding domain ng nanogram nM nanomolar

126 Appendix
OD optical density PARS Pichia Autonomous Replication Sequence P-gp P-glycoprotein PI Protease inhibitors Pi Inorganic phosphate psi pound per square inch qRT-PCR quantitative real-time polymerase chain reaction RNA ribonucleic acid rpm revolutions per minute sec second SDM site directed mutagenesis SDS sodium dodecyl sulfate SDS-PAGE sodium dodecyl sulfate polyacrylamide gel electrophoresis TBS Tris buffer saline TMD transmembrane domains U unit UV-Vis ultraviolet-visible V volt v/v volume per volume w/v weight per volume
Abbreviation Amino acid name
Ala A Alanine Arg R Arginine Asn N Asparagine Asp D Aspartic acid (Aspartate) Cys C Cysteine
Gln Q Glutamine Glu E Glutamic acid (Glutamate) Gly G Glycine
His H Histidine
Ile I Isoleucine Leu L Leucine Lys K Lysine Met M Methionine Phe F Phenylalanine Pro P Proline Ser S Serine Thr T Threonine Trp W Tryptophan Tyr Y Tyrosine Val V Valine
Asx B Aspartic acid or Asparagine

Appendix 127
Glx Z Glutamine or Glutamic acid Xaa X Any amino acid STOP
termination codon

128 Appendix
6.2 Materials and devices
Acetic Acid Merck Eurolab acrylamide AppliChem GmbH
Ampicillin Applichem GmbH APS AppliChem GmbH
BCA Sigma Aldrich Chemie GmbH Bicine Sigma Aldrich Chemie GmbH
Bradford reagent Sigma Aldrich Chemie GmbH Bromophenol Blue AppliChem GmbH BSA BIOMOL GmbH Chelex Suspension BIO-RAD Laboratories GmbH
Chymotrypsin AppliChem GmbH Copper Sulfate Merck Biosciences GmbH DDM AppliChem GmbH Desthiobiotin IBA GmbH Dextrose AppliChem GmbH DMSO Sigma Aldrich Chemie GmbH DOC AppliChem GmbH DTT AppliChem GmbH EACA AppliChem GmbH ECL Western Blotting Detection Reagent
GE Healthcare Bio Science
EDTA Sigma Aldrich Chemie GmbH
EGTA Merck Biosciences GmbH Ethanol Merck Eurolab Glycerol AppliChem GmbH
Glycine AppliChem GmbH
HCl Sigma Aldrich Chemie GmbH HRV 3C Protese Novagen
Imidazole AppliChem GmbH
K2HPO4 Sigma Aldrich Chemie GmbH
KH2PO4 Sigma Aldrich Chemie GmbH Leupeptin AppliChem GmbH Methanol Merck Eurolab
Milk Powder AppliChem GmbH Na2HPO4 Sigma Aldrich Chemie GmbH NaCl AppliChem GmbH NaH2PO4 Sigma Aldrich Chemie GmbH NaOH Carl Roth GmbH u. Co. KG
Ni (II)-NTA Agarose Qiagen Pepstatin AppliChem GmbH Peptone AppliChem GmbH PMSF AppliChem GmbH
Ponceau S Sigma Aldrich Chemie GmbH

Appendix 129
Proteinase-K AppliChem GmbH Protogold Plano GmbH Reactive Red 120 Sigma Aldrich Chemie GmbH SDS SERVA Electrophoresis GmbH Sodium Acetate AppliChem GmbH
Sorbitol Sigma Aldrich Chemie GmbH Strep-Tactin Superflow (50 % Suspension) IBA GmbH Sucrose GE Healthcare Bio Science
TCA AppliChem GmbH TEMED Fluka Tris AppliChem GmbH
Tris base AppliChem GmbH
Tryptone AppliChem GmbH Tween-20 Sigma Aldrich Chemie GmbH Yeast Extract AppliChem GmbH Zeocin Invitrogen GmbH β-mercaptoethanol Sigma Aldrich Chemie GmbH
Kits
QuikChange XL Site-Directed Mutagenesis Kit Stratagene
GeneJET Plasmid Miniprep Kit Fermentas Zymoclean™ Gel DNA Recovery Kit Zymoresearch DNA Clean & Concentrator™ Zymoresearch
Devices
10.0 ml Deep Well Plate HJ-Bioanalytik GmbH 96-well microtiter plate Nunc 96-well plate (MicroAmp) Applied Biosystems Agfa Curix 60 Film Processor Agfa autoclave steam sterilizer 3870 EL Jürgens
Avanti 300 Beckman balance Sartorius
BeadBeater TM Model 1107900 BioSpec Products centrifuge 5415 D Eppendorf centrifuge 5804 R Eppendorf cryo tubes Nunc electrophoresis power supply EPS 1000 Amersham Biotech
Electroporation Cuvettes 2.0 mm VWR International elektrophoresis power supply PowerPac 2000 BioRad EmulsiFlex-C5 high pressure emulsifier Avestin

130 Appendix
Fermenter Infors HT Minifors Infors HT
Galss beads 0.45 mm BioSpec Products gloves Roth hyperfilms GE Healthcare incubator IG 150 Astel incubator Revico Ultimo Hettich Kimwipe paper Kimberly-Clark laminar flow hood Flow BSB 6A and BSB 4A Gelaire Mastercycler personal Eppendorf MicroAmpTM Fast Optical 96-well reaction plates Applied Biosystems
MicroAmpTM Optical adhesive films Applied Biosystems
microplate reader MR700 Dynatech Milli Q RO 10 Plus clean water device Millipore
MiniSpin microcentrifuge Eppendorf
mocroplate Eppendorf
Nanodrop 2000 Peqlab needle Fischer nitrocellulose membranes (HybondTM ECL) GE Healthcare Biosciences
petri dish Greiner
pH meter pH 213 Merck
PVDF Western blotting Membranes Roth
reaction tube Eppendorf scalpel Bayha
SDS gel electrophoresis device (minigel 10 x 10 cm) Sigma semi-dry blotting equipment Sigma Sepatech Megafuge 1.0 Heraeus StepOnePlus™ Real-Time PCR System Applied Biosystems
sterile filters Minisart 0.2 μm Sartorius sterilisator UT 6120 Heraeus syringe Henke-Sass/Wolf Tecan GENios microplate reader Tecan Thermomixer comfort Eppendorf Trans-Blot® Electrophoretic Transfer Cell Bio-Rad
TranswellTM filter (3401 and 3402) Costar
ultra centrifuge Optima-L70 with rotor JA-14 Beckman
Ultra Yield Flask, 125 ml Thomson Instrument Company UV-VIS recording spectrophotometer UV-2401PC Shimadzu vortex IKA Labortechnik water bath GFL 1004 GFL Whatman paper No.1 and No.3 Whatman

Appendix 131
6.3 Clone charts
All the vector maps shown here were created by using clone manager 9.0 software.
6.3.1 Modified and Unmodified pPicholi vector
The vector map of the unmodified pPicholi vector from the MoBiTec was as follows.
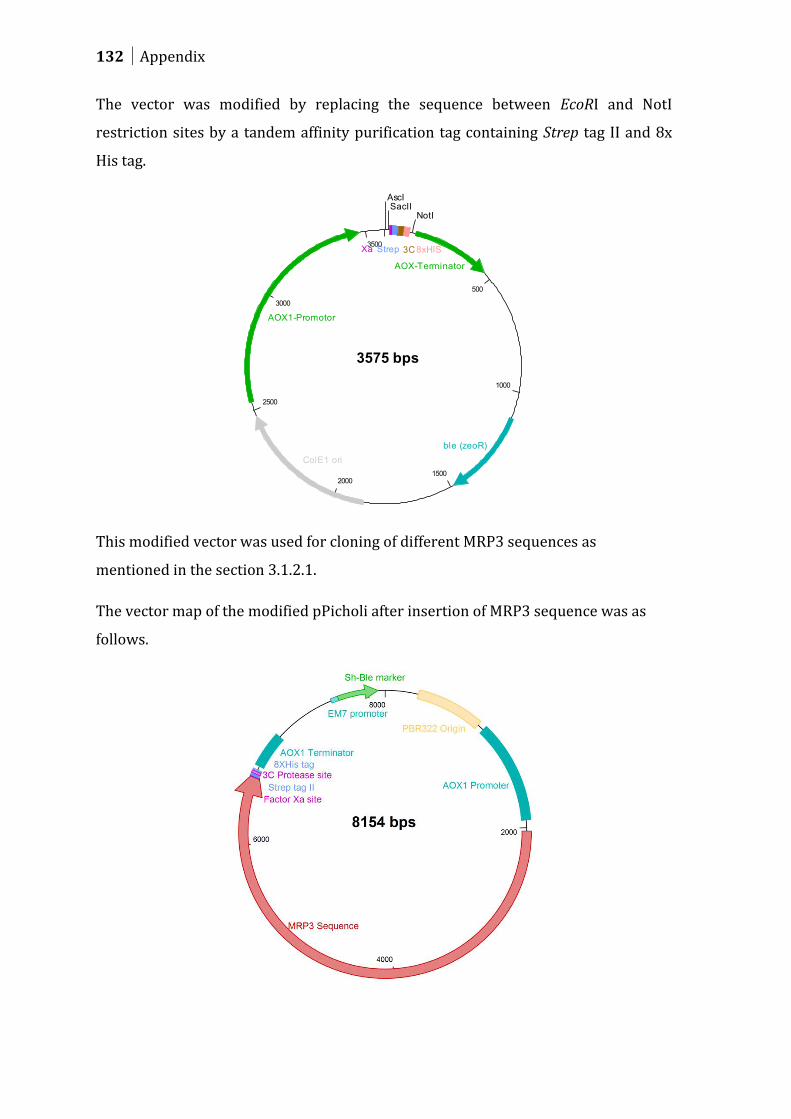
132 Appendix
The vector was modified by replacing the sequence between EcoRI and NotI
restriction sites by a tandem affinity purification tag containing Strep tag II and 8x
His tag.
This modified vector was used for cloning of different MRP3 sequences as
mentioned in the section 3.1.2.1.
The vector map of the modified pPicholi after insertion of MRP3 sequence was as
follows.
3575 bps
500
1000
15002000
2500
3000
3500
AscISacII
NotI
Xa Strep 3C 8xHIS
AOX-Terminator
ble (zeoR)ColE1 ori
AOX1-Promotor

Appendix 133
6.3.2 Map of the pGEM7-MRP3 vector
The pGEM7-MRP3 vector contained cDNA insert encoding hMRP3 sequence. The
cloned vector was kindly provided by Prof. P. Borst (The Netherlands Cancer
Institute, Amsterdam). This vector was transformed into TOP10F’ E.coli and used as
a template for all the preparatory PCR reactions.
7757 bps
1000
2000
3000
4000
5000
6000
7000
AatII
SphI
MRP3 cDNA
lac prom
pBR322 origin
amp marker
f1 originlacZ_a reporter

134 Appendix
6.3.3 Modified and Unmodified pPICZ A vector
The vector map of the unmodified pPICZ A vector from the Invitrogen was as
follows.
The vector was modified by replacing the c-myc epitope sequence by Strep tag II
sequence along with the protease cleavage sites designed for the cloning of MRP3
from the pPicholi-MRP3 vector.
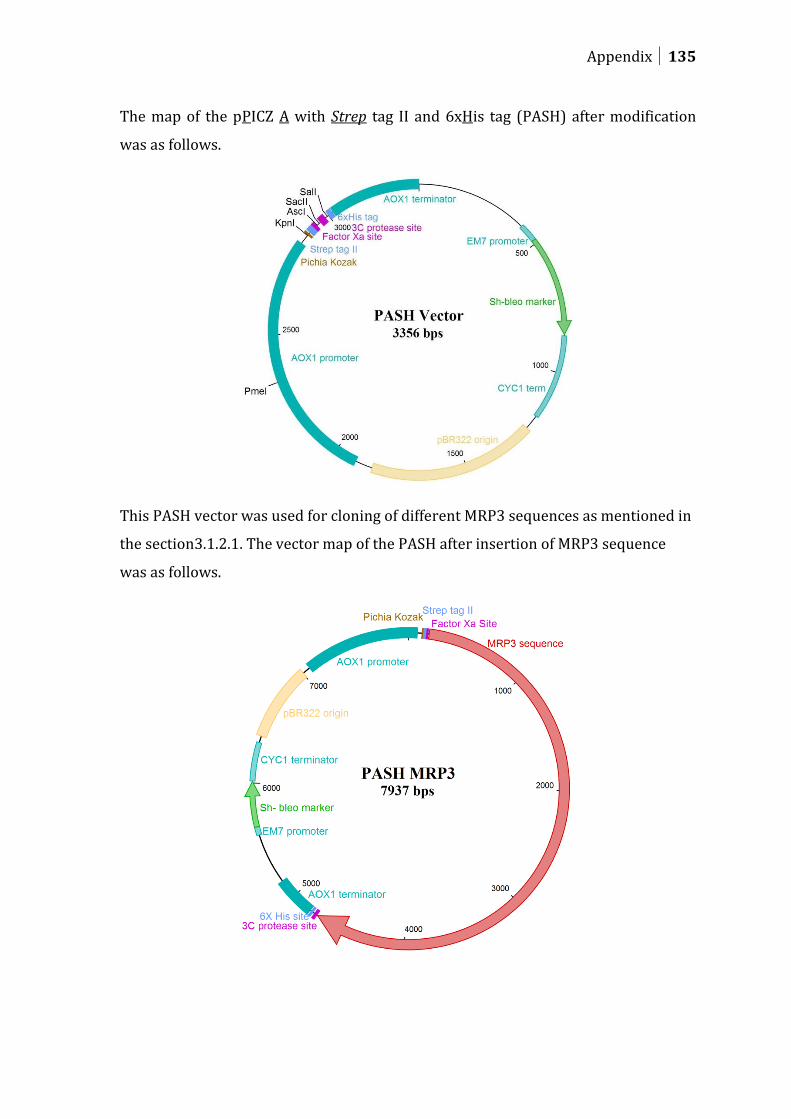
Appendix 135
The map of the pPICZ A with Strep tag II and 6xHis tag (PASH) after modification
was as follows.
This PASH vector was used for cloning of different MRP3 sequences as mentioned in
the section3.1.2.1. The vector map of the PASH after insertion of MRP3 sequence
was as follows.

136 Appendix
6.4 Bacterial and yeast strains used in the project
6.4.1 Escherichia coli
The E. coli strain TOP10F´ was used for all the bacterial transformation and plasmid
isolation experiments.
Top10 cells are modified E. coli K12 strains from Invitrogen used for cloning and
plasmid preparation. They have a high transformation efficiency and have the genes
for recA (a recombinase) and endA (a DNAse that lowers plasmid yeild) knocked
out. The TOP10F´ genotype consists of and additional F´ episome thet carries the
tetracycline resistance gene. The F’ sequence also allows isolation of single-stranded
DNA from vectors that have an f1 origin of replication. In addition, the F´ episome
carries the lacIq repressor for inducible expression from trc, tac, and lac promoters
using IPTG. Therefore, TOP10F´ cells require induction by IPTG for blue/white
colony screening.
Genotype: F lacIqTn10 (TetR) - mcrA (mrr-hsdRMS-mcrBC) 80lacZ M15 lacX74
recA1 ara 139 (ara-leu)7697 galU galK rpsL (StrR) endA1 nupG
6.4.2 Pichia pastoris
X-33 is a wild-type strain of Pichia pastoris used for selection on antibiotic
Zeocin™and large-scale growth. It strain grows normally in both YPD and minimal
media.
KM71 (his4 arg4 aox1Δ:SARG4) is a strain a mutation in the histidinol
dehydrogenase gene (his4) that prevents it from synthesizing histidine in the
argininosuccinate lyase gene (arg4) that prevents the strain from growing in the
absence of arginine. However, the chromosomal AOX1 gene is largely deleted and
replaced with the S. cerevisiae ARG4 gene in this strain which allows the cells to in
grow in the absence of arginine in media. As a result of the disruption of the AOX1
gene this strain relies on the much weaker AOX2 gene for the expression of alcohol
oxidase (AOX) and grows at a slow rate when methanol was used as a sole carbon
source (MutS).

Appendix 137
To create KM71H, KM71 was transformed with a gene fragment encoding the HIS4
gene and the transformants with the ability to grow on a minimal media lacking
Histidine were isolated. This generated the MutS, Arg+ and His+ KM71H strain.

138 Appendix
6.5 Figure captions
Figure 1-1: Molecular architecture of ABC transporters. ...................................................... 5
Figure 1-2: The schematic representation of structure of a typical ABC transporter
predicted using different computer-assisted algorithms. ............................. 6
Figure 1-3: A proposed mechanism of ATP binding and transformation of TMDs from
facing inward to facing outward conformation. ................................................ 8
Figure 1-4: Schematic structure of the “long” ABC transporters from ABCC subfamily.
............................................................................................................................................. 13
Figure 1-5: Subcellular localization and substrate specificities of long (left) and short
(right) MRPs. ................................................................................................................. 15
Figure 1-6: Model of the hypothetical transport cycle of MRP1 for the transport of
LTC4.. ................................................................................................................................. 17
Figure 1-7: Schematic representation of the insertion of the pPICZ plasmid to the
intact AOX1 locus from the P. pastoris genome................................................ 25
Figure 2-1: Schematic representation of MRP3 full transporter and its different
truncated versions proposed for cloning and expression in P. pastoris..
............................................................................................................................................. 28
Figure 3-1: Schematic representation of the expression cassette for ligation of
ABCC3 and its constructs in pPicholi for expression in P. pastoris. ......... 29
Figure 3-2: pGEM7-MRP3 plasmid showing different restriction pattern before and
after deletion of SacII site.. ....................................................................................... 31
Figure 3-3: Screenshot of the sequence alignment done using BioEdit sequence
alignment editor, after the sequencing of the positive clones from SDM
of the SacII site within the MRP3 sequence....................................................... 32
Figure 3-4: Results from a colony PCR performed to select the clones after ligation of
amplified MRP3 fragments into modified pPicholi vector.. ........................ 33
Figure 3-5: Relative size of the plasmids containing different constructs of MRP3. .. 34
Figure 3-6: Western blot analysis of small scale (3 ml) microsomal preparations
from different clones of P. pastoris expressing various constructs of
MRP3.. .............................................................................................................................. 36

Appendix 139
Figure 3-7: Western blot analysis of small scale microsomal preparations from
different clones of P. pastoris expressing various constructs of MRP3
from two independent culturing and induction experiments.................... 37
Figure 3-8: Western blot analysis of protein expression from different clones of
P. pastoris expressing various constructs of MRP3.. ...................................... 38
Figure 3-9: Western blot analysis of protein expression from the sub-clones clone
2D-2 expressing construct 2. .................................................................................. 39
Figure 3-10: Western blot analysis of large scale fermentation of clone 2D-2.5. ........ 39
Figure 3-11: Western blot analysis of small scale microsomal preparations from
three independent culturing and induction experiments with different
clones of P. pastoris.. ................................................................................................... 45
Figure 3-12: Western blot analysis of large scale fermentation of clone 1000-1. ...... 46
Figure 3-13: Silver staining of SDS-PAGE for analysis of the collected samples during
the ultrafiltration.. ....................................................................................................... 47
Figure 3-14: Western blotting of the Strep-tactin purified MRP3 protein sample.. .... 49
Figure 3-15: Coomassie staining of SDS-PAGE analysis of Strep-tactin column
purification of the control protein.. ...................................................................... 50
Figure 3-16: Western blot analysis of the overnight 3C protease cleaved MRP3
protein samples.. .......................................................................................................... 51
Figure 3-17: Western blotting of the 3C protease cleaved MRP3 protein purified on
Strep-tactin spin column. .......................................................................................... 52
Figure 3-18: Western blotting of the denatured MRP3 protein purified on Strep-
tactin spin column.. ..................................................................................................... 53
Figure 3-19: Schematic representation of the expression cassette for ABCC3 and its
truncated versions for expressing in P. pastoris. ............................................. 59
Figure 3-20: Schematic representation of the modification of in the multiple cloning
site (MCS) of the pPICZ A vector.. .......................................................................... 60
Figure 3-21: Western blot analysis of high throughput screening of different clones
of P. pastoris transformed with modified pPICZ A plasmids with MRP3
gene insert. ..................................................................................................................... 62

140 Appendix
Figure 3-22: Western blot analysis of high throughput screening of different clones
of P. pastoris for the expression of full transporter and its various
truncated forms. ........................................................................................................... 63
Figure 3-23: Western blot analysis of large scale fermentation of clone 100-5. .......... 64
Figure 3-24: Western blotting pictures showing Solubilization and purification
MRP3 expressed by P. pastoris clone 100-5 in fermenter culture. ........... 65
Figure 3-25: Western blotting of purification of the Ni-NTA purified MRP3 on Strep-
tactin spin column.. ..................................................................................................... 66
Figure 3-26:Western blotting of the SDS solubilized sample and purification of the
crude cell lysates of P. pastoris clone 100-5 from fermenter culture. ..... 67
Figure 3-27: Western blotting picture showing the detection of MRP3 expressed in
P. pastoris with Strep tag II at N terminal and C terminal positions. ....... 68
Figure 3-28: Western blotting of purification on reactive red column. ........................... 69
Figure 5-1: Structure of Coomassie Brilliant Blue G-250 ................................................... 100
Figure 5-2: The complex formation between the poly-His tag of the protein and the
immobilized a Ni2+ cations on from the Ni-NTA agarose (Block, Maertens
et al. 2009). .................................................................................................................. 118
Figure 5-3: Structure of Reactive Red 120 ............................................................................... 123

Appendix 141
6.6 Sequence of hMRP3 used for cloning and expression
As mentioned in section 3.1.2.2, the cDNA hMRP3 insert after cloning into pPicholi
vector was sequenced to ensure that the protein had no alteration in the amino acid
sequence. The sequence was then transferred into modified pPICZ A vector (section
3.2.2.2.1). The sequence of the gene and the protein after the ligation into pPICZ A
vector in was follows. The other truncated versions also had similar amino acid
sequence.
10 20 30 40 50 60
....|....|....|....|....|....|....|....|....|....|....|....|
MRP3 ATGGCCTCTTGGTCCCATCCACAATTTGAAAAGATTGAAGGTAGACGGCGCGCCATGGAC
M A S W S H P Q F E K I E G R R R A M D
70 80 90 100 110 120
....|....|....|....|....|....|....|....|....|....|....|....|
MRP3 GCCCTGTGCGGTTCCGGGGAGCTCGGCTCCAAGTTCTGGGACTCCAACCTGTCTGTGCAC
A L C G S G E L G S K F W D S N L S V H
130 140 150 160 170 180
....|....|....|....|....|....|....|....|....|....|....|....|
MRP3 ACAGAAAACCCGGACCTCACTCCCTGCTTCCAGAACTCCCTGCTGGCCTGGGTGCCCTGC
T E N P D L T P C F Q N S L L A W V P C
190 200 210 220 230 240
....|....|....|....|....|....|....|....|....|....|....|....|
MRP3 ATCTACCTGTGGGTCGCCCTGCCCTGCTACTTGCTCTACCTGCGGCACCATTGTCGTGGC
I Y L W V A L P C Y L L Y L R H H C R G
250 260 270 280 290 300
....|....|....|....|....|....|....|....|....|....|....|....|
MRP3 TACATCATCCTCTCCCACCTGTCCAAGCTCAAGATGGTCCTGGGTGTCCTGCTGTGGTGC
Y I I L S H L S K L K M V L G V L L W C
310 320 330 340 350 360
....|....|....|....|....|....|....|....|....|....|....|....|
MRP3 GTCTCCTGGGCGGACCTTTTTTACTCCTTCCATGGCCTGGTCCATGGCCGGGCCCCTGCC
V S W A D L F Y S F H G L V H G R A P A
370 380 390 400 410 420
....|....|....|....|....|....|....|....|....|....|....|....|
MRP3 CCTGTTTTCTTTGTCACCCCCTTGGTGGTGGGGGTCACCATGCTGCTGGCCACCCTGCTG
P V F F V T P L V V G V T M L L A T L L
430 440 450 460 470 480
....|....|....|....|....|....|....|....|....|....|....|....|
MRP3 ATACAGTATGAGCGGCTGCAGGGCGTACAGTCTTCGGGGGTCCTCATTATCTTCTGGTTC
I Q Y E R L Q G V Q S S G V L I I F W F
490 500 510 520 530 540
....|....|....|....|....|....|....|....|....|....|....|....|
MRP3 CTGTGTGTGGTCTGCGCCATCGTCCCATTCCGCTCCAAGATCCTTTTAGCCAAGGCAGAG
L C V V C A I V P F R S K I L L A K A E

142 Appendix
550 560 570 580 590 600
....|....|....|....|....|....|....|....|....|....|....|....|
MRP3 GGTGAGATCTCAGACCCCTTCCGCTTCACCACCTTCTACATCCACTTTGCCCTGGTACTC
G E I S D P F R F T T F Y I H F A L V L
610 620 630 640 650 660
....|....|....|....|....|....|....|....|....|....|....|....|
MRP3 TCTGCCCTCATCTTGGCCTGCTTCAGGGAGAAACCTCCATTTTTCTCCGCAAAGAATGTC
S A L I L A C F R E K P P F F S A K N V
670 680 690 700 710 720
....|....|....|....|....|....|....|....|....|....|....|....|
MRP3 GACCCTAACCCCTACCCTGAGACCAGCGCTGGCTTTCTCTCCCGCCTGTTTTTCTGGTGG
D P N P Y P E T S A G F L S R L F F W W
730 740 750 760 770 780
....|....|....|....|....|....|....|....|....|....|....|....|
MRP3 TTCACAAAGATGGCCATCTATGGCTACCGGCATCCCCTGGAGGAGAAGGACCTCTGGTCC
F T K M A I Y G Y R H P L E E K D L W S
790 800 810 820 830 840
....|....|....|....|....|....|....|....|....|....|....|....|
MRP3 CTAAAGGAAGAGGACAGATCCCAGATGGTGGTGCAGCAGCTGCTGGAGGCATGGAGGAAG
L K E E D R S Q M V V Q Q L L E A W R K
850 860 870 880 890 900
....|....|....|....|....|....|....|....|....|....|....|....|
MRP3 CAGGAAAAGCAGACGGCACGACACAAGGCTTCAGCAGCACCTGGGAAAAATGCCTCCGGC
Q E K Q T A R H K A S A A P G K N A S G
910 920 930 940 950 960
....|....|....|....|....|....|....|....|....|....|....|....|
MRP3 GAGGACGAGGTGCTGCTGGGTGCCCGGCCCAGGCCCCGGAAGCCCTCCTTCCTGAAGGCC
E D E V L L G A R P R P R K P S F L K A
970 980 990 1000 1010 1020
....|....|....|....|....|....|....|....|....|....|....|....|
MRP3 CTGCTGGCCACCTTCGGCTCCAGCTTCCTCATCAGTGCCTGCTTCAAGCTTATCCAGGAC
L L A T F G S S F L I S A C F K L I Q D
1030 1040 1050 1060 1070 1080
....|....|....|....|....|....|....|....|....|....|....|....|
MRP3 CTGCTCTCCTTCATCAATCCACAGCTGCTCAGCATCCTGATCAGGTTTATCTCCAACCCC
L L S F I N P Q L L S I L I R F I S N P
1090 1100 1110 1120 1130 1140
....|....|....|....|....|....|....|....|....|....|....|....|
MRP3 ATGGCCCCCTCCTGGTGGGGCTTCCTGGTGGCTGGGCTGATGTTCCTGTGCTCCATGATG
M A P S W W G F L V A G L M F L C S M M
1150 1160 1170 1180 1190 1200
....|....|....|....|....|....|....|....|....|....|....|....|
MRP3 CAGTCGCTGATCTTACAACACTATTACCACTACATCTTTGTGACTGGGGTGAAGTTTCGT
Q S L I L Q H Y Y H Y I F V T G V K F R
1210 1220 1230 1240 1250 1260
....|....|....|....|....|....|....|....|....|....|....|....|
MRP3 ACTGGGATCATGGGTGTCATCTACAGGAAGGCTCTGGTTATCACCAACTCAGTCAAACGT
T G I M G V I Y R K A L V I T N S V K R
1270 1280 1290 1300 1310 1320

Appendix 143
....|....|....|....|....|....|....|....|....|....|....|....|
MRP3 GCGTCCACTGTGGGGGAAATTGTCAACCTCATGTCAGTGGATGCCCAGCGCTTCATGGAC
A S T V G E I V N L M S V D A Q R F M D
1330 1340 1350 1360 1370 1380
....|....|....|....|....|....|....|....|....|....|....|....|
MRP3 CTTGCCCCCTTCCTCAATCTGCTGTGGTCAGCACCCCTGCAGATCATCCTGGCGATCTAC
L A P F L N L L W S A P L Q I I L A I Y
1390 1400 1410 1420 1430 1440
....|....|....|....|....|....|....|....|....|....|....|....|
MRP3 TTCCTCTGGCAGAACCTAGGTCCCTCTGTCCTGGCTGGAGTCGCTTTCATGGTCTTGCTG
F L W Q N L G P S V L A G V A F M V L L
1450 1460 1470 1480 1490 1500
....|....|....|....|....|....|....|....|....|....|....|....|
MRP3 ATTCCACTCAACGGAGCTGTGGCCGTGAAGATGCGCGCCTTCCAGGTAAAGCAAATGAAA
I P L N G A V A V K M R A F Q V K Q M K
1510 1520 1530 1540 1550 1560
....|....|....|....|....|....|....|....|....|....|....|....|
MRP3 TTGAAGGACTCGCGCATCAAGCTGATGAGTGAGATCCTGAACGGCATCAAGGTGCTGAAG
L K D S R I K L M S E I L N G I K V L K
1570 1580 1590 1600 1610 1620
....|....|....|....|....|....|....|....|....|....|....|....|
MRP3 CTGTACGCCTGGGAGCCCAGCTTCCTGAAGCAGGTGGAGGGCATCAGGCAGGGTGAGCTC
L Y A W E P S F L K Q V E G I R Q G E L
1630 1640 1650 1660 1670 1680
....|....|....|....|....|....|....|....|....|....|....|....|
MRP3 CAGCTGCTGCGCACGGCGGCCTACCTCCACACCACAACCACCTTCACCTGGATGTGCAGC
Q L L R T A A Y L H T T T T F T W M C S
1690 1700 1710 1720 1730 1740
....|....|....|....|....|....|....|....|....|....|....|....|
MRP3 CCCTTCCTGGTGACCCTGATCACCCTCTGGGTGTACGTGTACGTGGACCCAAACAATGTG
P F L V T L I T L W V Y V Y V D P N N V
1750 1760 1770 1780 1790 1800
....|....|....|....|....|....|....|....|....|....|....|....|
MRP3 CTGGACGCCGAGAAGGCCTTTGTGTCTGTGTCCTTGTTTAATATCTTAAGACTTCCCCTC
L D A E K A F V S V S L F N I L R L P L
1810 1820 1830 1840 1850 1860
....|....|....|....|....|....|....|....|....|....|....|....|
MRP3 AACATGCTGCCCCAGTTAATCAGCAACCTGACTCAGGCCAGTGTGTCTCTGAAACGGATC
N M L P Q L I S N L T Q A S V S L K R I
1870 1880 1890 1900 1910 1920
....|....|....|....|....|....|....|....|....|....|....|....|
MRP3 CAGCAATTCCTGAGCCAAGAGGAACTTGACCCCCAGAGTGTGGAAAGAAAGACCATCTCC
Q Q F L S Q E E L D P Q S V E R K T I S
1930 1940 1950 1960 1970 1980
....|....|....|....|....|....|....|....|....|....|....|....|
MRP3 CCAGGCTATGCCATCACCATACACAGTGGCACCTTCACCTGGGCCCAGGACCTGCCCCCC
P G Y A I T I H S G T F T W A Q D L P P
1990 2000 2010 2020 2030 2040

144 Appendix
....|....|....|....|....|....|....|....|....|....|....|....|
MRP3 ACTCTGCACAGCCTAGACATCCAGGTCCCGAAAGGGGCACTGGTGGCCGTGGTGGGGCCT
T L H S L D I Q V P K G A L V A V V G P
2050 2060 2070 2080 2090 2100
....|....|....|....|....|....|....|....|....|....|....|....|
MRP3 GTGGGCTGTGGGAAGTCCTCCCTGGTGTCTGCCCTGCTGGGAGAGATGGAGAAGCTAGAA
V G C G K S S L V S A L L G E M E K L E
2110 2120 2130 2140 2150 2160
....|....|....|....|....|....|....|....|....|....|....|....|
MRP3 GGCAAAGTGCACATGAAGGGCTCCGTGGCCTATGTGCCCCAGCAGGCATGGATCCAGAAC
G K V H M K G S V A Y V P Q Q A W I Q N
2170 2180 2190 2200 2210 2220
....|....|....|....|....|....|....|....|....|....|....|....|
MRP3 TGCACTCTTCAGGAAAACGTGCTTTTCGGCAAAGCCCTGAACCCCAAGCGCTACCAGCAG
C T L Q E N V L F G K A L N P K R Y Q Q
2230 2240 2250 2260 2270 2280
....|....|....|....|....|....|....|....|....|....|....|....|
MRP3 ACTCTGGAGGCCTGTGCCTTGCTAGCTGACCTGGAGATGCTGCCTGGTGGGGATCAGACA
T L E A C A L L A D L E M L P G G D Q T
2290 2300 2310 2320 2330 2340
....|....|....|....|....|....|....|....|....|....|....|....|
MRP3 GAGATTGGAGAGAAGGGCATTAACCTGTCTGGGGGCCAGCGGCAGCGGGTCAGTCTGGCT
E I G E K G I N L S G G Q R Q R V S L A
2350 2360 2370 2380 2390 2400
....|....|....|....|....|....|....|....|....|....|....|....|
MRP3 CGAGCTGTTTACAGTGATGCCGATATTTTCTTGCTGGATGACCCACTGTCTGCGGTGGAC
R A V Y S D A D I F L L D D P L S A V D
2410 2420 2430 2440 2450 2460
....|....|....|....|....|....|....|....|....|....|....|....|
MRP3 TCTCATGTGGCCAAGCACATCTTTGACCACGTCATCGGGCCAGAAGGCGTGCTGGCAGGC
S H V A K H I F D H V I G P E G V L A G
2470 2480 2490 2500 2510 2520
....|....|....|....|....|....|....|....|....|....|....|....|
MRP3 AAGACGCGAGTGCTGGTGACGCACGGCATTAGCTTCCTGCCCCAGACAGACTTCATCATT
K T R V L V T H G I S F L P Q T D F I I
2530 2540 2550 2560 2570 2580
....|....|....|....|....|....|....|....|....|....|....|....|
MRP3 GTGCTAGCTGATGGACAGGTGTCTGAGATGGGCCCGTACCCAGCCCTGCTGCAGCGCAAC
V L A D G Q V S E M G P Y P A L L Q R N
2590 2600 2610 2620 2630 2640
....|....|....|....|....|....|....|....|....|....|....|....|
MRP3 GGCTCCTTTGCCAACTTTCTCTGCAACTATGCCCCCGATGAGGACCAAGGGCACCTGGAG
G S F A N F L C N Y A P D E D Q G H L E
2650 2660 2670 2680 2690 2700
....|....|....|....|....|....|....|....|....|....|....|....|
MRP3 GACAGCTGGACCGCGTTGGAAGGTGCAGAGGATAAGGAGGCACTGCTGATTGAAGACACA
D S W T A L E G A E D K E A L L I E D T
2710 2720 2730 2740 2750 2760
....|....|....|....|....|....|....|....|....|....|....|....|

Appendix 145
MRP3 CTCAGCAACCACACGGATCTGACAGACAATGATCCAGTCACCTATGTGGTCCAGAAGCAG
L S N H T D L T D N D P V T Y V V Q K Q
2770 2780 2790 2800 2810 2820
....|....|....|....|....|....|....|....|....|....|....|....|
MRP3 TTTATGAGACAGCTGAGTGCCCTGTCCTCAGATGGGGAGGGACAGGGTCGGCCTGTACCC
F M R Q L S A L S S D G E G Q G R P V P
2830 2840 2850 2860 2870 2880
....|....|....|....|....|....|....|....|....|....|....|....|
MRP3 CGGAGGCACCTGGGTCCATCAGAGAAGGTGCAGGTGACAGAGGCGAAGGCAGATGGGGCA
R R H L G P S E K V Q V T E A K A D G A
2890 2900 2910 2920 2930 2940
....|....|....|....|....|....|....|....|....|....|....|....|
MRP3 CTGACCCAGGAGGAGAAAGCAGCCATTGGCACTGTGGAGCTCAGTGTGTTCTGGGATTAT
L T Q E E K A A I G T V E L S V F W D Y
2950 2960 2970 2980 2990 3000
....|....|....|....|....|....|....|....|....|....|....|....|
MRP3 GCCAAGGCCGTGGGGCTCTGTACCACGCTGGCCATCTGTCTCCTGTATGTGGGTCAAAGT
A K A V G L C T T L A I C L L Y V G Q S
3010 3020 3030 3040 3050 3060
....|....|....|....|....|....|....|....|....|....|....|....|
MRP3 GCGGCTGCCATTGGAGCCAATGTGTGGCTCAGTGCCTGGACAAATGATGCCATGGCAGAC
A A A I G A N V W L S A W T N D A M A D
3070 3080 3090 3100 3110 3120
....|....|....|....|....|....|....|....|....|....|....|....|
MRP3 AGTAGACAGAACAACACTTCCCTGAGGCTGGGCGTCTATGCTGCTTTAGGAATTCTGCAA
S R Q N N T S L R L G V Y A A L G I L Q
3130 3140 3150 3160 3170 3180
....|....|....|....|....|....|....|....|....|....|....|....|
MRP3 GGGTTCTTGGTGATGCTGGCAGCCATGGCCATGGCAGCGGGTGGCATCCAGGCTGCCCGT
G F L V M L A A M A M A A G G I Q A A R
3190 3200 3210 3220 3230 3240
....|....|....|....|....|....|....|....|....|....|....|....|
MRP3 GTGTTGCACCAGGCACTGCTGCACAACAAGATACGCTCGCCACAGTCCTTCTTTGACACC
V L H Q A L L H N K I R S P Q S F F D T
3250 3260 3270 3280 3290 3300
....|....|....|....|....|....|....|....|....|....|....|....|
MRP3 ACACCATCAGGCCGCATCCTGAACTGCTTCTCCAAGGACATCTATGTCGTTGATGAGGTT
T P S G R I L N C F S K D I Y V V D E V
3310 3320 3330 3340 3350 3360
....|....|....|....|....|....|....|....|....|....|....|....|
MRP3 CTGGCCCCTGTCATCCTCATGCTGCTCAATTCCTTCTTCAACGCCATCTCCACTCTTGTG
L A P V I L M L L N S F F N A I S T L V
3370 3380 3390 3400 3410 3420
....|....|....|....|....|....|....|....|....|....|....|....|
MRP3 GTCATCATGGCCAGCACGCCGCTCTTCACTGTGGTCATCCTGCCCCTGGCTGTGCTCTAC
V I M A S T P L F T V V I L P L A V L Y
3430 3440 3450 3460 3470 3480
....|....|....|....|....|....|....|....|....|....|....|....|

146 Appendix
MRP3 ACCTTAGTGCAGCGCTTCTATGCAGCCACATCACGGCAACTGAAGCGGCTGGAATCAGTC
T L V Q R F Y A A T S R Q L K R L E S V
3490 3500 3510 3520 3530 3540
....|....|....|....|....|....|....|....|....|....|....|....|
MRP3 AGCCGCTCACCTATCTACTCCCACTTTTCGGAGACAGTGACTGGTGCCAGTGTCATCCGG
S R S P I Y S H F S E T V T G A S V I R
3550 3560 3570 3580 3590 3600
....|....|....|....|....|....|....|....|....|....|....|....|
MRP3 GCCTACAACCGCAGCCGGGATTTTGAGATCATCAGTGATACTAAGGTGGATGCCAACCAG
A Y N R S R D F E I I S D T K V D A N Q
3610 3620 3630 3640 3650 3660
....|....|....|....|....|....|....|....|....|....|....|....|
MRP3 AGAAGCTGCTACCCCTACATCATCTCCAACCGGTGGCTGAGCATCGGAGTGGAGTTCGTG
R S C Y P Y I I S N R W L S I G V E F V
3670 3680 3690 3700 3710 3720
....|....|....|....|....|....|....|....|....|....|....|....|
MRP3 GGGAACTGCGTGGTGCTCTTTGCTGCACTATTTGCCGTCATCGGGAGGAGCAGCCTGAAC
G N C V V L F A A L F A V I G R S S L N
3730 3740 3750 3760 3770 3780
....|....|....|....|....|....|....|....|....|....|....|....|
MRP3 CCGGGGCTGGTGGGCCTTTCTGTGTCCTACTCCTTGCAGGTGACATTTGCTCTGAACTGG
P G L V G L S V S Y S L Q V T F A L N W
3790 3800 3810 3820 3830 3840
....|....|....|....|....|....|....|....|....|....|....|....|
MRP3 ATGATACGAATGATGTCAGATTTGGAATCTAACATCGTGGCTGTGGAGAGGGTCAAGGAG
M I R M M S D L E S N I V A V E R V K E
3850 3860 3870 3880 3890 3900
....|....|....|....|....|....|....|....|....|....|....|....|
MRP3 TACTCCAAGACAGAGACAGAGGCGCCCTGGGTGGTGGAAGGCAGCCGCCCTCCCGAAGGT
Y S K T E T E A P W V V E G S R P P E G
3910 3920 3930 3940 3950 3960
....|....|....|....|....|....|....|....|....|....|....|....|
MRP3 TGGCCCCCACGTGGGGAGGTGGAGTTCCGGAATTATTCTGTGCGCTACCGGCCGGGCCTA
W P P R G E V E F R N Y S V R Y R P G L
3970 3980 3990 4000 4010 4020
....|....|....|....|....|....|....|....|....|....|....|....|
MRP3 GACCTGGTGCTGAGAGACCTGAGTCTGCATGTGCACGGTGGCGAGAAGGTGGGGATCGTG
D L V L R D L S L H V H G G E K V G I V
4030 4040 4050 4060 4070 4080
....|....|....|....|....|....|....|....|....|....|....|....|
MRP3 GGCCGCACTGGGGCTGGCAAGTCTTCCATGACCCTTTGCCTGTTCCGCATCCTGGAGGCG
G R T G A G K S S M T L C L F R I L E A
4090 4100 4110 4120 4130 4140
....|....|....|....|....|....|....|....|....|....|....|....|
MRP3 GCAAAGGGTGAAATCCGCATTGATGGCCTCAATGTGGCAGACATCGGCCTCCATGACCTG
A K G E I R I D G L N V A D I G L H D L
4150 4160 4170 4180 4190 4200
....|....|....|....|....|....|....|....|....|....|....|....|
MRP3 CGCTCTCAGCTGACCATCATCCCGCAGGACCCCATCCTGTTCTCGGGGACCCTGCGCATG

Appendix 147
R S Q L T I I P Q D P I L F S G T L R M
4210 4220 4230 4240 4250 4260
....|....|....|....|....|....|....|....|....|....|....|....|
MRP3 AACCTGGACCCCTTCGGCAGCTACTCAGAGGAGGACATTTGGTGGGCTTTGGAGCTGTCC
N L D P F G S Y S E E D I W W A L E L S
4270 4280 4290 4300 4310 4320
....|....|....|....|....|....|....|....|....|....|....|....|
MRP3 CACCTGCACACGTTTGTGAGCTCCCAGCCGGCAGGCCTGGACTTCCAGTGCTCAGAGGGC
H L H T F V S S Q P A G L D F Q C S E G
4330 4340 4350 4360 4370 4380
....|....|....|....|....|....|....|....|....|....|....|....|
MRP3 GGGGAGAATCTCAGCGTGGGCCAGAGGCAGCTCGTGTGCCTGGCCCGAGCCCTGCTCCGC
G E N L S V G Q R Q L V C L A R A L L R
4390 4400 4410 4420 4430 4440
....|....|....|....|....|....|....|....|....|....|....|....|
MRP3 AAGAGCCGCATCCTGGTTTTAGACGAGGCCACAGCTGCCATCGACCTGGAGACTGACAAC
K S R I L V L D E A T A A I D L E T D N
4450 4460 4470 4480 4490 4500
....|....|....|....|....|....|....|....|....|....|....|....|
MRP3 CTCATCCAGGCTACCATCCGCACCCAGTTTGATACCTGCACTGTCCTGACCATCGCACAC
L I Q A T I R T Q F D T C T V L T I A H
4510 4520 4530 4540 4550 4560
....|....|....|....|....|....|....|....|....|....|....|....|
MRP3 CGGCTTAACACTATCATGGACTACACCAGGGTCCTGGTCCTGGACAAAGGAGTAGTAGCT
R L N T I M D Y T R V L V L D K G V V A
4570 4580 4590 4600 4610 4620
....|....|....|....|....|....|....|....|....|....|....|....|
MRP3 GAATTTGATTCTCCAGCCAACCTCATTGCAGCTAGAGGCATCTTCTACGGGATGGCCAGA
E F D S P A N L I A A R G I F Y G M A R
4630 4640 4650 4660 4670 4680
....|....|....|....|....|....|....|....|....|....|....|....|
MRP3 GATGCTGGACTTGCCTCTCCGCGGTTGGAAGTTCTGTTTCAAGGTCCAAATAGCGCCGTC
D A G L A S P R L E V L F Q G P N S A V
4690 4700
....|....|....|....|....
MRP3 GACCATCATCATCATCATCATTGA
D H H H H H H *

148 Appendix
6.7 Primer sequences
All the primers used in this project were ordered either from Eurofin MWG Biotech
or from Biolegio. The sequences of all primers are listed in 5'-3' orientation. For the
primers containing non complementary sequences, the melting and annealing
temperature for each primer pair used was found out experimentally by gradient
PCR.
Following are the abbreviations used for the designation of primers.
Tm melting temperature
TA melting temperature For Forward primer Rev Reverse primer
Primers used for the generation of different constructs of MRP3
MRP3 For AGTCTGGCGCGCCATGGACGCCCTGTG (27)
MRP3_D203 For AGTCTGGCGCGCCATGGCCTGCTTCAGGGAGAAACCT (37)
MRP3_Q250 For GTCTGGCGCGCCATGCATCCCCTGGAGGAGAAGGAC (37)
MRP3_S281 For AGTCTGGCGCGCCATGGAGGACGAGGTGCTGCTG (34)
MRP3_M904 Rev ACAGTCCGCGGCATAAACTGCTTCTGGACCAC (32)
MRP3_R905 For AGTCTGGCGCGCCATGAGACAGCTGAGTGCCCTGT (35)
MRP3 Rev ACAGTCCGCGGGAGGCAAGTCCAGCATCTCTG (32)
GGCGCGCC AscI restriction site at 5' end of the amplified sequence CCGCGG SacII restriction site at 3' end of the amplified sequence
Primers used for the site directed mutagenesis in the purification tag Tm (°C)
117_sense GAAAAGTTGGAAGTTCTGTTTCAAGGTCCACATCATCATCA (41) 69.4
117_antis TGATGATGATGTGGACCTTGAAACAGAACTTCCAACTTTTC (41) 69.4

Appendix 149
Primers used for the site directed mutagenesis in the SacII site Tm (°C)
MRP3_Mut_Sac_For GATGACCCACTGTCTGCGGTGGACTCTCA (29) 70.9
MRP3_Mut_Sac_For
TGAGAGTCCACCGCAGACAGTGGGTCATC (29) 70.9
Primers used for colony PCRs
AOX1 5' For GACTGGTTCCAATTGACAAGC
AOX1 3' Rev GCAAATGGCATTCTGACATCC
Strep tag II For CCTGGTCCCATCCACAATTTGAAAAG

150 References
7 References
Adachi, Y., H. Suzuki, et al. (2005). "Role of breast cancer resistance protein (Bcrp1/Abcg2) in the extrusion of glucuronide and sulfate conjugates from enterocytes to intestinal lumen." Mol Pharmacol 67(3): 923-928.
Ambudkar, S. V., I. H. Lelong, et al. (1998). "Purification and reconstitution of human P-glycoprotein." Methods Enzymol 292: 492-504.
Ames, G. F. (1986). "Bacterial periplasmic transport systems: structure, mechanism, and evolution." Annu Rev Biochem 55: 397-425.
Ayuso, C. and J. M. Millan (2010). "Retinitis pigmentosa and allied conditions today: a paradigm of translational research." Genome Med 2(5): 34.
Babenko, A. P. and J. Bryan (2003). "Sur domains that associate with and gate KATP pores define a novel gatekeeper." J Biol Chem 278(43): 41577-41580.
Bakos, E., R. Evers, et al. (1998). "Functional multidrug resistance protein (MRP1) lacking the N-terminal transmembrane domain." J Biol Chem 273(48): 32167-32175.
Balamurugan, V. (2006). "Pichia pastoris: A notable heterologous expression system for the production of
foreign proteins—Vaccines." Indian Journal of Biotechnology Vol 6(April 2007,). Baneyx, F. (1999). "Recombinant protein expression in Escherichia coli." Curr Opin
Biotechnol 10(5): 411-421. Baneyx, F. and M. Mujacic (2004). "Recombinant protein folding and misfolding in
Escherichia coli." Nat Biotechnol 22(11): 1399-1408. Beaudet, L. and P. Gros (1995). "Functional dissection of P-glycoprotein nucleotide-
binding domains in chimeric and mutant proteins. Modulation of drug resistance profiles." J Biol Chem 270(29): 17159-17170.
Belinsky, M. G., P. A. Dawson, et al. (2005). "Analysis of the in vivo functions of Mrp3." Mol Pharmacol 68(1): 160-168.
Biemans-Oldehinkel, E., M. K. Doeven, et al. (2006). "ABC transporter architecture and regulatory roles of accessory domains." FEBS Lett 580(4): 1023-1035.
Block, H., B. Maertens, et al. (2009). "Immobilized-metal affinity chromatography (IMAC): a review." Methods Enzymol 463: 439-473.
Boettner, M., B. Prinz, et al. (2002). "High-throughput screening for expression of heterologous proteins in the yeast Pichia pastoris." J Biotechnol 99(1): 51-62.
Bora, N. (2012). "Large-scale production of secreted proteins in Pichia pastoris." Methods Mol Biol 866: 217-235.
Borst, P. and R. O. Elferink (2002). "Mammalian ABC transporters in health and disease." Annu Rev Biochem 71: 537-592.
Bradford, M. M. (1976). "A rapid and sensitive method for the quantitation of microgram quantities of protein utilizing the principle of protein-dye binding." Anal Biochem 72: 248-254.
Brondyk, W. H. (2009). "Selecting an appropriate method for expressing a recombinant protein." Methods Enzymol 463: 131-147.
Brooks, C. L., M. Morrison, et al. (2013). "Rapid expression screening of eukaryotic membrane proteins in Pichia pastoris." Protein Sci.

References 151
Brown, B. S. (1996). Biological Membranes, Oxford Road, Manchester M13 9PT, U.K. Brown, R. E., K. L. Jarvis, et al. (1989). "Protein measurement using bicinchoninic
acid: elimination of interfering substances." Anal Biochem 180(1): 136-139. Bruce Alberts, A. J., Julian Lewis, Martin Raff, Keith Roberts, and Peter Walter (2002).
Molecular Biology of the Cell
Buckholz, R. G. and M. A. Gleeson (1991). "Yeast systems for the commercial production of heterologous proteins." Biotechnology (N Y) 9(11): 1067-1072.
Cereghino, J. L. and J. M. Cregg (2000). "Heterologous protein expression in the methylotrophic yeast Pichia pastoris." FEMS Microbiol Rev 24(1): 45-66.
Chan, K. W., H. Zhang, et al. (2003). "N-terminal transmembrane domain of the SUR controls trafficking and gating of Kir6 channel subunits." EMBO J 22(15): 3833-3843.
Chen, C. J., J. E. Chin, et al. (1986). "Internal duplication and homology with bacterial transport proteins in the mdr1 (P-glycoprotein) gene from multidrug-resistant human cells." Cell 47(3): 381-389.
Chloupkova, M., A. Pickert, et al. (2007). "Expression of 25 human ABC transporters in the yeast Pichia pastoris and characterization of the purified ABCC3 ATPase activity." Biochemistry 46(27): 7992-8003.
Choi, B. K., P. Bobrowicz, et al. (2003). "Use of combinatorial genetic libraries to humanize N-linked glycosylation in the yeast Pichia pastoris." Proc Natl Acad Sci U S A 100(9): 5022-5027.
Clare, J. J., F. B. Rayment, et al. (1991). "High-level expression of tetanus toxin fragment C in Pichia pastoris strains containing multiple tandem integrations of the gene." Biotechnology (N Y) 9(5): 455-460.
Cole, S. P., G. Bhardwaj, et al. (1992). "Overexpression of a transporter gene in a multidrug-resistant human lung cancer cell line." Science 258(5088): 1650-1654.
Colin Ratledge, B. r. K. (2006). Basic Technology. Cregg, J. M., K. J. Barringer, et al. (1985). "Pichia pastoris as a host system for
transformations." Mol Cell Biol 5(12): 3376-3385. Cregg, J. M., J. L. Cereghino, et al. (2000). "Recombinant protein expression in
Pichia pastoris." Mol Biotechnol 16(1): 23-52. Cregg, J. M., K. R. Madden, et al. (1989). "Functional characterization of the two
alcohol oxidase genes from the yeast Pichia pastoris." Mol Cell Biol 9(3): 1316-1323.
Cregg, J. M., I. Tolstorukov, et al. (2009). "Expression in the yeast Pichia pastoris." Methods Enzymol 463: 169-189.
David L. Nelson, M. M. C. (2008). "Lehninger Principles of Biochemistry." De Giuseppe, A., K. Forti, et al. (2010). "Purification by Strep-Tactin affinity
chromatography of a delete envelope gp51 protein of Bovine Leukaemia virus expressed in Sf21 insect cells." Protein J 29(3): 153-160.
Dean, M. (2009). "ABC transporters, drug resistance, and cancer stem cells." J Mammary Gland Biol Neoplasia 14(1): 3-9.
Dean, M., Y. Hamon, et al. (2001). "The human ATP-binding cassette (ABC) transporter superfamily." J Lipid Res 42(7): 1007-1017.
Dean, M., A. Rzhetsky, et al. (2001). "The human ATP-binding cassette (ABC) transporter superfamily." Genome Res 11(7): 1156-1166.

152 References
Deeley, R. G. and S. P. Cole (1997). "Function, evolution and structure of multidrug resistance protein (MRP)." Semin Cancer Biol 8(3): 193-204.
Deeley, R. G., C. Westlake, et al. (2006). "Transmembrane transport of endo- and xenobiotics by mammalian ATP-binding cassette multidrug resistance proteins." Physiol Rev 86(3): 849-899.
Donner, M. G. and D. Keppler (2001). "Up-regulation of basolateral multidrug resistance protein 3 (Mrp3) in cholestatic rat liver." Hepatology 34(2): 351-359.
Doyle, D. A., J. Morais Cabral, et al. (1998). "The structure of the potassium channel: molecular basis of K+ conduction and selectivity." Science 280(5360): 69-77.
Duret, S., A. Andre, et al. (2005). "Specific gene targeting in Spiroplasma citri: improved vectors and production of unmarked mutations using site-specific recombination." Microbiology 151(Pt 8): 2793-2803.
Eisenblatter, T., S. Huwel, et al. (2003). "Characterisation of the brain multidrug resistance protein (BMDP/ABCG2/BCRP) expressed at the blood-brain barrier." Brain Res 971(2): 221-231.
Evans, I. H. (1996). Yeast Protocols: Methods in Cell and Molecular Biology. Fernandez, S. B., Z. Hollo, et al. (2002). "Role of the N-terminal transmembrane
region of the multidrug resistance protein MRP2 in routing to the apical membrane in MDCKII cells." J Biol Chem 277(34): 31048-31055.
Gao, M., H. R. Cui, et al. (2000). "Comparison of the functional characteristics of the nucleotide binding domains of multidrug resistance protein 1." J Biol Chem 275(17): 13098-13108.
Gao, M., M. Yamazaki, et al. (1998). "Multidrug resistance protein. Identification of regions required for active transport of leukotriene C4." J Biol Chem 273(17): 10733-10740.
Gasser, B., M. Saloheimo, et al. (2008). "Protein folding and conformational stress in microbial cells producing recombinant proteins: a host comparative overview." Microb Cell Fact 7: 11.
Geisse, S., H. Gram, et al. (1996). "Eukaryotic expression systems: a comparison." Protein Expr Purif 8(3): 271-282.
Gellissen, G. (2006). Production of Recombinant Proteins. Glavinas, H., D. Mehn, et al. (2008). "Utilization of membrane vesicle preparations to
study drug-ABC transporter interactions." Expert Opin Drug Metab Toxicol 4(6): 721-732.
Gopal, T. V., T. Polte, et al. (1989). "A mouse hybrid cell line that supports gene expression from a variety of promoters in amplifiable vectors." In Vitro Cell Dev Biol 25(12): 1147-1154.
Gulati, S. (2011). Characterizing the Interaction of the ATP Binding Cassette Transporters
(G subfamily) with the Intracellular Protein Lipid Environment. PhD, Columbia University.
Hartner, F. S., C. Ruth, et al. (2008). "Promoter library designed for fine-tuned gene expression in Pichia pastoris." Nucleic Acids Res 36(12): e76.
Heppel, L. A. (1969). "The effect of osmotic shock on release of bacterial proteins and on active transport." J Gen Physiol 54(1): 95-113.
Higashikuni, Y., J. Sainz, et al. (2012). "The ATP-binding cassette transporter ABCG2 protects against pressure overload-induced cardiac hypertrophy and heart
References 153
failure by promoting angiogenesis and antioxidant response." Arterioscler Thromb Vasc Biol 32(3): 654-661.
Higgins, C. F. (1992). "ABC transporters: from microorganisms to man." Annu Rev Cell Biol 8: 67-113.
Higgins, C. F. and K. J. Linton (2004). "The ATP switch model for ABC transporters." Nat Struct Mol Biol 11(10): 918-926.
Higgins, D. R. (2001). "Overview of protein expression in Pichia pastoris." Curr Protoc Protein Sci Chapter 5: Unit5 7.
Hitchman, R. B., E. Locanto, et al. (2011). "Optimizing the baculovirus expression vector system." Methods 55(1): 52-57.
Hitchman, R. B., R. D. Possee, et al. (2009). "Baculovirus expression systems for recombinant protein production in insect cells." Recent Pat Biotechnol 3(1): 46-54.
Hoen, P. A., M. Hirsch, et al. (2011). "mRNA degradation controls differentiation state-dependent differences in transcript and splice variant abundance." Nucleic Acids Res 39(2): 556-566.
Hrycyna, C. A., M. Ramachandra, et al. (1999). "Both ATP sites of human P-glycoprotein are essential but not symmetric." Biochemistry 38(42): 13887-13899.
IBA, L. s. (2011). Specifications of Strep-Tactin® resins. Invitrogen (2010). EasySelect™ Pichia Expression Kit Ito, K., K. E. Weigl, et al. (2003). "Mutation of proline residues in the NH(2)-terminal
region of the multidrug resistance protein, MRP1 (ABCC1): effects on protein expression, membrane localization, and transport function." Biochim Biophys Acta 1615(1-2): 103-114.
Jacobs, P. P. and N. Callewaert (2009). "N-glycosylation engineering of biopharmaceutical expression systems." Curr Mol Med 9(7): 774-800.
Jacobs, P. P., S. Geysens, et al. (2009). "Engineering complex-type N-glycosylation in Pichia pastoris using GlycoSwitch technology." Nat Protoc 4(1): 58-70.
Jeremy M Berg, J. L. T., and Lubert Stryer ( 2002). Biochemistry. Jiang, H., K. Chen, et al. (2009). "Association of pregnane X receptor with multidrug
resistance-related protein 3 and its role in human colon cancer chemoresistance." J Gastrointest Surg 13(10): 1831-1838.
Jones, P. M. and A. M. George (2004). "The ABC transporter structure and mechanism: perspectives on recent research." Cell Mol Life Sci 61(6): 682-699.
Jones, P. M. and A. M. George (2012). "Mechanism of the ABC transporter ATPase domains: catalytic models and the biochemical and biophysical record." Crit Rev Biochem Mol Biol.
Kapoor, R. R., S. E. Flanagan, et al. (2011). "Hyperinsulinaemic hypoglycaemia and diabetes mellitus due to dominant ABCC8/KCNJ11 mutations." Diabetologia 54(10): 2575-2583.
Kavathas, P. and L. A. Herzenberg (1983). "Stable transformation of mouse L cells for human membrane T-cell differentiation antigens, HLA and beta 2-microglobulin: selection by fluorescence-activated cell sorting." Proc Natl Acad Sci U S A 80(2): 524-528.
Kessler, R. J. and D. D. Fanestil (1986). "Interference by lipids in the determination of protein using bicinchoninic acid." Anal Biochem 159(1): 138-142.

154 References
Khlistunova, I., J. Biernat, et al. (2006). "Inducible expression of Tau repeat domain in cell models of tauopathy: aggregation is toxic to cells but can be reversed by inhibitor drugs." J Biol Chem 281(2): 1205-1214.
Kim, J. Y., Y. G. Kim, et al. (2012). "CHO cells in biotechnology for production of recombinant proteins: current state and further potential." Appl Microbiol Biotechnol 93(3): 917-930.
Koenekoop, R. K. (2003). "The gene for Stargardt disease, ABCA4, is a major retinal gene: a mini-review." Ophthalmic Genet 24(2): 75-80.
Konig, J., M. Hartel, et al. (2005). "Expression and localization of human multidrug resistance protein (ABCC) family members in pancreatic carcinoma." Int J Cancer 115(3): 359-367.
Kool, M., M. van der Linden, et al. (1999). "MRP3, an organic anion transporter able to transport anti-cancer drugs." Proc Natl Acad Sci U S A 96(12): 6914-6919.
Le Saux, O., Z. Urban, et al. (2000). "Mutations in a gene encoding an ABC transporter cause pseudoxanthoma elasticum." Nat Genet 25(2): 223-227.
Leslie, E. M., I. J. Letourneau, et al. (2003). "Functional and structural consequences of cysteine substitutions in the NH2 proximal region of the human multidrug resistance protein 1 (MRP1/ABCC1)." Biochemistry 42(18): 5214-5224.
Li, H., N. Sethuraman, et al. (2006). "Optimization of humanized IgGs in glycoengineered Pichia pastoris." Nat Biotechnol 24(2): 210-215.
Li, Y. (2010). "Commonly used tag combinations for tandem affinity purification." Biotechnol Appl Biochem 55(2): 73-83.
Ling, L. Y., I. Ithoi, et al. (2010). "Optimization for high-level expression in Pichia pastoris and purification of truncated and full length recombinant SAG2 of Toxoplasma gondii for diagnostic use." Southeast Asian J Trop Med Public Health 41(3): 507-513.
Locher, K. P. (2009). "Review. Structure and mechanism of ATP-binding cassette transporters." Philos Trans R Soc Lond B Biol Sci 364(1514): 239-245.
Makrides, S. C. (1996). "Strategies for achieving high-level expression of genes in Escherichia coli." Microbiol Rev 60(3): 512-538.
Mayson, B. E., D. G. Kilburn, et al. (2003). "Effects of methanol concentration on expression levels of recombinant protein in fed-batch cultures of Pichia methanolica." Biotechnol Bioeng 81(3): 291-298.
Mitchell, P. and D. Tollervey (2000). "mRNA stability in eukaryotes." Curr Opin Genet Dev 10(2): 193-198.
MoBiTec (2003). pPICHOLI Shuttle Vector System Product Information and Instructions
Moody, J. E., L. Millen, et al. (2002). "Cooperative, ATP-dependent association of the nucleotide binding cassettes during the catalytic cycle of ATP-binding cassette transporters." J Biol Chem 277(24): 21111-21114.
Mus-Veteau, I. (2002). "Heterologous expression and purification systems for structural proteomics of mammalian membrane proteins." Comp Funct Genomics 3(6): 511-517.
Needham, M., M. Egerton, et al. (1995). "Further development of the locus control region/murine erythroleukemia expression system: high level expression and characterization of recombinant human calcitonin receptor." Protein Expr Purif 6(2): 124-131.

References 155
Needham, M., C. Gooding, et al. (1992). "LCR/MEL: a versatile system for high-level expression of heterologous proteins in erythroid cells." Nucleic Acids Res 20(5): 997-1003.
Obiezu, C. V., A. Soosaipillai, et al. (2002). "Detection of human kallikrein 4 in healthy and cancerous prostatic tissues by immunofluorometry and immunohistochemistry." Clin Chem 48(8): 1232-1240.
Oram, J. F. and R. M. Lawn (2001). "ABCA1. The gatekeeper for eliminating excess tissue cholesterol." J Lipid Res 42(8): 1173-1179.
Ota, M., Y. Katsuyama, et al. (2007). "Two critical genes (HLA-DRB1 and ABCF1)in the HLA region are associated with the susceptibility to autoimmune pancreatitis." Immunogenetics 59(1): 45-52.
Otonkoski, T., C. Ammala, et al. (1999). "A point mutation inactivating the sulfonylurea receptor causes the severe form of persistent hyperinsulinemic hypoglycemia of infancy in Finland." Diabetes 48(2): 408-415.
Parcej, D. N. (2012). Goethe University, Frankfurt. Parcej, D. N. and L. Eckhardt-Strelau (2003). "Structural characterisation of neuronal
voltage-sensitive K+ channels heterologously expressed in Pichia pastoris." J Mol Biol 333(1): 103-116.
Paulina Balbás, A. L. ( 2004). Recombinant Gene Expression. Payen, L. F., M. Gao, et al. (2003). "Role of carboxylate residues adjacent to the
conserved core Walker B motifs in the catalytic cycle of multidrug resistance protein 1 (ABCC1)." J Biol Chem 278(40): 38537-38547.
Petschnigg, J., O. W. Moe, et al. (2011). "Using yeast as a model to study membrane proteins." Curr Opin Nephrol Hypertens 20(4): 425-432.
Pisarev, A. V., M. A. Skabkin, et al. (2010). "The role of ABCE1 in eukaryotic posttermination ribosomal recycling." Mol Cell 37(2): 196-210.
Possee, R. D., C. J. Thomas, et al. (1999). "The use of baculovirus vectors for the production of membrane proteins in insect cells." Biochem Soc Trans 27(6): 928-932.
Rees, D. C., E. Johnson, et al. (2009). "ABC transporters: the power to change." Nat Rev Mol Cell Biol 10(3): 218-227.
Reginald H. Garrett, C. M. G. (2010). Biochemistry. Ren, Y., Y. Li, et al. (2012). "Role of the ABCE1 gene in human lung adenocarcinoma."
Oncol Rep 27(4): 965-970. Romanos, M. A., A. J. Makoff, et al. (1991). "Expression of tetanus toxin fragment C in
yeast: gene synthesis is required to eliminate fortuitous polyadenylation sites in AT-rich DNA." Nucleic Acids Res 19(7): 1461-1467.
Romanos, M. A., C. A. Scorer, et al. (1992). "Foreign gene expression in yeast: a review." Yeast 8(6): 423-488.
Ryan, C. M., P. Souda, et al. (2010). "Post-translational modifications of integral membrane proteins resolved by top-down Fourier transform mass spectrometry with collisionally activated dissociation." Mol Cell Proteomics 9(5): 791-803.
San Filippo, J., P. Sung, et al. (2008). "Mechanism of eukaryotic homologous recombination." Annu Rev Biochem 77: 229-257.
Sandy B. Primrose, R. T. (2009). Principles of Gene Manipulation and Genomics.

156 References
Schmidt, T. G., J. Koepke, et al. (1996). "Molecular interaction between the Strep-tag affinity peptide and its cognate target, Streptavidin." J Mol Biol 255(5): 753-766.
Schmitt, L. and R. Tampe (2002). "Structure and mechanism of ABC transporters." Curr Opin Struct Biol 12(6): 754-760.
Seddon, A. M., P. Curnow, et al. (2004). "Membrane proteins, lipids and detergents: not just a soap opera." Biochim Biophys Acta 1666(1-2): 105-117.
Seelheim, P., A. Wullner, et al. (2013). "Substrate translocation and stimulated ATP hydrolysis of human ABC transporter MRP3 show positive cooperativity and are half-coupled." Biophys Chem 171: 31-37.
Sharom, F. J. (2008). "ABC multidrug transporters: structure, function and role in chemoresistance." Pharmacogenomics 9(1): 105-127.
Shelton, P. A., N. W. Davies, et al. (1993). "Regulated expression of K+ channel genes in electrically silent mammalian cells by linkage to beta-globin gene-activation elements." Receptors Channels 1(1): 25-37.
Shim, J. and M. Karin (2002). "The control of mRNA stability in response to extracellular stimuli." Mol Cells 14(3): 323-331.
Sievert, M. K., D. S. Thiriot, et al. (1998). "High-efficiency expression and characterization of the synaptic-vesicle monoamine transporter from baculovirus-infected insect cells." Biochem J 330 ( Pt 2): 959-966.
Sinclair, A. M. and S. Elliott (2005). "Glycoengineering: the effect of glycosylation on the properties of therapeutic proteins." J Pharm Sci 94(8): 1626-1635.
Singer, S. J. and G. L. Nicolson (1972). "The fluid mosaic model of the structure of cell membranes." Science 175(4023): 720-731.
Smith, P. C., N. Karpowich, et al. (2002). "ATP binding to the motor domain from an ABC transporter drives formation of a nucleotide sandwich dimer." Mol Cell 10(1): 139-149.
Smith, P. K., R. I. Krohn, et al. (1985). "Measurement of protein using bicinchoninic acid." Anal Biochem 150(1): 76-85.
Sola, R. J. and K. Griebenow (2009). "Effects of glycosylation on the stability of protein pharmaceuticals." J Pharm Sci 98(4): 1223-1245.
Sorensen, H. P. and K. K. Mortensen (2005). "Advanced genetic strategies for recombinant protein expression in Escherichia coli." J Biotechnol 115(2): 113-128.
Spruth, B. (2011 ). Purifikation, Rekonstitution und Funktionsanalyse
des heterolog exprimierten humanen
ABCC3-Transporters. Diplomarbeit, University of Muenster. Sreekrishna, K. (2010). "Pichia, optimization of protein expression." Stearns, T., H. Ma, et al. (1990). "Manipulating yeast genome using plasmid vectors."
Methods Enzymol 185: 280-297. Tame, J. R., G. N. Murshudov, et al. (1994). "The structural basis of sequence-
independent peptide binding by OppA protein." Science 264(5165): 1578-1581.
Tanaka, A. R., K. Tanabe, et al. (2002). "ATP binding/hydrolysis by and phosphorylation of peroxisomal ATP-binding cassette proteins PMP70 (ABCD3) and adrenoleukodystrophy protein (ABCD1)." J Biol Chem 277(42): 40142-40147.

References 157
Thomas, P. and T. G. Smart (2005). "HEK293 cell line: a vehicle for the expression of recombinant proteins." J Pharmacol Toxicol Methods 51(3): 187-200.
Tschopp, J. F., P. F. Brust, et al. (1987). "Expression of the lacZ gene from two methanol-regulated promoters in Pichia pastoris." Nucleic Acids Res 15(9): 3859-3876.
Urbatsch, I. L., M. K. al-Shawi, et al. (1994). "Characterization of the ATPase activity of purified Chinese hamster P-glycoprotein." Biochemistry 33(23): 7069-7076.
van Veen, H. W., R. Callaghan, et al. (1998). "A bacterial antibiotic-resistance gene that complements the human multidrug-resistance P-glycoprotein gene." Nature 391(6664): 291-295.
Vasiliou, V., K. Vasiliou, et al. (2009). "Human ATP-binding cassette (ABC) transporter family." Hum Genomics 3(3): 281-290.
Verdon, G., S. V. Albers, et al. (2003). "Formation of the productive ATP-Mg2+-bound dimer of GlcV, an ABC-ATPase from Sulfolobus solfataricus." J Mol Biol 334(2): 255-267.
Vlaming, M. L., Z. Pala, et al. (2008). "Impact of Abcc2 (Mrp2) and Abcc3 (Mrp3) on the in vivo elimination of methotrexate and its main toxic metabolite 7-hydroxymethotrexate." Clin Cancer Res 14(24): 8152-8160.
Volkmann, D. G. (2011). Wan, L., H. Cai, et al. (2008). "High-level expression of a functional humanized single-
chain variable fragment antibody against CD25 in Pichia pastoris." Appl Microbiol Biotechnol 81(1): 33-41.
Wetterholm, A., D. Martinez Molina, et al. (2008). "High-level expression, purification, and crystallization of recombinant rat leukotriene C(4) synthase from the yeast Pichia pastoris." Protein Expr Purif 60(1): 1-6.
Wirth, M., J. Bode, et al. (1988). "Isolation of overproducing recombinant mammalian cell lines by a fast and simple selection procedure." Gene 73(2): 419-426.
Wittgen, H. G., J. J. van den Heuvel, et al. (2011). "Cannabinoid type 1 receptor antagonists modulate transport activity of multidrug resistance-associated proteins MRP1, MRP2, MRP3, and MRP4." Drug Metab Dispos 39(7): 1294-1302.
Wittrup, K. D., J. E. Bailey, et al. (1990). "Propagation of an amplifiable recombinant plasmid in Saccharomyces cerevisiae: flow cytometry studies and segregated modeling." Biotechnol Bioeng 35(6): 565-577.
Worrall, D. M. (1996). "Dye-ligand affinity chromatography." Methods Mol Biol 59: 169-176.
Xie, J., A. Nair, et al. (2008). "A comparative study examining the cytotoxicity of inducible gene expression system ligands in different cell types." Toxicol In Vitro 22(1): 261-266.
Yabuuchi, H., S. Takayanagi, et al. (2002). "ABCC13, an unusual truncated ABC transporter, is highly expressed in fetal human liver." Biochem Biophys Res Commun 299(3): 410-417.
Zehnpfennig, B. (2008). Modellsysteme für humanes ABCC3 – Funktionelle Rekonstitution und Charakterisierung in Proteoliposomen und Aufbau biosensorischer Oberflächen PhD, University of Muenster.

158 References
Zehnpfennig, B., I. L. Urbatsch, et al. (2009). "Functional reconstitution of human ABCC3 into proteoliposomes reveals a transport mechanism with positive cooperativity." Biochemistry 48(20): 4423-4430.
Zeng, H., L. J. Bain, et al. (1999). "Expression of multidrug resistance protein-3 (multispecific organic anion transporter-D) in human embryonic kidney 293 cells confers resistance to anticancer agents." Cancer Res 59(23): 5964-5967.
Zeng, H., G. Liu, et al. (2000). "Transport of amphipathic anions by human multidrug resistance protein 3." Cancer Res 60(17): 4779-4784.
Zha, D. (2012). Glycoengineered Yeast as an Alternative Monoclonal Antibody Discovery and Production Platform.
Zhao, H. L., C. Xue, et al. (2008). "Increasing the cell viability and heterologous protein expression of Pichia pastoris mutant deficient in PMR1 gene by culture condition optimization." Appl Microbiol Biotechnol 81(2): 235-241.