Embed Size (px)
Citation preview

BIOANALYTICAL APPLICATIONS OF MICROFLUIDIC DEVICES
BY
HUAIBIN ZHANG
DISSERTATION
Submitted in partial fulfillment of the requirements for the degree of Doctor of Philosophy in Chemistry
in the Graduate College of the University of Illinois at Urbana-Champaign, 2010
Urbana, Illinois
Doctoral Committee:
Professor Ralph G. Nuzzo, Chair Professor Ryan C. Bailey Professor Andrew A. Gewirth Professor Jonathan V. Sweedler

ii
ABSTRACT
The first part of the thesis describes a new patterning technique--microfluidic contact
printing--that combines several of the desirable aspects of microcontact printing and
microfluidic patterning and addresses some of their important limitations through the
integration of a track-etched polycarbonate (PCTE) membrane. Using this technique,
biomolecules (e.g., peptides, polysaccharides, and proteins) were printed in high fidelity
on a receptor modified polyacrylamide hydrogel substrate. The patterns obtained can be
controlled through modifications of channel design and secondary programming via
selective membrane wetting. The protocols support the printing of multiple reagents
without registration steps and fast recycle times.
The second part describes a non-enzymatic, isothermal method to discriminate single
nucleotide polymorphisms (SNPs). SNP discrimination using alkaline dehybridization
has long been neglected because the pH range in which thermodynamic discrimination
can be done is quite narrow. We found, however, that SNPs can be discriminated by the
kinetic differences exhibited in the dehybridization of PM and MM DNA duplexes in an
alkaline solution using fluorescence microscopy. We combined this method with
multifunctional encoded hydrogel particle array (fabricated by stop-flow lithography) to
achieve fast kinetics and high versatility. This approach may serve as an effective
alternative to temperature-based method for analyzing unamplified genomic DNA in
point-of-care diagnostic.

iii
ACKNOWLEDGEMENT
First and foremost, I would express my upmost gratitude to my advisor, Professor
Ralph Nuzzo, for his invaluable guidance, support, and motivation throughout my PhD
years. His outstanding scientific intuition, ingenuity, efficiency and effectiveness will
continue to have a guiding influence throughout my career. The trust and freedom that
Ralph gave me and the high research standard that he held me to at the same time
enormously helped me to mature and grow up to be an independent researcher.
I sincerely thank Professor Jonathan Sweedler, who offered me constructive and
valuable suggestions that effectively helped conquer some important obstacles throughout
the microfluidic contact printing project. I am also grateful to Professor Andrew Gewirth
for his career advice and insightful guidance in electrochemistry.
I heartedly appreciate the friendly group dynamics of the Nuzzo group, our close
collaboration, and diverse group interaction, all of which have helped me with every
aspect of my work and life at the University of Illinois and made the time enjoyable.
Most notably, I would express my thanks to William Childs, Svetlana Mitrovski,
Matthew Stewart, Rui Dong, Joo Kang, Jennifer Hanson Shepherd, Jimin Yao, Lanfang
Li, An-Phone Lee, Mike Motala, Luke Thompson, Audrey Bowen, and Jason Goldman.
My special thanks go to Jennifer, Svetlana, and Matthew for their friendly help and moral
support in and out of lab.
During my work I have collaborated with many brilliant colleagues for whom I have

iv
great regard. I wish to extend my warmest thanks to all those who have helped me and
made this work possible, especially Adam DeConinck and Scott C. Slimmer.
I am grateful to the secretaries in the Chemistry Department and Material Research
Laboratory, for assisting me in many different ways. Dawn Somers, Connie Knight, and
Theresa Struss deserve special mention.
I also owe my loving thanks to my parents, parents-in-law, and brother for their
unconditional support, understanding, and encouragement.
Finally and most importantly, I want to thank my dearest wife and soul mate, Yan, for
her support and love. Her understanding, encouragement, sacrifices and devotion were in
the end what made this dissertation possible. I am thrilled by the marriage we have forged
over the past nine years and the personal growth each of us has made. I really look
forward to continuing our growth together for years to come.
v
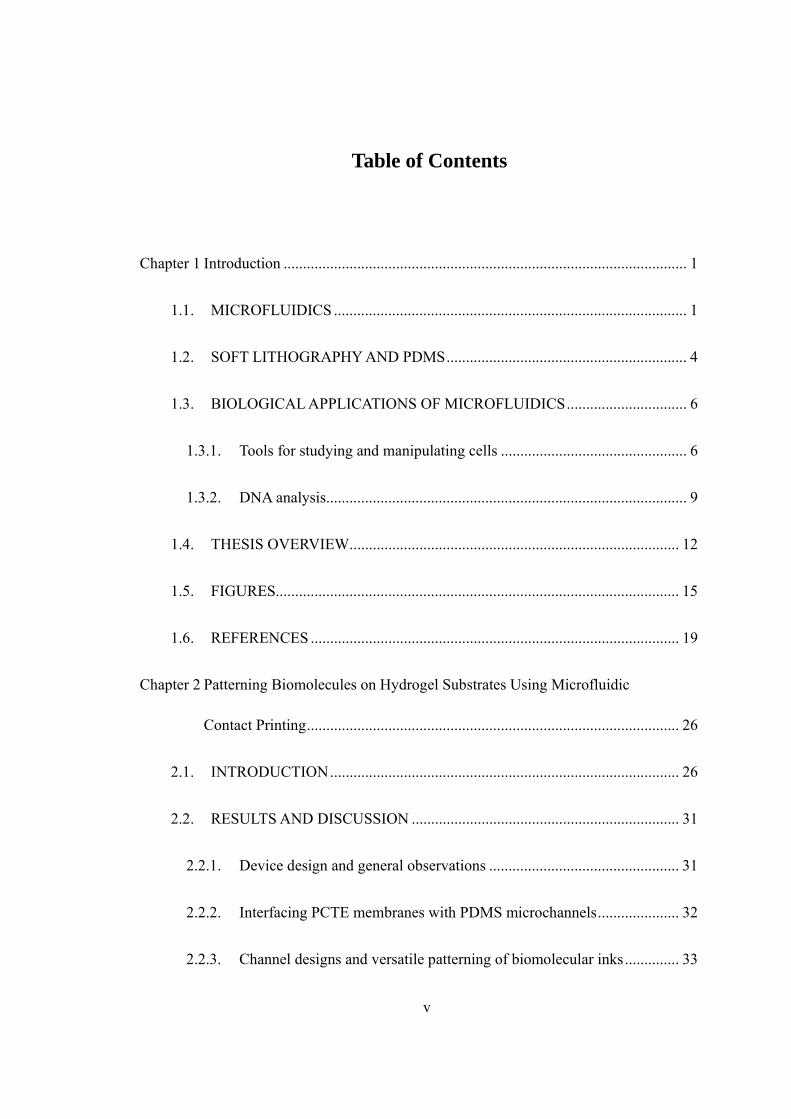
Table of Contents
Chapter 1 Introduction ........................................................................................................ 1
1.1. MICROFLUIDICS ........................................................................................... 1
1.2. SOFT LITHOGRAPHY AND PDMS .............................................................. 4
1.3. BIOLOGICAL APPLICATIONS OF MICROFLUIDICS ............................... 6
1.3.1. Tools for studying and manipulating cells ................................................ 6
1.3.2. DNA analysis ............................................................................................. 9
1.4. THESIS OVERVIEW ..................................................................................... 12
1.5. FIGURES........................................................................................................ 15
1.6. REFERENCES ............................................................................................... 19
Chapter 2 Patterning Biomolecules on Hydrogel Substrates Using Microfluidic
Contact Printing ................................................................................................ 26
2.1. INTRODUCTION .......................................................................................... 26
2.2. RESULTS AND DISCUSSION ..................................................................... 31
2.2.1. Device design and general observations ................................................. 31
2.2.2. Interfacing PCTE membranes with PDMS microchannels ..................... 32
2.2.3. Channel designs and versatile patterning of biomolecular inks .............. 33

vi
2.2.4. Discrete features patterned using selective membrane wetting .............. 38
2.2.5. Reusability and reproducibility ............................................................... 39
2.2.6. Further system modifications .................................................................. 40
2.3. CONCLUSION .............................................................................................. 40
2.4. EXPERIMENTAL .......................................................................................... 41
2.4.1. Fabrication ............................................................................................... 41
2.4.2. Patterning and imaging ............................................................................ 47
2.4.3. System characterization ........................................................................... 52
2.5. ACKNOWLEDGEMENTS............................................................................ 55
2.6. FIGURES........................................................................................................ 56
2.7. REFERENCES ............................................................................................... 69
Chapter 3 Alkaline Dehybridization for the Discrimination of Single Nucleotide
Polymorphisms ................................................................................................. 76
3.1. INTRODUCTION .......................................................................................... 76
3.2. EXPERIMENTAL .......................................................................................... 81
3.2.1. Materials and reagents ............................................................................. 81
3.2.2. DNA immobilization on agarose beads ................................................... 82
3.2.3. Microfluidic device fabrication ............................................................... 83

vii
3.2.4. On-chip DNA hybridization and dehybridization ................................... 84
3.2.5. Visualization of pH profile inside the channel ........................................ 86
3.2.6. Procedure for SNP discrimination ........................................................... 87
3.3. RESULTS AND DISCUSSION ..................................................................... 89
3.3.1. On-chip DNA hybridization .................................................................... 90
3.3.2. Alkaline dehybridization ......................................................................... 91
3.3.3. SNP discrimination via alkaline dehybridization .................................... 94
3.3.4. Recapture efficiency of the beads ........................................................... 98
3.4. CONCLUSION .............................................................................................. 99
3.5. ACKNOWLEDGEMENTS.......................................................................... 100
3.6. FIGURES AND TABLE ............................................................................... 101
3.7. REFERENCES ............................................................................................. 110
Chapter 4 Genotyping by Alkaline Dehybridization Using Graphically Encoded
Particles……………………………………………………………………...117
4.1. INTRODUCTION ........................................................................................ 117
4.2. RESULTS AND DISCUSSION ................................................................... 119
4.3. CONCLUSION ............................................................................................ 126
4.4. EXPERIMENTAL ........................................................................................ 127

viii
4.5. FIGURES AND TABLE ............................................................................... 130
4.6. REFERENCES ............................................................................................. 139
Appendix A. Alkaline Dehybridization Using a Glass Slide Support ............................ 143
Author’s Biography ........................................................................................................ 147

1
Chapter 1 Introduction
1.1. MICROFLUIDICS
Microfluidics is the science and technology of manipulating small volumes of liquid (<
10-6 litres) using submillimeter channels (10-6 - 10-3 meters).1 Controlling liquids on this
scale offers a number of important advantages and applications. For example,
microfluidics has a wide range of applications in analysis, particularly bioanalysis.2
Biological samples are usually difficult to obtain, challenging to store, potentially
hazardous during disposal, typically available only in low concentrations, and complex in
nature. Microfluidics involves small channel size, which reduces sample requirements,
decreases reagent consumption and minimizes waste. Microfluidic devices are reported to
have higher throughput (through parallel operations), lower levels of contamination
(using disposable units) and offer better sensitivity (by virtue of having higher
concentrations of analytes in smaller volumes) than is the case for traditional bench-top
instruments. Microfluidics also offers the promise of near-patient (or point-of-care)
diagnostics,3 which is essential for use in environments with limited resources and
infrastructure, such as battlefields and remote areas.4 In addition, microfluidic
technologies have proven to be useful new tools for biological studies and
engineering.2,5-7
Microfluidics has been closely associated with two terms—miniaturization and biology.

2
The success of the microelectronics industry established the powerful paradigm of
miniaturization. Making basic units (e.g., transistors) smaller allows more units to be
integrated into a single chip, which yields higher device performance and lower
fabrication costs. The power of miniaturization has been observed in molecular analysis.
Microanalytical methods (e.g., high-pressure liquid chromatography and capillary
electrophoresis) both improve sensitivity and decrease costs in comparison with its
counterparts in traditional analysis (e.g., liquid chromatography and electrophoresis).
Microfluidics began as an extension of microanalysis techniques and sought to develop a
versatile and complete analytical system. Andrew Manz proposed a new chemical sensing
concept around 1990, the micro total analytical system (μTAS), and predicted that this
system would provide numerous benefits that included high efficiency, low consumption,
faster analysis and parallel operation.8-9 This concept was further expanded, and was
vividly described as ‘lab-on-a-chip,’ which literally means integrating several laboratory
functions (e. g., sample preparation, separation, and analysis) on a single chip. The
majority of molecular analysis is performed using liquid forms, and both μTAS and
lab-on-a-chip are microfluidic technologies.
The growing interest in biology required the emergence of new analytical methods and
research tools such as microfluidics. Genetic information is linked to heritable diseases,
susceptibility to disease, and individual responses to medicines. Large amounts of genetic
information (> 13 billion nucleotide pairs in human genome) requires high-throughput,

3
high-sensitivity and low-cost analytical methods. Portable DNA analysis devices are
useful for applications such as epidemic disease monitoring and the detection of
biological weapons. Microfluidics has been used for DNA analysis since its inception,
and has demonstrated its potential. In addition to genomics, the ability to manipulate
living cells has also attracted a great deal of attention. Tissue engineering seeks to make
use of these capabilities to develop artificial organs to help millions of patients who
require organ transplants. Microfluidics offers an unprecedented ability to control
cellular microenvironments, guide cellular growth and study the fundamental science of
cellular interaction.
The rapid development of microfluidics during the past two decades is reflected in the
proliferation of literature on this subject. The International Statistical Institute (ISI) Web
of Science database is used to count publications that contain “microfluidics” and closely
associated terms (i.e., lab-on-a-chip and μTAS) in their titles and abstracts (Figure 1.1).
Between 1990 and 1996, the number of indexed publications on this subject was quite
limited (fewer than ten). During this period, microfluidic devices typically involved
devices that were fabricated with silicon and glass using traditional microfabrication
methods such as photolithography, micromachining, and etching. These fabrication
methods require routine access to expensive facilities (e.g., clean rooms) and special
equipment, which presents a barrier for general researchers in chemistry and biology
seeking to create microfluidic devices. Microfluidics began to experience exponential

4
growth starting in 1997. The number of annual publications grew to more than 100 in
2000, 1000 in 2004, and close to 3,000 in 2009. One reason for this rapid growth was the
development of polymer-based fabrication technique, or soft lithography, a technique
which dramatically reduced the barriers to entry in the field of microfluidics.
1.2. SOFT LITHOGRAPHY AND PDMS
Soft lithography consists of a set of polymer-based microfabrication techniques. These
techniques were developed by George Whitesides and his coworkers in order to
complement photolithography.10-11 The core concept of soft lithography is the replication
of microstructures made by photolithography or other techniques onto a soft polymer
stamp, followed by the use of the stamp as a patterning tool or for the purpose of making
a channel system. A common method of making an elastic stamp is illustrated in Figure
1.2(a). Pre-polymer solution is cast on a patterned (silicon) master, cured and peeled off.
The resulting stamp bears a surface relief structure that is the negative of what is on the
master. The microcontact printing technique (Figure 1.2(b)) uses the relief pattern on the
stamp to form ink patterns on the surface of substrates by means of contact.
Self-assembled monolayers (SAMs)12 constitutes an excellent ink for this purpose due to
its crystalline-like structure and nanometer thickness. The SAMs patterns formed by
thiol/thiolate or silane on gold or silicon surface can serve as an etching mask for further
patterning. In addition to patterning, the elastic stamp can also seal with other substrates

5
to form microfluidic channel systems (Figure 1.2(c)). Once a microstructured master has
been made using photolithography or other techniques, soft lithography can be used to
create numerous polymer replicas quickly and easily in ambient laboratory environments
without the use of specialized equipment, which produces a significant decrease in
fabrication cost and lowers barriers to enter.
Polydimethylsiloxane (PDMS) is the polymer most commonly used to make
microfluidic devices. Several properties of PDMS make it a particularly suitable material
for biological applications. PDMS is transparent down to ~ 300 nm and low in
background fluorescence, which makes PDMS-based microfluidic devices compatible
with optical and fluorescence microscopy. PDMS is inert in water and is biocompatible,
which makes it useful for cell studies. Another useful property is that biologically
important gases (e.g., O2, CO2) can pass PDMS easily, which makes on-chip cell growth
possible.
PDMS can form reversible or irreversible bonding with many substrates that are used
to make microfluidic devices. Glass, polystyrene, and silicon are widely used in biology,
and PDMS can reversibly bond with these materials. The reversible bonding between
PDMS and these materials is driven by van der Waals’s force, which is strong enough to
withstand 5 psi pressure. PDMS can also be used to form irreversible bonding with
numerous materials (e.g., clean glass, silicon, and polystyrene) when its surface is

6
activated by oxygen plasma,13 UV/Ozone,14-15 or Corona16. These treatments generate
-OH groups on the PDMS surface, which can form covalent bonding with other materials.
In some cases, PDMS needs to bond with porous membranes (e. g, polycarbonate
membrane) in order to make multilayer channels. These hybrid channels are useful for
making immunoassays,17 making gateable nano- or micro-fluidic interconnections,18-19
and for studying the flux of platelet agonists into flowing blood.20 Special surface
treatments are required for a permanent bonding between PDMS and polymer
membranes. Methods such as applying a thin layer of epoxy or PDMS prepolymer glue
should be conducted with great care in order to avoid microfluidic channels becoming
blocked.21 A recent study used a home-built initiated chemical vapor deposition
instrument to coat PDMS and its bonding substrate with a layer of epoxy
nano-adhesive.22 Another study involved coating polymer membrane with
3-aminopropyltriethoxysilane and claimed that an irreversible bond with PDMA was
formed.23
1.3. BIOLOGICAL APPLICATIONS OF MICROFLUIDICS
1.3.1. Tools for studying and manipulating cells
Microfluidic technologies provide unprecedented capabilities for controlling
microenvironments for the purpose of studying and manipulating cells.24-28 Channel size

7
of microfluidics is comparable to the intrinsic dimension of prokaryotic and eukaryotic
cells. These cells are sensitive to environmental factors such as topology, substrate
stiffness, surface chemistry, soluble gradients, etc.29-31 Controlling these factors allows
cell growth to be manipulated for biomedical applications such as wound healing and the
development of artificial organs for transplantation.32-34
Microfluidic technologies have proved to be useful for patterning biomolecules.35
Patterns of molecules in solution, or on the surface, have important effects on in vivo
forms of cellular behavior such as chemotaxis,36 axon extension37-38 and differentiation.39
Studies of these types of behavior were usually limited by the capabilities for patterning
biomolecules. For example, a common Boyden chamber can only generate simple and
unstable gradients.40 Microfluidics can generate complex and stable gradients by taking
advantage of a unique characteristic of hydrodynamics found on this scale, meaning
laminar flow. Streams of miscible liquids flow side-by-side in microfluidics, and mass
transfer between these streams is limited at the interface through diffusion.5 The
liquid-liquid interface, therefore, is usually clearly identified when two streams meet, and
becomes a gradient as liquids diffuse into each other. The former (i.e., clear interface) has
been used to deliver reagent to sub-cellular regions by placing cells at the interface of two
streams.41 The latter has been used to study chemotaxis, such as how sperm moves
towards ovary extracts.42 More complex gradients have been generated using a
microdiluter channel design (Figure 1.3(a)),43-44 which splits, combines and mixes fluids

8
several times in order to form a stable gradient that is orthogonal to the flow rate. This
setup has been used to guide neuron growth (Figure 1.3(b))44 and study how neutrophiles
move towards interleukin-8 polypeptide.45 A drawback of this method is that the gradient
needs to be maintained by a constant liquid flow, which may exert shear force on living
cells and alter their behavior.46
Microfluidics patterning has also been used to generate surface gradients. In one study,
PDMS stamp is reversibly sealed with substrates (e.g., glass or PDMS) that need to be
patterned.47 Flows of avidin protein and PBS buffer are established in a microdiluter,
and a gradient of avidin protein is generated at an outlet. Avidin protein is
non-specifically adsorbed on the glass to form a surface-bound gradient.47 The
immobilized gradient avidin can then translated to gradients of other biotinylated
biomolecules. Another way to capture soluble gradient is through polymerization.48 For
example, once a gradient of RGDS peptide dissolved in a prepolymer solution is formed
in a microfluidic channel, the prepolymer solution is then exposed to UV light to initiate
a photo-polymerization. The soluble peptide gradient is immobilized in the resulted
hydrogel, which can be used to guide endothelial cell attachment. Another simple method
to make surface-bound protein gradient is by taking advantage of depletion effects. When
a protein solution fills a microfluidics channel, protein adsorbs to the surface and
depleted from the solution.49 Using this method, a simple microfluidic channel could
generate a protein gradient with an intensity ranging from near-saturation to near-zero.

9
Microcontact printing has been widely used to form surface-bound biomolecules
patterns.50 For example, microcontact printing has been used to pattern a gold substrate
with methyl- and tri(ethylene glycol)- terminated SAMs.51 When the substrate is exposed
to a fibronectin solution, the protein adsorbs only to SAMS with hydrophobic tail group
(e.g., methyl-). The formed protein pattern is then used to control the attachment of
endothelial cells. Microcontact printing has been used to pattern protein ink directly
(Figure 1.4).52 The surface of PDMS is treated by plasma or UV/Ozone to be hydrophilic
first. A thin layer of protein solution is applied and carefully dried on the PDMS surface.
The coated PDMS stamp could then transfer the protein pattern to other substrates in
order to control cell growth.50 This method has recently been used to pattern hydrogel
substrates.53-54
1.3.2. DNA analysis
Microfluidics has attracted broad interest given its potential to help in the building of a
fully integrated DNA analysis system, which is ideal for point-of-care (POC)
diagnostics.3-4 Microfluidics has demonstrated that it is capable of performing functions
that are necessary for a sample-in-answer-out diagnostic device. These functions include
cell sorting, cell lysis, DNA extraction and purification, DNA amplification, and DNA
detection (e.g., sequencing and genotyping).55 56 57-58 The DNA detection methods used in
these studies usually are miniaturized versions of technologies used in bench-top

10
instruments. Some of these technologies may not fulfill the unique requirements that are
needed for use in point-of-care applications. For example, point-of-care device require
greater stringency regarding the stability of reagents due to the lack of air-conditioned
storage and operating environments. It is also ideal for POC devices that need to be
energy-efficient and versatile in order to decrease the need to carry extra batteries and
equipment.
Single Nucleotide Polymorphism (SNP) is a DNA sequence variation that involves a
single change in a single nucleotide.59 SNPs are the most common type of human genetic
variation,60-61 and SNPs have attracted considerable interest as the targets of disease
diagnostics,62-64 as well as for being gene markers.65-67 SNPs are usually discriminated
using either temperature-based or enzyme-based methods. Allele-specific oligonucleotide
hybridization (ASOH) is a typical temperature-based method.59,68 In this method,
thermal stability between a perfectly matched and mismatched DNA probe and its target
is used to distinguish between the SNP alleles. ASOH requires an intensive assay
optimization so that a single stringency condition (e.g., temperature, ion strength) can
discriminate among all of the SNPs on the assay. SNPs can be scored easily by taking a
fluorescence image after discrimination has been completed. A method called Dynamic
allele-specific hybridization (DASH) uses a dynamic heating process and monitors the
DNA dehybridization process.69-70 DASH uses standard reaction conditions, and does not
require assay optimization. The scoring of SNPs in this method is not as straightforward

11
as is the case for ASHO. On the other hand, enzyme-based genotyping methods use
polymerases or ligases to discriminate among SNPs.59 These methods offer high accuracy
and specificity, and have become increasingly common in centralized facilities.
Enzyme-based methods may not be ideal due to limited shelf-life, expensive reagents and
stringent reaction conditions (e.g., 37oC to ensure optimal enzyme activity).
In addition to discrimination methods, assay format is another important
consideration for POC devices. Particle-based systems have several advantages over
microarray-based systems for POC applications. Microarray is the most commonly used
type of assay among bench-top instruments.67 It is usually made using light-directed
chemistry to immobilize sequence specific DNA probes onto a designated location within
the parameters of a small chip. Although microarray has very high assay density,
hybridization kinetics of planar microarray is generally slow, and requires hours to
perform a sample hybridization step. Particle-based systems have higher surface/area
ratios and higher kinetics. For example, micrometer-scale beads coated with ssDNA
probe have been utilized to capture target ssDNA.71-73 In these systems, the necessary
hybridization time was decreased dramatically—from the period of hours required in the
case of a planar surface microarray to as little as a few seconds.73-75 In addition, particles
that are encoded with identification information serve as a flexible assay format for POC
applications.76 Unlike microarray, encoded particle probe-sets can be changed rapidly on
the spot to fulfill various types of diagnostic demands. Stop-flow lithography is a

12
recently-developed method that uses a strategy similar to photolithography to fabricate
hydrogel particles.77 This method combines particle synthesis, encoding and probe
incorporation into a single process.
1.4. THESIS OVERVIEW
The purpose of this dissertation is to utilize PDMS-based microfluidic devices on
bioanalytical applications, such as cells manipulation and DNA analysis. Chapter 2
describes a high-throughput, reusable printing platform for patterning biomolecular inks
on soft material substrates. Hydrogels imprinted with biomolecules, (e.g., proteins, or
peptides) have wide application in bioanalytical applications such as diagnostics and
studies of cells in culture. Currently used micropatterning techniques, such as
microcontact printing and microfluidic patterning, have some important limitations when
used on soft substrates. The platform described here draws inspiration from both
microcontact printing and microfluidic patterning techniques and extends them further
through the utilization of a membrane-based microfluidic device design. A track-etched
polycarbonate membrane is used to seal a PDMS microfluidic channel device to form a
printer head. Model ‘inks’—solutions of biotin-labeled biomolecular targets—are
constantly replenished via perfusion of solution through the membrane and captured on a
streptavidin-incorporating polyacrylamide hydrogel-coated substrate placed in conformal
contact with the print head. Resulting patterns on the hydrogel substrate can be controlled

13
via channel design and selective membrane wetting. Multiple channel designs are used
to pattern three model classes of biomolecules (i.e., peptides, polysaccharides, and
proteins), and to demonstrate versatility of this method. Polylysine patterned hydrogel
substrates were used to highlight a potential application of this patterning platform, as
substrates for directed growth of hippocampal neurons. The short cycle time and
reproducibility of this patterning technique are demonstrated in the end of this chapter.
Chapter 3 describes a novel, and often neglected, process—alkaline
dehybridization—for DNA analysis. Alkaline solutions (e.g., 1M NaOH) have been
widely used to dehybridize genomic DNAs, but alkaline dehybridization has not been
reported to be able to discriminate SNPs. An integrated microfluidic (μ-fl) device was
used to effect separations that discriminate single nucleotide polymorphisms (SNP) based
on kinetic differences in the lability of perfectly matched (PM) and mismatched (MM)
DNA duplexes during alkaline dehybridization. For this purpose, a 21-base
single-stranded DNA (ssDNA) probe sequence was immobilized on agarose-coated
magnetic beads, which in turn can be localized within the channels of a
poly(dimethylsiloxane) microfluidic device using an embedded magnetic separator. The
PM and MM ssDNA targets were hybridized with the probe to form a mixture of PM and
MM DNA duplexes using standard protocols. The hydroxide ions necessary for
mediating the dehybridization were generated electrochemically in-situ by performing the
oxygen reduction reaction (ORR) using O2 that passively permeates the device at a Pt

14
working electrode (Pt-WE) embedded within the microfluidic channel system. The
alkaline DNA dehybridization process was followed using fluorescence microscopy.
The results of this study show that the two duplexes exhibit different kinetics of
dehybridization, rate profiles that can be manipulated as a function of both the amount of
the hydroxide ions generated and the mass transfer characteristics of their transport
within the device. This system is shown to function as a durable platform for effecting
hybridization/dehybridization cycles using a non-thermal, electrochemical actuation
mechanism, one that may enable new designs for lab-on-a-chip devices used in DNA
analysis.
Chapter 4 describes a non-enzymatic, isothermal, versatile, and potentially
high-throughput genotyping approach that uses an alkaline discrimination method acting
on a multiplexed particle array. The kinetic difference of PM and MM duplexes
dehybridization under alkaline conditions is effectively measured by the difference in
fluorescence retention ratio, the peak value of which can serve as a simple metric for
genotyping. A pH gradient is used to discriminate target DNA sequences with different
SNP insertion points over a range of temperatures, reducing optimization requirements.
This technique is combined with the use of SFL-fabricated multifunctional encoded
hydrogel particles to achieve high versatility. This approach may serve as a new route for
analyzing unamplified genomic DNA.

15
1.5. FIGURES
Figure 1.1. Annual publications related to microfluidics across all journals that are
indexed by ISI Web of Science Database.

16
Figure 1.2: A schematic illustrating the fabrication of a PDMS stamp (a), which can be
used to pattern molecular ‘ink’ through Microcontact Printing (b) or sealed with a given
substrate to form a microfluidic channel system (c).

17
Figure 1.3: (a) A schematic drawing of a microfluidic diluter design that is used for the
fabrication of immobilized laminin gradient for guiding Rat hippocampal neuron growth
(b). (Reproduced with permission from Dertinger, S. K. W.; Jiang, X.; Li, Z.; Murthy, V.
N.; Whitesides, G. M. Proc. Natl. Acad. Sci. U. S. A., 2002, 99, 12542. Copyright (2002)
National Academy of Sciences, U.S.A.)

18
Figure 1.4: (a) Scheme of patterning protein with Microcontact Printing; (b)
fluorescence images of rhodamine-labeled antibodies patterned on a glass slide; (c) Three
different proteins printed on a glass slide by a flat stamp. (Reproduced with permission
from A. Bernard, J. P. Renault, B. Michel, H. R. Bosshard, E. Delamarche, Advanced
Material (Weinheim, Ger.), 2000, 12, 1067. Copyright Wiley-VCH Verlag GmbH & Co.
KGaA.)

19
1.6. REFERENCES
(1) Whitesides, G. M. "The origins and the future of microfluidics"; Nature 2006,
442, 368.
(2) Sia, S. K.; Whitesides, G. M. "Microfluidic devices fabricated in
poly(dimethylsiloxane) for biological studies"; Electrophoresis 2003, 24, 3563.
(3) Sia, S. K.; Kricka, L. J. "Microfluidics and point-of-care testing"; Lab Chip 2008,
8, 1982.
(4) Yager, P.; Edwards, T.; Fu, E.; Helton, K.; Nelson, K. et al "Microfluidic
diagnostic technologies for global public health"; Nature 2006, 442, 412.
(5) Beebe, D. J.; Mensing, G. A.; Walker, G. M. "Physics and applications of
microfluidics in biology"; Annu. Rev. Biomed. Eng. 2002, 4, 261.
(6) Weibel, D. B.; Whitesides, G. M. "Applications of microfluidics in chemical
biology"; Curr. Opin. Chem. Biol. 2006, 10, 584.
(7) Khademhosseini, A.; Langer, R.; Borenstein, J.; Vacanti, J. P. "Microscale
technologies for tissue engineering and biology"; Proc. Natl. Acad. Sci. U. S. A. 2006,
103, 2480.
(8) Manz, A.; Graber, N.; Widmer, H. M. "Miniaturized total chemical analysis
systems: A novel concept for chemical sensing"; Sensor Actua. B-Chem. 1990, 1, 244.
(9) Reyes, D. R.; Iossifidis, D.; Auroux, P.-A.; Manz, A. "Micro Total Analysis
Systems. 1. Introduction, Theory, and Technology"; Anal. Chem. 2002, 74, 2623.
(10) Xia, Y.; Whitesides, G. M. "Soft lithography"; Angew. Chem. Int. Edit. 1998, 37,
550.
(11) Xia, Y.; whitesides, G. M. "Soft Lithography"; Annu. Rev. Mater. Sci. 1998, 28,
153.
(12) Bain, C. D.; Troughton, E. B.; Tao, Y. T.; Evall, J.; Whitesides, G. M. et al
"Formation of monolayer films by the spontaneous assembly of organic thiols from
solution onto gold"; J. Am. Chem. Soc. 1989, 111, 321.

20
(13) Bhattacharya, S.; Datta, A.; Berg, J. M.; Gangopadhyay, S. "Studies on surface
wettability of poly(dimethyl) siloxane (PDMS) and glass under oxygen-plasma treatment
and correlation with bond strength"; J. Microelectromech. S. 2005, 14, 590.
(14) Efimenko, K.; Wallace, W. E.; Genzer, J. "Surface Modification of Sylgard-184
Poly(dimethyl siloxane) Networks by Ultraviolet and Ultraviolet/Ozone Treatment"; J.
Colloid. Interf. Sci. 2002, 254, 306.
(15) Berdichevsky, Y.; Khandurina, J.; Guttman, A.; Lo, Y.-H. "UV/ozone
modification of poly(dimethylsiloxane) microfluidic channels"; Sensor Actua. B-Chem.
2004, 97, 402.
(16) Haubert, K.; Drier, T.; Beebe, D. J. "PDMS bonding by means of a portable,
low-cost corona system"; Lab Chip 2007.
(17) Ismagilov, R. F.; Ng, J. M. K.; Kenis, P. J. A.; Whitesides, G. M. "Microfluidic
Arrays of Fluid-Fluid Diffusional Contacts as Detection Elements and Combinatorial
Tools"; Anal. Chem. 2001, 73, 5207.
(18) Kuo, T.-C.; M, D.; Cannon, J.; Chen, Y.; Tulock, J. J. et al "Gateable Nanofluidic
Interconnects for Multilayered Microfluidic Separation Systems"; Anal. Chem. 2003, 75,
1861.
(19) Kuo, T.-C.; Cannon, J., D.M.; Shannon, M. A.; Sweedler, J. V.; Bohn, P. W.
"Hybrid three-dimensional nanofluidic/microfluidic devices using molecular gates";
Sensor Actuator 2003, 102, 223.
(20) Neeves, K. B.; Diamond, S. L. "A membrane-based microfluidic device for
controlling the flux of platelet agonists into flowing blood"; Lab Chip 2008, 8, 701.
(21) Chueh, B.; Huh, D.; Kyrtsos, C. R.; Houssin, T.; Futai, N. et al "Leakage-Free
Bonding of Porous Membranes into Layered Microfluidic Array Systems"; Anal. Chem.
2007, 79, 3504.
(22) Im, S. G.; Bong, K. W.; Lee, C.-H.; Doyle, P. S.; Gleason, K. K. "A conformal
nano-adhesive via initiated chemical vapor deposition for microfluidic devices"; Lab

21
Chip 2009, 9, 411.
(23) Aran, K.; Sasso, L. A.; Kamdar, N.; Zahn, J. D. "Irreversible, direct bonding of
nanoporous polymer membranes to PDMS or glass microdevices"; Lab Chip 2010, 10,
548.
(24) El-Ali, J.; Sorger, P. K.; Jensen, K. F. "Cells on chips"; Nature 2006, 442, 403.
(25) Yi, C. Q.; Li, C. W.; Ji, S. L.; Yang, M. S. "Microfluidics technology for
manipulation and analysis of biological cells"; Anal. Chim. Acta 2006, 560, 1.
(26) Shim, J.; Bersano-Begey, T. F.; Zhu, X. Y.; Tkaczyk, A. H.; Linderman, J. J. et al
"Micro- and nanotechnologies for studying cellular function"; Curr. Top. Med. Chem.
2003, 3, 687.
(27) Hung, P. J.; Lee, P. J.; Sabounchi, P.; Lin, R.; Lee, L. P. "Continuous perfusion
microfluidic cell culture array for high-throughput cell-based assays"; Biotechnol. Bioeng.
2005, 89, 1.
(28) Pearce, T. M.; Williams, J. C. "Microtechnology: Meet neurobiology"; Lab Chip
2006.
(29) Lim, J. Y.; Donahue, H. J. "Cell Sensing and Response to Micro- and
Nanostructured Surfaces Produced by Chemical and Topographic Patterning"; Tissue Eng.
2007, 13, 1879.
(30) Falconnet, D.; Csucs, G.; Michelle Grandin, H.; Textor, M. "Surface engineering
approaches to micropattern surfaces for cell-based assays"; Biomaterials 2006, 27, 3044.
(31) Discher, D. E.; Janmey, P.; Wang, Y. L. "Tissue cells feel and respond to the
stiffness of their substrate"; Science 2005, 310, 1139.
(32) Whitesides, G. M.; Ostuni, E.; Takayama, S.; Jiang, X.; Ingber, D. E. "Soft
Lithography in Biology and Biochemistry"; Annu. Rev. Biomed. Eng. 2001, 3, 335.
(33) Wang, J.; Ren, L.; Li, L.; Liu, W.; Zhou, J. et al "Microfluidics: A new cosset for
neurobiology"; Lab Chip 2009, 9, 644.
(34) Grayson, A. C. R.; Shawgo, R. S.; Johnson, A. M.; Flynn, N. T.; Li, Y. et al "A

22
bioMEMS review: MEMS technology for physiologically integrated devices";
Proceedings of the IEEE 2004, 92, 6.
(35) Khademhosseini, A.; Langer, R. "Nanobiotechnology: drug delivery and tissue
engineering"; Chem. Eng. Prog. 2006, 102, 38.
(36) Adler, J. "Chemotaxis in bacteria"; Science 1966, 153, 708.
(37) Baier, H.; Bonhoeffer, F. "Axon Guidance By Gradients Of A Target-Derived
Component"; Science 1992, 255, 472.
(38) Song, H.-J.; Poo, M.-M. "Signal transduction underlying growth cone guidance
by diffusible factors"; Curr. Opin. Neurobiol. 1999, 9, 355.
(39) Engler, A. J.; Sen, S.; Sweeney, H. L.; Discher, D. E. "Matrix Elasticity Directs
Stem Cell Lineage Specification"; Cell 2006, 126, 677.
(40) Boyden, S. "The chemotactic effect of mixtures of antibody and antigen on
polymorphonuclear leucocytes"; J. Exp. Med. 1962, 115, 453.
(41) Takayama, S.; Ostuni, E.; LeDuc, P.; Naruse, K.; Ingber, D. E. et al "Laminar
flows-Subcellular positioning of small molecules"; Nature 2001, 411, 1016.
(42) Koyama, S.; Amarie, D.; Soini, H. A.; Novotny, M. V.; Jacobson, S. C.
"Chemotaxis Assays of Mouse Sperm on Microfluidic Devices"; Anal. Chem. 2006, 78,
3354.
(43) Dertinger, S. K. W.; Chiu, D. T.; Jeon, N. L.; Whitesides, G. M. "Generation of
Gradients Having Complex Shapes Using Microfluidic Networks"; Anal. Chem. 2001, 73,
1240.
(44) Dertinger, S. K. W.; Jiang, X.; Li, Z.; Murthy, V. N.; Whitesides, G. M.
"Gradients of substrate-bound laminin orient axonal specification of neurons"; Proc. Natl.
Acad. Sci. U. S. A. 2002, 99, 12542.
(45) Jeon, N. L.; Baskaran, H.; Dertinger, S. K. W.; Whitesides, G. M.; Van De Water,
L. et al "Neutrophil chemotaxis in linear and complex gradients of interleukin-8 formed
in a microfabricated device"; Nat. Biotechnol. 2002, 20, 826.

23
(46) Hsu, S.; Thakar, R.; Liepmann, D.; Li, S. "Effects of shear stress on endothelial
cell haptotaxis on micropatterned surfaces"; Biochem. Biophys. Res. Commun. 2005, 337,
401.
(47) Jiang, X. Y.; Xu, Q. B.; Dertinger, S. K. W.; Stroock, A. D.; Fu, T. M. et al "A
general method for patterning gradients of biomolecules on surfaces using microfluidic
networks"; Anal. Chem. 2005, 77, 2338.
(48) Burdick, J. A.; Khademhosseini, A.; Langer, R. "Fabrication of Gradient
Hydrogels Using a Microfluidics/Photopolymerization Process"; Langmuir 2004, 20,
5153.
(49) Fosser, K. A.; Nuzzo, R. G. "Fabrication of Patterned Multicomponent Protein
Gradients and Gradient Arrays Using Microfluidic Depletion"; Anal. Chem. 2003, 75,
5775.
(50) Kane, R. S.; Takayama, S.; Ostuni, E.; Ingber, D. E.; Whitesides, G. M.
"Patterning proteins and cells using soft lithography"; Biomaterials 1999, 20, 2363.
(51) Mrksich, M.; Chen, C. S.; Xia, Y.; Dike, L. E.; Ingber, D. E. et al "Controlling
cell attachment on contoured surfaces with self-assembled monolayers of alkanethiolates
on gold"; Proc. Natl. Acad. Sci. USA 1996, 93, 10775.
(52) Bernard, A.; Renault, J. P.; Michel, B.; Bosshard, H. R.; Delamarche, E.
"Microcontact Printing of Proteins"; Adv. Mater. (Weinheim, Ger.) 2000, 12, 1067.
(53) Hynd, M. R.; Frampton, J. P.; Dowell-Mesfin, N.; Turner, J. N.; Shain, W.
"Directed cell growth on protein-functionalized hydrogel surfaces"; J. Neurosci. Meth.
2007, 162, 255.
(54)Hynd, M. R.; Frampton, J. P.; Burnham, M.-R.; Martin, D. L.; Dowell-Mesfin, N.
M. et al "Functionalized hydrogel surfaces for the patterning of multiple biomolecules"; J.
Biomed. Mater. Res., Part A 2007, 81A, 347.
(55) Sun, Y.; Kwok, Y. C. "Polymeric microfluidic system for DNA analysis"; Anal.
Chim. Acta 2006, 556, 80.

24
(56) Auroux, P. A.; Koc, Y.; de Mello, A.; Manz, A.; Day, P. J. R. "Miniaturised
nucleic acid analysis"; Lab Chip 2004, 4, 534.
(57) Di Carlo, D.; Ionescu-Zanetti, C.; Zhang, Y.; Hung, P.; Lee, L. P. "On-chip cell
lysis by local hydroxide generation"; Lab Chip 2005, 5, 171.
(58) Burns, M. A.; Johnson, B. N.; Brahmasandra, S. N.; Handique, K.; Webster, J. R.
et al "An integrated nanoliter DNA analysis device"; Science 1998, 282, 484.
(59) Syvanen, A.-C. "Accessing genetic variation: genotyping single nucleotide
polymorphisms"; Nat. Rev. Genet. 2001, 2, 930.
(60) Sachidanandam, R.; Weissman, D.; Schmidt, S. C.; Kakol, J. M.; Stein, L. D. et
al "A map of human genome sequence variation containing 1.42 million single nucleotide
polymorphisms"; Nature 2001, 409, 928.
(61) Wang, D. G.; Fan, J.-B.; Siao, C.-J.; Berno, A.; Young, P. et al "Large-Scale
Identification, Mapping, and Genotyping of Single-Nucleotide Polymorphisms in the
Human Genome"; Science 1998, 280, 1077.
(62) Kruglyak, L. "Prospects for whole-genome linkage disequilibrium mapping of
common disease genes"; Nat. Genet. 1999, 22, 139.
(63) McCarthy, J. J.; Hilfiker, R. "The use of single-nucleotide polymorphism maps
in pharmacogenomics"; Nat. Biotechnol. 2000, 18, 505.
(64) Kassam, S.; Meyer, P.; Corfield, A.; Mikuz, G.; Sergi, C. "Single nucleotide
polymorphisms (SNPs): History, biotechnological outlook and practical applications";
Curr. Pharmacogenomics 2005, 3, 237.
(65) Stoneking, M. "Single nucleotide polymorphisms: From the evolutionary past";
Nature 2001, 409, 821.
(66) Kruglyak, L. "The use of a genetic map of biallelic markers in linkage studies";
Nat. Genet. 1997, 17, 21.
(67) Hacia, J. G.; Fan, J. B.; Ryder, O.; Jin, L.; Edgemon, K. et al "Determination of
ancestral alleles for human single-nucleotide polymorphisms using high-density

25
oligonucleotide arrays"; Nat. Genet. 1999, 22, 164.
(68) Stoneking, M.; Hedgecock, D.; Higuchi, R. G.; Vigilant, L.; Erlich, H. A.
"Population variation of human MTDNA control region sequences detected by enzymatic
amplification and sequence-specific oligonucleotide probes"; Am. J. Hum. Genet. 1991,
48, 370.
(69) Howell, W. M.; Job, M.; Gyllensten, U.; Brookes, A. J. "Dynamic allele-specific
hybridization"; Nat. Biotechnol. 1999, 17, 87.
(70) Jobs, M.; Howell, W. M.; Stroemqvist, L.; Mayr, T.; Brookes, A. J. "DASH-2:
Flexible, low-cost, and high-throughput SNP genotyping by dynamic allele-specific
hybridization on membrane arrays"; Genome Res. 2003, 13, 916.
(71) Verpoorte, E. "Beads and chips: New recipes for analysis"; Lab Chip 2003, 3,
60N.
(72) Seong, G. H.; Zhan, W.; Crooks, R. M. "Fabrication of microchambers defined
by photopolymerized hydrogels and weirs within microfluidic systems: Application to
DNA hybridization"; Anal. Chem. 2002, 74, 3372.
(73) Kim, J.; Heo, J.; Crooks, R. M. "Hybridization of DNA to Bead-Immobilized
Probes Confined within a Microfluidic Channel"; Langmuir 2006, 22, 10130.
(74) Fan, Z. H.; Mangru, S.; Granzow, R.; Heaney, P.; Ho, W. et al "Dynamic DNA
hybridization on a chip using paramagnetic beads"; Anal. Chem. 1999, 71, 4851.
(75) Kohara, Y.; Noda, H.; Okano, K.; Kambara, H. "DNA probes on beads arrayed in
a capillary, 'Bead-array', exhibited high hybridization performance"; Nucl. Acids Res.
2002, 30, e87.
(76) Nolan, J. P.; Sklar, L. A. "Suspension array technology: evolution of the
flat-array paradigm"; Trends Biotechnol. 2002, 20, 9.
(77) Pregibon, D. C.; Toner, M.; Doyle, P. S. "Multifunctional Encoded Particles for
High-Throughput Biomolecule Analysis"; Science 2007, 315, 1393.

26
Chapter 2 Patterning Biomolecules on Hydrogel Substrates
Using Microfluidic Contact Printing
Note: The majority of the text comes from Huaibin Zhang, Jennifer N. Hanson Shepherd, and Ralph G. Nuzzo, “Microfluidic Contact Printing: a Versatile Printing Platform for Patterning Biomolecules on Hydrogel Substrates”, Soft Matter 2010, 6, 2238-2245. Copyright 2010 Royal Society of Chemistry.
The images included in 2.6 and 2.7 were taken by Dr. Jennifer N Hanson Shepherd.
2.1. INTRODUCTION
Methods for patterning biomolecules are of broad utility, with exemplary applications
that include diagnostics,1 chemical sensing,2 and platforms for studying cellular
behaviors.3-4 The present report addresses this latter interest, highlighting the
development of a protocol for patterning soft substrate materials in ways that complement
those currently used to pattern hard substrates such as glass, silicon, or plastic. The
patterning of the latter hard surfaces for use in biomolecular analysis has been intensively
reported in the literature, with notable applications that include their use to direct
neuronal growth,5-7 study synaptogenesis,8 and improve cellular attachment via
modification with cell recognition molecules such as laminin.9-10 Controlled
biomolecular gradients have also been used to study important cellular processes, such as
chemotaxis,11 haptotaxis,12 angiogenesis,13 morphogenesis14 and axon guidance.15-16
Interest in performing similar cellular studies on soft materials is growing as it is now
becoming well understood that substrate modulus can play a significant role in mediating

27
the morphological and physiological development of cells.17-18 In this context, soft
materials, specifically hydrogels, are more suitable substrates for cellular studies because
their mechanical properties can be easily tailored to better mimic in vivo conditions.19-20
Micropatterning technologies, including microcontact printing (μCP) and microfluidic
patterning, are a logical choice for generating patterns and gradients of this type as they
allow the manipulation of small volumes of solution with precise control over its
temporal and spatial delivery.4 Μicrocontact printing, first described by the Whitesides
group in the 1990’s,21-22 can be used to create complex but useful patterns of alkanethiol
(and alkyl silane) self-assembled monolayers (SAMs) on gold (and glass) surfaces, via a
physical ‘stamping’-based transfer technique. These SAMs can be used as both a resist
and a platform that enables subsequent modification via covalent attachment. Proteins,
for example, can be attached to an appropriately patterned SAM either via non-specific
adsorption23 or through specific functionalized end groups on the thiols.24-25 James et al.
later modified the technique to make it amenable to and compatible with the direct
printing of proteins.26 In the latter study, hydrophobic polydimethylsiloxane (PDMS)
stamps made via replica molding were modified with an oxygen plasma to render them
hydrophilic. This modification in turn allowed the direct printing of a positively
charged protein (polylysine) over a 4 cm2 glass substrate. A few recent studies have
extended µCP to pattern biomolecules on soft substrates. 27-28 A study conducted by
Hynd et al. utilized an acrylamide-based hydrogel substrate that was photopolymerized in

28
the presence of a streptavidin-incorporating monomer. The resulting gel film was
capable of binding biotinylated extracellular matrix proteins (ECM) transferred in
patterned form via µCP.27 A following study by the same authors examined cellular
responses to these and found a preference for them to adhere in ECM modified regions.29
Microfluidic patterning is the most commonly used method to generate fluid-based
gradients sustained by laminar flow,30-32 but has also been used to create surface-bound
patterns via adsorption.9,33-34 In the latter case, a PDMS channel system is reversibly
bound via a compliant soft-contact to a hard substrate such as glass or silicon. A
solution containing a biomolecular adsorbate (e.g., a protein) is pushed through the
channels and bonded to the surface in spatial registration either through specific or
non-specific interactions with the substrate. The channel system is then removed from
the substrate and the resulting patterned surface, or even the PDMS stamp itself, used for
biological studies. Applications made using this approach have been reported in the
literature with notable examples including axon guidance,9,34 haptotaxis,35 and directed
cellular migration.36
While powerful, microfluidic patterning and μCP techniques both have important
limitations in particular regarding their capacities for efficiently and reproducibly
generating multi-component biomolecular gradients or discrete chemical patterns
imprinted on soft substrates. It is inherently difficult to use microfluidic methods to

29
pattern soft materials, for example, due to the complexity involved in promoting close
conformal contact with a hydrogel, which is necessary to prevent leakage. Furthermore,
the reusability of the microfluidic patterning technique is usually low because the flow is
disrupted when the substrate is separated from the channel after each printing step. This
disturbance necessitates an extended preparation time and can result in a loss of precious
reagents (e.g., a specific protein target for an assay). The limitations of μCP techniques in
the latter context lie in the innate difficulty associated with rigorously controlling the
amount of material transferred when using a complex macromolecular ink, which is
essential for generating gradients of useful species such as proteins.9,33,37 In addition,
when patterning multiple biomolecular inks using µCP, difficult alignment steps are
usually required. To address this limitation, Bernard et al. combined μCP and
microfluidics to enable the printing of multiple biomolecules, without the need for a
registration step.38 In this study, a microfluidic channel was reversibly sealed to a
planar PDMS stamp (i.e., a slab without surface relief). Protein solution flowing
through the microfluidic channel adsorbed to the surface of the PDMS slab and in this
way defined the “inking” areas. This protocol was used to print 16 different proteins to
a plastic substrate at the same time. The one drawback of this method, however, is that
the stamp is not reusable and does not usefully enable the patterning of soft substrates.
There therefore remains a need and opportunity to provide further improvements to these
techniques, especially in terms of the scope of both the inks and substrates that can be
patterned.

30
The work described here draws inspiration from both microcontact printing and
microfluidic patterning techniques and extends them further through utilization of a
membrane-based microfluidic device design.39 This system, presented schematically in
Figure 2.1 (steps I-IV), creates a ‘microfluidic contact printing’ tool by using microfluidic
channels fabricated via typical soft lithography methods37,40-42 that are irreversibly sealed
to a modified polycarbonate track-etched (PCTE) membrane. PCTE membranes have
been incorporated into microfluidic devices to make gateable nano- or micro-fluidic
interconnects in multilayered separation systems43-45 and in the fabrication of stacked
microfluidic devices used to study the flux of platelet agonists into flowing blood.46
Previous studies that incorporated PCTE membrane into their devices used adhesives (e.g,
epoxy or PDMS prepolymer) to interface the membranes with the PDMS
microchannels.45,47-48 Applying an ultra-thin layer of the adhesives is necessary and
challenging because excess glue on the membrane can block membrane pores and,
possibly, even neighboring microfluidic channels. The device reported here is fabricated
using vapor deposited thin-film adhesion layers that obviate this latter requirement, thus
simplifying fabrication.
In this study, the printing tool was used to pattern a single biomolecular ink solution
via complex single channel designs; multiple biomolecular ink solutions were also
patterned simultaneously using a multi-channel design. The system’s capabilities for
generating gradients using multiple channel designs also are demonstrated. We
31
specifically demonstrate capabilities for patterning model biomolecular ink compositions
including those based on small chain-length peptides, polysaccharides, and proteins.
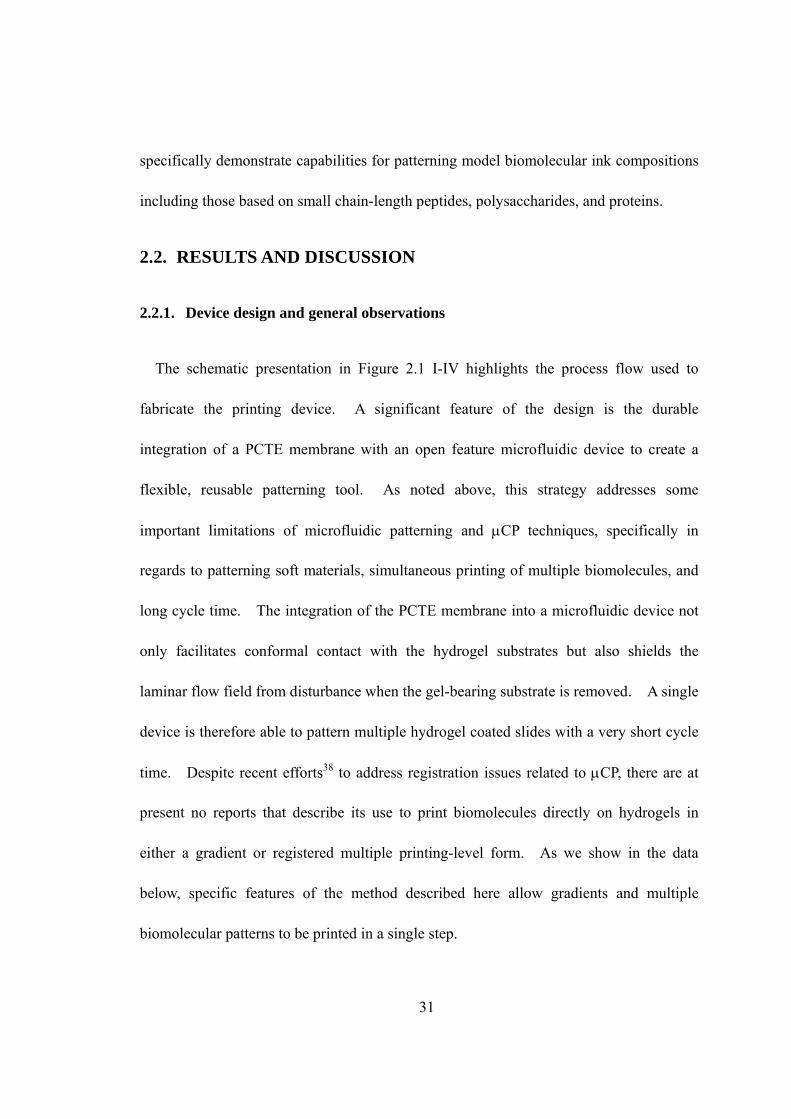
2.2. RESULTS AND DISCUSSION
2.2.1. Device design and general observations
The schematic presentation in Figure 2.1 I-IV highlights the process flow used to
fabricate the printing device. A significant feature of the design is the durable
integration of a PCTE membrane with an open feature microfluidic device to create a
flexible, reusable patterning tool. As noted above, this strategy addresses some
important limitations of microfluidic patterning and μCP techniques, specifically in
regards to patterning soft materials, simultaneous printing of multiple biomolecules, and
long cycle time. The integration of the PCTE membrane into a microfluidic device not
only facilitates conformal contact with the hydrogel substrates but also shields the
laminar flow field from disturbance when the gel-bearing substrate is removed. A single
device is therefore able to pattern multiple hydrogel coated slides with a very short cycle
time. Despite recent efforts38 to address registration issues related to μCP, there are at
present no reports that describe its use to print biomolecules directly on hydrogels in
either a gradient or registered multiple printing-level form. As we show in the data
below, specific features of the method described here allow gradients and multiple
biomolecular patterns to be printed in a single step.

32
The printing procedure involves two components of actuation: (a) transudation of a
biomolecular ‘ink’ through a PCTE membrane; and (b) the subsequent capture of this ‘ink’
by an affinity modified hydrogel. The quantitative aspects of the transferred pattern
(feature width, depth, shape, and contour; concentration of imprinted biomolecular ink;
gradient profiles; and hierarchy) can be tailored by manipulation of simple mass-transfer
responsive system features. For example, the location of the ‘ink’ supplied can be
controlled through combination of the underlying channel design and the use of a
secondary selective membrane wetting protocol (see below). The amount of ‘ink’
supplied also can be dynamically modulated by such factors as the flow rate/backing
pressure and contact time between the hydrogel and the device. ‘Ink’ capture is the
result of a competition between diffusive zone spreading within the hydrogel and the
kinetics of the coupling reaction, which in the current model involve a non-covalent
binding between the biotinylated ‘ink’ and streptavidin-incorporating gel. The printing
resolution, therefore, is directly affected by intrinsic ‘ink’ characteristics (e.g., the
molecular weight or charge distribution) as well as the probe concentration in the
hydrogel. These modifiable and controllable system parameters allow a versatile and
dynamic patterning capability for soft substrates, as illustrated in the following sections.
2.2.2. Interfacing PCTE membranes with PDMS microchannels
Creating a strong bond between the PCTE membrane and PDMS microchannel support
is a critical design requirement for this microfluidic device. To do so (Figure 2.1(a)),

33
the PCTE membranes are first modified with a thin layer of vapor-deposited titanium (an
adhesion layer), followed by silicon dioxide, which substantially improves bonding
between the PDMS microchannels and the membrane. This adhesion layer does not
cause any obvious deformation of the PCTE membrane (Figure 2.1(b)) but decreases the
pore size by approximately 14 nm at these mass coverages (Figure 2.2). We believe that
the SiO2 coating gives the PCTE membrane a glass-like surface, which is able to form
strong chemical bonds with PDMS after surface activation using a corona discharge.49
The latter treatment in fact provides fully irreversible adhesive bonding. 50 We note that
interfacing of the channel to the modified membrane is significantly improved when the
cast PDMS channels are soft or slightly under-cured (procedure described in the ESI).51
The PCTE membrane used was large enough to cover and seal the entire underlying
channel system (including the inlet and outlet) to circumvent the possibility of
leaking.44,46,48 To accommodate this design, a syringe needle was inserted through the
PDMS sidewall into the inlet reservoir and then sealed to the PDMS using epoxy, as is
schematically depicted in Figure 2.1(c). The optical micrograph in Figure 2.1(d) shows
the underlying microchannel system of a completed printing device (white areas).
2.2.3. Channel designs and versatile patterning of biomolecular inks
Small chain peptide patterned using single-channel designs.
We used the IKVAV (Ile-Lys-Val-Ala-Val) sequence as a model small chain peptide.

34
The IKVAV sequence is a small peptide derived from the large glycoprotein laminin,
which plays an important role in various cellular processes including migration,
differentiation, attachment, and neurite extension.52-54 It more importantly has been
identified as the active recognition site in laminin and used in model form for controlling
cellular adhesion and neurite extension.55 To immobilize this sequence, the IKVAV was
modified with biotin on one end for attachment to the streptavidin-incorporating
polyacrylamide hydrogel and fluorescein isothiocyanate (FITC) on the other end for
visualization purposes.
Examples of two single channel designs and the corresponding peptide patterns
transferred to the hydrogel are presented in Figure 2.3. As can be seen from the
fluorescence micrographs, IKVAV is easily transferred to the hydrogel substrate in a
registry directly corresponding to the underlying channel design. In these images, the
concentration of streptavidin in the hydrogel was ~ 50 μg/ml which most likely explains
the halo effect seen around the transferred channel edges. When the streptavidin
concentration was increased 20 times, however, a pattern that not only had improved
resolution, but also smaller features was generated (Figure 2.3(e)) as expected for a
reaction-diffusion based capture system.56 A specific quantitative comparison of the
relationship between streptavidin concentration and printing resolution can be found in
example presented in Figure 2.4.

35
It is worth noting that the peptide-patterned hydrogels, when stored at 4°C for several
weeks, did not experience significant reduction in fluorescence intensity or diffusive
spreading of the bound peptide. This affirms that the stability of the biotin-streptavidin
affinity system permits the generation of patterned peptide substrates in advance, a
feature we found to be useful in studies of guided cell growth mediated by immobilized
peptide sequences.57 This aspect of the work is discussed below.
Polysaccharides patterned using multi-channel designs.
To further explore the printing capabilities of the system, two multi-channel designs
were tested using fluorescein and rhodamine labeled biotinylated dextrans (MW = 10
kDa) as model polysaccharides. Dextran is a hydrophilic polysaccharide that has a high
water solubility, is commonly used as both an anterograde and retrograde tracer in
neurons,58 and has been variously used as a drug delivery vehicle.59 In the results
presented in Figure 2.5, fluorescein and rhodamine labeled biotinylated dextrans were
injected into each individual channel. The printed pattern is directly related to the
underlying channel design, as well as the specific ink moved through the corresponding
microchannel. A proven channel design30 (Figure 2.5(d)) for generating complex
gradients (a mixing tree), was incorporated into the system. The two labeled dextrans
were injected into the channel system at points where the solutions are split, combined,
and mixed, to create co-localized gradients which were then transferred to the hydrogel
(Figure 2.5(e)). These data demonstrate that parallel printing of multiple substances can

36
be accomplished in a single patterning cycle. This provides a useful point of
comparison to classical μCP methods, where the patterning of multiple biomolecular inks
requires sequential inking and printing steps along with effective means of registration.
The printing platform is for this reason one we believe could be useful for creating
substrates for use in high-throughput screening methods.
Large-area protein gradients generated using a single-channel design.
A serpentine single-channel gradient generator was used to transfer a FITC and biotin
labeled polylsyine (MW = 15-30 kDa) to the hydrogel substrate (Figure 2.6). Polylysine
is commonly used to treat substrates for tissue culture to improve cell adhesion and
viability, as well as in patterned form to guide neuronal growth on planar substrates.60-62
A single channel design with an incrementally increasing channel spacing (Figure 2.6(a))
was used to create the printed concentration gradient shown in Figure 2.6(b), one
quantitatively analyzed in the data given in Figure 2.6(c). The chemical gradient
formed results from both the incremented spacing as well as the pressure drop that occurs
as the solution moves farther from the channel inlet.63 Using a single channel to pattern
a single component gradient in this way may be preferred for reasons of ease of
implementation over other more complex designs, such as the mixing-tree30 based device
shown in Figure 2.5(d). While the latter is well suited to printing multicomponent
gradients, the simpler single channel design serves as a convenient way to create well
defined grayscale patterns for chemotactic64 or haptotactic65 cell migration assays.
37
Orthogonal patterning via secondary protein exposure.
A secondary protein exposure does not overwrite the first protein pattern. The
patterns are bound stably to the gel substrates via the biotin-streptavidin linkage, which
allows a secondary patterning step to be carried out using a different biomolecular ink.
This is illustrated by the example shown in the micrograph presented in Figure 2.6(e),
which shows an initially printed pattern of FITC-polylysine-biotin. The image presented
in Figure 2.6(f) illustrates the results of a secondary exposure, an orthogonal patterning,
of rhodamine-Bovine Serum Albumin (BSA)-biotin on the same substrate. As is clearly
seen in this latter image, the secondary exposure does not fully overwrite the initial
patterning but in fact shows a significant orthogonality in the relative uptake of the BSA.
We further quantify this phenomenon showing it in a plot that highlights the blockage (of
BSA), Figure 2.7. This capability allows the substrate to be easily modified with a
second biotinylated target to provide better control of the surface properties.
Protein patterned gel substrates for neuronal guidance.
Hydrogels patterned with polylysine using the channel design presented in Figure 2.6(d)
were used to guide the growth of hippocampal neurons. The neurons can detect and
respond in accordance (Figure 2.6(g)) with the underlying polylysine pattern. As
illustrated in the contrast enhanced image in Figure 2.6(g), the neuronal processes (red)
are seen to follow along the edge of the protein pattern (green), connecting with other cell
soma (blue) as they navigate the substrate. The images reveal a general tendency for the

38
cell soma to attach near the transition boundary of the polylysine domain and propagate
dense projections of processes into it. The highlighted phenomenon is similar to the
findings presented in previous studies of neuronal guidance on polylysine patterned on
hard substrates.5,60-62 We do find that soft substrates based on polyacrylamide hydrogels
are more challenging to use given the substantial cytotoxicity of residual monomer. We
are currently developing significantly more biologically compliant gel chemistries that
will remove this sensitivity (see below).
2.2.4. Discrete features patterned using selective membrane wetting
A selective membrane wetting method can be used to advantageously extend the
patterning of discrete features using the microfluidic contact printing tool. As received
or post-modification with Ti/SiO2, PCTE membranes are hydrophobic so pores in the
membrane must be ‘wetted’ with a low surface tension solvent,25 such as isopropyl
alcohol (IPA), to initiate solution penetration. In the previous sections, the membrane
covering the channel system was wet extensively by IPA using a cotton swab (Figure 2.8),
which in turn created patterns determined explicitly by the channel design. The ‘writing’
method described here uses a capillary tube to precisely deliver the IPA wetting agent
(Figure 2.9 and Figure 2.10) to distinct membrane regions to create a secondary degree of
control on the pattern generation that operates in hierarchy with the channel design
(Figure 2.11(a, b)). We found that it is only in these selectively wetted regions where
biotinylated solutions transude through the membrane to be captured subsequently by the

39
streptavidin-incorporating hydrogel (Figure 2.11(c)). The micrograph presented in
Figure 2.11(d) shows a ’UIUC’ pattern that was ‘drawn’ on the PCTE membrane-sealed
channel system, while Figure 2.11(e) and f show the resulting transudation of a
biotinylated FITC solution through these wetted regions along with the corresponding
pattern of the FITC-biotin captured in the gel. These exemplary results suggest this
method is a versatile way to pattern substrates in the form factor of multiplexed arrays
without the requirement for a 3D integrated microfluidic delivery system.
2.2.5. Reusability and reproducibility
The plot in Figure 2.12 illustrates the recycle capability of the system and the pattern
transfer reproducibility between consecutively printed gels. The analysis was done
using fluorescein-labeled dextran with the channel design shown in Figure 2.1(d). In
order to determine an appropriate testing time, the fluorescence intensity and diameter of
the transferred patterns in relation to printing time were also investigated and found to
increase linearly as the stamping time was incremented from 0.5 to 10 minutes (Figure
2.13). This follows in accordance with a diffusive broadening of the target flux in the
gel over time. Based on these data, a 5-minute stamping time was adopted to test the
reusability and reproducibility of the printing technique. As seen from the plot given in
Figure 2.12, with inset micrographs displaying printing results from the same device at
different time points over several days, the intensity of the transferred patterns was
essentially constant over multiple printing cycles. These data affirm a broader

40
capability for the generation of uniformly patterned substrates with short cycle time and
useful copy numbers.
2.2.6. Further system modifications
The system reported in this work has significant potential to be modified, whether by
altering the channel design, membrane material selection, method of membrane wetting,
the incorporated affinity binding system, or hydrogel system used as a receiving substrate.
In our continuing work, for example, we are exploring printing platforms that are
modified to use binding schemes exploiting complementary strands of ss-DNA as well as
antibody/antigen recognition methods. The more important modification, however,
centers on new gel chemistries to replace the bench-mark polyacrylamide system used
here, ones that will significantly enhance biocompatibility in cell-based studies. We will
report on progress in this area shortly. Finally, we would like to stress the challenges
related to printing large biomolecules like proteins, which are known to have biofouling
issues caused by denaturization and agglomeration. These challenges are closely related
to the intrinsic characteristics of the inks, which in turn need to be reflected in the
optimization of system parameters like membrane selection, modification of the pore
surface chemistry, sample preparation, and flow rate control.
2.3. CONCLUSION
Microfluidic contact printing, a new patterning technique described here, combines

41
several of the desirable aspects of μCP and microfluidic patterning techniques, and
addresses some of their important limitations through the integration of a PCTE
membrane. Using this technique, biomolecules (e.g., peptides, polysaccharides, and
proteins) were printed in high fidelity on a receptor modified polyacrylamide hydrogel
substrate. The transferred pattern is primarily dictated by the design rules of the
underlying microfluidic channel system, coupled with diffusive zone spreading. The
application of a selective membrane wetting protocol, allows a versatile secondary
patterning capability. The protocols support the printing of multiple reagents without
registration steps and fast recycle times.
2.4. EXPERIMENTAL
2.4.1. Fabrication
Device fabrication
Polyvinylpyrrolidone (PVP) or PVP-free (PVPF) PCTE membranes (0.22 μm pore,
GE Osmonics Labstore, Minnetonka, MN) were carefully placed in conformal contact
with 1 mm thick PDMS slabs, which act as sacrificial support layers during surface
modification. Care was taken to minimize scratches and deformation on the membranes
throughout every step of the modification procedure, as small scratches detrimentally
affect future patterning attempts. A 50 Å adhesion layer of titanium, followed by 100 Å
of SiO2 were evaporated onto the surface of the membranes, at a rate of approximately

42
0.1 Å/s to provide a uniform surface coverage (Temescal FC-1800 electron beam
evaporator). This coverage, given the ballistic nature of the deposition method, is not
conformal to the high aspect ratio pore interiors, which remain hydrophobic. Scanning
electron microscopy (JEOL 6060LV General Purpose SEM, Tokyo, Japan) was used to
image the membrane before and after deposition. Membrane pore sizes were measured
using Image Pro Express (Media Cybernetics, Inc., Bethesda, MD) and analyzed by
Microsoft Excel (Figure 2.2).
Silicon masters were generated using the following standard photolithography
techniques.66-67 Silicon wafers were scored into desired sizes, cleaned with piranha
solution, rinsed with deionized water (Milli-Q, Millipore, Billerica, MA) and then blown
dry with nitrogen. SU8-50 (MicroChem Corp., Newton, MA) was spun-coated onto the
wafer pieces at 2900 rpm, with a ramping of 100 rpm/sec, for 30 seconds. The wafers
were pre-baked for 5 minutes at 120 ºC and patterned by exposing to UV (MJB3 Mask
Aligner, Suss Microtech, Garching, Germany) for 45 seconds. Exposed wafers were
then post-baked for 5 minutes at 120 ºC and cooled, before being developed with SU8
developer (Microchem Corp.). All patterned wafers were treated with
tridecafluoro-1,1,2,2-tetrahydrooctyl trichlorosilane (Sigma Aldrich, St. Louis, MO) for
two hours in a dessicator under vacuum, to prevent adhesion of PDMS to the fabricated
masters.
The silicon master was covered with degassed PDMS (10:1 ratio, Sylgard® 184).

43
Samples were heated at 70 ºC until PDMS was softly cured (~20 minutes), which
significantly improves irreversible interfacing between the PDMS microchannels and
supporting substrate. In the fabrication process described here, the PDMS is cured long
enough to be removed from the master, but can still be deformed when gently
manipulated with a tweezers (i.e. a small indent on the surface can be seen versus fully
cured PDMS, which cannot be deformed in such a manner). To quantitatively
characterize the experimental condition of the soft-cure, the curing ratio first proposed by
Go and Shoji was used.51 The curing ratio, R, is defined as R= ts/tf, where ts is the soft
cure time and tf is the full cure time. The full cure time, in minutes, can be calculated
based on the experimental equation log10(tf)= 3.4710 - 0.0158Ts, where Ts is the soft
cure temperature in degrees Celsius. For this system, samples were cured for 22
minutes at 70 °C, which gives a curing ratio, R, of 0.1. It should be noted that the soft
cure time depends on the amount of PDMS being cured, so longer soft cure times may be
required for larger samples.
The softly cured PDMS mold replicas were removed from the masters, and holes were
punched at the channel inlets and outlets using biopsy punches. The backside (or
unpatterned side) of the PDMS stamp and a microscope slide were permanently bonded
together, after both surfaces were treated by Corona discharge (BD-20AC with power
line filter, Electro-Mechanics, Ravenswood, IL, starting voltage 45 KV) for 40 seconds.49
The previously Ti/SiO2 modified PCTE membranes were exposed for 2 minutes to

44
Corona discharge, while the open PDMS channels (previously attached to the supporting
glass microscope slide) were exposed to Corona discharge for 40 seconds. The two
activated components were carefully placed into contact and then placed in a 70 ºC oven
to cure for at least one hour. Once curing was complete, a syringe needle (26 gauge)
that had been removed from its plastic housing, was inserted into the inlet hole (from the
sidewall of the device) and sealed with 5-minute epoxy. The device was then placed in
70 ºC oven for at least one hour to ensure that the epoxy was fully cured.
Hydrogel preparation
Microscope slides were cut into 25 mm x 10 mm pieces to serve as supports for the
hydrogel substrates. The glass pieces were cleaned with piranha solution for 20 minutes,
rinsed with Milli-Q water and dried with nitrogen. To promote adhesion between the
cleaned glass slides and the hydrogel substrate, each slide was treated with 100 μl of
3-(trimethoxysilyl)-propyl acrylate : glacial acetic acid: H2O (1:2:2, v/v) for 1hr and then
rinsed with water and then ethanol.29 The silane treated glass slides were generally used
within a few days.
Prepolymer solution was prepared containing 10% acrylamide, 0.26% N,N-methylene-
bis-acrylamid (Bis) and 0.05% N,N,N’,N’-Tetramethylethylenediamine (TEMED). A
5mg/ml solution of Streptavidin acrylamide (Invitrogen, Carlsbad, CA) in PBS was
added to the prepolymer solution in a 1:100 ratio for regular patterning experiments or in

45
a 1:5 ratio for biological studies and small feature size/high resolution patterning. A 10
wt % aqueous solution of ammonium peroxydisulfate initiator was added in a 1:50 ratio.
The pre-polymer solution was quickly distributed to the previously silane-treated glass
slides, which were placed on a PDMS slab to prevent liquid overflow. The pre-polymer
solution was covered by a glass microscope slide, with one or three #1 coverslips used as
spacers, to allow for full gelation. As prepared, the hydrogel slabs were approximately
50 µm thick (one coverslip as a spacer) or 150 µm thick (three coverslips as a spacer).
Thicker gels were used for general patterning experiments, while thinner gels were used
for cell culture studies. Once gelation was complete, typically 20 minutes, the glass
supported gels were removed from the PDMS slab, separated from the microscope slides
and stored at 4 oC in deionized water until needed.
Membrane wetting
As received and following surface modification, the PCTE membranes are
hydrophobic so must be exposed to IPA to allow solution to penetrate through the pores.
The microfluidic contact printing device was for this reason exposed to solvent in two
ways. In the first method, a cotton swab soaked in IPA was used to wet channel regions
where solution perfusion was desired (Figure 2.8) and then was immediately submerged
in water to prevent solvent evaporation. This technique was most commonly used to
wet devices used in patterning experiments. We note that, when using this wetting
technique, the best printing results were attained using PVP modified membranes.
46
In the second method, a ‘pen’ was created to ‘write’ solvent in discrete places across
the channel system covered by the PCTE membrane. As highlighted in Figure 2.9, the
‘pen’ in this setup was made by connecting fused silica capillary tubing (Dinner = 50 μm,
Douter = 150 μm, Polymicro Technologies, Phoenix, AZ) to a syringe (1 ml Norm-Ject®
Luer syringes, Henke Sass Wolf, Germany) loaded into a syringe pump (PHD 2000
programmable pump, Harvard Apparatus, Holliston, Massachusetts) using polyethylene
tubing (PE-20, Intramedic Clay Adams® Brand, Diagnostic Systems, Sparks, MD). The
capillary tubing was housed inside an empty Sharpie marker (Sharpie®, Oak Brook, IL)
shaft to facilitate handling. Prior to use, the syringe was filled with isopropyl alcohol
(IPA), which served as the ‘ink’. A PDMS channel device, fabricated as described
above, was submerged in a petri dish of deionized water. Submerging the device in
water while ‘writing’ allows for a greater working time to pattern the device, as the ‘ink’
will quickly evaporate when exposed to air. The submerged device was placed on a
sample stage that can be precisely controlled laterally and vertically. A stereoscope
(SZX7, Olympus, Melville, NY) mounted on an articulating arm boom stand was used to
observe the writing process. Before the writing process, the syringe pump was set to 1
μl/min, while flow was allowed to stabilize. The stage was slowly brought up until the
water covered the tip of the capillary tubing. At this point, the stereoscope was used to
observe the progress of IPA through the ‘pen’ tip. When the IPA reached a steady
perfusion state through the tip, a change in the refractive index between the IPA and the
water can be observed. At this time, the dish was slowly brought up further, until an

47
interface formed between the surface of the device and tip. It is important that the
capillary tip not touch the top of device, as it will tear and/or deform the membrane as it
rasters along the surface. Once the interface has formed, the desired pattern can be
written on the PDMS device, by carefully moving the stage in the x- and y-directions.
After drawing is complete, devices are submerged in deionized water. A sequence of
images that demonstrates this process can be seen in Figure 2.10.
Prior to use, and after being ‘wet’ with IPA, the microfluidic devices were degassed for
at least 20 minutes in a vacuum oven, submerged in deionized water, using the channel
outgas technique (COT) described previously.68 After degassing, devices were stored
submerged in deionized water until needed.
2.4.2. Patterning and imaging
Peptide patterning.
Biotin-Ile.Lys.Val.Ala.Val. Lys (FITC)-NH2 (Biotin-IKVAV-FITC) was synthesized by
the Biotechnology Center at the University of Illinois at Urbana-Champaign. A 100 µM
stock solution of this peptide was prepared using Milli-Q water and stored at 4 °C until
needed. The peptide solution was loaded into a syringe, connected to a single-channel
microfluidic device via PE-20 polyethylene tubing, and then loaded into a syringe pump
(1 µl/min, Harvard Apparatus, Holliston, MA). To prevent solvent evaporation, a drop
of water was placed on the membrane and covered with a cover slip. The progression of

48
the fluorescently labeled peptide through the microchannel system was tracked using a
fluorescence microscope (Epifluorescent Microscope Olympus, AX-70 with a CCD
camera Optronic MagnaFire, Melville, NY). Once flow of the labeled peptide could be
observed through the wetted channel regions (typically 5-10 minutes), the coverslip was
removed, the membrane surface was rinsed briefly with water and then blotted dry. A
streptavidin-incorporating hydrogel was placed on the channel system, after excess water
was removed, and held in place with a small weight to ensure conformal contact. Care
should be taken to avoid trapping air at the interface as this will detract from successful
patterning. Peptide pattern transfer was typically complete after 2.5 minutes. Once the
patterning was complete, the gel was removed from the device, rinsed with deionized
water and then imaged via fluorescent microscopy. All fluorescent images were
background corrected using the method described in the ESI.
Dextran patterning.
Biotinylated dextran (MW = 10 kDa) labeled with either a tetramethylrhodamine
(mini-ruby) or fluorescein (mini-emerald) (Invitrogen) were used. A 20 μM stock
solution of each labeled dextran was prepared using Milli-Q water and stored at room
temperature until needed. The dextran solutions were interfaced with the microfluidic
devices and visualized in the same way as described previously for the peptide solution.
Contact times of ~ 5 minutes typically gave high fidelity pattern transfer. Individual

49
images of the mini-ruby and mini-emerald components of the patternwere captured using
appropriate filter sets and then combined using Adobe PhotoShop (Adobe, San Jose, CA).
Protein patterning
Biotin-polylysine (MW = 15-30 kDa) was purchased from Nanocs (New York, NY)
and labeled with FITC using the EZ-Label Fluorescein Isothiocynate Protein Labeling
Kit (Pierce Biotechnology, Rockford, IL) according to the included instructions.
Typical dialysis methods were used to remove the excess FITC reagent. Biotinylated
Bovine Serum Albumin (BSA) was purchased from Pierce Biotechnology and
functionalized with NHS-rhodamine (Pierce Biotechnology) as per the included
instructions. Once the labeling was complete and the excess dye had been removed, the
protein solutions were stored at 4 ºC until needed.
Polylysine solution, 2 mg/ml in Milli-Q water, was prepared and then degassed in a
vacuum oven. After the solution had been degassed, it was interfaced with the
microfluidic device in the same way as described above. For these patterning attempts,
the flow rate was set to either 0.5 or 1 µl/min depending on the channel design. It was
found that higher flow rates were better for creating gradients as the printed pattern
resolution decreased with an increasing flow rate. For printing discrete features, lower
flow rates are desirable (less than or equal to 0.5 µl/min). Printing protein patterns
typically require longer contact time (15-30 minutes) depending on channel design.

50
Patterned gels were stored in PBS buffer overnight at 37 ºC to remove any unbound
protein and then transferred to 4 ºC for further storage.
For the secondary patterning of BSA, approximately 100 µl of rhodamine and biotin
labeled BSA (1mg/ml in Milli-Q water) was placed on top of the polylysine patterned gel
and allowed to adsorb for 1 hour. The gel slab was rinsed with deionized water, placed
in fresh deionized water at 37 ºC for several hours and then imaged.
Hippocampal neuron culture and imaging
Primary hippocampal neurons were used to highlight a potential application for
patterned gels created using this platform—guided cell growth. The cell plating
procedure and immunocytochemistry protocol used are similar to those published
previously.69
Prior to use in culture, patterned polylysine gel slabs were sterilized by exposure to 0.1%
Gentamicin (Invitrogen) PBS solution for 2 hours 29 before being transferred to a petri
dish of fresh sterile PBS, where they were stored overnight at 4 ºC.
The cell plating procedure used is similar to one published previously.69
Hippocampal neurons were isolated from post-natal day one (P1) Long-Evans rats. All
experiments were conducted under protocols approved by the UIUC Institutional Animal

51
Care and Use Committee of the Vice Chancellor for Research, and under continuous
supervision of the campus veterinarian staff. The gels were plated at an initial density
of approximately 150 cells/mm2. Neuronal samples were maintained in a humidified
environment at 37 ºC with 5% CO2 and supplemented with Neurobasal media twice
weekly for one week.
After 7 days in culture, neuronal samples were prepared for fluorescent imaging using
the same method presented previously.69 Samples were treated with DAPI (Invitrogen)
to stain the DNA in the nucleus blue, while rhodamine-phalloidin (Invitrogen) was used
to stain the actin in the cytoskeleton red. All fluorescent microscopy was carried out
using a Zeiss Axiovert 200M inverted research-grade microscope. A
Dapi/Hoechts/AMCA filter (Chroma Technology, Rockingham, VT) was used for the
DAPI imaging, a Special Yellow Rhodamine/Cy3/Texas Red filter (Chroma Technology)
was used for the rhodamine imaging, and a Piston/GFP filter (Chroma Technology) was
used to image the fluorescein.
Image background correction
All images used, either in the text or for image analysis, were background corrected in
the following manner, modified from method described by Model et al.70 A standard
slide was created by placing 0.1 mM fluorescein solution between a coverslip and a
microscope slide, which was subsequently imaged using fluorescence microscopy.

52
These images could then be used to highlight fluorescent intensity heterogeneity related
to the microscope and camera. Matlab (The MathWorks, Natick, MA) was used to
background correct the raw images. Using this software, RGB images were first
converted to gray scale and then each was divided by an image of the reference; corrected
images were then outputted with false coloring.
2.4.3. System characterization
Testing the device reusability and pattern reproducibility
The reusability of the device was demonstrated by patterning gels using the same
device at different time points over several days. The device, in this case, was based on
serpentine channel (width = 50 µm) that connected nine dots (diameter = 350 μm),
forming a 3x3 array as shown in Figure 2.1(d). Fluorescein labeled biotinylated dextran
(i.e., mini-emerald) was injected at 1 μl/min and the stamping time between the hydrogel
and the device was held constant at 5 minutes. Using the same device, 11 patterned gels
were created. The first 5 gels were printed on day 1, while the following 6 were printed
three days later (day 4). In between printing cycles on day 1 and 4, the device was
stored at 4 ºC in deionized water. Patterned gels were imaged, background corrected,
and analyzed using Image Pro Express. For each image, the pixels in nine
representative areas, corresponding to the nine dots patterned directly from the
underlying channel design, were sampled. The mean intensity of pixels within each
circular area was measured to represent the area intensity.

53
Typically, in a microfluidic channel, there is a drop in pressure as the distance from the
channel inlet increases.63 Thus, it might be expected that the intensity of a transferred
pattern would be directly related to the underlying location in the microchannel. In an
effort to address this phenomenon, the nine circular areas were analyzed separately by
grouping corresponding areas of the 11 consecutively printed patterns together (so there
were 9 groups in total). For each group, the mean intensity of the 11 circular areas was
determined to attain a normalization factor. This factor was then used to generate a
normalized mean intensity for the corresponding area of the pattern. The plot given in
Figure 2.12 gives the normalized mean intensity for each of the 9 regions of the pattern;
standard deviation of the intensity for each region was used to generate error bars.
Testing the time dependence relationship on transferred pattern intensity and size
The printed pattern fidelity, in terms of diameter in comparison to the original channel
design, was investigated using the channel design (Figure 2.1(d)) and setup described in
the pattern transfer reproducibility/device reusability section. In this analysis, the only
parameter that was changed was the stamping time which ranged from 0.5 to 10 minutes.
Specifically, the relationship between printing time and pattern intensity and diameter
were considered. The AOI (Area of Interest) function was used to fit the 9 transferred
dots. The normalization factor that was generated for the pattern reproducibility study
(overall mean intensity for dots 1-9 printed at 5 minutes) was used as a baseline. The

54
5-minute overall intensity was used as a baseline, as this time was most often used for
dextran patterning. The individual mean intensity for each dot was divided by this
normalization factor, to allow for strict comparison between time and intensity. Using
this ratio, the percent change from the baseline or the most typically used printing
parameters can be visualized. This data is presented in Figure 2.13, with error bars
representing the standard deviation. As shown by the highlighted plot, the intensity of the
transferred pattern increases linearly with stamping time.
The dependence of time on the size of the resulting patterns (in relation to the original
channel design) was investigated similarly. The AOI function was used to determine the
area in pixels of each of the 9 dots. An optical image of the original channel design was
loaded into Image Pro, the actual radius determined (~35 pixels) which was used to
determine the area. The determined area was subsequently used as a normalization
factor. Each individually measured area was divided by the normalization factor, to get
a ratio of the actual dot size in relation to the transferred dot. These data are plotted in
Figure 2.13, with error bars representing the standard deviation. We found that the
diameter of the printed circles increased linearly with printing ranging from 0.5 to 10
minutes. For example, the diameter of the 10 minute transfer is almost twice as large as
that of 5 minute transfer. The size of the transferred pattern depends on the diffusion
kinetics of the dextran inside the gel, the capture efficiency of the streptavidin for the
biotinylated dextran, as well as the size and conformation of the dextran itself.

55
2.5. ACKNOWLEDGEMENTS
This work was supported by the Wm. Keck Foundation and the National Science
Foundation (grant CHE0704153). We used facilities of the Center for Microanalysis of
Materials at UIUC supported by the U. S. Department of Energy, Division of Materials
Sciences under Award No. DE-FG02-07ER46471. We would like to thank Karen Weis
for her invaluable advice and guidance in regards to cell culture and Jon Ekman, Imaging
Technology Group, UIUC, for his help with cell imaging.

56
2.6. FIGURES
Figure 2.1: Device fabrication (I) and printing process flow (II-V) are schematically
represented in (a). The polyacrylamide gel (with incorporated streptavidin) is placed on
top of the sealed microchannels (II) where the biotinylated biomolecule solution can
diffuse through the PCTE membrane into the gel (III) and be captured by the streptavidin
protein (IV), to form long term gradients/patterns (V). The pore morphology after Ti/SiO2
deposition is shown in the SEM image in (b). A schematic representation of the side view
of the device is presented in (c), while the top view of a completed device is shown in the
brightfield image in (d). Scale bar in (b) is 1 μm and the smallest ruler mark in (d) is 500
μm.

57
Figure 2.2: SEM micrographs of track-etched polycarbonate membrane before (a) and
after (b) Ti/SiO2 deposition. The table presents statistical information of the pore size
analysis. The average diameter of the pore decreased about 14 nm after Ti/SiO2
deposition. Scale bar is 500 nm.

58
Figure 2.3: Patterning results for the IKVAV peptide for different channel designs
(width = 50 μm) are shown in (a) and (c). The original channel design can be directly
transferred to the gel (b), (d). In (e) two 75 μm diameter dots, on a 20 μm wide channel,
were transferred to the gel to highlight printing resolution capabilities. Scale bar is 250
μm in (b), 500 μm in (d) and 50 μm in (e).

59
Figure 2.4: Initial printing results for biotin-polylysine-FITC on polyacrylamide
hydrogels. Hydrogels in (a) and (c) were made with prepolymer solution containing 50
μg/ml and 1mg/ml streptavidin acrylamide, respectively. Line scans in (b), (d)
highlight differences in pattern resolution related to streptavidin concentration. Scale bars
are 500 μm.
Line Profile
Distance (Pixel)0 200 600 1000
0
2000030000400005000060000
Line Profile
Distance (Pixel)0 200 600 1000
0
2000030000400005000060000
Low Streptavidin Conc.
High Streptavidin Conc.In
tens
ity (a
. u.)
Inte
nsity
(a. u
.)
(a) (b)
(c) (d)

60
Figure 2.5: Patterning results for the fluorescein and rhodamine labeled dextran
solutions for the multi-channel designs highlighted in (a) and (d). The fluorescent
micrographs in (b) and (c) show that multiple biomolecules can be patterned onto the gel
in one printing attempt, directly related to the underlying channel design. The complex
mixing scheme in (d) can be used to create gradients of biomolecules like the one
pictured in (e). Scale bars are 500 μm.

61
Figure 2.6: Patterning results for the direct printing of FITC-labeled polylysine and
indirect patterning of rhodamine labeled BSA. The channel design shown in (a) can be
used to create gradients of biomolecules using a simple single channel design, which has
a fixed channel width (50 μm) and range of spacing between loops from 40 to 160 μm.
The transferred gradient shown in (b) is quantitatively represented by the line scan across
the sample, presented in (c). The single channel design in (d) was used to create a
pattern of fluorescently labeled polylysine (e) and then the substrate was exposed to a
secondary patterning of rhodamine labeled BSA (f); the secondary patterning does not
‘overwrite’ the first. Finally, the response of primary hippocampal neurons to polylysine
patterns created with the channel design in (d) is presented in (g). In this image, the
biotin-polylysine-FITC pattern appears green, while the cell nuclei (stained with DAPI)
appear blue and the cell processes (stained with rhodamine-phalloidin) appear red. Scale
bars are 500 μm in (b), (e) and (f), and 100 μm in (g).

62
Figure 2.7: (a) Fluorescent micrograph highlights initial patterning of
biotin-PDL-FITC, while (c) shows secondary exposure of biotin-BSA-Rhodamine. The
line scans in (b) and (d) quantitatively describe the initial patterning and the orthogonal
exposure, respectively. Scale bars are 500 μm.
(a)
(b)
(c)
(d)
Inte
nsity
(a. u
.)Distance (pixel)
Inte
nsity
(a. u
.)
0
21
34
Distance (pixel)0
1

63
Figure 2.8: The underlying channel design was wetted with isopropyl alcohol using a
cotton swab. The wetted device was immediately submerged in water to prevent solvent
evaporation. The color of the PCTE membrane changed from white to translucent after
wetting. Scale bar is 500 μm.

64
Figure 2.9: Experimental set-up of the writing station for selective membrane wetting.
(1) “Pen”, an empty Sharpie®
marker shaft contains fused silica capillary tubing (Dinner =
50 μm, Douter = 150 μm, see inset for an enlarged view); (2) PE-20 tubing; (3) 1 ml
syringe, loaded with isopropyl alcohol; (4) Control of lateral, vertical movement of stage;
(5) Adjustable clamp; (6) Sample stage; (7) Petri dish, with submerged device in water; (8)
Syringe pump; (9) Stereoscope.

65
Figure 2.10: Image sequences highlights selective wetting of the PCTE membrane with
isopropyl alcohol using a capillary ‘pen’, gently rastered across the membrane surface.
Membrane color changes from white to translucent after IPA exposure. Scale bar is 300
μm.

66
Figure 2.11: The secondary membrane wetting technique is schematically represented
in (a), while an optical micrograph of the ‘writing’ process is presented in (b). Solution
can diffuse out through the underlying microchannels only in the regions that have been
wetted with solvent (c). The optical micrograph in (d) shows a pattern that was ‘written’
on the membrane, while the fluorescence image in (e) shows the diffusion of the
FITC-biotin molecule through the wetted regions. The resulting pattern that was
transferred to the gel is shown in (e). Scale bars are 300 μm.

67
Figure 2.12: The plot presented here shows the system’s high pattern transfer
reproducibility over consecutive printing cycles. The first 5 data points represent
printing attempts on day 1, while the last 6 data points represent printing attempts
completed on day 4. The inset micrographs visually highlight the similarity in
fluorescence intensity between individual printing cycles. Scale bar is 500 μm.

68
Figure 2.13: The fluorescence intensity (a) and diameter (b) of the printed pattern
linearly increases, through a stamping time range of 0.5-10 minutes. In (c) a micrograph
of the printed pattern at 5 minutes is given, while the printed pattern after 10min is given
in (d). Scale bar is 500 μm.

69
2.7. REFERENCES
(1) Vo-Dinh, T.; Cullum, B. M.; Stokes, D. L. "Nanosensors and biochips: frontiers
in biomolecular diagnostics"; Sensor Actuat. B-Chem. 2001, 74, 2.
(2) Haupt, K.; Mosbach, K. "Molecularly Imprinted Polymers and Their Use in
Biomimetic Sensors"; Chem. Rev. 2000, 100, 2495.
(3) Offenhausser, A.; Bocker-Meffert, S.; Decker, T.; Helpenstein, R.; Gasteier, P. et
al "Microcontact printing of proteins for neuronal cell guidance"; Soft Matter 2007, 3,
290.
(4) Kane, R. S.; Takayama, S.; Ostuni, E.; Ingber, D. E.; Whitesides, G. M.
"Patterning proteins and cells using soft lithography"; Biomaterials 1999, 20, 2363.
(5) James, C. D.; Davis, R. C.; Meyer, M.; Turner, A.; Turner, S. et al "Aligned
Microcontact Printing of Micrometer-Scale Poly-L-Lysine Structures for Controlled
Growth of Cultured Neurons on Planar Microelectrode Arrays"; IEEE T. Bio.-Med. Eng.
2000, 47, 17.
(6) Oliva Jr., A. A.; James, C. D.; Kingman, C. E.; Craighead, H. G.; Banker, G. A.
"Patterning Axonal Guidance Molecules Using a Novel Strategy for Microcontact
Printing "; Neurochem. Res. 2003, 28, 1639.
(7) Ahn, D. J.; Jin, J. J.; Lee, G. S.; Kwon, G.; Pak, J. J. et al "Hippocampal
neuronal network directed geometrically by sub-patterns of microcontact printing (uCP)";
J. Ind. Eng. Chem. 2003, 9, 25.
(8) Cornish, T.; Branch, D. W.; Wheeler, B. C.; Campanelli, J. T. "Microcontact
Printing: A Versatile Technique for the Study of Synaptogenic Molecules "; Mol. Cell
Neurosci. 2002, 20, 140.
(9) Dertinger, S. K. W.; Jiang, X.; Li, Z.; Murthy, V. N.; Whitesides, G. M.
"Gradients of substrate-bound laminin orient axonal specification of neurons"; P. Natl.
Acad. Sci. USA 2002, 99, 12542.
(10) Wang, D.-Y.; Huang, Y.-C.; Chiang, H.; Wo, A.-M.; Huang, Y.-Y. "Microcontact

70
printing of laminin on oxygen plasma activated substrates for the alignment and growth
of Schwann cells"; J. Biomed. Mater. Res. B 2006, 80B, 447.
(11) Adler, J. "Chemotaxis in bacteria"; Science 1966, 153, 708.
(12) Carter, S. B. "Haptotaxis and the mechanism of cell motility"; Nature 1967, 213,
256.
(13) Carmeliet, P. "Mechanisms of angiogenesis and arteriogenesis"; Nat. Med. 2000,
6, 389.
(14) Turing, A. M. "The chemical basis of morphogenesis"; B. Math. Biol. 1990, 52,
153.
(15) Baier, H.; Bonhoeffer, F. "Axon guidance by gradients of target-derived
component"; Science 1992, 255, 472.
(16) Song, H.-J.; Poo, M.-M. "Signal transduction underlying growth cone guidance
by diffusible factors"; Curr. Opin. Neurobiol. 1999, 9, 355.
(17) Discher, D. E.; Janmey, P.; Wang, Y.-L. "Tissue cells feel and respond to the
stiffness of their substrate"; Science 2005, 18, 1139.
(18) Engler, A. J.; Sen, S.; Sweeney, H. L.; Discher, D. E. "Matrix Elasticity Directs
Stem Cell Lineage Specification"; Cell 2006, 126, 677.
(19) Cushing, M. C.; Anseth, K. S. "Hydrogel Cell Cultures"; Science 2007, 316,
1133.
(20) Hynd, M. R.; Turner, J. N.; Shain, W. "Applications of hydrogels for neural cell
engineering"; J. Biomat. Sci.-Polym E. 2007, 18, 1223.
(21) Kumar, A.; Whitesides, G. M. "Features of gold having micrometer to centimeter
dimensions can be formed through a combination of stamping with an elastomeric stamp
and an alkanethiol モ ink ヤ followed by chemical etching"; Appl, Phys. Lett. 1993, 63,
2002.
(22) Kumar, A.; Biebuyck, H. A.; Whitesides, G. M. "Patterning Self-Assembled
Monolayers: Applications in Materials Science"; Langmuir 1994, 10, 1498.

71
(23) Lopez, G. P.; Biebuyck, H. A.; Harter, R.; Kumar, A.; Whitesides, G. M.
"Fabrication and imaging of two-dimensional patterns of proteins adsorbed on
self-assembled monolayers by scanning electron microscopy"; J. Am. Chem. Soc. 1993,
115, 10774.
(24) Mrksich, M.; Grunwell, J. R.; Whitesides, G. M. "Biospecific Adsorption of
Carbonic Anhydrase to Self-Assembled Monolayers of Alkanethiolates That Present
Benzenesulfonamide Groups on Gold"; J. Am. Chem. Soc. 1995, 117, 12009.
(25) Garcia-Payo, M. C.; Izquierdo-Gil, M. A.; Fernandez-Pineda, C. "Wetting Study
of Hydrophobic Membranes via Liquid Entry Pressure Measurements with Aqueous
Alcohol Solutions"; J. Colloid Interf. Sci. 2000, 230, 420.
(26) James, C. D.; Davis, R. C.; Kam, L.; Craighead, H. G.; Isaacson, M. et al
"Patterned Protein Layers on Solid Substrates by Thin Stamp Microcontact Printing";
Langmuir 1998, 14, 741.
(27)Hynd, M. R.; Frampton, J. P.; Burnham, M.-R.; Martin, D. L.; Dowell-Mesfin, N.
M. et al "Functionalized hydrogel surfaces for the patterning of multiple biomolecules"; J.
Biomed. Mater. Res. A 2007, 81A, 347.
(28) Burnham, M. R.; Turner, J. N.; Szarowski, D.; Martin, D. L. "Biological
functionalization and surface micropatterning of polyacrylamide hydrogels";
Biomaterials 2006, 27, 5883.
(29) Hynd, M. R.; Frampton, J. P.; Dowell-Mesfin, N.; Turner, J. N.; Shain, W.
"Directed cell growth on protein-functionalized hydrogel surfaces"; J. Neurosci. Meth.
2007, 162, 255.
(30) Dertinger, S. K. W.; Chiu, D. T.; Jeon, N. L.; Whitesides, G. M. "Generation of
Gradients Having Complex Shapes Using Microfluidic Networks"; Anal. Chem. 2001, 73,
1240.
(31) Jeon, N. L.; Baskaran, H.; Dertinger, S. K. W.; Whitesides, G. M.; Van De Water,
L. et al "Neutrophil chemotaxis in linear and complex gradients of interleukin-8 formed

72
in a microfabricated device"; Nat. Biotechnol. 2002, 20, 826.
(32) Chung, B. G.; Flanagan, L. A.; Rhee, S. W.; Schwartz, P. H.; Lee, A. P. et al
"Human neural stem cell growth and differentiation in a gradient-generating microfluidic
device"; Lab Chip 2005, 5, 401.
(33) Jiang, X. Y.; Xu, Q. B.; Dertinger, S. K. W.; Stroock, A. D.; Fu, T. M. et al "A
general method for patterning gradients of biomolecules on surfaces using microfluidic
networks"; Anal. Chem. 2005, 77, 2338.
(34) Romanova, E. V.; Fosser, K. A.; Rubakhin, S. S.; Nuzzo, R. G.; Sweedler, J. V.
"Engineering the morphology and electrophysiological parameters of cultured neurons by
microfluidic surface patterning "; FASEB J. 2004, 18, 1267.
(35) Rhoads, D. S.; Guan, J.-L. "Analysis of directional cell migration on defined FN
gradients: Role of intracellular signaling molecules"; Exp. Cell Res. 2007, 313, 3859.
(36) Petty, R. T.; Li, H.-W.; Maduram, J. H.; Ismagilov, R.; Mrksich, M. "Attachment
of Cells to Islands Presenting Gradients of Adhesion Ligands"; J. Am. Chem. Soc. 2007,
129, 8966.
(37) Whitesides, G. M.; Ostuni, E.; Takayama, S.; Jiang, X.; Ingber, D. E. "Soft
Lithography in Biology and Biochemistry"; Annu. Rev. Biomed. Eng. 2001, 3, 335.
(38) Bernard, A.; Renault, J. P.; Michel, B.; Bosshard, H. R.; Delamarche, E.
"Microcontact Printing of Proteins"; Adv. Mater. 2000, 12, 1067.
(39) Jong, J. d.; Lammertink, R. G. H.; Wessling, M. "Membranes and microfluidics:
a review"; Lab Chip 2006, 6, 1125.
(40) Xia, Y.; Whitesides, G. M. "Soft Lithography"; Polym. Mater. Sci. Eng. 1997, 77,
596.
(41)Xia, Y.; Whitesides, G. M. "Soft Lithography"; Angew. Chem. Int. Edit. 1998, 37,
550.
(42) Rogers, J. A.; Nuzzo, R. G. "Recent Progress in Soft Lithography"; Mater. Today
2005, 8, 50.
73
(43) Kuo, T.-C.; Cannon, J., D.M.; Shannon, M. A.; Sweedler, J. V.; Bohn, P. W.
"Hybrid three-dimensional nanofluidic/microfluidic devices using molecular gates";
Sensor Actuat. 2003, 102, 223.
(44) Kuo, T.-C.; Cannon, J. D. M.; Chen, Y.; Tulock, J. J.; Shannon, M. A. et al
"Gateable Nanofluidic Interconnects for Multilayered Microfluidic Separation Systems";
Anal. Chem. 2003, 75, 1861.
(45) Flachsbart, B. R.; Wong, K.; Iannacone, J. M.; Abante, E. N.; Vlach, R. L. et al
"Design and fabrication of a multilayered polymer microfluidic chip with nanofluidic
interconnects via adhesive contact printing"; Lab Chip 2006, 6, 667.
(46) Neeves, K. B.; Diamond, S. L. "A membrane-based microfluidic device for
controlling the flux of platelet agonists into flowing blood"; Lab Chip 2008, 8, 701.
(47) Hediger, S.; Fontannaz, J.; Sayah, A.; Hunziker, W.; Gijs, M. A. M. "Biosystem
for the culture and characterisation of epithelial cell tissues"; Sensor Actuat. B-Chem.
2000, 63, 63.
(48) Chueh, B.; Huh, D.; Kyrtsos, C. R.; Houssin, T.; Futai, N. et al "Leakage-Free
Bonding of Porous Membranes into Layered Microfluidic Array Systems"; Anal. Chem.
2007, 79, 3504.
(49) Haubert, K.; Drier, T.; Beebe, D. J. "PDMS bonding by means of a portable,
low-cost corona system "; Lab Chip 2006, 6, 1548.
(50) Smith, P. J.; Owen, M. J.; Holm, P. H.; Toskey, G. A. In Electrical Insulation and
Dielectric Phenomena, 1992. Annual Report. Victoria, BC, Canada, 1992, p 829.
(51) Go, J. S.; Shoji, S. "A disposable, dead volume-free and leak-free in-plane
PDMS microvalve"; Sensor Actuat. A-Phys. 2004, 114, 438.
(52) Graf, J.; Iwamoto, Y.; Sasaki, M.; Martin, G. R.; Kleinman, H. K. et al
"Identification of an amino acid sequence in laminin mediating cell attachment,
chemotaxis, and receptor binding"; Cell 1987, 48, 989.
(53) Timpl, R.; Rohde, H.; Robey, P. G.; Rennard, S. I.; Foidart, J. M. et al

74
"Laminin--a glycoprotein from basement membranes"; J. Bio. Chem. 1979, 254, 9933.
(54) Ekblom, M.; Klein, G.; Mugrauer, G.; Fecker, L.; Deutzmann, R. et al "Transient
and locally restricted expression of laminin a chain mRNA by developing epithelial cells
during kidney organogenesis"; Cell 1990, 60, 337.
(55) Tashiro, K.; Sephel, G. C.; Weeks, B.; Sasakig, M.; Martinn, G. R. et al "A
Synthetic Peptide Containing the IKVAV Sequence from the A Chain of Laminin
Mediates Cell Attachment, Migration, and Neurite Outgrowth"; J. Biol. Chem. 1989, 264,
16174.
(56) Grzybowski, B. A.; Bishop, K. J. M.; Campbell, C. J.; Fialkowski, M.; Smoukov,
S. K. "Micro- and nanotechnology via reaction-diffusion"; Soft Matter 2005, 1, 114.
(57) Hersel, U.; Dahmen, C.; Kessler, H. "RGD modified polymers: biomaterials for
stimulated cell adhesion and beyond"; Biomaterials 2003, 24, 4385.
(58) Vercilli, A.; Repici, M.; Garbossa, D.; Grimaldi, A. "Recent techniques for
tracing pathways in the central nervous system of developing and adult mammals"; Brain
Res. Bull. 2000, 51, 11.
(59) Mehvar, R. "Dextrans for targeted and sustained delivery of therapeutic and
imaging agents"; J. Controlled Release 2000, 69, 1.
(60) Branch, D. W.; Corey, J. M.; Weyhenmeyer, J. A.; Brewer, G. J.; Wheeler, B. C.
"Microstamp patterns of biomolecules for high-resolution neuronal networks"; Med. Biol.
Eng. Comput 1998, 36, 135.
(61) Branch, D. W.; Wheeler, B. C.; Brewer, G. J.; Leckband, D. E. "Long-term
maintenance of patterns of hippocampal pyramidal cells on substrates of polyethylene
glycol and microstamped polylysine"; IEEE Trans. Biomed. Eng. 2000, 47, 290.
(62) Chang, J. C.; Brewer, G. J.; Wheeler, B. C. "A modified microstamping
technique enhances polylysine transfer and neuronal cell patterning"; Biomaterials 2003,
24, 2863.
(63) Sia, S. K.; Whitesides, G. M. "Microfluidic devices fabricated in
75
poly(dimethylsiloxane) for biological studies"; Electrophoresis 2003, 24, 3563.
(64) Nelson, R. D.; Quie, P. G.; Simmons, R. L. "Chemotaxis Under Agarose: A New
and Simple Method for Measuring Chemotaxis and Spontaneous Migration of Human
Polymorphonuclear Leukocytes and Monocytes"; J. Immunol. 1975, 115, 1650.
(65) Huttenlocher, A.; Ginsberg, M.; Horwitz, A. "Modulation of cell migration by
integrin-mediated cytoskeletal linkages and ligand-binding affinity"; J. Cell Biol. 1996,
134, 1551.
(66) Rothschild, M. "Projection optical lithography"; Mater. Today 2005, 8, 18.
(67) Ronse, K. "Optical lithography-a historical perspective"; C. R. Phys. 2006, 7,
844.
(68) Monahan, J.; Gewirth, A. A.; Nuzzo, R. G. "A method for filling complex
polymeric microfluidic devices and arrays"; Anal. Chem. 2001, 73, 3193.
(69) Hanson, J. N.; Motola, M. J.; Heien, M. L.; Gillette, M.; Sweedler, J. V. et al
"Textural Guidance Cues for Controlling Process Outgrowth of Mammalian Neurons";
Lab Chip 2009, 9, 122.
(70) Model, M. A.; Burkhardt, J. K. "A standard for calibration and shading
correction of a fluorescence microscope"; Cytometry 2001, 44, 309.

76
Chapter 3 Alkaline Dehybridization for the Discrimination
of Single Nucleotide Polymorphisms
Note: The majority of the text comes from Huaibin Zhang, Svetlana M. Mitrovski, Ralph G. Nuzzo, “A Microfluidic Device for the Discrimination of Single Nucleotide Polymorphisms in DNA Oligomers Using Electrochemically Actuated Alkaline Dehybridization”, Anal. Chem., 2007, 79, 9014-9021. Reproduced by permission of the American Chemical Society.
3.1. INTRODUCTION
Single Nucleotide Polymorphism (SNP) is a DNA sequence variation that involves one
change in a single nucleotide. As the most common type of human genetic variation,1-2
SNPs have attracted considerable interest as targets of disease diagnostics,3-5 as well as
gene markers.6-8 Due to the abundance and importance of SNPs, many detection
techniques9-10 have been developed, most of which can be divided into two broad
categories: scanning and diagnostic.11 The scanning methods are able to separate wild-
and mutant-type DNA based on their difference in mobility and/or stability. Typical
SNP detection techniques that use the scanning strategy include single-strand
conformation polymorphism (SSCP)12, heteroduplex analysis (HA)12, denaturing gradient
gel electrophoresis (DGGE)13, and denaturing high-performance liquid chromatography
(DHPLC)14. The diagnostic methods, in contrast, require that the sequence of DNA be
known prior to designing the primer. Examples of techniques using the latter diagnostic
strategy include polymerase chain reactions (PCRs)15, single-base extensions (SBE)16,
77
and ligase detection reactions (LDR)17. Most of these SNP detection techniques,
however, suffer from drawbacks associated with low throughput and (for some) high
expense.9
Miniaturization provides a way to increase throughput at lower cost because small
dimensions reduce reagent consumption while enabling an ability to do multiplex
analyses. The best example demonstrating the cost-advantages that attend
miniaturization and large scale integration is provided by the semiconductor industry,
where advances in photolithography18-19 have served to spur the progression of what is
perhaps the most powerful and sophisticated manufacturing technology ever developed.
The extension of these manufacturing methods (photolithography in particular) into the
field of DNA analysis has enabled an effective, and highly versatile platform technology
for microarray based systems.20 These devices are usually made by using light-directed
chemistry to immobilize thousands of sequence specific DNA probes onto a designated
location within a small chip;21 hundreds of SNP variations can be detected in parallel in
this way.22 The planar microarray format, however, engenders reaction kinetics that are
diffusion-limited, requiring as much as several hours to complete a hybridization
process.23 The lithographic processes used to fabricate these devices also have an
intrinsic step-sequence error rate that limits sequence homology within a “pixel”, and for
this reason the length of the sequences that can be analyzed.24 These limitations provide
one motivation to current research in the field that seeks to develop new analytical

78
platforms.25
Analytical methods based on microfluidic technologies have demonstrated their
potential in a number of diversified areas of application including biology, medicine,
chemical analysis, and missions for homeland security.26-30 Microfluidic devices offer
many distinct benefits including the ability to manipulate exceptionally small volumes of
liquid, resulting in low reagent consumption, short analysis times, and improved
sensitivity.26 These systems, in addition, can be mass-fabricated at low cost, especially
when polymer-based materials are used in their construction.31 These advantages make
microfluidics a particularly attractive platform for performing DNA analyses.32-33
This report considers a new integration and chemical actuation strategy for a μ-fl
system that can be used to analyze oligo-DNA duplexes for the presence of SNPs.
Many conventional SNP detection methods, such as SSCP34, DGGE35, LDR36, and SBE37,
have already been successfully realized in microfluidic formats.11 These microfluidic
platforms provide new opportunities for improving the analytical figures of merit as well.
For example, micrometer-scale beads coated with ssDNA probe have been utilized in
microfluidic formats to capture target ssDNA.38-40 In these systems, the necessary
hybridization time was decreased dramatically—from the period of hours required in a
planar surface microarray to as little as a few seconds.40-42 Mass transfer impacts due to
the high surface-to-volume ratio of the bead-based assay are central contributors to this

79
enhanced performance.38,41 Bead-based microfluidic devices have also been used in
SNP discrimination.43-47 In an exemplary study reported by Liu et al,43 a monolayer of
ssDNA coated beads was assembled in a microfluidic device to dynamically enhance the
capture of a target ssDNA; a subsequent treatment with formamide was then used to
discriminate a SNP. Their results suggest that the presence of SNP sequences can be
distinguished more effectively based on dehybridization than on capture/hybridization.43
The present work follows a similar strategy using, though, a different chemical
mechanism.
It is known in the literature that alkaline dehybridization is a reliable and convenient
way to denature double-stranded DNA (dsDNA) via a mechanism involving the
deprotonation of guanine and cytosine segments;48-49 at high pH (e.g., pH > 13),
essentially all such interactions are destroyed.49 High-concentration alkaline solutions
also are used to dehybridize long chain DNA sequences with high G/C content.50-51 If
the pH is held at a moderate range (e.g., pH = 11 - 13), the dehybridization process is less
strongly driven and, in some cases, reversible.48,52-53 The literature on this subject is
limited and what data, however, exist suggests that pH provides an inefficient means
through which to detect SNPs,54 as the pH range in which an essentially thermodynamic
discrimination can be made is quite narrow (ΔpH < 0.3) and likely very sequence-length
limited.

80
In a previous study, we described a microfluidic electrochemical actuator that is able to
generate precise and highly localized fluxes of high pH within a microfluidic channel
system.55 In this work, we have utilized this capacity to drive an alkaline DNA
dehybridization process and examined its capability for providing a kinetic discrimination
of the presence of a model SNP. For this purpose we exploit an indiscriminate capture
of oligonucleotide sequences by ssDNA-coated magnetic beads contained in a
microfluidic device that integrates a magnetic separator and microelectrochemical cell.
The latter is used to electrochemically generate a basic reagent with both temporal and
spatial control by performing the oxygen reduction reaction (ORR) using gas that
passively permeates the polymeric components of the device.55 The functional design
used here integrates a simplified device design that retains a capacity to electrochemically
generate transient pH values that are high enough to dehybridize DNA. By controlling
the duration of a potential pulse, and thereby the temporal/spatial profile of the OH-
concentration created by it, we were able to specifically release a single nucleotide
mismatched (MM) DNA while retaining the majority of perfectly matched (PM) DNA on
the bead. We show here that multiple hybridization/dehybridization cycles can be
carried on a single chip with excellent recapture efficiency.

81
3.2. EXPERIMENTAL
3.2.1. Materials and reagents
A PDMS prepolymer (Sylgard 184, Dow Corning, Midland, MI, mixed in a 10:1 ratio
with the curing agent) was used to fabricate the μ-fl device.56 The cylindrical
nickel-plated NdFeB magnet (d x h = 2 x 2 mm) was purchased from CMS Magnetics
(Plano, TX). Magnetic core agarose beads (20-75 μm, 6 % agarose, cross-linked with
epichlorohydrin) functionalized with glyoxal were obtained from Colloidal Science
Solutions (West Warwick, RI). Aldehyde-functionalized glass slides (VALS, Vantage
Aldehyde Slides) used in experiments described in the supplementary materials were
purchased from CEL Associates (Pearland, TX). Phosphate Buffered Saline (PBS, pH =
7.4, [H2PO4-] + [HPO4
2-] = 6.7 mM) was purchased from HyClone (Logan, UT). Silver
epoxy resin (EPO-TEK 4110) was obtained from Epoxy Technology (Billerica, MA).
Silicone adhesive (AST-RTV 27806) was purchased from Anti-Seize Technology
(Franklin Park, IL). All chemicals used were of analytical grade.
The DNA oligomers used in this study were obtained from Integrated DNA
Technologies (Coralville, IA) and are listed in Table 3.1. The amine group used to
immobilize the probe was linked to the 3’ end through a 6 carbon chain. The 5’ end of
PM target DNA was labeled with a Cal Fluor® fluorophore (λexcite = 598 nm, λemission =
617 nm). For some experiments requiring a double label, the 5’ end of MM target

82
DNAs was modified with an Oregon Green fluorophore (λexcite = 494 nm, λemission = 518
nm). All DNA oligomers were purified by HPLC by the manufacturer and used as
received. A 100 μM stock solution of the Probe DNA was prepared in PBS buffer; 100
μM stock solutions of the PM and MM target DNAs were prepared in TE buffers (10 mM
Tris, 1 mM EDTA, pH 7.5). All DNA solutions were stored in a freezer at -12 °C.
3.2.2. DNA immobilization on agarose beads
The procedure used to immobilize the Probe DNA on the beads was based on the
protocol provided by the manufacturer. In this procedure, 50 mg of agarose beads were
filtered from their aqueous suspension using a sintered glass filter and resuspended in 150
μl of a coupling solution of pH = 10 carbonate buffer containing 0.15 M NaCl and 50
mM NaCNBH3. The suspension was shaken for 15 minutes after which 10 μL of a
100 μM Probe DNA solution in PBS was added and the mixture shaken for an additional
75 minutes. The suspension was held at room temperature overnight to complete the
coupling step. The Probe-linked beads were then filtered and re-suspended in 100 μL of
the coupling solution. After adding 240 μl of 0.4 % (v/v) ethanolamine aqueous
solution, the mixture was vigorously shaken for 1 hour to block the unreacted aldehyde
sites on the beads. The beads were then filtered, washed copiously with 18 MΩ milli-Q
water, and resuspended in water (containing 0.03 % NaN3 as a preservative).

83
3.2.3. Microfluidic device fabrication
The fabrication procedure for the microfluidic device used in this study is depicted
schematically in Figure 3.1(a). In step (i), a nickel-plated NdFeB cylindrical magnet
(the separator) was conformally attached to a flat PDMS membrane (previously cured
for > 48 h). A Pt thin-film working electrode (WE) assembly, comprising a 100 nm
thick Pt layer deposited on a 15 nm Ti adhesion layer that is supported in turn by a 1
mm thick quartz slide, was fabricated using standard photolithography lift-off procedures
described elsewhere.57 The WE array was placed onto the PDMS flat, Pt-side-down, at
a distance of 5 mm from the magnet (measured from the center of the electrode to the
center of the magnet). In step (ii), the PDMS prepolymer was poured over the setup and
placed in a vacuum oven for 10 minutes to remove entrained air bubbles. The polymer
was then cured at 70 °C for 2 hours. In step (iii), the entire “sandwich” was flipped over
and the thin PDMS membrane was carefully peeled away to reveal the WE and magnet
embedded within the PDMS. The latter assembly served as the bottom layer of the
microfluidic device. The upper layer of the device (iv) consisted of a microfluidic
channel (20 mm long, 0.94 mm wide, and 0.12 mm high) that was fabricated in PDMS
using a rapid prototyping procedure.56 The ends of the PDMS channel were opened
using a 1.5 mm diameter biopsy punch to permit introduction of solution into the device
as well as to serve as access points for a Ag-wire pseudo-reference (RE) and Pt-wire
counter (CE) electrodes. The bottom and upper layers of the microfluidic device were

84
treated with UV/ozone for 5 min to promote adhesion.58 The two layers were then
sealed together irreversibly by placing them in conformal contact and heating the
assembled structure in an oven at 70 °C for 2 hours. Electrical contact to the thin-film
WE was made using silver-epoxy resin and a Pt-wire.
The microfluidic device was filled with electrolyte solution (PBS buffer) using the
channel outgas technique.59 The DNA coated magnetic beads were inserted into the
channel by applying hydrodynamic flow, which was induced by keeping the solution
levels at the ends of the channel at uneven heights. The latter procedure resulted in the
formation of a plug of beads above the embedded magnet (which in turn could be
dislodged by a steep, pulsatile increase of the flow rate or mechanically agitating the
device). The Pt-wire CE and an Ag-wire pseudo-RE were inserted into the reservoirs
and the entire assembly then placed into a box containing electrical contacts by which the
WE, CE, and RE were connected to a potentiostat (650B, CH Instruments, Austin, TX).
Figure 3.1(b) shows schematic representations of the top and side views of the assembled
device.
3.2.4. On-chip DNA hybridization and dehybridization
The immobilization of the Probe DNA (Table 3.1) on the agarose beads was effected
using the Schiff base coupling protocol schematically depicted in Figure 3.2.60 The

85
terminal amine groups on the 3’ end of the Probe were reacted with the aldehyde groups
on the glyoxal-coated agarose beads to form a C=N bond (Schiff base reaction).60 This
linkage was reduced in-situ to a more stable C-N bond by NaCNBH3. The unreacted
aldehyde sites on the beads were then blocked using ethanolamine coupled in a manner
similar to that used for the Probe DNA.
Dynamic DNA hybridizations were performed in the channel by flowing 20 μL of 1
μM PM target (Table 3.1) solution (20 pmol) over the beads at a linear displacement rate
of 9 x 10⁻³ m/sec (corresponding to a 20 min contact time for DNA hybridization). The
DNA solution that remained in the inlet reservoir was replaced with PBS buffer, which
was allowed to pass through the channel for 20 minutes to rinse away any excess PM
target in the channel. The magnetic separator served to concentrate the beads in this
flow field in the region down stream of the WE (closest to the CE).
The dehybridization reaction of the captured PM duplex was performed using base
electrochemically generated by the ORR.55 These experiments were performed under
potentiostatic control (at −0.6 V vs. Ag). The course of the dehybridization process was
monitored by fluorescence microscopy using an epifluorescent microscope (Olympus,
AX-70, Melville, NY) equipped with a CCD camera (Optronic MagnaFire). The
images were analyzed using Image Pro software (Media Cybernetics, Silver Spring, MD).

86
3.2.5. Visualization of pH profile inside the channel
The pH change resulting from the ORR inside the channel was monitored in situ by
fluorescence microscopy using fluorescein as a pH sensitive dye. The emission of the
fluorescein probe is one for which the quantum yield (Φ) is strongly pH dependent. The
value of Φ is 0.20–0.25 for the neutral molecule (pKa = 2.2) and 0.25–0.35 for the
monoanion (pKa = 4.3), while the Φ of the dianion (pKa = 6.7) is markedly larger (~
0.93).61
The channel of a device depicted by Figure 3.1(c) was filled with electrolyte (0.1 M
NaCl + 0.1 mM fluorescein, pH = 4). With the syringe pump stopped, a 34 second square
wave potentiostatic pulse at ε = -0.6 V (Ag) was applied, conditions similar to that used
to desorb a MM1 target DNA. A high emission plug was formed in the WE region during
the pulse. The entire plug was forced from the region of the WE in the direction of the
beads using a hydrodynamic flow driven by a syringe pump at a rate of 0.3 μl/sec.
Time-lapse fluorescence images at the WE region were recorded using a fluorescence
microscope in conjunction with a U-MWIB filter set. A sequence of representative
micrographs is shown in Figure 3.6. The time that the syringe pump was actuated was set
as time zero.
The number of electrons supplied by the 34 second pulse was 9.35 x 10⁻⁵ C yielding

87
9.69 x 10⁻¹⁰ mol OH-, assuming that hydroxide ions were the sole product of the ORR.
The volume of the high emission region formed in the vicinity of the WE is ~ 0.2 μl,
corresponding to a calculated average pH in the imaged plug of ~ 11.7. Since the average
pH of the plug is much larger than the pKa of fluorescein dianion (i.e., 6.7), we did not
observe any long-ranged intensity gradient along the plug.
When an external actuation was applied, the plug moved with some initial hysteresis
along the channel with a linear translation velocity of 3 x 10⁻⁵ m/sec. This accords well
with the value of 4 x 10⁻⁵ m/sec estimated using the volumetric delivery of the syringe
pump for channels with these dimensions. It is worth noting that the edge shape of the
plug becomes parabolic during the external actuation and that similar parabolic fronts are
observed in Figure 3.3(e) and Figure A.1(c) in the Appendix A.
3.2.6. Procedure for SNP discrimination
PM and MM target ssDNAs were hybridized to the Probe ssDNA using an off-chip
procedure as follows: 100 μl of the Probe-coated beads were mixed with 40 μl of 5 μM
PM (or MM) target solution. The mixture was shaken vigorously for 20 minutes at
room temperature. The beads were then separated by centrifugation, rinsed by shaking
with fresh 300 μl PBS solution for 5 minutes, after which they were separated from the
solution by centrifugation. The rinsing step was repeated three times.

88
Equal amounts of PM and MM duplex coated DNA beads were mixed together and
injected into the channel hydrodynamically, concentrating them as an intimate mixture in
the region of the magnetic separator. To complete the device, an Ag wire pseudo-RE
was pierced through the PDMS sidewall into one of the extension reservoirs (Figure
3.1(c)). A second needle, connecting to a programmable syringe pump, was also
incorporated at the location of the RE. A paste of silicone adhesive (AST-RTV 27806)
was applied to the connection point of the Ag wire (or the needle) and the PDMS sidewall,
and fastened at room temperature for 2 hours to seal any gap between the inserted object
and the sidewall. The reservoir was covered with a thin PDMS slab. The syringe
pump was used to affect a secondary external control of the fluid flow inside the channel.
The Pt-wire CE was placed into the other extension reservoir.
Hydroxide ions were generated at the WE by a series of potentiostatically applied
current pulses at E = −0.6 V, the duration of which was varied between 15 to 50 s. The
plug of base generated in this way was passed through the channel in the direction of the
duplex coated beads at a flow rate of 0.3 μL/min using a hydrodynamic flow of a pushing
buffer that was actuated externally using the syringe pump.
The dehybridization of the duplex DNA was followed by fluorescence microscopy.
The emission of the PM target was monitored using a XF102-2 filter set (λexcite = 565 ±
30 nm, λemission = 655 ± 45 nm) while the MM targets were observed using a U-MWIB

89
filter set (λexcite = 475 ± 15 nm, λemission > 515 nm). When required, both target types
could be observed simultaneously using a XF101-2 filter set (λexcite = 525 ± 25 nm,
λemission > 565 nm); this protocol, while convenient, is relatively inefficient at collecting
intensity from the MM targets.
3.3. RESULTS AND DISCUSSION
Magnetic core agarose beads and a nickel-plated NdFeB magnetic separator were used
in this model system because they provide an efficient and relatively simple microfluidic
platform62 for testing the non-thermal MEMS-based actuation of DNA hybridization and
dehybridization processes of interest in this work. The magnetic core agarose gel beads,
functionalized with an amine-terminated Probe ssDNA using a standard glutaraldehyde
coupling protocol, have several critical functions in this device. First, they enable the
efficient collection of non-hybridized DNA fragments present in the solution and their
subsequent concentration in bound form at the region of the device where the
electrochemically mediated sorting is carried out. Second, and most important, this
configuration facilitates a chemokinetic approach to discriminate SNPs that we believe
may possess broad utility. These aspects of the device design and operation are
described below.
Figure 3.3(a) shows an image of the magnetic beads spreading uniformly through the
90
channel after their introduction into the device. Using flow to direct them to the region
of the separator, the beads aggregate above the embedded magnet, leading to the
formation of a dense plug as illustrated by the fluorescence micrograph of Figure 3.3(b).
This image was obtained after capturing a fluorescently-labeled target ssDNA as
described in next section.
The magnetic beads can be dislodged from the separation region and released to the
channel using either external mechanical agitation or a pulsatile high flow rate of the
buffer. In this design, the balance of the shear and magnetic forces is used to
discriminate whether the beads are retained or washed away from the magnetic separator.
This simple design complements a related approach described by others that employs a
variable force magnetic separator.63
3.3.1. On-chip DNA hybridization
The capture of a fluorescently labeled, PM ss-target sequence (Table 3.1) by the
bead-immobilized probe sequence proceeds efficiently in the μ-Fl device. Such capture
strategies have been well studied and excellent discussions on this aspect are available in
the literature.40-41 As the image of Figure 3.3(b) shows, the plug of packed beads serves
as an efficient platform for hybridization-based capture, and provides a signal level for
the duplex relative to the background that is quite high (here for the capture of 20 pmol of

91
target ss-DNA by a factor of 23). These performance metrics are vastly superior to
those obtained with this same microscope for a device integrating a planar functionalized
glass surface to effect the DNA hybridization (device fabrication procedure and
dehybridization images are in Appendix A). We also found that the on-chip
hybridization performed using the supported bead device configuration yielded faster
kinetics, a result likely due to its higher total surface area as compared to a planar glass
surface assay.41,64
We should note here that the extent of nonspecific adsorption of the various DNAs on
the agarose beads is insignificant as revealed by control experiments carried out using
both on-chip and off-chip hybridization protocols. In both cases, the nonspecific
adsorption of a 21-base sequence showing no sequence homology was significantly lower
than the specific adsorption of a sequence with either a SNP or full complementarity
(Figure 3.4). This is not a surprising result given the fact that agarose gels have been
extensively used as inert matrices in electrophoresis65-66 and chromatography67 to
separate various DNA65,68, RNA69 and protein analytes67,70-71.
3.3.2. Alkaline dehybridization
The immobilized PM duplex was dehybridized successfully using a transient high
concentration flux of OH- that was generated electrochemically at the WE. In this

92
experiment, the Pt-WE was polarized cathodically by applying a potential step from the
open circuit potential (OCP) to −0.6 V (corresponding to an ~ 3 μA ORR current)55 and
the course of the DNA dehybridization process followed by fluorescence microscopy.
The micrographs presented in Figure 3.3(c-e) show images taken in the area of the beads
(down stream of the WE) at times of 300, 330, and 400 s after the beginning of the
potential step at the WE. In this experiment no external flow field is applied. In this
mode of operation, the base generated at the WE spreads spontaneously through the
channel, doing so at a rate that is faster in the direction of the CE. This intrinsic quality
of the device’s actuated flow dynamics follows from a balance of the directional flow that
is driven by the Faradaic current (towards the CE) and diffusive transport as described in
a previous report.55 The sequence of images shown in Figure 3.3(c-e) reveals that
dissociation of the target ssDNA, and its detachment from the beads, proceeds along the
direction corresponding to the motion of the OH- front generated at the Pt-WE. As the
target DNA is swept from the magnetically entrained beads, a fluorescent stream is seen
to move from the WE towards the CE compartment.
It should be noted that under these conditions the pH of the solution in the channel is
quite high. Assuming that the value of the total electrical charge generated during a 5
min current pulse at E = −0.6 V is directly proportional to the amount of hydroxide ions
generated at the WE, from the known volume element of the device lying between the
WE and the magnet (0.94 mm x 0.12 mm x 5 mm = 0.56 μL), we estimate that the

93
average value of the pH within segment of the device is equal to a pH ~ 12 (we assume
for this calculation that hydroxide ions were the sole product of the ORR, i.e. that the
number of exchanged electrons per O2 molecule is equal to 472. We conducted several
off-chip control experiments, using basic buffers of known pH, and found that the
dehybridization reaction for duplexes of this size proceeded to completion as long as an
alkaline buffer of pH = 11 or greater is used. We also found that the time needed to
effect a complete dehybridization from the beads decreased with increasing the pH of the
solution. In one particularly informative control experiment in which a PM duplex
coated glass slide was immersed in a pH = 11 buffer, we found that it took 11 s for the
fluorescence intensity to decrease (by loss of the labeled strand to and dilution in the bulk
of the buffer) by 40 % of the initial value. When a more alkaline (pH = 13) buffer
solution was used, however, the fluorescence intensity decreased to the background level
nearly instantaneously (within a few seconds of its introduction into the basic solution).
Additional experiments also suggested that these pH dependent rate sensitivities are also
influenced by the sequence complementarity, specifically that the rate of displacement of
a mismatched sequence were in fact faster—a feature exploited below as the basis for a
protocol for SNP detection.
It should be pointed out that the PDMS used in the device serves as a passive source of
O2 for the embedded electrochemical cell. The efficiency of this device results from
both the high solubility and diffusivity of O2 in this material, which are higher in PDMS

94
than they are in water, as well as the design rules of the device being in a range where
those beneficial aspects can be exploited. These issues, which have consequential
impacts on device design, have been examined in detail and quantitatively discussed in an
earlier report.55
The alkaline dehybridization performed in the way described above possesses a
number of potential advantages. In contrast to the more commonly used method of
so-called thermal melting, alkaline dehybridization does not require the integration of
heating elements onto the chip, eliminates the necessity of precise thermal control and
isolation, allows the use of heat sensitive reagents, and increases device power efficiency
by obviating thermal dissipation. The passive reagent foundation of the method also
eliminates the need for components that provide an external supply of the dehybridization
reagent (hydroxide or formamide), making it particularly attractive for use in portable
devices. Most importantly, though, the on-chip generation of hydroxide allows the base
to be generated in a localized manner with a coupled ability to fine tune the temporal and
spatial profiles of the hydroxide ions released using programmed current pulses in
conjunction with an externally actuated device flow.
3.3.3. SNP discrimination via alkaline dehybridization
We used the alkaline dehybridization mechanism as a means to discriminate between

95
PM and MM DNA. To do so, the WE was subjected to a series of current pulses of
varying durations at a potential sufficient to drive the ORR. The region of the
magnetically held beads was monitored simultaneously by fluorescence microscopy.
Figure 3.5(a) shows a plug formed by a mixture of MM1 (green) and PM (red) DNA
duplex-coated beads before the application of the current pulse. The sequence of
micrographs in Figure 3.5(a-d) illustrate that these two DNA complexes can be
discriminated effectively using a sequence of current pulses of varying duration. The
sample for this model demonstration was a mixture comprised of equal amounts of
independently prepared PM (red) and MM1 (green) duplex-coated beads. The image of
Figure 3.5(a) shows the collection of this mixture of beads from a flowing stream (an
externally actuated linear displacement relocation of 9 x 10⁻³ m/sec) in the form of a
closely packed plug in the region above the embedded magnet.
The system was then interrogated using a stop-flow program correlated with a series of
cathodic pulses applied at the WE upstream of the bead bed. The response is illustrated
in the series of images given in Figure 3.5(b-c). In these experiments, a plug of
hydroxide ions (Figure 3.6) was generated by the application of the cathodic current
pulse(s) at the WE (located outside of field of view on the left side of the frame in Figure
3.5(a-d)) with the flow stopped, after which the entire plug of base was forced from the
region of the WE in the direction of the beads using a hydrodynamic flow of buffer (~ 4 x
10-5 m/sec) driven by a syringe pump. The image shown in Figure 3.5(b) is a

96
fluorescence micrograph taken after an alkaline plug generated by a 34 s square wave
potentiostatic pulse at ε = -0.6 V (Ag) had passed the bead plug. One sees from this
image that this exposure to base substantially depletes the MM1 DNA while only
minimally affecting the red intensity that corresponds to PM DNA duplex.
The application of two additional potentiostatic current pulses leads to a nearly
complete removal of the MM1 DNA; the red intensity, though diminished, evidences a
selectivity favoring the retention of the PM-DNA (Figure 3.5(c)). The exhaustive
desorption of the PM DNA requires a more extensive exposure to high pH. An intensity
analysis of Figure 3.5(c) reveals that the sequence of three 34 s potentiostatic current
pulses decreases the red intensity (and its correlated population of PM-DNA) to ~ 67 %
of its initial value. The application of a fourth, slightly longer, pulse (36 s) led to a
further reduction to ~ 17 % of the initial red intensity. One additional pulse lead to a
nearly complete desorption of the PM DNA via the alkaline-mediated dehybridization,
the measured red intensity being < 5 % of its initial value (Figure 3.5(d)).
The graph presented in Figure 3.5(e) treats the trends in the data described above more
quantitatively. The composite figure shows plots of total intensity (red + green) as well
as a ratio of red and green intensities as a function of the total charge generated by the
potentiostatic pulses. The data used to construct these plots were measured in a separate
set of experiments using excitation and collection protocols selective for the high

97
sensitivity detection of each duplex form, as the fluorescence intensities used to construct
the composite images of Figure 3.5(a-d) are too low to quantify accurately.
The latter data (Figure 3.5(e)) reveal that the total (red + green) intensity decreases
progressively with the increasing amount of cathodic charge passed in the cell via the
ORR. This suggests that a progressive desorption of target DNA strands from the
probe-conjugated beads (via alkaline dehybridization) occurs during the course of the
experiment. The ratio of the red and green intensities, corresponding to the changing
proportion of PM and MM1-bearing DNA duplexes in the bead plug increases
dramatically—reaching a limiting value that is about 70 times that of the initial value.
The subsequent decline noted in this ratio reflects the ultimate depletion of the PM-DNA
(and the decay of the PM-intensity level to that of the background). Though far from
optimized, these data demonstrate that alkaline dehybridization, driven in a pulsatile form,
can effect a kinetic discrimination of a SNP—doing so here for a single-base mismatch in
a 21-base-long sequence.
We tested the discrimination protocol on two additional ssDNA targets (MM2 and
MM3, Table 3.1). Each forms a single mismatch with the probe ssDNA. The resulting
SNPs, however, differ from the one formed by MM1 in terms of not only the type of the
mismatched pair but also the location of the SNP. Compared to the C•T pair that was in
the center of the MM1-probe duplex, MM2 resulted in a G•T mismatched pair that was

98
three-bases away from the 3’ end, while MM3 formed an A•G mismatched pair localized
at three-bases away from the 5’ end. As illustrated by a sequence of fluorescence
micrographs (Figure 3.7), the method is able to selectively dehybridize MM2 and MM3
from a mixture of mismatched and perfectly matched DNA duplex-beads.
3.3.4. Recapture efficiency of the beads
We examined the recapture efficiency of this system, and its stability, by performing
repetitive hybridization/dehybridization cycles on a single plug of beads. In one
representative experiment, six hybridization/dehybridization cycles were performed to
test the recapture efficiency for a PM target ss-DNA and the processes monitored by
fluorescence microscopy. These data are presented in Figure 3.8, which shows a plot of
the fluorescence intensities measured after each capture (C1-C7) and release (R1-R6)
step. The signal/background ratio measured over a common rectangular area at the
leading edge of the plug (illustrated by the 0.4 x 0.75 mm box overlaying micrograph C1)
was used to construct this plot. Representative fluorescence micrographs taken at
different stages of the process are also shown. These results illustrate the
reproducibility of the in-device DNA hybridization/dehybridization reactions over
replicate capture and release cycles, demonstrating that multiple analyses can be carried
out using a single set of agarose beads. We note that the slight variations seen in this
experiment are likely due to a rearrangement of beads that is driven by the hydrodynamic

99
flow over the course of the experiment. Evidence of such rearrangements can be seen in
the micrographs (C1 and C5) shown in Figure 3.8.
3.4. CONCLUSION
A hybrid-PDMS microfluidic device embedding a microelectrochemical reactor can be
used to discriminate SNPs in a 21-base oligonucleotide via an electrochemically-actuated
alkaline dehybridization process. The system exploits a passive reagent delivery design,
using the O2 that readily permeates the PDMS structures of the device as the precursor
for OH- generated via the ORR.
The SNP discrimination mechanism, as currently embodied in this device design,
exploits the impacts of mass-transfer effects on the sequence-sensitive kinetics of alkaline
dehybridization. At this point, the design of the device is far from optimized and one can
envision several areas where subsequent improvements might be made. First, we used
an arbitrary limit of ~ 1 hour to complete one cycle of the on-chip
hybridization/dehybridization in the present work. This cycle time can be dramatically
improved because of the rapid kinetics intrinsic to the bead-based systems employed here.
Second, a relatively high concentration (10-6 M) of the target DNA was used in the
hybridization step for convenience. We believe that the device should be able to detect
concentrations that are orders of magnitude lower than this value. The sensitivity of the
device is mainly limited by the efficiency of bead-based systems and the capabilities of

100
fluorescence microscopy, both of which has been well studied and known to be extremely
sensitive. In addition, the sensitivity can be improved further by coupling the device
with a DNA amplification module. Third, a purification factor of 70x was achieved by
this simple design. The pulsatile release of the OH- here uses a reagent that is generated
at a single electrode, a design that we believe innately limits the nature of the pH profiles
(temporal and spatial) that can be programmed. Alternatively, an array system
integrating individually addressable electrodes should enable a more precise control over
the kinetics of multiple base triggered reactions. Developing such designs, however,
will require a deeper understanding of the dynamics and chemical sensitivities of the
alkaline dehybridization of oligo-DNA duplexes. Such understandings, we believe, will
lead to device design rules that can exploit this sensitivity in technologically useful ways.
3.5. ACKNOWLEDGEMENTS
This work was supported by the National Science Foundation (CHE0097096) and
used facilities of the Center for Microanalysis of Materials at UIUC supported by the U.S.
Department of Energy, Division of Materials Sciences under Award No.
DEFG02-91-ER45439. The authors gratefully acknowledge useful discussion with Dr.
William Childs during the early stages of this project.

101
3.6. FIGURES AND TABLE
Figure 3.1: Schematic presentation of (a) the fabrication procedure, (b) the top and side
views of the assembled device, and (c) the side view of an assembled device when a
programmable syringe pump is incorporated to actuate flow.

102
Figure 3.2: Schematic representations of the DNA (i) immobilization, (ii) hybridization,
and (iii) dehybridization procedures.

103
Figure 3.3: (a) An optical image of magnetic agarose beads inside the channel of a
model device. (b) Fluorescence micrograph of a plug of PM duplex coated magnetic
agarose beads positioned above the embedded magnet. The PM target was dynamically
captured by the Probe using an on-chip protocol. (c-e) Fluorescence micrographs of the
PM duplex coated agarose beads taken at 300 s (c), 330 s (d) and 400 s (e) after the
beginning of the potential step at the WE.

104
Figure 3.4: Fluorescence micrographs of control experiments examining the relative
importance of nonspecific adsorption of various analytical DNA samples on probe
conjugated beads, studies carrying out using both in situ and ex situ hybridization
protocols as described in the experimental methods. In these experiments fluorescence
micrographs were recorded after mixing the probe-conjugated agarose beads with either a
fully noncomplementary DNA (FNC-DNA: (a) and (b) above) and Target DNA
containing a SNP ((c) and (d) above). The fully noncomplementary DNA used here had
the structure: 5’-Oregon Green 488-TCA GAG CAT ATA AAG TGA GGT -3’.

105
Figure 3.5: Fluorescence micrographs of a mixed plug of PM (red) and MM1 (green)
conjugated magnetic core agarose beads bearing a covalently linked 21 base sequence.
The image in (a) corresponds to the starting plug, one formed from the capture of an
equal mixture of beads bearing PM and MM1 duplexes. The images in (b-c) show the
progressive alkaline dehybridization and elution of the ss- MM1 and PM targets using
pulsatile infusions of high pH generated by the ORR. The image in (d) illustrates the
exhaustive desorption of the ss-PM target via an exposure to a slightly higher pH. The
plots in (e) show the total intensity (red + green), and a ratio of red and green intensities
as a function of the total OH- generated by the potentiostatic pulses.

106
Figure 3.6: A sequence of fluorescence micrographs showing the electrochemical
generation of a high pH plug (pH ~ 11.7) and its pressure driven motion as visualized
using fluorescein as a pH sensitive dye. The region of high emission intensity
corresponds to a high pH zone created in the vicinity of an embedded Pt working
electrode. The edges of the plug assumed a parabolic shape when it is pushed by a
syringe pump at a rate of 3 x 10⁻⁵ m/sec using a flow of 0.3 μl/min (here in the direction
of the bead bed lying out of the view toward the left side of the image). The
electrochemically driven fluid motion6 is relatively small under the conditions used given
the rather large cross sectional area of this device’s channel system. The micrographs
reveal that there is some hysteresis in the actuation of the pressure driven flow, one we
believe to be related to a backpressure created by the bead plug. The time that the syringe
pump was actuated was set as time zero.

107
Figure 3.7: Fluorescence micrographs of a mixed plug of PM and MM conjugated
magnetic core agarose beads bearing a covalently linked 21 base sequence. MM2 was
used in the images (a)-(c) and MM3 was used in the images (d)-(f), respectively. The
images in (a) and (d) correspond to the starting plugs, ones formed from the capture of an
approximately equal mixture of beads bearing PM and MM duplexes. The images in (b)
and (e) illustrate selectivity in the alkaline dehybridization of the ss- MM and PM targets
using pulsatile infusions of high pH generated by the ORR. The images in (c) and (f)
illustrates the exhaustive desorption of the ss-PM target via an exposure to a slightly
higher pH.

108
Figure 3.8: A plot of fluorescence intensity as a function of the number of PM-DNA
capture (C1-C7) and release (R1-R6) cycles. The signal/background ratio was measured
after each hybridization and dehybridization procedure over a common rectangular area
residing at the leading edge of the agarose bead plug.

109
Table 3.1: Oligonucleotide sequence used in SNP analysis experiments
Name Sequence
Probe
PM Target
MM1 Target
MM2 Target
MM3 Target
5’-CCT GGG AAA GTC CCC TCA ACA -C6-NH2-3’
5’-Cal Fluo 610-TGT TGA GGG GAC TTT CCC AGG-3’
5’-Oregon Green 488-TGT TGA GGG TAC TTT CCC AGG-3’
5’-Oregon Green 488-TGT TGA GGG GAC TTT CCT AGG-3’
5’-Oregon Green 488-TGT GGA GGG GAC TTT CCC AGG-3’

110
3.7. REFERENCES
(1) Sachidanandam, R.; Weissman, D.; Schmidt, S. C.; Kakol, J. M.; Stein, L. D. et
al "A map of human genome sequence variation containing 1.42 million single nucleotide
polymorphisms"; Nature 2001, 409, 928.
(2) Wang, D. G.; Fan, J.-B.; Siao, C.-J.; Berno, A.; Young, P. et al "Large-Scale
Identification, Mapping, and Genotyping of Single-Nucleotide Polymorphisms in the
Human Genome"; Science 1998, 280, 1077.
(3) Kruglyak, L. "Prospects for whole-genome linkage disequilibrium mapping of
common disease genes"; Nat. Genet. 1999, 22, 139.
(4) McCarthy, J. J.; Hilfiker, R. "The use of single-nucleotide polymorphism maps
in pharmacogenomics"; Nat. Biotechnol. 2000, 18, 505.
(5) Kassam, S.; Meyer, P.; Corfield, A.; Mikuz, G.; Sergi, C. "Single nucleotide
polymorphisms (SNPs): History, biotechnological outlook and practical applications";
Curr. Pharmacogenomics 2005, 3, 237.
(6) Stoneking, M. "Single nucleotide polymorphisms: From the evolutionary past";
Nature 2001, 409, 821.
(7) Kruglyak, L. "The use of a genetic map of biallelic markers in linkage studies";
Nat. Genet. 1997, 17, 21.
(8) Hacia, J. G.; Fan, J. B.; Ryder, O.; Jin, L.; Edgemon, K. et al "Determination of
ancestral alleles for human single-nucleotide polymorphisms using high-density
oligonucleotide arrays"; Nat. Genet. 1999, 22, 164.
(9) Syvanen, A.-C. "Accessing genetic variation: genotyping single nucleotide
polymorphisms"; Nat. Rev. Genet. 2001, 2, 930.
(10)Weber, J.; Barbier, V.; Pages-Berhouet, S.; Caux-Moncoutier, V.; Stoppa-Lyonnet,
D. et al "A High-Throughput Mutation Detection Method Based on Heteroduplex
Analysis Using Graft Copolymer Matrixes: Application to Brca1 and Brca2 Analysis";
Anal. Chem. 2004, 76, 4839.

111
(11) Handal, M. I.; Ugaz, V. M. "DNA mutation detection and analysis using
miniaturized microfluidic systems"; Expert Rev. Mol. Diagn. 2006, 6, 29.
(12) Nataraj, A. J.; Olivos-Glander, I.; Kusukawa, N.; W. Edward Highsmith, J.
"Single-strand conformation polymorphism and heteroduplex analysis for gel-based
mutation detection"; Electrophoresis 1999, 20, 1177.
(13) Gelfi, C.; Righetti, S. C.; Zunino, F.; Torre, G. D.; Pierotti, M. A. et al "Detection
of p53 point mutations by double-gradient, denaturing gradient gel electrophoresis";
Electrophoresis 1997, 18, 2921.
(14) Underhill, P. A.; Jin, L.; Lin, A. A.; Mehdi, S. Q.; Jenkins, T. et al "Detection of
Numerous Y Chromosome Biallelic Polymorphisms by Denaturing High-Performance
Liquid Chromatography"; Genome Res. 1997, 7, 996.
(15) Germer, S.; Higuchi, R. "Single-Tube Genotyping without Oligonucleotide
Probes"; Genome Res. 1999, 9, 72.
(16) Kuppuswamy, M. N.; Hoffman, J. W.; Kasper, C. K.; Spitzer, S. G.; Groce, S. L.
et al "Single Nucleotide Primer Extension to Detect Genetic Diseases: Experimental
Application to Hemophilia B (Factor IX) and Cystic Fibrosis Genes"; Proc. Natl. Acad.
Sci. U.S.A. 1991, 88, 1143.
(17) Barany, F. "Genetic Disease Detection and DNA Amplification Using Cloned
Thermostable Ligase"; Proc. Natl. Acad. Sci. U.S.A. 1991, 88, 189.
(18) Okazaki, S. "Resolution limits of optical lithography"; J. Vac. Sci. Technol. B
1991, 9, 2829.
(19) Ronse, K. "Optical lithography-a historical perspective"; C. R. Physique 2006, 7,
844.
(20) Heller, M. J. "DNA microarray technology: Devices, systems, and applications";
Annu. Rev. Biomed. Eng. 2002, 4, 129.
(21) Ramsay, G. "DNA chips: State-of-the-art"; Nat. Biotechnol. 1998, 16, 40.
(22) Syvanen, A. C. "Toward genome-wide SNP genotyping"; Nat. Genet. 2005, 37,

112
S5.
(23) Schena, M.; Shalon, D.; Davis, R. W.; Brown, P. O. "Quantitative Monitoring of
Gene Expression Patterns with a Complementary DNA Microarray"; Science 1995, 270,
467.
(24) Dufva, M. "Fabrication of high quality microarrays"; Biomol. Eng. 2005, 22,
173.
(25) Ng, J. K.-K.; Liu, W.-T. "Miniaturized platforms for the detection of
single-nucleotide polymorphisms"; Anal. Bioanal. Chem. 2006, 386, 427.
(26) Whitesides, G. M. "The origins and the future of microfluidics"; Nature 2006,
442, 368.
(27) Reyes, D. R.; Iossifidis, D.; Auroux, P.-A.; Manz, A. "Micro Total Analysis
Systems. 1. Introduction, Theory, and Technology"; Anal. Chem. 2002, 74, 2623.
(28) Auroux, P. A.; Iossifidis, D.; Reyes, D. R.; Manz, A. "Micro total analysis
systems. 2. Analytical standard operations and applications"; Anal. Chem. 2002, 74,
2637.
(29) Hauptmann, P. R. "Selected examples of intelligent (micro) sensor systems:
state-of-the-art and tendencies"; Meas. Sci. Technol. 2006, 17, 459.
(30) Pumera, M.; Merkoci, A.; Alegret, S. "New materials for electrochemical sensing
VII. Microfluidic chip platforms"; Trends Anal. Chem. 2006, 25, 219.
(31) Xia, Y.; Whitesides, G. M. "Soft lithography"; Angew. Chem. Int. Edit. 1998, 37,
550.
(32) Verpoorte, E. "Microfluidic chips for clinical and forensic analysis";
Electrophoresis 2002, 23, 677.
(33) Sun, Y.; Kwok, Y. C. "Polymeric microfluidic system for DNA analysis"; Anal.
Chim. Acta 2006, 556, 80.
(34) Vahedi, G.; Kaler, K.; Backhouse, C. J. "An integrated method for mutation
detection using on-chip sample preparation, single-stranded conformation polymorphism,

113
and heteroduplex analysis"; Electrophoresis 2004, 25, 2346.
(35) Buch, J. S.; Rosenberger, F.; Highsmith, W. E., Jr.; Kimball, C.; DeVoe, D. L. et
al "Denaturing gradient-based two-dimensional gene mutation scanning in a polymer
microfluidic network"; Lab Chip 2005, 5, 392.
(36) Hashimoto, M.; Hupert, M. L.; Murphy, M. C.; Soper, S. A.; Cheng, Y. W. et al
"Ligase Detection Reaction/Hybridization Assays Using Three-Dimensional Microfluidic
Networks for the Detection of Low-Abundant DNA Point Mutations"; Anal. Chem. 2005,
77, 3243.
(37) Hebert, N. E.; Brazill, S. A. "Microchip capillary gel electrophoresis with
electrochemical detection for the analysis of known SNPs"; Lab Chip 2003, 3, 241.
(38) Verpoorte, E. "Beads and chips: New recipes for analysis"; Lab Chip 2003, 3,
60N.
(39) Seong, G. H.; Zhan, W.; Crooks, R. M. "Fabrication of microchambers defined
by photopolymerized hydrogels and weirs within microfluidic systems: Application to
DNA hybridization"; Anal. Chem. 2002, 74, 3372.
(40) Kim, J.; Heo, J.; Crooks, R. M. "Hybridization of DNA to Bead-Immobilized
Probes Confined within a Microfluidic Channel"; Langmuir 2006, 22, 10130.
(41) Fan, Z. H.; Mangru, S.; Granzow, R.; Heaney, P.; Ho, W. et al "Dynamic DNA
hybridization on a chip using paramagnetic beads"; Anal. Chem. 1999, 71, 4851.
(42) Kohara, Y.; Noda, H.; Okano, K.; Kambara, H. "DNA probes on beads arrayed in
a capillary, 'Bead-array', exhibited high hybridization performance"; Nucl. Acids Res.
2002, 30, e87.
(43) Ng, J. K.-K.; Feng, H.; Liu, W.-T. "Rapid discrimination of single-nucleotide
mismatches using a microfluidic device with monolayered beads"; Anal. Chim. Acta 2007,
582, 295.
(44) Ali, M. F.; Kirby, R.; Goodey, A. P.; Rodriguez, M. D.; Ellington, A. D. et al
"DNA Hybridization and Discrimination of Single-Nucleotide Mismatches Using

114
Chip-Based Microbead Arrays"; Anal. Chem. 2003, 75, 4732.
(45) Russom, A.; Ahmadian, A.; Andersson, H.; Nilsson, P.; Stemme, G.
"Single-nucleotide polymorphism analysis by allele-specific extension of fluorescently
labeled nucleotides in a microfluidic flow-through device"; Electrophoresis 2003, 24,
158.
(46) Taylor, J. D.; Briley, D.; Nguyen, Q.; Long, K.; Iannone, M. A. et al "Flow
cytometric platform for high-throughput single nucleotide polymorphism analysis";
BioTechniques 2001, 30, 661.
(47) Iannone, M. A.; Taylor, J. D.; Chen, J.; Li, M.-S.; Rivers, P. et al "Multiplexed
single nucleotide polymorphism genotyping by oligonucleotide ligation and flow
cytometry"; Cytometry 2000, 39, 131.
(48) Barber, R. "Alkaline denaturation of DNA and the stability of the helix";
Biochim. Biophys. Acta 1971, 238, 60.
(49) Ageno, M.; Dore, E.; Frontali, C. "The Alkaline denaturation of DNA"; Biophys.
J. 1969, 9, 1281.
(50) Luck, G.; Zimmer, C.; Snatzke, G.; Sondgerath, G. "Optical Rotatory Dispersion
and Circular Dichroism of DNA from Various Sources at Alkaline pH"; Eur. J. Biochem.
1970, 17, 514.
(51) Birnboim, H. C.; Doly, J. "A rapid alkaline extraction procedure for screening
recombinant plasmid DNA"; Nucleic Acids Res. 1979, 7, 1513.
(52) Mala, Z.; Kleparnik, K.; Bocek, P. "Highly alkaline electrolyte for
single-stranded DNA separations by electrophoresis in bare silica capillaries"; J.
Chromatogr., A 1999, 853, 371.
(53) Zimmer, C. "Alkaline denaturation of DNA's from various sources"; Biochim.
Biophys. Acta 1968, 161, 584.
(54) Sosnowski, R. G.; Tu, E.; Butler, W. F.; O'Connell, J. P.; Heller, M. J. "Rapid
determination of single base mismatch mutations in DNA hybrids by direct electric field

115
control"; Proc. Natl. Acad. Sci. USA 1997, 94, 1119.
(55) Mitrovski, S. M.; Nuzzo, R. G. "An electrochemically driven
poly(dimethylsiloxane) microfluidic actuator: oxygen sensing and programmable flows
and pH gradients"; Lab Chip 2005, 5, 634.
(56) Duffy, D. C.; McDonald, J. C.; Schueller, O. J. A.; Whitesides, G. M. "Rapid
Prototyping of Microfluidic Systems in Poly(dimethylsiloxane)"; Anal. Chem. 1998, 70,
4974.
(57) Mitrovski, S. M.; Nuzzo Ralph, G. "A passive microfluidic hydrogen air fuel
cell with exceptional stability and high performance "; Lab Chip 2006, 6, 353.
(58) Childs, W. R.; Nuzzo, R. G. "Decal transfer microlithography: A new
soft-lithographic patterning method"; J. Am. Chem. Soc. 2002, 124, 13583.
(59) Monahan, J.; Gewirth, A. A.; Nuzzo, R. G. "A method for filling complex
polymeric microfluidic devices and arrays"; Anal. Chem. 2001, 73, 3193.
(60) Peelen, D.; Smith, L. M. "Immobilization of amine-modified oligonucleotides on
aldehyde-terminated alkanethiol monolayers on gold"; Langmuir 2005, 21, 266.
(61) Martin, M. M.; Lindqvist, L. "The pH dependence of fluorescein fluorescence";
J. Lumin. 1975, 10, 381.
(62) Pamme, N. "Magnetism and microfluidics"; Lab Chip 2006, 6, 24.
(63) Smistrup, K.; Hansen, O.; Bruus, H.; Hansen, M. F. "Magnetic separation in
microfluidic systems using microfabricated electromagnets--experiments and
simulations"; J. Magn. Magn. Mater. 2005, 293, 597.
(64) Pregibon, D. C.; Toner, M.; Doyle, P. S. "Magnetically and Biologically Active
Bead-Patterned Hydrogels"; Langmuir 2006, 22, 5122.
(65) Polsky, F.; Edgell, M. H.; Seidman, J. G.; Leder, P. "High capacity gel
preparative electrophoresis for purification of fragments of genomic DNA"; Anal.
Biochem. 1978, 87, 397.
(66) Smith, S. S.; Gilroy, T. E.; Ferrari, F. A. "The influence of agarose-DNA affinity

116
on the electrophoretic separation of DNA fragments in agarose gels"; Anal. Biochem.
1983, 128, 138.
(67) Varilova, T.; Madera, M.; Pacakova, V.; Stulik, K. "Separation Media in Affinity
Chromatography of Proteins - A Critical Review"; Curr. Proteomics 2006, 3, 55.
(68) Duro, G.; Izzo, V.; Barbieri, R. "Methods for recovering nucleic acid fragments
from agarose gels"; J. Chromatogr.: Biomed. Appl. 1993, 618, 95.
(69) Peacock, A. C.; Dingman, C. W. "Molecular weight estimation and separation of
ribonucleic acid by electrophoresis in agarose-acrylamide composite gels"; Biochemistry
1968, 7, 668.
(70) Shainoff, J. R. "Zonal immobilization of proteins"; Biochem. Biophys. Res.
Commun. 1980, 95, 690.
(71) Mateo, C.; Palomo, J. M.; Fuentes, M.; Betancor, L.; Grazu, V. et al "Glyoxyl
agarose: A fully inert and hydrophilic support for immobilization and high stabilization of
proteins"; Enzyme Microb. Technol. 2006, 39, 274.
(72) In this particular case the pH value estimated by considering the buffer effect of
the PBS was similar (to within ~ 0.1 pH units) to what we calculated using the simpler
model based on pure water due to the fact that the pulse completely overwhelms its buffer
capacity.

117
Chapter 4 Genotyping by Alkaline Dehybridization Using
Graphically Encoded Particles
Note: This chapter is adapted from a manuscript that is in preparation for Angew. Chem., Int. Ed. as: Huaibin Zhang, Adam J. DeConinck, Scott C. Slimmer, Patrick S. Doyle, Jennifer A. Lewis, and Ralph G. Nuzzo, Genotyping by Alkaline Dehybridization Using Graphically Encoded Particles.
4.1. INTRODUCTION
Single-nucleotide polymorphisms (SNPs), a type of variation that involves one change
in a single nucleotide, are the most commonly encountered and most important DNA
sequence variation..1-2 Point-of-Care (POC) diagnostic devices that discriminate SNP
genotypes3 have potential applications in global healthcare,4-5 epidemic control,6 and
forensic analysis7-8. An ideal POC device should be portable, inexpensive to fabricate,
easy to operate, and capable of rapid discrimination of multiple analytes.9-10
Miniaturization of existing bench-top discrimination methods and assay formats has yet
to adequately meet these requirements.10-11 Enzyme-assisted genotyping methods1
generally require expensive, and often chemically sensitive, reagents such as DNA
ligases or polymerases that may not be ideal for POC applications. Recent studies,
however, have shown impressive progress in developing novel non-enzymatic analysis
methods12-15, some of which show promise for the analysis of genomic DNA without
PCR amplification.16-17

118
Most non-enzymatic genotyping methods are based on allele-specific oligonucleotide
(ASO) probes which form either perfectly matched (PM) or single base mismatched (MM)
duplexes with the target.1,18 These duplexes are discriminated based on their stability
under a certain discriminating condition, most often temperature.1 One of the most
widely used methods, the so called GeneChip (Affymetrix), requires careful optimization
of the assay and reaction conditions so that a single temperature can discriminate many
SNPs on an array.19-20 Newer methods, such as Dynamic Allele-Specific Hybridization
(DASH),21-22 circumvent this challenge by monitoring the dehybridization process
dynamically in a temporal21 or spatial23 temperature gradient, in which the optimal
discrimination condition is achieved at one point of the gradient. These methods, however,
require precise temperature control with dedicated instrumentation which may not be
suitable for POC applications.
Herein, we report a non-enzymatic, isothermal, versatile, and potentially
high-throughput genotyping approach that uses an alkaline discrimination method acting
on a multiplexed particle array. SNP discrimination using alkaline dehybridization24-27
has long been neglected because the pH range in which thermodynamic discrimination
can be performed is quite narrow (ΔpH < 0.3). We have previously reported, however,
that SNPs can be discriminated by the kinetic differences exhibited in the dehybridization
of PM and MM DNA duplexes in an alkaline solution using fluorescence microscopy.28
The current work extends these observations and provides a means for implementing a

119
fully multiplexed analytical assay based on this mechanism of genotyping. We use an
alkaline-based dehybridization that provides SNP discrimination isothermally using a gel
bead sorting system that simplifies the device design, uses simple reagents (e.g., NaOH),
and enables rapid analysis. We also enhance the versatility of this technique by using a
graphically-encoded multifunctional hydrogel particle array for multiplexing.29 This
approach provides significant advantages over existing planar microarray technology,30 as
it allows for faster mass transfer, rapid probe-set modification, and potentially better
quality control.31
4.2. RESULTS AND DISCUSSION
Multifunctional hydrogel particles incorporating ASO probes in distinct regions are
fabricated using stop-flow lithography (SFL, Figure 4.1(a)).29,32-37 Three monomer
streams flow side-by-side in a microchannel (Figure 4.1(a)) in the laminar flow regime,
minimizing mixing between the distinct streams. The central stream contains 60%
polyethylene glycol diacrylate (PEGDA) loaded with an acrylate-modified dye; each side
stream contains 20% PEGDA, 40% polyethylene glycol (PEG) and a selected
acrylate-modified 21-base DNA probe. Exposing the monomer streams to a burst of UV
light through a photomask produces 2D extruded particles where the shape and encoding
of the particle (Figure 4.1(b) and (c)) are determined by the photomask. The DNA probe
regions on the particle can be visualized after hybridizing fluorescently labeled target

120
DNA (Figure 4.1(d)). When several sets of particles are mixed and injected gently into a
microfluidic channel with a PDMS dam (Figure 4.1(e)), they form a monolayer particle
array for easy visualization (Figure 4.1(f)). These particles may then be ejected out the
channel using a steep, pulsed increase of the fluid flow rate.
Using a hydrogel network as a solid support for co-polymerized DNA probes provides
an ideal environment for quantitative DNA analysis with fast kinetics, low fluorescence
background, and high target capacity.29,38 The PEGDA/PEG mixture forms a
semi-interpenetrating network39 with tunable porosity, enabling control over mass
transfer through the hydrogel-water interface.38 Fabrication in the laminar flow regime
allows immobilization of allele-specific probes in distinct regions for easy comparison,
and SFL enables high-throughput fabrication with small variation between particles
within a single batch. In this work numbers and letters are used as a graphical encoding
for straightforward identification of particles, but more complex encodings such as
barcodes may be used for machine-based identification.29
A schematic for genotyping using alkaline dehybridization and encoded particles is
illustrated in Figure 4.1(g). When particles (labeled “:2”) incorporating probes P3 and P1
are mixed with a fluorescently labeled homozygote (T1), both sides of the particle
hybridize and fluoresce if a stringency condition is not applied ((i) in Figure 4.1(g)). The
specific sequences for P3, P1, T1 and other DNAs used in this work are given in Table
121
4.1. The “colon” side of the :2 particle (i.e., P3) forms MM duplexes with a variant site in
the center, while the “label” side (i.e., P1) forms PM duplexes. Increasing the pH of the
surrounding medium results in dehybridization of the probe T1 from both sides, but the
rate at which T1 dehybridizes is (as will be shown) faster for the MM case.28 Within an
appropriate time scale and pH range, the difference in dehybridization kinetics provides
an easily measured temporal difference in the fluorescence intensity between the two
sides ((ii) in Figure 4.1(g)), which evolves until both sides dehybridize completely ((iii)
in Figure 4.1(g)). Dehybridization of the other homozygote, T3, provides a fluorescence
difference with opposite sign, while a heterozygote sample (i.e., a mixture of hybridized
T1 and T3) is expected to produce little or no difference between the two sides. The
present work demonstrates that the temporal differences in fluorescence intensity
between the two ends can be used effectively to discriminate genotypes.
To test this concept, three sets of P3/P1 particles labeled :2, :3 and :4 were fabricated,
and hybridized with synthetic DNA targets T1, T3, and a 50/50 mixture of T1 and T3,
respectively. These hybridized particles were then mixed together and injected into a
microfluidic channel for assay. Phosphate buffer (pH 11.20) was injected into the channel
at room temperature (22oC), and the fluorescence intensity of the DNA duplexes during
alkaline dehybridization was monitored using time-lapse fluorescence microscopy. The
data was normalized and background corrected by calculating a time-dependent
fluorescence retention ratio, (I(t)-Imin)/(Imax-Imin), with maximum and minimum intensities

122
calculated for each probe region. Representative profiles of the fluorescence retention
ratio are shown in Figure 4.2. As predicted, within a ~ 5 minutes dehybridization process,
a significant intensity contrast is produced between either side of particles :2 and :3 (i.e.,
Figure 4.3(a) and Figure 4.3(b)) while particle :4 showed a much weaker intensity
contrast (Figure 4.3(c)). To quantify the time-dependent intensity contrast for a given
particle, we calculated the difference in the fluorescence retention ratio (Δ) between the
“colon” and the “label” sides at all times and compared the different particle sets. The Δ
curves of the three particles sets are distinctly different (Figure 4.3(d)). The negative peak
in the Δ curve of particle set :2 reflects that the DNA duplexes at the “colon” side
dehybridize faster than the “label” side, while the positive peak in particle set :3 indicates
faster dehybridization on the “label” side.
In contrast to the single-peak behavior observed in each of the homozygous curves, the
heterozygous curve shows a more complex double-peak behavior. The Δ curve for
particle set :4 shows an initial positive peak followed by a negative peak, both with lower
magnitude than the homozygous single-peak curves. This double-peak behavior appears
to combine the behaviors observed in the two homozygous experiments, suggesting the
presence of both PM and MM duplexes on each side (Figure 4.3(c)). It is interesting to
note that the retention ratio observed on either side of the :4 particle set may be
approximated by a linear combination of the observed retention ratios in the
corresponding probe regions of the homozygous experiments(Figure 4.4). Further

123
quantitative studies are necessary to better interpret this behavior.
To simplify comparisons between the data sets we calculated the peak value Δm of each
curve (i.e., Δmax or Δmin depending the absolute magnitude); for the "double-peak"
heterozygous experiment we use the higher-magnitude negative peak. These Δm values
for each particle in the array fall into three distinct groups corresponding to the three sets,
as shown by the histogram in Figure 4.3(e). The use of Δm compensates to some extent
for various types of system heterogeneity, and can be used autonomously as a single
metric to make genotyping calls.
We performed similar experiments at 10oC and 37oC to evaluate the method’s
temperature sensitivity, and find the major difference to be in the time required to
complete an experiment. The time required for the fluorescence intensity to fall to 5% of
the initial value is approximately 60 minutes at 10 oC, 7 minutes at 22 oC, and 2 minutes
at 37 oC (Figure 4.2). Our calculated Δm, however, is relatively insensitive to changes in
temperature and remains a viable genotyping criterion. We verified statistical significance
of this result using Welch's two-sample t-test, which showed the means of each Δm
distribution to be significantly different from the other two in that experiment at 95 %
confidence Figure 4.5(a)).
The sensitivity of the dehybridization rate to temperature presents some difficulties. At

124
higher temperatures the temporal resolution of the experiment may be insufficient for
resolving the intensity contrast, while at lower temperatures the time required for
experiments is greatly increased, reducing the utility in POC settings. This suggests that
a multiplexed assay would require a detailed optimization for the different time scales
involved. There exist modified procedures that could make such optimization
unnecessary, however.
We therefore further tested this point by varying the mode of the dehybridization
protocol, applying instead a temporal pH gradient to the particle assay so that an optimal
stringency condition can be achieved for each SNP at any measurement temperature. To
generate a temporal pH gradient, we injected a 0.02M NaOH solution at an increasing
rate, mixing completely with a constant flow of water before reaching the particle assay
(NaOH injection profile and estimated [OH-] and pH values are provided in Figure 4.6).
Applying the same gradient at 10 oC, 22 oC and 37 oC for the three sets of P3/P1 particles
shows similar discrimination to the constant pH buffer, with better discrimination at high
temperature (Figure 4.5(b)). A standardized reaction condition not only minimizes the
effort in optimization, but also generates better results.
The same protocols were applied to DNAs with the SNP site located three bases from
the 5’ end of the probe strand, rather than the center (as above). We fabricated three sets
of particles incorporating probes P4 and P1 (Table 4.1), labeled :E, :F, and :K (Figure

125
4.1(f)), and hybridized separately with synthetic targets simulating three genotypes (Table
4.1, and key for Figure 4.5(d)). Both a constant pH 11.20 buffer (Figure 4.5(c)) and a pH
gradient (Figure 4.5(d)) were applied to mixed sets of these particles, and Δm was
calculated for each particle as previously described. As before, these values fall into
clearly separated groups. In each of the twelve DNA/temperature/experiment
combinations shown in Figure 4.5, the differences in distribution means are significant at
the 95% confidence level. This result is most significant given that it is well known that
SNPs located at the end of a DNA sequence are difficult to discriminate using thermal
methods.21 The clear discrimination shown here demonstrate the high sensitivity of this
kinetic-based method even in this challenging context.
We further tested this genotyping approach using a “sandwich” tagging method (Figure
4.7(a)) on three clinically relevant mutations associated with thrombotic disorders,
MTHFR (C T), Factor II (G A) and Factor V (G A).40 We fabricated three sets of
particles, labeled :M, :FII, and :FV, each containing two 21-base ASO probes for the
corresponding SNP. Probes for the wild-type sequence are always found on the “label”
side, with the mutated sequence (mut) at the “colon” side. We prepared three mixtures of
synthetic non-fluorescent target DNAs (~70 base long, Table 4.1) that simulate three
combinations of homozygous or heterozygous samples. The target mixtures were
hybridized with particle assays and rinsed ((i) in Figure 4.7(a)) before adding a mixture
of three gene-specific, fluorescently labeled, secondary probes (30-base) ((ii) in Figure

126
4.7(a)). By carrying out an alkaline gradient experiment ((iii) in Figure 4.7(a)), we were
able to straightforwardly determine the genotypes from the particle fluorescence at peak
contrasts (Figure 4.7(b)). These results correspond correctly to the target composition. We
believe this “sandwich” tagging scheme is useful for POC analysis of genomic DNA
because it does not require labeling the target DNA and increases the specificity through
two sequential hybridization steps of the sequence-specific probes. This specificity is
necessary for analyzing highly complex genomic DNA.16
4.3. CONCLUSION
We herein demonstrate alkaline dehybridization as an effective alternative to
temperature-based discrimination of SNPs. The kinetic difference of PM and MM
duplexes dehybridization under alkaline conditions is effectively measured by the
difference in fluorescence retention ratio, the peak value of which can serve as a simple
metric for genotyping. We have demonstrated the utility of a pH gradient to discriminate
target DNA sequences with different SNP insertion points over a range of temperatures,
reducing optimization requirements. We combine this technique with the use of
SFL-fabricated multifunctional encoded hydrogel particles to achieve high versatility.
With the subattomole sensitivity of the hydrogel particle system demonstrated by the
previous research,38 the approach presented here may serve as a new route for
analyzing unamplified genomic DNA.

127
4.4. EXPERIMENTAL
Microchannels for stop-flow lithography (SFL) and genotyping were fabricated by
casting polydimethylsiloxane (PDMS, Sylgard 184, Dow Corning) off of photoresist
masters. Single-layer masters for SFL channels were produced by spin-coating SU-8 50
(Microchem) at 2000 rpm for 30s, with a 5 min soft bake at 120 C, a 40 s 300 W UV
exposure through a photomask, and a 5 min post-bake at 120 C. Two-layer masters
incorporating a 40 um high dam for genotyping were similarly fabricated in two steps as
above (spin-coat at 3500 rpm for 30 s for step), with an alignment step preceding the
second exposure. PDMS elastomer and curing agent were mixed at a 10:1 ratio by weight
and poured over masters, then baked at least 3 hours at 70oC and peeled up to form the
top surface of the channel. The bottom surface of the microchannel was fabricated by
spin-coating PDMS at 1500 rpm onto a glass coverslip (Gold Seal) and baking for 6
hours at 70oC. The two surfaces were bonded by exposure to UV/Ozone for 5 minutes.
Particles were fabricated by SFL29 using three-inlet Y-junction channels in the laminar
flow regime. Applied pressures were 1 psi in the central stream and 3 psi on either side.
The central “label” stream consisted of a 60 vol% aqueous solution of poly(ethylene
glycol) diacrylate (PEGDA, Sigma Aldrich, Mn = 700) with 5 vol% photoinitiator
(Darocur 1173, Ciba) and 0.0005 wt% methacryloxyethyl thiocarbamoyl rhodamine B
(PolyFluor 570, Polysciences) as the fluorescent dye. The “probe” streams on either side

128
consisted of an aqueous solution containing 20 vol% PEGDA, 40% poly(ethylene glycol)
(Polysciences, Mn=200), 5 vol% photoinitiator and 30vol% of acrylate-modified
single-strand DNA probe (IDT DNA) at 0.15 mM in TE buffer. Solid particles were
produced by photopolymerization using UV light from an Hg lamp and a photomask
incorporating the particle label at the microscope field stop. Fabrication was carried out
with a flow time of 1 s, a pause after flow of 1 s, and an exposure time of 0.3 s. Particles
were collected in a reservoir containing a mixture of 2/3 PEGDA and 1/3 TE buffer by
volume and pipetted into microcentrifuge tubes. The particles were separated from
solution by centrifugation at 5000 rpm for 1min. They were then rinsed three times by
0.05% TWEEN20 in PBS buffer (PBST), and stored in PBST at room temperature until
use.
To carry out a genotyping experiment, standard assay particles were hybridized with
Oregon Green-488 or Alex488-tagged target DNA overnight, while sandwich assay
particles were first hybridized with a mixture of target DNA and then hybridized with
fluorescently tagged secondary DNA probes. Particle samples were then mixed and
injected gently into a microchannel (900um wide, 80um high) containing a PDMS dam
(40um high) to form a monolayer assay.
In single-buffer experiments, alkaline dehybridization was carried out by flowing over
the particles a pH 11.20 phosphate buffer at a rate of 10 ul/min. In a pH gradient

129
experiment, pH 7 deionized water was injected at a rate of 20 uL/min and allowed to mix
completely with a time-varying stream of 0.02 M NaOH using a programmable syringe
pump (PHD 22/2000, Harvard Apparatus, Holliston, MA, USA). The injection rate of
NaOH and calculated [OH-] and pH is given in Figure 4.6. Dehybridization was
monitored by a Zeiss Axiovert 200M fluorescence microscope (Carl Zeiss, Thornwood,
NY) with a home-build temperature control stage at 5x magnification and frame rates of
0.3-0.5 fps. The resulting images were analyzed using custom software in Matlab to
locate the particles and determine the intensity in probe regions.

130
4.5. FIGURES AND TABLE
Figure 4.1: (a) Stop-flow lithography (SFL) is illustrated, in which we photocure
co-flowing PEG-based monomer streams to produce multifunctional encoded hydrogel
particles (b, c) which contain DNA probes on either side and a fluorescent dye in the
center. Probe regions are visualized by fluoescence microscopy (d) after hybridization
with Alex-488-labeled target DNA. Particles are immobilized by a dam in a microfluidic
channel (e) to form a multiplexed particle assay (f). (g) illustrates a genotyping scheme
using these particles in an alkaline dehybridization protocol.

131
Figure 4.2: Retention ratio of each side and delta are plotted versus time for each type
of P3/P1 particle, at increasing temperatures. Note that while the visible difference
between the retention ratio curves becomes more difficult to discern at higher
temperatures, the peak in delta remains a reliable indicator.

132
Figure 4.3: Three batches of particles containing allele-specific probes P1 and P3
(5’-CCTGGGAAAGT(C/A)CCCTCAACA-3’, alternatives shown in parentheses) form
PM or MM duplexes on either end of particle when they hybridize, respectively, with
synthetic DNA targets T1 (a), T3 (b), and a 50/50 mixture of T1 andT3 (c), simulating
three possible genotypes. A time-dependent difference in fluorescence retention ratio, Δ,
across each particle is generated when subjected to an alkaline condition (pH 11.20
phosphate buffer). Δ curves for each particle type are shown in (d) and the peak values
Δm are found for a mix of particles and plotted in a histogram (e). Δm fall into natural
groups for each type of particle.

133
Figure 4.4: The hybridization schematic (a) shows the hybridized target strands in the
two homozygous experiments, :2 and :3, and the heterozygous experiment, :4. Note that
the PM and MM duplexes on either side of bead :4 are a combination of the duplexes on
the corresponding sides of beads :2 and :3. In (b), we see the plotted retention ratios
of :2, :3 and :4 on the colon side. The heterozygous colon-side signal (:4) can be
expressed as a linear combination of the two homozygous colon-side signals (:2 and :3).
As shown in Eq. 4.1, we calculate the linear combination using the relative fraction of
R:2 as the fitting parameter (f1). Plotting this fitted colon-side data over the original
colon-side :4 data (c) shows an extremely good fit (R2=0.9996). A similar procedure on

134
the label side (d; Eq. 4.2) also fits extremely well (R2=0.9998). Subtracting the fitted
label side data from the fitted colon side data (Eq. 4.3) produces a delta curve (e) which
closely reproduces (R2=0.9316) the Δ:4 from the experimental data.
Eq. 4.1
Eq. 4.2
Eq. 4.3

135
Figure 4.5: Genotyping is studied at different temperatures (10oC, 22oC, and 37oC)
using a pH 11.20 buffer (a and c) or a pH gradient to drive dehybridization (b and d). (a)
and (b) are for DNA with the variant base located in the center, while (c) and (d) show
results when the variant base located at three base away from the end.

136
Figure 4.6: (a) shows the calculated values for the [OH-] and pH during the first
thousand seconds of a dynamic alkaline dehybridization experiment. (b) shows the
injection rate of the NaOH solution; injection rate of water is constant at 20 uL/min.
0 500 10000
0.005
0.01
Time (s)
[OH
-]
0 500 10000
5
10
15
20
Time (s)
NaO
H in
ject
ion
rate
(μL
min
-1)
0 500 100010
11
12
pH

137
Figure 4.7: (a) Synthetic DNA targets of genes associated with thrombotic disorders
(MTHFR, Factor II, and Factor V) and fluorescently labeled gene-specific secondary
probes are sequentially hybridized to three types of particles containing allele-specific
probes. Target mixture for test 1 contains MTHFR mutant, Factor II mutant and Factor
V wild-type. Target mixture for test 2 contains MTHFR wild-type, 50/50 mixture of
Factor II wild-type and mutant, and Factor V mutant. Target mixture for test 3 contains
MTHFR mutant, Factor II wild-type, and 50/50 mixture of Factor V wild-type and mutant.
(b) Representative images are shown for each test at the time of Δm. (Contrast in these
images is enhanced.)

138
Table 4.1: DNA sequences
P1 5’-/Acryd/CCT GGG AAA GTC CCC TCA ACA /-3’
P3 5’-/Acryd/CCT GGG AAA GTA CCC TCA ACA / -3’
P4 5’-/Acryd/ CCT AGG AAA GTC CCC TCA ACA /-3’
T1 5’-Org488/TGT TGA GGG GAC TTT CCC AGG-3’
T3 5’-Org488/TGT TGA GGG TAC TTT CCC GGA-3’
T4 5’-Org488/TGT TGA GGG GAC TTT CCT GGA-3’ MTHFR 1st
wild-type probe 5’-/Acryd/ ATG AAA TCG GCT CCC GCA GAC / -3’
MTHFR 1st Mutation probe
5’-/Acryd/ ATG AAA TCG ACT CCC GCA GAC / -3’
MTHFR wide-type target
5’-GAA GCA GGG AGC TTT GAG GCT GAC CTG AAG CAC TTG AAG GAG AAG GTG TCT GCG GGA GCC GAT TTC AT-3’
MTHFR mutation target
5’-GAA GCA GGG AGC TTT GAG GCT GAC CTG AAG CAC TTG AAG GAG AAG GTG TCT GCG GGA GTC GAT TTC AT-3’
MTHFR 2nd probe
5’-CAA GTG CTT CAG GTC AGC CTC AAA GCT CCC TGC TTC- Alex488-3
Factor II 1st wild-type probe
5’-/Acryd/ CTC AGC GAG CCT CAA TGC TCC / -3’
Factor II 1st Mutation probe
5’-/Acryd/ CTC AGC AAG CCT CAA TGC TCC / -3’
Factor II wide-type target
5’- TAG TAT TAC TGG CTC TTC CTG AGC CCA GAG AGC TGC CCA TGA ATA GCA CTG GGA GCA TTG AGG CTC GCT GAG -3’
Factor II mutation target
5’- TAG TAT TAC TGG CTC TTC CTG AGC CCA GAG AGC TGC CCA TGA ATA GCA CTG GGA GCA TTG AGG CTT GCT GAG -3’
Factor II 1st 2nd probe
5’- CTC TGG GCT CAG GAA GAG CCA GTA ATA CTA - Alex488-3’
Factor V 1st wild-type probe
5’-/Acryd/ TGG ACA GGC GAG GAA TAC AGG / -3’
Factor V 1st Mutation probe
5’-/Acryd/ TGG ACA GGC AAG GAA TAC AGG / -3’
Factor V wide-type target
5’- GAA GAA ATT CTC AGA ATT TCT GAA AGG TTA CTT CAA GGA CAA AAT ACC TGT ATT CCT CGC CTG TCC A -3’
Factor V mutation target
5’- GAA GAA ATT CTC AGA ATT TCT GAA AGG TTA CTT CAA GGA CAA AAT ACC TGT ATT CCT TGC CTG TCC A -3’
Factor V 2nd probe 5’- TAA CCT TTC AGA AAT TCT GAG AAT TTC TTC - Alex488-3

139
4.6. REFERENCES
(1) Syvanen, A.-C. "Accessing genetic variation: genotyping single nucleotide
polymorphisms"; Nat. Rev. Genet. 2001, 2, 930.
(2) Syvanen, A. C. "Toward genome-wide SNP genotyping"; Nat. Genet. 2005, 37,
S5.
(3) Holland, C. A.; Kiechle, F. L. "Point-of-care molecular diagnostic systems -- past,
present and future"; Curr. Opin. Microbiol. 2005, 8, 504.
(4) Voisey, J.; Morris, C. P. "SNP Technologies for Drug Discovery: A Current
Review"; Curr. Drug Discovery Technol. 2008, 5, 230.
(5) McCarthy, J. J.; Hilfiker, R. "The use of single-nucleotide polymorphism maps
in pharmacogenomics"; Nat. Biotechnol. 2000, 18, 505.
(6) Schork, N. J.; Fallin, D.; Lanchbury, J. S. "Single nucleotide polymorphisms and
the future of genetic epidemiology"; Clin. Genet. 2000, 58, 250.
(7) Sobrino, B.; Brión, M.; Carracedo, A. "SNPs in forensic genetics: a review on
SNP typing methodologies"; Forensic Sci. Int. 2005, 154, 181.
(8) Budowle, B.; van, D. A. "Forensically relevant SNP classes"; BioTechniques
2008, 44, 603.
(9) Yager, P.; Edwards, T.; Fu, E.; Helton, K.; Nelson, K. et al "Microfluidic
diagnostic technologies for global public health"; Nature 2006, 442, 412.
(10) Dobson, M. G.; Galvin, P.; Barton, D. E. "Emerging technologies for
point-of-care genetic testing"; Expert Rev. Mol. Diagn. 2007, 7, 359.
(11) Ng, J. K.-K.; Liu, W.-T. "Miniaturized platforms for the detection of
single-nucleotide polymorphisms"; Anal. Bioanal. Chem. 2006, 386, 427.
(12) Ogasawara, S.; Fujimoto, K. "SNP Genotyping by Using Photochemical
Ligation"; Angew. Chem., Int. Ed. 2006, 45, 4512.
(13) Bowler, Frank R.; Diaz-Mochon, Juan J.; Swift, Michael D.; Bradley, M. "DNA
Analysis by Dynamic Chemistry"; Angew. Chem., Int. Ed. 2010, 49, 1809.

140
(14) Taton, T. A.; Mirkin, C. A.; Letsinger, R. L. "Scanometric DNA Array Detection
with Nanoparticle Probes"; Science 2000, 289, 1757.
(15) Sosnowski, R. G.; Tu, E.; Butler, W. F.; O'Connell, J. P.; Heller, M. J. "Rapid
determination of single base mismatch mutations in DNA hybrids by direct electric field
control"; Proc. Natl. Acad. Sci. U.S.A. 1997, 94, 1119.
(16) Bao, Y. P.; Huber, M.; Wei, T.-F.; Marla, S. S.; Storhoff, J. J. et al "SNP
identification in unamplified human genomic DNA with gold nanoparticle probes"; Nucl.
Acids Res. 2005, 33, e15.
(17) Castro, A.; Williams, J. G. K. "Single-Molecule Detection of Specific Nucleic
Acid Sequences in Unamplified Genomic DNA"; Anal. Chem. 1997, 69, 3915.
(18) Kwok, P.-Y. "Methods for Genotyping single nucleotide polymorphisms"; Annu.
Rev. Genomics Hum. Genet. 2001, 2, 235.
(19) Wang, D. G.; Fan, J.-B.; Siao, C.-J.; Berno, A.; Young, P. et al "Large-Scale
Identification, Mapping, and Genotyping of Single-Nucleotide Polymorphisms in the
Human Genome"; Science 1998, 280, 1077.
(20) Vainrub, A.; Pettitt, B. M. "Theoretical aspects of genomic variation screening
using DNA microarrays"; Biopolymers 2004, 73, 614.
(21) Howell, W. M.; Job, M.; Gyllensten, U.; Brookes, A. J. "Dynamic allele-specific
hybridization"; Nat. Biotechnol. 1999, 17, 87.
(22) Jobs, M.; Howell, W. M.; Stroemqvist, L.; Mayr, T.; Brookes, A. J. "DASH-2:
Flexible, low-cost, and high-throughput SNP genotyping by dynamic allele-specific
hybridization on membrane arrays"; Genome Res. 2003, 13, 916.
(23) Crews, N.; Wittwer, C. T.; Montgomery, J.; Pryor, R.; Gale, B. "Spatial DNA
Melting Analysis for Genotyping and Variant Scanning"; Anal. Chem. 2009, 81, 2053.
(24) Frontali, C.; Ageno, M.; Dore, E. "Dynamics of the alkaline denaturation of
DNA"; Quaderni de La Ricerca Scientifica 1968, No. 47, 165.
(25) Ageno, M.; Dore, E.; Frontali, C. "The Alkaline denaturation of DNA"; Biophys.

141
J. 1969, 9, 1281.
(26) Crothers, D. M. "The kinetics of DNA denaturation"; J. Mol. Biol. 1964, 9, 712.
(27) Massie, H. R.; Zimm, B. H. "Kinetics of denaturation of DNA"; Biopolymers
1969, 7, 475.
(28) Zhang, H.; Mitrovski, S. M.; Nuzzo, R. G. "Microfluidic Device for the
Discrimination of Single-Nucleotide Polymorphisms in DNA Oligomers Using
Electrochemically Actuated Alkaline Dehybridization"; Anal. Chem. 2007, 79, 9014.
(29) Pregibon, D. C.; Toner, M.; Doyle, P. S. "Multifunctional Encoded Particles for
High-Throughput Biomolecule Analysis"; Science 2007, 315, 1393.
(30) Heller, M. J. "DNA microarray technology: Devices, systems, and applications";
Annu. Rev. Biomed. Eng. 2002, 4, 129.
(31) Nolan, J. P.; Sklar, L. A. "Suspension array technology: evolution of the
flat-array paradigm"; Trends Biotechnol. 2002, 20, 9.
(32) Jang, J.-H.; Dendukuri, D.; Hatton, T. A.; Thomas, E. L.; Doyle, P. S. "A route to
three-dimensional structures in a microfluidic device: stop-flow interference lithography";
Angew. Chem., Int. Ed. 2007, 46, 9027.
(33) Panda, P.; Ali, S.; Lo, E.; Chung, B. G.; Hatton, T. A. et al "Stop-flow
lithography to generate cell-laden microgel particles"; Lab Chip 2008, 8, 1056.
(34) Hwang, D. K.; Oakey, J.; Toner, M.; Arthur, J. A.; Anseth, K. S. et al "Stop-Flow
Lithography for the Production of Shape-Evolving Degradable Microgel Particles"; J. Am.
Chem. Soc. 2009, 131, 4499.
(35) Dendukuri, D.; Pregibon, D. C.; Collins, J.; Hatton, T. A.; Doyle, P. S.
"Continuous-flow lithography for high-throughput microparticle synthesis"; Nat. Mater.
2006, 5, 365.
(36) Dendukuri, D.; Gu, S. S.; Pregibon, D. C.; Hatton, T. A.; Doyle, P. S. "Stop-flow
lithography in a microfluidic device"; Lab Chip 2007, 7, 818.
(37) Shepherd, R. F.; Panda, P.; Bao, Z.; Sandhage, K. H.; Hatton, T. A. et al

142
"Stop-Flow Lithography of Colloidal, Glass, and Silicon Microcomponents"; Adv. Mater.
2008, 20, 1.
(38) Pregibon, D. C.; Doyle, P. S. "Optimization of Encoded Hydrogel Particles for
Nucleic Acid Quantification"; Anal. Chem. 2009, 81, 4873.
(39) Witte, R. P.; Blake, A. J.; Palmer, C.; Kao, W. J. "Analysis of poly(ethylene
glycol)-diacrylate macromer polymerization within a multicomponent
semi-interpenetrating polymer network system"; J. Biomed. Mater. Res., Part A 2004,
71A, 508.
(40) Lefferts, J. A.; Jannetto, P.; Tsongalis, G. J. "Evaluation of the Nanosphere
Verigene® System and the Verigene® F5/F2/MTHFR Nucleic Acid Tests"; Exp. Mol.
Pathol. 2009, 87, 105.

143
Appendix A. Alkaline Dehybridization Using a Glass Slide
Support
DNA immobilization and hybridization on a glass slide
The DNA immobilization was carried out on aldehyde-coated glass slides (5 ×10 mm)
that were cut from a larger piece (Vantage Aldehyde Slides, CEL Associates, Pearland,
TX) and rinsed with milli-Q water followed by drying in a stream of N2.
The immobilization solution (24 μM probe ssDNA in pH 9 carbonate buffer) was
heated by immersion in boiling water for 3 min and after it cooled down to room
temperature, traces (~ 0.001%) of sodium dodecyl sulfate (SDS) surfactant were added to
the solution to facilitate spreading onto the aldehyde-coated glass. Each slide was then
used as a substrate onto which 5 μL of DNA immobilization solution was added. The
glass slides were then placed in a dehumidifier and kept for at least 2 hours at room
temperature to complete the Schiff base reaction. The DNA coated glass slide was then
soaked in NaBH4 solution (0.025 g NaBH4 + 7 ml H2O + 3 ml ethanol)1 for 5 min in
order to reduce the Schiff base and the remaining aldehyde group. In order to remove
the non-specifically adsorbed DNA, the glass pieces were soaked in 2x SSPE/0.2 % SDS
solution, which contained 2 mM EDTA, 7 mM SDS, 300 mM NaCl, and 20 mM
NaH2PO4 the pH of which was adjusted to pH = 7.4 using 1 M NaOH,2-3 for 5 min.

144
This procedure was followed by shaking in the same solution for 5 min and milli-Q water
for 5 min after which the slide was soaked in boiling milli-Q water for 5 min. The final
rinse was performed with milli-Q water after which the slide was dried in a stream of
nitrogen.
The DNA hybridization was performed using a 2.5 μM complementary DNA solution
which was prepared by diluting the stock DNA solution (described in Materials and
Reagents section) with 2x SSPE/0.2 %SDS solution (pH = 7.4). The hybridization
solution was heated by immersing in boiling water for 2 min before use. An 8 μL
aliquot of hybridization solution was spread on the probe-coated glass slide after which it
was kept in a humidity chamber (100 % RH) for 1 hr at 37 °C.4 The slide was rinsed
with water, and shaken in 2xSSPE/0.2%SDS solution twice for 5 min.
Device fabrication
Several methods were used to fabricate planar structures. Our best results came from a
modification of a procedure taken from the literature.1 In this method, a duplex coated
glass slide was embedded in the device following a modification of the procedure
described in the experimental section (i.e., Figure 3.1(a)). In brief, a duplex-coated glass
slide and a WE array were placed into contact (duplex-side down) with a fully-cured
PDMS flat (with a 5 mm distance from the center of the glass slide to the center of the
WE array). Uncured PDMS prepolymer was poured over the setup and placed in vacuo

145
for 10 minutes. The prepolymer was then cured at 37 °C overnight. The entire
“sandwich” was flipped over and the thin PDMS membrane was carefully peeled away to
reveal the duplex-coated side of the glass slide and the WE. The latter assembly served as
the bottom layer of the microfluidic device. A PDMS upper layer with microfluidic
channels (width x separation x height = 0.2 mm x 0.2 mm x 0.05 mm) was treated with
UV/ozone for 5 min and sealed conformally with the bottom layer. This protocol yields a
modified glass surface active towards specific DNA capture/release albeit with an
interfering (and generally high) non-specific background.
References
(1) Zammatteo, N.; Jeanmart, L.; Hamels, S.; Courtois, S.; Louette, P. et al
"Comparison between Different Strategies of Covalent Attachment of DNA to Glass
Surfaces to Build DNA Microarrays"; Anal. Biochem. 2000, 280, 143.
(2) Lin, Z.; Strother, T.; Cai, W.; Cao, X.; Smith, L. M. et al "DNA Attachment and
Hybridization at the Silicon (100) Surface"; Langmuir 2002, 18, 788.
(3) Peelen, D.; Smith, L. M. "Immobilization of amine-modified oligonucleotides on
aldehyde-terminated alkanethiol monolayers on gold"; Langmuir 2005, 21, 266.
(4) Dawson, E. D.; Reppert, A. E.; Rowlen, K. L.; Kuck, L. R. "Spotting
optimization for oligo microarrays on aldehyde-glass"; Anal. Biochem. 2005, 341, 352.

146
Figure A.1: (a) Schematic representation of the relative position of the Pt-WE and the
ds-DNA coated glass slide. The distance between the center of the electrode and the slide
is ∼ 5 mm. (b) Fluorescence micrograph of the ds-DNA coated glass slide
immediately prior to the beginning of the DNA dehybridization. (c)-(d) Fluorescence
micrographs taken in the course of the DNA dehybridization. The image in (c) shows a
laminar flow profile corresponding to the alkaline fluid flow from WE to CE.

147
Author’s Biography
Huaibin Zhang was born in Yunnan, China on April 17, 1979. In the high school, he
was selected as one of the three provincial representatives to compete in the National
Chemistry Contest. After receiving the second-class honor in the contest, he was recruited
by the Chemistry Department at the Nankai University. He joined Chemisoft Society
there and participated in the production of two multi-media textbooks for general
chemistry. In the summer of 2002 he entered the master program in chemistry at the
University of Waterloo. Under the guidance of Professor Mónica Barra, Huaibin studied
the mechanism of the thermal cis-to-trans isomerization of unsymmetrical
1,3-diaryltriazenes. After receiving a M. S. degree in 2004, Huaibin continued his
chemistry studies by entering the doctoral program at the University of Illinois at
Urbana-Champaign. He joined the research group of Professor Ralph G. Nuzzo and
began exploring biological applications of microfluidic system. He discovered that
alkaline dehybridization can be used to discriminate single nucleotide polymorphisms
(SNP), and further developed a system to demonstrate the genotyping application of this
technique. He also developed a membrane-based microfluidic contact printing technique
to pattern biomolecules on soft materials. After receiving his Ph.D. in chemistry in 2010
Huaibin will be joining the laboratory of Professor David R. Walt at the Tufts University
as a postdoctoral research fellow.