Embed Size (px)
Citation preview
BIOACTIVE NATURAL PRODUCTS FROM THE SOFT CORAL, SINULARIA SP.
LIM FEI SHEN
MASTER OF SCIENCE
FACULTY OF ENGINEERING AND SCIENCE
UNIVERSITI TUNKU ABDUL RAHMAN
MAY 2014
BIOACTIVE NATURAL PRODUCTS FROM THE SOFT CORAL, SINULARIA SP.
BY
LIM FEI SHEN
A dissertation submitted to the Department of Science
Faculty of Science and Engineering
UniversitiTunku Abdul Rahman
In partial fulfillment of the requirements for the degree of
Master of Science
May 2014

ABSTRACT
BIOACTIVE NATURAL PRODUCTS FROM THE SOFT CORAL, Sinularia sp.
Lim Fei Shen
Soft coral is a rich source of bioactive secondary metabolites and one of
the most prolific sources of new marine natural products. In this study, the soft
coral, Sinularia sp. was chosen to study its photo-toxicity, antifungal and
antibacterial activities. Lyophilized samples of Sinularia sp. were subjected to
sequential extraction using organic solvents of increasing polarity, i.e. hexane,
diethyl ether, chloroform, ethyl acetate, acetone, methanol and water at a ratio of
1 g: 10 mL. Microculture tetrazolium (MTT) test with light irradiation was used
to study its photo-toxicity activity towards the leukemia cell line, HL 60.
Chloroform extract with the highest photo-toxicity activity (2.25% of cell
viability) was subjected to isolation using flash chromatography. However, the
fractions were unstable and lost its activitiy after fractionation. In antimicrobial
assay, a colorimetric broth microdilution method using p-iodonitrotetrazolium
violet (INT) as growth indicator was employed to determine the minimum
inhibitory concentrations (MICs) towards medically-important bacteria and fungi.
Hexane extract which exhibited the strongest inhibitory effect towards
Cryptococcus neoformans (MIC= 0.03 mg/mL, n=3) was selected for further in
vitro bioassay-guided fractionation. It was purified using silica gel impregnated
ii
with silver nitrate and semi-preparative thin layer chromatography (TLC). Fuscol
(C20H32O, MW = 288) which was identified by gas chromatography mass
spectrometry (GCMS) and nuclear magnetic resonance (NMR) analysis had a
mean of MIC value 0.064 mg/mL towards C. neoformans. Fraction 1 from the
hexane extract which demonstrated anti-fungal activity (MIC = 0.13 mg/mL)
contains a mixture of hydrocarbons and eight other compounds identified using
GCMS. Fraction 6, a white powder, was found to be a mixture of sterols (MIC =
0.06 mg/mL).
iii
ACKNOWLEDGEMENTS
I would like to thank my supervisor, Dr. Khoo Kong Soo and co-
supervisor, Dr. Sit Nam Weng for their valuable help and guidance throughout the
whole research. Their comments and suggestions had made this research possible.
Besides, I would like to thank my friends in University Malaya, Dr. Lee
Guan Serm, Dr. Hong Sok Lai and Dr. Tan Kong Wai for their help. I appreciate
the information shared generously by them.
I also acknowledge Dr. Lee Hong Boon and her students in CARIF, Sime
Darby Medical Center for their help. I thank all my lab mates in Universiti Tunku
Abdul Rahman for being supportive and helpful all the time.
Finally and especially, I would like to express gratitude to my beloved
family.
iv
FACULTY OF SCIENCE
UNIVERSITI TUNKU ABDUL RAHMAN
Date: _________________________
SUBMISSION OF THESIS
It is hereby certified that LIM FEI SHEN (ID No: 08UEM01996) has completed
this thesis entitled “BIOACTIVE NATURAL PRODUCTS FROM THE SOFT
CORAL, SINULARIA SP.” under the supervision of Assoc. Prof. Dr. Khoo Kong
Soo (Supervisor) from the Department of Chemical Science, Faculty of Science,
and Assist. Prof. Dr. Sit Nam Weng (Co-supervisor) from Department of
Biomedical Science, Faculty of Science.
I understood that the University will upload softcopy of my thesis in pdf format
into UTAR Institutional Repository, which may be made accessible to UTAR
community and public.
Yours truly, ____________________ (LIM FEI SHEN)
v
APPROVAL SHEET
This thesis entitled “BIOACTIVE NATURAL PRODUCTS FROM THE SOFT CORAL, SINULARIA SP.” was prepared by LIM FEI SHEN and submitted as partial fulfillment of the requirements for the degree of Master of Science at Universiti Tunku Abdul Rahman. Approved by: ___________________________ (Assoc. Prof. Dr. KHOO KONG SOO) Date:………………….. Supervisor Department of Chemical Science Faculty of Science Universiti Tunku Abdul Rahman ___________________________ (Assist. Prof. Dr. SIT NAM WENG) Date:………………….. Co-supervisor Department of Biomedical Science Faculty of Science Universiti Tunku Abdul Rahman
vi
DECLARATION
I ________________________________________________ hereby declare that the thesis/dissertation is based on my original work except for quotations and citations which have been duly acknowledged. I also declare that it has not been previously or concurrently submitted for any other degree at UTAR or other institutions. ____________________ (LIM FEI SHEN)
Date _____________________
vii
TABLE OF CONTENTS
ABSTRACT ii ACKNOWLEDGEMENTS iv PERMISSION SHEET v APPROVAL SHEET vi DECLARATION vii TABLE OF CONTENTS viii LIST OF TABLES ix LIST OF FIGURES x LIST OF ABBREVIATION xv CHAPTER 1.0 INTRODUCTION
1
1.1 Natural Products 1 1.2 Marine Natural Products 2 1.3 Sinularia sp. 3 1.4 Antimicrobial 5 1.5 Photodynamic Therapy 6 1.6 Hypothesis 7 1.7 Objectives 7 2.0 LITERATURE REVIEW
9
2.1 Natural Products 9 2.2 Research on Sinularia sp. 11 2.2.1 Research on Sinularia dissecta 16 2.2.2 Research on Sinularia flexibilis
21
2.3 Antimicrobial Susceptibility Testing Methods 22 2.3.1 Disc Diffusion Method 23 2.3.2 Broth Dilution Method 23 2.3.3 Bio-autography Method
24
2.4 Fungi 25 2.4.1 Cryptococcus neoformans 25 2.4.2 Candida species 26 2.4.3 Aspergillus niger 26 2.4.4 Trichophyton mentagrophytes
27
2.5 Bacteria 28
viii
2.5.1 Staphylococcus aureus 28 2.5.2 Bacillus cereus 29 2.5.3 Pseudomonas aeruginosa 29 2.5.4 Escherichia coli 30 2.5.5 Klebsiella pneumoniae
30
2.6 Photodynamic Therapy 30 3.0 MATERIALS AND METHODS
32
3.1 Sample Collection and Extraction 32 3.2 Microbial Susceptibility Testing 33 3.2 .1 Sample Extract Preparation 34 3.2.2 Growth Indicator Preparation 35 3.2.3 Antibacterial Testing 35 3.2.3.1 Bacterial Strains 37 3.2.3.2 Bacterial Inocula Preparation 37 3.2.3.3 Chloramphenicol Preparation 38 3.2.3.4 Broth Medium Preparation
38
3.2.4 Antifungal Testing 38 3.2.4.1 Fungal Strains 40 3.2.4.2 Fungal Inocula Preparation 41 3.2.4.3 Fluconazole Preparation 42 3.2.4.4 Broth Medium Preparation
42
3.3 Solvent Toxicity Testing 43 3.4 Photo-toxicity Assay 46 3.4.1 Preparation of Cell Line 48 3.4.2 Photosensitizer Preparation 48 3.4.3 Isolation of Active Photo-cytotoxic Compounds
49
3.5 Isolation and Identification of Antifungal Compounds 50 3.5.1 Gas Chromatography Mass Spectrometry Analysis 53 3.5.2 1H Nuclear Magnetic Resonance and 13C Nuclear
Magnetic Resonance Spectroscopic Analysis on the Isolated Antifungal Compound
54
4.0 RESULTS AND DISCUSSION
55
4.1 Collection of Sinularia sp. 55 4.2 Sequential Extraction of Sinularia sp. 56 4.3 Solvent Toxicity 57 4.4 Antimicrobial Activities 63 4.4.1 Antibacterial Testing 64 4.4.2 Antifungal Activities 68
ix
4.4.3 Photo- toxicity Activities
72
4.5 Isolation of Antifungal Components from Hexane Extract of Sinularia sp.
74
4.6 Fuscol, Isolated Antifungal Compound from Sinularia sp. 82 4.7 Summary 101 4.8 Suggestions for Further Work 101 5.0 CONCLUSIONS 102 REFERENCES 103 APPENDICES 109
x
LIST OF TABLES
Table
Page
2.1 Drugs developed from natural sources.
10
3.1 Mobile phases used in the isolation of active photo-toxicity chloroform extract.
50
3.2 Mobile phases used in the isolation of active antifungal hexane extract.
52
4.1 Dry weights of Sinularia sp. collection on four different days.
56
4.2 Yield of seven extracts from 1.58 kg of dried sample of Sinularia sp
57
4.3 Percentage of the organic solvents that inhibited the growth of the tested bacteria.
60
4.4 Percentage of the organic solvents that inhibited the growth of the tested fungi.
62
4.5 Mean MIC values (mg/mL) of the seven extracts of Sinularia sp. towards tested bacteria.
66
4.6 Total activity (mL) of the seven extracts of Sinularia sp. towards tested bacteria
67
4.7 Mean MIC values (mg/mL) of the seven extracts of Sinularia sp. towards tested fungi.
70
4.8 Total activity (mL) of the seven extracts of Sinularia sp. towards tested fungi. 1H NMR data of isolated fuscol and those reported in the literature.
71
4.9 1H NMR data of isolated fuscol and those reported in the literature
90
xi
4.10 13C NMR data of isolated fuscol and those reported in the literature.
95
4.11 HSQC and HMBC data of the isolated fuscol. 99
xii
LIST OF FIGURES
Figure
Page
1.1 Adenine arabinoside, Ara-A and cytosine arabinoside, Ara-C. 3
1.2 Sinularia sp. 4
2.1 Yonarolide isolated from Sinularia sp. 12
2.2 Four novel diterpenoids isolated from Sinularia sp. 12
2.3 Six marine sterols isolated from Sinularia sp. 13
2.4 Six compounds isolated from Sinularia sp. 15
2.5 Sinulamide isolated from Sinularia sp. 16
2.6 Fifteen steroids isolated from Sinularia dissecta. 17
2.7 Five steroids isolated from Sinularia dissecta. 18
2.8 α-keto-2-methylene-β-alanine methyl esters and 4,5-seco-african-4,5-dione isolated from Sinularia dissecta.
19
2.9 Diterpenes isolated from Sinularia dissecta. 20
2.10 Thirteen sterols isolated from Sinularia flexibilis. 21
2.11 Biscembranoid diterpene isolated from Sinularia flexibilis. 22
2.12 Principle of photodynamic treatment. 31
3.1 Design of the 96- well microplate for antibacterial testing. 36
3.2 Design of the 96-well microplate for antifungal testing. 40
3.3 Design of the 96- well plate for solvent toxicity testing. 45
3.4 Principle of the MTT assay. The reduction of MTT into its formazan product is catalyzed by mitochondrial dehydrogenases.
46
4.1 An example of microtitre plates showing the result of the organic solvents against C. parapsilosis (ATCC 22019).
63
xiii
4.2 Percentage of cell viability of HL 60 versus Sinularia sp.
extracts.
72
4.3 Percentage of cell viability of HL 60 versus Sinularia sp. fractions.
73
4.4 Total ion chromatogram of fraction AgN1. 75
4.5 Chemical structure of undecane. 76
4.6 Chemical structure of prehnitol 76
4.7 Chemical structure of durol. 76
4.8 Chemical structure of tridecane. 77
4.9 Chemical structure of dodecane. 77
4.10 Chemical structure of tetradecane. 78
4.11 Chemical structure of palmityl palmitate
78
4.12 Total ion chromatogram of subfraction AgN6. 79
4.13 Chemical structure of lanol 81
4.14 Chemical structure of ergost-5,8(14)-dien-3-ol. 81
4.15 Chemical structure of campesterol. 82
4.16 AgN27-1 (C20H32O, MW=288) 83
4.17 Total ion chromatogram of subfraction AgN27-1. 84
4.18 Mass spectrum of compound AgN27-1. 85
4.19 1H NMR spectrum of fuscol, isolated from Sinularia sp. 87
4.20 Expanded 1H NMR spectrum of fuscol, isolated from Sinularia
sp.
88
xiv
4.21 Expanded 1H NMR spectrum of fuscol, isolated from Sinularia
sp..
88
4.22 Expanded 1H NMR spectrum of fuscol, isolated from Sinularia
sp.
89
4.23 13C (CDCl3) NMR broadband spectrum of fuscol, isolated from Sinularia sp.
94
4.24 13C (CDCl3) NMR DEPT broadband spectrum of fuscol, isolated from Sinularia sp.
96
4.25 HSQC broadband spectrum of fuscol. 97
4.26 HMBC broadband spectrum of fuscol. 98
xv
LIST OF ABBREVIATIONS
AIDS Acquired Immunodeficiency Syndromes
ATCC American Type Culture Collection
CFU Colony forming unit
CLSI Clinical and Laboratory Standard Institute
DEPT Distortionless Enhancement by Polarization Transfer
DMSO Dimethyl sulphoxide
FDA Food and Drug Administration
GCMS Gas Chromatography Mass Spectrametry
HIV Human Immunodeficiency Virus
HPLC High Performance Liquid Chromatography
INT p-Iodonitrotetrazolium violet
MHA Mueller-Hinton Agar
MHB Mueller-Hinton Broth
MIC Minimum inhibitory concentration
MOPS 3-(N-morpholino) propanesulfonic acid
MTT 3-[4,5-dimethylthiazol-2-yl]-2,5-diphenyltetrazolium
bromide
NMR Nuclear Magnetic Resonance
PDA Potato dextrose agar
PDT Photodynamic therapy
Pha Pheophorbide-A
xvi
RPMI Roswell Park Memorial Institute
SARS Severe acute respiratory syndrome
TIC Total ion chromatogram
TLC Thin layer chromatography
UV Ultraviolet
xvii
CHAPTER 1.0
INTRODUCTION
1.1 Natural Products
Natural products are secondary metabolites from various source
materials including terrestrial plants, terrestrial microorganisms, marine
organisms and marine microorganisms (Chin et al., 2006). These compounds
usually have molecular weights of less than 2000 amu. Examples of secondary
metabolites are alkaloids, flavonoids, coumarins, glycosides, lignins, steroids,
terpenoids and many more. They can be obtained after a number of processes
accordingly which are extraction, fractionation and isolation (Sarker et al.,
2006).
For thousands of years, natural products have played an important role
in treating and preventing human diseases. The contribution of natural product
is evidenced by approximately 75% of drugs for infectious diseases and 60%
of anticancer compounds are either natural products or natural product
derivatives. According to World Health Organization, roughly two-thirds to
three quarters of the world’s population relies upon medicinal plants for its
primary pharmaceutical care (McChesney et al., 2007). Natural products
provide a starting point for new synthetic compounds, with diverse structures
and often with multiple stereo centers (Balunasand Kinghorn2005).
1.2 Marine Natural Products
Among the natural products, marine compounds provide numerous of
sources of natural products since the oceans cover more than 70% of the earth’s
surface and represent greatest biodiversity in the world. There are thousands of
marine life identified and millions more unknown (Murray et al., 1999). Among
the known groups of organisms are such as coral, sponges, mollusks, tunicates,
echinoderms, and algae.
These marine organisms produce valuable natural products that are useful
to mankind. Ecological pressures, including predation, competition for space, the
fouling of the surface and successfully reproducing have led to the evolution of
secondary metabolites with various bioactivities (Donia and Hamann 2003).
Among the natural sources, marine organisms such as sponges, sea cucumbers,
mollusks and corals have a great potential for producing new drugs. They are
potential sources of bioactive substances and have provided novel lead
compounds for the pharmaceutical industry (Mayer et al., 2009).
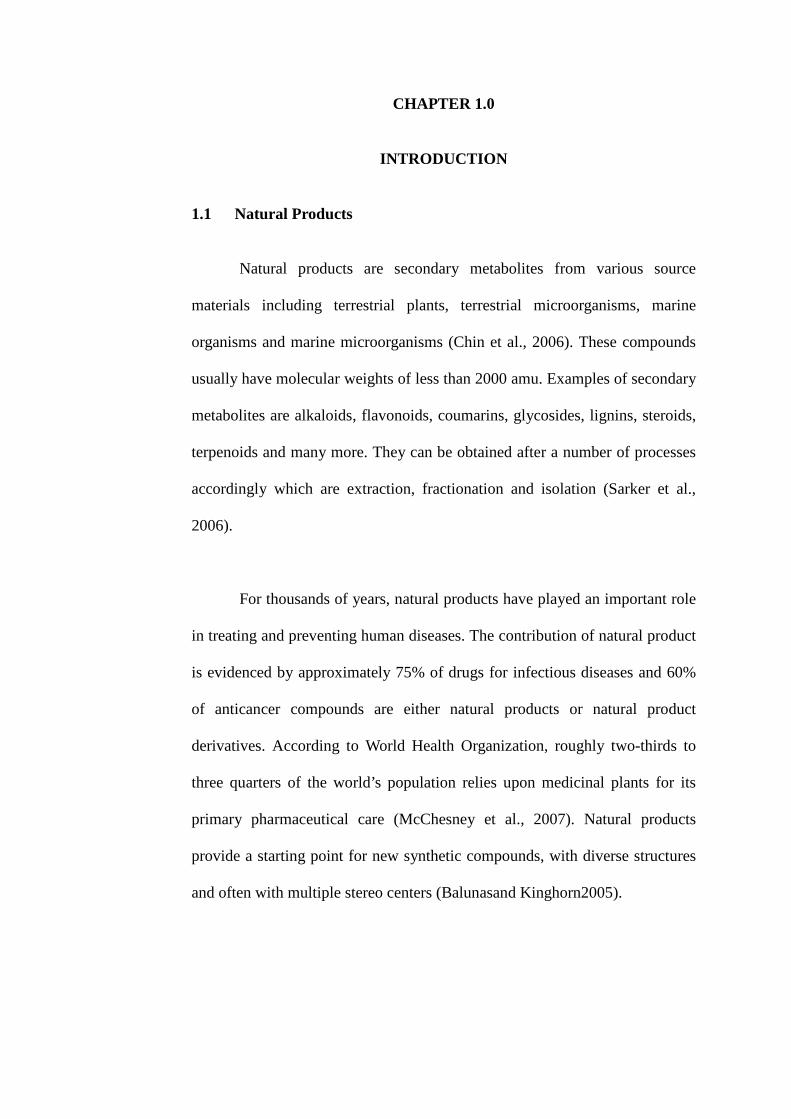
Since early 1950s, the search for drugs in marine began when the first
spongouridine and spongothymidine were isolated from the Caribbean sponge,
Cryptothecacrypta. They were approved as an anticancer drug (cytosine
arabinoside, Ara-C) and an antiviral drug (adenine arabinoside, Ara-A), which
2
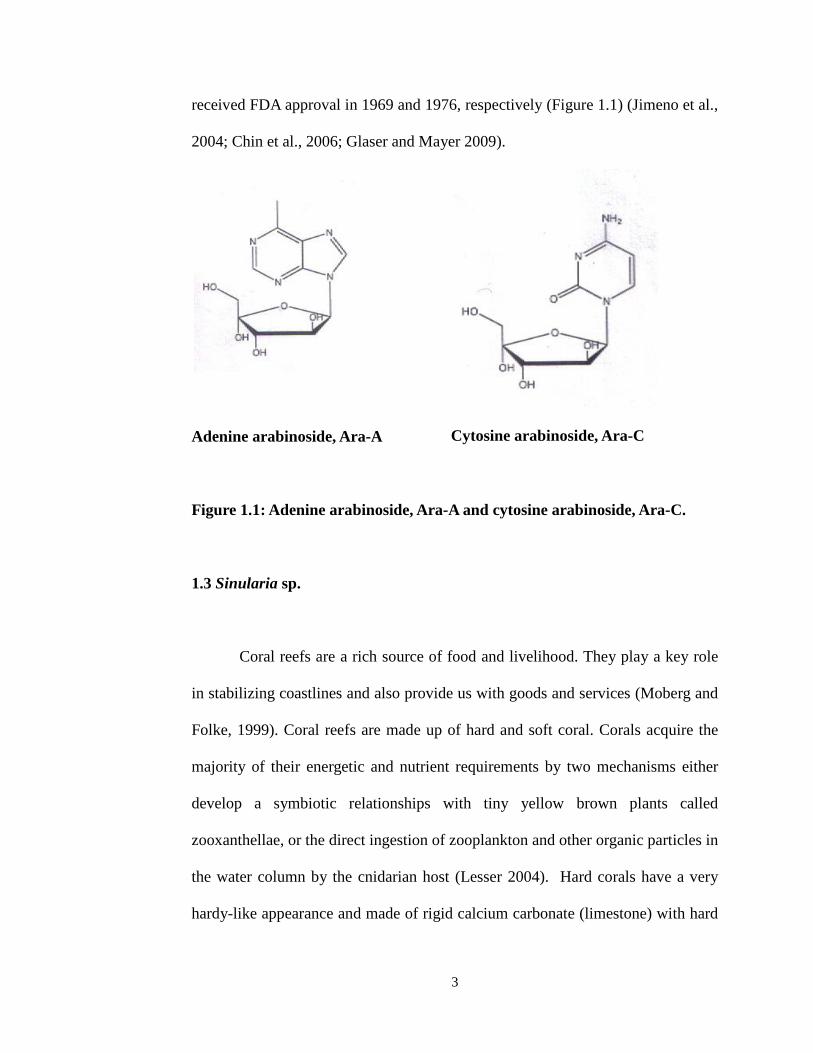
received FDA approval in 1969 and 1976, respectively (Figure 1.1) (Jimeno et al.,
2004; Chin et al., 2006; Glaser and Mayer 2009).
Adenine arabinoside, Ara-A
Cytosine arabinoside, Ara-C
Figure 1.1: Adenine arabinoside, Ara-A and cytosine arabinoside, Ara-C.
1.3 Sinularia sp.
Coral reefs are a rich source of food and livelihood. They play a key role
in stabilizing coastlines and also provide us with goods and services (Moberg and
Folke, 1999). Coral reefs are made up of hard and soft coral. Corals acquire the
majority of their energetic and nutrient requirements by two mechanisms either
develop a symbiotic relationships with tiny yellow brown plants called
zooxanthellae, or the direct ingestion of zooplankton and other organic particles in
the water column by the cnidarian host (Lesser 2004). Hard corals have a very
hardy-like appearance and made of rigid calcium carbonate (limestone) with hard
3
calcium skeletons. While the soft corals have a soft and leathery feel. Soft corals
do have some rigid calcium carbonate but it is blended with protein, so it is less
rigid compared to hard coral (Haider and Khan 2012).
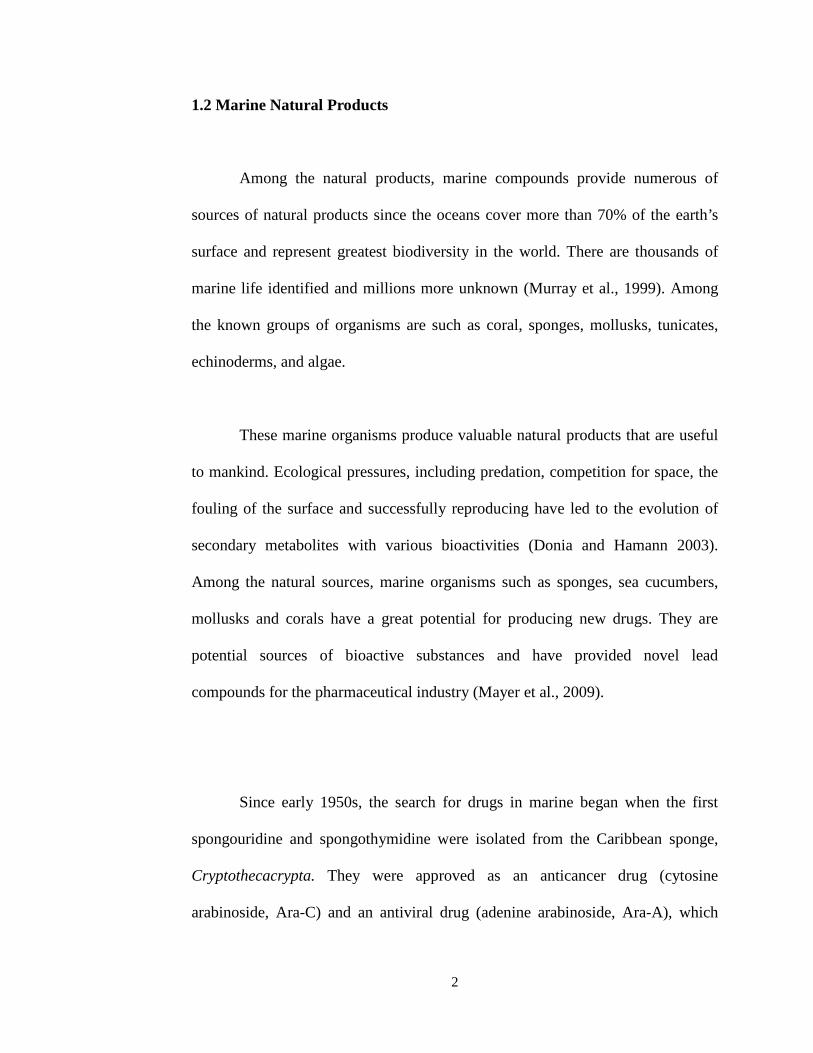
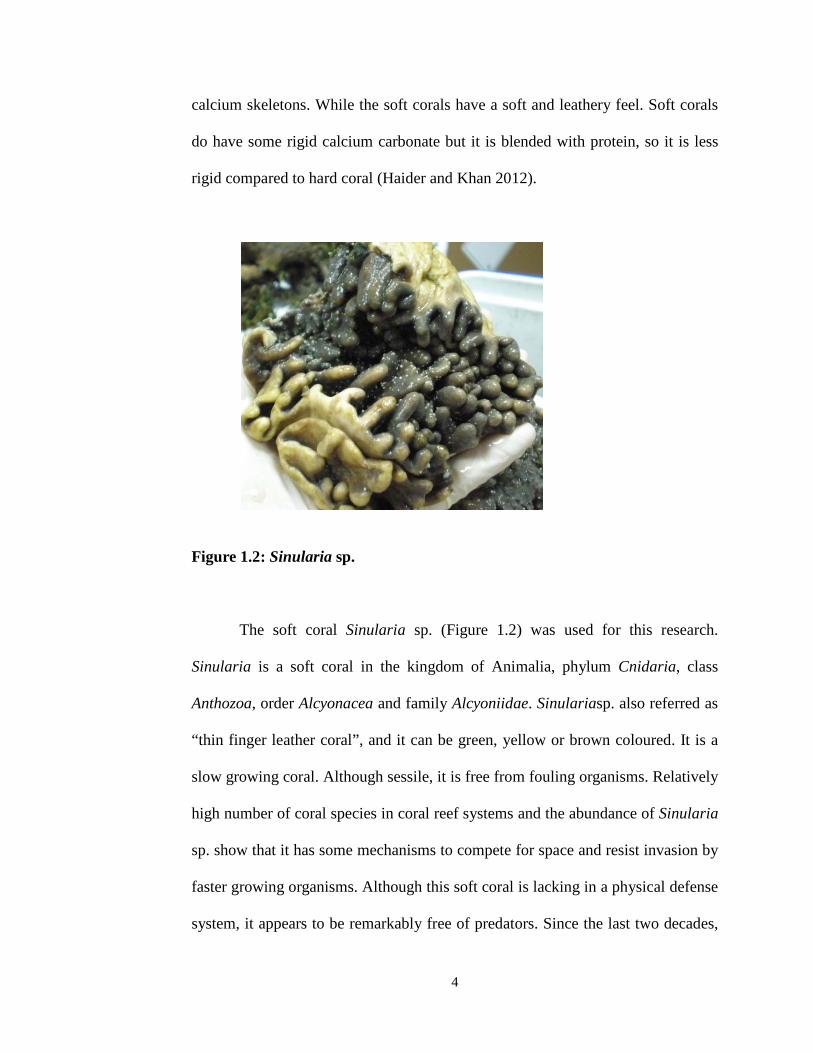
Figure 1.2: Sinularia sp.
The soft coral Sinularia sp. (Figure 1.2) was used for this research.
Sinularia is a soft coral in the kingdom of Animalia, phylum Cnidaria, class
Anthozoa, order Alcyonacea and family Alcyoniidae. Sinulariasp. also referred as
“thin finger leather coral”, and it can be green, yellow or brown coloured. It is a
slow growing coral. Although sessile, it is free from fouling organisms. Relatively
high number of coral species in coral reef systems and the abundance of Sinularia
sp. show that it has some mechanisms to compete for space and resist invasion by
faster growing organisms. Although this soft coral is lacking in a physical defense
system, it appears to be remarkably free of predators. Since the last two decades,
4
Sinulariasp. attracts considerably attention because it produces a wide range of
secondary metabolites including sesquiterpenes, diterpenes, polyhydroxylated
steroids, and polyamine compounds. These metabolites were shown to possess a
range of biological activities such as antimicrobial (Kelman et al., 2006), anti-
inflammatory (Williams and Faulkner 1996), antipredator (Alstyne et al., 1994)
and cytotoxic activities (Sheuet al., 1999).
1.4 Antimicrobial
Over the years, antimicrobial resistance is a major health problem and
challenges worldwide. New infectious diseases keep emerging and the use of
certain antibiotics had caused undesirable side effects. Even though many
antimicrobial compounds are marketed, the ability of microbes to develop
resistance to antimicrobial compounds is amazingly rapid (Jayaraman et al., 2008).
Besides antibiotic resistance, humankind is faced with the emergence of new
epidemics threats such as severe acute respiratory syndrome (SARS), human
immunodeficiency virus - human acquired immune deficiency syndrome (HIV-
AIDS) and bird flu (Minh et al., 2005).
Fungal infections are a major cause of diseases and mortality for the past
decade, in part as a consequence of the increase in AIDS, the greater use of
immunosuppressive drugs in transplantation and chemotherapeutic agents in
cancer, long term use of corticosteroids and even the indiscriminate use of
5
antibiotics. The common antifungal drugs available in the market are polyenes
(such as amphotericin B and nystatin), echinocandins (such as caspofungin and
micafungin), allylamines (such as niftifine and terbinafine), and azoles (such as
fluconazole, ketoconazole, itraconazole, etc) (Aher et al., 2009). Besides, the
development of vaccines against fungal pathogens is less advanced than bacterial
pathogens due to the similar eukaryotic nature with humans and the target patients
to be vaccinated are often immunocompromised (Segal and Elad 2006).
1.5 Photodynamic Therapy
Cancer is still a medical enigma that has yet to be solved.Surgery,
radiotherapy and chemotherapy are the three major methods used by clinicians in
the treatment of cancer. These methods are useful in some forms of cancer but
there is no single method can be used against all forms of cancer.Photodynamic
therapy (PDT) has been proposed as a promising new approach of medical
treatment of cancer diseases and non-oncological disorders (Buytaert et al., 2007).
The treatment is based upon the interaction of visible light with the
photosensitizing molecules in target cells. Subsequent photochemical reactions
result in the production of reactive oxygen species (ROS) inducing the cell death.
PDT can induce both modes of cell death, apoptosis and necrosis in target cells
(Plaetzer et al., 2003).
6
Photofrin is a photosensitizer approved by the European Union, the United
States FDA and Asian countries use in PDT. Hypocrellin A, which is isolated
from natural fungus sacs of Hypocrellabambusae, causes cell damage by
photodynamic reactions (Chio-Srichan et al., 2008). Due to the cytotoxicity
activities reported, many researchers have focused on the search for phototoxic
compounds from marine sources.
1.6 Hypothesis
Among the marine invertebrates, soft corals continue to be one of the most
prolific sources of new marine natural products. The secondary metabolites found
in soft corals have diverse bioactivities, including anti-infective, anti-predatory,
allelopathic, anti-fouling and cytotoxic properties (Wang, 2008). Since the soft
coral, Sinulariasp. is a rich source of bioactive secondary metabolites (Wang,
2008) this research is focused on whether extracts from it could be used as anti-
microbial drug.
1.7 Objectives
The objectives of this study were to extract antimicrobial compounds from
Sinularia sp. Isolation and identification of the antifungal active extract were
conducted by using flash chromatography impregnated with silver nitrate and gas
chromatography mass spectrometer (GC-MS). This research is also focused on
7
whether extracts from it could be used as photosensitisers in photodynamic
therapy (PDT) which exhibited minimally invasive therapeutic modality in the
threatment of cancer diseases and non-oncological disorders (Buytaertet al., 2007).
Besides, the toxicity of solvent on the microbes used was also carried out.
8
CHAPTER 2
LITERATURE REVIEW
2.1 Natural Products
Natural products are compounds that are obtained from living organisms
which include plants, microorganisms and animals from land and marine (Table
2.1). The compounds can be obtained from the entire or part of the organism. For
example, leaves, bark and stem of a plant or an individual organ of an animal. In
chemistry, natural products are often referred as secondary metabolites or pure
compounds that are extracted from the entire or part of the organism. The
examples of secondary metabolites are alkaloids, coumarins, glycosides, lignins,
flavonoids and terpenoids (Sarker et al., 2006).
Marine natural products are gaining more attention in the research field as
many compounds are found to be useful from medical to bio-fuel industries.
Many reviews and journals have published highlighting the promising future of
marine natural products as the main source in drug development (Mayer et al.,
2009; Nobili et al., 2009).
9
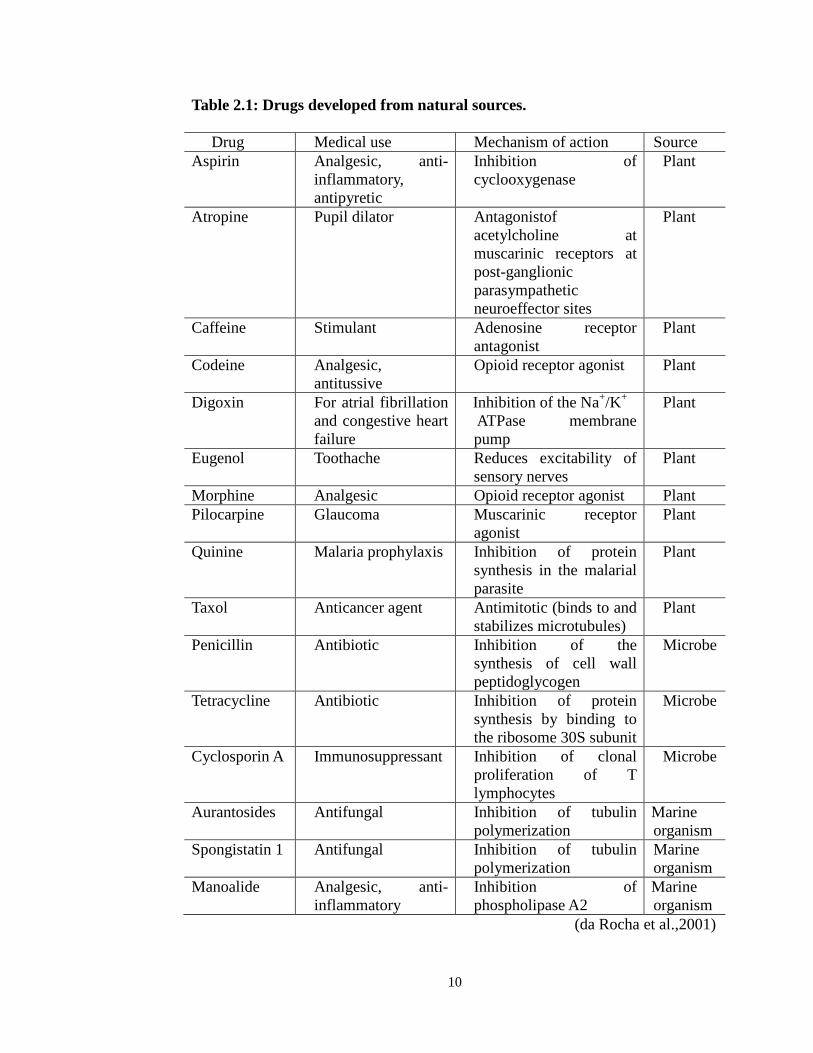
Table 2.1: Drugs developed from natural sources. Drug Medical use Mechanism of action Source Aspirin Analgesic, anti-
inflammatory, antipyretic
Inhibition of cyclooxygenase
Plant
Atropine Pupil dilator Antagonistof acetylcholine at muscarinic receptors at post-ganglionic parasympathetic neuroeffector sites
Plant
Caffeine Stimulant Adenosine receptor antagonist
Plant
Codeine Analgesic, antitussive
Opioid receptor agonist Plant
Digoxin For atrial fibrillation and congestive heart failure
Inhibition of the Na+/K+
ATPase membrane pump
Plant
Eugenol Toothache Reduces excitability of sensory nerves
Plant
Morphine Analgesic Opioid receptor agonist Plant Pilocarpine Glaucoma Muscarinic receptor
agonist Plant
Quinine Malaria prophylaxis Inhibition of protein synthesis in the malarial parasite
Plant
Taxol Anticancer agent Antimitotic (binds to and stabilizes microtubules)
Plant
Penicillin Antibiotic Inhibition of the synthesis of cell wall peptidoglycogen
Microbe
Tetracycline Antibiotic Inhibition of protein synthesis by binding to the ribosome 30S subunit
Microbe
Cyclosporin A Immunosuppressant Inhibition of clonal proliferation of T lymphocytes
Microbe
Aurantosides Antifungal Inhibition of tubulin polymerization
Marine organism
Spongistatin 1 Antifungal Inhibition of tubulin polymerization
Marine organism
Manoalide Analgesic, anti-inflammatory
Inhibition of phospholipase A2
Marine organism
(da Rocha et al.,2001)
10
2.2 Research on Sinularia sp.
Soft corals, or Alcyonacea, are included in the subclass Octacorallia
because they have tentacles and internal body divisions in multiples of eight.
They belong to the class of Anthozoa of phylum Cnidaria, the stinging-celled
animals. They are found in parts of the reef with the greatest current, facing the
open ocean. This is due to the fact that soft corals rely on currents to bring them
food and oxygen, and carry away their wastes. Soft corals tend to produce
smooth mucous coating and it is colonized by bacteria. Some bacteria can be
pathogenic and cause disease but some bacteria could serve as beneficial
symbionts. However, corals are able to get rid of the bacteria by self cleansing of
mucus from their surface (Kelman et al., 2006).
The Genus Sinularia is one of the most widely distributed soft coral in the
tropical reef. During the past decade, many bioactive metabolites have been
reported and it hasyielded many new skeletal structures such as unusual
sesquiterpenes, cembranediterpenes and sterols.
To date, not much researches that have been done on the soft coral
Sinularia sp. although a large variety of natural products is expected from the soft
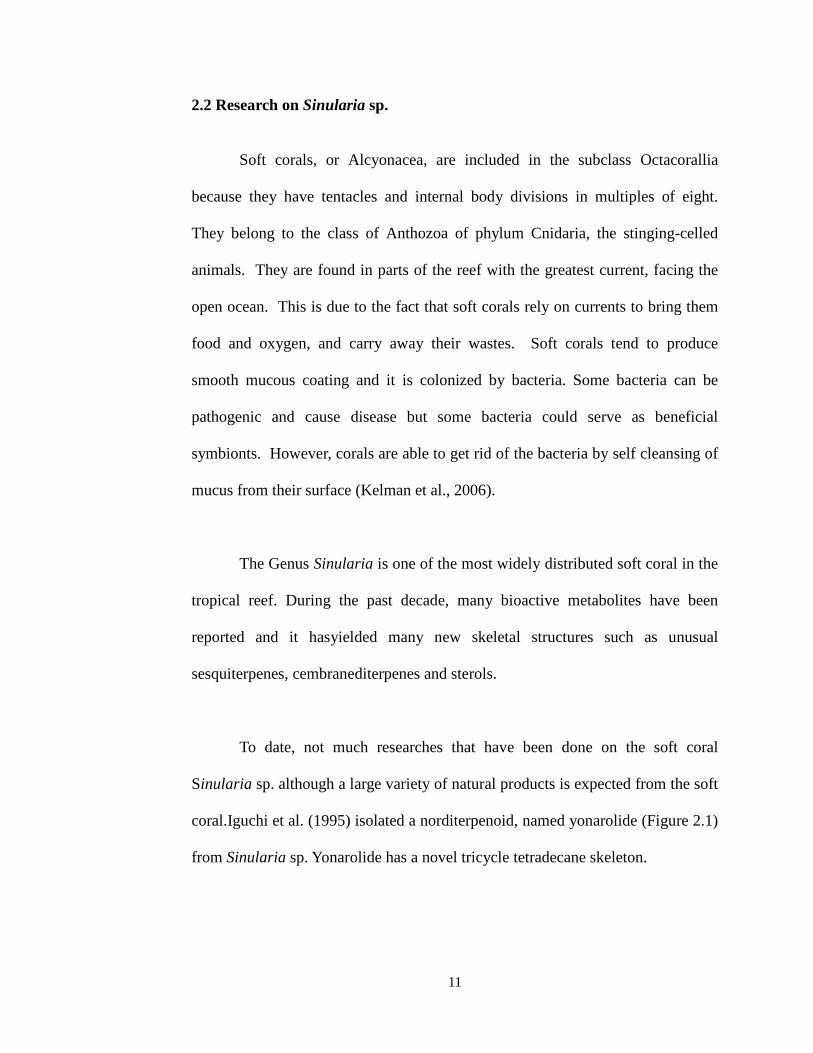
coral.Iguchi et al. (1995) isolated a norditerpenoid, named yonarolide (Figure 2.1)
from Sinularia sp. Yonarolide has a novel tricycle tetradecane skeleton.
11
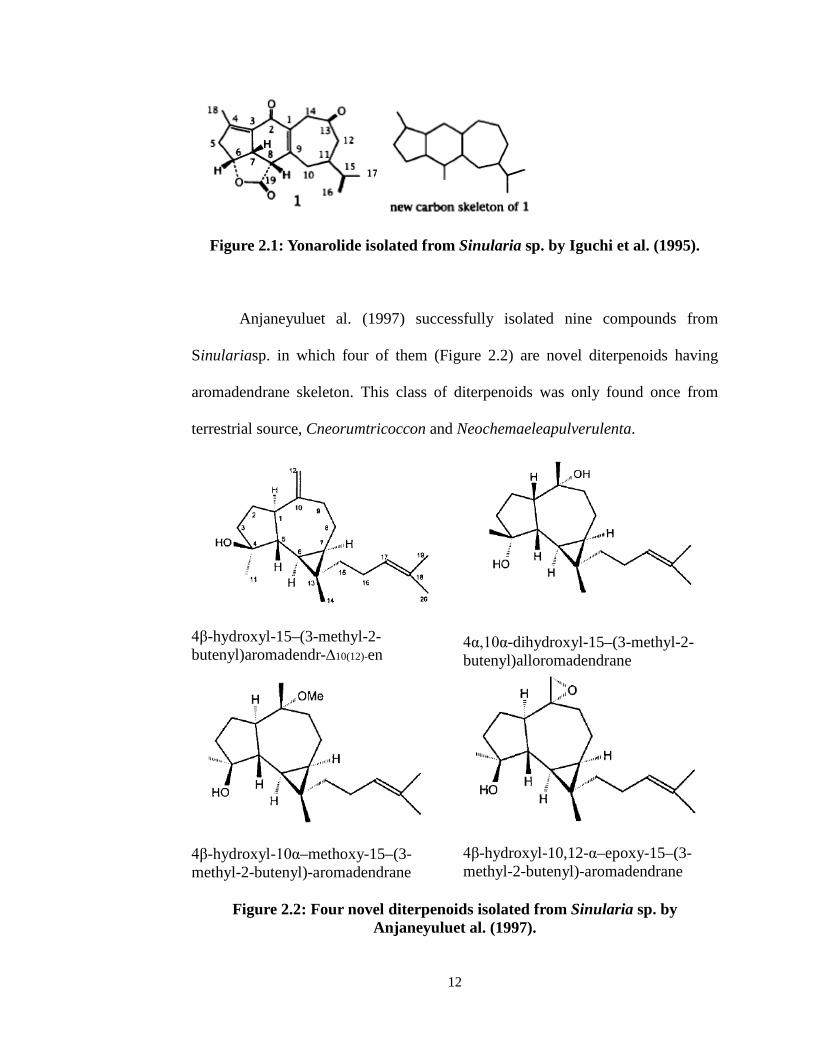
Figure 2.1: Yonarolide isolated from Sinularia sp. by Iguchi et al. (1995).
Anjaneyuluet al. (1997) successfully isolated nine compounds from
Sinulariasp. in which four of them (Figure 2.2) are novel diterpenoids having
aromadendrane skeleton. This class of diterpenoids was only found once from
terrestrial source, Cneorumtricoccon and Neochemaeleapulverulenta.
4β-hydroxyl-15–(3-methyl-2-butenyl)aromadendr-∆10(12)-en
4α,10α-dihydroxyl-15–(3-methyl-2-butenyl)alloromadendrane
4β-hydroxyl-10α–methoxy-15–(3-methyl-2-butenyl)-aromadendrane
4β-hydroxyl-10,12-α–epoxy-15–(3-methyl-2-butenyl)-aromadendrane
Figure 2.2: Four novel diterpenoids isolated from Sinularia sp. by
Anjaneyuluet al. (1997).
12
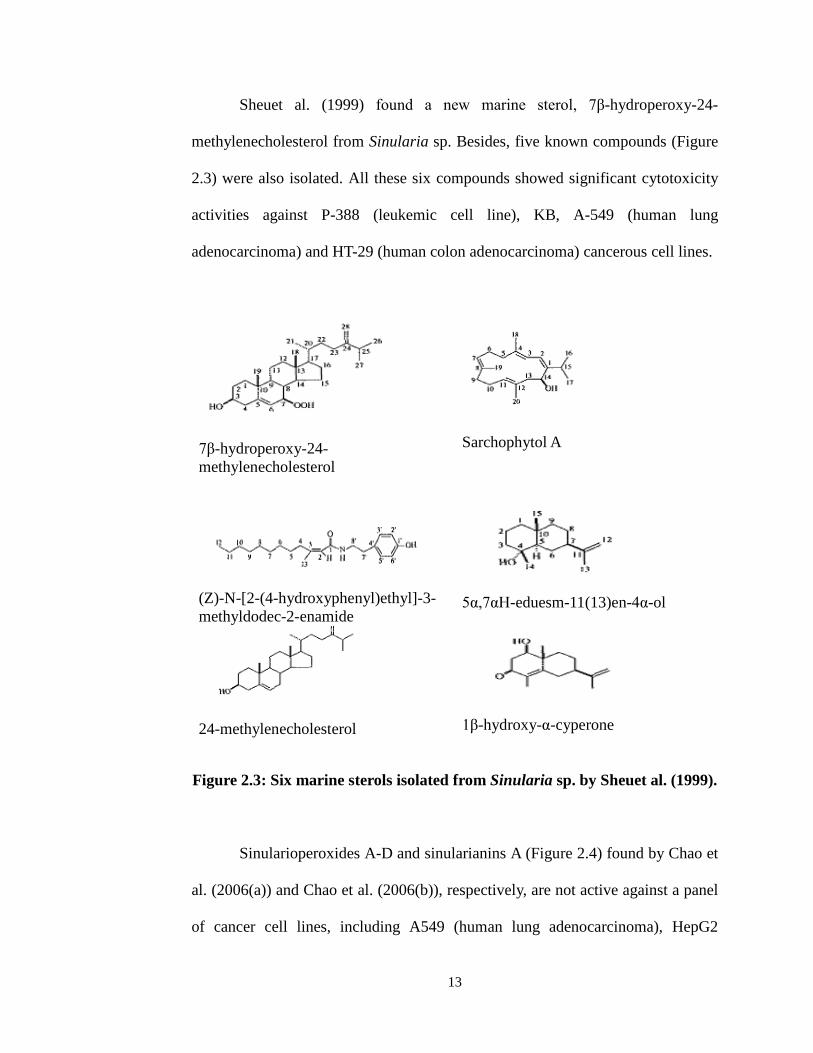
Sheuet al. (1999) found a new marine sterol, 7β-hydroperoxy-24-
methylenecholesterol from Sinularia sp. Besides, five known compounds (Figure
2.3) were also isolated. All these six compounds showed significant cytotoxicity
activities against P-388 (leukemic cell line), KB, A-549 (human lung
adenocarcinoma) and HT-29 (human colon adenocarcinoma) cancerous cell lines.
7β-hydroperoxy-24-methylenecholesterol
Sarchophytol A
(Z)-N-[2-(4-hydroxyphenyl)ethyl]-3-methyldodec-2-enamide
5α,7αH-eduesm-11(13)en-4α-ol
24-methylenecholesterol
1β-hydroxy-α-cyperone
Figure 2.3: Six marine sterols isolated from Sinularia sp. by Sheuet al. (1999).
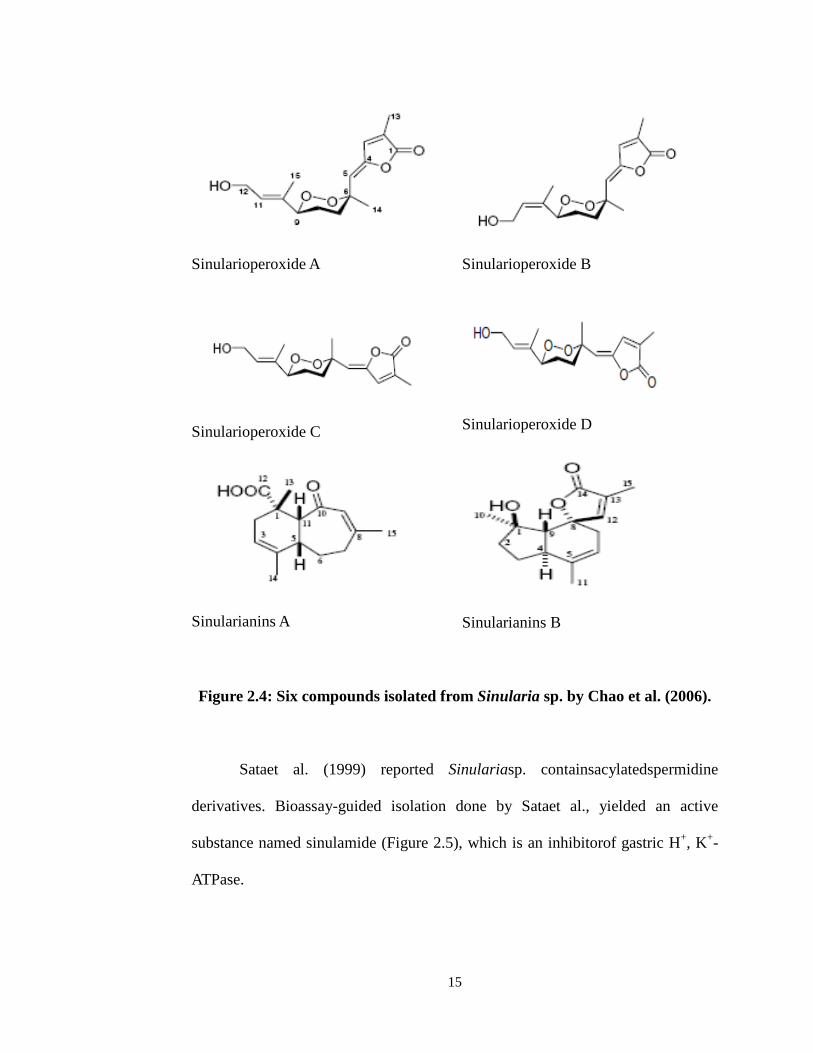
Sinularioperoxides A-D and sinularianins A (Figure 2.4) found by Chao et
al. (2006(a)) and Chao et al. (2006(b)), respectively, are not active against a panel
of cancer cell lines, including A549 (human lung adenocarcinoma), HepG2
13
(human hepatocellular carcinoma), MCF7 and MAD-MB-231 (both human breast
carcinoma) cells although cyclic peroxides often exhibit a wide spectrum of
biological activities including cytotoxic against cancer cells and antiparasitic
activities. Both sinularioperoxides and sinularianins A are sesquiterpenoids.
Sinularioperoxides possess a cyclic peroxide and a γ-alkylidene-α-methyl-α,β-
unsaturated γ-lactone moieties.While, sinularianins A, possesses a bicyclic
skeleton,sinulariolane.SinularianinB found by Chao et al. (2006(b)) has a
valerenane skeleton, with a spiro-butenolide moiety, which had been reported to
occur in plants. Due to low yield of sinularianins B, the cytotoxicity of this
metabolite toward the above cell lines has not been determined.
14
Sinularioperoxide A
Sinularioperoxide B
Sinularioperoxide C
Sinularioperoxide D
Sinularianins A
Sinularianins B
Figure 2.4: Six compounds isolated from Sinularia sp. by Chao et al. (2006).
Sataet al. (1999) reported Sinulariasp. containsacylatedspermidine
derivatives. Bioassay-guided isolation done by Sataet al., yielded an active
substance named sinulamide (Figure 2.5), which is an inhibitorof gastric H+, K+-
ATPase.
15
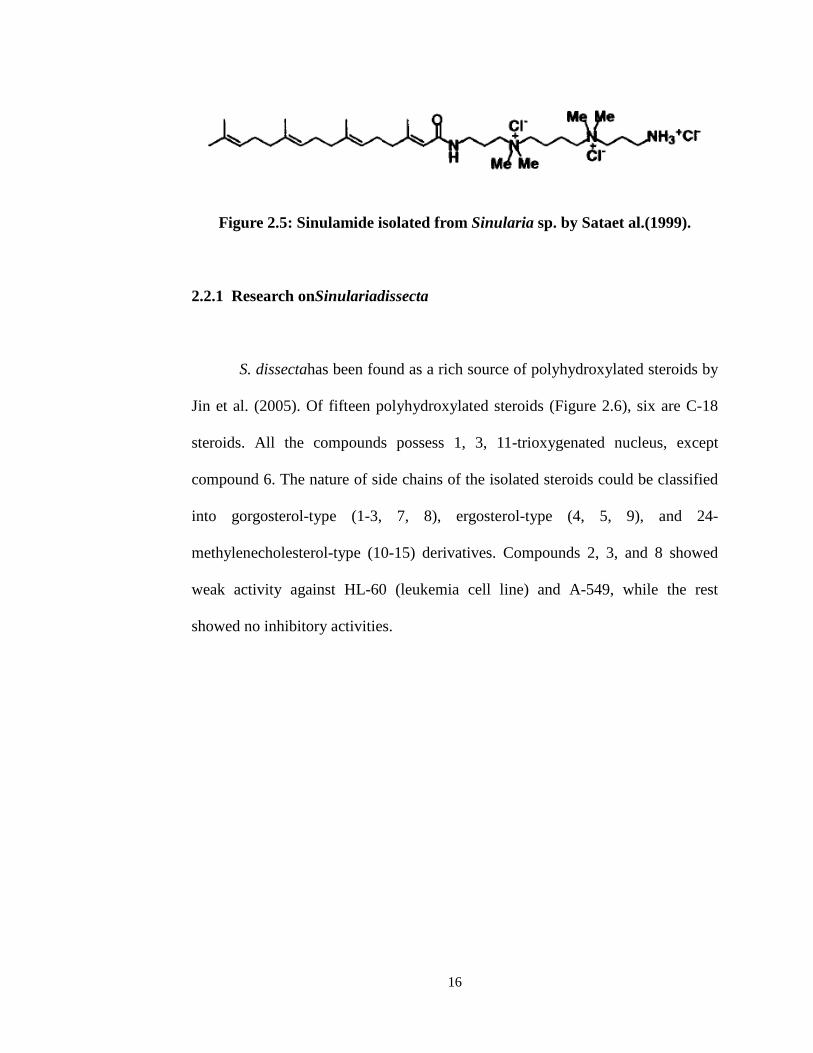
Figure 2.5: Sinulamide isolated from Sinularia sp. by Sataet al.(1999).
2.2.1 Research onSinulariadissecta
S. dissectahas been found as a rich source of polyhydroxylated steroids by
Jin et al. (2005). Of fifteen polyhydroxylated steroids (Figure 2.6), six are C-18
steroids. All the compounds possess 1, 3, 11-trioxygenated nucleus, except
compound 6. The nature of side chains of the isolated steroids could be classified
into gorgosterol-type (1-3, 7, 8), ergosterol-type (4, 5, 9), and 24-
methylenecholesterol-type (10-15) derivatives. Compounds 2, 3, and 8 showed
weak activity against HL-60 (leukemia cell line) and A-549, while the rest
showed no inhibitory activities.
16
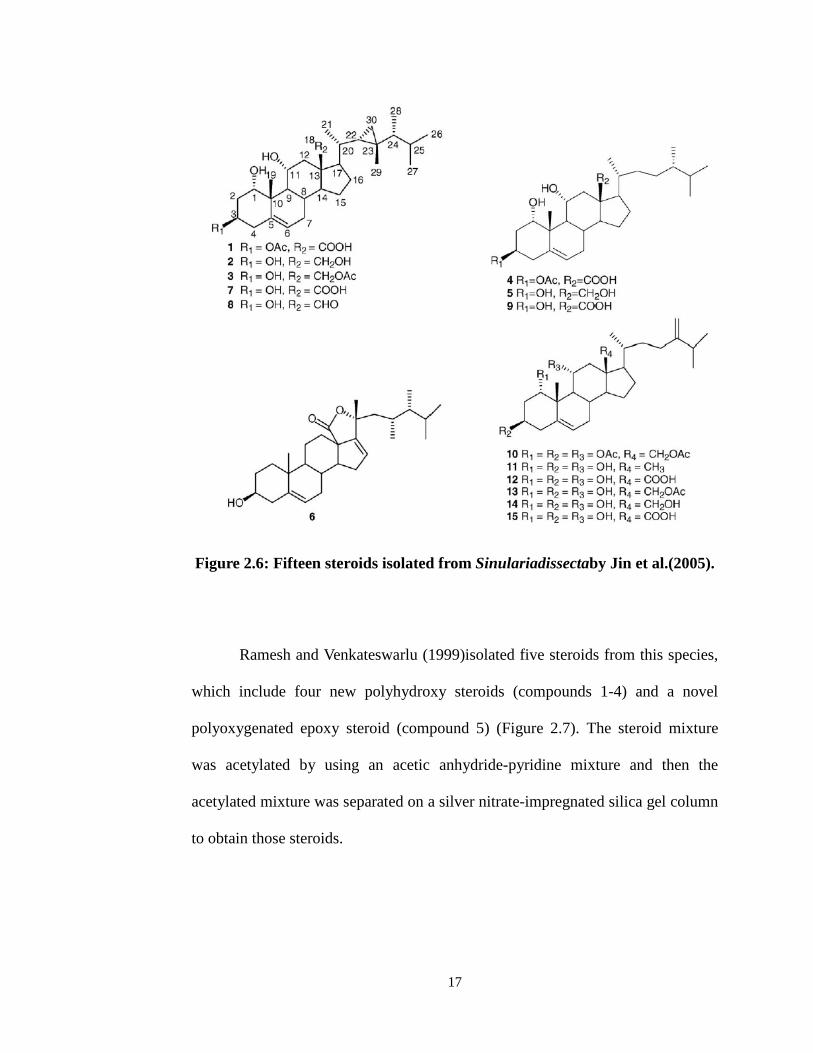
Figure 2.6: Fifteen steroids isolated from Sinulariadissectaby Jin et al.(2005).
Ramesh and Venkateswarlu (1999)isolated five steroids from this species,
which include four new polyhydroxy steroids (compounds 1-4) and a novel
polyoxygenated epoxy steroid (compound 5) (Figure 2.7). The steroid mixture
was acetylated by using an acetic anhydride-pyridine mixture and then the
acetylated mixture was separated on a silver nitrate-impregnated silica gel column
to obtain those steroids.
17
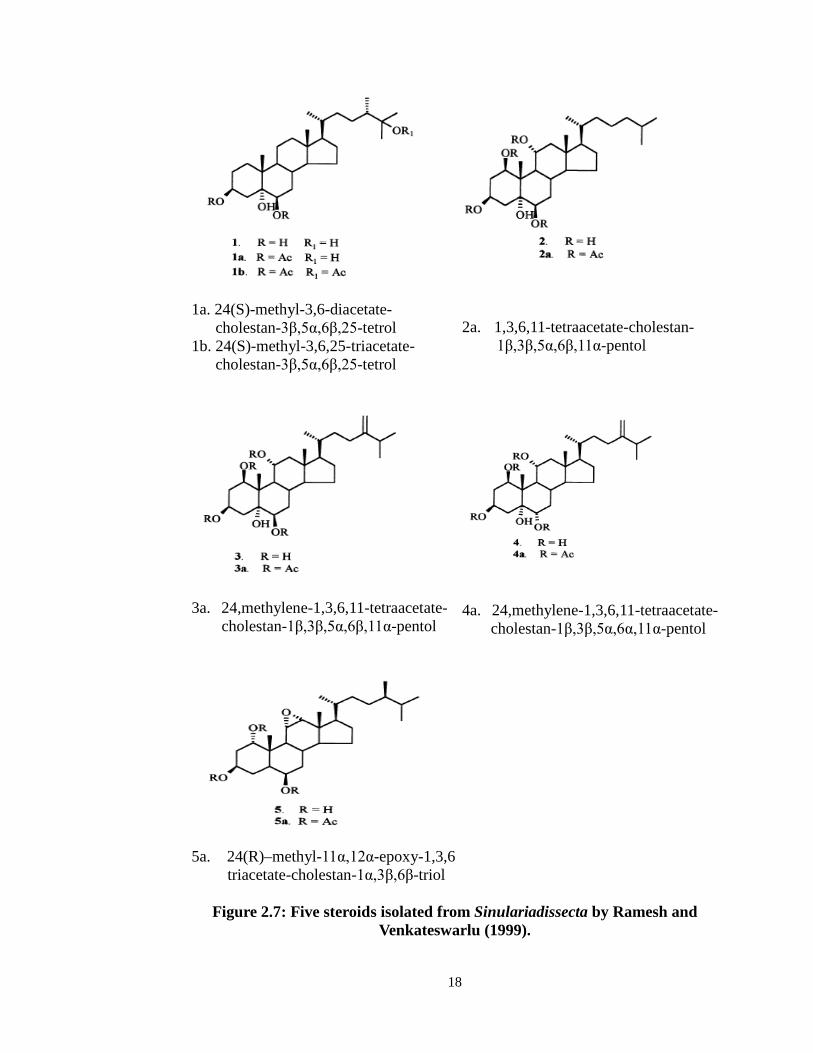
1a. 24(S)-methyl-3,6-diacetate- cholestan-3β,5α,6β,25-tetrol
1b. 24(S)-methyl-3,6,25-triacetate- cholestan-3β,5α,6β,25-tetrol
2a. 1,3,6,11-tetraacetate-cholestan-
1β,3β,5α,6β,11α-pentol
3a. 24,methylene-1,3,6,11-tetraacetate-cholestan-1β,3β,5α,6β,11α-pentol
4a. 24,methylene-1,3,6,11-tetraacetate-
cholestan-1β,3β,5α,6α,11α-pentol
5a. 24(R)–methyl-11α,12α-epoxy-1,3,6triacetate-cholestan-1α,3β,6β-triol
Figure 2.7: Five steroids isolated from Sinulariadissecta by Ramesh and
Venkateswarlu (1999).
18
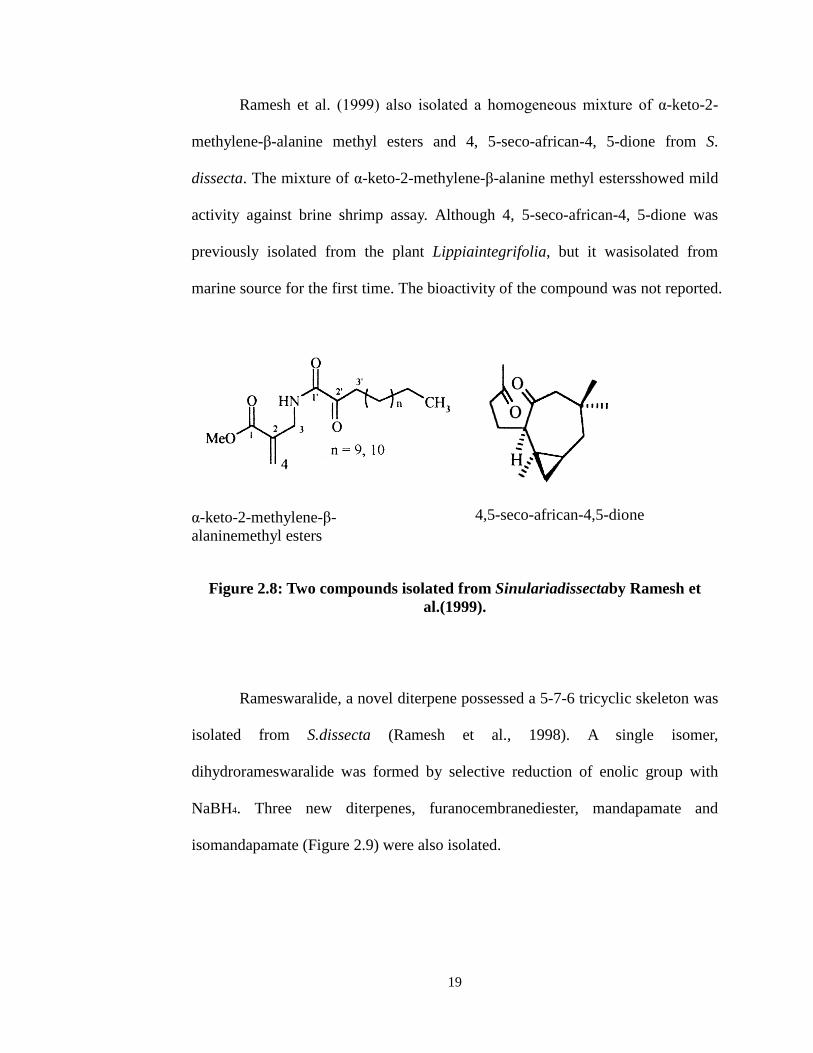
Ramesh et al. (1999) also isolated a homogeneous mixture of α-keto-2-
methylene-β-alanine methyl esters and 4, 5-seco-african-4, 5-dione from S.
dissecta. The mixture of α-keto-2-methylene-β-alanine methyl estersshowed mild
activity against brine shrimp assay. Although 4, 5-seco-african-4, 5-dione was
previously isolated from the plant Lippiaintegrifolia, but it wasisolated from
marine source for the first time. The bioactivity of the compound was not reported.
α-keto-2-methylene-β-alaninemethyl esters
4,5-seco-african-4,5-dione
Figure 2.8: Two compounds isolated from Sinulariadissectaby Ramesh et al.(1999).
Rameswaralide, a novel diterpene possessed a 5-7-6 tricyclic skeleton was
isolated from S.dissecta (Ramesh et al., 1998). A single isomer,
dihydrorameswaralide was formed by selective reduction of enolic group with
NaBH4. Three new diterpenes, furanocembranediester, mandapamate and
isomandapamate (Figure 2.9) were also isolated.
19
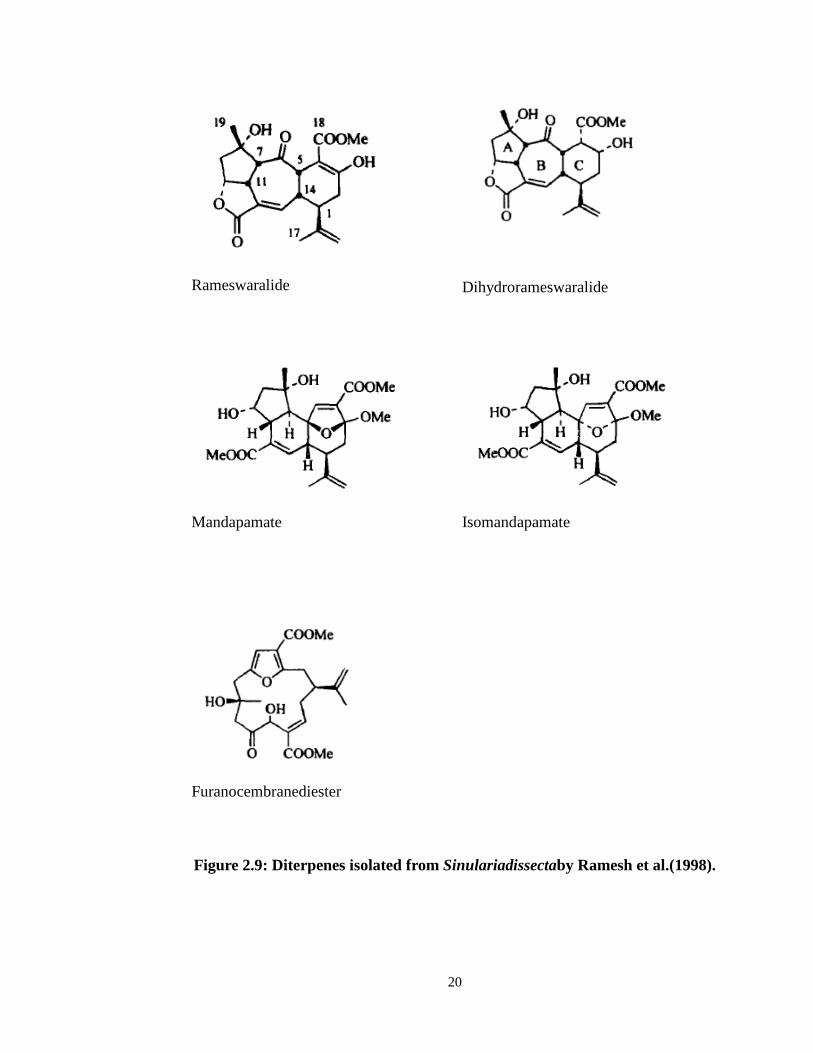
Rameswaralide
Dihydrorameswaralide
Mandapamate
Isomandapamate
Furanocembranediester
Figure 2.9: Diterpenes isolated from Sinulariadissectaby Ramesh et al.(1998).
20
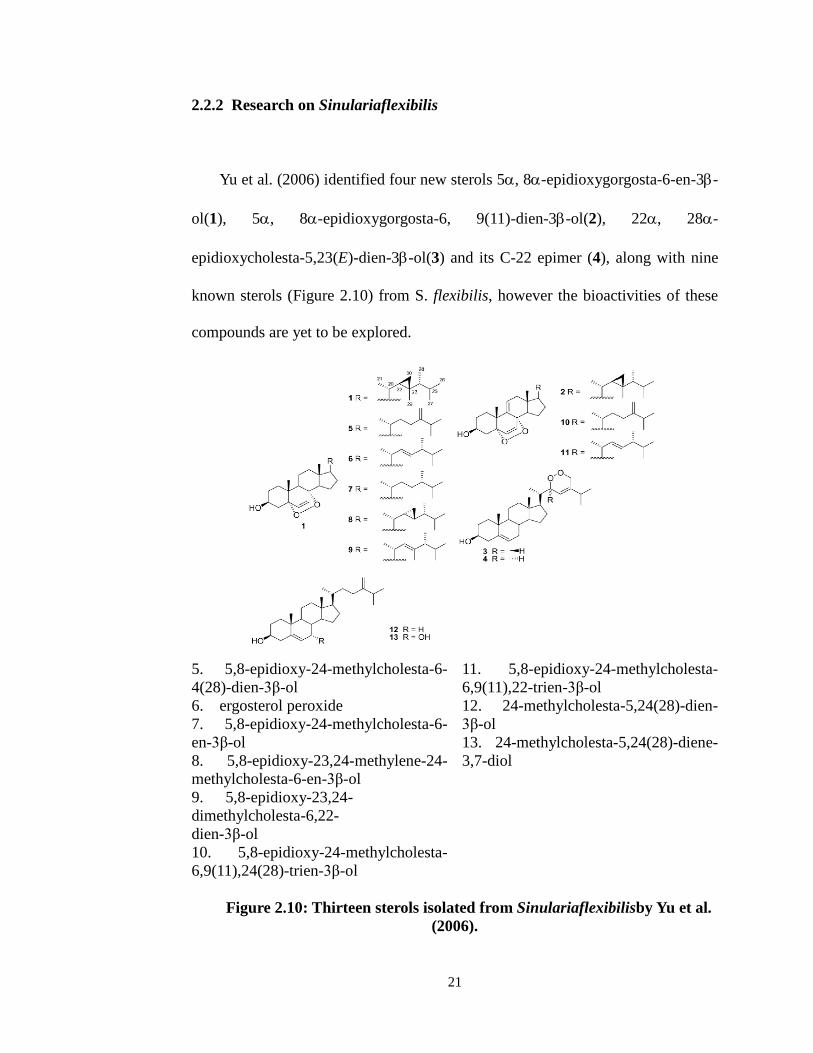
2.2.2 Research on Sinulariaflexibilis
Yu et al. (2006) identified four new sterols 5α, 8α-epidioxygorgosta-6-en-3β-
ol(1), 5α, 8α-epidioxygorgosta-6, 9(11)-dien-3β-ol(2), 22α, 28α-
epidioxycholesta-5,23(E)-dien-3β-ol(3) and its C-22 epimer (4), along with nine
known sterols (Figure 2.10) from S. flexibilis, however the bioactivities of these
compounds are yet to be explored.
5. 5,8-epidioxy-24-methylcholesta-6- 4(28)-dien-3β-ol 6. ergosterol peroxide 7. 5,8-epidioxy-24-methylcholesta-6- en-3β-ol 8. 5,8-epidioxy-23,24-methylene-24-methylcholesta-6-en-3β-ol 9. 5,8-epidioxy-23,24-dimethylcholesta-6,22-dien-3β-ol 10. 5,8-epidioxy-24-methylcholesta-6,9(11),24(28)-trien-3β-ol
11. 5,8-epidioxy-24-methylcholesta-6,9(11),22-trien-3β-ol 12. 24-methylcholesta-5,24(28)-dien-3β-ol 13. 24-methylcholesta-5,24(28)-diene-3,7-diol
Figure 2.10: Thirteen sterols isolated from Sinulariaflexibilisby Yu et al. (2006).
21
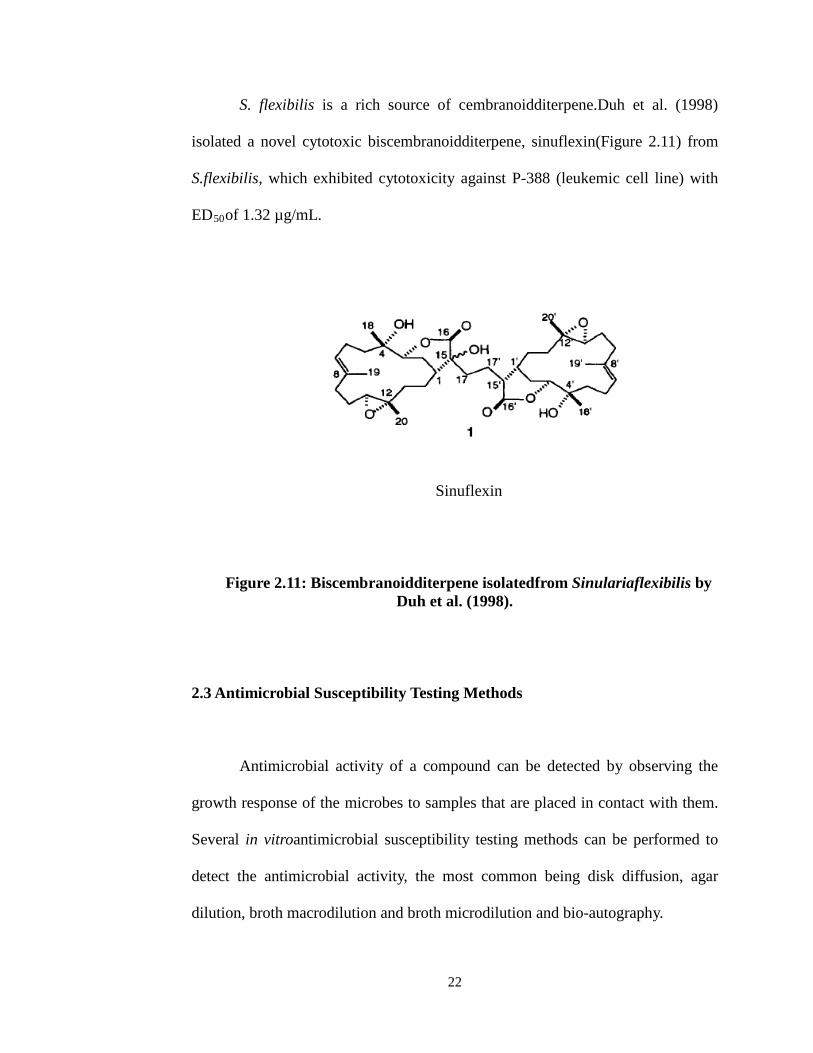
S. flexibilis is a rich source of cembranoidditerpene.Duh et al. (1998)
isolated a novel cytotoxic biscembranoidditerpene, sinuflexin(Figure 2.11) from
S.flexibilis, which exhibited cytotoxicity against P-388 (leukemic cell line) with
ED50of 1.32 µg/mL.
Sinuflexin
Figure 2.11: Biscembranoidditerpene isolatedfrom Sinulariaflexibilis by
Duh et al. (1998).
2.3 Antimicrobial Susceptibility Testing Methods Antimicrobial activity of a compound can be detected by observing the
growth response of the microbes to samples that are placed in contact with them.
Several in vitroantimicrobial susceptibility testing methods can be performed to
detect the antimicrobial activity, the most common being disk diffusion, agar
dilution, broth macrodilution and broth microdilution and bio-autography.
22
2.3.1 Disc Diffusion Method
The antimicrobial activity of different extracts and pure compounds can be
measured using numerous in vitroassays, but discdiffusion methodremains the
most commonly used method.It is based on the measurement of zones of growth
inhibition from the effect of known concentrations of an antimicrobial agent
diffuse from impregnated discs onto an agar plate, which has previously been
inoculated with the test organism. The result obtained provides information
whether the organism is sensitive, intermediate or resistant to the antimicrobial
agent after suitable incubation period (McGrillet al., 2009). This method is
technically easy to perform, relatively inexpensive, reproducible, and the drug
combinations can be changed easily (Lestari et al., 2008).
2.3.2 Broth Dilution Method
Broth macrodilution andmicrodilution methods are recommended by
Clinical and Laboratory Standards Institute (CLSI) for minimum inhibitory
concentration (MIC) determination (NCCLS, 2003).Broth dilution is a method in
which a predetermined concentration of suspension of bacterium is tested against
varying concentrations of an antimicrobial agent in a liquid medium. The broth
macrodilution method is performed in tubes containing a minimum volume of 2
mL while microdilutionis performed in smaller volumes using microtitration
plates. It is usually performed as serial dilution. Broth dilution method is a more
23
complicated and expensive method compared with discdiffusion method but it is
useful to quantify antimicrobial activity of various extracts for comparative
purposes (Teffoet al., 2010). Besides, this method can avoid the problems
associated with agar diffusion techniques, for example difficulties in diffusion of
non-polar extracts through an aqueous agar matrix (Eloffet al., 2008). The use of
microplates also allows various concentrations to be assessed in the same time.
The MIC could be assessed either spectrophotometrically or with the aid of
colorimetric growth indicator, the indicator commonly used are p-
Iodonitrotetrazolium violet or resazurin (Eloff et al.,2007;Liu et al., 2007).
2.3.3 Bio-autography Method
Three approaches are used in bio-autographic method: (a) direct bio-
autography in which the microorganism grow directly on the thin layer
chromatographic (TLC) plate, (b) contact bio-autography in which the
antimicrobial compounds are transferred from TLC plate onto an agar plate which
contains the microorganism, (c) agar-overlay bio-autography in which the TLC
plate places directly onto an agar plate which contains the microorganism (Cos et
al., 2006). This method is useful in detecting the number of bioactive compounds
present in an extract. However, this method is problematic with fungi as fungi
grow more slowly than bacteria and thus it increases the contamination rate (Eloff
et al., 2008).
24
2.4 Fungi
Fungi are eukaryotic microorganisms which include yeast, mould and
dimorphism.Dimorphic fungi are fungi which can grow as a mould or as yeast
(Gerard et al., 2012). Fungi are ubiquitous in the environment, and infection due
to fungal pathogens has become more frequent. Fungal diseases can be divided
clinically into superficial mycoses, subcutananeous mycoses, systemic mycoses
and opportunistic mycoses. Clinically, candidiasis, aspergillosis and
cryptococcosis are the three major infections in the immune-compromised
patients.
2.4.1 Cryptococcus neoformans
Cryptococcus neoformans is a fungal pathogen and the causative agent of
cryptococcosis. This organism produces a unique capsule which is a complex
polymer, the major component of the capsule mass is glucuronoxylomannan
(Heiss et al., 2009). Pigeon droppings and soil contaminated with fecal material
are considered the reservoir of C. neoformans in nature. The primary disease
caused by C. neoformans is chronic meningitis. The onset is slow, with a low-
grade fever and headache progressing to altered mental state. Most patients are
immune compromised, although some show no immune defect. This fungus is
found throughout the world.The disease is transmitted through inhalation of the
yeast cells. It is the most common fungal infection seen in acquired
25
immunodeficiency syndrome (AIDS) (Mader 2010). C. neoformans also causes
infections in a wide range of domestic and wild animals, for example,
cryptococcosis is the most common fungal disease in cats (Jacobs and Medleau,
1998).
2.4.2 CandidaSpecies
Candida albicansexists in the yeast form as normal flora but becomes
invasive in the filamentous form.Infection caused byCandida sp. is referred to as
candidiasis and is the most common cause of opportunistic mycoses worldwide.
Candida sp. is a normal inhabitant of human gastrointestinal and genital tract.
Candida infection is a common disease of lower genital tract in women, young
age, pre-menopausal status, use of oral contraceptives, and history of diabetes are
associated with an increased risk (Parazziniet al., 2000). Besides, colonization of
the mouth by Candida sp. has also been well known since the age of Hippocrates,
isolated from various oral sites including tongue, cheek and palatal mucosa, and
from dental plaque, dental caries, and the subgingival flora. Some have important
roles in the development of oral and dental diseases (Senet al., 1997).
2.4.3Aspergillusniger
The genus of Aspergillus is moulds which arewidespread in the
environment, being found in the soil, in the air, on plants and on decomposing
26
organic matter. Aspergillus sp. is also opportunistic pathogens that cause
aspergillosis especially in immune-compromised patients. Besides, otomycosis is
another fungal infection caused by Aspergillus sp. particularlyby A. fumigatus, A.
niger and A. flavus. Otomycosis or fungal otitis external is described as fungal
infection of the external auditory canal with infrequent complications involving
the middle ear. Although otomycosisrarely life-threatening, but the disease
requires long term treatment and follow-up, yet the recurrence rate remains high.
This infection distributes worldwide but it is more common in tropical and
subtropical regions and occurs in adults of both sexes but children are less
commonly affected (Aktas and Yigit2009).
2.4.4 Trichophytonmentagrophytes
Epidermophyton, Microsporumand Trichophyton are the three genera of
dermatophytes that affect keratinous tissue of humans and of other vertebrates,
causing superficial infections (Karaca and Koc 2004). These fungi are highly
adapted to the non-living, keratinized tissues of nail, hair and the stratum corneum
of the skin. Production of keratinase allows dermatophytes to digest keratin in
skin, nail and hairs. Dermatophytoses are slowly progressive eruptions of the skin
and its appendages which are not painful or life-threatening, but typically involve
induration, itching, erythema and scaling. Dermatophytoses are common skin
infections in domestic animals, especially dogs and cats. The transmission of
dermatophytes to humans from dogs and cats usually occurs through direct
27
contact or indirectly through fungus-bearing hair and scales from infected animals
(Ateset al., 2008).
2.5 Bacteria
Bacteria are a large group of unicellular, prokaryotemicroorganisms. They
are classified based on their cell wall characterization by Gram staining method.
Gram staining methods are designed to make a staining agent binds to the
bacteria’s cell wall. The classification is largely based on the difference of cell
wall structure. Gram-positive bacteria are classified as bacteria that retain a
crystal violet dye during the Gram stain process and will appear blue or violet
under microscope, whereas Gram-negative bacteria will appear red or pink
(Mader 2010).
2.5.1 Staphylococcusaureus
Staphylococcus aureus is a Gram-positive, spherical bacterium. S. aureus
frequently lives as commensal on human skin or in the nose of a healthy person. It
also occurs in the throat and less commonly, may be found in the colon and urine.
The most common infections are those of the skin and soft tissues, including
cellulitis, impetigo and soft tissue abscesses. S. aureusis also the most common
cause of bone and joint infections such as acute and vertebral osteomyelitis. The
bacterial infection is also the cause of morbidity and mortality in renal patients
28
aleading cause ofhaemodialysis related bacteraemia (Casey et al., 2007; Rowe et
al., 2002).
2.5.2Bacillus cereus
Bacillus cereus is a Gram-positive, aerobic, rod-shaped bacterium.It is
commonly found in soil with low nutrient requirement. B. cereus is a common
food poisoning organism; it can cause two types of food poisoning: a diarrheal
type which is associated with consumption of contaminated milk product, meat
and vegetables. While the emetic type is due to the consumption of contaminated
rice and pasta.It is known to create heavy nausea, vomiting, and abdominal pain.
These foodborne illnesses occur due to survival of the B. cereus spores. It is an
opportunistic pathogen that caused variety of infections, such as endophthalmitis,
bacteremia, septicemia, endocarditis,salpingitis, cutaenous infections, pneumonia
and meningitis in immunocompromised patients (Kotirantaet al., 2000; Rasko et
al.,2005).
2.5.3Pseudomonas aeruginosa
Pseudomonas aeruginosa is a Gram-negative, aerobic, rod-shaped, and
glucose-nonfermentativebacterium. It typically infects the pulmonary
tract, urinary tract, burns, wounds, and also causes other blood infections. It is
also one of the most prevalent pathogens in nosocomial pneumonia (Fujimura et
29
al.,2009).
2.5.4Escherichia coli
Escherichia coliis a Gram-negative, aerobic and facultative anaerobic,
non-spore-forming, rod-shaped bacterium. It generally causes several intestinal
and extra-intestinal infections such as urinary tract
infections, meningitis, peritonitis, mastitis, septicemia and pneumonia(Madigan
and Martinko 2006).
2.5.5Klebsiellapneumoniae
K. pneumoniae is a Gram-negative, lactosefermenting, facultative anaerobic,
rod shaped bacterium distributed widely in the natural environment. It is also
found in the normal flora of the skin, and intestines (Legakis et al., 1995). K.
pneumoniae is an opportunistic pathogen that infects immune-compromised and
immune-suppressed patients. Besides, these bacterial infections can also lead to
human urinary or respiratory tractinfections (Huang et al., 2009).
2.6PhotodynamicTherapy
Cancer is a disease in which involves with changes or mutations in the
genomes of cells. It causes a group of cells grow uncontrollably regardless the
normal processes of cell division. There are two groups of factors result cancer:
30
external factors in the environment (chemical, tobacco, radiation and infectious
microorganisms) and factors within the cell (hormones, mutations and immune
condition) (Reddy et al., 2003).
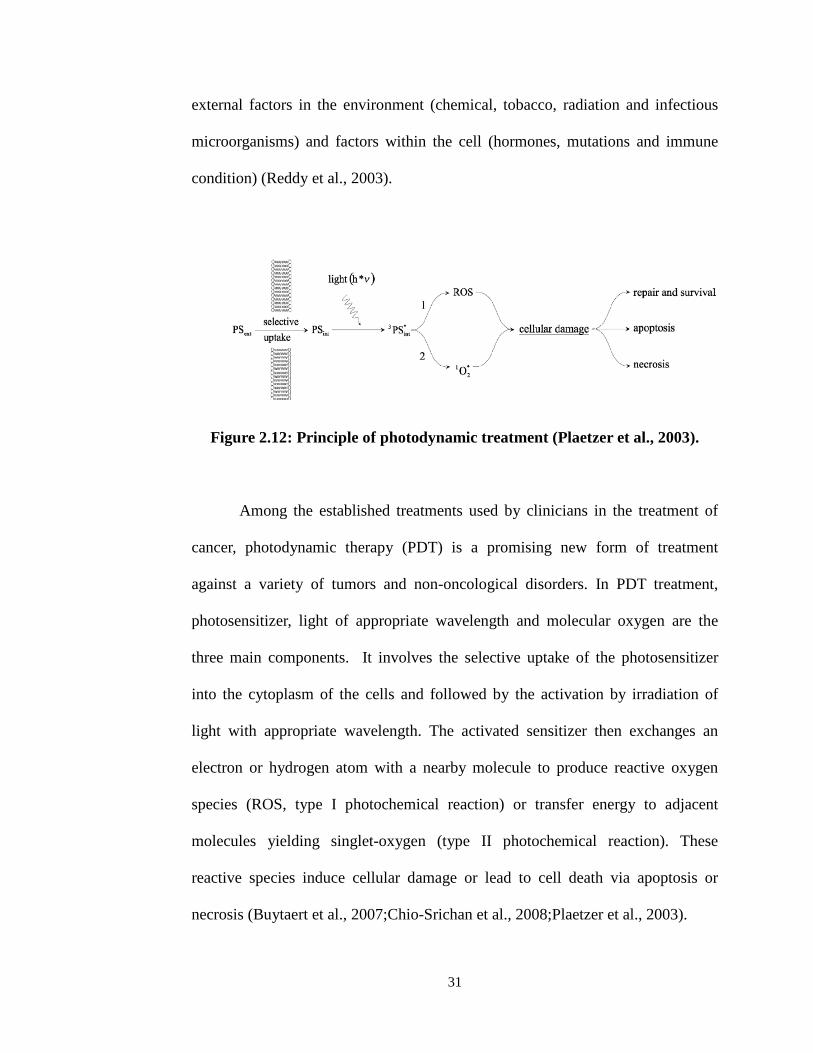
Figure 2.12: Principle of photodynamic treatment (Plaetzer et al., 2003).
Among the established treatments used by clinicians in the treatment of
cancer, photodynamic therapy (PDT) is a promising new form of treatment
against a variety of tumors and non-oncological disorders. In PDT treatment,
photosensitizer, light of appropriate wavelength and molecular oxygen are the
three main components. It involves the selective uptake of the photosensitizer
into the cytoplasm of the cells and followed by the activation by irradiation of
light with appropriate wavelength. The activated sensitizer then exchanges an
electron or hydrogen atom with a nearby molecule to produce reactive oxygen
species (ROS, type I photochemical reaction) or transfer energy to adjacent
molecules yielding singlet-oxygen (type II photochemical reaction). These
reactive species induce cellular damage or lead to cell death via apoptosis or
necrosis (Buytaert et al., 2007;Chio-Srichan et al., 2008;Plaetzer et al., 2003).
31
CHAPTER 3.0
MATERIAL AND METHODS
3.1 Sample Collection and Extraction
The chemicals used were:
Hexane (Merck, AR grade), diethyl ether (Merck, AR grade ), chloroform (Merck,
AR grade), ethyl acetate (Merck, AR grade), acetone (Merck, AR grade),
methanol (Merck, AR grade)
Sinulariasp. was collected from Tanjung Tuan Port Dickson, Negeri
Sembilan on four different days, 13th May 2008, 28th April 2009, 12th December
2009 and 13th April 2012. The specimens were washed thoroughly with sea water
to remove soil and debris and it was kept in the ice box while on the way to the
laboratory. They were later frozen immediately and stored.
The soft coral was thawed before extraction was carried out, they were cut
into small pieces and subjected to freeze drying (Model: Martin Christ, Alpha 1-4,
LD plus). 1.58kg of lyophilized sample was blended into a fine
powder.Lyophilized samples of Sinularia sp. were subjected to sequential
extraction using organic solvents of increasing polarities, i.e. hexane (0), diethyl
32
ether (2.8), chloroform (4.1), ethyl acetate (4.4), acetone (5.1), methanol (5.1) and
water (9) at a ratio of 1g: 10mL. The sample was immersed in hexane and left on
an orbital shaker (Model: IKA) at 120 rpm overnight. The extract was filtered
with Whatman 542 filter paper. The filtrates were kept while the sample was
added with hexane again and shook for another night. The steps were repeated
two to three times and continued with the next solvent. The steps were monitored
by thin layer chromatography. The extracts collected were concentrated under
vacuum by rotary evaporator (Model: BuchiRotavapor R-200) to remove the
solvent and further dried using a vacuum concentrator. The seven different
extracts were screened for their cytotoxicity, antibacterial and antifungal activities.
3.2 Microbial Susceptibility Testing
Principle:
The antimicrobial activity of compounds can be assessed by observing the
growth response of the microbes that are in contact with them. Several invitro
susceptibility testsmay be used for detecting antimicrobial activity, the most
common being disk diffusion, agar dilution, broth macrodilution and broth
microdilution and bio-autographic.
A Colorimetric broth microdilution method was used in solvent toxicity
testing, antibacterial and antifungal assays. Broth microdilution allows varied
concentrations to be assessed at the same time on the same microplate(Liu et al.,
33
2007). This avoids the problems associated with agar diffusion techniques, for
example difficulty in the diffusion of non-polar extracts through an aqueous agar
matrix (Eloffet al., 2008). The MIC value could also be quantified easily either
spectrophotometrically or with the aid of a colorimetric growth indicator (Liu et
al., 2007).
Procedures:
The test was performed on sterile and untreated 96 U-bottom well plate. It
was performed as serial two-fold dilutions, performed by removing 50µL of
contents from wells in the second column and transferring these to the wells in the
third column. Serial dilution was repeated until the eleventh column was reached.
p-Iodonitrotetrazolium violet (INT) was used as the growth indicator in the assay.
The MIC was defined as the lowest concentration of solvent/ extract/ fraction in
which there was no microbial growth, indicated by the absence ofcolour
change.The total activity (mL) of each fraction was calculated as the total mass
(mg) of the extract divided by the MIC value (mg/mL). The total activity value
indicates the volume to which an extract or a fraction derived from 1g of sample
material can be diluted and still inhibits the growth of microbial cells (Eloff,
2004).
3.2 .1 Sample Extract Preparation
Methanol (Merck, HPLC grade).
34
Procedures:
20mg of each dried extract was dissolved in 1 mL of methanol and water
mixture (2:1, v/v). The sample was filter-sterilized using a 0.2 µm nylon syringe
filter.
3.2.2 Growth Indicator Preparation
The chemical used was p-iodonitrotetrazolium violet (Sigma Aldrich).
Procedures:
The p-iodonitrotetrazolium violet (INT) solution was prepared by
dissolving 40 mg of INT in 100 mL of distilled water and further sterilized by
using 0.2 µm nylon syringe filter and stored at 4°C until required.
3.2.3Antibacterial Testing
The antibacterial test wasperformed on 96 well plates. The layout of the
plate is shown in Figure 3.1. 100 µL of broth medium was added to sterility
control wells to ensure the sterility of the broth medium. 75 µL of broth medium
and 25 µL of each extract were added to negative control wells to ascertain
sterility of each extract. The viability of the microbes was assessed by adding 50
µL of the tested microbes to 50 µL of the broth medium in the growth control
wells. For antibacterial testing and drug control, 50 µL of broth medium was
35
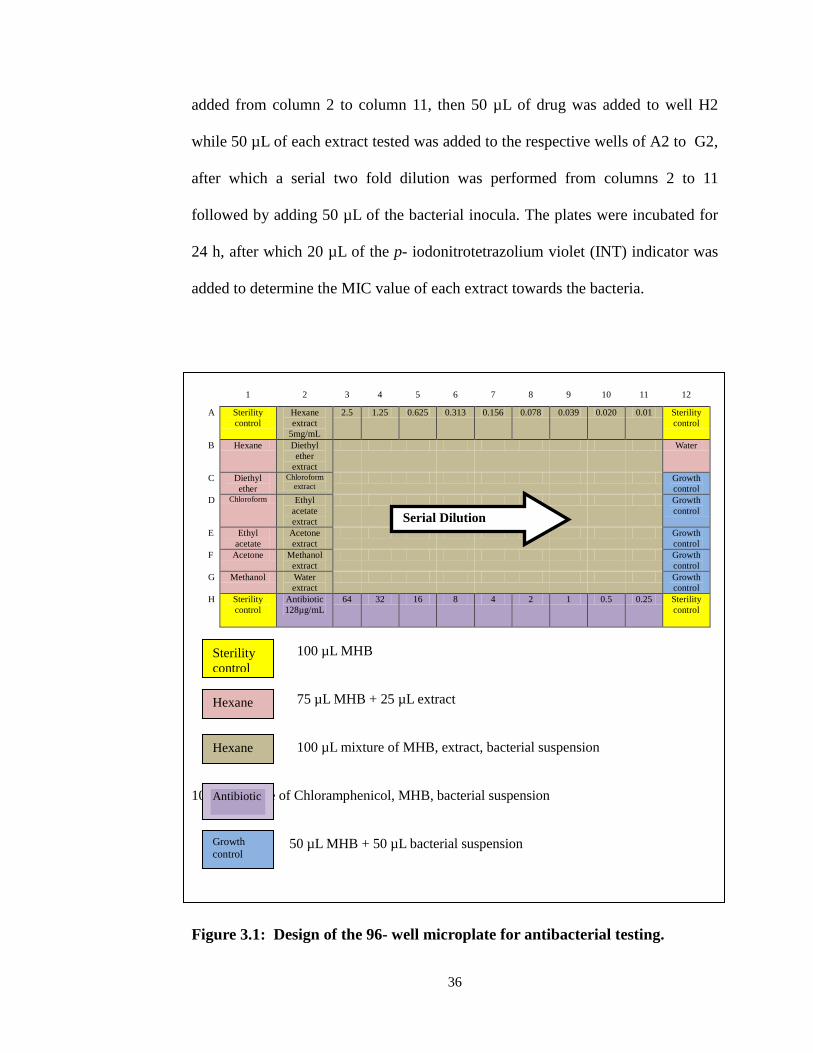
added from column 2 to column 11, then 50 µL of drug was added to well H2
while 50 µL of each extract tested was added to the respective wells of A2 to G2,
after which a serial two fold dilution was performed from columns 2 to 11
followed by adding 50 µL of the bacterial inocula. The plates were incubated for
24 h, after which 20 µL of the p- iodonitrotetrazolium violet (INT) indicator was
added to determine the MIC value of each extract towards the bacteria.
1 2 3 4 5 6 7 8 9 10 11 12
A Sterility control
Hexane extract
5mg/mL
2.5 1.25 0.625 0.313 0.156 0.078 0.039 0.020 0.01 Sterility control
B Hexane Diethyl ether
extract
Water
C Diethyl ether
Chloroform extract
Growth control
D Chloroform Ethyl acetate extract
Growth control
E Ethyl acetate
Acetone extract
Growth control
F Acetone Methanol extract
Growth control
G Methanol Water extract
Growth control
H Sterility control
Antibiotic 128µg/mL
64 32 16 8 4 2 1 0.5 0.25 Sterility control
100 µL MHB 75 µL MHB + 25 µL extract 100 µL mixture of MHB, extract, bacterial suspension 100µL mixture of Chloramphenicol, MHB, bacterial suspension 50 µL MHB + 50 µL bacterial suspension
Figure 3.1: Design of the 96- well microplate for antibacterial testing.
Sterility control
Antibiotic
Hexane
Hexane
Growth control
Serial Dilution
36
3.2.3.1 Bacterial Strains
Both Gram-positive and Gram-negative bacteria were used in the study.
The Gram-positive bacteria were Staphylococcus aureus (ATCC 29213) and
Bacillus cereus (ATCC 11778). The Gram-negative bacteria were Pseudomonas
aeruginosa (ATCC 27853), Klebsiellapneumoniae(ATCC 13883), Escherichia
coli- penicillin sensitive strain (ATCC 25922) and E. coli-penicillin resistant
strain (ATCC 35218).
3.2.3.2 BacterialInocula Preparation
The chemicals used were:
Mueller-Hinton Agar(Oxoid), Mueller-Hinton Broth(Oxoid)
Procedures:
The bacteria were cultured using Mueller-Hinton agar at 37 ºC ,
incubation times were between 18 to 24 h. Mueller-Hinton Broth (MHB) was
used as the broth medium and the concentrations of bacteria inocula were adjusted
and measured using UV-Vis spectrophotometer set at 625 nm. A few colonies of
bacteria were transferred to MHB and the optical density of the bacteria inoculum
37
was adjusted to fall between 0.08 to 0.10 absorbance units, where the
concentration of bacteria is 1 x 10⁸ CFU/mL. The dilution was carried out to
obtain a final concentration of 1 x 10⁶ CFU/mL.
3.2.3.3 Chloramphenicol Preparation
The chemical used was Chloramphenicol (Oxoid).
Procedures:
Chloramphenicol was dissolved in distilled water to concentration of 512
µg/mL and sterilized by filtration through a 0.2 µm syringe filter. The
concentration rangeused as the positive control was between 0.25 to 128 µg/mL.
3.2.3.4 Broth Medium Preparation
The chemical used was MHB powder (Oxoid).
Procedures:
10.5 g of MHB powder was dissolved in 500 mL distilled water. The
medium was sterilized by autoclaving at 121 ºC for 15 min.
38
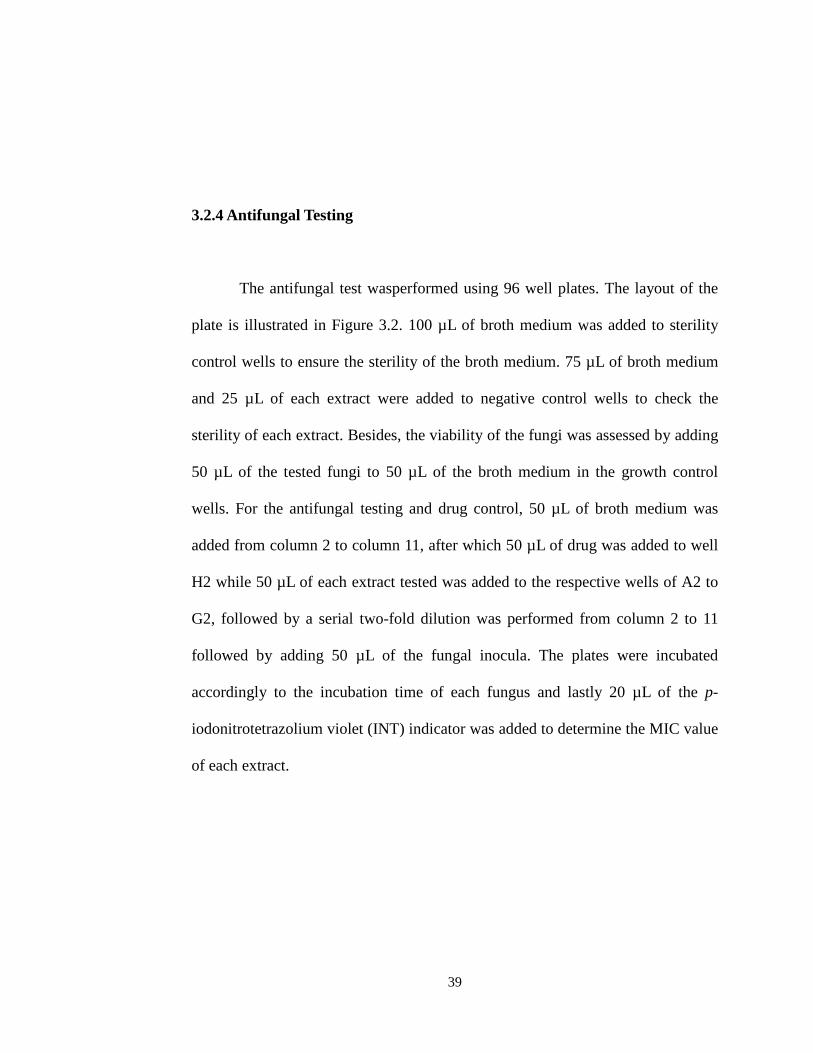
3.2.4 Antifungal Testing
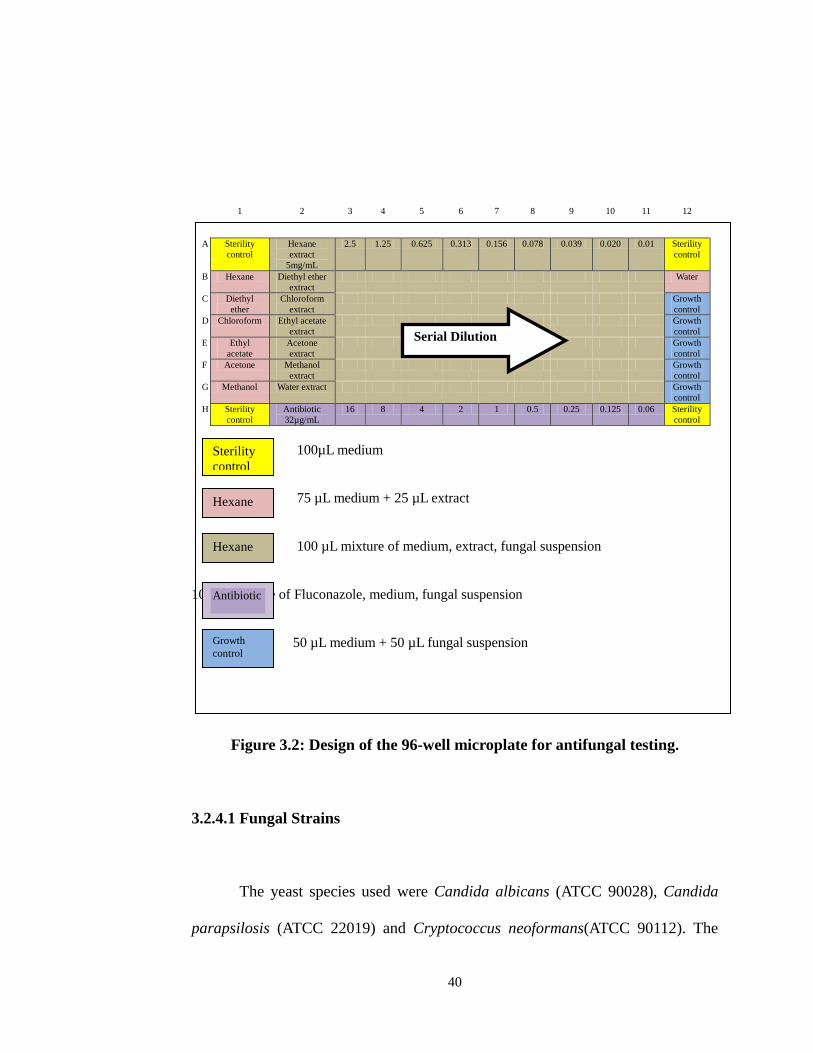
The antifungal test wasperformed using 96 well plates. The layout of the
plate is illustrated in Figure 3.2. 100 µL of broth medium was added to sterility
control wells to ensure the sterility of the broth medium. 75 µL of broth medium
and 25 µL of each extract were added to negative control wells to check the
sterility of each extract. Besides, the viability of the fungi was assessed by adding
50 µL of the tested fungi to 50 µL of the broth medium in the growth control
wells. For the antifungal testing and drug control, 50 µL of broth medium was
added from column 2 to column 11, after which 50 µL of drug was added to well
H2 while 50 µL of each extract tested was added to the respective wells of A2 to
G2, followed by a serial two-fold dilution was performed from column 2 to 11
followed by adding 50 µL of the fungal inocula. The plates were incubated
accordingly to the incubation time of each fungus and lastly 20 µL of the p-
iodonitrotetrazolium violet (INT) indicator was added to determine the MIC value
of each extract.
39
1 2 3 4 5 6 7 8 9 10 11 12
A Sterility control
Hexane extract
5mg/mL
2.5 1.25 0.625 0.313 0.156 0.078 0.039 0.020 0.01 Sterility control
B Hexane Diethyl ether extract
Water
C Diethyl ether
Chloroform extract
Growth control
D Chloroform Ethyl acetate extract
Growth control
E Ethyl acetate
Acetone extract
Growth control
F Acetone Methanol extract
Growth control
G Methanol Water extract Growth control
H Sterility control
Antibiotic 32µg/mL
16 8 4 2 1 0.5 0.25 0.125 0.06 Sterility control
100µL medium 75 µL medium + 25 µL extract 100 µL mixture of medium, extract, fungal suspension 100µL mixture of Fluconazole, medium, fungal suspension 50 µL medium + 50 µL fungal suspension
Figure 3.2: Design of the 96-well microplate for antifungal testing.
3.2.4.1 Fungal Strains
The yeast species used were Candida albicans (ATCC 90028), Candida
parapsilosis (ATCC 22019) and Cryptococcus neoformans(ATCC 90112). The
Serial Dilution
Sterility control
Hexane
Hexane
Antibiotic
Growth control
40
mouldsspecies used were Aspergillusniger (ATCC 16404) and
Trichophytonmentagrophytes (ATCC 9533).
3.2.4.2 Fungal Inocula Preparation
The chemicals used were:
Potato dextrose agar(Merck),RPMI-1640 with L-glutamine, without bicarbonate
(Sigma Aldrich), 3-(N-morpholino) propanesulfonic acid (Merck)
Procedures:
The fungi were cultured using potato dextrose agar. Different incubation
times were required for different species of fungus. Candida species was
incubated for 24h while C. neoformans and A. nigerwere incubated for 48h. A
120h incubation period was used for T. mentagrophytes. RPMI-1640 with L-
glutamine, without bicarbonate and 3-(N-morpholino) propanesulfonic acid at pH
7 was used as the broth medium. Similar to bacterial inocula, fungalinocula were
prepared by transferring a few colonies of fungi to the medium broth. The
concentrations of fungalinocula were adjusted by its optical density using a UV-
Vis spectrophotometer set at 530 nm. The absorbance of inocula of Candida
species and C. neoformanswere adjusted within the range of 0.12 to 0.15, while
the absorbance of inocula of A. niger and T. mentagrophyteswere adjusted within
the range of 0.09 to 0.11, whereby the concentration of fungi was 1-5 x
106 CFU/mL.Dilution was carried out to obtain a final concentration of fungal
41
inocula, Candida species at 0.5-2.5 x 10³ CFU/mL, C. neoformansat 0.5-2.5 x
104 CFU/mL and A. niger and T. mentagrophytes at 0.5-2.5 x 10⁵ CFU/mL.
3.2.4.3 Fluconazole Preparation
The chemicals used were:
Fluconazole (Merck), Dimethyl sulfoxide (Merck)
Procedures:
Fluconazole (Merck)was disssolved in dimethyl sulfoxide (DMSO) to a
concentration of 6.4mg/mL. This was further diluted to a ratio of 1:50 in broth
mediumand sterilized by filtration through a 0.2 µm filter.The concentrations
tested were between 0.63 to 32 µg/mL.
3.2.4.4 Broth Medium Preparation
The chemicals used were:
RPMI-1640 medium supplemented with glutamine and phenol red (Sigma
Aldrich), 3-(N-morpholino) propanesulfonic acid (MOPS) (Merck)
Procedures:
One liter of the broth medium was prepared as follows: 20.8 g of RPMI-
1640 medium supplemented with glutamine and phenol red, without bicarbonate,
42
69.06 g of 3-(N-morpholino) propanesulfonic acid (MOPS) were dissolved in
800mL distilled water, adjusting the pH to 7.0 at 25°C with 1 mol/L sodium
hydroxide solution. Water was added to make up the final volume to 1 L.The
medium was filtered-sterilized and stored at 4°C.
3.3 Solvent Toxicity Testing
The solvents used were:
Hexane (Merck, HPLC grade), diethyl ether (Merck, HPLC grade), chloroform
(Merck, HPLC grade), ethyl acetate (Merck, HPLC grade), methanol (Merck,
HPLC grade), dimethyl sulfoxide (Merck, AR grade), ethanol (Merck, HPLC
grade), butanol (Merck, HPLC grade), dichoromethane (Merck, HPLC grade),
acetone (Merck, HPLC grade)
Procedures:
Solvent toxicity test was performed to investigate the toxicity of ten
different organic solvents (hexane, diethyl ether, chloroform, ethyl acetate,
methanol, dimethyl sulfoxide, ethanol, butanol, dichloromethane and acetone)
towards fungi and bacteria. The concentrations of the solvent used varied from
0.05 to 25% (v/v). Chloramphenicol was used as positive control in antibacterial
assay and fluconazole was used in antifungal assay.
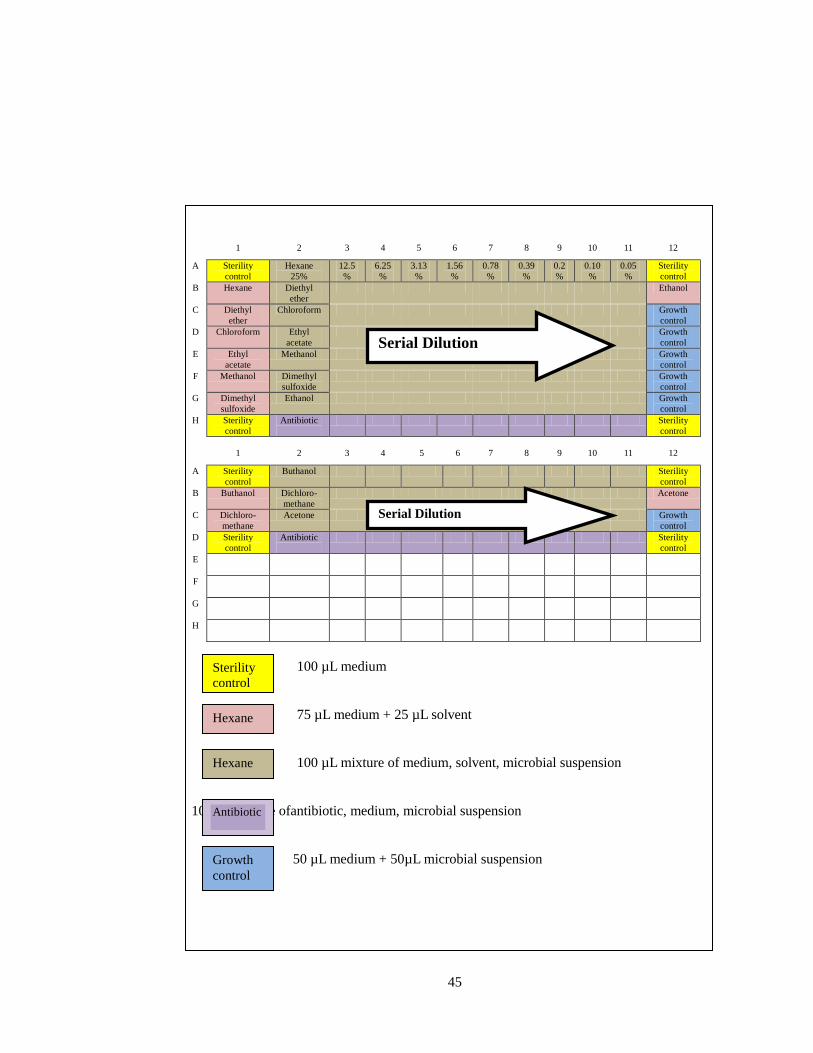
The tests were performed on 96 well plates and the design of the plate was
43
arranged as in Figure 3.3. 100 µL of broth medium was added to the sterility
control wells to check the sterility of the broth medium. 75 µL of broth medium
and 25 µL of each selected solvent were added to negative control wells to check
the sterility of each solvent. The viability of the microbes was assessed by adding
50 µL of the tested microbes to 50 µL of the broth medium to the growth control
wells. For solvents testing and drug control wells, 50 µL of broth medium was
added from column 2 to column 11, followed by 50 µL of drug was added to well
H2 while 50 µL of each solvent tested was added to the respective wells of A2 to
G2. Serial two fold dilution was then performed from column 2 to 11 followed by
adding 50 µL of the microbial inocula. The plates for bacterial inocula were
incubated at 37 ºC for 24 h. The plates for Candida species were incubated for
24h while C. neoformans and A. nigerwere incubated for 48h. A 120h incubation
period was used for T. mentagrophytes. All the plates for fungal inocula were
incubated at 37 ºC. Finally 20 µL of the p-iodonitrotetrazolium violet (INT)
indicator was added and MIC value was determined.
44
1 2 3 4 5 6 7 8 9 10 11 12
A Sterility control
Hexane 25%
12.5%
6.25%
3.13%
1.56%
0.78%
0.39%
0.2%
0.10%
0.05%
Sterility control
B Hexane Diethyl ether
Ethanol
C Diethyl ether
Chloroform Growth control
D Chloroform Ethyl acetate
Growth control
E Ethyl acetate
Methanol Growth control
F Methanol Dimethyl sulfoxide
Growth control
G Dimethyl sulfoxide
Ethanol Growth control
H Sterility control
Antibiotic
Sterility control
1 2 3 4 5 6 7 8 9 10 11 12
A Sterility control
Buthanol Sterility control
B Buthanol Dichloro-methane
Acetone
C Dichloro-methane
Acetone Growth control
D Sterility control
Antibiotic
Sterility control
E
F
G
H
100 µL medium 75 µL medium + 25 µL solvent 100 µL mixture of medium, solvent, microbial suspension 100µL mixture ofantibiotic, medium, microbial suspension 50 µL medium + 50µL microbial suspension
Serial Dilution
Sterility control
Hexane
Hexane
Antibiotic
Growth control
Serial Dilution
45
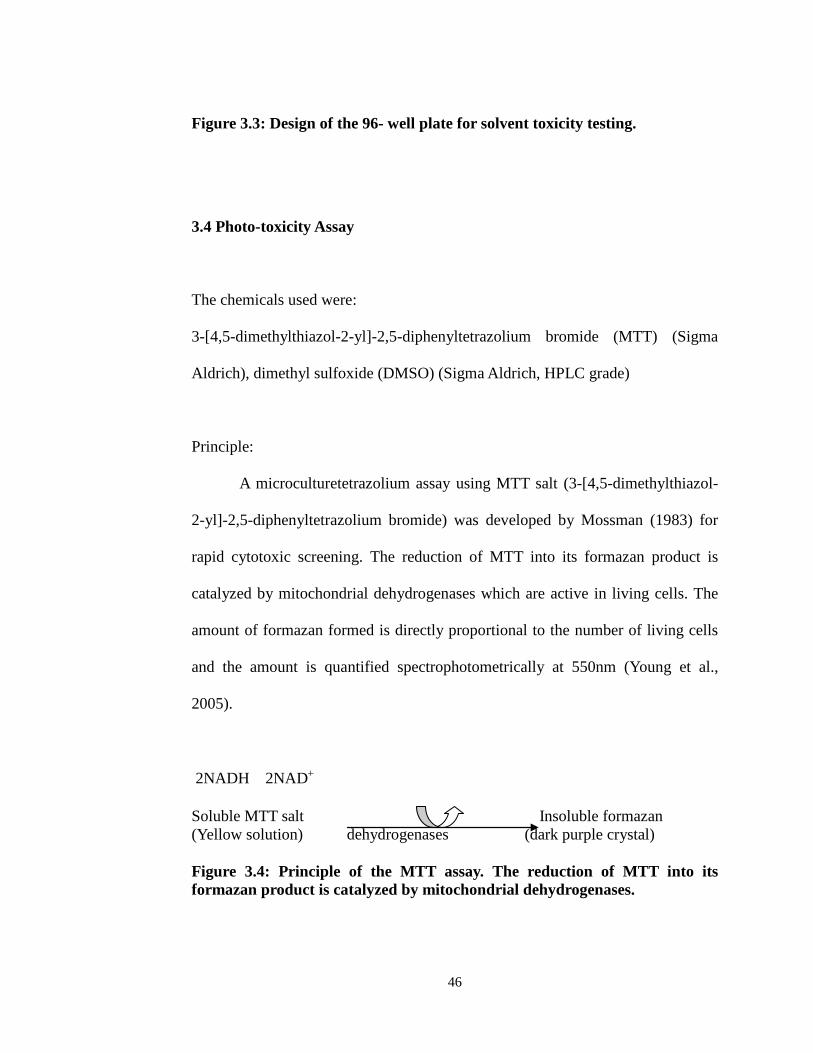
Figure 3.3: Design of the 96- well plate for solvent toxicity testing.
3.4 Photo-toxicity Assay
The chemicals used were:
3-[4,5-dimethylthiazol-2-yl]-2,5-diphenyltetrazolium bromide (MTT) (Sigma
Aldrich), dimethyl sulfoxide (DMSO) (Sigma Aldrich, HPLC grade)
Principle:
A microculturetetrazolium assay using MTT salt (3-[4,5-dimethylthiazol-
2-yl]-2,5-diphenyltetrazolium bromide) was developed by Mossman (1983) for
rapid cytotoxic screening. The reduction of MTT into its formazan product is
catalyzed by mitochondrial dehydrogenases which are active in living cells. The
amount of formazan formed is directly proportional to the number of living cells
and the amount is quantified spectrophotometrically at 550nm (Young et al.,
2005).
2NADH 2NAD+
Soluble MTT salt Insoluble formazan (Yellow solution) dehydrogenases (dark purple crystal) Figure 3.4: Principle of the MTT assay. The reduction of MTT into its formazan product is catalyzed by mitochondrial dehydrogenases.
46
Procedure:
The MTT test was performed in sterile, untreated 96 flat-bottom well
plates. Sterility controls, positive controls, negative controls and growth controls
were included. The seven extracts were dissolved inDMSO and the stock
concentration was 100 mg/mL. The working stocks were vortexed and diluted to
40 mg/mL with RPMI medium without phenol red prior to addition to the cell
suspension. 50 mL of the cells (approx. 15,000 cells/well) was added to each well,
followed by 50 µL of the extracts. The plate was subjected to light irradiation for
10min at 9.6 J/cm after 2h of incubation. After 24h incubation, 20 µL of MTT
solution at 5 mg/mL was added to each well and left for another 4 h for crystal
formation. 75 µL of supernatant was removed and 100 µL of DMSO was added
and mixed thoroughly to dissolve the purple coloured crystal. The absorbance of
the wells was read immediately on a microplate reader at a wavelength of 570 nm.
The average absorbance was calculated and used to determine the percentage of
cell viability using the formula:
Cell viability (%) = S (average) – B (average) x 100 A (average) – B (average)
Where, S = Absorbance of the cells treated with extract
A = Absorbance of the cells without extract
B = Absorbance of the medium only
47
3.4.1 Preparation of Cell Line
The chemicals used were:
Roswell Park Memorial Institute (RPMI) 1640 medium supplemented with 1%
(v/v) L-glutamine and 10% (v/v) Fetal Bovine Serum (Gibco®), HL 60 cell line
(NCI).
Procedures:
A promylocytic leukemia cell line HL 60 was obtained from National
Cancer Institute, Maryland, USA. The cells were maintained in the Roswell Park
Memorial Institute (RPMI) 1640 supplemented with 1% (v/v) L-glutamine and 10%
(v/v) Fetal Bovine Serum (Gibco) at 37 ºC and 5% CO2atmosphere.
3.4.2 Photosensitizer Preparation
The chemicals used were:
Pheophorbide-A (Pha) (Frontier Scientific), dimethyl sulfoxide (DMSO) (Sigma
Aldrich, HPLC grade)
Procedures:
48
Pheophorbide-A (Pha) (Frontier Scientific), a commercially available
photo-cytotoxic compound was dissolved in DMSO to a concentration of 1mg/mL.
The stock solution was kept at -20 °C in the dark. It was directly diluted in
medium to obtain the desired initial working concentration at 20 µg/mL.
.
3.4.3 Isolation of Active Photo-cytotoxic Compounds
The chemicals used were:
Silica gel 230-400 mesh (Merck), hexane (Merck, HPLC grade), ethyl acetate
(Merck, HPLC grade)
Procedures:
Activity-guided fractionation was performed on active chloroform extract.
It was subjected to silica gel flash chromatography fitted with a 40 x 150 mm
silica cartridge which was packed with silica gel 230-400 mesh. The column was
eluted with five mobile phases (Table 3.1). Fractions of 50 mL each were
collected and monitored by thin layer chromatography (TLC). Fractions with
similar TLC patterns were combined and screened for photo-cytotoxicity activity.
To avoid the active compounds being degraded by light, the procedure was
performed under dim light.
49
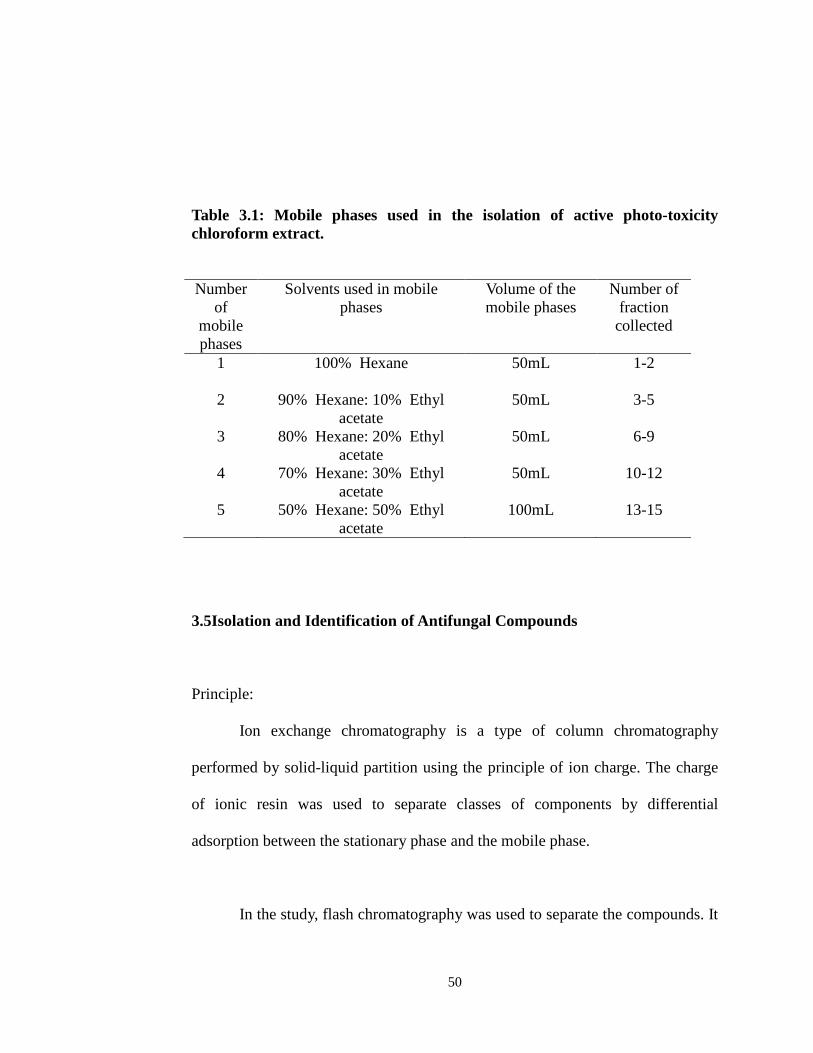
Table 3.1: Mobile phases used in the isolation of active photo-toxicity chloroform extract. Number
of mobile phases
Solvents used in mobile phases
Volume of the mobile phases
Number of fraction
collected
1 100% Hexane 50mL 1-2
2 90% Hexane: 10% Ethyl acetate
50mL 3-5
3 80% Hexane: 20% Ethyl acetate
50mL 6-9
4 70% Hexane: 30% Ethyl acetate
50mL 10-12
5 50% Hexane: 50% Ethyl acetate
100mL 13-15
3.5Isolation and Identification of Antifungal Compounds
Principle:
Ion exchange chromatography is a type of column chromatography
performed by solid-liquid partition using the principle of ion charge. The charge
of ionic resin was used to separate classes of components by differential
adsorption between the stationary phase and the mobile phase.
In the study, flash chromatography was used to separate the compounds. It
50
is a very convenient and fast technique compared to conventional column
chromatography. Briefly, a column is dry filled with silica gel, a sample is
introduced, and then solvent is forced through the column under pressure. As the
hexane extract is oily, a modified flash chromatography using silica gel
impregnated with 1 % of silver nitrate as reported by Li et al. (2005) was used.
The chemicals used were:
Silica gel 230-400 mesh (Merck), preparative thin layer chromatography, silver
nitrate, hexane (Merck, HPLC grade), ethyl acetate (Merck, HPLC grade)
Procedures:
The silica gel mixture was prepared by mixing 100 g silica gel (230-
400mesh ASTM) with an aqueous solution of 11 g of silver nitrate dissolved in 60
mL of distilled water. The mixture was ground and then dried in oven for
overnightat 70 °C.The dimension of the column used was 80mm x 150mm. The
column was eluted first with nine mobile phases (Table 3.2). 200 mL fractions
were collected and monitored by gas chromatography mass spectrometry (GCMS).
Fractions with similar TIC patterns were combined and screened for antifungal
activity.
51
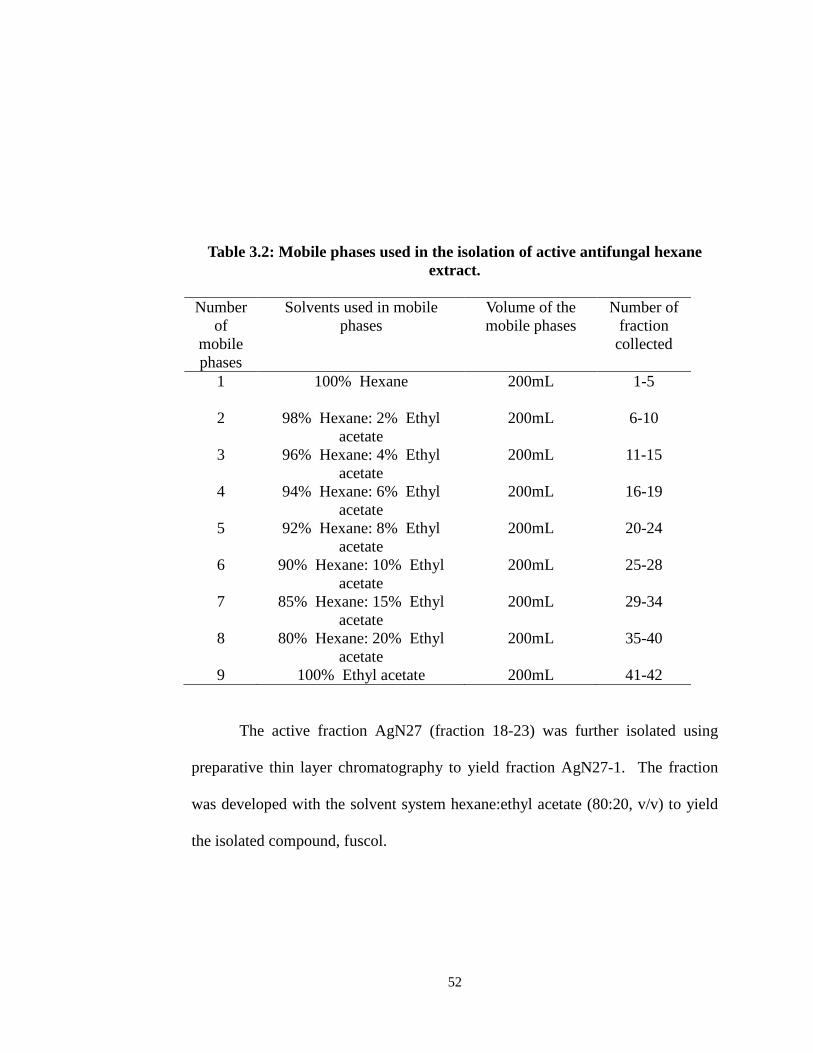
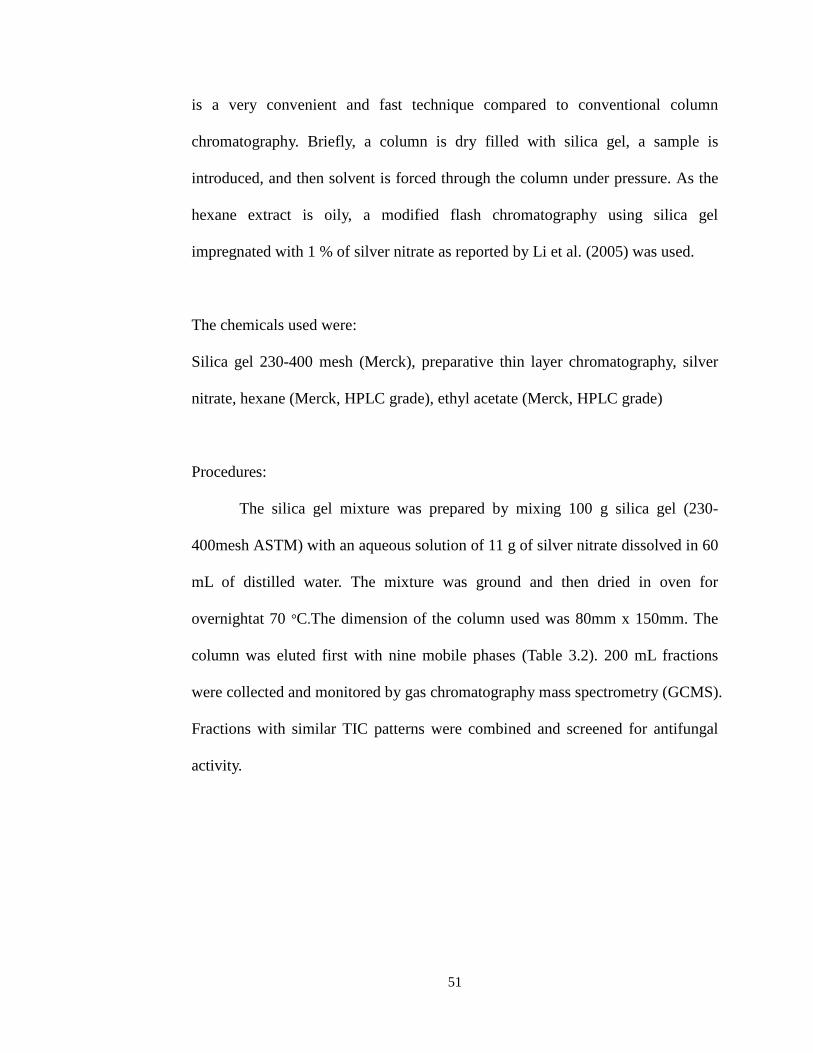
Table 3.2: Mobile phases used in the isolation of active antifungal hexane extract.
Number
of mobile phases
Solvents used in mobile phases
Volume of the mobile phases
Number of fraction
collected
1 100% Hexane 200mL 1-5
2 98% Hexane: 2% Ethyl acetate
200mL 6-10
3 96% Hexane: 4% Ethyl acetate
200mL 11-15
4 94% Hexane: 6% Ethyl acetate
200mL 16-19
5 92% Hexane: 8% Ethyl acetate
200mL 20-24
6 90% Hexane: 10% Ethyl acetate
200mL 25-28
7 85% Hexane: 15% Ethyl acetate
200mL 29-34
8 80% Hexane: 20% Ethyl acetate
200mL 35-40
9 100% Ethyl acetate 200mL 41-42
The active fraction AgN27 (fraction 18-23) was further isolated using
preparative thin layer chromatography to yield fraction AgN27-1. The fraction
was developed with the solvent system hexane:ethyl acetate (80:20, v/v) to yield
the isolated compound, fuscol.
52
3.5.1 Gas Chromatography Mass SpectrometryAnalysis
The chemical used was methanol (Merck, GC grade).
Procedures:
GC-MS is a chromatographic technique to identify the volatile compounds
of a sample. The sample was dissolved in methanol, followed by filtration using
0.45 µm syringe filter prior to injection into GCMS. GCMS analysis was
performed on an Agilent Technologies 6890N GC System equipped with Agilent
Technologies 5975 inert Mass Selective Detector (70 eV direct inlet) on fused
silica capillary column HP–5ms (30 m, ID 0.25 mm, 0.25 μm film thickness) with
helium as carrier gas at a flow rate of 1 mL/min. The column temperature was
programmed initially at 100°C, then increased 5°C min-1 to 300°C and was kept
isothermally for 10min.The total ion chromatogram obtained was auto integrated
by Chemstation and the constituents were identified by comparison with
published mass spectra databases (Wiley 9N Mass Spectral Library).
53
3.5.21H Nuclear Magnetic Resonance and 13C Nuclear Magnetic Resonance
Spectroscopic Analysis on the Isolated Antifungal Compound
The chemical used was deuterated methanol D4.
Procedures:
The isolated antifungal compound was air dried and dissolved in deuterated
methanol D4. The solution was then transferred to a NMR tube (Norell, 400 MHz)
to a height of 4 cm. The compound was subjected to1H nuclearmagnetic
resonance (NMR) and 13C NMR (Model: Bruker, JOEL, Japan, 270 MHz) for
structural elucidation.
54
CHAPTER 4.0
RESULTS AND DISCUSSION
4.1 Collection of Sinulariasp. The soft coral, Sinulariasp., was collected from Tanjung Tuan
PortDickson, Malaysia. The site offers a combination of high biological diversity
and density of marine organisms including algae, sponges, mollusks, corals and
fishes. After collection of sample, it was rinsed with sea water and kept in an ice
box immediately. It is because the sample might die upon the exposure to air and
rapidly decompose and cause the compounds present in the sample rapidly
degraded by oxidative, enzymatic, or polymerization process. This will also lower
the overall yield. After it was sent to the laboratory, immediate storage in the
freezer was necessary to inactivate the enzymatic activity and reduce the possible
degradation.
Freeze drying was chosen to prepare the sample instead of air drying. It
eliminates water molecules and prevents the potential active constituents altered
or lost. Many marine organisms including Sinularia sp. contain significant
55
quantities of water and often cause the extracts contain surface active agents
which will initiate foaming and bubbling during the concentration process by
rotary evaporator. The hardening of the sample simplified the crushing work of
corals and allowed for easier breakage of the cell, which would then release the
substances present. Pounding the samples into powder form allows a larger
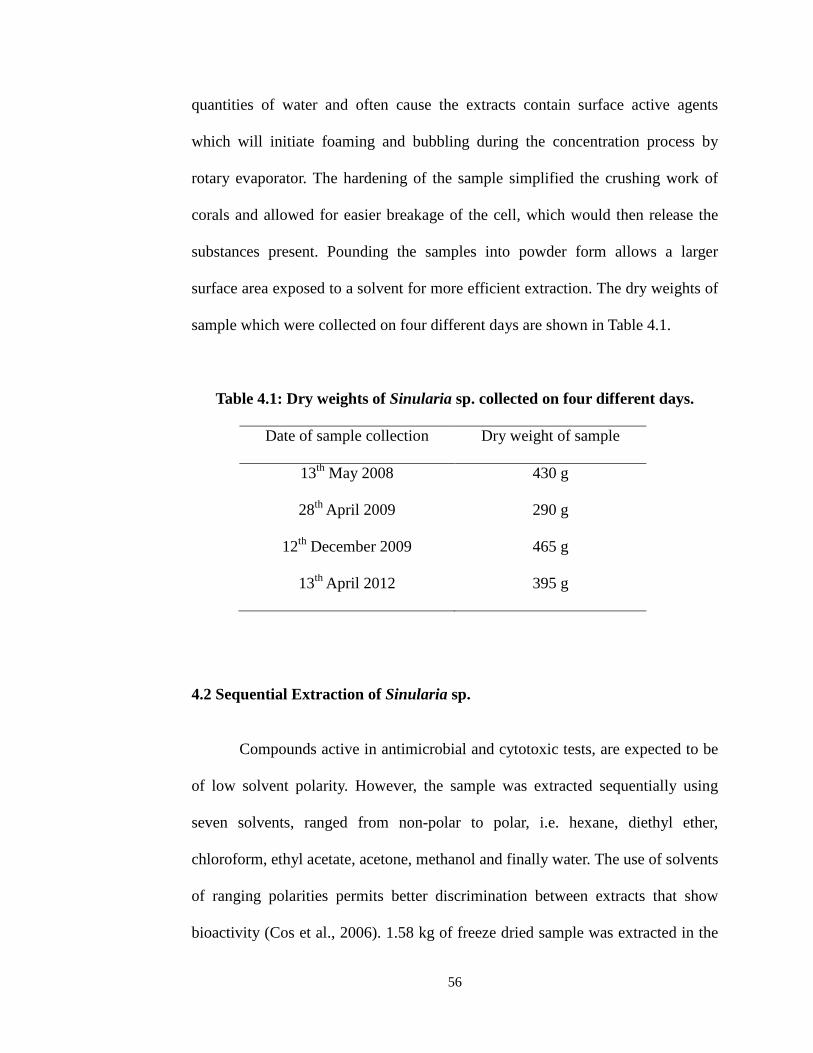
surface area exposed to a solvent for more efficient extraction. The dry weights of
sample which were collected on four different days are shown in Table 4.1.
Table 4.1: Dry weights of Sinularia sp. collected on four different days.
Date of sample collection Dry weight of sample
13th May 2008 430 g
28th April 2009 290 g
12th December 2009 465 g
13th April 2012 395 g
4.2 Sequential Extraction of Sinularia sp. Compounds active in antimicrobial and cytotoxic tests, are expected to be
of low solvent polarity. However, the sample was extracted sequentially using
seven solvents, ranged from non-polar to polar, i.e. hexane, diethyl ether,
chloroform, ethyl acetate, acetone, methanol and finally water. The use of solvents
of ranging polarities permits better discrimination between extracts that show
bioactivity (Cos et al., 2006). 1.58 kg of freeze dried sample was extracted in the
56
same solvent for 2-3 times and the extract was analysed by TLC to ensure
complete extraction of the compounds with solvent of same polarity.
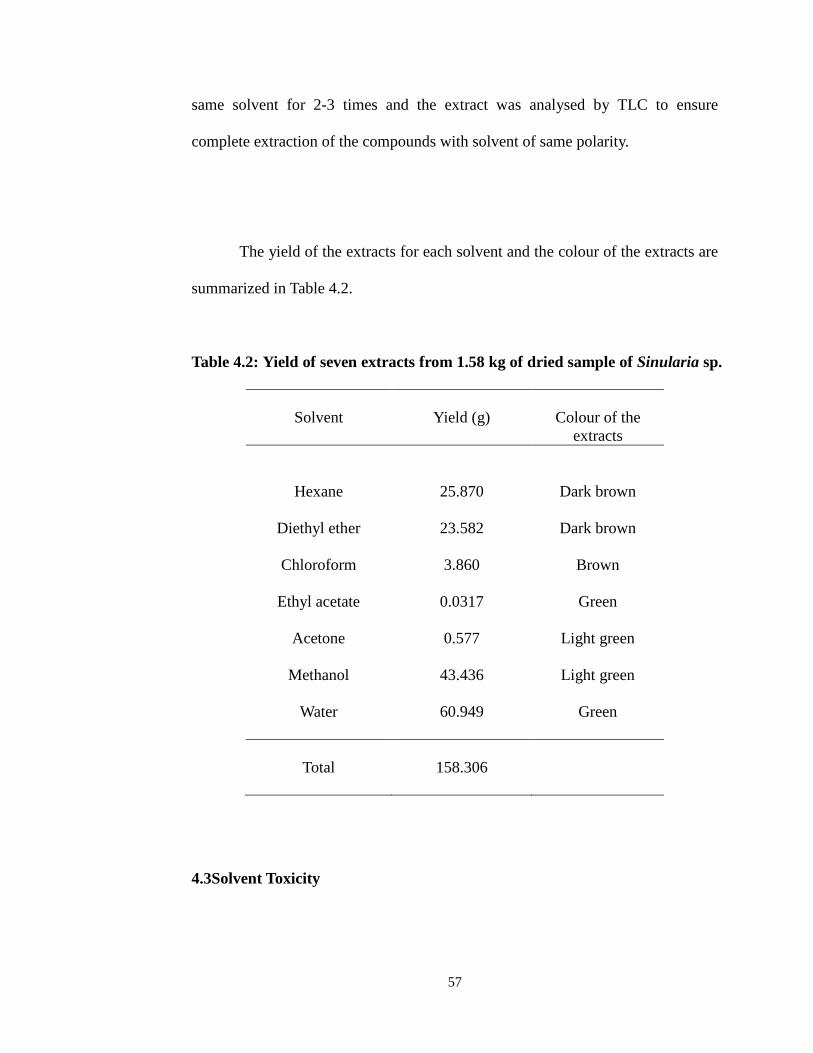
The yield of the extracts for each solvent and the colour of the extracts are
summarized in Table 4.2.
Table 4.2: Yield of seven extracts from 1.58 kg of dried sample of Sinularia sp.
Solvent
Yield (g)
Colour of the
extracts
Hexane
25.870
Dark brown
Diethyl ether 23.582 Dark brown
Chloroform 3.860 Brown
Ethyl acetate 0.0317 Green
Acetone 0.577 Light green
Methanol 43.436 Light green
Water 60.949 Green
Total
158.306
4.3Solvent Toxicity
57
It is often necessary to dissolve natural compounds in organic solvents as
some compounds have limited solubility in water. While it is desirable to use
solvents that are non-toxic to the microorganisms used for bioassays, but there is
no standard method for defining the most suitable solvent or the optimal solvent
concentration to be used. Hence, a suitable method must be employed to
determine the conditions that result in the lowest degree of toxicity on the
microorganisms used for bioassays as some solvents may affect biological
membranes of the microbes (Sikkemaet al., 1995).
For this purpose, a colorimetric broth microdilution assay was performed,
using p-iodonitrotetrazolium violet (INT) as the growth indicator. The inhibition
was indicated by the lack of colour change while microbial growth was indicated
by a colour change to red. The concentrations of solvent tested were varied from
0.05 to 25%. Among the 10 solvents tested, only DMSO exhibited some degree of
inhibitory activity (Table 4.3).K. pneumoniaewas the strain that was least
sensitive to DMSO, with an MIC value of 25% while E. coli, penicillin-resistant
strain, was the most sensitive towards DMSO, with MIC value of 6.25%. The
susceptibility of S. aureus, B. cereus, P. aeruginosa and E. coli (penicillin-
sensitive strain) towards DMSO was approximately equal, with MIC values of
12.5%. Gram-positive bacteria appear to be more sensitive than Gram-negative
bacteria towards DMSO. This could be due to the lack of the outer membrane
which acts as a barrier against hydrophobic molecules (Denyer andMaillard,
2002).
58
The effects of organic solvents on fungi were also studied and the results
are summarized in Table 4.4. The MIC was defined as the lowest concentration of
solvent in which there was no microbial growth, indicated by the absence of
colour change (Figure 4.1). The same MIC values (12.5%) were obtained for C.
albicans and C. parapsilosiswhen DMSO was used.A lower MIC value of 6.5%
was obtained for C. neoformans.The same degree of inhibition towards the
growth of A. niger and T. mentagrophytesfor which MIC values of 6.5% were
recorded.
Inhibition of growth of the microorganisms might be due to the
accumulation of solvents in the cytoplasmic membrane which would affect its
structural properties thus preventing the cell from performing essential functions
such as dissipation of pH and electrical potentials, disruption of the normal flow
of ions, proteins, lipids and endogenous metabolites, and the effects on membrane
protein (Sikkemaet al., 1994 & 1995). Some microorganisms have the ability to
modify the physical properties of cellular membranes by increasing the rigidity of
the cellular membrane thus making the cell less permeable to toxic compounds
such as solvents, drugs and antibiotics (Fernandeset al., 2003).
59
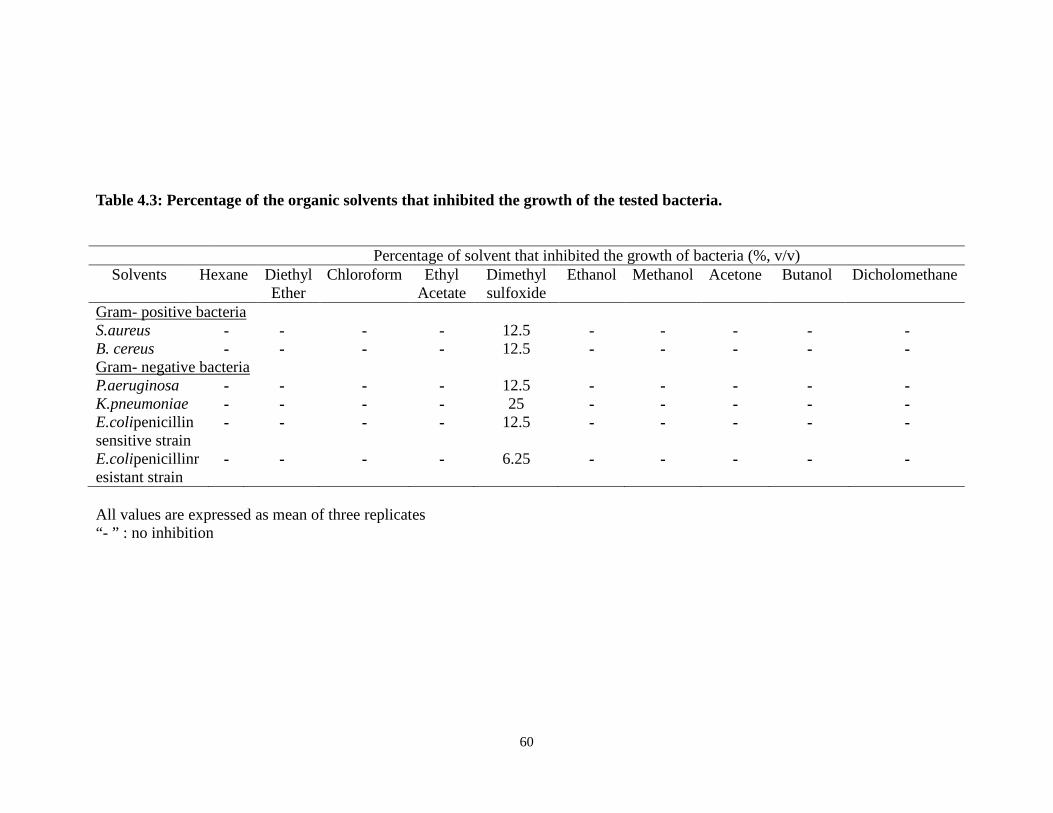
Table 4.3: Percentage of the organic solvents that inhibited the growth of the tested bacteria. Percentage of solvent that inhibited the growth of bacteria (%, v/v)
Solvents Hexane Diethyl Ether
Chloroform Ethyl Acetate
Dimethyl sulfoxide
Ethanol Methanol Acetone Butanol Dicholomethane
Gram- positive bacteria S.aureus - - - - 12.5 - - - - - B. cereus - - - - 12.5 - - - - - Gram- negative bacteria P.aeruginosa - - - - 12.5 - - - - - K.pneumoniae - - - - 25 - - - - - E.colipenicillin sensitive strain
- - - - 12.5 - - - - -
E.colipenicillinresistant strain
- - - - 6.25 - - - - -
All values are expressed as mean of three replicates “- ” : no inhibition
60
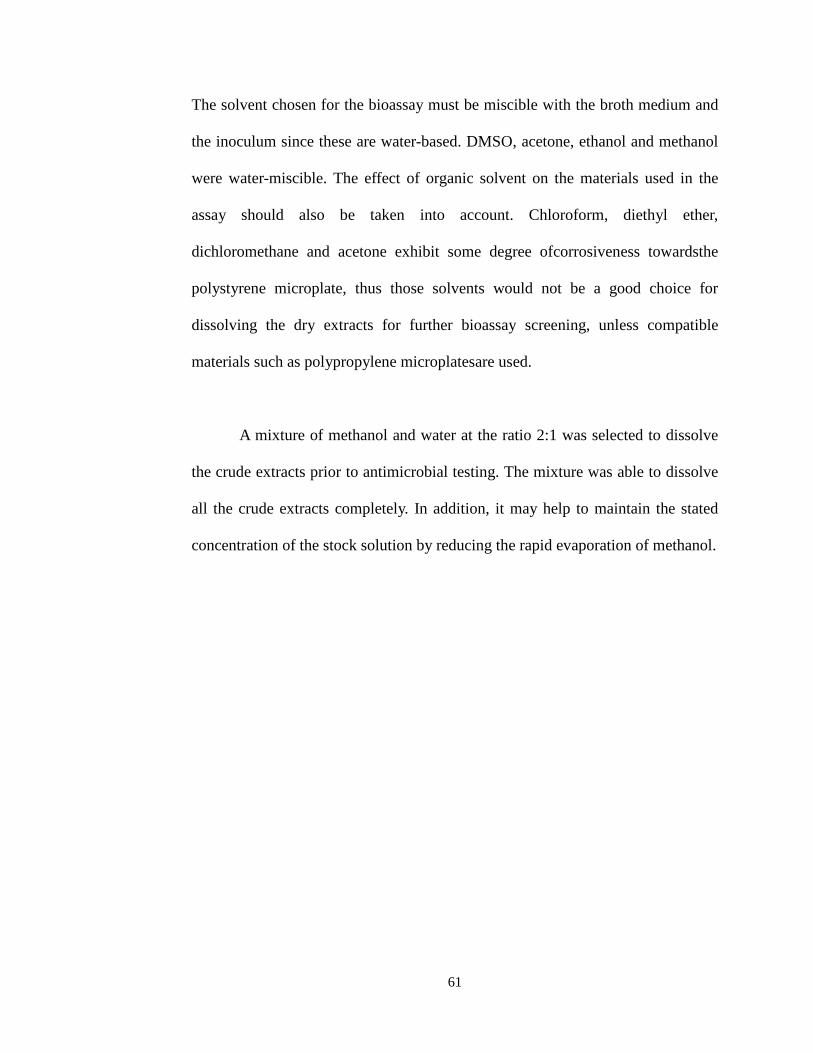
The solvent chosen for the bioassay must be miscible with the broth medium and
the inoculum since these are water-based. DMSO, acetone, ethanol and methanol
were water-miscible. The effect of organic solvent on the materials used in the
assay should also be taken into account. Chloroform, diethyl ether,
dichloromethane and acetone exhibit some degree ofcorrosiveness towardsthe
polystyrene microplate, thus those solvents would not be a good choice for
dissolving the dry extracts for further bioassay screening, unless compatible
materials such as polypropylene microplatesare used.
A mixture of methanol and water at the ratio 2:1 was selected to dissolve
the crude extracts prior to antimicrobial testing. The mixture was able to dissolve
all the crude extracts completely. In addition, it may help to maintain the stated
concentration of the stock solution by reducing the rapid evaporation of methanol.
61
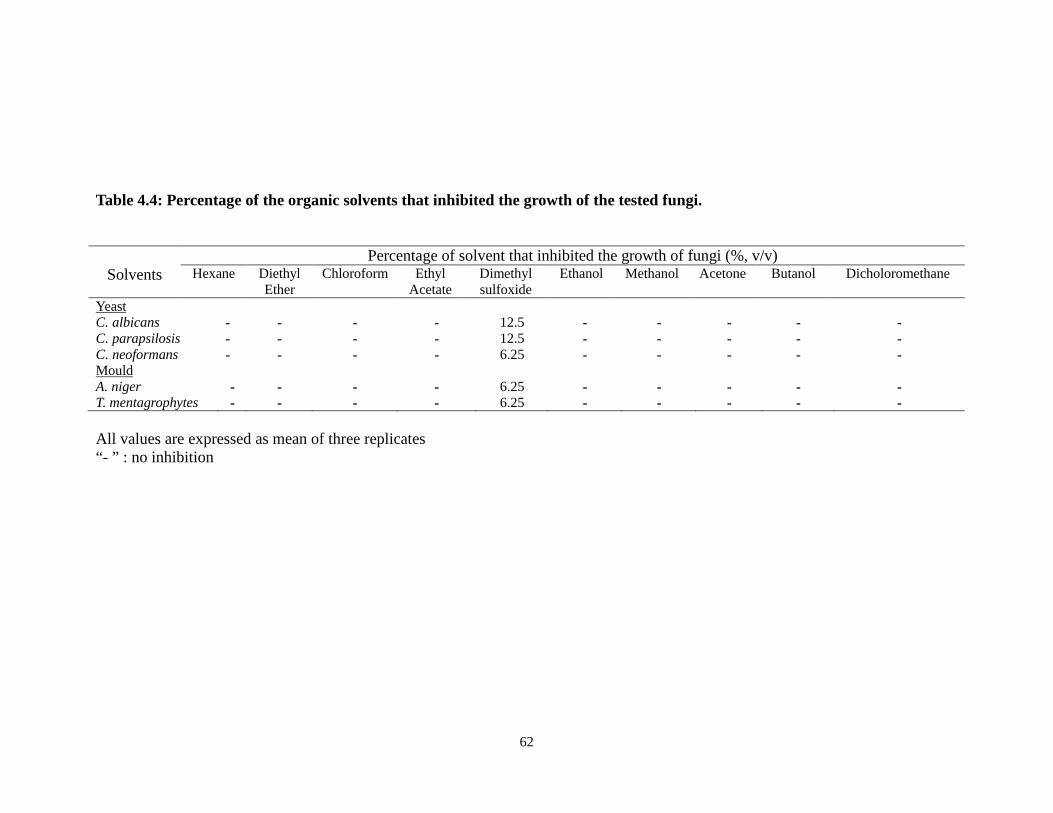
Table 4.4: Percentage of the organic solvents that inhibited the growth of the tested fungi. Percentage of solvent that inhibited the growth of fungi (%, v/v)
Solvents Hexane Diethyl Ether
Chloroform Ethyl Acetate
Dimethyl sulfoxide
Ethanol Methanol Acetone Butanol Dicholoromethane
Yeast C. albicans - - - - 12.5 - - - - - C. parapsilosis - - - - 12.5 - - - - - C. neoformans - - - - 6.25 - - - - - Mould A. niger - - - - 6.25 - - - - - T. mentagrophytes - - - - 6.25 - - - - - All values are expressed as mean of three replicates “- ” : no inhibition
62
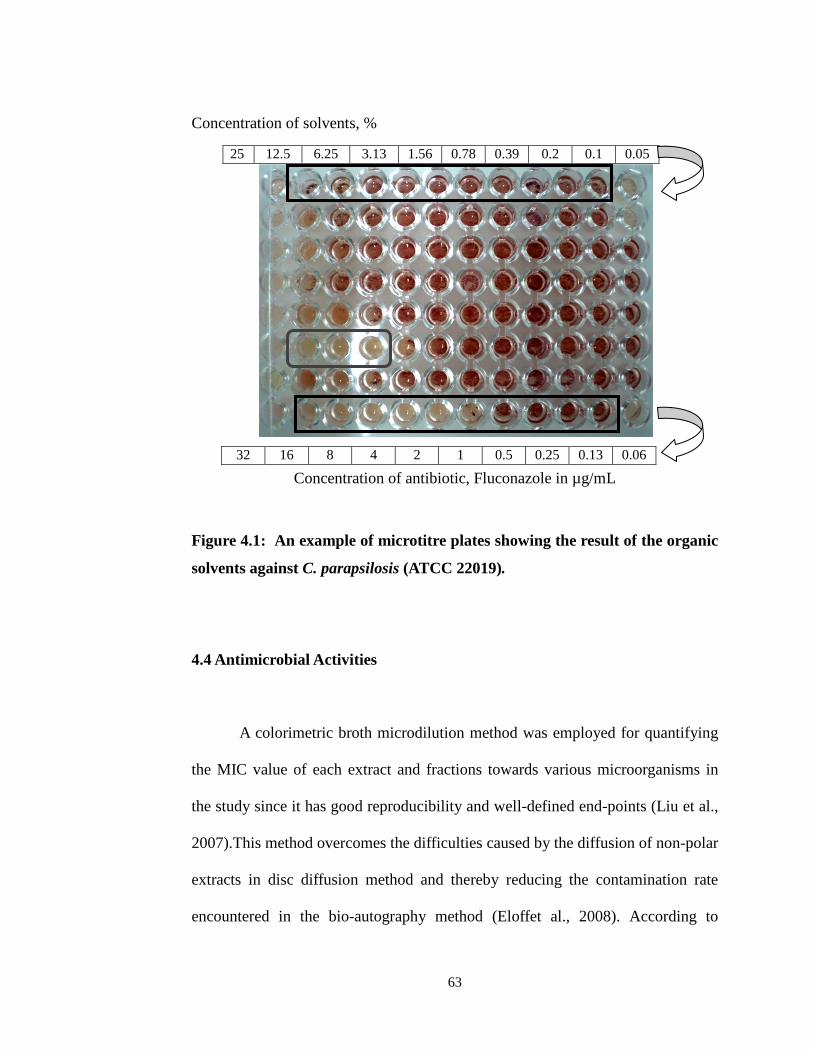
Concentration of solvents, %
Concentration of antibiotic, Fluconazole in µg/mL
Figure 4.1: An example of microtitre plates showing the result of the organic
solvents against C. parapsilosis (ATCC 22019).
4.4 Antimicrobial Activities
A colorimetric broth microdilution method was employed for quantifying
the MIC value of each extract and fractions towards various microorganisms in
the study since it has good reproducibility and well-defined end-points (Liu et al.,
2007).This method overcomes the difficulties caused by the diffusion of non-polar
extracts in disc diffusion method and thereby reducing the contamination rate
encountered in the bio-autography method (Eloffet al., 2008). According to
25 12.5 6.25 3.13 1.56 0.78 0.39 0.2 0.1 0.05
32 16 8 4 2 1 0.5 0.25 0.13 0.06
63
Aligianniset al., (2001), the extracts are considered to exhibit strong inhibition if
the MIC value is between 0.5 mg/mL and below; moderately inhibition if the MIC
value is between 0.6 and 1.5 mg/mL and weak inhibition if the MIC value is more
than 1.6 mg/mL.
4.4.1 Antibacterial Testing
In antibacterial testing, two Gram-positive bacteria, S. aureus and B.
cereus and four Gram-negative bacteria, K. pneumoniae, P. aeruginosa and E. coli
penicillin-resistant and sensitive-type were used. Chloramphenicol with
concentrations ranging from 0.25 to 128 µg/mL was used as the positive control.
Table 4.5 summarizes the results of the extracts towards the six medically-
important bacteria. All extracts except water demonstrated inhibition towards S.
aureus, B. cereus, K. pneumoniae and P. aeruginosa with MIC values ranging
from 0.08 to 5.00 mg/mL. The methanol extract only showed weak inhibition
towards S. aureus, K.pneumoniae and P. aeruginosawith MIC values of 5 mg/mL,
2.5 mg/mL and 4.17 mg/mL. Among the extracts, only ethyl acetate extract
showed inhibition towards both E. coli penicillin sensitive and penicillin resistant
strains with MIC value of 5 mg/mL. The water extract showed no inhibition
toward all the bacteria tested.
64
Table 4.6 shows the total activities of seven extracts towards tested
bacteria. Diethyl ether extract showed highest total activity (186.57 mL/g)
towards K. pneumoniae, this shows that 1 g of the extract can be dissolved in
186.57 mL of solvent and still have inhibitory activity towards K. pneumoniae.
65
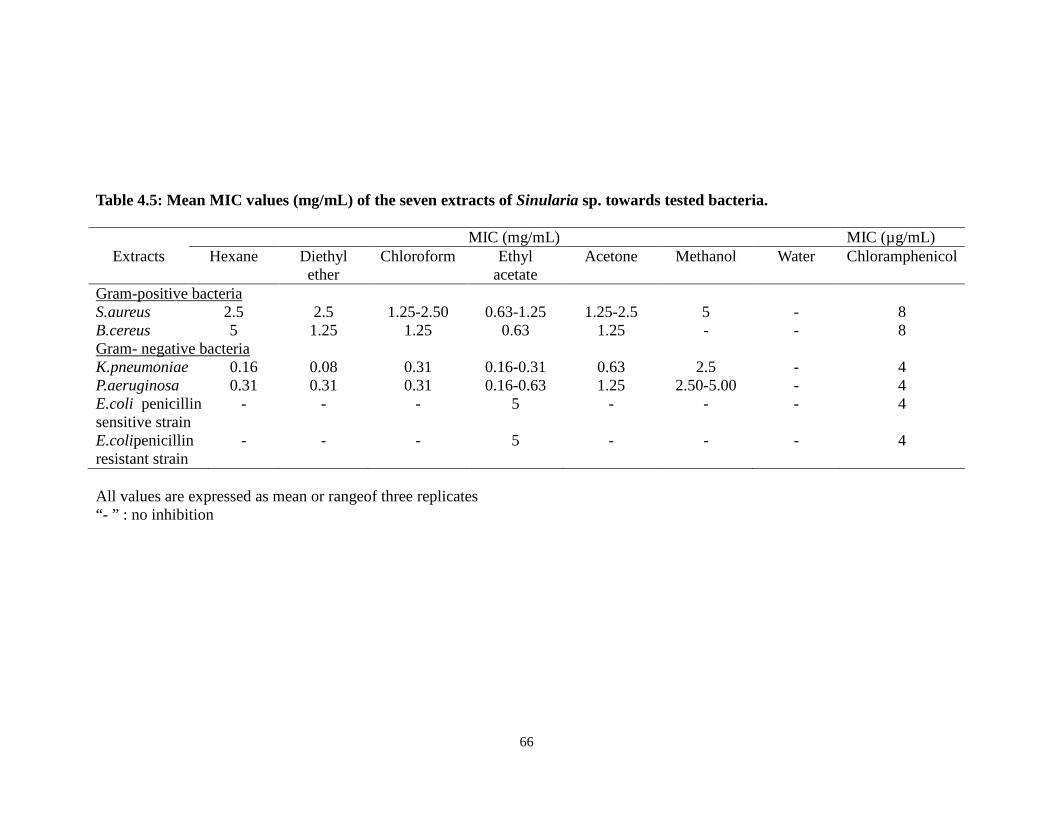
Table 4.5: Mean MIC values (mg/mL) of the seven extracts of Sinularia sp. towards tested bacteria.
MIC (mg/mL) MIC (µg/mL) Extracts Hexane Diethyl
ether Chloroform Ethyl
acetate Acetone Methanol Water Chloramphenicol
Gram-positive bacteria S.aureus 2.5 2.5 1.25-2.50 0.63-1.25 1.25-2.5 5 - 8 B.cereus 5 1.25 1.25 0.63 1.25 - - 8 Gram- negative bacteria K.pneumoniae 0.16 0.08 0.31 0.16-0.31 0.63 2.5 - 4 P.aeruginosa 0.31 0.31 0.31 0.16-0.63 1.25 2.50-5.00 - 4 E.coli penicillin sensitive strain
- - - 5 - - - 4
E.colipenicillin resistant strain
- - - 5 - - - 4
All values are expressed as mean or rangeof three replicates “- ” : no inhibition
66
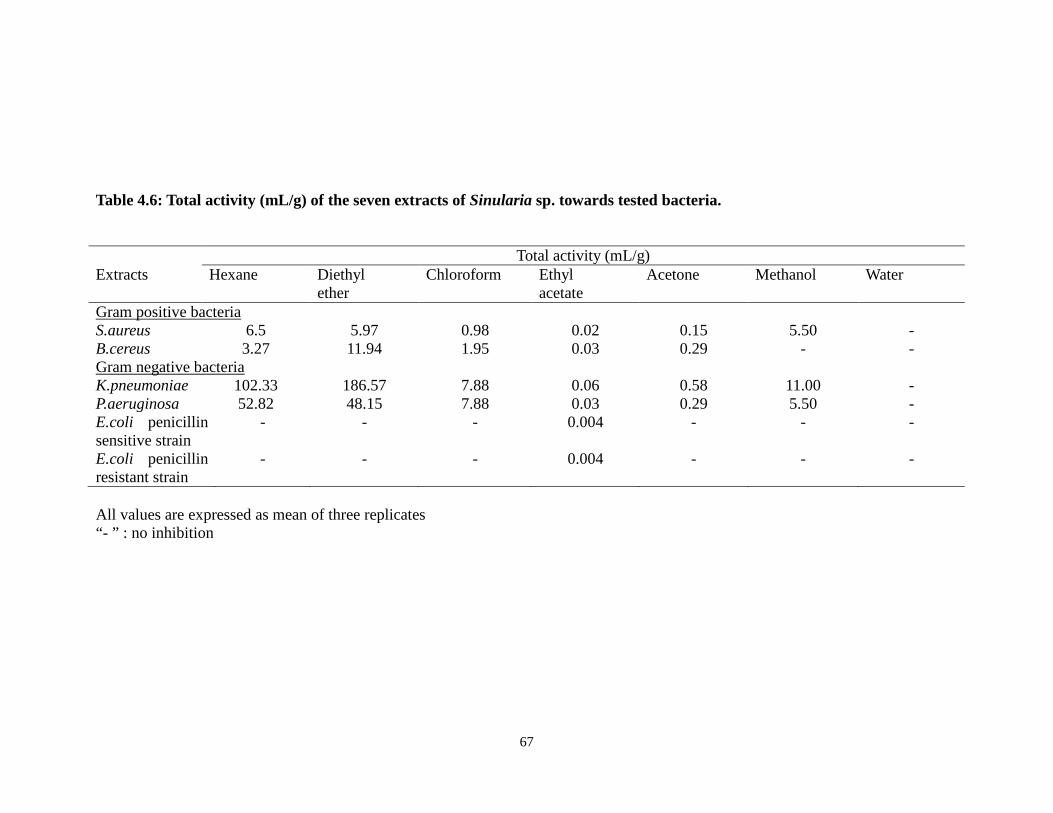
Table 4.6: Total activity (mL/g) of the seven extracts of Sinularia sp. towards tested bacteria. Total activity (mL/g) Extracts Hexane Diethyl
ether Chloroform Ethyl
acetate Acetone Methanol Water
Gram positive bacteria S.aureus 6.5 5.97 0.98 0.02 0.15 5.50 - B.cereus 3.27 11.94 1.95 0.03 0.29 - - Gram negative bacteria K.pneumoniae 102.33 186.57 7.88 0.06 0.58 11.00 - P.aeruginosa 52.82 48.15 7.88 0.03 0.29 5.50 - E.coli penicillin sensitive strain
- - - 0.004 - - -
E.coli penicillin resistant strain
- - - 0.004 - - -
All values are expressed as mean of three replicates “- ” : no inhibition
67
4.4.2 Antifungal Activities The seven extracts were subjected to antifungal testing using colorimetric
broth microdilution. Five medically-important fungi including yeasts and moulds
were used in the testing. The yeasts used were Calbicans, C. parapsilosis and C.
neoformans while the moulds used were A. niger and T. mentagrophytes.The
antifungal drug, fluconazole with concentrations from 0.63 to 32 µg/mL was used
as the positive control.
Table 4.7 summarizes the results of the extracts towards the five
medically-important fungi. Hexane and diethyl ether extracts showed inhibitory
activity towards yeasts and moulds, the MIC values towards C.parapsilosis and
C.neoformans were ranged from 0.02 to 0.31 mg/mL. However, both extracts
showed no inhibition towards A. niger. The MIC values of acetone and methanol
extracts obtained were between 0.16 and 5 mg/mL. Acetone and ethyl acetate
extracts showed good inhibition, but the yield from these two extracts were too
little for further isolation (˂0.05%). Water extract showed weak inhibition
towards Candida species with MIC values ranged from 2.5 to 5 mg/mL.
The total activities of seven extracts towards fungi tested are summarised
in Table 4.8. Hexane extract showed the highest total activity with a value of
409.34 mL/g towards C. neoformans, i.e. that 1 g of extract dissolved in 409.34
mL of solvent has inhibitory activity towards C.neoformans. Due to its strong
inhibitory activity and sufficient quantity, hexane extract was selected for
68

bioassay-guided isolation to identify the bioactive compounds.
69
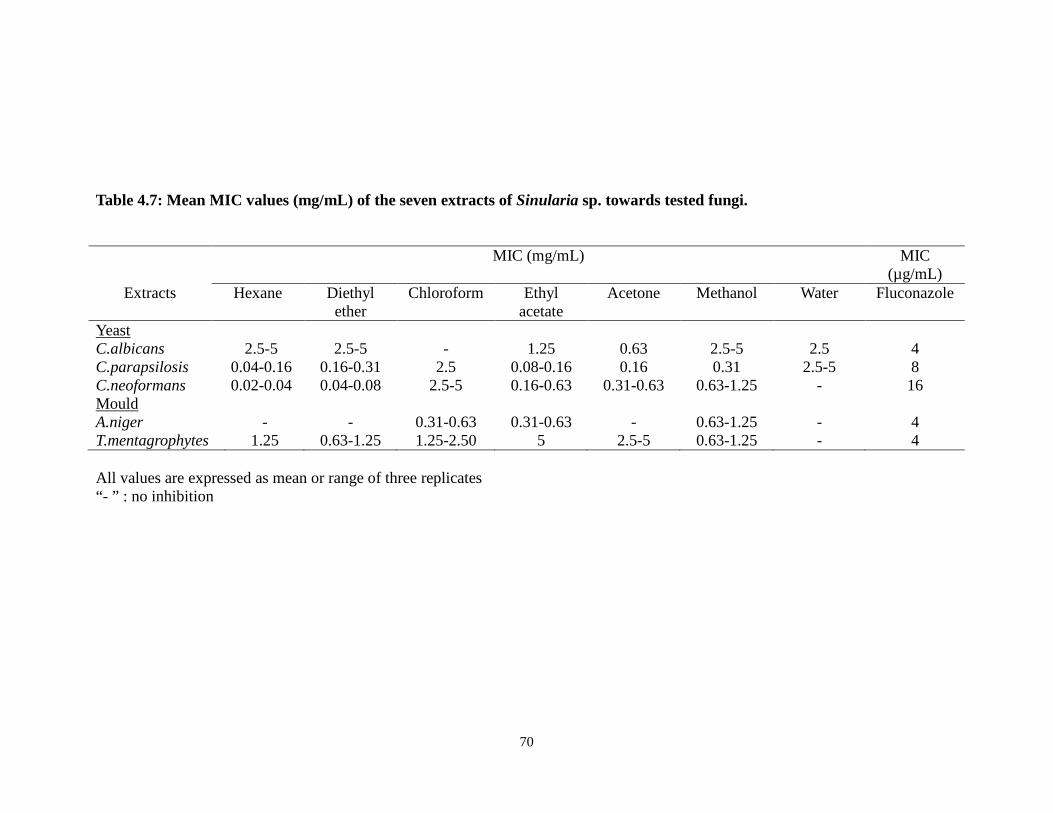
Table 4.7: Mean MIC values (mg/mL) of the seven extracts of Sinularia sp. towards tested fungi. MIC (mg/mL) MIC
(µg/mL) Extracts Hexane Diethyl
ether Chloroform Ethyl
acetate Acetone Methanol Water Fluconazole
Yeast C.albicans 2.5-5 2.5-5 - 1.25 0.63 2.5-5 2.5 4 C.parapsilosis 0.04-0.16 0.16-0.31 2.5 0.08-0.16 0.16 0.31 2.5-5 8 C.neoformans 0.02-0.04 0.04-0.08 2.5-5 0.16-0.63 0.31-0.63 0.63-1.25 - 16 Mould A.niger - - 0.31-0.63 0.31-0.63 - 0.63-1.25 - 4 T.mentagrophytes 1.25 0.63-1.25 1.25-2.50 5 2.5-5 0.63-1.25 - 4 All values are expressed as mean or range of three replicates “- ” : no inhibition
70
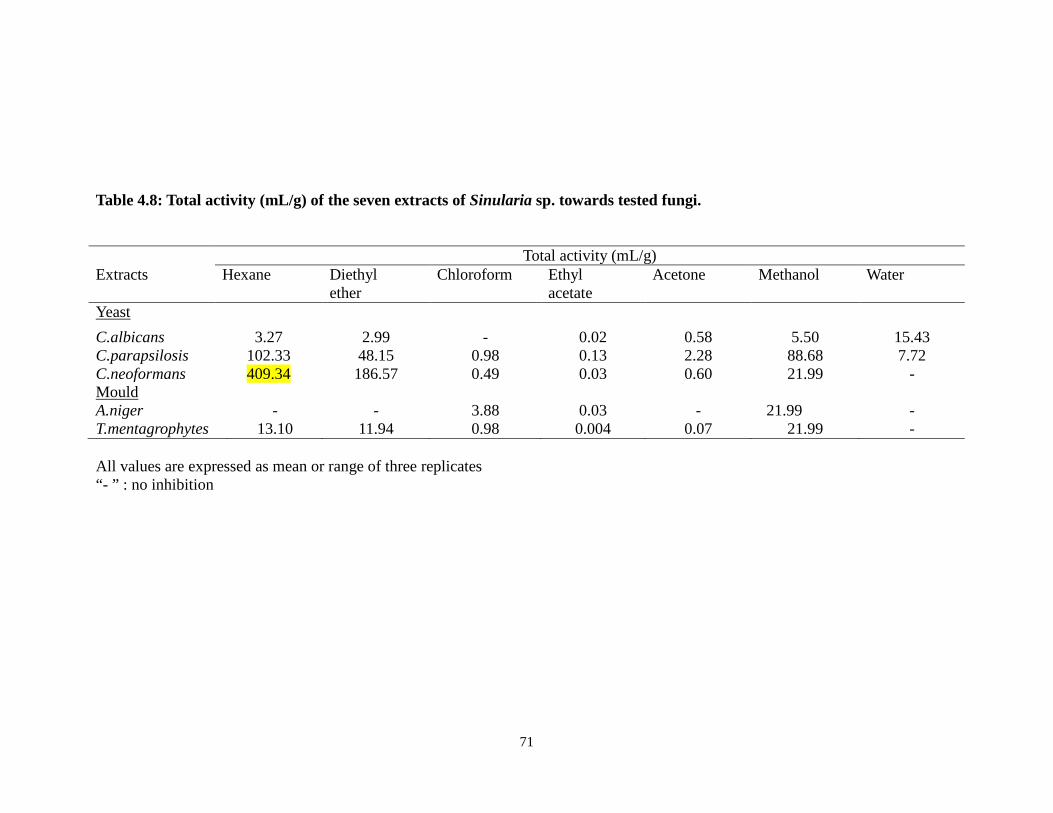
Table 4.8: Total activity (mL/g) of the seven extracts of Sinularia sp. towards tested fungi. Total activity (mL/g) Extracts Hexane Diethyl
ether Chloroform Ethyl
acetate Acetone Methanol Water
Yeast C.albicans 3.27 2.99 - 0.02 0.58 5.50 15.43 C.parapsilosis 102.33 48.15 0.98 0.13 2.28 88.68 7.72 C.neoformans 409.34 186.57 0.49 0.03 0.60 21.99 - Mould A.niger - - 3.88 0.03 - 21.99 - T.mentagrophytes 13.10 11.94 0.98 0.004 0.07 21.99 - All values are expressed as mean or range of three replicates “- ” : no inhibition
71
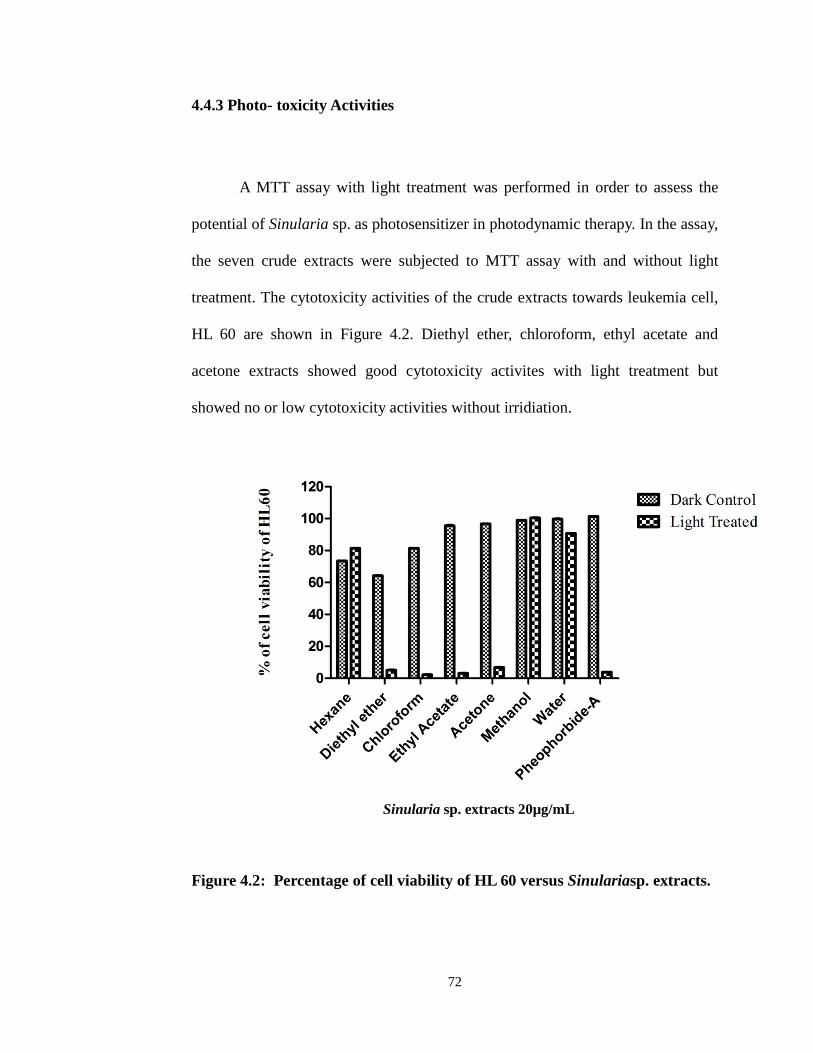
4.4.3 Photo- toxicity Activities
A MTT assay with light treatment was performed in order to assess the
potential of Sinularia sp. as photosensitizer in photodynamic therapy. In the assay,
the seven crude extracts were subjected to MTT assay with and without light
treatment. The cytotoxicity activities of the crude extracts towards leukemia cell,
HL 60 are shown in Figure 4.2. Diethyl ether, chloroform, ethyl acetate and
acetone extracts showed good cytotoxicity activites with light treatment but
showed no or low cytotoxicity activities without irridiation.
Sinularia sp. extracts 20µg/mL
Figure 4.2: Percentage of cell viability of HL 60 versus Sinulariasp. extracts.
72
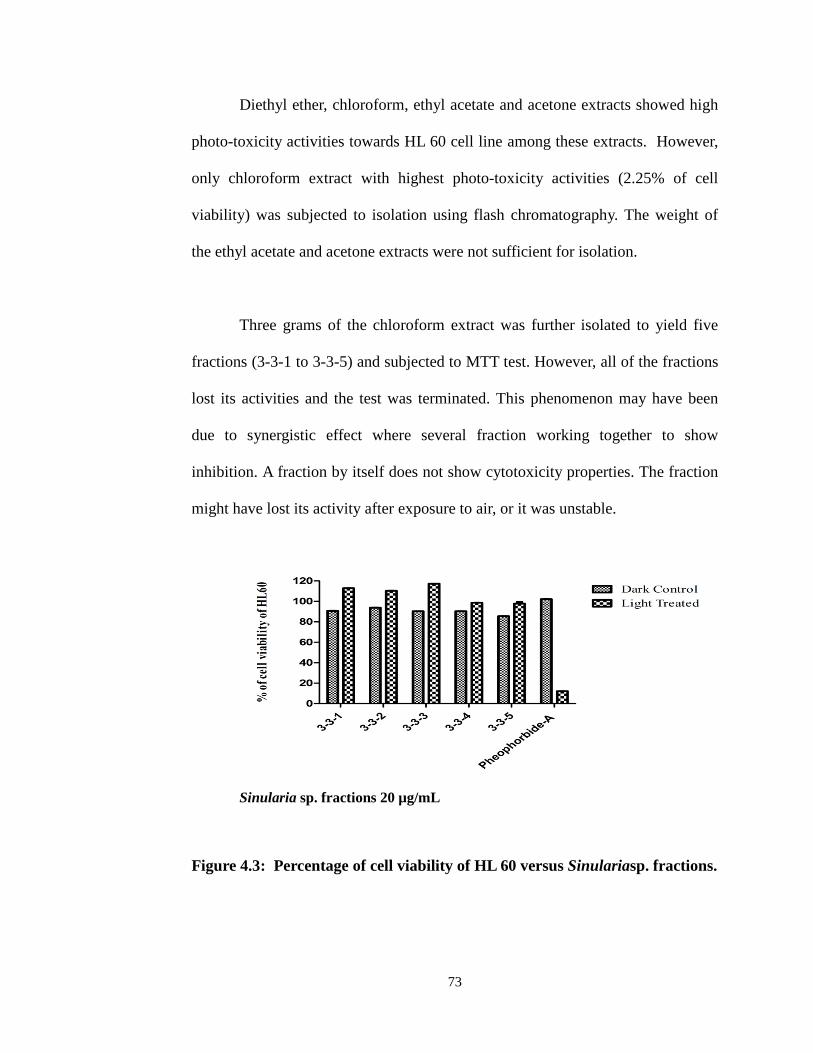
Diethyl ether, chloroform, ethyl acetate and acetone extracts showed high
photo-toxicity activities towards HL 60 cell line among these extracts. However,
only chloroform extract with highest photo-toxicity activities (2.25% of cell
viability) was subjected to isolation using flash chromatography. The weight of
the ethyl acetate and acetone extracts were not sufficient for isolation.
Three grams of the chloroform extract was further isolated to yield five
fractions (3-3-1 to 3-3-5) and subjected to MTT test. However, all of the fractions
lost its activities and the test was terminated. This phenomenon may have been
due to synergistic effect where several fraction working together to show
inhibition. A fraction by itself does not show cytotoxicity properties. The fraction
might have lost its activity after exposure to air, or it was unstable.
Sinularia sp. fractions 20 µg/mL
Figure 4.3: Percentage of cell viability of HL 60 versus Sinulariasp. fractions.
73
4.5 Isolation of Antifungal Components from Hexane Extract of Sinulariasp.
The hexane extract of Sinulariasp. was found to exhibit strong antifungal
activity and thus was subjected to isolation techniques to obtain its active
components.The hexane extract was subjected to modified column
chromatography techniques described by Li et al., (2005). The hexane extract
was fractionated into 30 fractions (AgN1 to AgN30) that were then subjected to
another round of antifungal activity screening. All 30 fractions were subjected to
GCMS analysis on an Agilent Technologies 6890N GC System. The total ion
chromatogram obtained was auto integrated by Chemstation and the constituents
were identified by comparison with published mass spectra databases (Wiley 9N
Mass Spectral Library).
A few fractions were found to exhibit strong antifungal activities towards
C. neoformans including AgN1 (MIC value 0.13 mg/mL), AgN6 (MIC value 0.06
mg/mL) and AgN27 (MIC value 0.016mg/mL). Fraction AgN1 is an oily mixture
of hydrocarbons and eight other compounds in this fraction. These are waxy
compounds common for protection and to prevent desiccation. The total ion
chromatogram is shown in Figures 4.4 – 4.11 and Appendix A. This is the first
report of waxy substances from the soft coral, Sinulariasp.
74
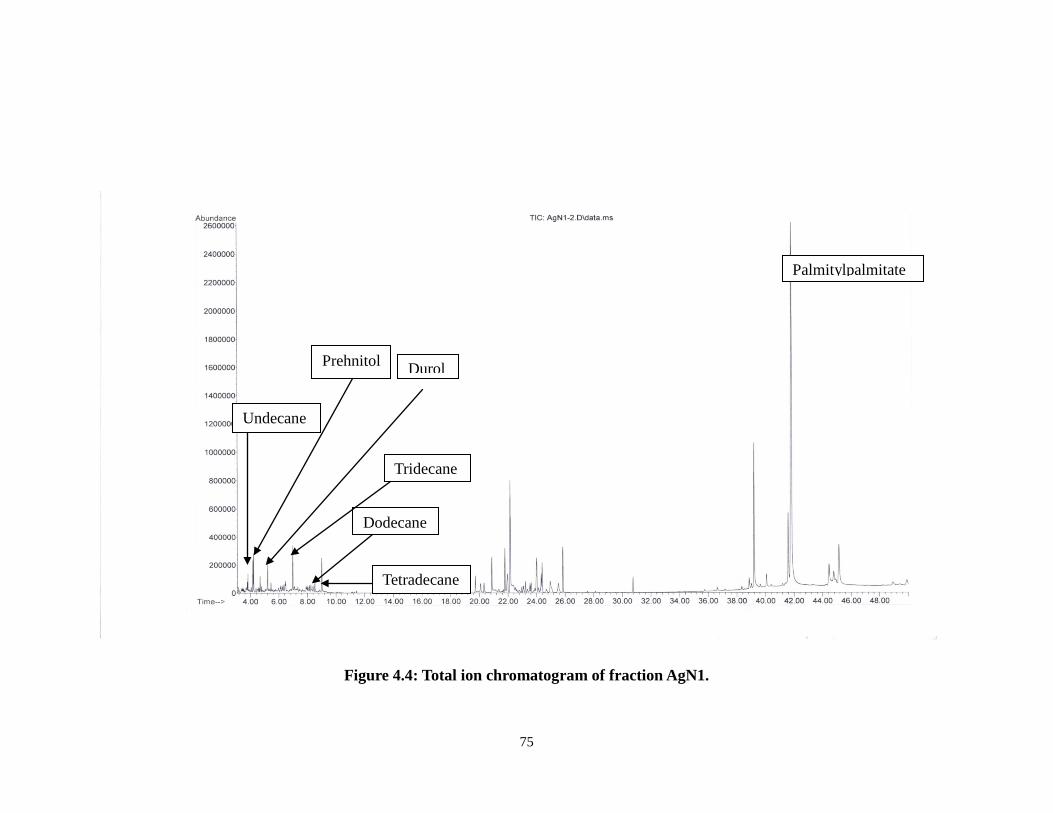
Figure 4.4: Total ion chromatogram of fraction AgN1.
Prehnitol
Dodecane
Palmitylpalmitate
Undecane
Tridecane
Tetradecane
Durol
75
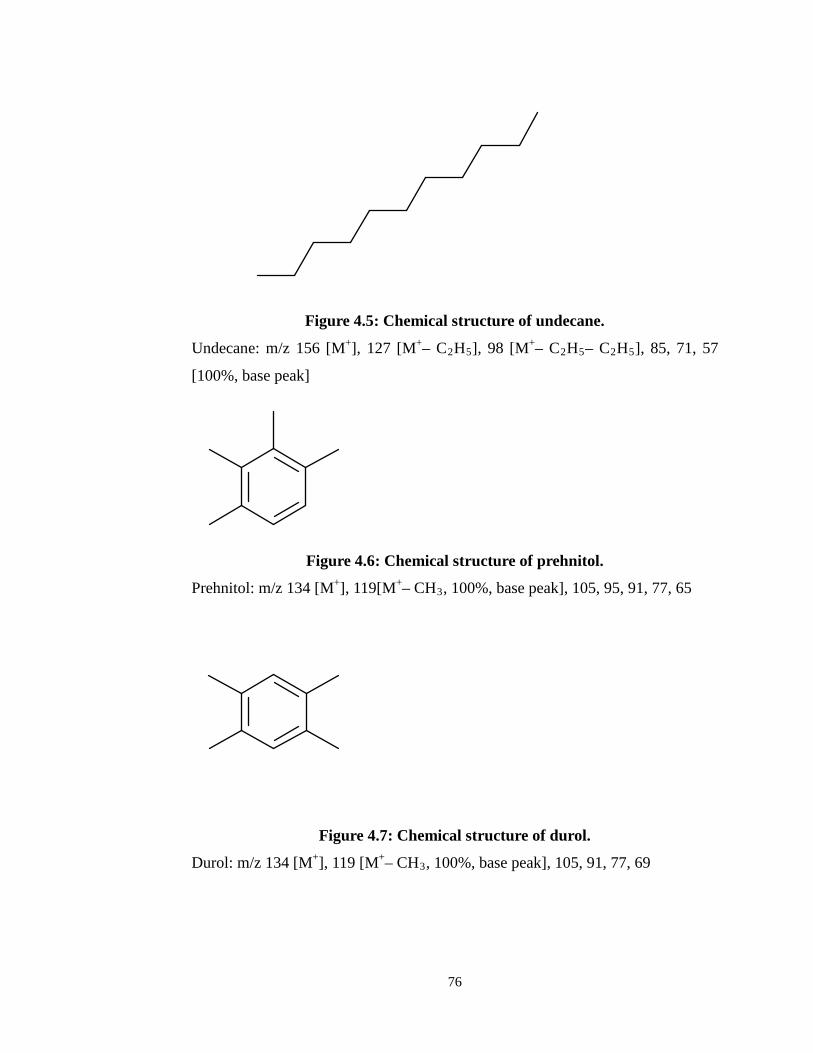
Figure 4.5: Chemical structure of undecane.
Undecane: m/z 156 [M+], 127 [M+– C2H5], 98 [M+– C2H5– C2H5], 85, 71, 57
[100%, base peak]
Figure 4.6: Chemical structure of prehnitol.
Prehnitol: m/z 134 [M+], 119[M+– CH3, 100%, base peak], 105, 95, 91, 77, 65
Figure 4.7: Chemical structure of durol.
Durol: m/z 134 [M+], 119 [M+– CH3, 100%, base peak], 105, 91, 77, 69
76
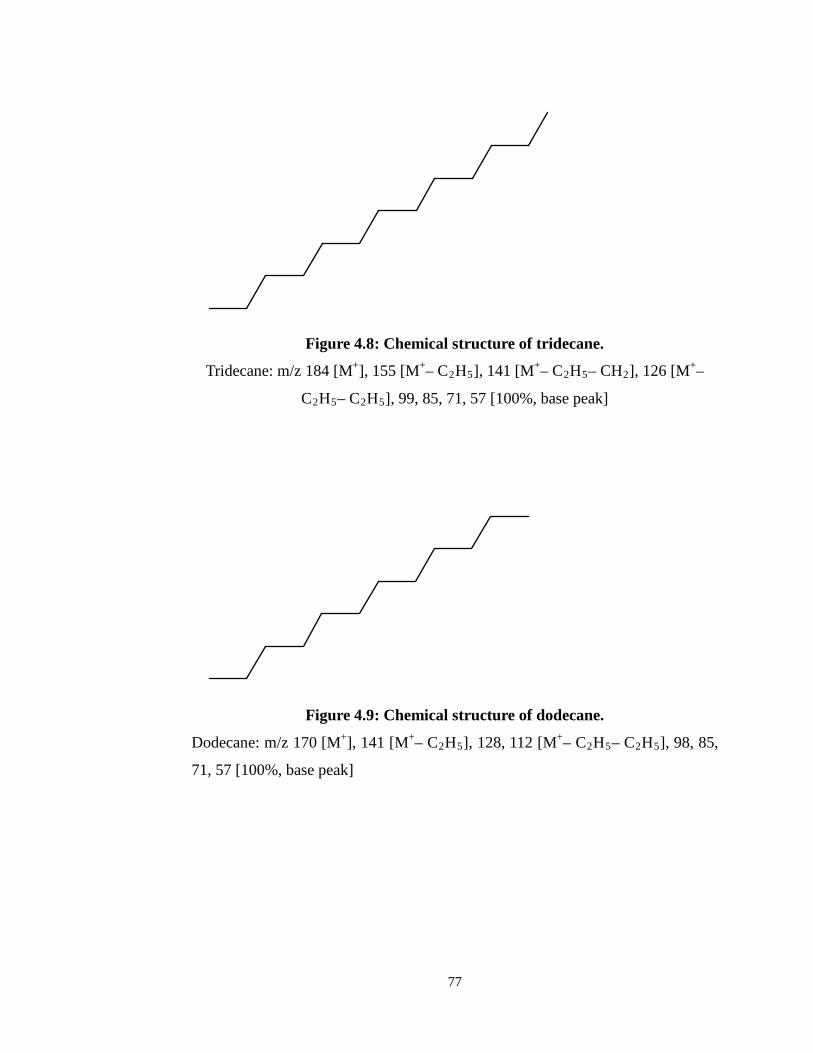
Figure 4.8: Chemical structure of tridecane.
Tridecane: m/z 184 [M+], 155 [M+– C2H5], 141 [M+– C2H5– CH2], 126 [M+–
C2H5– C2H5], 99, 85, 71, 57 [100%, base peak]
Figure 4.9: Chemical structure of dodecane.
Dodecane: m/z 170 [M+], 141 [M+– C2H5], 128, 112 [M+– C2H5– C2H5], 98, 85,
71, 57 [100%, base peak]
77
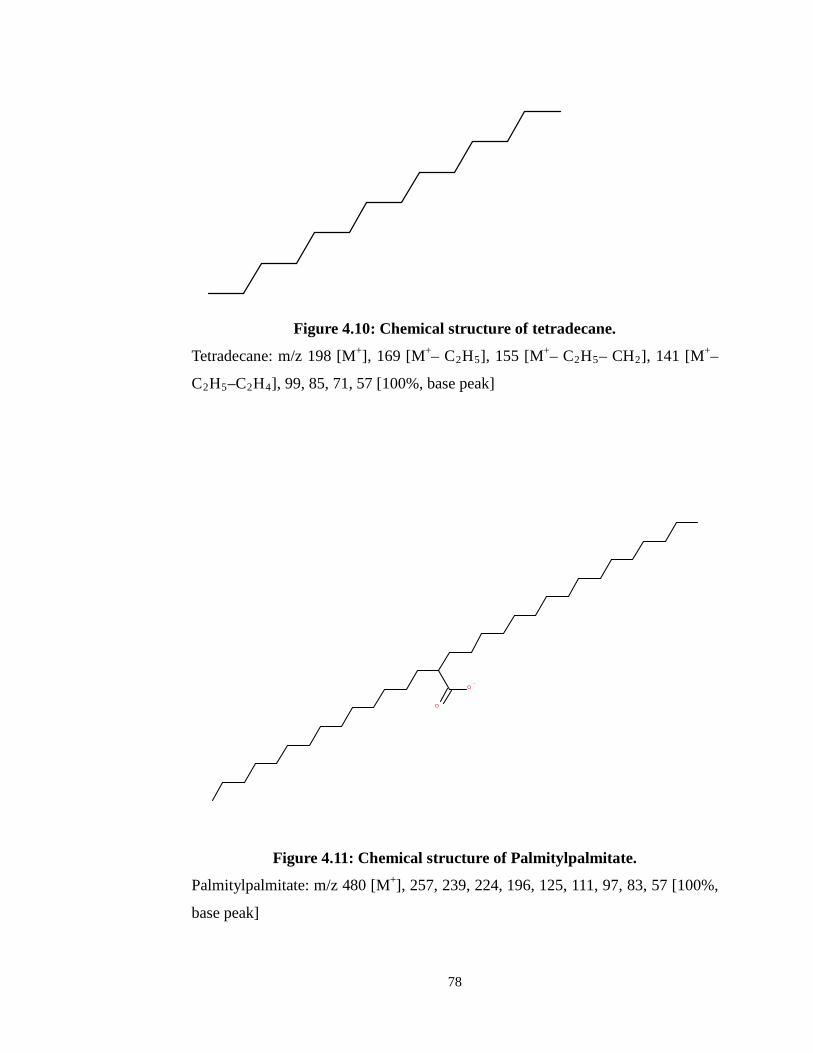
Figure 4.10: Chemical structure of tetradecane.
Tetradecane: m/z 198 [M+], 169 [M+– C2H5], 155 [M+– C2H5– CH2], 141 [M+–
C2H5–C2H4], 99, 85, 71, 57 [100%, base peak]
O
O–
Figure 4.11: Chemical structure of Palmitylpalmitate.
Palmitylpalmitate: m/z 480 [M+], 257, 239, 224, 196, 125, 111, 97, 83, 57 [100%,
base peak]
78
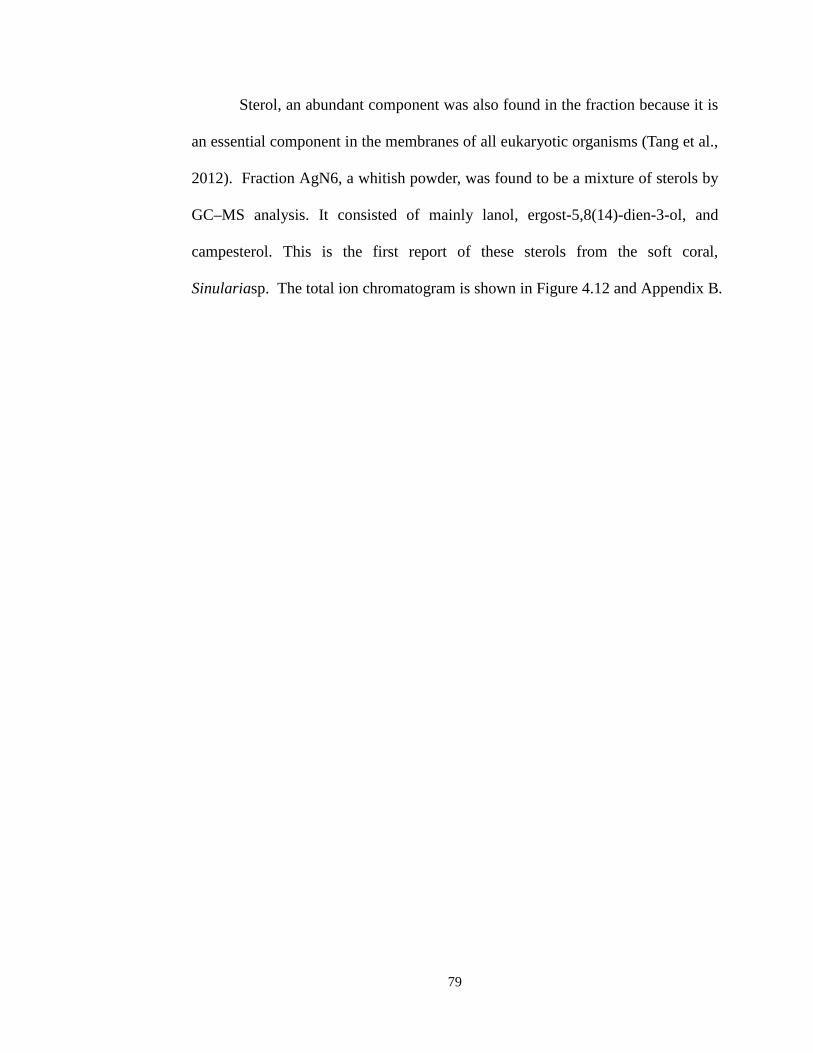
Sterol, an abundant component was also found in the fraction because it is
an essential component in the membranes of all eukaryotic organisms (Tang et al.,
2012). Fraction AgN6, a whitish powder, was found to be a mixture of sterols by
GC–MS analysis. It consisted of mainly lanol, ergost-5,8(14)-dien-3-ol, and
campesterol. This is the first report of these sterols from the soft coral,
Sinulariasp. The total ion chromatogram is shown in Figure 4.12 and Appendix B.
79
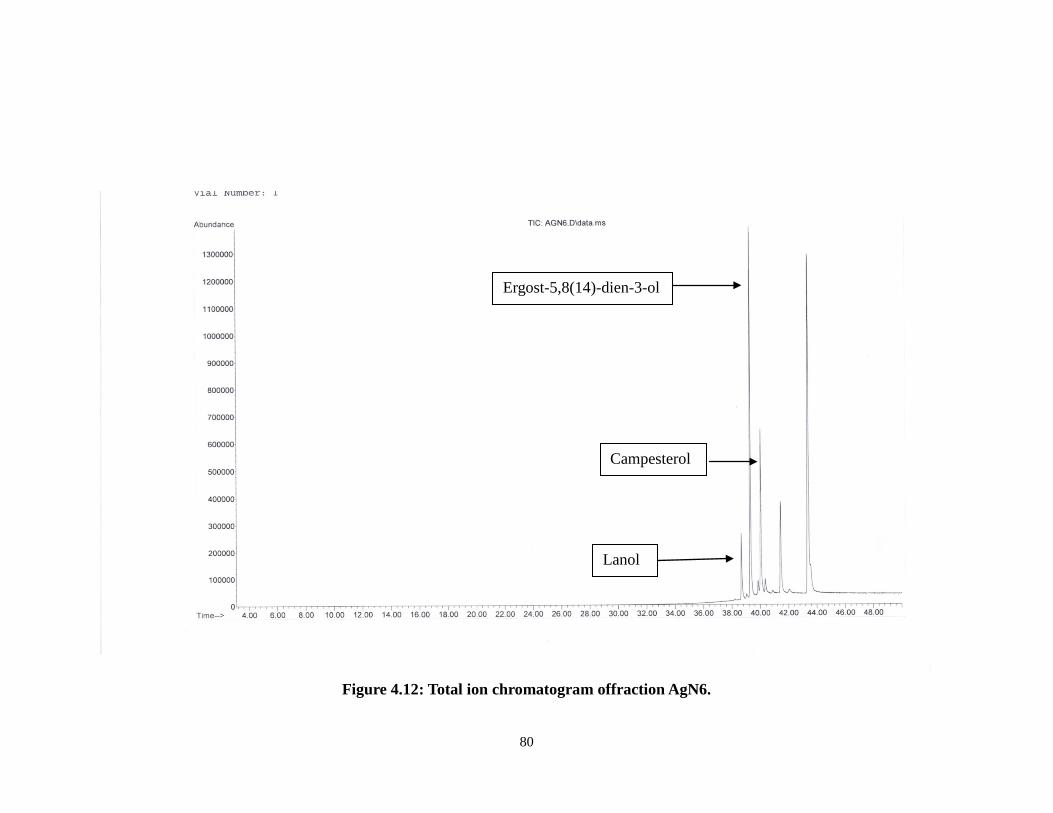
Figure 4.12: Total ion chromatogram offraction AgN6.
Ergost-5,8(14)-dien-3-ol
Lanol
Campesterol
80
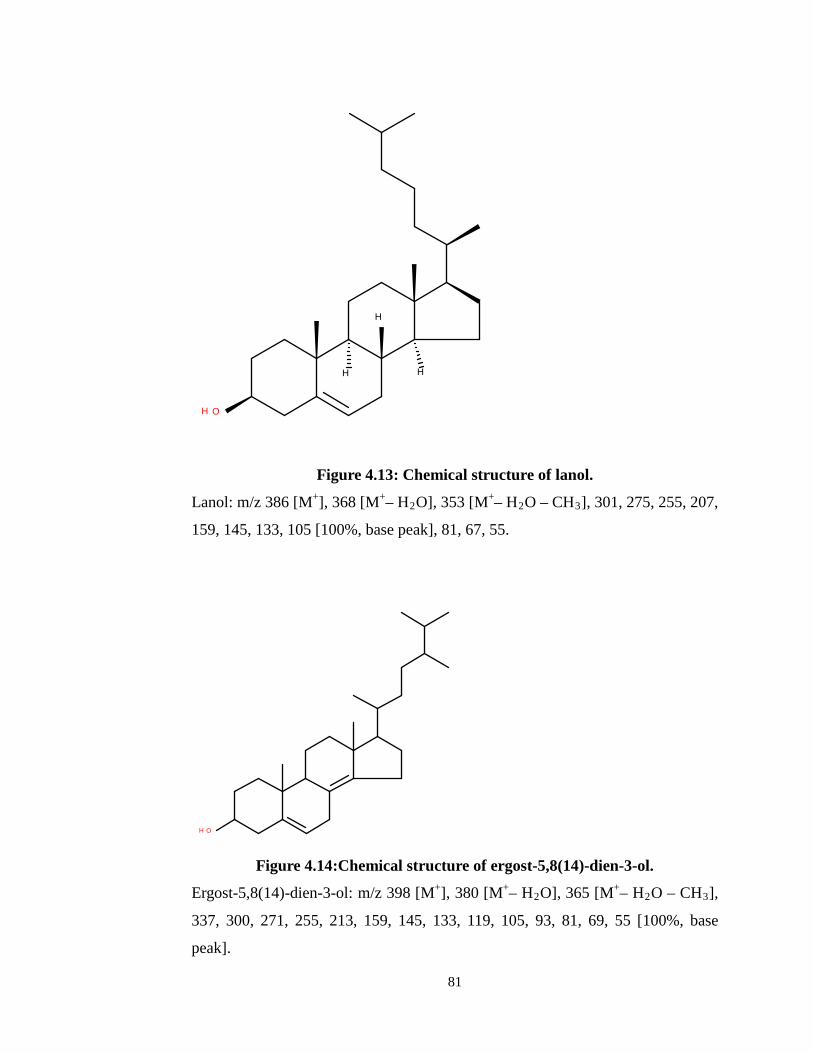
H
H
H
OH
Figure 4.13: Chemical structure of lanol.
Lanol: m/z 386 [M+], 368 [M+– H2O], 353 [M+– H2O – CH3], 301, 275, 255, 207,
159, 145, 133, 105 [100%, base peak], 81, 67, 55.
OH
Figure 4.14:Chemical structure of ergost-5,8(14)-dien-3-ol.
Ergost-5,8(14)-dien-3-ol: m/z 398 [M+], 380 [M+– H2O], 365 [M+– H2O – CH3],
337, 300, 271, 255, 213, 159, 145, 133, 119, 105, 93, 81, 69, 55 [100%, base
peak].
81
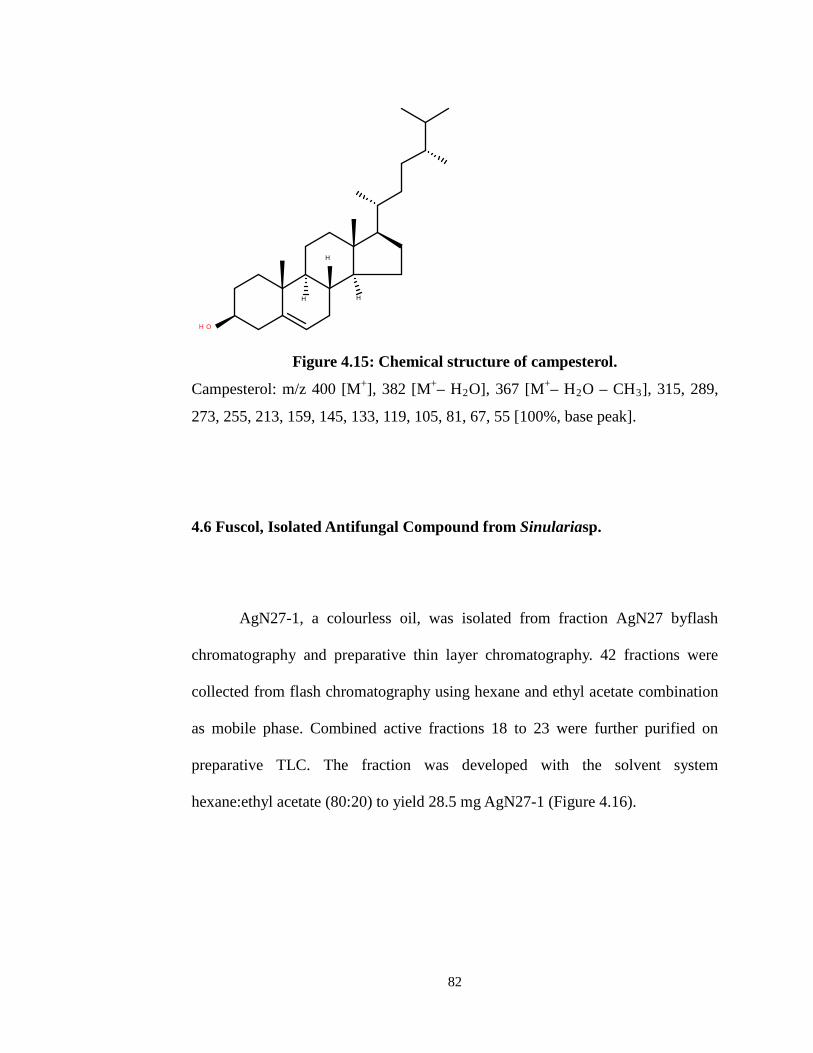
HH
H
OH
Figure 4.15: Chemical structure of campesterol.
Campesterol: m/z 400 [M+], 382 [M+– H2O], 367 [M+– H2O – CH3], 315, 289,
273, 255, 213, 159, 145, 133, 119, 105, 81, 67, 55 [100%, base peak].
4.6 Fuscol, Isolated Antifungal Compound from Sinulariasp.
AgN27-1, a colourless oil, was isolated from fraction AgN27 byflash
chromatography and preparative thin layer chromatography. 42 fractions were
collected from flash chromatography using hexane and ethyl acetate combination
as mobile phase. Combined active fractions 18 to 23 were further purified on
preparative TLC. The fraction was developed with the solvent system
hexane:ethyl acetate (80:20) to yield 28.5 mg AgN27-1 (Figure 4.16).
82
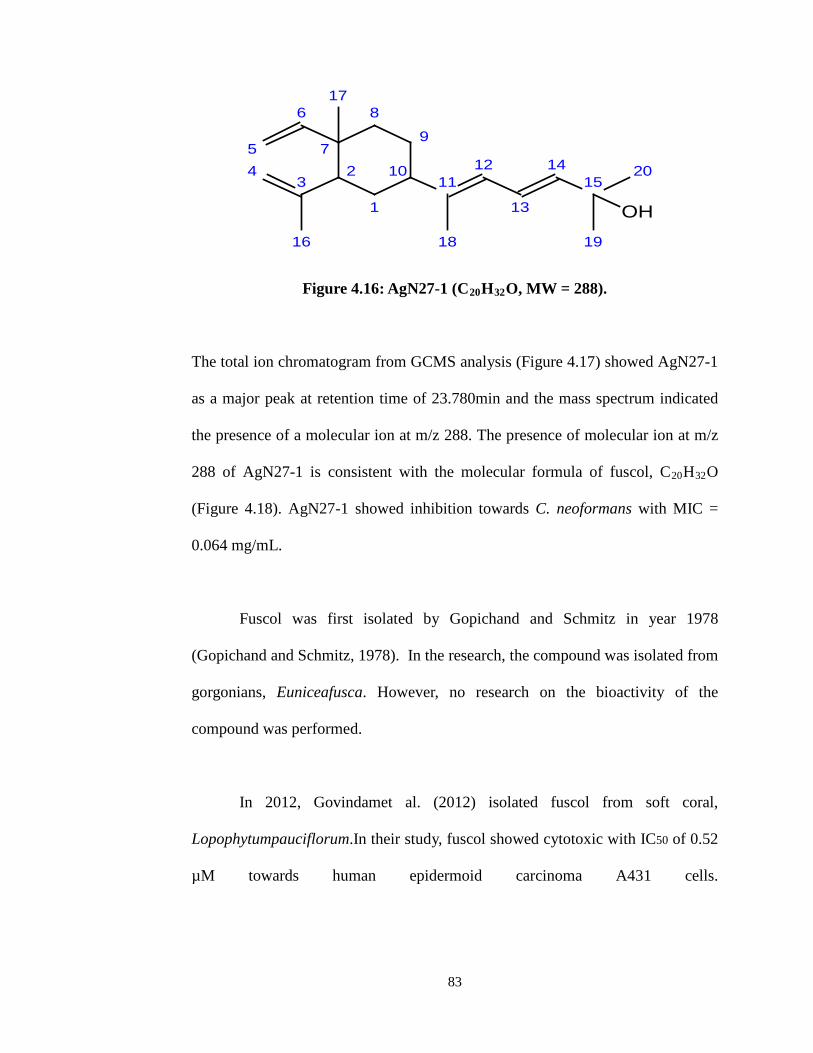
Figure 4.16: AgN27-1 (C20H32O, MW = 288).
The total ion chromatogram from GCMS analysis (Figure 4.17) showed AgN27-1
as a major peak at retention time of 23.780min and the mass spectrum indicated
the presence of a molecular ion at m/z 288. The presence of molecular ion at m/z
288 of AgN27-1 is consistent with the molecular formula of fuscol, C20H32O
(Figure 4.18). AgN27-1 showed inhibition towards C. neoformans with MIC =
0.064 mg/mL.
Fuscol was first isolated by Gopichand and Schmitz in year 1978
(Gopichand and Schmitz, 1978). In the research, the compound was isolated from
gorgonians, Euniceafusca. However, no research on the bioactivity of the
compound was performed.
In 2012, Govindamet al. (2012) isolated fuscol from soft coral,
Lopophytumpauciflorum.In their study, fuscol showed cytotoxic with IC50 of 0.52
µM towards human epidermoid carcinoma A431 cells.
72
6
3
54
8
9
1
10
16
17
11
18
12
13
1415
20
19
OH
83
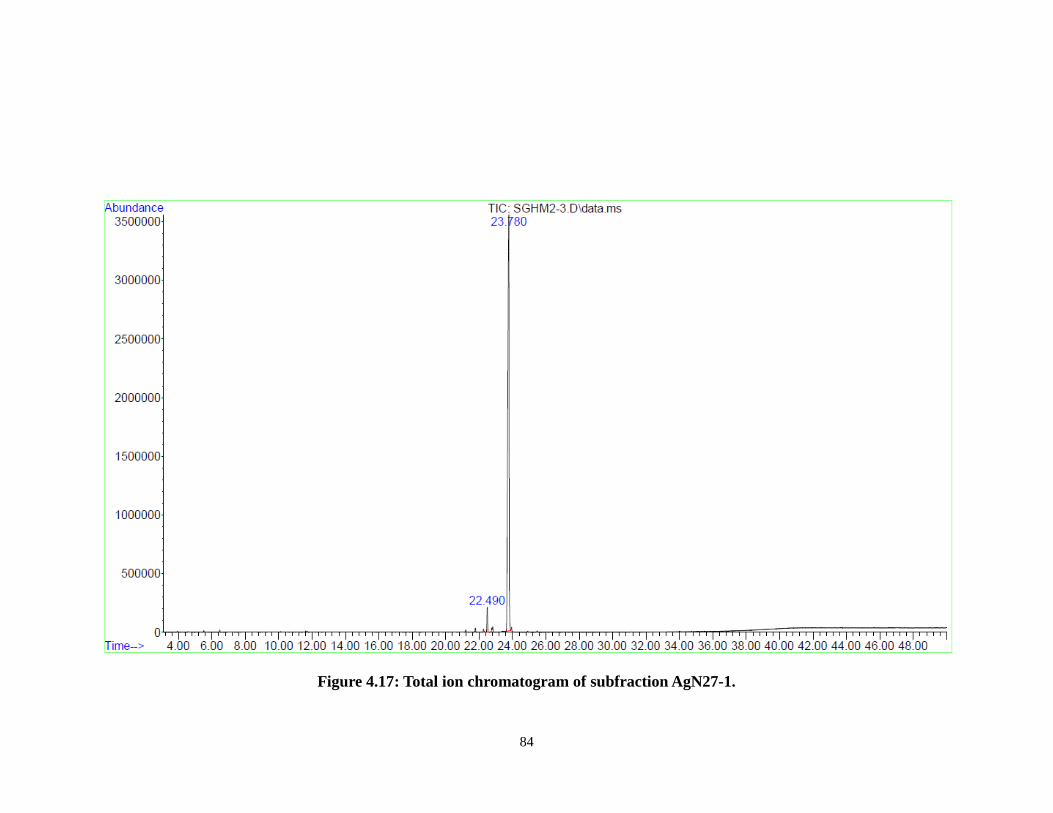
Figure 4.17: Total ion chromatogram of subfraction AgN27-1.
84
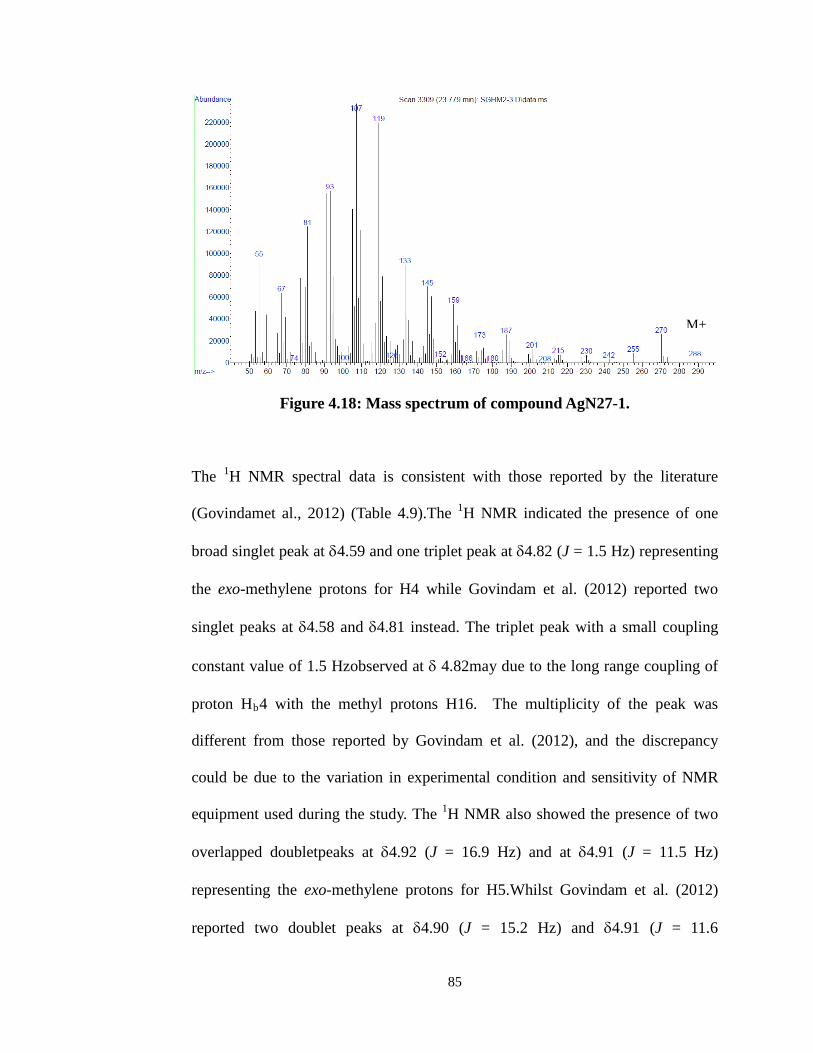
Figure 4.18: Mass spectrum of compound AgN27-1.
The 1H NMR spectral data is consistent with those reported by the literature
(Govindamet al., 2012) (Table 4.9).The 1H NMR indicated the presence of one
broad singlet peak at δ4.59 and one triplet peak at δ4.82 (J = 1.5 Hz) representing
the exo-methylene protons for H4 while Govindam et al. (2012) reported two
singlet peaks at δ4.58 and δ4.81 instead. The triplet peak with a small coupling
constant value of 1.5 Hzobserved at δ 4.82may due to the long range coupling of
proton Hb4 with the methyl protons H16. The multiplicity of the peak was
different from those reported by Govindam et al. (2012), and the discrepancy
could be due to the variation in experimental condition and sensitivity of NMR
equipment used during the study. The 1H NMR also showed the presence of two
overlapped doubletpeaks at δ4.92 (J = 16.9 Hz) and at δ4.91 (J = 11.5 Hz)
representing the exo-methylene protons for H5.Whilst Govindam et al. (2012)
reported two doublet peaks at δ4.90 (J = 15.2 Hz) and δ4.91 (J = 11.6
M+
85
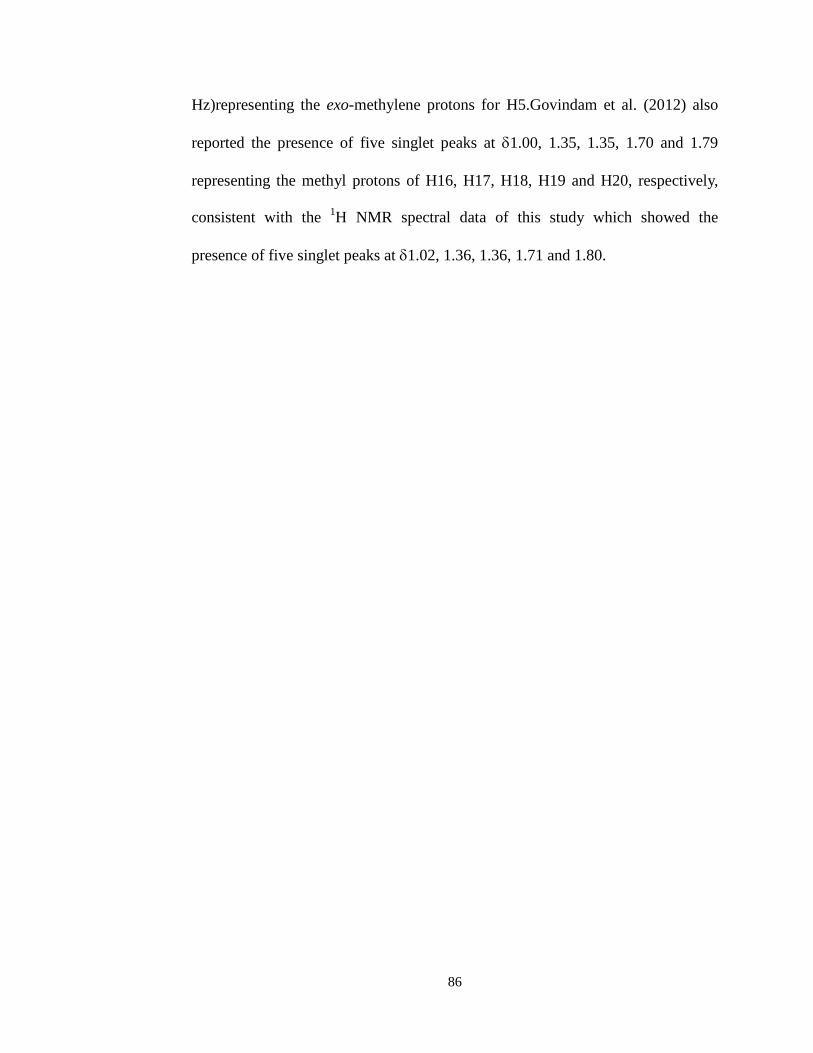
Hz)representing the exo-methylene protons for H5.Govindam et al. (2012) also
reported the presence of five singlet peaks at δ1.00, 1.35, 1.35, 1.70 and 1.79
representing the methyl protons of H16, H17, H18, H19 and H20, respectively,
consistent with the 1H NMR spectral data of this study which showed the
presence of five singlet peaks at δ1.02, 1.36, 1.36, 1.71 and 1.80.
86
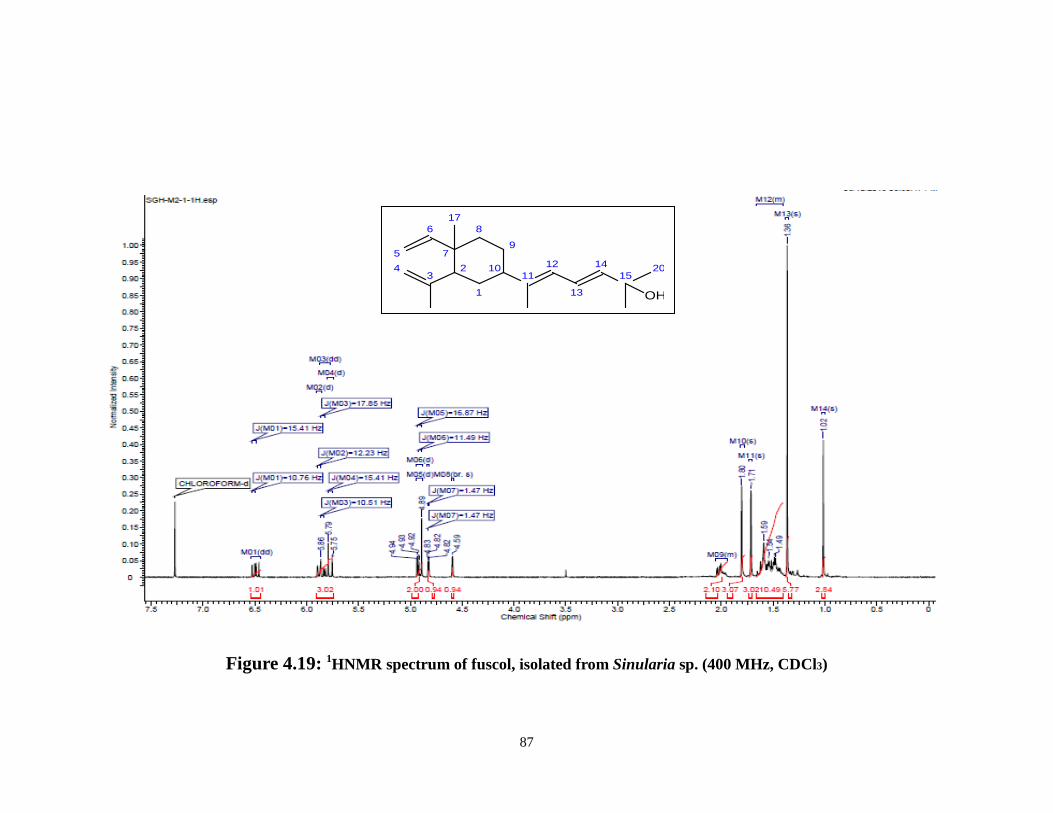
Figure 4.19: 1HNMR spectrum of fuscol, isolated from Sinularia sp. (400 MHz, CDCl3)
72
6
3
54
8
9
1
10
17
1112
13
1415
20
OH
87
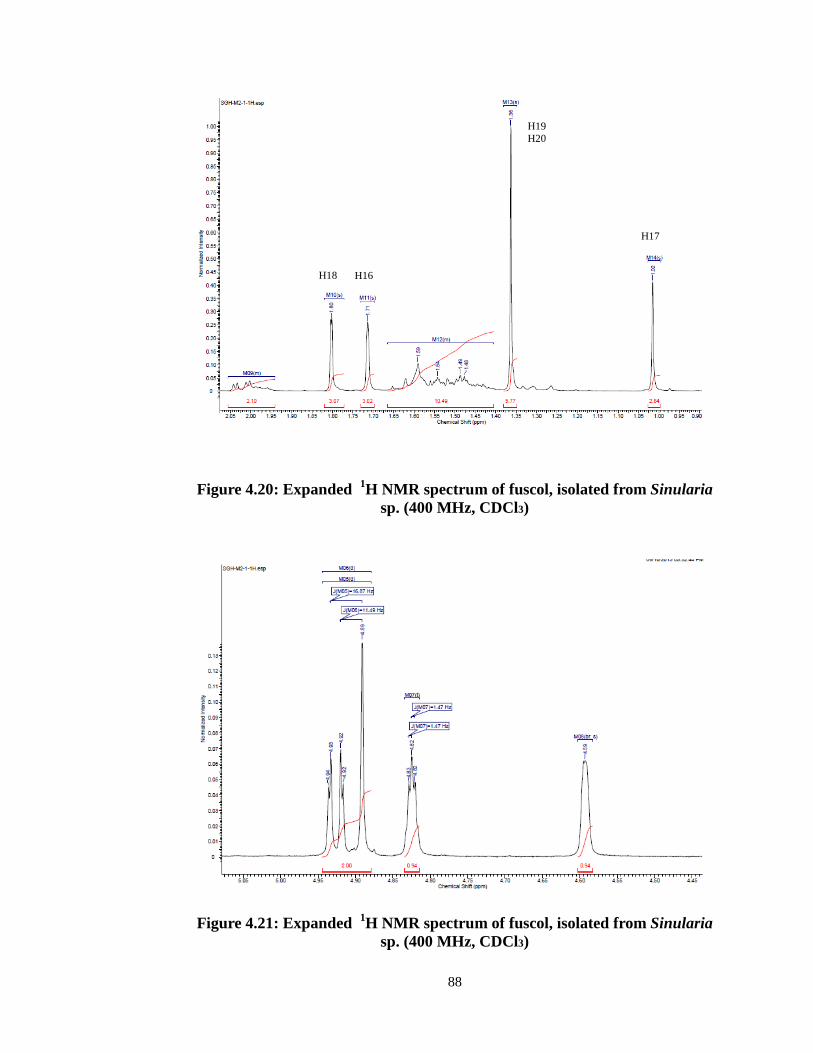
Figure 4.20: Expanded 1H NMR spectrum of fuscol, isolated from Sinularia
sp. (400 MHz, CDCl3)
Figure 4.21: Expanded 1H NMR spectrum of fuscol, isolated from Sinularia
sp. (400 MHz, CDCl3)
H17
H19 H20
H18 H16
88
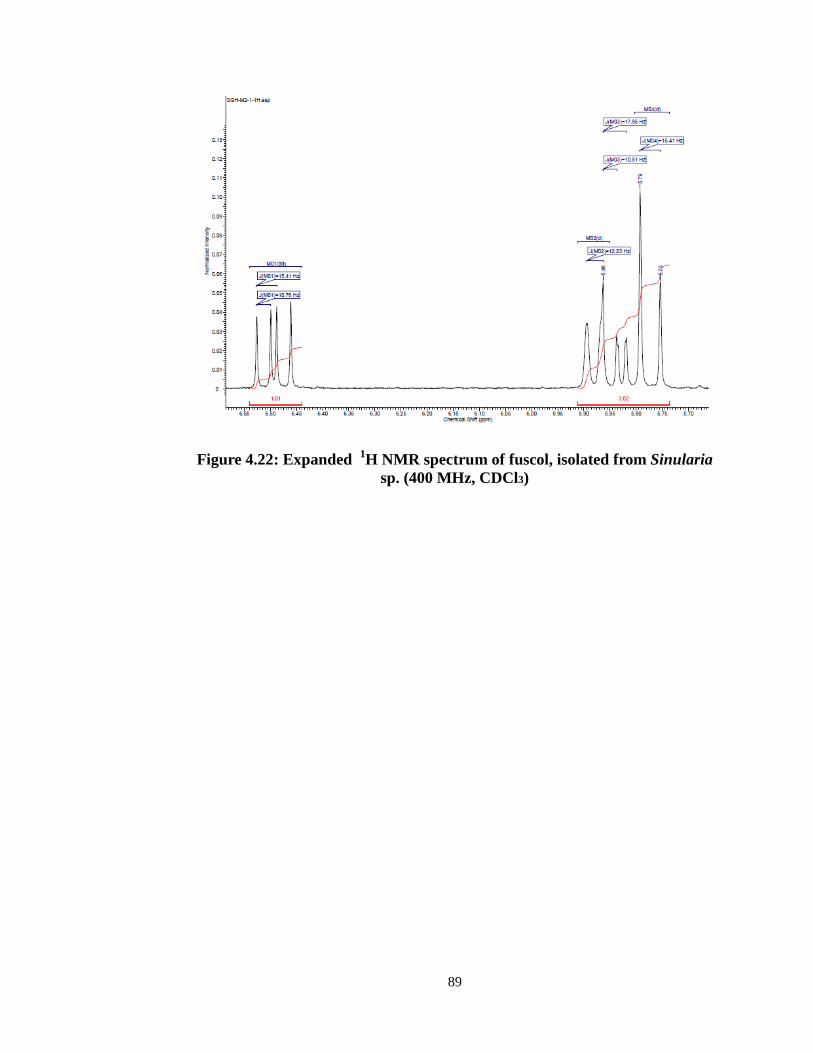
Figure 4.22: Expanded 1H NMR spectrum of fuscol, isolated from Sinularia
sp. (400 MHz, CDCl3)
89
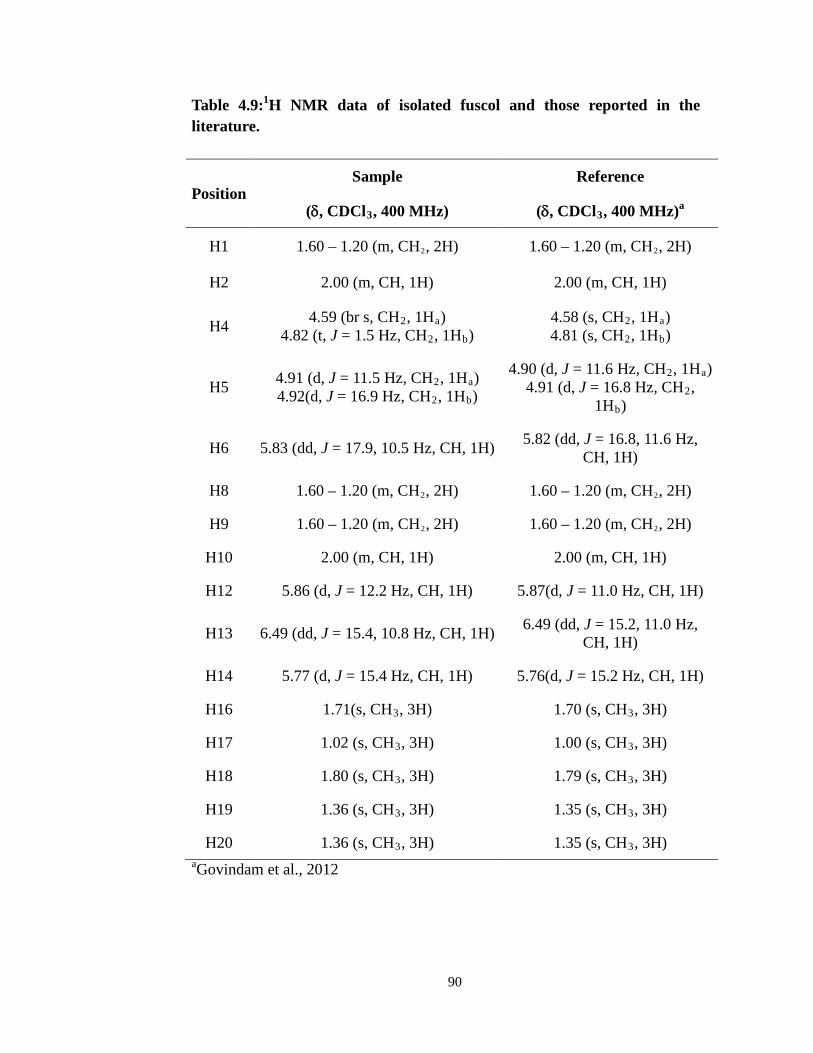
Table 4.9:1H NMR data of isolated fuscol and those reported in the literature.
Position Sample Reference
(δ, CDCl3, 400 MHz) (δ, CDCl3, 400 MHz)a
H1 1.60 – 1.20 (m, CH2, 2H) 1.60 – 1.20 (m, CH2, 2H)
H2 2.00 (m, CH, 1H) 2.00 (m, CH, 1H)
H4 4.59 (br s, CH2, 1Ha) 4.82 (t, J = 1.5 Hz, CH2, 1Hb)
4.58 (s, CH2, 1Ha) 4.81 (s, CH2, 1Hb)
H5 4.91 (d, J = 11.5 Hz, CH2, 1Ha) 4.92(d, J = 16.9 Hz, CH2, 1Hb)
4.90 (d, J = 11.6 Hz, CH2, 1Ha) 4.91 (d, J = 16.8 Hz, CH2,
1Hb)
H6 5.83 (dd, J = 17.9, 10.5 Hz, CH, 1H) 5.82 (dd, J = 16.8, 11.6 Hz, CH, 1H)
H8 1.60 – 1.20 (m, CH2, 2H) 1.60 – 1.20 (m, CH2, 2H)
H9 1.60 – 1.20 (m, CH2, 2H) 1.60 – 1.20 (m, CH2, 2H)
H10 2.00 (m, CH, 1H) 2.00 (m, CH, 1H)
H12 5.86 (d, J = 12.2 Hz, CH, 1H) 5.87(d, J = 11.0 Hz, CH, 1H)
H13 6.49 (dd, J = 15.4, 10.8 Hz, CH, 1H) 6.49 (dd, J = 15.2, 11.0 Hz, CH, 1H)
H14 5.77 (d, J = 15.4 Hz, CH, 1H) 5.76(d, J = 15.2 Hz, CH, 1H)
H16 1.71(s, CH3, 3H) 1.70 (s, CH3, 3H)
H17 1.02 (s, CH3, 3H) 1.00 (s, CH3, 3H)
H18 1.80 (s, CH3, 3H) 1.79 (s, CH3, 3H)
H19 1.36 (s, CH3, 3H) 1.35 (s, CH3, 3H)
H20 1.36 (s, CH3, 3H) 1.35 (s, CH3, 3H) aGovindam et al., 2012
90
The 13C NMR broadband spectrum (Figure 4.23) showed the presence of
20 carbons consisting of five methyl carbons at δ15.4, 16.7, 24.8, 29.9, 29.9, three
methylene carbons at δ26.5, 32.6, 39.8, two exo–methylene carbons at δ 109.9,
112.1, six methine carbons at δ47.6, 52.7, 122.4, 123.0, 139.2, 150.2 and four
quaternary carbons at δ39.3, 70.9, 143.4, 147.6. The assignment of the carbon
types was confirmed through the DEPT analysis (Figure 4.24).
The structure of fuscol was further confirmed by the heteronuclear single
quantum coherence (HSQC) and heteronuclear multiple bond coherence (HMBC)
data as shown in Table 4.11. HSQC spectrum (Figure 4.25)showed the direct 1H–
13C correlation in fuscol, while HMBC spectrum showed long range connectivity
of proton to carbons separated by one or two atoms away and also correlate
quaternary carbons with nearby protons in fuscol (Figure 4.26) (Silverstein and
Webster, 1998).
Quaternary carbon C3 showed 2J correlations with methine proton H2,
exo-methylene protons H4 and methyl proton H16. There are 2J correlations
between quaternary carbon C7 and methyl proton H17 and methine protons H2
and H6, whilst it also showed 3J correlation with exo-methylene protons H5.
Quaternary carbon C11, on the other hand, showed 2J correlation with methyl
proton H18 and 3J correlation with methine proton H13. As for quaternary carbon
C15, it showed 3J correlation with methine proton H13 and 2J correlation with
methine proton H14 and both methyl protons H19 and H20.
91
Exo-methylene carbonC4 showed 3J correlations with methine proton H2
and methyl proton H16, whilst its protons exhibited3J correlation with methine
carbonC2 and methyl carbonC16. The exo-methylene protonH4 showed 2J
correlation with quaternary carbon C3.
Methyl carbon C16 has 3J correlation with methine proton H2 and exo-
methylene protons H4. Methyl proton H16 showed 2J correlation with quaternary
carbon C3, 3J correlation with methine carbonC2 and exo-methylene carbon C4.
As for methyl carbon C17, it showed 3J correlation with methine protons H2 and
H6 whilst its protons showed 2J correlation with quaternary carbon C7, 3J
correlation with methine carbonsC2 and methylene carbon C8. There are 3J
correlations between methyl carbon C18 and methine protons H10 and H12 while
methyl proton H18 has 2J correlations with quaternary carbon C11 and 3J
correlations with methine carbons C10 and C12. Both methyl carbons C19 and
C20 showed 3J correlations with mehine proton H14 and each other protons.
Both methyl protons of H19 and H20 exhibited 2J correlation with quaternary
carbon C15 and 3J correlation with methine carbon C14. Both methyl protons of
H19 and H20 also showed 3J correlation with each other carbon.
The methine carbon C12 showed 2J correlation with methine proton H13
and 3J correlation with methyl protons H18. There are 3J correlation between
methine proton H12 with methine carbon C10 and methyl carbon C18. Methine
proton H12also found to have2J correlation with methine carbon C13.
92
Methinecarbon C13 has 2J correlation with methine protons H12 and H14. As for
its methine proton, H13 showed 2J correlation with methine carbons C12 and
C14, 3J correlation with quaternary carbons C11 and C15. Methine proton H14
showed 2J correlation with methine carbon C13 and quaternary carbon C15. It
also showed 3J correlation with methine carbon C13 and both methyl carbons C19
and C20. Whilst its methine carbon C14 showed 2J correlation with methine
proton H13 and 3J correlations with methine proton H12 and both methyl protons
H19 and H20.
93
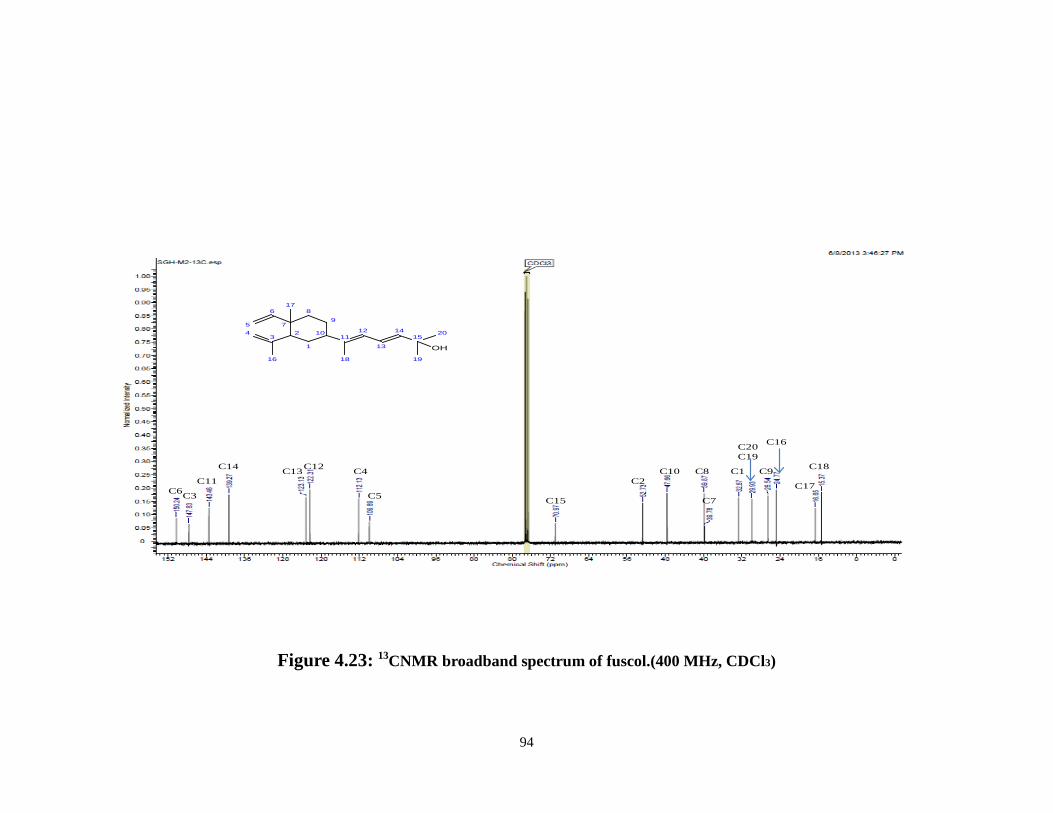
C1
C5
C2
C3
C4
C6C7
C8 C9C10
C16
C13C11
C14 C18
C17
C12C19
C15
C20
72
6
3
54
8
9
1
10
16
17
11
18
12
13
1415
20
19
OH
Figure 4.23: 13CNMR broadband spectrum of fuscol.(400 MHz, CDCl3)
94
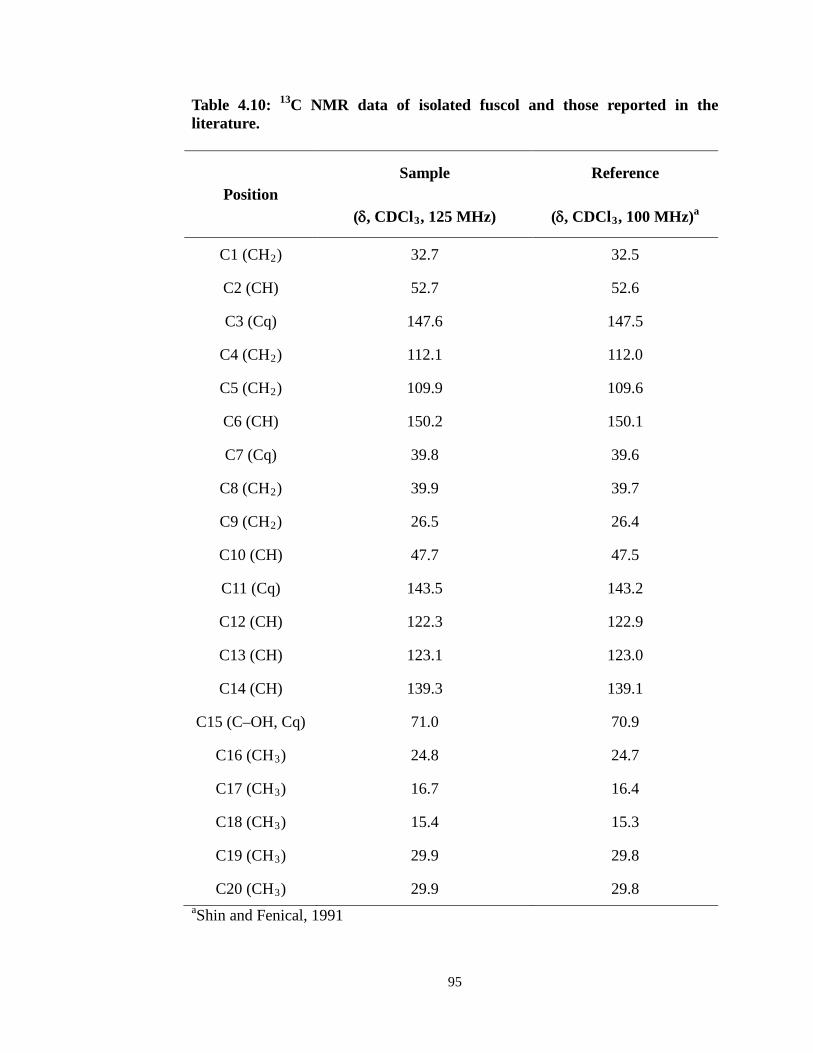
Table 4.10: 13C NMR data of isolated fuscol and those reported in the literature.
Position Sample Reference
(δ, CDCl3, 125 MHz) (δ, CDCl3, 100 MHz)a
C1 (CH2) 32.7 32.5
C2 (CH) 52.7 52.6
C3 (Cq) 147.6 147.5
C4 (CH2) 112.1 112.0
C5 (CH2) 109.9 109.6
C6 (CH) 150.2 150.1
C7 (Cq) 39.8 39.6
C8 (CH2) 39.9 39.7
C9 (CH2) 26.5 26.4
C10 (CH) 47.7 47.5
C11 (Cq) 143.5 143.2
C12 (CH) 122.3 122.9
C13 (CH) 123.1 123.0
C14 (CH) 139.3 139.1
C15 (C–OH, Cq) 71.0 70.9
C16 (CH3) 24.8 24.7
C17 (CH3) 16.7 16.4
C18 (CH3) 15.4 15.3
C19 (CH3) 29.9 29.8
C20 (CH3) 29.9 29.8 aShin and Fenical, 1991
95
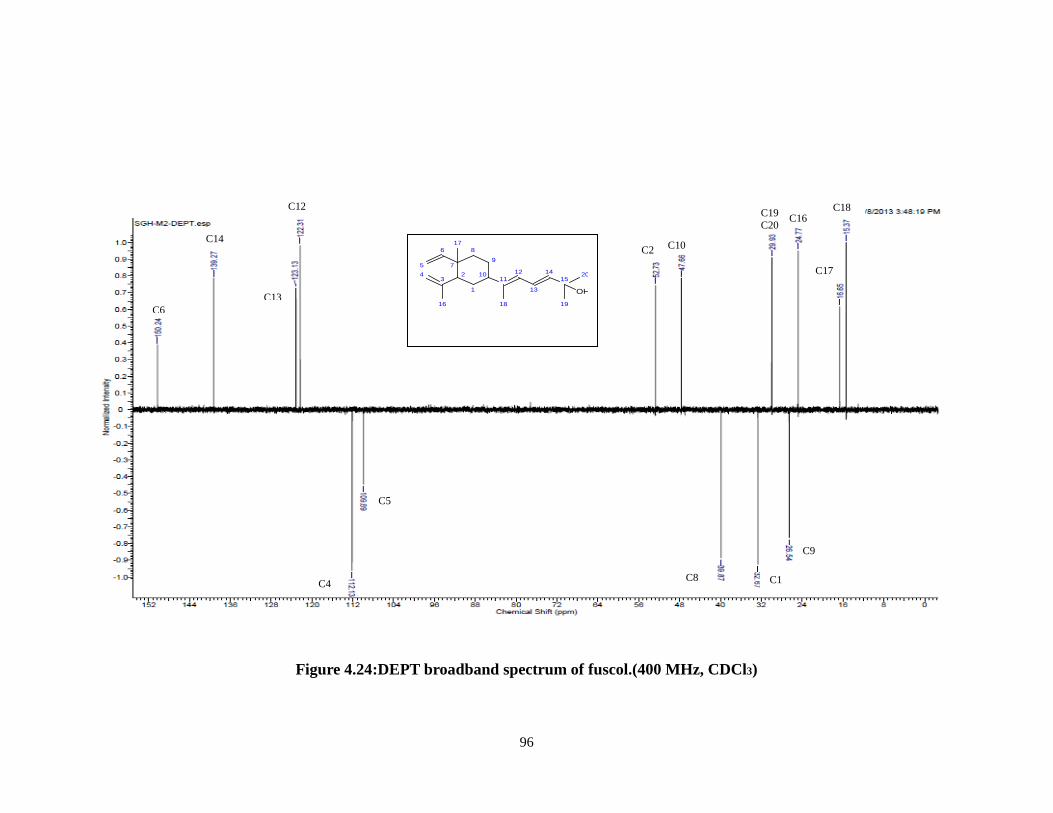
Figure 4.24:DEPT broadband spectrum of fuscol.(400 MHz, CDCl3)
72
6
3
54
8
9
1
10
16
17
11
18
12
13
1415
20
19
OH
C6
C14
C13
C12
C2 C10
C19 C20 C16
C17
C18
C4
C5
C8 C1
C9
96
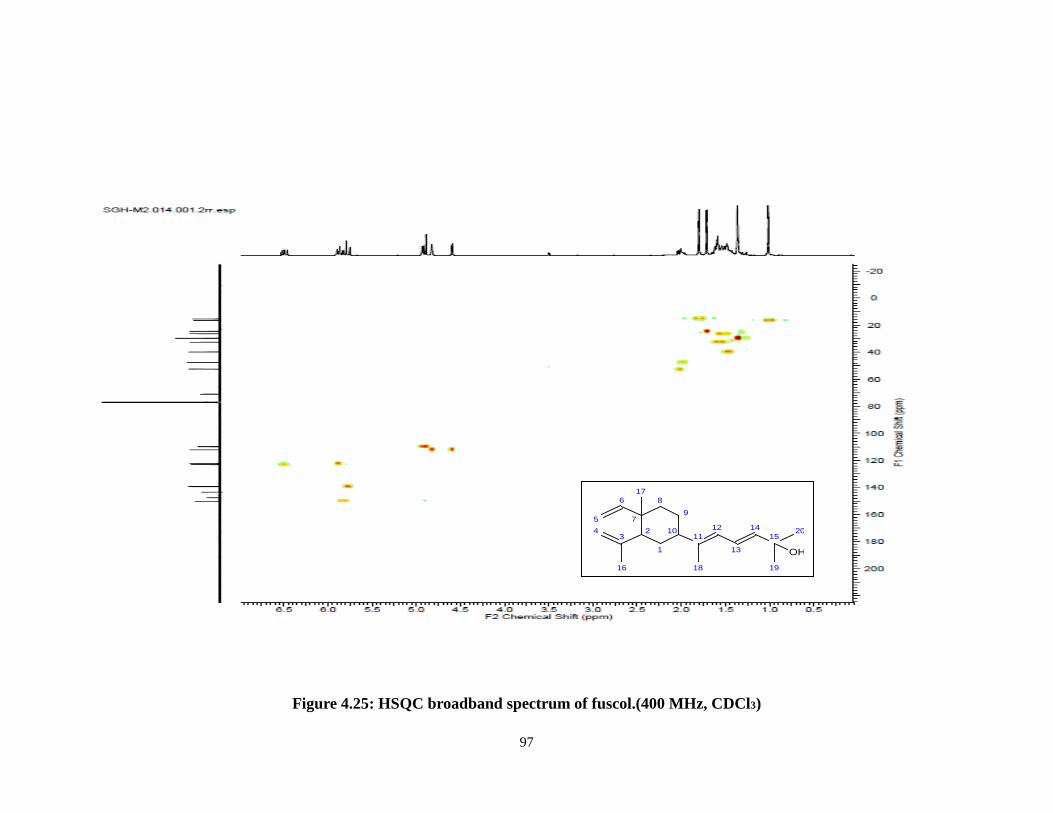
Figure 4.25: HSQC broadband spectrum of fuscol.(400 MHz, CDCl3)
72
6
3
54
8
9
1
10
16
17
11
18
12
13
1415
20
19
OH
97
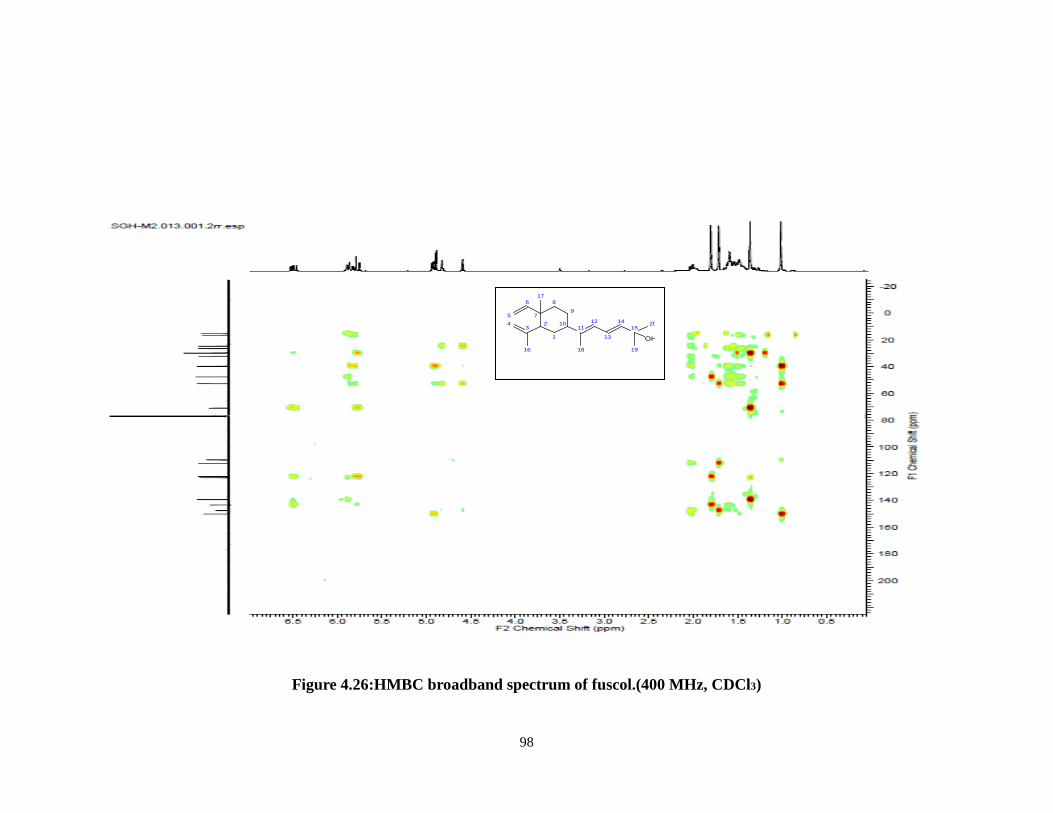
Figure 4.26:HMBC broadband spectrum of fuscol.(400 MHz, CDCl3)
72
6
3
54
8
9
1
10
16
17
11
18
12
13
1415
20
19
OH
98
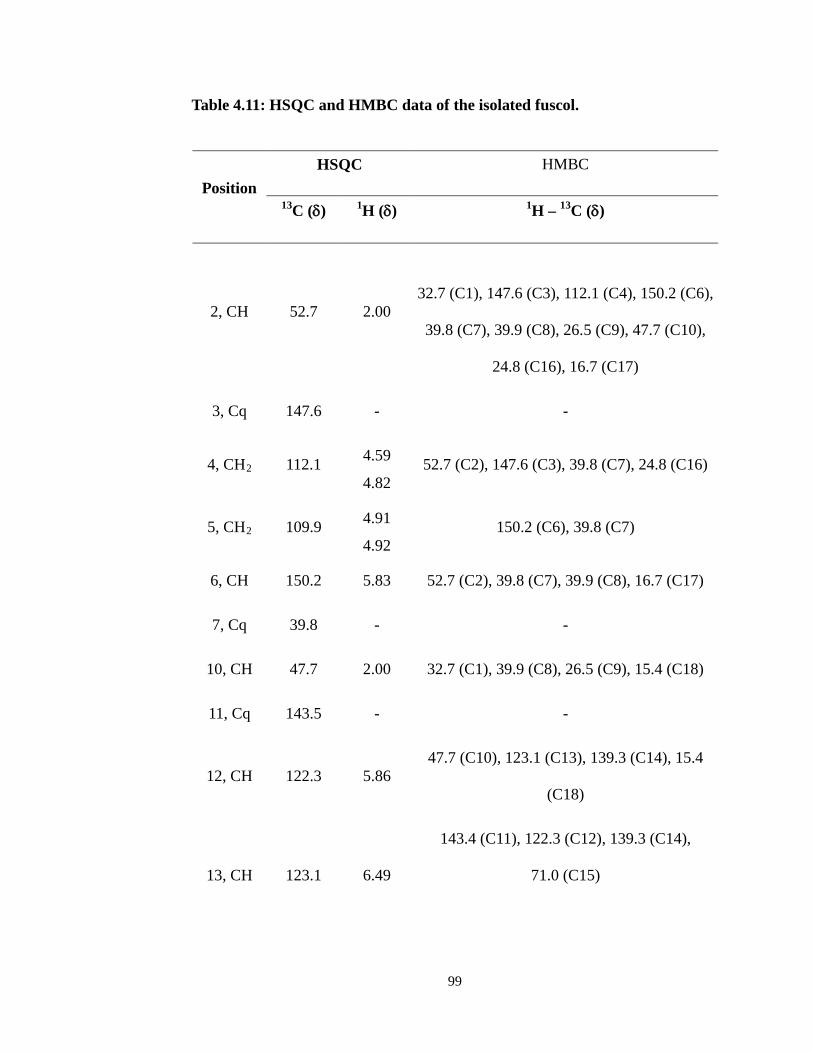
Table 4.11: HSQC and HMBC data of the isolated fuscol.
Position HSQC HMBC
13C (δ) 1H (δ) 1H – 13C (δ)
2, CH 52.7 2.00
32.7 (C1), 147.6 (C3), 112.1 (C4), 150.2 (C6),
39.8 (C7), 39.9 (C8), 26.5 (C9), 47.7 (C10),
24.8 (C16), 16.7 (C17)
3, Cq 147.6 - -
4, CH2 112.1 4.59
4.82 52.7 (C2), 147.6 (C3), 39.8 (C7), 24.8 (C16)
5, CH2 109.9 4.91
4.92 150.2 (C6), 39.8 (C7)
6, CH 150.2 5.83 52.7 (C2), 39.8 (C7), 39.9 (C8), 16.7 (C17)
7, Cq 39.8 - -
10, CH 47.7 2.00 32.7 (C1), 39.9 (C8), 26.5 (C9), 15.4 (C18)
11, Cq 143.5 - -
12, CH 122.3 5.86 47.7 (C10), 123.1 (C13), 139.3 (C14), 15.4
(C18)
13, CH 123.1 6.49
143.4 (C11), 122.3 (C12), 139.3 (C14),
71.0 (C15)
99
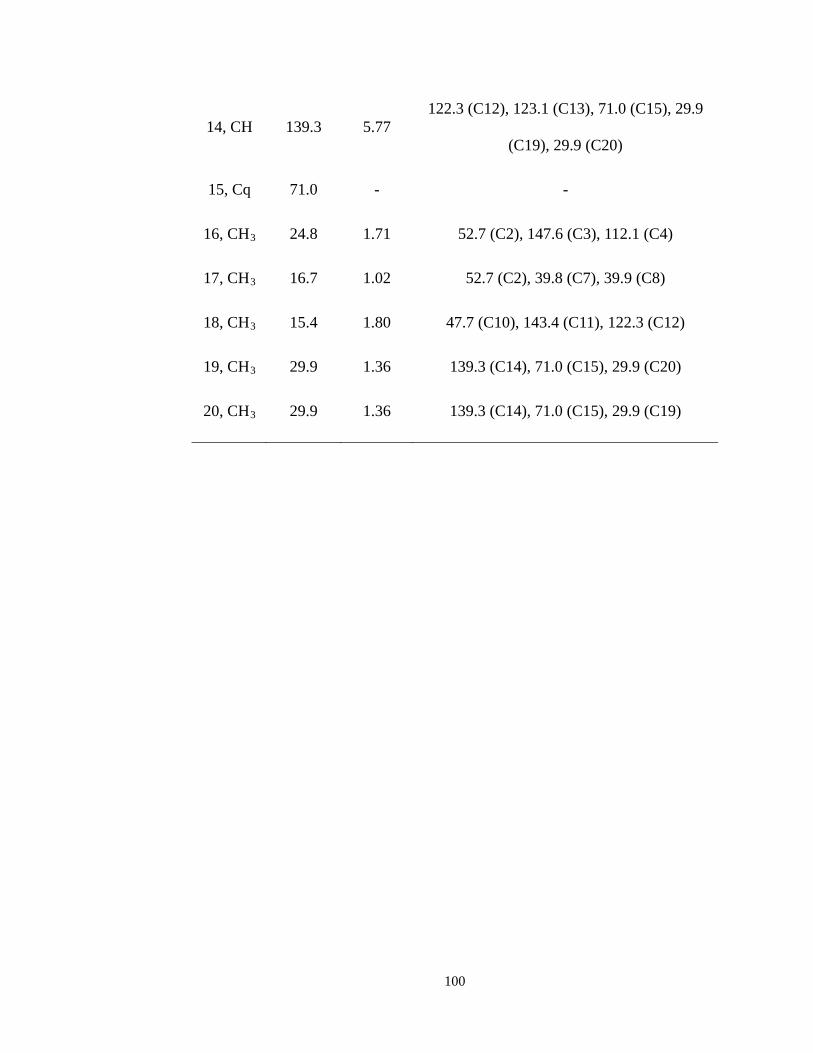
14, CH 139.3 5.77 122.3 (C12), 123.1 (C13), 71.0 (C15), 29.9
(C19), 29.9 (C20)
15, Cq 71.0 - -
16, CH3 24.8 1.71 52.7 (C2), 147.6 (C3), 112.1 (C4)
17, CH3 16.7 1.02 52.7 (C2), 39.8 (C7), 39.9 (C8)
18, CH3 15.4 1.80 47.7 (C10), 143.4 (C11), 122.3 (C12)
19, CH3 29.9 1.36 139.3 (C14), 71.0 (C15), 29.9 (C20)
20, CH3 29.9 1.36 139.3 (C14), 71.0 (C15), 29.9 (C19)
100
4.7 Summary
Sinulariasp. exhibited antifungal and antibacterial activities. Fuscol is the
compound responsible for the antifungal activities. Fuscol was reported for the
first time from the Sinulariasp. A mixture of sterols and hydrocarbons were also
found from the active antifungal fractions. These compounds were also reported
for the first time from Sinulariasp. The chloroform extract of Sinulariasp.
showed photo-toxicity activity towards HL 60. However, the fractions of
chloroform extract lost its activities after exposed to air or it was unstable.
4.8 Suggestions for Further Work
Fuscol, an isolated antifungal compound from Sinulariasp. is not as potent
as standard antifungal drug. Chemical modification should be carried out in order
to obtain a new compound with higher potency. Collection of sample at different
locations should be performed to assess the effects of environment towards the
antifungal activity of fuscol.
The isolation of antibacterial compound from diethyl ether extract should
be carried out to elucidate the structure of antibacterial compounds.
Characterization of the isolated antibacterial compounds should be also studied.
101
CHAPTER 5.0
CONCLUSION The active antifungal hexane extract of Sinularia sp. was purified by
bioassay-guided fractionation towards C. neoformans(ATCC 90112).
Fuscol(C20H32O, MW = 288), an antifungal compound with MIC value of 0.064
mg/mL was isolated from the extract. Besides, an oily mixture of hydrocarbons
and seven other compounds (fraction AgN1) with MIC value of 0.13 mg/mL was
also found. They are undecane, prehnitol, durol, tridecane, dodecane, tetradecane,
and palmitylpalmitate. A whitish powder (fraction AgN6) consisted of cyclopropa
[5,6]-33-norgorgostan-3-ol, lanol, ergost-5,8(14)-dien-3-ol, campesterol and
stigmasterol were also found. The MIC value was 0.06 mg/mL. All these
compounds were first time reported from the soft coral, Sinulariasp.
Diethyl ether extract exhibited strong inhibition towards C. neoformans
and K.pneumoniae. However, bioassay-guided fractionation was not performed
due to time constraint.
Chloroform extract showed positive result in photo-cytotoxicity test
towards leukemia cell line HL 60. However, all of the fractions lost their activities
after fractionation. It maybe due to synergistic effect where several fractions
working together to show inhibition, or the fraction might have lost its activity
after exposure to air, or it was unstable.
102
REFERENCES
Aher, N.G. et al., 2009. Synthesis and antifungal activity of 1,2,3- triazole containing fluconazole analogues. Bioorganic and Medicinal Chemistry Letters, 19, pp. 759-763. Aktas, E. and Yigit, N., 2009. Determination of antifungal susceptibility of Aspergillus spp. Responsible for otomycosis by E-test method. Journal de MycologieMedicale, 19, pp. 122-125. Aligiannis, N. et al., 2001. Composition and antimicrobial activity of the essential oils of two Origanum species. Journal of AgrculturalAnd Food Chemistry, 40, pp. 4168-4170. Alstyne, K. L.V., Wylie, C. R. and Paul, V. J., 1994. Antipredator defenses in tropical Pacific soft corals (Coelenterata: Alcyonacea) II. The relative importance of chemical and structural defenses in three species of Sinularia. Journal Experimental Marine Biology Ecological, 178, pp.17-34. Anjaneyulu, A.S.R., Krishnamurthy, M.V.R. and Rao, G.V., 1997. Rare aromadendranediterpenoids from a new soft coral species of Sinularia genus of the Indian ocean. Tetrahedron, 53 (27), pp. 9301-9312. Ates, A. et al., 2008. Dermatophytes isolated from asymptomatic dogs in Adana, Turkey: A preliminary study. Journal de MycologieMédicale, 18, pp. 154—157. Balunas, M. J. and Kinghorn, A. D., 2005. Drug discovery from medicinal plants. Life Sciences, 78, pp. 431-441. Buytaert, E., Dewaele, M. and Agostinis, P., 2007. Molecular effectors of multiple cell death pathways initiated by photodynamic therapy. Biochimia et BiophysicaActa1776, pp. 86-107. Casey, A.L., Lambert, P.A. and Elliott, T.S.J., 2007. Staphylococci. International Journal of Antimicrobial Agents, 29 (3), pp. 23–32.
Chao, C.H. et al., 2006a. Novel cyclic sesquiterpene peroxides from the Formasan soft coral Sinularia sp. Tetrahedron Letters, 47, pp. 2175-2178.
Chao, C.H. et al., 2006b. Sinularianins A and B, novel sesquiterpenoids from the Formasan soft coral Sinularia sp.. Tetrahedron Letters, 47, pp. 5889-5891. Chin, Y.W. et al., 2006. Drug discovery from natural sources. The AAPS Journal 2006; 8(2) Article 28.
103
Chio-Srichan,S. et al., 2008. Photosensitizer effects on cancerous cells: A combined study using synchrotron infrared and fluorescence microscopies. Biochimica et BiophysicaActa, 1780, pp. 854-860. Cos, P. et al., 2006. Anti-infective potential of natural products: How to develop a stronger in vitro ‘ proof-of-concept’. Journal of Ethnopharmacology, 106, pp. 290-302. da Rocha, A. B., Lopes, R.M. and Schwartsmann, G., 2001. Natural products in anticancer therapy. Current opinion in Pharmacology, 1, pp. 364-369. Denyer, S.P. and Maillard, J.Y., 2002. Cellular impermeability and uptake of biocides and antibiotics in Gram-negative bacteria. Journal of Application Microbiology, 92 (Suppl. 1), pp. 35-45. Donia, M. and Hamann, M.T., 2003.Marine natural products and their potential applications as anti-infective agents.Lancet Infectious Diseases, 3(6), pp. 338-48. Duh, C.Y. et al., 1998. A novel cytotoxic biscembranoid from the Formosan soft coral Sinulariaflexibilis. Tetrahedron Letters, 39, pp. 7121-7122. Eloff, J. N., 2004. Quantification the bioactivity of plant extracts during screening and bioassay guided fractionation. Phytomedicine, 11, pp.370-371. Eloff, J.N., Masoko, P. and Picard, J., 2007. Resistance of animal fungal pathogens to solvents used in bioassays. South African Journal of Botany, 73, pp. 667-669. Eloff, J.N., Katerere, D.R. and McGaw, L.J., 2008. The biological activity and chemistry of the southern African Combretaceae. Journal of Ethnopharmacology, 119, pp. 686–699. Fernandes, P. et al., 2003. Solvent tolerance in bacteria: role of efflux pumps and cross-resistance with antibiotics. International Journal of Antimicrobial Agents,22, pp. 211-216. Fujimura, T. et al., 2009. Susceptibility of Pseudomonas aeruginosaclinical isolates in Japan to doripenem and other antipseudomonal agents. International Journal of Antimicrobial Agents, 34, pp. 523–528. Gerard, J.T. et al., 2012. Microbiology: An Introduction,11th ed. USA: Pearson. Glaser, K. B. and Mayer, A. M. S., 2009. A renaissance in marine pharmacology: From preclinical curiosity to clinical reality. Biochemical Pharmacology, 78, pp. 440-448.
104
Gopichand, Y. and Schmitz, F. J., 1978. Marine natural products: Fuscol, a new elemene-type diterpene alcohol from the gorgonian Euniceafusca. Tetrahedron Letters, 39, pp. 3641-3641. Govindam, S.V.S. et al., 2012. Cyclolobatriene, a novel prenylatedgermacrenediterpene, from the soft coral Lopophytumpauciflorum. Bioorganic & Medicinal Chemistry, 20, pp 687-692. Heiss, C. et al., 2009. The structure of Cryptococcus neoformansgalactoxylomannan contains β-D-glucuronic acid. Carbohydrate Research, 334, pp. 915-920. Huang, Y. J. et al., 2009. MrkF is a component of type 3 fimbriae in Klebsiella pneumonia. Research in Microbiology, 160, pp. 71-79. Iguchi, K., Kajiyama, K. and Yamada, Y., 1995. Yonarolide: a new marine norditerpenoid possessing a novel tricyclic skeleton, from the Okinawan soft coral of the genus, Sinulariasp. Tetrahedron Letters, 36 (48), pp. 8807-8808. Jacobs, G.J and Medleau, L., 1998. Cryptococcosis. In Greene CE editors, Infectious Diseases of the Dog and Cat. (pp. 383-390). Philadelphia: WB Saunders. Jayaraman, S. K., Manoharan, M. S. and Illanchezian, S., 2008. Antibacterial, Antifungal and Tumor Cell Suppression Potential of Morindacitrifolia Fruit Extracts,International Journal of Integrative Biology, 3 (1), pp. 44-49. Jimeno, J. et al., 2004. Review: New marine derived anticancer therapeutics- A journey from the sea to clinical trials. Marine Drugs, 2, pp. 14-29. Jin, P. et al., 2005. Polyhydroxylated steroids from the soft coral Sinulariadissecta. Steroids, 70, pp. 487-493. Karaca, N. and Koc, A.N., 2004. In vitro susceptibility testing of dermatophytes: comparison of diskdiffusion and reference broth dilution methods.Diagnostic Microbiology and Infectious Disease, 48, pp. 259–264. Kelman, D. et al., 2006. Antimicrobial activity of red sea corals. Marine Biology, 149, pp. 357-363. Kotiranta, A., Lounatmaa, K. and Haapasalo, M., 2000. Epidemiology and pathogenesis of Bacillus cereus infections. Microbes and Infection, 2, pp. 189-198 .
105
Legakis, N.J. et al., 1995. Klebsiellapneumoniae infections in Greek hospitals. Dissemination of plasmids encoding an SHV-5 type beta-lactamase. Journal of Hospital Infection, 31, pp. 177-187. Lesser, M. P., 2004. Experimental biology of coral reef ecosystems. Journal of Experimental Marine Biology and Ecology, 300, pp. 217-252. Lestari, E.S., et al., 2008. Comparison of the accuracy of disk diffusion zone diameters obtained by manual zone measurements to that by automated zone measurements to determine antimicrobial susceptibility. Journal of Microbiological Methods, 75, pp. 177–181. Li, T. S., Li, J.T. and Li, H. Z., 2005. Modified and convenient preparation of silica impregnated with silver nitrate and its application to the separation of steroids and triterpenes. Journal of Chromatography A, 715, pp. 372-375. Liu,M. et al., 2007. Colorimetric broth microdilution method for the antifungal screening of plant extracts against yeasts. Methods, 42, pp. 325-329. Mader, S.S., 2010. Biology, 10th ed. London: McGraw Hill. Madigan, M.T. and Martinko, J.M., 2006. Microbial growth control, 11th ed. USA: Pearson. Mayer, A.M.S. et al., 2009. Review: Marine pharmacology in 2005-6: marine compounds with anthelmintic, antibacterial, anticoagulant, antifungal, anti-inflammatory, antimalarial, antiprotozoal, antituberculosis, and antiviral activities; affecting the cardiovascular, immune and nervous systems, and other miscellaneous mechanisms of action. Biochimica et BiophysicaActa, 1790, pp. 283-308. McChesney, J.D., Venkataraman, S.K. and Henri,J.T., 2007. Plant natural products: Back to the future or into extinction? Phytochemistry, 68, pp. 2015-2022. McGrill, K. et al., 2009. Comparison of disc diffusion and epsilometer (E-test) testing techniques to determine antimicrobial susceptibiliy of Campylobacter isolates of food and human clinical origin. Journal of Microbiological Methods, 79, pp. 238–241. Minh, C. V., Kiem, P. V. and Dang, N. H., 2005. Marine natural products and their potential application in the future. AJSTD, 22 (4), pp. 297-311. Moberg, F. and Folke, C., (1999). Analysis ecological goods and services of coral reef ecosystems. Ecological Economics, 29, pp. 215-233.
106
Mossman, T., 1983. Rapid calorimetric assay for cellular growth and survival: application to proliferation and cytotoxicity assay. Journal of Immunological Methods, 65, pp. 55-63. Murray, H.G.M. et al., 1999. The discovery and development of marine compounds with pharmaceutical potential. Journal of Biotechnology, 70, pp. 15-25. Nobili, S. et al., 2009. Natural compounds for cancer treatment and prevention. Pharmacological Research, 59, pp. 365-378. Parazzini, F. et al., 2000. Determinants of different Candida species infections of the genital tractin women. European Journal of Obstetrics & Gynecology and Reproductive Biology, 93, pp. 141–145. Plaetzer, K. et al., 2003. The modes of cell death induced by PDT: An overview. Medical Laser Application, 18, pp. 7-19. Ramesh, P. and Venkateswarlu, Y., 1999. Novel steroid constituents of the soft coral Sinulariadissecta. Steroids, 64, pp. 785-789. Ramesh, P. et al., 1999. A 2-methylene-β-alanine methyl ester derivative from the soft coral Sinulariadissecta. Biochemical Systematics and Ecology, 27, pp. 661-662. Ramesh, P., Reddy, N.S. and Venkateswarlu, Y., 1998. Rameswaralide, a novel diterpenoid from the soft coral Sinulariadissecta. Tetrahedron Letters, 39, pp. 8217-8220. Rasko, D.A. et al., 2005. Genomics of the Bacillus cereus group of organisms. FEMS Microbiology Reviews, 29, pp. 303-329. Reddy, L. et al., 2003. Natural products for cancer prevention: a global perspective. Pharmacology & Therapeutics, 99, pp. 1-13. Sarker, S.D. et al., 2006. Methods in Biotechnology: Natural Products Isolation, 2nd ed. Humana Press. Sata, N.U. et al., 1999. Sinulamide: a H,K-ATPase inhibitor from a soft coral Sinulariasp. Tetrahedron Letters, 40, pp. 719-722. Segal, E. and Elad, D., 2006. Fungal vaccines and immunotherapy. Journal de MycologieMedicale, 16, pp. 134-151.
107
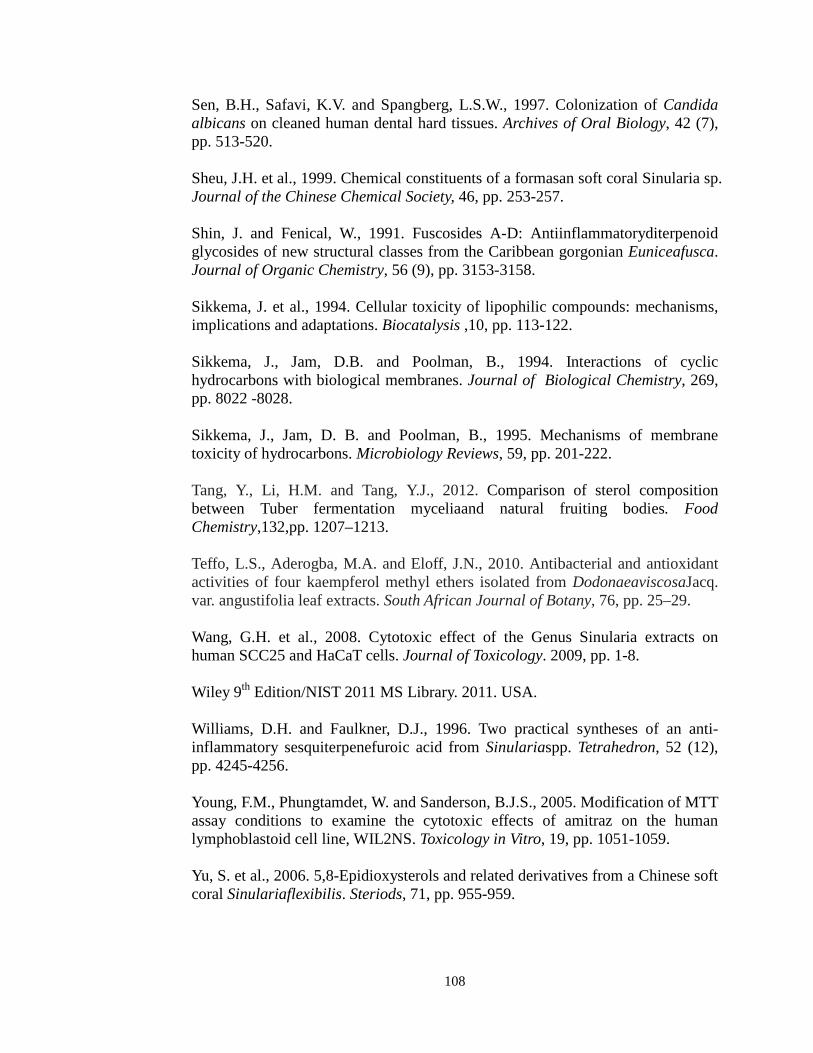
Sen, B.H., Safavi, K.V. and Spangberg, L.S.W., 1997. Colonization of Candida albicans on cleaned human dental hard tissues. Archives of Oral Biology, 42 (7), pp. 513-520. Sheu, J.H. et al., 1999. Chemical constituents of a formasan soft coral Sinularia sp. Journal of the Chinese Chemical Society, 46, pp. 253-257. Shin, J. and Fenical, W., 1991. Fuscosides A-D: Antiinflammatoryditerpenoid glycosides of new structural classes from the Caribbean gorgonian Euniceafusca. Journal of Organic Chemistry, 56 (9), pp. 3153-3158. Sikkema, J. et al., 1994. Cellular toxicity of lipophilic compounds: mechanisms, implications and adaptations. Biocatalysis ,10, pp. 113-122. Sikkema, J., Jam, D.B. and Poolman, B., 1994. Interactions of cyclic hydrocarbons with biological membranes. Journal of Biological Chemistry, 269, pp. 8022 -8028. Sikkema, J., Jam, D. B. and Poolman, B., 1995. Mechanisms of membrane toxicity of hydrocarbons. Microbiology Reviews, 59, pp. 201-222. Tang, Y., Li, H.M. and Tang, Y.J., 2012. Comparison of sterol composition between Tuber fermentation myceliaand natural fruiting bodies. Food Chemistry,132,pp. 1207–1213. Teffo, L.S., Aderogba, M.A. and Eloff, J.N., 2010. Antibacterial and antioxidant activities of four kaempferol methyl ethers isolated from DodonaeaviscosaJacq. var. angustifolia leaf extracts. South African Journal of Botany, 76, pp. 25–29. Wang, G.H. et al., 2008. Cytotoxic effect of the Genus Sinularia extracts on human SCC25 and HaCaT cells. Journal of Toxicology. 2009, pp. 1-8. Wiley 9th Edition/NIST 2011 MS Library. 2011. USA. Williams, D.H. and Faulkner, D.J., 1996. Two practical syntheses of an anti-inflammatory sesquiterpenefuroic acid from Sinulariaspp. Tetrahedron, 52 (12), pp. 4245-4256. Young, F.M., Phungtamdet, W. and Sanderson, B.J.S., 2005. Modification of MTT assay conditions to examine the cytotoxic effects of amitraz on the human lymphoblastoid cell line, WIL2NS. Toxicology in Vitro, 19, pp. 1051-1059. Yu, S. et al., 2006. 5,8-Epidioxysterols and related derivatives from a Chinese soft coral Sinulariaflexibilis. Steriods, 71, pp. 955-959.
108
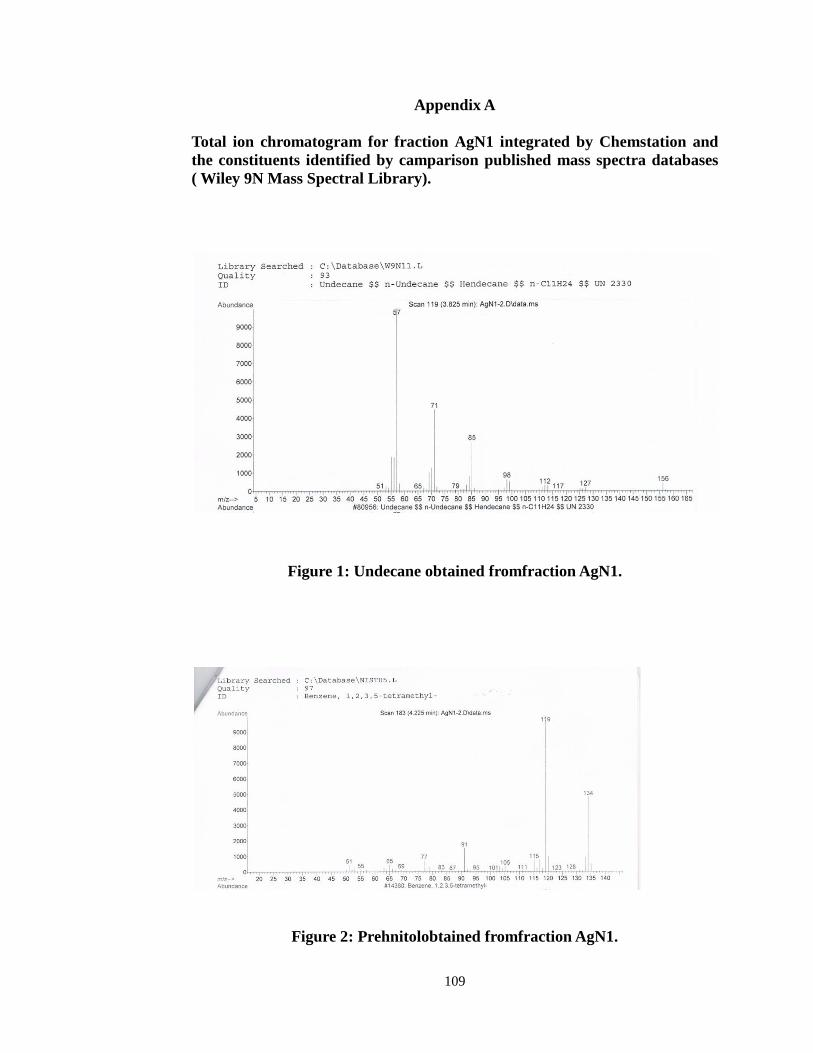
Appendix A
Total ion chromatogram for fraction AgN1 integrated by Chemstation and the constituents identified by camparison published mass spectra databases ( Wiley 9N Mass Spectral Library).
Figure 1: Undecane obtained fromfraction AgN1.
Figure 2: Prehnitolobtained fromfraction AgN1.
109
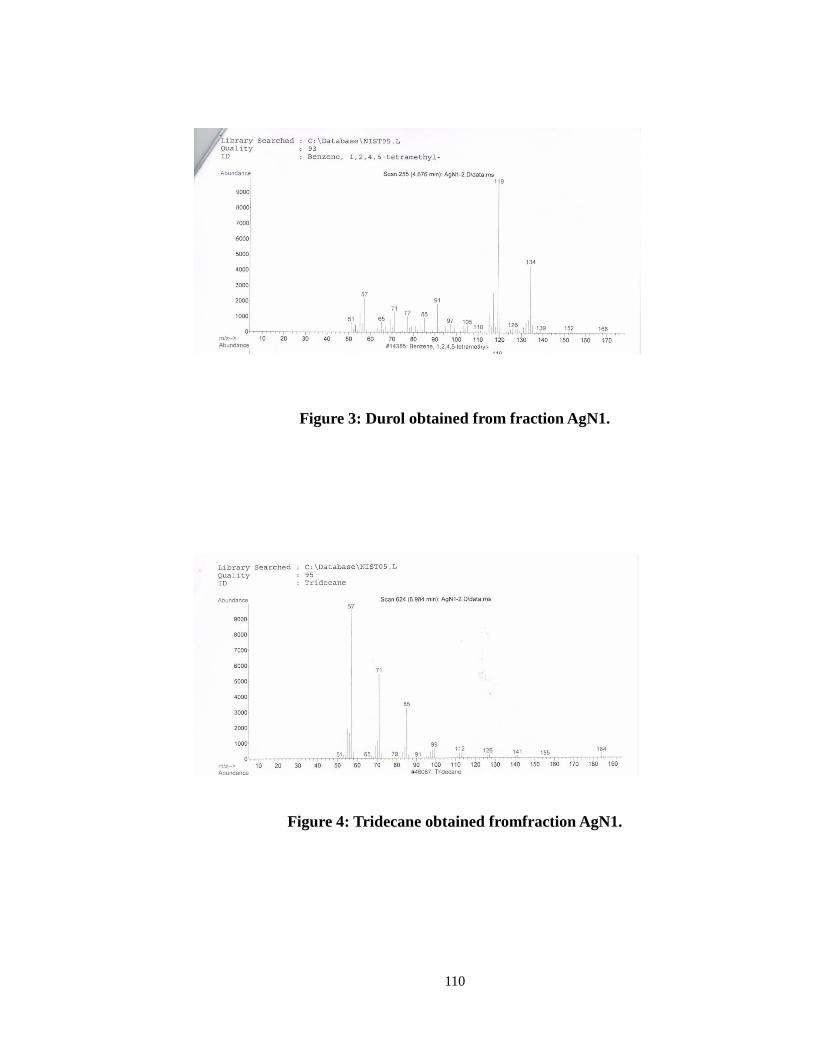
Figure 3: Durol obtained from fraction AgN1.
Figure 4: Tridecane obtained fromfraction AgN1.
110
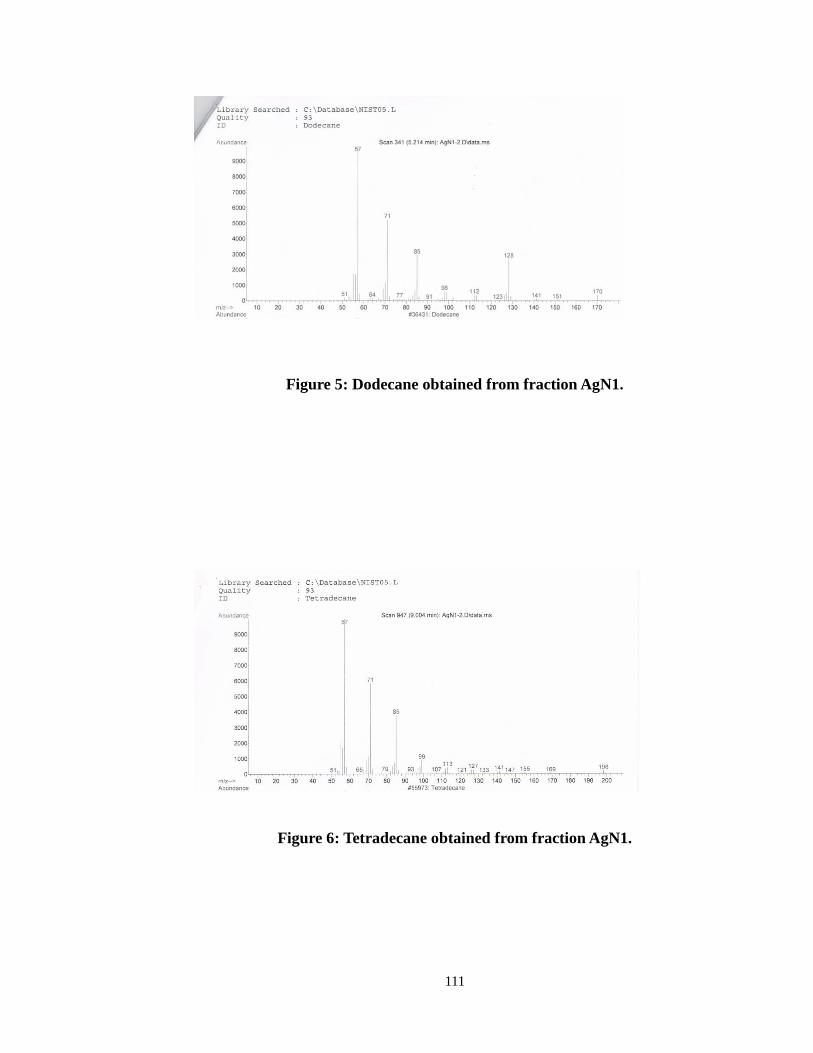
Figure 5: Dodecane obtained from fraction AgN1.
Figure 6: Tetradecane obtained from fraction AgN1.
111
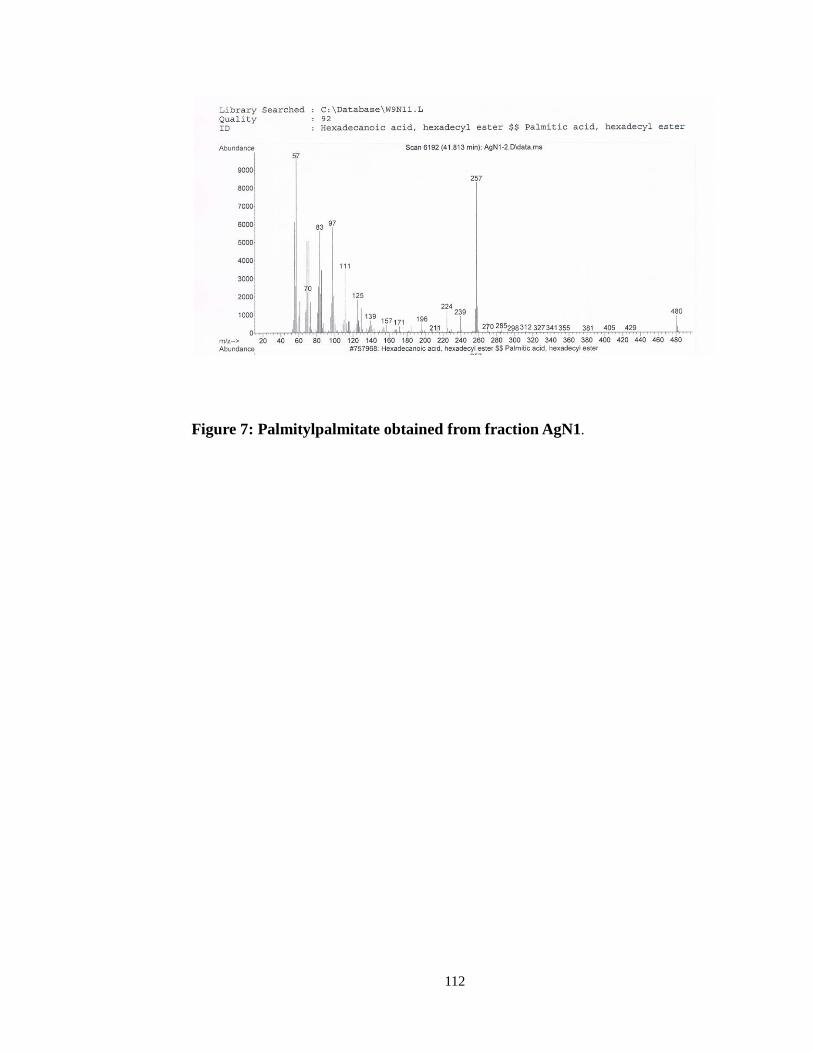
Figure 7: Palmitylpalmitate obtained from fraction AgN1.
112
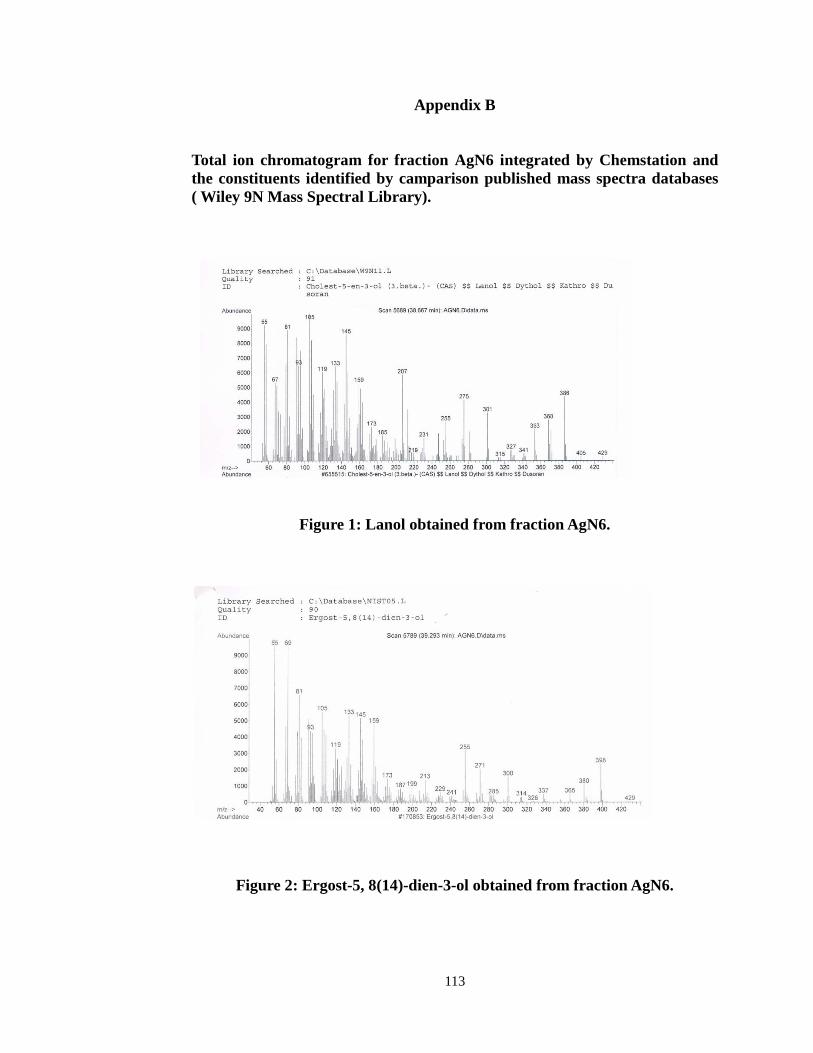
Appendix B
Total ion chromatogram for fraction AgN6 integrated by Chemstation and the constituents identified by camparison published mass spectra databases ( Wiley 9N Mass Spectral Library).
Figure 1: Lanol obtained from fraction AgN6.
Figure 2: Ergost-5, 8(14)-dien-3-ol obtained from fraction AgN6.
113
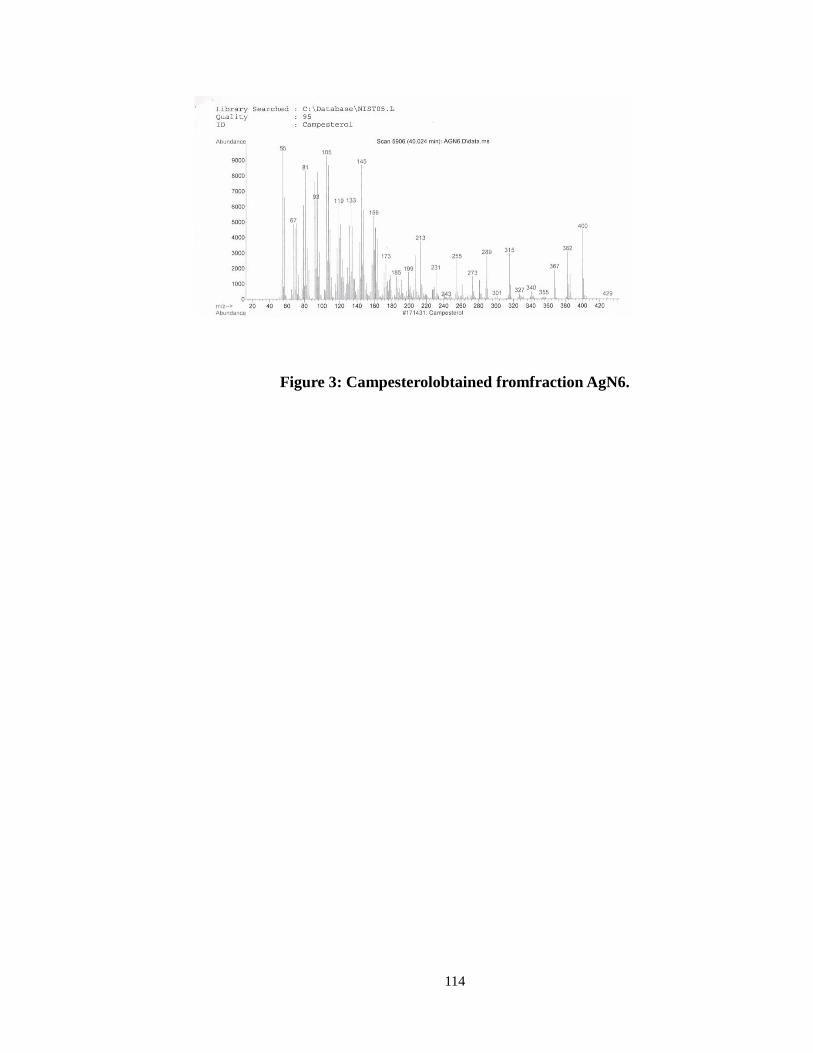
Figure 3: Campesterolobtained fromfraction AgN6.
114
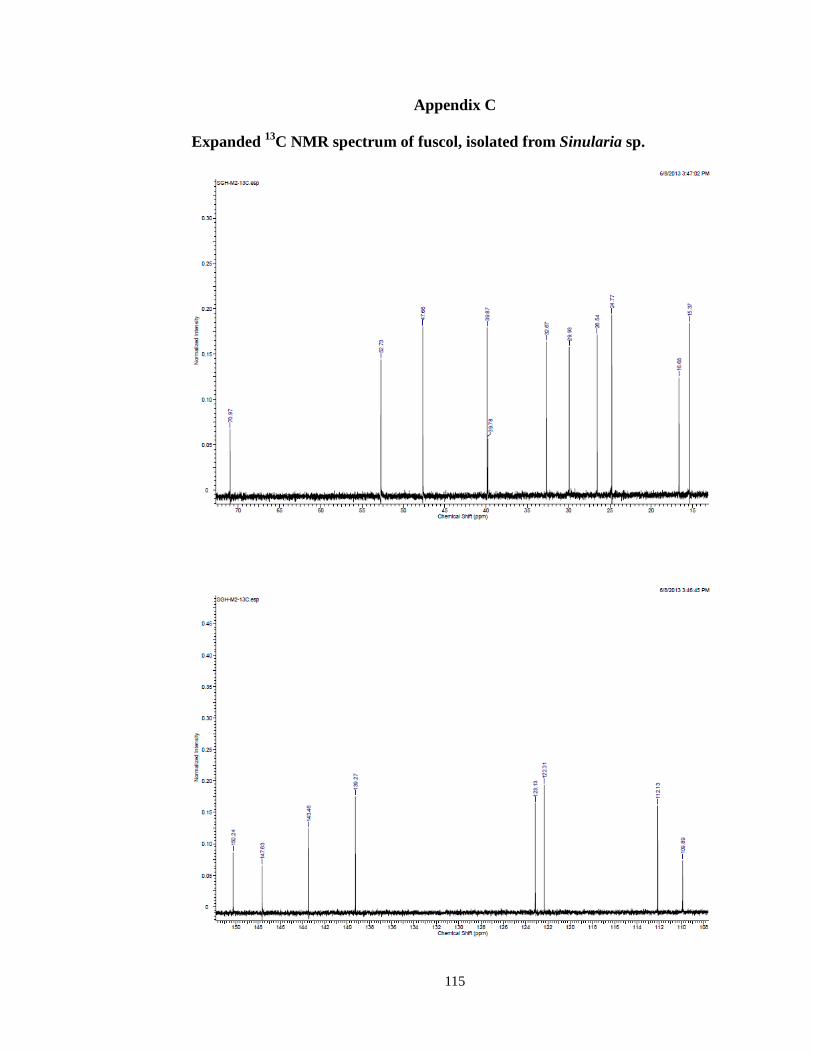
Appendix C
Expanded 13C NMR spectrum of fuscol, isolated from Sinularia sp.
115
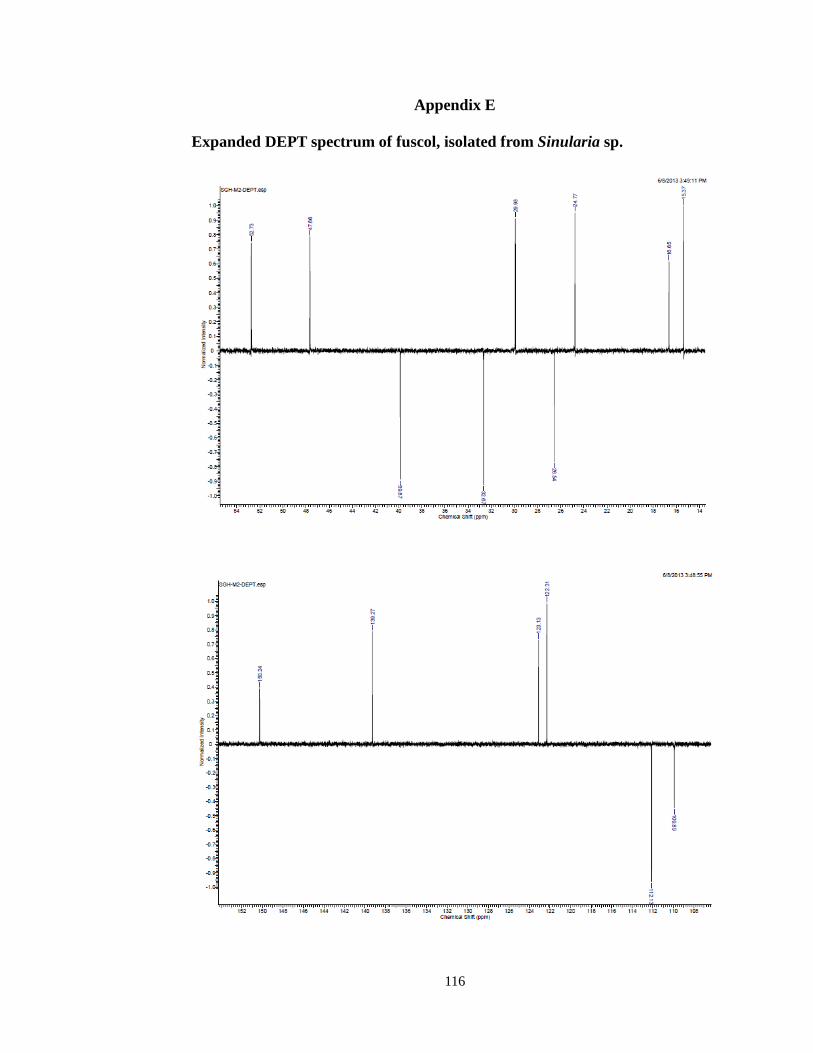
Appendix E
Expanded DEPT spectrum of fuscol, isolated from Sinularia sp.
116
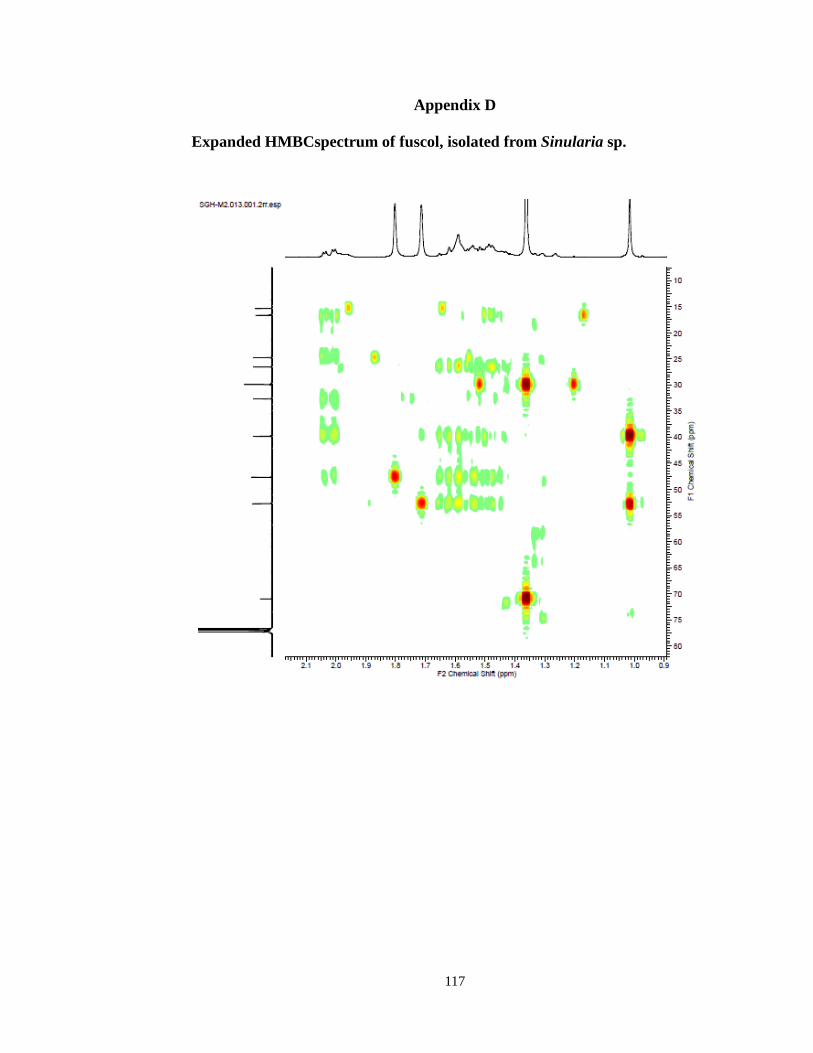
Appendix D
Expanded HMBCspectrum of fuscol, isolated from Sinularia sp.
117
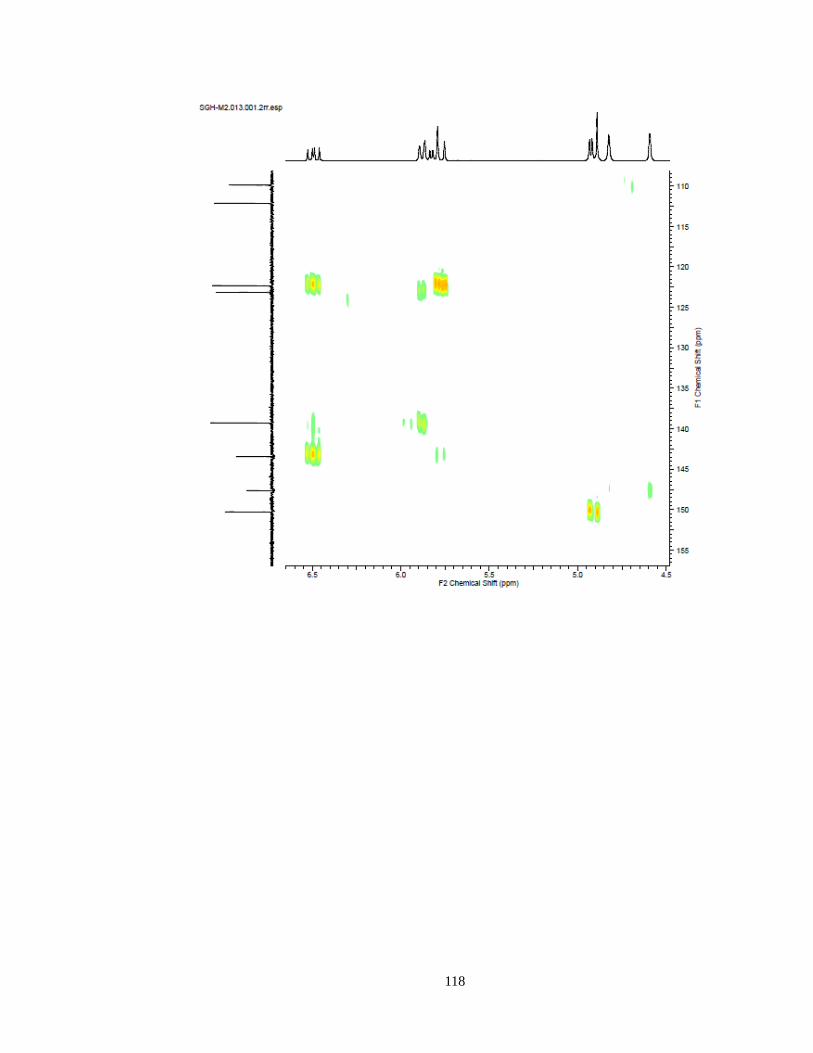
118
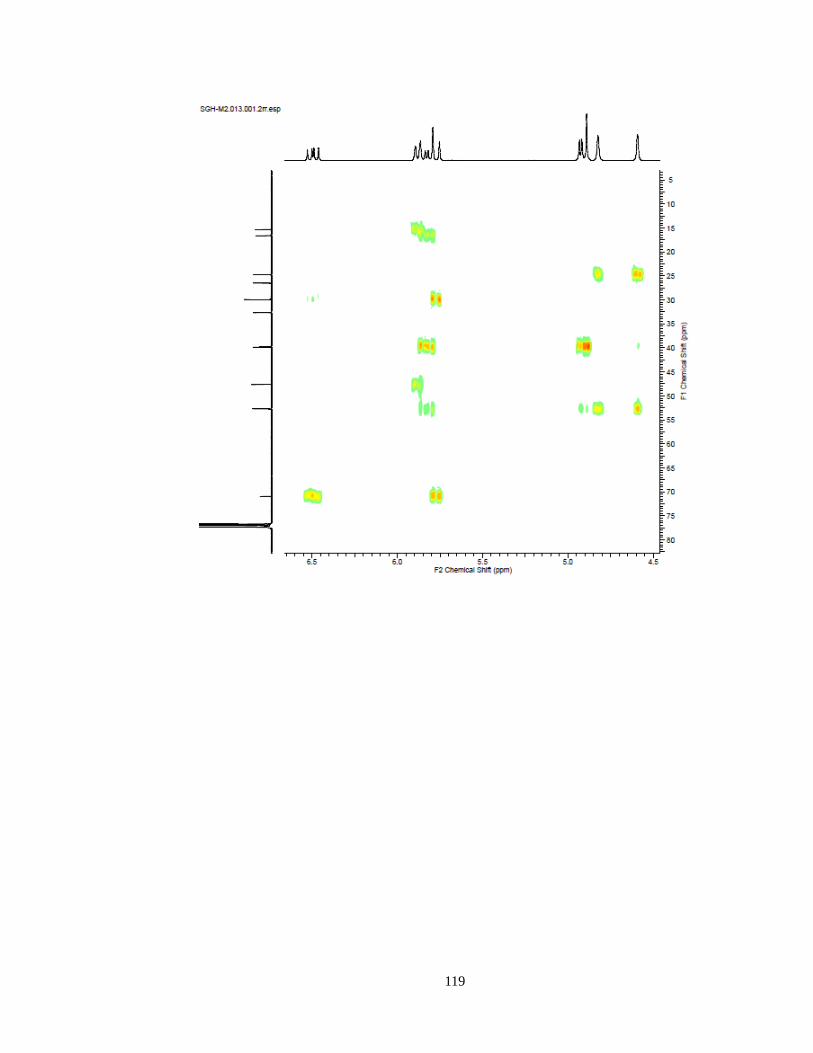
119
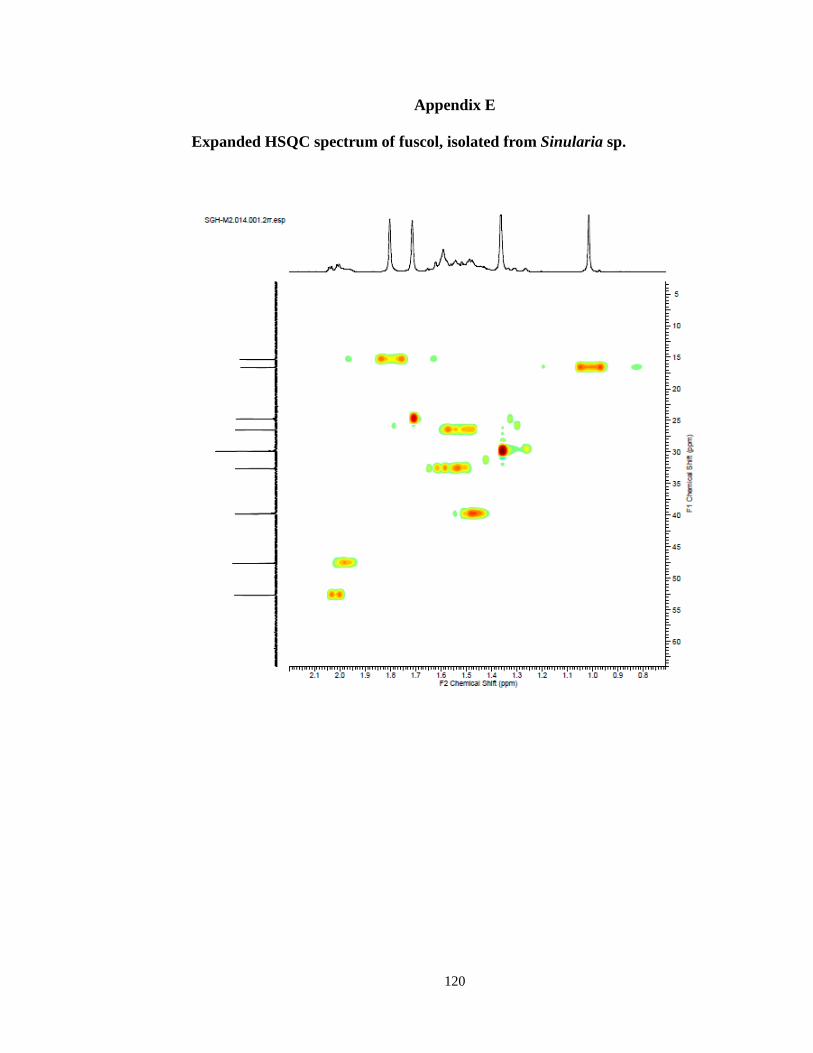
Appendix E
Expanded HSQC spectrum of fuscol, isolated from Sinularia sp.
120
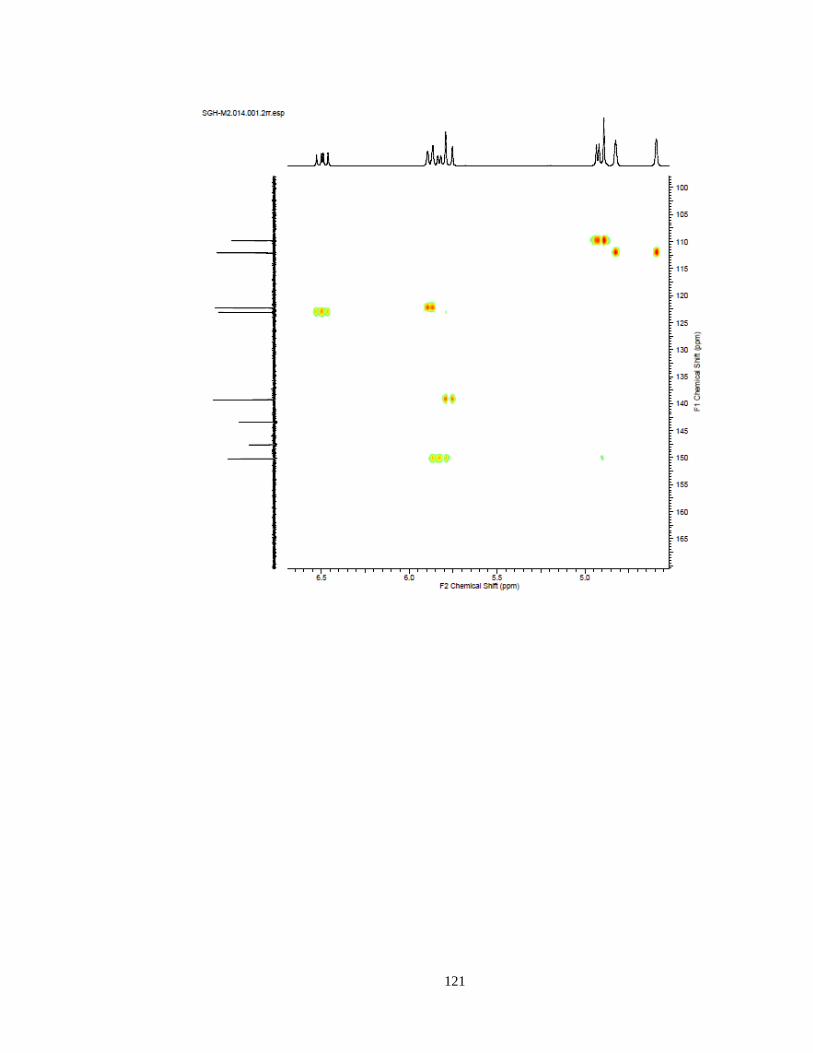
121