Embed Size (px)
Citation preview

2014, Vol 15, �o 2 29
Bio-economic modelling to assess the impact of water pricing policies
at the farm level in the Oum Zessar watershed, southern Tunisia
Houcine Jedera, Mongi Sghaier
a, Kamel Louhichi
b, Pytrik Reidsma
c
a Laboratoire d’Economie et Sociétés Rurales, Institut des Régions Arides IRA, Route du Jorf,
4119, Médenine, Tunisia
b European Commission - Joint Research Centre Institute for Prospective Technological Studies.
Edificio Expo - c/ Inca Garcilaso, 341092 Seville - Spain C Plant Production Systems, Wageningen University, P.O. Box 430, 6700 AK Wageningen,
the Netherlands
Corresponding author:
Tel: 216 75 633 005; Email: [email protected] ; [email protected]
Laboratoire d’Economie et Sociétés Rurales, Institut des Régions Arides IRA, Route du Jorf,
4119, Médenine, Tunisia
Abstract
For integrated assessment at farm level, the Farm System SIMulator model (FSSIM)
was used. FSSIM is a bio-economic model developed for the European context, and was
adapted and tested for Tunisian conditions to assess, ex-ante, impacts of water pricing
policies at the farm level to the year 2015.
The results show that all farm types are strongly dependent on the water pricing pol-
icy. Farmers that have private irrigation systems and pay for pumping mainly, are more
sensitive to the progressive increase of irrigation water costs compared to farms that
obtain water from public irrigation systems, who pay for the amount of water received.
A sensitivity analysis showed that increasing the water price with more than 17% is not
advisable to local decision makers, because the net income continued to decline, while
the water consumption remained stable with further increases. Hence, there is no fur-
ther gain in terms of water saving. Overall, intensive agricultural systems with private
irrigation systems seem more vulnerable and unsustainable and therefore the extension
of public irrigation systems and semi-intensive agriculture is recommendable to im-
prove the sustainability of agriculture in this arid zone.
Keywords: Irrigated agriculture; Water policy; bio-economic model; Integrated as-
sessment
1. Introduction
Land degradation is one of the most important environmental externalities of today
and a major threat to the sustainability of agricultural systems in developing countries.
The Oum Zessar watershed, in the south of Tunisia, represents an example where land
degradation and overexploitation of water resources are serious problems. The pressure
on natural resources in this region is increasing in the last decades due to agricultural

30 AGRICULTURAL ECO�OMICS REVIEW
intensification, increase in human needs and the opening to regional markets. The situa-
tion may get worse over the years, especially with climate change and further intensifi-
cation of agricultural practices, if no concrete measures are taken. Land use policies are
one of the most important factors that have a role to internalize this externality and en-
sure the sustainability of farming systems in arid regions (Tilman et al, 2002). It was
assumed that the water policy is one of the land use policies that may have an important
role to reduce these problems and its impacts on agricultural activities, especially on the
demand of irrigation water. Another hypothesis, the intensification in agriculture can
lead to overexploitation of water resources more than the realization of profitability eco-
nomic for the farm.
Water saving irrigation in arid areas is an important factor for the sustainability of
agricultural systems. For the last two decades, the water policy in Tunisia has managed
and regulated water demand based on a price policy for irrigation water. The objective
of this paper is to assess, ex-ante, the impacts of a water pricing policy on the farming
system in the watershed of Oum Zessar.
2. Overview of water policies in Tunisia
From the sixties to the eighties, water management policy concentrated on the mobi-
lization of water resources and the implementation of required infrastructure for the dis-
tribution of these resources all over the country. This has contributed to the expansion
of irrigated areas, intensification, diversification and regulation of the agricultural sys-
tems.
In the beginning of the nineties, water management had to change its focus as this
period has been marked by the development of the industrial and tourism sectors as
competitors to the traditional water consuming sector. In addition, demand for water in
agriculture increased as a result of newly created areas and intensification efforts. The
total demand for water has increased substantially. Therefore, the new water policy in-
troduced in the nineties has turned to the management and regulation of demand, while
continuing the effort of water mobilization (Bachta et al., 2004). The main objective for
this new policy is to conserve water resources and encourage demand management in
the irrigation sector; a national water saving strategy was implemented. As part of this
strategy, a number of reforms were introduced in the past few years, including the pro-
motion of water users’ associations, called locally “Groupements de Développement
Agricore, (GDA)”, an increase in the price of irrigation water was used for pushing the
farmers to adopt technologies that increase water use efficiency at field level. This strat-
egy has sought to rationalize the pricing of irrigation water in terms of (i) costs, (ii)
variations among systems, and (iii) national priorities, notably food security (Fouzai and
Zekri, 2002; Al Atiri, 2005).
Since 1990, the price of irrigation water has increased gradually at an annual rate by
13% in real terms to cover full cost of operating and maintenance. In 2007, the water
price in public irrigation systems at the Oum Zessar watershed was in the range of 0.08
TD1 per m
3. Assessing the impact of this policy options was subject only to ex-post
evaluation in several regions of the country. These ex-post evaluations showed that the
1 TD: Tunisian Dinars; 1DT=0.56 € = 0.77US$ in 2007.

2014, Vol 15, �o 2 31
increase in price has resulted in full recovery of operating costs, a significant drop in
water consumption and a change in land use by irrigated crops in some regions of Tuni-
sia. In the central, western and northeastern regions however, with large areas of high
value crops (fruits, vegetables and greenhouses crops), water demand remains relatively
inelastic and income is reduced (Hamdane, 2002). These results are useful to analyze
past situations but they must also be used to improve the situation for the future through
the suggestion of new policy options. The results of a change in the past cannot directly
be extrapolated to the future however. On the other hand, ex-ante impact assessment of
the water pricing is still underdeveloped in the research and evaluation projects con-
ducted by the Ministry of Agriculture and Water Resources. Today, the need to develop
modelling tools for the ex-ante impact assessment of policy options becomes a neces-
sary methodological and pragmatic approach to improve the agricultural sector in Tuni-
sia. This paper represents an ex-ante impact assessment of the water pricing policy on
the sustainability of farming in the arid south-east of Tunisia. The bio-economic model-
ling approach has been mobilized for this impact assessment.
3. Methodology and area of study
3.1. The bio-economic modelling approach
The bio-economic modelling approach is known generally as a linkage between
models from different disciplines to provide multi-disciplinary and multi-scale answers
to a given problem. Bio-economic models provide a comprehensive indication on the
relationship between human activities and environmental externalities and take into ac-
count simultaneously the technical, economic and environmental impacts of policies,
without having to give a monetary value to environmental aspects (i.e. environmental
indicators are expressed in physical terms). At farm level, these types of models are re-
ferred to as bio-economic farm models. A bio-economic farm model is defined as a
model that links formulations describing farmers’ resource management decisions to
formulations that describe current and alternative production possibilities in terms of
required inputs to achieve outputs and associated externalities. In many studies, bio-
economic farms models have been proposed as tools to assess the impacts of policy
changes on agricultural systems (Donaldson et al., 1995; Flichman, 1996; Riesgo and
Gomez-Limon, 2006; Semaan et al., 2007). As mentioned above however, most models
were developed for specific contexts, and data needs were often large, causing that it
was difficult to re-apply these models for different contexts. This study uses a generic
bio-economic farm model and adapts, applies and tests the model for use outside the
original context. This generic model is the Farming Systems Simulator (FSSIM) devel-
oped in the SEAMLESS project. The SEAMLESS project (System for Environmental
and Agricultural Modelling: Linking European Science and Society) developed an inte-
grated framework for assessment of the agricultural sector targeted at assessing agricul-
tural and environmental policies and technological innovations at multiple scales (Van
Ittersum et al., 2008). The study presented in this paper is part of the LUPIS project
(Land Use Policies and Sustainable Development in Developing Countries), which is a
cooperation between European and developing countries aiming to adapt generic mod-
els developed for the European context and apply them for new research questions in
developing countries. The main objective of the LUPIS project is to ex-ante analyzes

32 AGRICULTURAL ECO�OMICS REVIEW
the impacts of land use policies on sustainable development, comparing a range of de-
veloping countries. The different methods and tools developed in SEAMLESS project
can be applied for this objective. The bio-economic farm model FSSIM is specifically
suitable for assessment impacts of land use policies at farm level in same case studies in
Lupis project.
This article has two objectives: The first objective is to adapt this generic bio-
economic farm model FSSIM to a context different from the original European context,
where the water pricing policy in Tunisia serves as an example for other developing
country contexts. The second objective is to assess, ex-ante, the impacts of a water pric-
ing policy on the farming systems in the watershed of Oum Zessar in southeastern Tuni-
sia.
3.2. Case study: Oum Zessar Watershed
The Oum Zessar watershed is located in the Northwestern Governorate of Médenine
and covers 36530 ha (Figure 1). It stretches from the mountains of Matmata (Beni
khédache) in the south-west, crosses the Jeffara plain (via Koutine) and the saline de-
pression (Sebkha) before ending in the Mediterranean (Gulf of Gabes). The choice for
this watershed was made due to its geographical situation and its hydrological, ecologi-
cal and socio-economic functions. It has a strategic importance in terms of water re-
sources. Approximately 70% of this potential resource is mobilised. Agriculture is the
largest water-consuming sector (using 84% of water consumed), followed by domestic
use (13%). Industry, tourism and various other sectors make use of the remainder (Ma-
mou, 1977). It also has a high socio-economic importance with its agricultural sector.
This importance is explained by the annual income of the agriculture sector at the re-
gional level that exceeds 120 Million Tunisian dinars and provides employment to one
fifth of the working population (MEDD, 2006).
The farming systems are marked by their diversity from the upstream to downstream
areas of the watershed. The systems are characterised by the predominance of olives
trees, agricultural activities that vary from one year to another depending on the rainfall
Figure 1: Location of Oum Zessar watershed.

2014, Vol 15, �o 2 33
regime, the development of irrigated agriculture exploiting the shallow and deep
groundwater aquifers of the region, and the development of episode cereals.
Irrigated agriculture can be distinguished by two types of irrigation systems. Firstly, the
private irrigation system which is based on private wells at the farm level, and it is
mainly localized in the upstream area of the watershed (at Ksar Hallouf), with some in
the downstream areas. Land use includes cash crops, greenhouses, vegetables and fruit
trees. The cropping area varies between 0.2 and 10 ha per farmer. Secondly, the public
irrigation system is based on collective drilling, usually created by the government. The
water management is ensured by different Groups of Agricultural Development (GDA).
These areas are situated in the downstream zone of the watershed, and include the pub-
lic irrigation systems of “Oum Zessar”, “Oued Moussa” and “Gosba”.
3.3. Bio-economic model FSSIM
FSSIM is an optimization model which maximizes a farm’s total gross marginal sub-
ject to set of resource and policy constraints. Total gross marginal is defined as total
revenues minus total variables costs from crop. Total variables costs include costs of
fertilizers, costs of crop protection, costs of seed and plant material, costs of hired la-
bour and costs of irrigation water. A quadratic objective function used to account in-
creasing variable costs per unit of production because of inadequate machinery and
management capacity and decreasing yields due to land heterogeneity (Howitt, 1995).
The general mathematical formulation of FSSIM is presented below (Equation1) (Lou-
hichi et al, 2010):
Maximize: Z W X X ' QX′= −
Subject to: 0Ax b; x≤ ≥ (1)
Where Z is the total gross marginal, W is the (n x 1) vector of the parameters of the
linear part of the activities’ gross marginal, Q is the (n x n) matrix of the parameters of
the quadratic part of the activities’ gross marginal, X is the (n x 1) of the simulated lev-
els of the agricultural activities, A is the (m x n) matrix of the technical coefficients and
b is the (m x1) vector of available resources levels.
The agricultural activities are defined in FSSIM as a combination of crop rotation,
soil type, irrigation technique and the production system. The livestock activities are not
considered in this bio-economic modelling; because of missing data required to run the
model and get good results, we preferred therefore to study the impact of water pricing
on agriculture system as a first attempt to adapt this bio-economic model outside the
European context, but in the future research, it is important to integrate the livestock
activities to assess a set of agricultural policies for whole activities (agricultural and
livestock).
The principal technical and socio-economic constraints are implemented in FSSIM:
arable land, irrigable land, area of perennials activities, labour and water constraints.
The available arable land constraint is specified per soil type and ensures that the sum of
the area of the activities on a certain soil does not exceed the available farm land for this
soil type. The available land is derived from data survey and hence imposed exoge-
nously. Selling or buying of land is not considered in FSSIM. The available irrigated
land constraint ensures that the area with irrigated activities does not exceed the avail-
able irrigable land. The area of perennials activities (i.e. olive trees) is not simulated but

34 AGRICULTURAL ECO�OMICS REVIEW
included as a constraint, as perennial activities are determined by long-term investment
decisions. It is assumed that the levels of these crops are equal to the ones observed in
the base year. The available amount of irrigation water constraint ensures that the total
volume of water required for the irrigated activities does not exceed the available water
volume. Finally, the labour constraint is used to calculate the number of hours of hired
labour, given the labour requirements of different activities and the availability of fam-
ily labour. Hired labour is considered as an additional cost, the price of which is equal
to the average region-specific wage rate. Allocation of family labour to off-farm activi-
ties is not considered in FSSIM.
3.3.1. Calibration model
FSSIM is a positive model, which means that it reproduces the observed levels of the
base year, and uses these to forecast future changes. In our application, the standard
Positive Mathematical Programming approach developed by Howitt (1995) was used to
calibrate the model and to guarantee exact reproduction of the observed situation. The
standard PMP approach is a generic and fully automated procedure which means that it
can be easily adapted and used in different regions and farm types without additional
specific information.
In PMP calibrated models, the observed activity levels of farm types are used to cal-
culate the non linear cost function (Kanellopoulos et al., 2010). The standard approach
of PMP uses a two step approach. In the first step, a number of calibration constraints
are added to the model, to ensure that the observed activity levels of the base year are
reproduced. In the second step, the calibration constraints are taken out and their
shadow prices are used to specify and include the non-linear costs in the objective func-
tion. This approach has been applied in many European researches for evaluating
Common Agricultural Policy’s reform impacts.
3.3.2. Policy scenarios simulated by FSSIM
At the farm level the main policy option that was assessed is related to the irrigated
water pricing. To implement the irrigated water policy, assumptions need to be made on
how the policy or the policy parameters change and assess their impact on the farming
systems (Jeder et al, 2011). Four scenarios have been assessed using the FSSIM model,
including two policy scenarios:
Base year: the base year for the calibration is 2007, and the simulation is based on data
on current cropping patterns, inputs and outputs
Baseline scenario: the baseline serves as the reference for the policy scenarios in 2015.
The assumptions for the baseline scenario are the following: (i) an inflation rate of
2.9% for all inputs and outputs (based on the central bank statistics of Tunisia); (ii)
prices and and yields of crops follow a statistical Gaussian distribution2.
Policy option 1: an increase of the irrigation water price for the next years at an annual
rate of 13%, from 2007 and 2015 for the farms in the public irrigation systems.
Policy option 2: an increase of the cost of pumping irrigation water for the next years at
an annual rate of 13%, from 2007 to 2015 for farms in the private irrigation systems.
2 Yields and price trends are not considered in this application.

2014, Vol 15, �o 2 35
Figure 2: Inputs and outputs of the model chain CropSyst-FSSIM as applied in Oum Zessar
watershed.

36 AGRICULTURAL ECO�OMICS REVIEW
3.3.3. Environmental externalities
For parameters on externalities, the biophysical model CropSyst (Stöckle et al.,
2003) has been used to calculate the externality ‘soil erosion’. Most bio-economic mod-
elling work in Tunisia used CropSyst to assess environmental indicators (Belhouchette,
2004; Abbés, 2005), in Europe also, it was used for FSSIM applications in framwork of
SEAMLESS project (Belhouchette et al., 2011). The calculation of soil erosion is based
on the widely used Wischmeier and Smith equation (USLE Universal Soil Loss Equa-
tion). According to this model, erosion is a multiplicative function of R (rainfall and
runoff factor by geographic location), K (soil erodibility factor), LS (slope length-
gradient factor), C (crop/vegetation and management factor) and P (support practice
factor) (Equation 4):
Universal Soil Loss Equation (USLE): A =R * K * LS * C * P (2)
To apply the CropSyst-FSSIM model chain, three types of data are required: (i) the
bio-physical characteristics of the agri-environmental zones used as input for the bio-
physical model CropSyst, (ii) the farm type characteristics used in FSSIM to define the
resources availability, and (ii) the input output data/coefficients of the current activities
which include technical, social and economic information such as yield, input, prices
and costs (Figure 2).
3.4 Data acquisition
3.4.1. Farm data
This research took particular care to gather high-quality data on the technical and
economic systems employed by the individual farms. Information concerning the quan-
tities of input used per crop and crop yields were gathered through a targeted survey
with 50 farms in the watershed, of which some were part of the regional agriculture ad-
visory services. These data have been collected for the most frequent cropping system in
the region. They take into account cropping techniques, rotation and climatic condi-
tions. As not all farms can be simulated individually, a farm typology was developed
grouping similar farms, and data was aggregated per farm type.
The methodological approach adopted for developing a farm typology was not based
on a statistical approach, but criteria were developed based on the survey and interviews
with farmers and experts in the region and a literature review on the production systems
in the region. This approach resulted in two major criteria: criterion (1) is type of irriga-
tion system, public or private; criterion (2) is the size of farms. To better specify the
production systems identified, an additional secondary criterion was developed, which
is the ratio of irrigated and irrigable land within a farm indicating the degree of intensi-
fication. This methodology resulted in four farm types (Figure 3); a large semi-intensive
farm in the public irrigation system (farm 1), a small intensive farm in the public irriga-
tion system (farm 2), a large semi-intensive farm in the private irrigation system (farm
3), and a small intensive farm in the private irrigation system (farm 4).
Each farm type identified represents a virtual farm obtained by averaging data from
farms that are grouped in the same type. From Table 1, it is possible to extract the data
on resource endowment of each farm type, such as available land per soil type (%), irri-
gation water availability (m3), water price (DT/m
3), area crops (%) and family labour
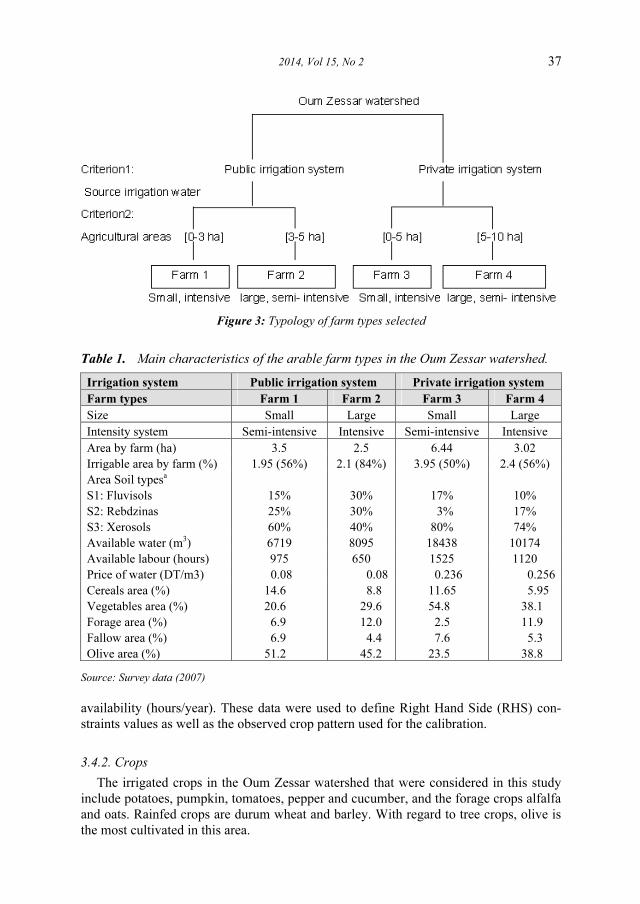
2014, Vol 15, �o 2 37
Figure 3: Typology of farm types selected
Table 1. Main characteristics of the arable farm types in the Oum Zessar watershed.
Irrigation system Public irrigation system Private irrigation system
Farm types Farm 1 Farm 2 Farm 3 Farm 4
Size Small Large Small Large
Intensity system Semi-intensive Intensive Semi-intensive Intensive
Area by farm (ha) 3.5 2.5 6.44 3.02
Irrigable area by farm (%) 1.95 (56%) 2.1 (84%) 3.95 (50%) 2.4 (56%)
Area Soil typesa
S1: Fluvisols
S2: Rebdzinas
S3: Xerosols
15%
25%
60%
30%
30%
40%
17%
3%
80%
10%
17%
74%
Available water (m3) 6719 8095 18438 10174
Available labour (hours) 975 650 1525 1120
Price of water (DT/m3) 0.08 0.08 0.236 0.256
Cereals area (%)
Vegetables area (%)
Forage area (%)
Fallow area (%)
Olive area (%)
14.6
20.6
6.9
6.9
51.2
8.8
29.6
12.0
4.4
45.2
11.65
54.8
2.5
7.6
23.5
5.95
38.1
11.9
5.3
38.8
Source: Survey data (2007)
availability (hours/year). These data were used to define Right Hand Side (RHS) con-
straints values as well as the observed crop pattern used for the calibration.
3.4.2. Crops
The irrigated crops in the Oum Zessar watershed that were considered in this study
include potatoes, pumpkin, tomatoes, pepper and cucumber, and the forage crops alfalfa
and oats. Rainfed crops are durum wheat and barley. With regard to tree crops, olive is
the most cultivated in this area.

38
AG
RIC
UL
TU
RA
L E
CO
�O
MIC
S R
EV
IEW
Table
2:
Set
of
input
and o
utp
ut
coef
fici
ent
for
curr
ent
agri
cult
ura
l act
ivit
ies
in t
he
Oum
Zes
sar
wate
rshed
.
Rotation
Crops
Soil
Techniquesa
Yield (ton/ha)
Yield vari-ability (%) (2005-2008)
Labour (hours/ha)
Water use (m
3)
Variable costs (DT/ha)
Soil erosion (ton/ha)
b
Average price (DT/ha)
Price vari-ability (%) (2005-2008)
Fal
low
F
allo
w
S1
Tr
0
0
3
0
50
12
0
0
Fal
low
F
allo
w
S2
Tr
0
0
5
0
50
6
0
0
Fal
low
F
allo
w
S3
Tr
0
0
8
0
50
3
0
0
Oat
es
Oat
es
S3
Ti
0
0
424
8000
824
6
350
15
Alf
alfa
A
lfal
fa
S2
Ti
35.5
7
9
595
12000
2095
0
300
10
Oli
ve
Oli
ve
S1
Tr
0.8
7
12
40
0
190
0
883
20
Oli
ve
Oli
ve
S1
Ti
1.4
5
60
1700
325
0
883
20
Oli
ve
Oli
ve
S2
Tr
0.7
7
18
30
0
150
0
883
20
Oli
ve
Oli
ve
S2
Ti
1.1
8
8
60
1850
325
0
883
20
Oli
ve
Oli
ve
S3
Tr
0.6
5
30
35
0
140
0
883
20
Oli
ve
Oli
ve
S3
Ti
1.5
7
8
60
2000
325
0
883
20
Bar
ley
Bar
ley
S1
Tr
0.5
2
25
50
0
90
3
337
25
Pota
toes
-Pum
pkin
P
ota
toes
S
3
Ti-
Ti
12.8
9
5
1500
6000
2337
3
482
15
Pota
toes
-Pum
pkin
P
um
pkin
S
3
Ti-
Ti
25.4
4
6
1600
4500
1536
3
440
10
Tom
atoes
-C
ucu
mber
T
om
atoes
S
3
Ti-
Ti
19.7
1
17
850
3500
2035
3
543
15
Tom
atoes
-C
ucu
mber
C
ucu
mber
S
3
Ti-
Ti
25.1
1
12
750
5000
1536
12
562
10
Duru
m w
hea
t -B
arle
y
Duru
m w
hea
t S
1
Tr-
Tr
1.0
7
25
120
0
135
6
463
35
Duru
m w
hea
t -B
arle
y
Bar
ley
S1
Tr-
Tr
0.5
7
15
50
0
90
12
337
25
Bar
ley-
Pep
per
B
arle
y
S3
Tr-
Ti
0.5
5
10
65
0
110
12
337
25
Bar
ley-
Pep
per
P
epper
S
3
Tr-
Ti
20.8
7
16
800
5500
2120
3
985
15
Sourc
e: s
urv
ey a
nd r
egio
nal
data
, and o
wn c
alc
ula
tions
a.
Pro
duct
ion t
echniq
ues
: T
r: r
ainfe
d a
nd T
i: i
rrig
ated
. F
or
exam
ple
, th
e nota
tion “
Ti-
Tr”
mea
ns
the
firs
t cr
op i
s ir
rigat
ed “
Ti”
and t
he
seco
nd c
rop i
s ra
infe
d.
b.
The
bio
physi
cal
model
use
d i
s not
yet
able
to s
imula
te t
he
erosi
on g
ener
ated
by "
oli
ve"
; it
was
ass
um
ed t
hat
the
oli
ve
tree
is
not
deg
radin
g s
oil
s, t
his
coef
fici
ent
equ
al t
o z
ero
.

2014, Vol 15, �o 2 39
Main current rotations identified were tomatoes-cucumber, barley-pepper, potatoes-
pumpkin and durum wheat-barley. Combined to management types, soil types and pro-
duction system, these rotations define the current activities. For each crop within an ag-
ricultural activity a set of data was collected. It included data on average yield, yield
variability, labour use, and amount and method of water management as presented in
Table 2.
Additionally, for each crop a set of economic data has been specified including pro-
ducer prices, water pricing, and variable costs. The average prices and variability were
collected from regional data such as the Office of South Development (ODS, 2008), and
data were averaged for 2005-2008 (Table 2). Variable costs were calculated by sum-
ming input costs (fertilizers, seeds and biocides), irrigation costs and hired labour costs.
4. Results
4.1. Model calibration
Model calibration was tested by comparing the results of the crop allocation simu-
lated by the model (simulated value) and the crop allocation observed in the base year
situation in 2007 (observed value). The difference between both values is assed statisti-
cally by using the percent absolute deviation (PAD). The results of the calibration with-
out Positive Mathematical Programming (PMP) for the four farm type are presented in
Table 3.
As shown in this table, the PAD obtained in the first step for the farm types are big-
ger than the fixed threshold which is 15%, showing that the model is not exactly cali-
brated. This is explained by the limited number of binding constraints and the lack of
specification technologies (i.e. the only distinction is between rainfed and irrigated, not
other irrigation techniques such as drip irrigation, complementary sprinkler irrigation
for fruit trres). The second step by applying the method of Positive Mathematical Pro-
gramming (PMP), the model is calibrated exactly (PAD is equal to zero). Once the
model is calibrated, it can make the simulation scenarios.
4.2. Impact assessment of policy option 1: increasing of water pricing
The comparison between policy option 1 and the baseline in 2015 in Table 4 shows:
(i) a decrease in water consumption due to the increased cost of production, (ii) a de-
cline in hours of labour, (ii) changes in crop areas, and (iii) a reduced level of soil ero-
sion for certain farm types. Increasing water price by 13% led to drop of water use of
17.6 % on the intensive farm 1, which is larger than the 14.9% on the semi-intensive
farm 2.
The economic results show a larger decrease in income for the intensive farm 1 com-
pared to the semi-intensive farm 2. The decrease reaches 7.6% for the intensive farm 1
explaining the importance of the input water for such agricultural practice. The irriga-
tion water price increase has hugely contributed to the increase of the production cost.
The drop in temporal labour could not compensate for this, while in the meantime it
does affect social stability and the agricultural employment in the region.

40
AG
RIC
UL
TU
RA
L E
CO
�O
MIC
S R
EV
IEW
Table
3:
Res
ult
s of
model
cali
bra
tion
Irri
gati
on
syst
em
Pu
bli
c ir
rigati
on
syst
em
Pri
vate
irr
igati
on
syst
em
Farm
typ
es
Farm
1
Farm
2
Farm
3
Farm
4
Farm
ing s
yst
em
Sm
all
, in
ten
sive
syst
em
Larg
e, s
emi-
inte
nsi
ve
syst
em
Sm
all
, in
ten
sive
syst
em
Larg
e, s
emi-
inte
nsi
ve
syst
em
Cro
ps
Ob
s.
level
Sim
.
BC
a
Sim
.
AC
b
Ob
s.
level
Sim
.
BC
a
Sim
.
AC
b
Ob
s.
level
Sim
.
BC
a
Sim
.
AC
b
Ob
s.
level
Sim
.
BC
a
Sim
.
AC
b
Bar
ley
0.1
2
0.6
6
0.1
2
0.5
1
0.8
5
0.5
1
0.1
0
0.9
2
0.1
0
0.5
0
1.9
8
0.5
0
Duru
m w
hea
t 0.1
0
0.1
0
0.0
8
0.0
8
0.2
5
0.2
5
Oat
s 0.0
5
0.0
5
0.0
5
0.0
5
Alf
alfa
0.2
5
0.0
5
0.2
5
0.2
4
0.2
4
0.3
6
0.3
6
0.1
1
0.1
1
Pota
toes
0.2
5
0.2
5
Tom
atoes
0.3
6
0.3
6
0.1
0
0.1
0
0.5
7
0.5
7
1.3
9
1.3
9
Pum
pkin
0.2
5
0.2
5
Pep
per
0.0
2
0.6
6
0.0
2
0.5
1
0.8
5
0.5
1
0.0
2
0.9
2
0.0
2
0.2
5
1.9
7
0.2
5
Cucu
mber
0.3
6
0.3
6
0.1
0
0.1
0
0.5
7
0.5
7
1.3
9
1.3
9
Fal
low
0.1
1
0.1
1
0.2
4
0.2
4
0.1
6
0.1
6
0.4
9
0.4
9
Oli
ve
1.1
3
1.1
3
1.1
3
1.7
9
1.7
9
1.7
9
1.1
7
1.1
7
1.1
7
1.5
1
1.5
1
1.5
1
Tota
l ar
ea
2.5
2.5
2.5
3.5
3.5
3.5
3.0
2
3.0
2
3.0
2
6.4
4
5.4
6
6.4
4
PA
D w
ithout
PM
P
43.2
0
27.4
2
54.6
3
61.2
5
PA
D w
ith P
MP
(%
)
0.0
0
0.0
0
0.0
0
0.0
0
Source:
model
result
s
a:
sim
ula
ted
are
a b
efo
re c
ali
bra
tio
n P
MP
b:
sim
ula
ted
are
a a
fter
cali
bra
tio
n P
MP

2014, Vol 15, �o 2 41
Table 4: Impact of policy option 1-2015 (increase price of irrigation water) at the
farm level.
Irrigation system Public irrigation system
Farm type Farm 1 Farm 2
Farming system Small, intensive Large, semi-intensive
Indicators /Units Baseline
2015
Policy option
1-2015 (%)
Baseline
2015
Policy option
1-2015 (%)
Farm income (DT/ha) 4171 -7.6 3880 -5.7
Total costs (DT/ha) 3318 +8.0 3026 5.8
Labour (Hours/ha) 883 -5.4 644 -7.1
Water use (m3/ha) 3224 -17.6 1919 -14.9
Soil erosion (ton/ha) 3.30 -6.3 3.30 -6.8
Barley area (ha) 0.12 +17.4 0.61 +11.7
Durum wheat area (ha) 0.10 +8.7
Oats area (ha) 0.05 +5.8
Cereals area (ha) 0.27 +13.7 0.61 +11.8
Potatoes
Tomatoes 0.43 +17.0 0.16 -4.8
Pumpkin
Pepper 0.03 +45.3 0.61 +11.8
Cucumber 0.43 +17.0 0.16 -4.8
Vegetables area (ha) 0.89 +18.0 0.93 +6.1
Olive area (ha) 1.13 0.0 1.79 0.0
Forage : alfalfa area (ha) 0.25 -77.5 0.17 -75.0
Source: model results
The environmental externality soil erosion declines substantially for both farm types
with 6.3% and 6.8 % for farm 1 and 2, respectively. This result can be explained by the
change in the allocation of land between the rainfed and irrigated crops. The results
(Table 4) showed an increase in area of (mainly rainfed) cereals with 13.7% for the in-
tensive farm 1 and 11.8% for the semi-intensive farm 2 against a decline in area of the
irrigated forage crop alfalfa by 77.5 % for farm 1 and by 75% for farm 2. Alfalfa re-
quires a lot water and labor (Table 2) during all agricultural seasons. On farm 2, also the
area of the vegetable crops tomatoes and cucumber decline by 4.8 % each, but the area
of pepper increases by 11.8 %. On the intensive farm 1, the areas of all vegetable crops
increase by 18 % on average. These strategies show that both farms reduce areas of
most water demanding crops, but at the same time increase areas of irrigated crops that
are most profitable.
4.3. Impacts assessment of policy option 2: increased cost of pumping water
The economic results in Table 5 show a larger decrease in income for the intensive
farm 3 (24.9%) compared to the semi-intensive farm 4 (21.9%) after the decrease of
water consumption to 11.1% for farm 3 and to 4.6% for farm 4. The significant drops in

42 AGRICULTURAL ECO�OMICS REVIEW
Table 5: Impact of policy option 2-2015 (increase cost of pumping water) at the farm
level.
Irrigation system Private irrigation system
Farm type Farm 3 Farm 4
Farming system Small, intensive Large, semi-intensive
Indicators /Units Baseline
2015
Policy option
2-2015 (%)
Baseline
2015
Policy option
2-2015 (%)
Farm income (DT/ha) 5452 -24.9 5266 -21.9
Total costs (DT/ha) 3369 +37.8 3604 +27.5
Labour (Hours/ha) 1069 -3.5 1070 -3.8
Water use (m3/ha) 3360 -11.1 2863 -4.6
Soil erosion (ton/ha) 4.29 -3.2 4.83 -0.4
Barley area (ha) 0.10 +31.0 0.49 -0.2
Durum wheat area (ha) 0.08 +12.7 0.66 +20.6
Oats area (ha) 0.05 -5.8
Cereals area (ha) 0.18 +23.0 1.20 +11.0
Potatoes 0.25 +4.9
Tomatoes 0.66 +6.2 1.52 -8.9
Pumpkin 0.25 +4.9
Pepper 0.03 +50.0 0.17 +80.7
Cucumber 0.66 +0.7 1.52 -8.9
Vegetables area (ha) 1.35 +7.6 3.71 -3.0
Olive area (ha) 1.17 0.0 1.51 0.0
Forage: alfalfa area (ha) 0.32 -45.1 0.07 -37.1
Source: model results
farm income show that these types of agricultural system heavily dependent on the pro-
duction factor ‘water’. To address the significant decline in profitability of the farm,
farmers adopt various cropping strategies according to its constraints and its techno-
economic conditions. The behaviors of these farmers are manifested by the decrease in
hours of labour by 3.5% for the intensive farm 3 and 3.8% for the semi-intensive farm 4
(Table 5).
In terms of environmental impacts, policy option 2 shows that the decrease in water
consumption for the intensive farm 3 reduces soil erosion (3.2%) generated by the effect
of irrigation with saline water on fragile soils. For the semi-intensive farm 4 the impact
is negligible.
In terms of agricultural area, Table 5 shows that forage area is already low on farm 4
in the baseline. Hence, this farm has relatively little opportunity to further reduce water
use, and income is directly affected. It is the only farm type where vegetable area is re-
duced, despite the high profitability. The intensive farm 3 switches forage crops for
vegetable crops (7.6%), especially pepper, which is more profitable in economic terms.
But as this system is still based on irrigated crops, the income is also greatly reduced
following the increase of water prices.

2014, V
ol
15, �
o 2
43
Table
6:
Sensit
ivit
y a
naly
sis
, show
ing c
hange i
n i
ndic
ato
rs d
ue t
o i
ncreases i
n w
ate
r p
ric
e o
r p
um
pin
g o
f w
ate
r, rela
tive t
o t
he b
aseli
ne
Farm
in
com
e (D
T/h
a)
Wate
r co
nsu
mp
tion
(m
3/h
a)
Ero
sion
(to
n/h
a)
Farm
1
Farm
3
Farm
1
Farm
3
Farm
1
Farm
3
Incr
ease
pri
ce /
cost
s
pu
mp
ing o
f w
ate
r %
S
mall
, in
ten
sive
Sm
all
, in
ten
sive
Sm
all
, in
ten
sive
Sm
all
, in
ten
sive
Sm
all
, in
ten
sive
Sm
all
, in
ten
sive
S0
13 (
bas
elin
e)
3795
4097
2655
2988
4.5
5
4.1
6
S1
14
-1%
-3
%
-12%
-3
%
0%
-1
%
S2
15
-2%
-7
%
-13%
-6
%
0%
-2
%
S3
16
-3%
-1
0%
-1
3%
-1
0%
0%
-3
%
S4
17
-5%
-1
4%
-1
3%
-1
3%
1%
-4
%
S5
18
-6%
-1
8%
-1
4%
-1
4%
1%
-3
%
S6
19
-7%
-2
2%
-1
4%
-1
4%
1%
-2
%
S7
20
-9%
-2
7%
-1
4%
-1
5%
1%
-1
%
Source:
model
result
s
44 AGRICULTURAL ECO�OMICS REVIEW
4.4. Sensitivity analysis
The CropSyst-FSSIM model chain can be used as decision tool for policy makers
and local actors with regard to the water policy and the impacts on farming systems and
the sustainability of irrigated agriculture in the region. This requires the comparison of
different alternatives, and therefore a sensitivity analysis was performed.
The sensitivity analysis is based on the simulation of variation in prices and costs of
irrigation water for the intensive systems (farm 1 and farm 3). The results in Table 6
show that when prices are increased with 20%, the intensive farm in the public irriga-
tion system is able to absorb the impact with only an income decline of 9%. The decline
in farm income in the private irrigation system on the other hand reaches 27%. In terms
of environmental externalities, increasing water prices or the cost of pumping induces
small reductions in soil erosion in both irrigation systems.
The sensitivity analysis also showed that increasing the water price with more than
17% (equals to 0.280 DT/m3 for the public and 0.836 DT/m
3 for the private irrigation
systems) is not advisable to local decision makers, because the net income continues to
decline, while the water consumption remains stable with further increases. Hence, there
is no further gain in terms of water saving. Overall, intensive agricultural systems with
private irrigation systems seem most vulnerable and unsustainable regarding water use
and therefore the extension of public irrigation systems and semi-intensive agriculture is
recommendable to improve the sustainability of agriculture in this arid zone.
5. Discussion
5.1. Impacts of water pricing policy on agricultural activities
This study showed that a water price increase of 13% leads to a reduction in water
consumption in all farms types, particularly the intensive farms. This result is similar to
other empirical studies (Gomes and Berbel-Limon, 2000; de Fraiture and Perry, 2002),
showing that the pricing policy remains an effective instrument to control the consump-
tion of water in agriculture. The significant drops in farm income show that the agricul-
tural systems in Oum Zessar watershed heavily dependent on the production factor ‘wa-
ter’. Independent of the policy, pumping costs will increase due to the decline in
groundwater level. This, along with the instability of natural conditions, in particular
climate change and difficult conditions in the international energy market, affects the
economic viability of these farms types in the coming years. To address the significant
decline in profitability of the farm, farmers adopt various cropping strategies according
to its constraints and its techno-economic conditions. These adaptations cannot com-
pletely reduce the negative economic impacts, but their impacts on the environment,
water saving and reducing erosion, are positive. The degree of sustainability and vulner-
ability of each system to increased costs of irrigation water differ. This study showed
that especially farms with private irrigation systems have few opportunities to adapt
cropping patterns, and are therefore vulnerable to changes in external factors like policy,
climate and the market.
An effective water pricing policy should have three objectives: water savings, limit-
ing welfare losses and the collection of revenue. The objective to set charges at full- or
near to-cost recovery prices has been at the core of most pricing reforms. In Tunisia, it
is preferable to increase the price of water to encourage farmers to reduce waste and to

2014, Vol 15, �o 2 45
ensure the transfer of welfare to the GDA (who determines the water price) to be used
for repairs or to increase the production capacity of water in the next year. Irrigation
water demand functions tend to be inelastic at low prices and more elastic at high water
prices. Below a certain threshold of water prices, ratios of collected revenue and water
savings over welfare losses are efficient, and when prices are inelastic any pricing
change fall within the limits of farmers’ “ability-to-pay”. The price threshold can be
identified if the water demand is estimated for a sufficiently wide price range (Iglesias
et al., 1998), which resulted in a threshold of 17% price increase in this case study. Be-
yond this threshold, welfare losses increase while water use does not decrease anymore.
Other secondary effects may occur, including resorting to fallow land and less profitable
dry-land regimes.
5.2. Strength and weakness of Bio-economic farm model FSSIM
The bio-economic farm model FSSIM proved to be a good tool to assess land use
policies like the case of the water pricing policy in Oum Zessar watershed in Tunisia.
Simulation of a series of scenarios in combination with sensitivity analyses led to im-
portant recommendations for policy makers. The tool is generic enough to be applied in
a different context, although some adaptations need to be made according the objective
of their implement, for example, this model has been adapted also in china for inte-
grated assessment of agricultural land use policies on nutrient pollution and sustainable
development in Taihu Basin in the east of china in Lupis project (Reidsma et al., 2012).
It should be noted however that this application has some limitations in terms of
methodology and assumptions. First of all, the application was limited to current ob-
served activities. No improved activities such as improved irrigation techniques or al-
ternative activities were included. Also livestock activities were not included, which
could be relevant in relation to the forage crops. Including these would give farms more
options to adapt to land use policies. However, the impact assessment focuses on the
short term, 2015, so it can be assumed that there are not many alternatives available.
A second limitation is that it was assumed that the area of perennial crops remains
constant. Perennial activities respond differently to price changes than annual activities
due to long-tem investments. This is a restrictive assumption as olive trees are very im-
portant in all farm types. Olive trees do however not require much water, so water de-
mand is virtually inelastic at low prices. The majority of olives trees are rain-fed, often
behind the soil and water conservation works where rainwater is collected. In addition,
water prices need to be substantially increased in order to achieve water savings and to
encourage farmers to change crops when they cultivate high value crops such as olives,
citrus and vegetables (Giannoccaro et al., 2009). Lastly, the fact that this is an impact
assessment on the short-term is another reason to assume that perennial activities will
remain constant.
6. Conclusion
The objective of this study was to perform an ex-ante impact assessment of the water
pricing policy on four representative farm types of irrigated agriculture in the region in
two different irrigation systems (a semi-intensive and intensive farm in the public irriga-

46 AGRICULTURAL ECO�OMICS REVIEW
tion system and a semi-intensive and intensive farm in the private irrigation system).
This was done using the bio-economic model FSSIM coupled to the biophysical model
CropSyst. Results showed the higher vulnerability of farms with private irrigation sys-
tems compared to farms in public irrigation systems facing scenarios of increased
prices/costs of irrigation water by 13%. A sensitivity analysis showed that it is not ad-
visable to policymakers to increase the price of irrigation water beyond a rate of 17%
because the consumption of water does not further diminish, while the farm income
continues to decrease tremendously. The sensitivity analysis also confirmed that the
public irrigation system is more durable than the private irrigation system and the strat-
egy of the Tunisian government to extend the public irrigation system is an appropriate
strategy for the preservation of water resources and limit the problem of land degrada-
tion for sustainability of irrigated agricultural in arid zones.
Acknowledgements
This study was carried out for the Tunisian case study in the LUPIS (Land Use Poli-
cies and Sustainable Development in Developing Countries; www.lupis.eu) project.
LUPIS is an EU funded project run by 16 institutes in 13 countries. We would like to
thank Mr. Floor Brouwer for his coordination of the LUPIS project.
References
1. Abbés, K., 2005. Analyse de la relation agriculture-environnement : une approche bioé-conomique, cas de salinisation des sols et de la pollution par les nitrates au nord tunisien. Thèse de doctorat en économie, université Montpellier I. 305 p.
2. Al Atiri, R., 2005. Analyse des politiques hydrauliques. Cas de la Tunisie .actes de du sémi-
naire Euro Méditerranéen « Les instruments économiques et la modernisation des périmètres des périmètres irrigués ». Séance 1. Politiques hydrauliques : expériences et per-spectives 21-22 novembre 2005, Sousse, Tunisie.
3. Bachta, M.S., Ben Mimoun, A., Zaiebet, L., Albouchi, L., 2004. Simulation of a water mar-ket in Tunisia: A case study of GIC Melalsa – Kairouan. Séminaire “Modernisation de l’Agriculture Irriguée” Rabat, Maroc, April 19-23.
4. Belhouchette, H., 2004. Evaluation de la durabilité de successions culturales à l’échelle d’un périmètre irrigué en Tunisie : Utilisation d’un modèle de culture (CropSyst), un SIG et un modèle bioéconomique. Thèse de doctorat en science Agronomique, école Nationale supérieure d’agronomie de Montpellier.UMR Fonctionnement et conduite des systèmes de culture tropicaux et méditerranéens.
5. Belhouchette, H., Louhichi, K., Therond, O., Mouratiadou, I., Wery, J., Van Ittersum, M., Flichman, G., 2011. Assessing the impact of the Nitrate Directive on farming systems using a bio-economic modelling chain. Agricultural Systems. 104 135–145.
6. Berbel, J., Gomez-Limon, J.A., 2000. The impact of water pricing policy in Spain: an analy-sis of three irrigated areas. Agricultural Water Management. 43, 219-238.
7. De Fraiture C., Perry C., 2002. Why is the irrigation water demand curve inelastic at low price ranges? Paper presented at International conference on: Irrigation water Policies: Mi-cro and macro considerations. Jointly organized by World Bank and Government of Mo-rocco. June 15-17, 2002. Agadir, Morocc.
8. Donaldson, A.B., Flichman, G., Webster, J.P.G., 1995. Integrating agronomic and economic models for policy analysis at the farm level: the impact of CAP reform in two European re-

2014, Vol 15, �o 2 47
gions. Agricultural Systems. 48, 163–178. 9. Fouzai, A., Zekri, S., 2002. Estimation of a demand function for irrigation water at Bou-
hertma. Working Paper (In French).College of Agricultural, University of Tunisia-Carthage, Tunisia.
10. Flichman, G., 1996. L’évaluation micro-économique de la reforme de la PAC par un modèle bio-économique: une illustration sur la région de Toulouse. In: Reyniers, F.N., Benoit-Cattin, M. (Eds.), Linking-Agricultural-Models: Seminar- Proceedings, Montpellier, France. CIRAD-CA, IAM, Montpellier, France, pp. 71–75.
11. Giannoccaro, G., Pistón, J.M., Kolberg, S., Berbel, J., 2009. Comparative analysis of water saving policies in agriculture: pricing versus quotas. Technological Perspectives for Ra-tional Use of Water Resources in the Mediterranean Region. Options Méditerranéennes, n° 88, 2009.
12. Hamdane, A., 2002. Valeur Économique des Eaux Agricoles, Cas de la Tunisie. Forum sur
la gestion de la demande en eau. Beyrouth, LIBAN – Juin 2002. 13. Howitt, R. E., 1995. A calibration method for agricultural economic production models.
American Journal of Agricultural Economics.46 (2), 147-159. 14. Iglesias, E., Garrido, A., Sumpsi, J., Varela-Ortega, C., 1998. Water demand elasticity: im-
plications for water management and water pricing policies. World congress of environ-
mental and resource economists. VENICE, ITALY, 26-29 June 1998. 15. Jeder, H., Sghaier, M., Louhichi, K., 2011. Tarification de l’eau d’irrigation et durabilité des
systèmes de production : cas du bassin versant d’Oum Zessar, Sud-Est de la Tunisie. �EW MEDIT. Vol. VII –n.1/2011.
16. Kanellopoulos, A., Berentsen, P.B.M., Heckelei, T., Van Ittersum, M.K., Oude Lansink, A.G.J.M., 2010. Assessing the forecasting performance of a generic bio-economic farm model calibrated with two different PMP variants. Journal of Agricultural Economics. 61, 274-294.
17. Louhichi, K., Kanellopoulos, A., Janssen, S., Flichman, G., Blanco, M., Hengsdijk, H., Heckelei, T., Berentsen, P., Oude Lansink, A., Van Ittersum, M.K., 2010. FSSIM, a bio-economic farm model for simulating the response of EU farming systems to agricultural and environmental policies. Agricultural Systems. 103 585–597.
18. Reidsma, P., Feng, S., Van Loon, M., Lubbers, M., Kanellopoulos, A., Kang, C., Wolf, J. Van Ittersum, M.K., Qu, F., 2012. Integrated assessment of agricultural land use policies on nutrient pollution and sustainable development in Taihu Basin, China. Environmental Sci-
ence &Policy .18, 66-76. 19. Riesgo, L., Gomez-Limon, J.A., 2006. Multi-criteria policy scenario analysis for public
regulation of irrigated agricultural. Agricultural Systems. 91, 1-28. 20. Semaan, J., Flichman, G., Scardigno, A., Steduto, P., 2007. Analysis of nitrate pollution
control policies in the irrigated agriculture of Apulia Region (Southern Italy): a bio-economic modelling approach. Agricultural Systems. 94, 357–367.
21. Stöckle, C. O., Donatelli, M., Nelson, R., 2003. CropSyst, a cropping systems simulation model. Eur. J. Agron. 18, 289-307.
22. Taddese, G., 2001. Land degradation: A challenge to Ethiopia. Environmental Management. 27 (6), 815-824.
23. Tilman, D., Cassman, K.G., Matson, P.A., Naylor, R., Polasky, S., 2002. Agricultural sus-tainability and intensive production practices. �ature. 418, 671-677.
24. Van Ittersum, M. K., Ewert, F., Heckelei, T., Wery, J., Olsson, J.A., Andersen, E., Bezlep-kina I., Brouwer, F., Donatelli, M., Flichman, G., Olsson,L., Rizzoli, A.E., Van der Wal, T., Wien, J.E., Wolf, J. 2008. Integrated assessment of agricultural systems – A component based framework for the European Union (SEAMLESS). Agricultural Systems. 96, 150-165.