Embed Size (px)
Citation preview
Binding Constraints on Economic Growth in Cambodia:A Growth Diagnostic Approach
SAING Chan Hang
Working Paper Series No. 80
March 2013
A CDRI Publication
CDRI - Cambodia’s leading independent development policy
research institute

iCDRI Working Paper Series No. 80
Binding Constraints on Economic Growth in Cambodia:
A Growth Diagnostic Approach
CDRI Working Paper Series No. 80
SAING Chan Hang
March 2013
CDRICambodia’s leading independent development policy research institute
ii Binding Constraints on Economic Growth in Cambodia: A Growth Diagnostic Approach
© 2013 CDRI - Cambodia’s leading independent development policy research institute
All rights reserved. No part of this publication may be reproduced, stored in a retrieval system or transmitted in any form or by any means—electronic, mechanical, photocopying, recording, or otherwise—without the written permission of CDRI.
ISBN-10: 99950–52–71-3
Binding Constraints on Economic Growth in Cambodia: A Growth Diagnostic Approach
CDRI Working Paper Series No. 80
Responsibility for ideas, facts and opinions presented in this research paper rests solely with the authors. Their opinions and interpretations do not necessarily reflect the views of the Cambodia Development Resource Institute.
CDRI� 56, Street 315, Tuol Kork, Phnom Penh, Cambodia � PO Box 622, Phnom Penh, Cambodia℡ (+855 23) 881 384/881 701/881 916/883 603� (+855 23) 880 734 E-mail: [email protected] Website: www.cdri.org.kh
Layout and Cover Design: Oum Chantha
iiiCDRI Working Paper Series No. 80
CONTENTS
Acronyms ...................................................................................................................................vAcknowledgements ...................................................................................................................viExecutive Summary .................................................................................................................vii
1. Introduction ..........................................................................................................................1
2. Framework of Analysis ........................................................................................................3
3. Overall Macroeconomic Performance ...............................................................................5
4. Explaining Drivers of Growth during the last Decade (1999-2009) ................................94.1 Agriculture .......................................................................................................................94.2 Industry ..........................................................................................................................124.3 Services ..........................................................................................................................134.4 New Source of Growth ..................................................................................................14
5. Growth Constraints in Cambodia: Evidence so far ........................................................15
6. New Evidence of Constraints on Growth in Cambodia .................................................186.1 Cost of and Access to Finance .......................................................................................196.2 Appropriability of Returns .............................................................................................24
6.2.1 Macroeconomic Risks ..........................................................................................256.2.2 Microeconomic Risks ...........................................................................................286.2.3 Property Rights and Quality of Institutions ..........................................................296.2.4 Tax Rate and Taxation ..........................................................................................296.2.5 Evidence of Self-discovery and Coordination ......................................................30
6.3 Social Return .................................................................................................................326.3.1 Low Human Capital .............................................................................................326.3.2 Inadequate Infrastructures ....................................................................................356.3.3 Cost of Electricity .................................................................................................37
7. Conclusion ..........................................................................................................................40
References ...............................................................................................................................42
Appendix .................................................................................................................................44
CDRI Working Papers ..........................................................................................................45
iv Binding Constraints on Economic Growth in Cambodia: A Growth Diagnostic Approach
LIST OF FIGURES, TABLES AND APPENDIX
Figure 1: Annual GDP Growth at 2000 price ..........................................................................1Figure 2: Distribution of GDP by Major Sectors ....................................................................2Figure 3: Growth Diagnostic Problem Tree .............................................................................3Figure 4: Inflation Trends, 2002-2011 (monthly y-o-y % change) ..........................................5Figure 5: Trade Balance, Current Account and FDI (percentage of GDP) ..............................6Figure 6: 12-Month Lending Interest Rate Spreads and Exchange Rate (2006-2010) ............7Figure 7: Government Revenue Collection and Expenditure (Percentage of GDP) ...............8Figure 8: Cultivated Area (ha) of Major Crops, 1999-2009 .................................................11Figure 9: Agricultural Prices at International Markets ..........................................................11Figure 10: Regional Per Capita GDP at 2000 Prices (1993=100) ...........................................18Figure 11: Education and Birth Rate vs. per capita GDP 2007 (2000 prices) .........................19Figure 12: Financial Depth vs. per capita GDP, 2008 (2000 prices) .......................................20 Figure 13: Real Lending Rate vs. Investment Ratio, 2008-2009 .............................................21Figure 14: Doing Business Ranking 2011 for ASEAN (among 183 economies) ....................25Figure 15: Garment Export Value Growth 2006-2011 .............................................................25Figure 16: Growth of Holiday and Business Arrivals 2006-2011 ...........................................26Figure 17: Growth of Import of Construction Materials 2006-2011 .......................................26Figure 18: Inflation Rate and Exchange Rate, 2004-2011 .......................................................27Figure 19: Distribution of Population by Age and Sex Groups (1998 left; 2008 right) ..........33Figure 20: Net Enrolment Rates by Age and Sex in 2009 (percentage) ..................................33Figure 21: Labour Force (15-64 years) Participation Rate by Education ................................34Figure 22: Cost of Export and Import in ASEAN in USD (per 20-foot container) .................36Figure 23: Energy Sources in ASEAN in 2008 (percentage of total) ......................................38Figure 24: Crude Oil and Natural Gas Prices, 1997-2011 .......................................................38Figure 25: Value Lost due to Electricity Outage (% of Sale)...................................................39
Table 1: Sources of Growth by Economic Activity, 1999-2009 ..........................................10 Table 2: Real Lending Rate (Lending rate minus Inflation rate) ..........................................20Table 3: Most Problematic Factors for Doing Business in Cambodia, 2008-2010 .............21Table 4: Gross Saving as % of GDP in ASEAN, 1999-2009 ...............................................22Table 5: Interest Rate Spread (Lending Rate minus Deposit Rate) ......................................22Table 6: Foreign Aid (Percentage of Gross Capital Formation) ...........................................23Table 7: Concessional Debt as Percentage to External Debt ...............................................23Table 8: Foreign Direction Investment (Percentage of GDP) ..............................................24Table 9: Ranking of Macroeconomic Environment in 2010 ................................................28Table 10: Indicators on Ranking and Control of Corruption .................................................28Table 11: Indicators of Institution and Regulatory Quality, 2009 - 2010 ..............................29Table 12: Ranking of Extent and Effect of Taxation and Tax Rates in Asia ..........................30Table 13: Indicators of Product Discoveries in Cambodia .....................................................30Table 14: Gross Enrolment Rate among ASEAN Countries ..................................................35Table 15: Key Indicators of Road Infrastructure in ASEAN (various years in bracket) ........35Table 16: Logistic Performance Index (LPI) in ASEAN in 2009 (1=Low; 5=High) .............36Table 17: Electricity Tariff in ASEAN Countries in 2010 (US cents/Kwh)...........................37
A-1 : Distribution of Hydropower Projects Across Cambodia as of 2008 ......................44
vCDRI Working Paper Series No. 80
ACRONYMS
ASEAN Association of South-East Asian NationsCDC Council for Development of CambodiaCED Customs and Excise DepartmentCSES Cambodia Socio-Economic SurveyCSR Cambodia Specified RubberEAC Electricity Authority of CambodiaELC Economic Land ConcessionsEU European UnionFAO Food and Agriculture OrganisationFDI Foreign Direct InvestmentFOB Free on BoardGDP Gross Domestic ProductGDRP General Directorate of Rubber PlantationGMAC Garment Manufacturers Association of CambodiaGSP Generalised System of Preference IFC International Finance CorporationIFS International Financial StatisticsIMF International Monetary FundISO International Organisation for StandardisationKHR Khmer RielMAFF Ministry of Agriculture, Forestry and FisheryMEF Ministry of Economy and FinanceMFN Most Favoured NationMOC Ministry of CommerceMOP Ministry of PlanningMOT Ministry of TourismNBC National Bank of CambodiaNGO Non-Governmental OrganisationNIS National Institute of StatisticsNSDP National Strategic Development PlanNSI North-South InstituteODA Overseas Development AssistanceSida Swedish International Development Cooperation AgencySMEs Small and Medium-Sized EnterprisesSMR Standard Malaysian RubberSTR Standard Thai RubberSPS Sanitary and Phytosanitary StandardsSVR Standard Vietnamese RubberUSD US DollarWB World BankWDI World Development IndicatorsWEF World Economic ForumWGI World Governance IndicatorsWITS World Integrated Trade Solution
vi Binding Constraints on Economic Growth in Cambodia: A Growth Diagnostic Approach
ACKNOWLEDGEMENTS
The author is deeply grateful for the funding support provided by the Swedish International Development Cooperation Agency (Sida), as well as financial support during the conceptual stage of this study from the North-South Institute (NSI), initiated by Dr Rodney Schmidt, Vice President and Director of Research of the North-South Institute, without which this study would not have happened. I am profoundly grateful to Dr Tong Kimsun, coordinator of Economy, Trade and Regional Cooperation programme at CDRI and Mr. Larry Strange, executive director of CDRI, for their very kind support, interest, guidance and encouragement in making this study happen.
Special thanks are also due to Dr. Stéphane Guimbert, former senior economist of the World Bank in Cambodia for his comments and inputs. I am also thankful to CDRI researchers, who provided me with critical and constructive comments during CDRI’s bi-weekly research workshop and Ms Ourn Vimoil and Ms Sry Bopharath, assistants of Economy, Trade and Regional Cooperation Programme for data collection and administrative support. Special gratitude is also extended to our language editor, Ms Susan Watkins, for her patience and constant support and Dr. Rebecca Catalla, CDRI research advisor, for her comments and suggestions in the study. Thanks are also due to the many support staff at CDRI, especially Mr Ung Sirn Lee, director of operations.
Phnom Penh March 2013
viiCDRI Working Paper Series No. 80
EXECUTIVE SUMMARY
This study applies the growth diagnostic approach, developed by Hausmann, Rodrik and Velasco in 2005, to identify binding constraints on Cambodia’s growth after the crises in 2008 and 2009. Growth was strong during 1999-2009 at an average annual rate of 9.0 percent, but then slowed to 6.7 percent in 2008 and dropped to 0.1 percent in 2009, before rebounding in 2010 posting 5 percent. Average annual inflation rate was between 1 and 7 percent during 2002-2007, but jumped to 25 percent in 2008. Overall consumer prices then declined bringing inflation down to 4.0 percent in 2010. Rebound in export has also been evident after the crisis, but trade deficit persists. Budget deficit remains, but is under control.
Garments, tourism, construction and agriculture, particularly paddy rice, have retained their status as key drivers of growth, though a slower pace of expansion was evident in the construction sector and renewed efforts to promote paddy rice production and milled rice export emerged in mid 2010. On the binding constraints to growth, the study finds that cost of finance has not seemed to be constraint as of 2009. Even though real lending rate rose from -9.0 percent in 2008 to 19.5 percent in 2009, the highest among ASEAN members, the increase resulted primarily from the surge in consumer prices. Credit to the private sector continued to grow by 5 percent in 2009 despite sluggish economic activities during the year, but lower than the 77 percent in 2007 and 50 percent in 2008.
In addition, there is no sign that access to international finance has been a constraint as executives surveyed in the World Economic Forum Report ranked “foreign currency regulations” 14th in 2009 and 13th in 2010 out of 15 factors worrying investors in doing business in Cambodia. Macroeconomic risk was no longer a concern of firms’ appropriability of return in 2010 with inflation back to the pre-crisis inflation rate and the exchange rate fluctuation under control. Corporate tax rate and land rights do not appear to be constraints, but corruption, lack of dispute settlement mechanisms, limited law enforcement and tax administration are likely to be constraints on growth. The problem of limited self-discovery is also evident, but it does not appear to act as constraint on growth as the survival rate of new exported products stood at around 39.9 percent during 2000-2009.
The issue of poor coordination could be a constraint as confirmed by substantial evidence observed across sub-sectors of the economy. Despite skill mismatch in the labour market and low level of education of the workforce resulting in low returns to education, low human capital does not act as constraint on growth at aggregate level because labour is abundant. On the infrastructure side, there is evidence that inadequate road transport, poor logistic performance and high cost of electricity, are likely to be constraints on growth.

1CDRI Working Paper Series No. 80
1
INTRODUCTION
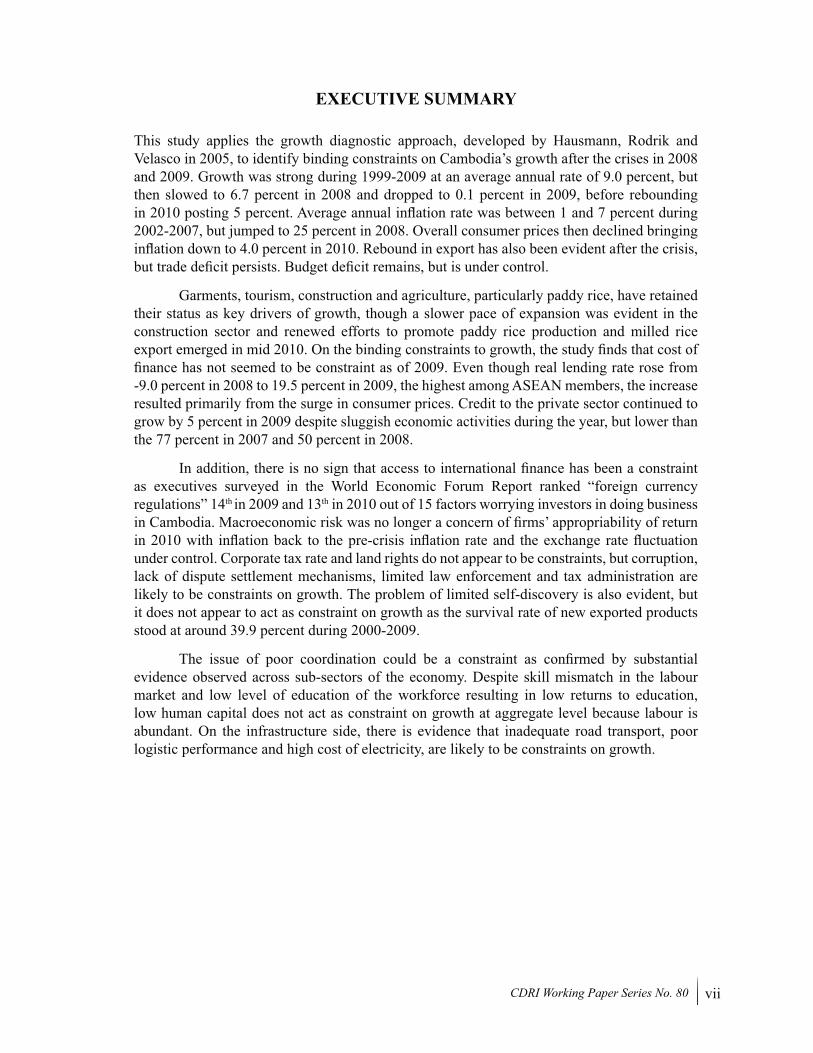
Despite its aid-dependent status, traditionally plagued by weak governance, corruption and limited institutional capacities (World Bank 2004a), Cambodia’s economic development has fared remarkably well during the last decade, even with the slowdown in 2008-2009. Real output growth was rapid averaging at 9.1 percent during 1998-2008 largely due to Cambodia’s macroeconomic and political stability, as well as regional and global prosperity during the period, regardless of the brake imposed by the Asian Financial Crisis in 1997-98 and the twin crises, namely high energy and food prices in 2008 and global financial crisis in 2009. Growth had been driven mainly by the drastic expansion of the manufacturing industry at an average annual rate of 14.4 percent during 1998-2008, dominated by textile and garment industry, and marked rise in tourism industry given significant and constant spike in number of tourist arrivals during the periods.
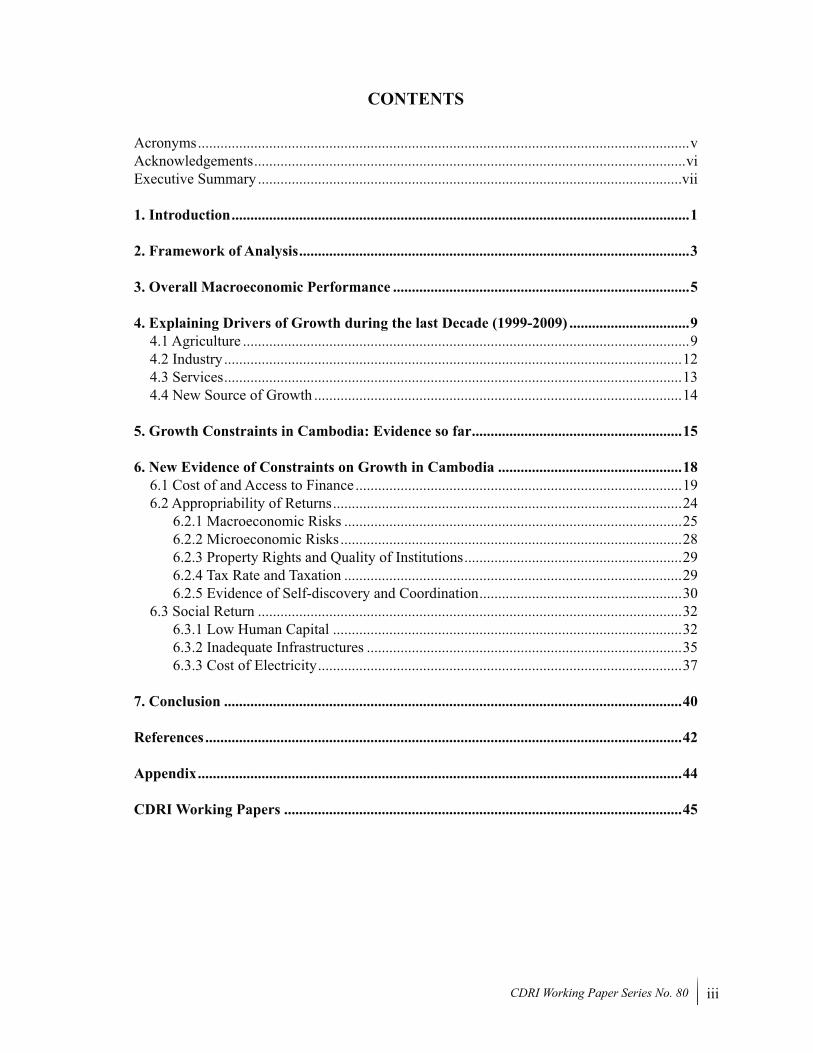
It is important to note that such vibrant and robust growth was hit hard by the twin crises, which significantly changed the strong and dynamic growth momentum of the country’s economy as growth nosedived from 10.2 percent in 2007 to 0.1 percent in 2009 plunging the three growth-enhancing pillars, namely garments, construction, and tourism, into deep contraction, which slackened the overall growth (Figure 1). Most severe cyclical impact is evident in garment industry given the considerable decline in export to the US and EU markets and the massive lay-off of garment workers in 2009. The banking sector has been insulated as its exposure to the international financial market is limited and the government’s countercyclical measures, such as change in reserve requirement, were also introduced during recession. Quick recovery was evident as output growth rebounded to 5 percent in 2010. Overall, the medium-term outlook appears promising, but the pace of growth since the crises has been slow and uneven across sectors.
Figure 1: Annual GDP Growth at 2000 price
9.1
6.45.4 5.6
5
11.9
8.88.1
6.6
8.5
10.3
13.3
10.810.2
6.7
.1
56
6.5 6.5 6.9 7
projection
0
3
6
9
12
15
annu
al %
grow
th of
gdp a
t 200
0 pric
e
1994
1995
1996
1997
1998
1999
2000
2001
2002
2003
2004
2005
2006
2007
2008
2009
2010
2011
2012
2013
2014
2015
Source: Ministry of Economy & Finance, 2010
2 Binding Constraints on Economic Growth in Cambodia: A Growth Diagnostic Approach
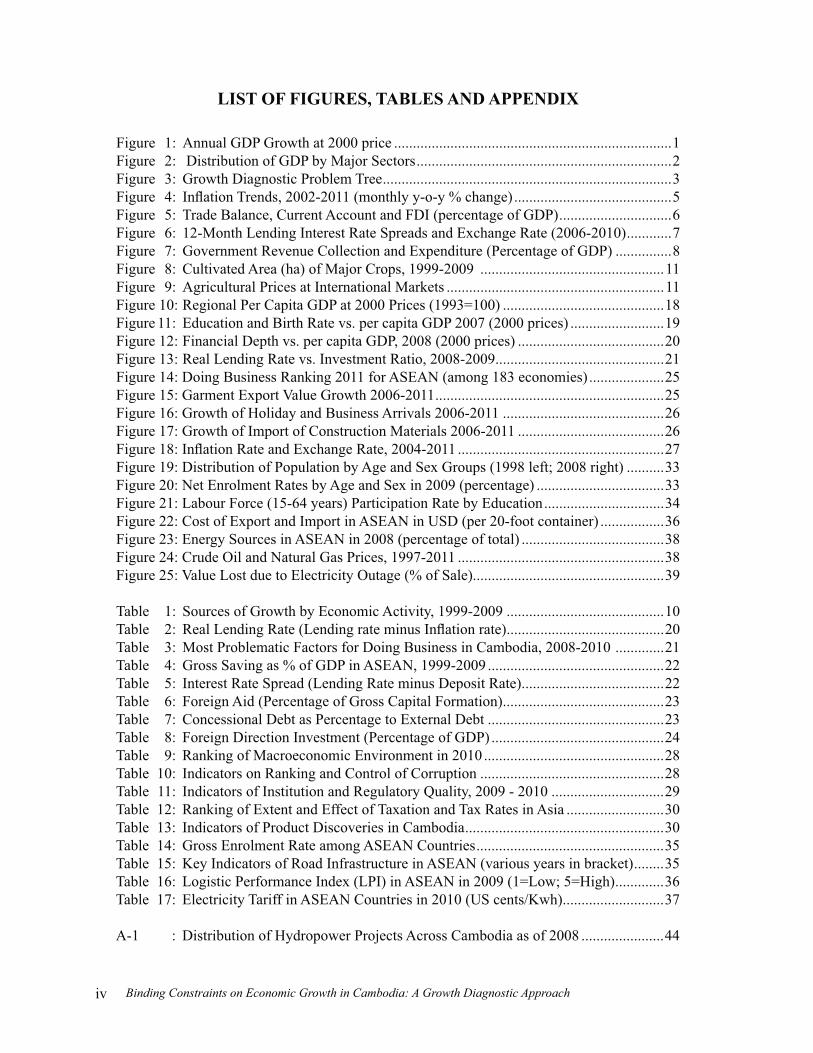
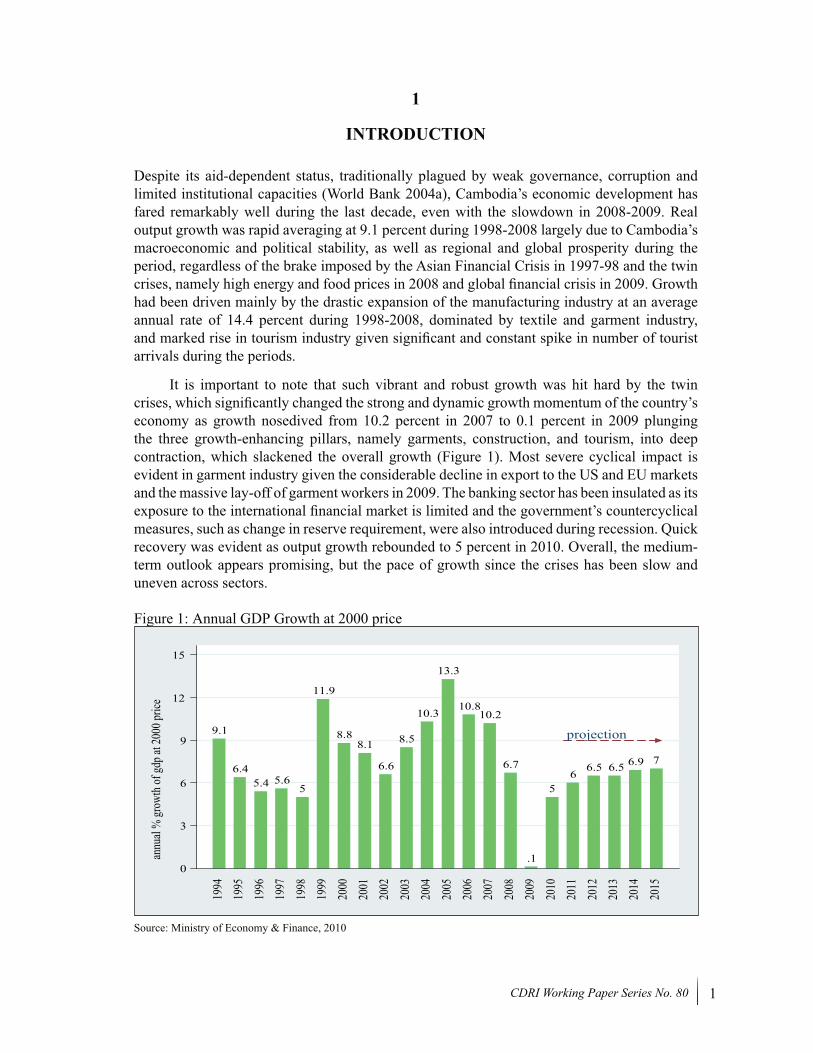
There has been notable transformation in the structure of Cambodia’s economy from a highly agrarian to a less agriculture-based one. As illustrated in Figure 2, share of agriculture to GDP declined markedly from approximately 50 percent in 1994 to around a third in 2009 and shares of industry and services to GDP rose constantly during the period. Cambodia’s impressive growth account during the last decade is particularly unique as the nation’s large stock of capital and intellectual resources was destroyed during the reign of the Khmer Rouge (1975-1979).
Figure 2: Distribution of GDP by Major Sectors
projection
Agriculture
Services
Industry
1020
3040
50
Perc
entag
e con
tribu
tion o
f majo
r sec
tors
to G
DP
1995 2000 2005 2010 2015
Source: Ministry of Economy and Finance 2010
This paper intends to explain the key drivers underlying the pace of growth during the period 1999 to 2009 drawing on existing literature and investigates the likely binding constraints on Cambodian growth by applying the growth diagnostic approach developed by Hausmann, Rodrik and Velasco in 2005, which is elaborated in Section 2. The country’s current overall macroeconomic performance is overviewed in Section 3 and sources/drivers of growth during the last decade are explained in section 4. Literature and studies on the sources of growth are reviewed in Section 5. Factors constraining growth are discussed in Section 6. Conclusion is made in Section 7.
3CDRI Working Paper Series No. 80
2
FRAMEWORK OF ANALYSIS
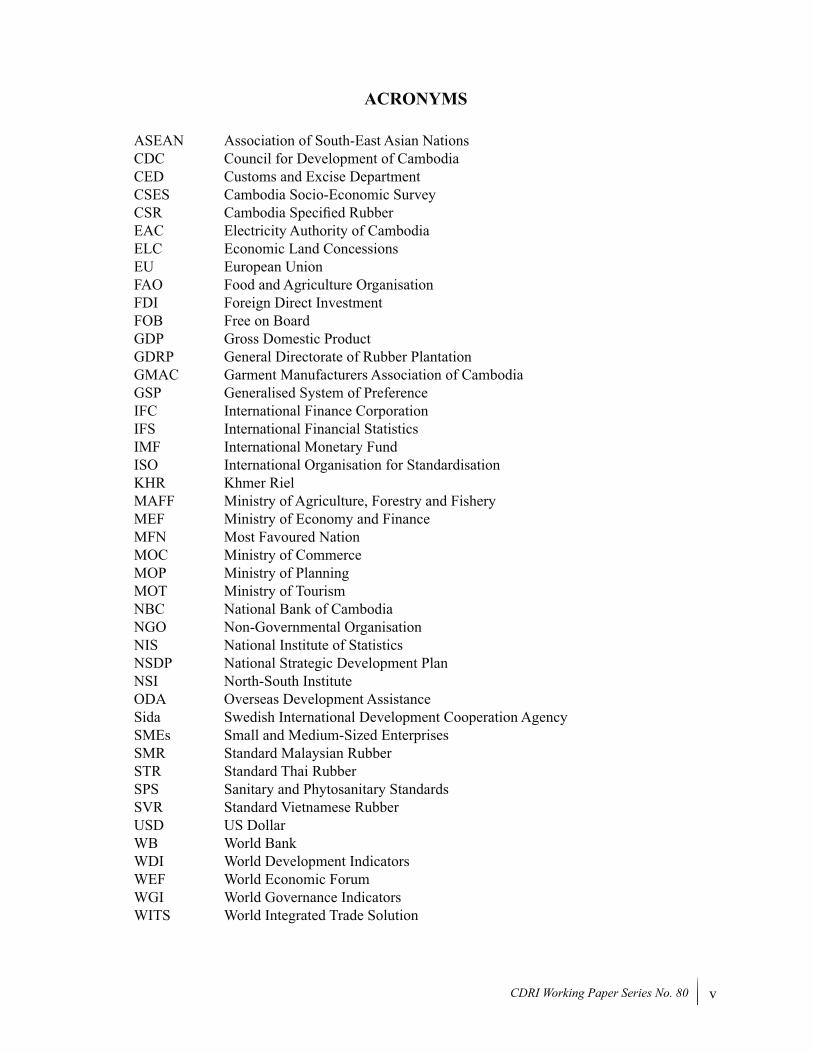
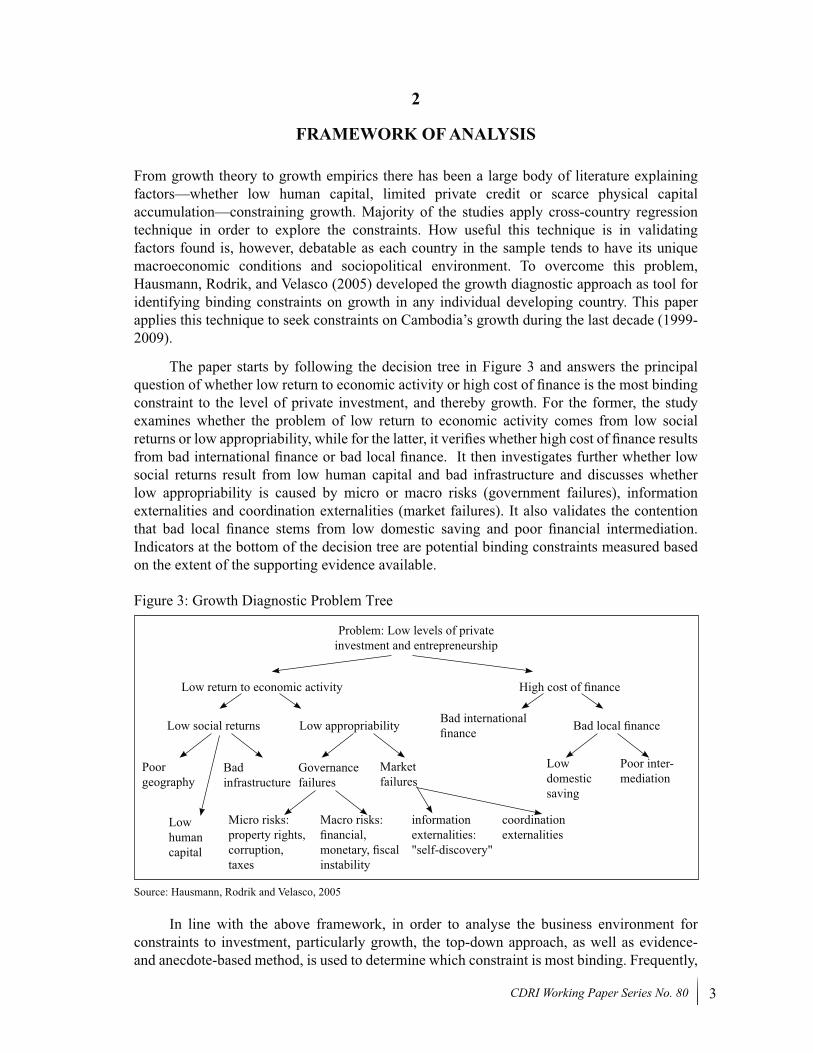
From growth theory to growth empirics there has been a large body of literature explaining factors—whether low human capital, limited private credit or scarce physical capital accumulation—constraining growth. Majority of the studies apply cross-country regression technique in order to explore the constraints. How useful this technique is in validating factors found is, however, debatable as each country in the sample tends to have its unique macroeconomic conditions and sociopolitical environment. To overcome this problem, Hausmann, Rodrik, and Velasco (2005) developed the growth diagnostic approach as tool for identifying binding constraints on growth in any individual developing country. This paper applies this technique to seek constraints on Cambodia’s growth during the last decade (1999-2009).
The paper starts by following the decision tree in Figure 3 and answers the principal question of whether low return to economic activity or high cost of finance is the most binding constraint to the level of private investment, and thereby growth. For the former, the study examines whether the problem of low return to economic activity comes from low social returns or low appropriability, while for the latter, it verifies whether high cost of finance results from bad international finance or bad local finance. It then investigates further whether low social returns result from low human capital and bad infrastructure and discusses whether low appropriability is caused by micro or macro risks (government failures), information externalities and coordination externalities (market failures). It also validates the contention that bad local finance stems from low domestic saving and poor financial intermediation. Indicators at the bottom of the decision tree are potential binding constraints measured based on the extent of the supporting evidence available.
Figure 3: Growth Diagnostic Problem Tree
Problem: Low levels of private investment and entrepreneurship
Low return to economic activity
Low social returns
Poor geography
Bad infrastructure
Governance failures
Micro risks: property rights, corruption, taxes
Macro risks: financial, monetary, fiscal instability
information externalities: "self-discovery"
coordination externalities
Market failures
Low domestic saving
Poor inter-mediation
Low human capital
Low appropriability Bad international finance Bad local finance
High cost of finance
Source: Hausmann, Rodrik and Velasco, 2005
In line with the above framework, in order to analyse the business environment for constraints to investment, particularly growth, the top-down approach, as well as evidence- and anecdote-based method, is used to determine which constraint is most binding. Frequently,
4 Binding Constraints on Economic Growth in Cambodia: A Growth Diagnostic Approach
regional benchmark and comparators, i.e. ASEAN nations, is utilised for constraint identification. It should be noted that given data limitations, the study at some points relies on findings in a previous study by the World Bank (WB 2009b). The details of data sources and indicators are presented below.
For key macroeconomic data: National accounts, public expenditures and investment, tax collection and administration, budget operation/balance, domestic saving, and inflation have been generated from the National Institute of Statistics (NIS), Ministry of Economy and Finance (MEF) and the World Development Indicators (WDI) of the World Bank. Data on exchange rate, domestic and private credit, deposit rate, interest rate on loan, interest rate spreads/premium, credit growth, current account balance, non-performing loan, and other relevant financial indicators have been collected from the National Bank of Cambodia (NBC) and the International Financial Statistics of the International Monetary Fund (IFS-IMF). Data on investment, either foreign or domestic, at aggregate level have been obtained from the Council for the Development of Cambodia (CDC). Trade data are from the Ministry of Commerce (MOC), World Integrated Trade Solution (WITS) of the World Bank and UN Commodity Trade.
Other sources & indicators include: Overall indicators of business environment are from the global competitiveness report of the World Economic Forum (WEF) and from the Doing Business Data of the World Bank. Data on regulatory environment and quality of institution have been retrieved from the World Governance Indicators (WGI) of the World Bank. Yields, prices, cultivation areas of agriculture products have been gathered from the Ministry of Agriculture, Forestry and Fishery (MAFF) and Food Agriculture Organisation (FAO). Trade infrastructure indicators are from the World Trade Indicators (WTI) & Doing Business Data of the World Bank.
5CDRI Working Paper Series No. 80
3
OVERALL MACROECONOMIC PERFORMANCE
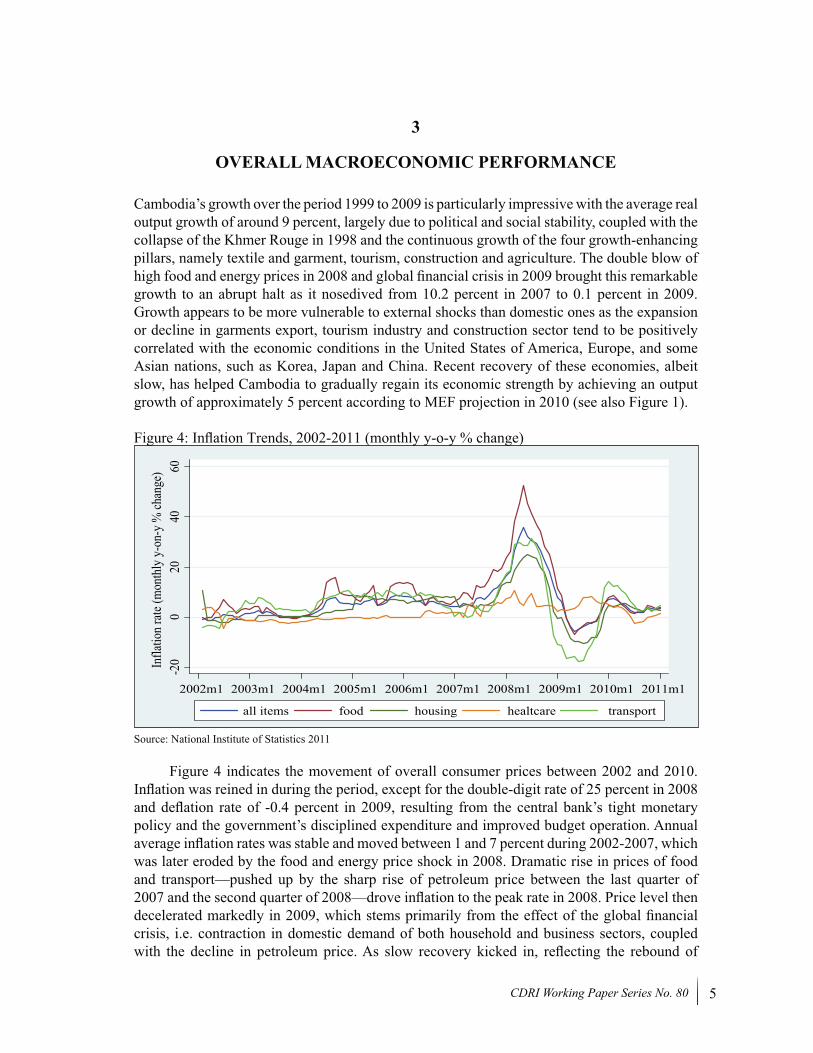
Cambodia’s growth over the period 1999 to 2009 is particularly impressive with the average real output growth of around 9 percent, largely due to political and social stability, coupled with the collapse of the Khmer Rouge in 1998 and the continuous growth of the four growth-enhancing pillars, namely textile and garment, tourism, construction and agriculture. The double blow of high food and energy prices in 2008 and global financial crisis in 2009 brought this remarkable growth to an abrupt halt as it nosedived from 10.2 percent in 2007 to 0.1 percent in 2009. Growth appears to be more vulnerable to external shocks than domestic ones as the expansion or decline in garments export, tourism industry and construction sector tend to be positively correlated with the economic conditions in the United States of America, Europe, and some Asian nations, such as Korea, Japan and China. Recent recovery of these economies, albeit slow, has helped Cambodia to gradually regain its economic strength by achieving an output growth of approximately 5 percent according to MEF projection in 2010 (see also Figure 1).
Figure 4: Inflation Trends, 2002-2011 (monthly y-o-y % change)
-20
020
4060
Infla
tion
rate
(mon
thly
y-o
n-y
% ch
ange
)
2002m1 2003m1 2004m1 2005m1 2006m1 2007m1 2008m1 2009m1 2010m1 2011m1
all items food housing healtcare transport
Source: National Institute of Statistics 2011
Figure 4 indicates the movement of overall consumer prices between 2002 and 2010. Inflation was reined in during the period, except for the double-digit rate of 25 percent in 2008 and deflation rate of -0.4 percent in 2009, resulting from the central bank’s tight monetary policy and the government’s disciplined expenditure and improved budget operation. Annual average inflation rates was stable and moved between 1 and 7 percent during 2002-2007, which was later eroded by the food and energy price shock in 2008. Dramatic rise in prices of food and transport—pushed up by the sharp rise of petroleum price between the last quarter of 2007 and the second quarter of 2008—drove inflation to the peak rate in 2008. Price level then decelerated markedly in 2009, which stems primarily from the effect of the global financial crisis, i.e. contraction in domestic demand of both household and business sectors, coupled with the decline in petroleum price. As slow recovery kicked in, reflecting the rebound of
6 Binding Constraints on Economic Growth in Cambodia: A Growth Diagnostic Approach
domestic and external demands, overall price level returned to the pre-crises level bringing the annual inflation rate of 4.0 percent in 2010.
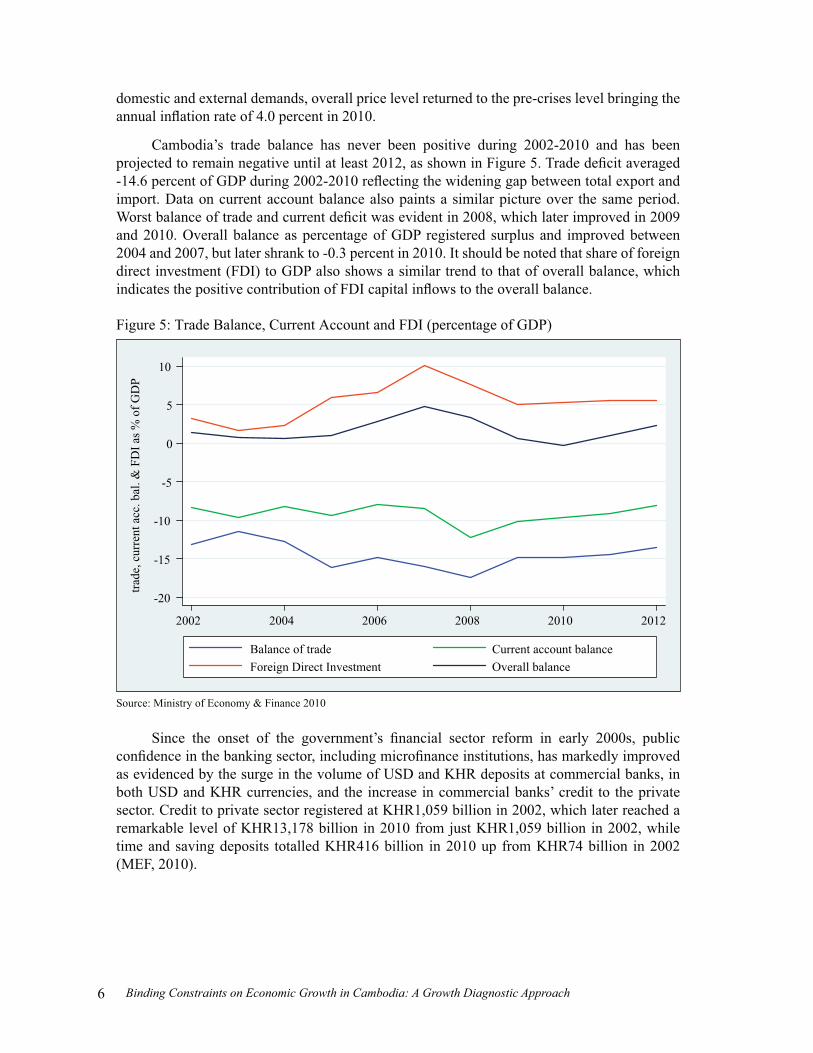
Cambodia’s trade balance has never been positive during 2002-2010 and has been projected to remain negative until at least 2012, as shown in Figure 5. Trade deficit averaged -14.6 percent of GDP during 2002-2010 reflecting the widening gap between total export and import. Data on current account balance also paints a similar picture over the same period. Worst balance of trade and current deficit was evident in 2008, which later improved in 2009 and 2010. Overall balance as percentage of GDP registered surplus and improved between 2004 and 2007, but later shrank to -0.3 percent in 2010. It should be noted that share of foreign direct investment (FDI) to GDP also shows a similar trend to that of overall balance, which indicates the positive contribution of FDI capital inflows to the overall balance.
Figure 5: Trade Balance, Current Account and FDI (percentage of GDP)
-20
-15
-10
-5
0
5
10
trade
, cur
rent
acc
. bal
. & F
DI a
s % o
f GD
P
2002 2004 2006 2008 2010 2012
Balance of trade Current account balanceForeign Direct Investment Overall balance
Source: Ministry of Economy & Finance 2010
Since the onset of the government’s financial sector reform in early 2000s, public confidence in the banking sector, including microfinance institutions, has markedly improved as evidenced by the surge in the volume of USD and KHR deposits at commercial banks, in both USD and KHR currencies, and the increase in commercial banks’ credit to the private sector. Credit to private sector registered at KHR1,059 billion in 2002, which later reached a remarkable level of KHR13,178 billion in 2010 from just KHR1,059 billion in 2002, while time and saving deposits totalled KHR416 billion in 2010 up from KHR74 billion in 2002 (MEF, 2010).
7CDRI Working Paper Series No. 80
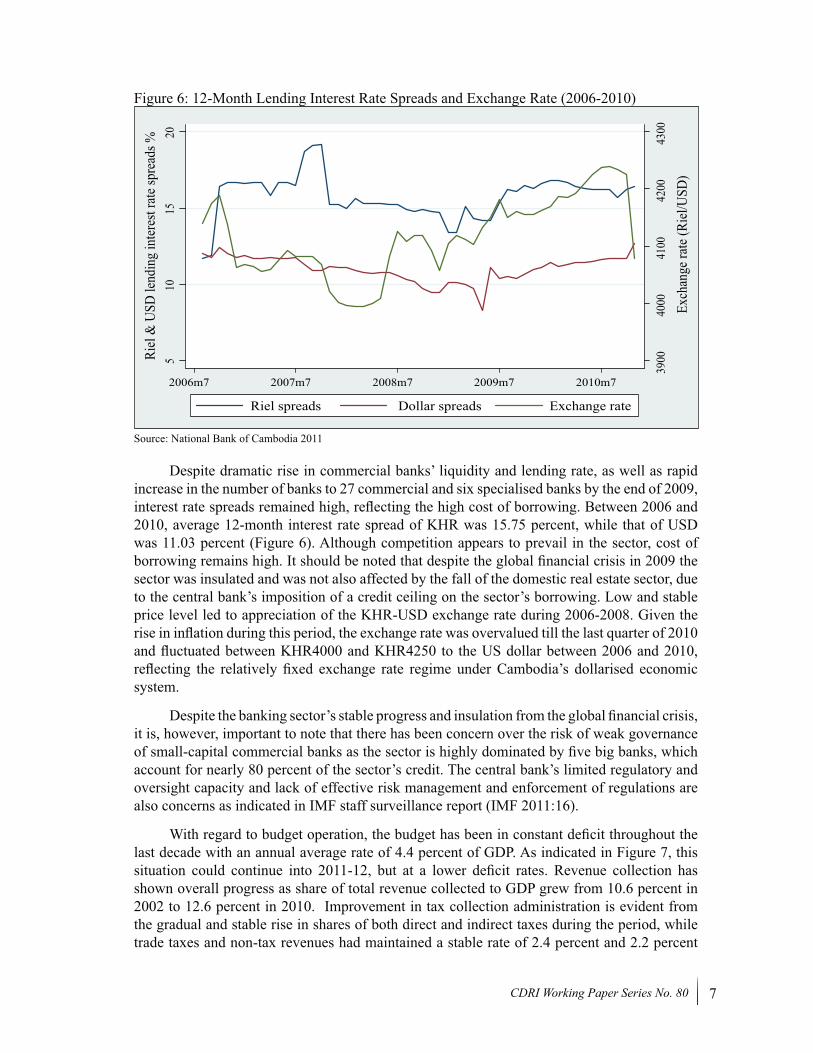
Figure 6: 12-Month Lending Interest Rate Spreads and Exchange Rate (2006-2010)
3900
4000
4100
4200
4300
Exch
ange
rate
(Riel
/USD
)
510
1520
Riel
& U
SD le
ndin
g in
teres
t rate
spre
ads %
2006m7 2007m7 2008m7 2009m7 2010m7
Riel spreads Dollar spreads Exchange rate
Source: National Bank of Cambodia 2011
Despite dramatic rise in commercial banks’ liquidity and lending rate, as well as rapid increase in the number of banks to 27 commercial and six specialised banks by the end of 2009, interest rate spreads remained high, reflecting the high cost of borrowing. Between 2006 and 2010, average 12-month interest rate spread of KHR was 15.75 percent, while that of USD was 11.03 percent (Figure 6). Although competition appears to prevail in the sector, cost of borrowing remains high. It should be noted that despite the global financial crisis in 2009 the sector was insulated and was not also affected by the fall of the domestic real estate sector, due to the central bank’s imposition of a credit ceiling on the sector’s borrowing. Low and stable price level led to appreciation of the KHR-USD exchange rate during 2006-2008. Given the rise in inflation during this period, the exchange rate was overvalued till the last quarter of 2010 and fluctuated between KHR4000 and KHR4250 to the US dollar between 2006 and 2010, reflecting the relatively fixed exchange rate regime under Cambodia’s dollarised economic system.
Despite the banking sector’s stable progress and insulation from the global financial crisis, it is, however, important to note that there has been concern over the risk of weak governance of small-capital commercial banks as the sector is highly dominated by five big banks, which account for nearly 80 percent of the sector’s credit. The central bank’s limited regulatory and oversight capacity and lack of effective risk management and enforcement of regulations are also concerns as indicated in IMF staff surveillance report (IMF 2011:16).
With regard to budget operation, the budget has been in constant deficit throughout the last decade with an annual average rate of 4.4 percent of GDP. As indicated in Figure 7, this situation could continue into 2011-12, but at a lower deficit rates. Revenue collection has shown overall progress as share of total revenue collected to GDP grew from 10.6 percent in 2002 to 12.6 percent in 2010. Improvement in tax collection administration is evident from the gradual and stable rise in shares of both direct and indirect taxes during the period, while trade taxes and non-tax revenues had maintained a stable rate of 2.4 percent and 2.2 percent
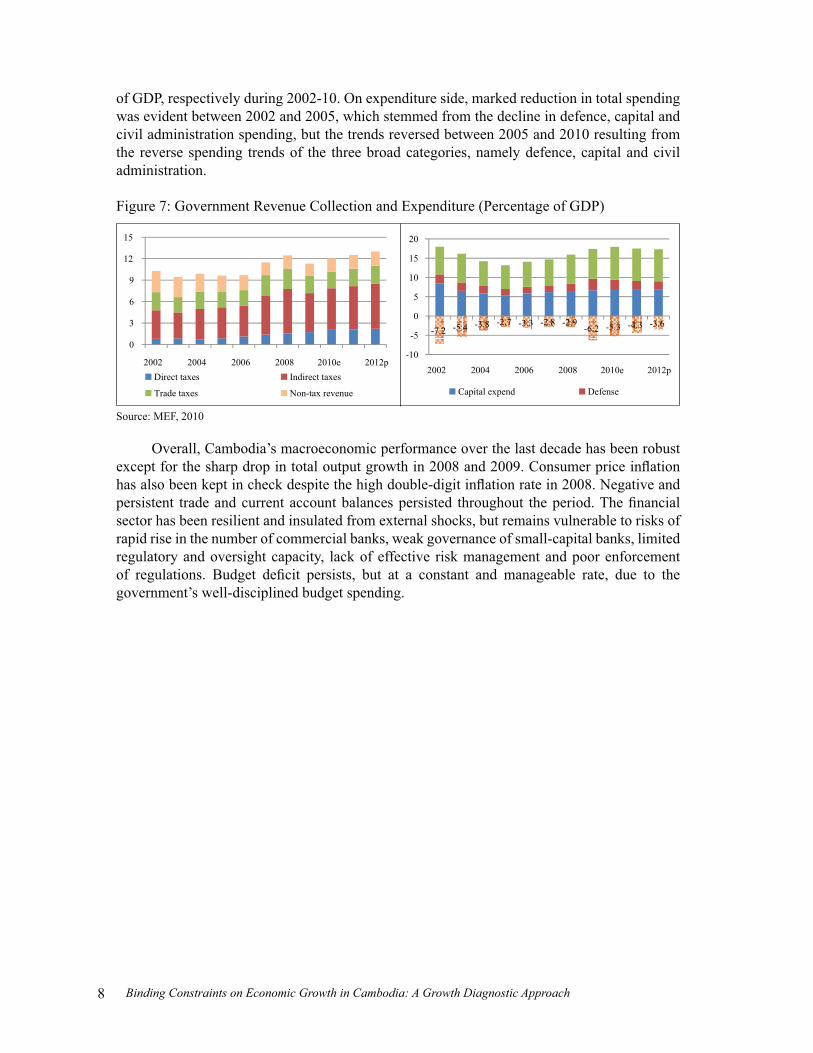
8 Binding Constraints on Economic Growth in Cambodia: A Growth Diagnostic Approach
of GDP, respectively during 2002-10. On expenditure side, marked reduction in total spending was evident between 2002 and 2005, which stemmed from the decline in defence, capital and civil administration spending, but the trends reversed between 2005 and 2010 resulting from the reverse spending trends of the three broad categories, namely defence, capital and civil administration.
Figure 7: Government Revenue Collection and Expenditure (Percentage of GDP)
0
3
6
9
12
15
2002 2004 2006 2008 2010e 2012pDirect taxes Indirect taxes
Trade taxes Non-tax revenue
-7.2 -5.4 -3.8 -2.7 -3.3 -2.8 -2.9-6.2 -5.3 -4.3 -3.6
-10
-5
0
5
10
15
20
2002 2004 2006 2008 2010e 2012p
Capital expend Defense
Source: MEF, 2010
Overall, Cambodia’s macroeconomic performance over the last decade has been robust except for the sharp drop in total output growth in 2008 and 2009. Consumer price inflation has also been kept in check despite the high double-digit inflation rate in 2008. Negative and persistent trade and current account balances persisted throughout the period. The financial sector has been resilient and insulated from external shocks, but remains vulnerable to risks of rapid rise in the number of commercial banks, weak governance of small-capital banks, limited regulatory and oversight capacity, lack of effective risk management and poor enforcement of regulations. Budget deficit persists, but at a constant and manageable rate, due to the government’s well-disciplined budget spending.
9CDRI Working Paper Series No. 80
4
EXPLAINING DRIVERS OF GROWTH DURING THE LAST DECADE (1999-2009)
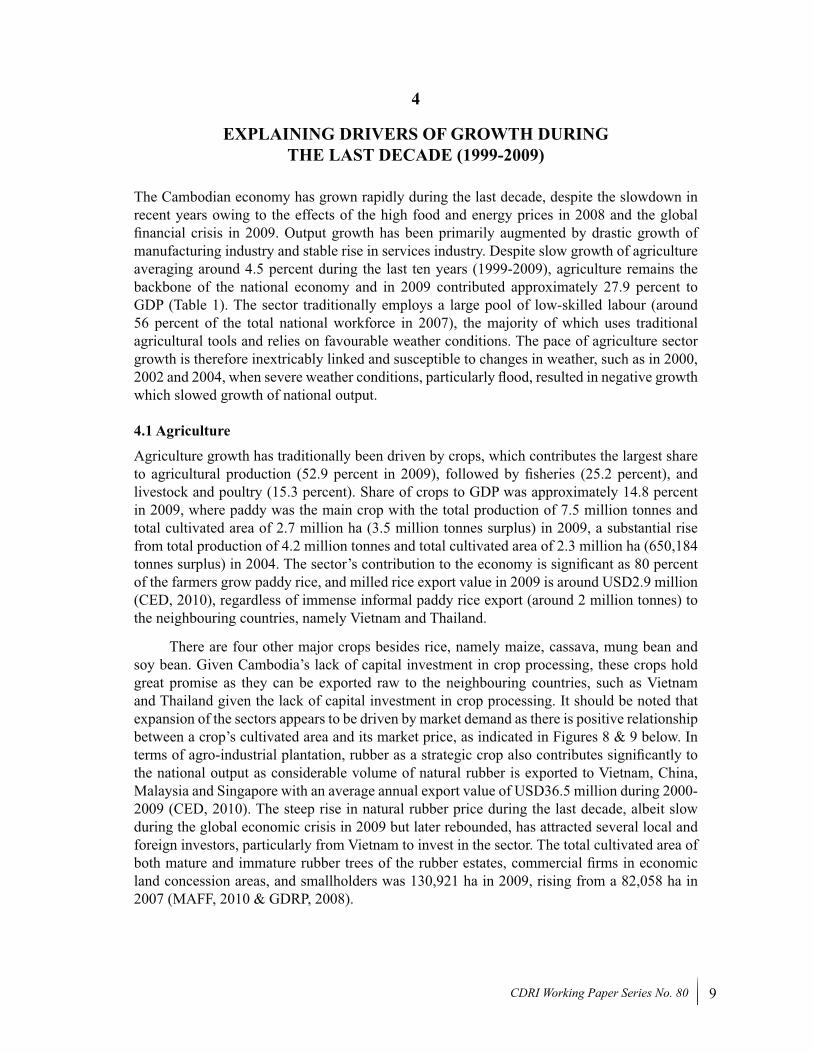
The Cambodian economy has grown rapidly during the last decade, despite the slowdown in recent years owing to the effects of the high food and energy prices in 2008 and the global financial crisis in 2009. Output growth has been primarily augmented by drastic growth of manufacturing industry and stable rise in services industry. Despite slow growth of agriculture averaging around 4.5 percent during the last ten years (1999-2009), agriculture remains the backbone of the national economy and in 2009 contributed approximately 27.9 percent to GDP (Table 1). The sector traditionally employs a large pool of low-skilled labour (around 56 percent of the total national workforce in 2007), the majority of which uses traditional agricultural tools and relies on favourable weather conditions. The pace of agriculture sector growth is therefore inextricably linked and susceptible to changes in weather, such as in 2000, 2002 and 2004, when severe weather conditions, particularly flood, resulted in negative growth which slowed growth of national output.
4.1 Agriculture
Agriculture growth has traditionally been driven by crops, which contributes the largest share to agricultural production (52.9 percent in 2009), followed by fisheries (25.2 percent), and livestock and poultry (15.3 percent). Share of crops to GDP was approximately 14.8 percent in 2009, where paddy was the main crop with the total production of 7.5 million tonnes and total cultivated area of 2.7 million ha (3.5 million tonnes surplus) in 2009, a substantial rise from total production of 4.2 million tonnes and total cultivated area of 2.3 million ha (650,184 tonnes surplus) in 2004. The sector’s contribution to the economy is significant as 80 percent of the farmers grow paddy rice, and milled rice export value in 2009 is around USD2.9 million (CED, 2010), regardless of immense informal paddy rice export (around 2 million tonnes) to the neighbouring countries, namely Vietnam and Thailand.
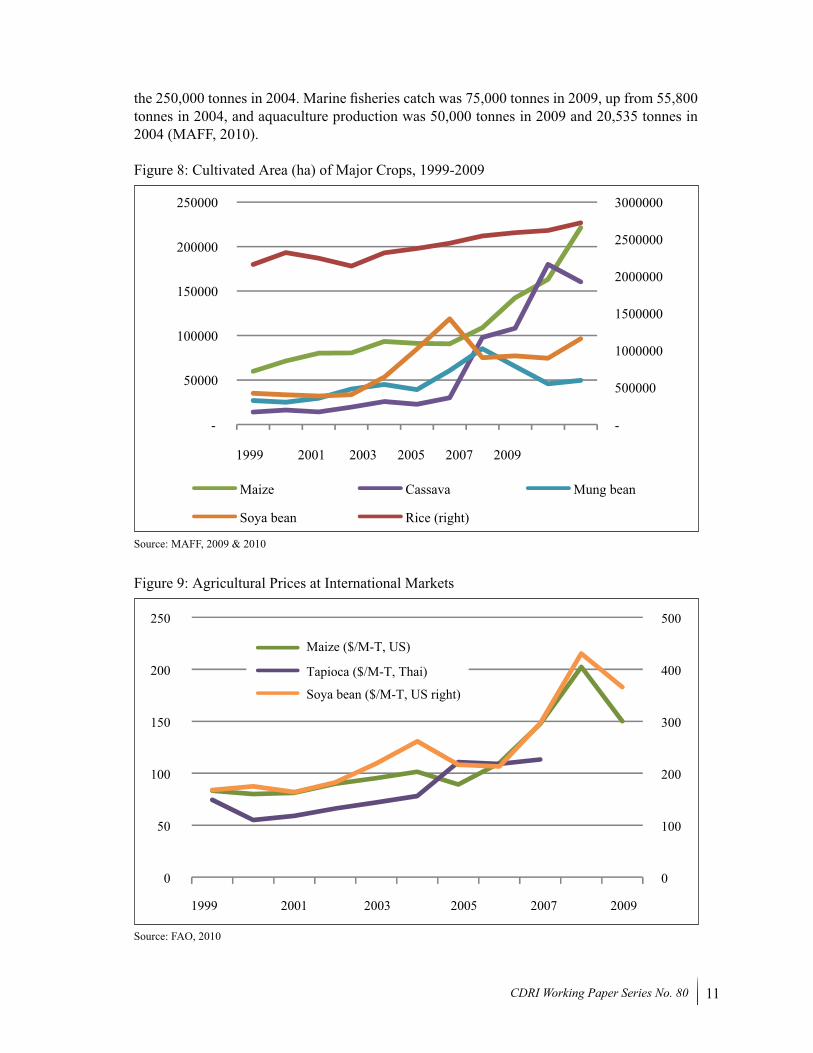
There are four other major crops besides rice, namely maize, cassava, mung bean and soy bean. Given Cambodia’s lack of capital investment in crop processing, these crops hold great promise as they can be exported raw to the neighbouring countries, such as Vietnam and Thailand given the lack of capital investment in crop processing. It should be noted that expansion of the sectors appears to be driven by market demand as there is positive relationship between a crop’s cultivated area and its market price, as indicated in Figures 8 & 9 below. In terms of agro-industrial plantation, rubber as a strategic crop also contributes significantly to the national output as considerable volume of natural rubber is exported to Vietnam, China, Malaysia and Singapore with an average annual export value of USD36.5 million during 2000-2009 (CED, 2010). The steep rise in natural rubber price during the last decade, albeit slow during the global economic crisis in 2009 but later rebounded, has attracted several local and foreign investors, particularly from Vietnam to invest in the sector. The total cultivated area of both mature and immature rubber trees of the rubber estates, commercial firms in economic land concession areas, and smallholders was 130,921 ha in 2009, rising from a 82,058 ha in 2007 (MAFF, 2010 & GDRP, 2008).
10 Binding Constraints on Economic Growth in Cambodia: A Growth Diagnostic Approach
Table 1: Sources of Growth by Economic Activity, 1999-2009
SectorValue
added 1999 (bill. KHR)
Share of GDP 1999
Value added 2009 (bill. KHR)
Share of GDP 2009
Growth 1999-09
Share employment
2007Agriculture, Fishery & Forestry 5078 39.2% 7995 27.9% 4.5% 55.9%Crops 2210 17.1% 4233 14.8% 7.6% -Livestock & poultry 861 6.7% 1221 4.3% 3.3% -Fisheries 1443 11.1% 2014 7.0% 2.9% -Forestry & logging 563 4.3% 526 1.8% -1.7% -Industry 2346 18.1% 7123 24.8% 13.0% 15.4%Mining 27 0.2% 151 0.5% 20.3% 0.3%Manufacturing 1731 13.4% 4800 16.7% 12.1% 11.3%
Food, beverage & tobacco 468 3.6% 581 2.0% 2.5% -Textile, wearing apparel & footwear 771 6.0% 3963 13.8% 21.2% -Wood, paper & publishing 147 1.1% 116 0.4% -1.8% -Rubber manufacturing 63 0.5% 70 0.2% 2.6% -Other manufacturing 282 2.2% 651 2.3% 9.5% -
Electricity, gas & water 54 0.4% 178 0.6% 12.3% 0.2%Construction 535 4.1% 1994 6.9% 15.8% 3.6%Services 4084 37.1% 11478 40.0% 9.6% 28.7%Trade 1447 11.2% 2558 8.9% 5.8% 14.3%Hotel & restaurants 438 3.4% 1335 4.7% 13.6% 1.0%Transport & communications 877 6.8% 1817 6.3% 9.6% 2.7%Finance 128 1.0% 490 1.7% 16.4% 0.4%Public administration 380 2.9% 352 1.2% -0.7% 2.2%Real estate & business 797 6.2% 2104 7.3% 10.2% 0.2%Other services 738 5.7% 2821 9.8% 16.0% 7.9%Taxes on products less subsidies 833 6.4% 2480 8.6% 14.7% -Less: Subsidies 11 0.1% 37 0.1% 21.7% -Less: Finance service charge 113 0.9% 383 1.3% 11.6% -Total GDP 12947 100.0% 28692 100.0% 8.7% 100.0%
Sources: MEF, 2010 & NIS, 2008 cited in IMF, 2009 pp. 3
Livestock accounted for only 4.3 percent of GDP in 2009. Key products in this sector include cattle, buffalo, pigs and poultry. In 2009 buffalo contributed the smallest share with the total production of 739,646 heads, followed by pigs (2,126,304 heads) and cattle with the largest share (3,579,882 heads). There is potential for growth in the export of cattle to Vietnam and Thailand, but the domestic pig market faces rising competition from imported pigs from Vietnam. The constant surge in poultry production during the last five years is a result of the introduction of better preventative measures against such disease as bird flu in the early 2000s. Average annual production growth of poultry between 2005 and 2009 was 7.8 percent, whereas in 2009 it stood at around 19.3 percent (MAFF, 2010).
Fisheries sector contributed to about 7 percent of total national output in 2009 and had an average annual production growth of around 3.0 percent between 1999 and 2009. The sector’s total production consists of products from inland fisheries, marine fisheries and aquaculture activities. Inland/ freshwater fisheries produce the largest share of the annual catch as Cambodia has the Tonle Sap Lake, a vast freshwater lake covering 270 km2 in the dry season and 16,000 km2 in the wet season, as well as a 480 km stretch of the Mekong River from the border with Laos to the border with Vietnam. Total fish production in 2009 was 390,000 tonnes, higher than
11CDRI Working Paper Series No. 80
the 250,000 tonnes in 2004. Marine fisheries catch was 75,000 tonnes in 2009, up from 55,800 tonnes in 2004, and aquaculture production was 50,000 tonnes in 2009 and 20,535 tonnes in 2004 (MAFF, 2010).
Figure 8: Cultivated Area (ha) of Major Crops, 1999-2009
500000
--
1000000
1500000
2000000
2500000
3000000
50000
100000
150000
200000
250000
1999 2001 2003 2005 2007 2009
Maize Cassava Mung bean
Soya bean Rice (right)
Source: MAFF, 2009 & 2010
Figure 9: Agricultural Prices at International Markets
0
100
200
300
400
500
0
50
100
150
200
250
1999 2001 2003 2005 2007 2009
Maize ($/M-T, US)
Tapioca ($/M-T, Thai) Soya bean ($/M-T, US right)
Source: FAO, 2010
12 Binding Constraints on Economic Growth in Cambodia: A Growth Diagnostic Approach
Forestry and logging account for 1.8 percent of the total national output with the average growth of -1.7 percent over 1999-2009. Forestry had played a vital role generating income for the country during the 1990s, a time when illegal logging was rampant, but since the government’s crackdown on illegal logging activities and the introduction of the moratorium of logging activities and appropriation of around half of the total number of forest concessions in early 2000s there has been significant decline in tree-felling and export of timber and forest products.
4.2 Industry
Industry accounted for about 24.8 percent of the national output in 2009, a marked rise from 18.1 percent in 1999. Average growth of the sector during this period was approximately 13 percent, which is substantial. This indicates the sector’s significant contribution to the national economy. In terms of share of value added, textiles, wearing apparel and footwear account for largest share of 13.8 percent in 2009, up from 6.0 percent in 1999, followed by construction (6.0 percent) and food, beverages and tobacco (2.0 percent) in 2009. However, in terms of the number of small and medium-size enterprises, food, beverages and tobacco has the largest share (26,379 enterprises) in 2007 (NIS, 2008).
The textile and footwear sector is one of the four main pillars of the national economy. The sector’s average annual growth was remarkably high at 21.2 percent over 1999-2009. It has contributed considerably to the country’s total production through employment creation and export earnings (export). With preferential treatment, such as Most Favoured Nation status (MFN) and Generalised System of Preference (GSP) from the US and EU, (ended in early 2005), as well as abundant cheap labour and good labour standard compliance, the sector has expanded rapidly during the last decade and a half. The industry employed around 290,000 workers in May 2009 (MOC, 2009) and annual export earnings from clothing reached USD2.4 billion in 2009, where 65.6 percent of garment export was destined for the US and 21.9 percent to the EU (CED, 2010).
Food, beverages and tobacco accounts for only 2 percent of GDP with average annual growth of 2.5 percent over 1999-2009. The sluggish expansion of the sector could be attributed to persistent and strong competition from cheaper products imported from Thailand and Vietnam, where infrastructure and services such as electricity, internet, mobile phone and transport are more reliable and costs are lower.
Electricity and gas grew rapidly at an average annual growth rate of 12. 3 percent between 1999 and 2009, but accounted for only 0.6 percent of national output in 2009 against 0.4 percent in 1999. Despite rapid expansion of the sector, it is still unable to meet the increasing demand of the overall population and business enterprises. To cope with rising demand, Cambodia imports electricity from neighbouring Thailand and Vietnam.
Mining sector also made dramatic growth with average annual growth rate of 20.3 percent over 1999-2009, but its share to GDP in 2009 remained tiny at 0.5 percent, up from 0.2 percent in 1999. The sector could generate huge windfalls to the economy once revenue starts to flow from the petroleum industry where a number of international oil mining companies are exploring both on-shore and off-shore reserves.
Construction—one of the four growth-enhancing sectors—marked spectacular growth during the last decade with an average annual rate of 15.8 percent over 1999-2009 and accounted for almost 7 percent of GDP in 2009, up from the 4.1 percent share to GDP in 1999.
13CDRI Working Paper Series No. 80
The sector’s boom became evident in the early 2000s, but decelerated just after the national election (lower-house election) in late 2007, which could be attributed to the slump in business confidence resulting from the political impasse in forming a coalition government among the three main political parties, Cambodian People’s Party, Sam Rainsy Party and Funcinpec Party. The sector continued to stagnate further as it was also struck by the global financial crisis in 2009.
4.3 Services
Services sector accounted for 40 percent of the national output in 2009, higher than the 37.1 percent share to GDP in 1999. Its average annual growth rate during 1999-2009 was 9.6 percent. Key features of the sector include trade, hotels and restaurants, transport and communications, finance, public administration and real estate and business.
Trade accounted for around 9 percent of GDP in 2009, with an average yearly growth rate of 5.8 percent between 1999 and 2009. The sector’s pace of growth has been driven by both international and domestic trading activities. The increase in cross-border and beyond the border trade flows result from Cambodia’s success in re-integrating itself into region (a member of ASEAN in 1999) and the world (a member of WTO in 2004), while at the same time the considerable surge in household income has benefited from domestic trade (World Bank 2009b, p.9).
The hotel and restaurant sector’s share of GDP was 4.7 percent in 2009, higher than the 3.4 percent in 1999. Average annual growth of the sector over 1999-2009 is 13.6 percent, indicating rapid pace of expansion. This growth in hospitality industry stems primarily from the surge in service demand of foreign visitor arrivals in Cambodia, particularly in Siem Reap province, a cultural tourist site home to hundreds of ancient Khmer temples. The total number of tourist arrivals grew remarkably from 367,743 in 1999 to 2,125,465 in 2008 (MOT 2009). There is also rising local tourist demand for such services from local tourist due to improved roads and increasing availability of domestic package tours.
Transport and communication contributed 6.3 percent of GDP in 2009 and average annual growth over 1999-2009 was 9.6 percent. The sector’s sources of growth are tourism and trade. The telecommunications sector has grown rapidly during the last five years, but particularly mobile phone and internet, except for fixed phone services. As of early 2008, there were six mobile phone operators and 12 internet service providers (CDRI 2010:205).
Finance sector accounted for 1.7 percent of the national output in 2009, with the annual average growth rate of 16.4 percent over 1999-2009. Growth has been rapid during the last couple of years and driven by banking sub-sector, which is a dominant industry in the financial sector as insurance sub-sector remains at its initial stage of development. By the end of 2009, the banking sub-sector comprised of 27 commercial banks (up from 15 in 2006), 6 specialised banks and 20 licensed microfinance institutions (NBC 2009:1).
Real estate and business accounted for 7.3 percent of the 2009 GDP and growth has been quite impressive with the average annual rate of 10.2 percent over 1999-2009. The sector’s expansion is in line with the development pace of construction sector.
14 Binding Constraints on Economic Growth in Cambodia: A Growth Diagnostic Approach
4.4 New Source of Growth
Obviously, during the last decade there have been four traditional sectors, which have played a vital growth-enhancing role in Cambodian economy. Textiles and clothing has been the leading factor in augmenting national output growth, followed by tourism, as reflected in the development of hospitality and transport industries, construction and agriculture, namely paddy. These four sectors depend substantially on regional and global demand, which makes growth vulnerable to regional and global shocks.
The global financial crisis which was felt in late 2008 has put these sectors’ resilience to the test, where garments was hit hardest followed by construction and tourism. In contrast, agriculture was not hit as severely as the three other sectors. Rice accounts for around 50 percent of total crop production; 7.5 million tonnes of paddy were produced in 2009 with 3.5 million tonnes surplus (paddy rice conversion ratio is around 64 percent), which could be processed for export. However, official statistics indicates that only around 13,000 tonnes of milled rice were exported in 2009, reflecting the lack of domestic processing and warehousing capacity.
Recognising the agricultural sector’s resilience and potential and realising the importance of broadening the country’s narrow-based economy, the government has renewed its interest in its development by promoting rice production and export. In doing so, the government has compiled the “Policy Document on Paddy Rice Production and Export of Milled Rice” which sets out its vision for producing paddy surplus of more than 4 million tonnes and milled rice export of at least 1 million tonnes and ensuring that Cambodian rice is internationally recognised.
Key specific objectives of the policy measures cover four broad dimensions as follows1:
Paddy rice production:• increase paddy rice productivity by using high yielding seeds and modern farming techniques; continue to expand irrigation, build and maintain rural roads; promote micro-credit for agriculture; and promote and establish farmer organisations; and give priority to delivering land titles in the potential rice production areas and classify land zones;
Paddy rice collection and processing:• encourage private sector to invest in paddy rice processing and milled rice export; continue financing for paddy rice collection; provide support and strengthen the Rice Milling Association; create new financial instruments and leverage mechanism for financing; consider establishing an Agriculture Development Bank; and reduce electricity price and extend coverage areas;
Improvement of logistics: • enhance trade facilitation, reduce informal fees and eliminate illegal check points; implement a single-stop service for export processing; address grading and quality issues to comply with internationally-recognised standards; invest in necessary infrastructure to reduce costs of export;
Marketing of milled rice: • explore opportunities in regional and global markets; establish a Rice Market Intelligence Unit; develop framework for information sharing among stakeholders in domestic markets; and prepare a strategic market penetration plan to improve Cambodia’s competitiveness in the region and the world.
1 SNEC (2010), “Policy Document on Promotion of Paddy Rice Production and Export of Milled Rice”
15CDRI Working Paper Series No. 80
5
GROWTH CONSTRAINTS IN CAMBODIA: EVIDENCE SO FAR
There have been a number of studies on growth constraints in Cambodia during past years. The first exercise on the examination of constraints to the country’s economic growth is in Chapter 4 of the World Bank’s poverty assessment of Cambodia (World Bank 2006). Rather than applying a macro level analysis, the report emphasises the poverty-reducing role of agriculture and agribusiness and applies the growth diagnostic approach developed by Hausman, Rodrik, and Velsaco (2005) to explore binding constraints to growth of agriculture and agribusiness sector growth.
With regard to the agriculture sector, the primary binding constraint is weak private appropriability of returns from ill-defined property rights, while the second main constraint is low social returns from poor infrastructure and low human capital stock. Insecurity in land tenure is widespread and hinders private investment as investment in agriculture, such as land clearance, installation of irrigation facilities, soil enrichment/balancing, cropping and crop maintenance, is a long-term process. Lack of land title prevents land owners from using land tenure as collateral to access formal credit. The report also underlines the vague and unofficial nature of land tenure, which stems primarily from the allocation of state-owned land to military units for demobilisation and business associates so as to consolidate political hegemony (WB 2006a:74). Weakness in the framework for tenure security was also found to be one of the main disincentives to investment.
The secondary constraint is that of underdeveloped and inadequate small-scale irrigation facilities as well as insufficient complementary public services, which create a bottleneck to improving agricultural productivity, one of the determinants of social return. Around 44 percent of farm plots had no irrigation in either wet or dry season in 2004 (World Bank 2006a:90). Farm productivity is further constrained by limited access to road infrastructure and transport. Stock of human capital remained low as the percentage of adults aged 25 and above that had completed primary education in Cambodia was twice as low as those in Indonesia, Philippines and Vietnam; also, late entry, repetition and dropout rates, albeit declining, remained high (World Bank 2006a:97). Quality of education is another impediment to social return as reflected in pupil-teacher ratios, which in 2004 were the highest in the region for primary education and the third worst for secondary education (World Bank 2006a:101).
On agribusiness, two binding constraints stand out in order of significance, namely governance and high cost of finance. Informal fees which are uncertain and cumbersome are prevalent across the sub-sector, reducing firms’ ability to produce viable business plans and accurately finance new investments. As indicated in the World Bank assessment report on the investment climate in Cambodia in 2004, informal payments for licensing, securing access to domestic markets, trade facilitation and carrying out economic activities in general were frequent (82 percent of responding firms) and substantial (5 percent of sales revenue) (World Bank 2004 cited in World Bank 2006a:76). High interest rate spreads coupled with short loan maturities in the formal capital market made quasi-formal enterprises depend largely on retained earnings and informal sources of finance, such as family and friends at higher rates (Development Consulting International 2003, cited in World Bank 2006a:76).
16 Binding Constraints on Economic Growth in Cambodia: A Growth Diagnostic Approach
The growth diagnostic framework was applied by the World Bank for the second time in its latest report on “Sustaining Rapid Growth in a Challenging Environment” (World Bank 2009b: Ch 6). The report aims primarily to identify constraints that explain low levels of investment and low diversification. Following the framework, it touches on three major issues, namely access to finance, cost of factors in connection with level of social returns, and appropriability.
On the cost of and access to finance, as of mid 2008 at aggregate level it is unlikely that the financial sector acts as a constraint to output growth. The World Bank’s investment climate report in 2009 confirms that only a small proportion of firms in the survey consider access to and cost of finance as a severe constraint in the business environment. It is, however, important to note that it could be an obstacle to growth-enhancing sectors, such as construction and agriculture. That credit supply for investment in construction is limited is indicated by the negative correlation between real interest rate and investment in the sector. In 2008, agriculture received only 5 percent of the private sector’s total loan portfolio, which induced many farmers to source finance from informal sources with high interest rate (NBC 2008). Limited access to formal finance could be attributed to problems of land titling as collateral, and inflexible loan repayment requirements for certain agricultural crops, particularly agro-forestry. Low rate of saving compared with other countries in the region is also evident, which makes business enterprises dependent on external/overseas financing.
A number of factors were identified in the analysis and considered to be likely growth constraints. Electricity cost appears to be a constraint as there is high incidence of generator use and high electricity tariff, which is confirmed by electricity-intensive industries. Cost of electricity ranges from USD0.18 per Kw in urban areas to USD0.30-0.90 per Kw in rural areas, higher than in neighbouring countries where the tariff is below USD0.10 (World Bank 2009b:36). Trade cost is also found to be one of the obstacles as transport and logistics capabilities in Cambodia are limited (limited/poor infrastructures relative to regional average). For instance, the cost of shipping a dry 40-foot container from Sihanoukville port to Singapore is approximately USD600, higher than the USD220 cost of shipping from Ho Chi Minh City to Singapore. It should be noted that distances from the two destinations to Singapore port are somewhat comparable. Additionally, the cost of transporting agricultural products is USD15 per tonne per 100 km in Cambodia, which is higher than in Vietnam (USD7.5) and Thailand (USD4). Human capital is abundant, but with low level of education, despite improvement in education attainment during the past decade. This is not a major constraint as returns to education remain low and have even decreased in the private sector (World Bank 2009b:35).
Appropriability does appear to be low as investors hesitate to undertake investment with high returns and adequate finance mainly because of uncertainty about whether they could appropriate the returns. There are a range of underlying factors behind the uncertain investment environment in Cambodia. Macroeconomic instability loomed in early 2008 as risks increased sharply during the period. Level of taxation is not seen as a major constraint, but the complexity of regulations and poor administration of tax and regulatory requirements disrupt business activities and induce enterprises to stay in the informal sector. Absence of credible dispute settlement mechanisms, as well as widespread corruption, has further dented investors’ confidence. The latest World Bank investment climate survey discloses that over 80 percent of established firms are expected to make unofficial payments to get things done and firms’ perception of corruption is high, compared with other countries at the same level of development (WB 2009b:20 & 64).
17CDRI Working Paper Series No. 80
Two more factors also stand out as likely constraints limiting firms’ capability to appropriate returns, namely lack of self-discovery and coordination, and market failure under some circumstances. Newly discovered and plausible business is easily replicated, thus discouraging innovation in Cambodia. There is also evidence of low survival rate of export; for instance, a newly discovered export product is unlikely to last for more than a couple of years owing to firms’ inability to deliver on time, logistics issues and so on. Weak coordination of inputs and policies further undermines enterprises’ ability to innovate, and thereby reduces firms’ incentive to invest. Agricultural commodity markets are often distorted where cash-strapped farmers cannot negotiate prices and are forced to sell at low farm-gate prices after harvest. Likewise, the market tends to fail as domestic producers (especially in agro-processing) and cannot compete against smuggled goods (duty evasion).
In summary, the first attempt by the World Bank to apply the growth diagnostic approach to Cambodia highlights constraints in agriculture and agri-business sectors. Some of the common sectoral constraints include ill-defined property rights, poor infrastructure, low human capital stock, and issues of governance, i.e. corruption and high cost of finance. The Bank’s second growth diagnostic exercise aims to explain binding constraints at aggregate level by gathering similar accounts. In doing so, it captures three major dimensions: access to finance, cost of factors and appropriability. The financial sector is not likely to be a constraint to growth, while cost of factors, such as electricity cost, transport and logistics capabilities are likely constraints, except for human capital, which has low level of education and low return from education. Low level of appropriability is attributed to uncertain business environments, high macroeconomic risks, complex regulations and poor tax administration, lack of self-discovery and coordination and market failures.
18 Binding Constraints on Economic Growth in Cambodia: A Growth Diagnostic Approach
6
NEW EVIDENCE OF CONSTRAINTS ON GROWTH IN CAMBODIA
Apart from the twin shocks in 2008 and 2009 that slowed momentum, growth during the last decade and a half has been vibrant and robust, largely due to the attainment of genuine peace and stability, as well as sound and prudent macroeconomic management. Previous studies by the World Bank identified a couple of constraints at both micro and macro levels (WB 2006, 2009b). However, because of the current and drastic changes in Cambodia’s economy since the two crises, these preconditions for and constraints on growth may no longer hold. Therefore, it is imperative that growth constraints be reinvestigated.
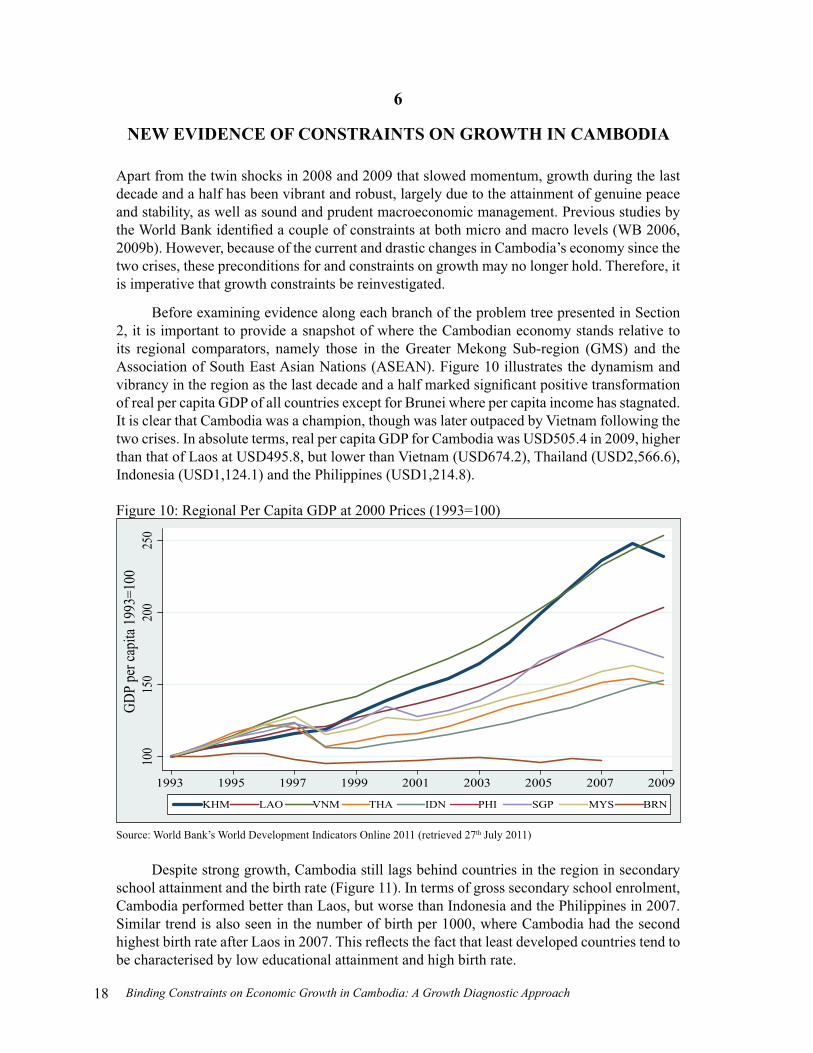
Before examining evidence along each branch of the problem tree presented in Section 2, it is important to provide a snapshot of where the Cambodian economy stands relative to its regional comparators, namely those in the Greater Mekong Sub-region (GMS) and the Association of South East Asian Nations (ASEAN). Figure 10 illustrates the dynamism and vibrancy in the region as the last decade and a half marked significant positive transformation of real per capita GDP of all countries except for Brunei where per capita income has stagnated. It is clear that Cambodia was a champion, though was later outpaced by Vietnam following the two crises. In absolute terms, real per capita GDP for Cambodia was USD505.4 in 2009, higher than that of Laos at USD495.8, but lower than Vietnam (USD674.2), Thailand (USD2,566.6), Indonesia (USD1,124.1) and the Philippines (USD1,214.8).
Figure 10: Regional Per Capita GDP at 2000 Prices (1993=100)
100
150
200
250
GDP
per c
apita
1993
=100
1993 1995 1997 1999 2001 2003 2005 2007 2009
KHM LAO VNM THA IDN PHI SGP MYS BRN
Source: World Bank’s World Development Indicators Online 2011 (retrieved 27th July 2011)
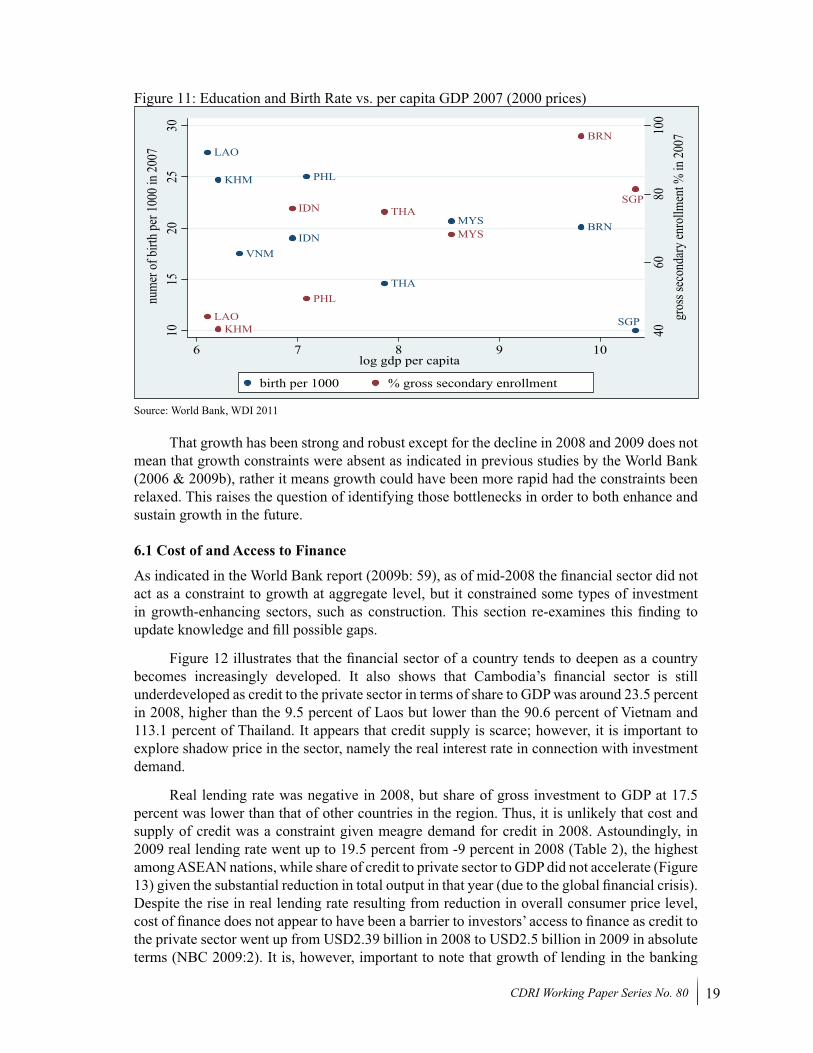
Despite strong growth, Cambodia still lags behind countries in the region in secondary school attainment and the birth rate (Figure 11). In terms of gross secondary school enrolment, Cambodia performed better than Laos, but worse than Indonesia and the Philippines in 2007. Similar trend is also seen in the number of birth per 1000, where Cambodia had the second highest birth rate after Laos in 2007. This reflects the fact that least developed countries tend to be characterised by low educational attainment and high birth rate.
19CDRI Working Paper Series No. 80
Figure 11: Education and Birth Rate vs. per capita GDP 2007 (2000 prices)
BRN
KHM
IDN
LAO
MYS
PHL
SGP
THA
VNM
BRN
KHM
IDN
LAO
MYS
PHL
SGPTHA
4060
8010
0gr
oss s
econ
dary
enro
llmen
t % in
2007
1015
2025
30nu
mer
of bi
rth pe
r 100
0 in 2
007
6 7 8 9 10log gdp per capita
birth per 1000 % gross secondary enrollment
Source: World Bank, WDI 2011
That growth has been strong and robust except for the decline in 2008 and 2009 does not mean that growth constraints were absent as indicated in previous studies by the World Bank (2006 & 2009b), rather it means growth could have been more rapid had the constraints been relaxed. This raises the question of identifying those bottlenecks in order to both enhance and sustain growth in the future.
6.1 Cost of and Access to Finance
As indicated in the World Bank report (2009b: 59), as of mid-2008 the financial sector did not act as a constraint to growth at aggregate level, but it constrained some types of investment in growth-enhancing sectors, such as construction. This section re-examines this finding to update knowledge and fill possible gaps.
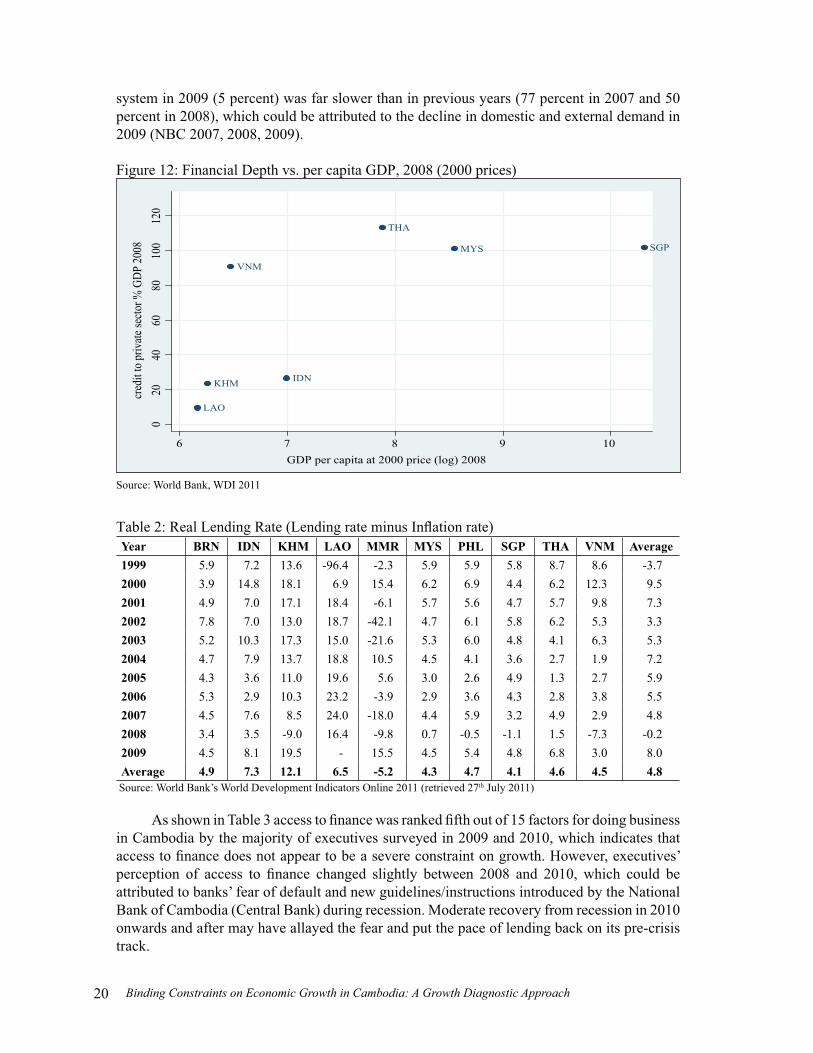
Figure 12 illustrates that the financial sector of a country tends to deepen as a country becomes increasingly developed. It also shows that Cambodia’s financial sector is still underdeveloped as credit to the private sector in terms of share to GDP was around 23.5 percent in 2008, higher than the 9.5 percent of Laos but lower than the 90.6 percent of Vietnam and 113.1 percent of Thailand. It appears that credit supply is scarce; however, it is important to explore shadow price in the sector, namely the real interest rate in connection with investment demand.
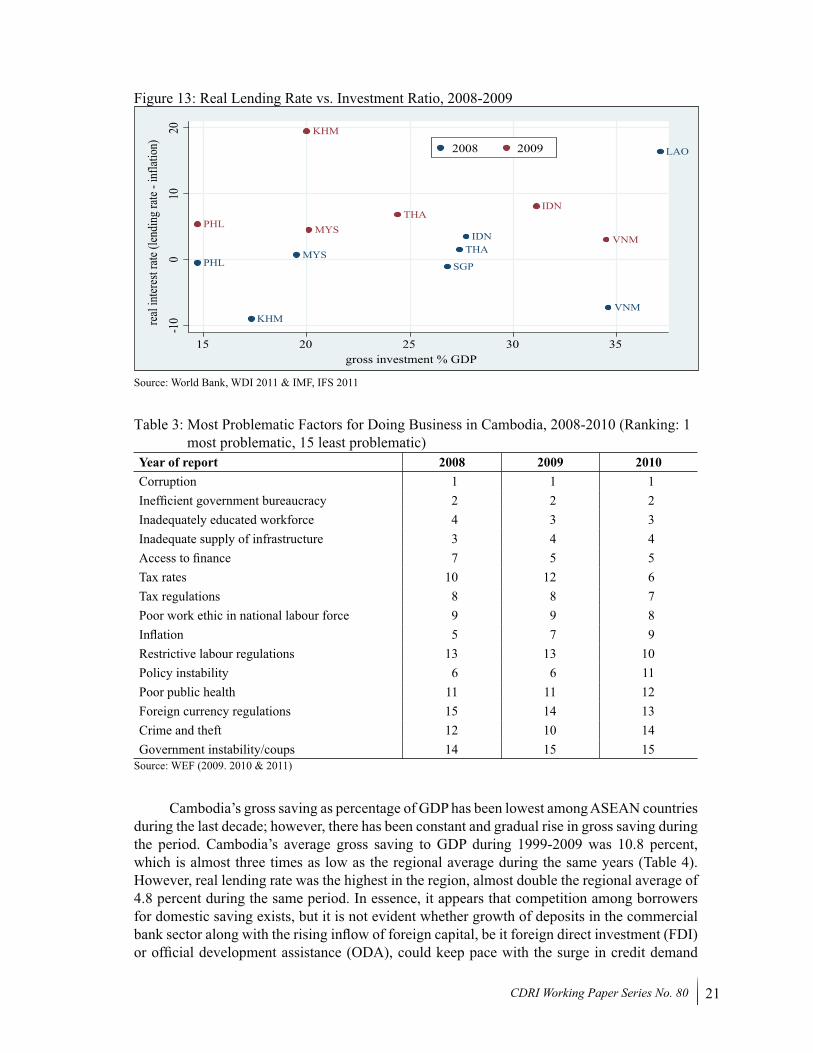
Real lending rate was negative in 2008, but share of gross investment to GDP at 17.5 percent was lower than that of other countries in the region. Thus, it is unlikely that cost and supply of credit was a constraint given meagre demand for credit in 2008. Astoundingly, in 2009 real lending rate went up to 19.5 percent from -9 percent in 2008 (Table 2), the highest among ASEAN nations, while share of credit to private sector to GDP did not accelerate (Figure 13) given the substantial reduction in total output in that year (due to the global financial crisis). Despite the rise in real lending rate resulting from reduction in overall consumer price level, cost of finance does not appear to have been a barrier to investors’ access to finance as credit to the private sector went up from USD2.39 billion in 2008 to USD2.5 billion in 2009 in absolute terms (NBC 2009:2). It is, however, important to note that growth of lending in the banking
20 Binding Constraints on Economic Growth in Cambodia: A Growth Diagnostic Approach
system in 2009 (5 percent) was far slower than in previous years (77 percent in 2007 and 50 percent in 2008), which could be attributed to the decline in domestic and external demand in 2009 (NBC 2007, 2008, 2009).
Figure 12: Financial Depth vs. per capita GDP, 2008 (2000 prices)
KHM IDN
LAO
MYS SGP
THA
VNM
020
4060
8010
012
0cr
edit
to pr
ivate
secto
r % G
DP 20
08
6 7 8 9 10GDP per capita at 2000 price (log) 2008
Source: World Bank, WDI 2011
Table 2: Real Lending Rate (Lending rate minus Inflation rate)Year BRN IDN KHM LAO MMR MYS PHL SGP THA VNM Average1999 5.9 7.2 13.6 -96.4 -2.3 5.9 5.9 5.8 8.7 8.6 -3.72000 3.9 14.8 18.1 6.9 15.4 6.2 6.9 4.4 6.2 12.3 9.52001 4.9 7.0 17.1 18.4 -6.1 5.7 5.6 4.7 5.7 9.8 7.32002 7.8 7.0 13.0 18.7 -42.1 4.7 6.1 5.8 6.2 5.3 3.32003 5.2 10.3 17.3 15.0 -21.6 5.3 6.0 4.8 4.1 6.3 5.32004 4.7 7.9 13.7 18.8 10.5 4.5 4.1 3.6 2.7 1.9 7.22005 4.3 3.6 11.0 19.6 5.6 3.0 2.6 4.9 1.3 2.7 5.92006 5.3 2.9 10.3 23.2 -3.9 2.9 3.6 4.3 2.8 3.8 5.52007 4.5 7.6 8.5 24.0 -18.0 4.4 5.9 3.2 4.9 2.9 4.82008 3.4 3.5 -9.0 16.4 -9.8 0.7 -0.5 -1.1 1.5 -7.3 -0.22009 4.5 8.1 19.5 - 15.5 4.5 5.4 4.8 6.8 3.0 8.0Average 4.9 7.3 12.1 6.5 -5.2 4.3 4.7 4.1 4.6 4.5 4.8
Source: World Bank’s World Development Indicators Online 2011 (retrieved 27th July 2011)
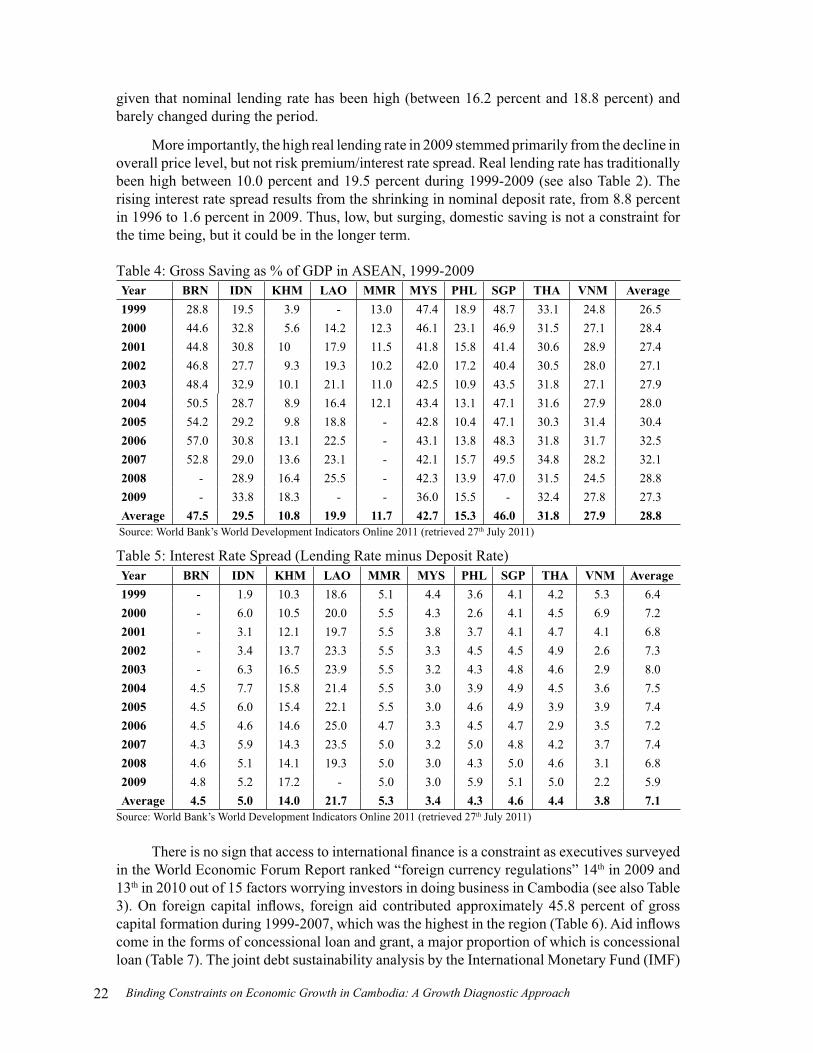
As shown in Table 3 access to finance was ranked fifth out of 15 factors for doing business in Cambodia by the majority of executives surveyed in 2009 and 2010, which indicates that access to finance does not appear to be a severe constraint on growth. However, executives’ perception of access to finance changed slightly between 2008 and 2010, which could be attributed to banks’ fear of default and new guidelines/instructions introduced by the National Bank of Cambodia (Central Bank) during recession. Moderate recovery from recession in 2010 onwards and after may have allayed the fear and put the pace of lending back on its pre-crisis track.
21CDRI Working Paper Series No. 80
Figure 13: Real Lending Rate vs. Investment Ratio, 2008-2009
KHM
IDN
LAO
MYSPHL SGP
THA
VNM
KHM
IDN
MYSPHLTHA
VNM
-10
010
20re
al in
teres
t rate
(len
ding
rate
- inf
latio
n)
15 20 25 30 35gross investment % GDP
2008 2009
Source: World Bank, WDI 2011 & IMF, IFS 2011
Table 3: Most Problematic Factors for Doing Business in Cambodia, 2008-2010 (Ranking: 1 most problematic, 15 least problematic)
Year of report 2008 2009 2010Corruption 1 1 1Inefficient government bureaucracy 2 2 2Inadequately educated workforce 4 3 3Inadequate supply of infrastructure 3 4 4Access to finance 7 5 5Tax rates 10 12 6Tax regulations 8 8 7Poor work ethic in national labour force 9 9 8Inflation 5 7 9Restrictive labour regulations 13 13 10Policy instability 6 6 11Poor public health 11 11 12Foreign currency regulations 15 14 13Crime and theft 12 10 14Government instability/coups 14 15 15
Source: WEF (2009. 2010 & 2011)
Cambodia’s gross saving as percentage of GDP has been lowest among ASEAN countries during the last decade; however, there has been constant and gradual rise in gross saving during the period. Cambodia’s average gross saving to GDP during 1999-2009 was 10.8 percent, which is almost three times as low as the regional average during the same years (Table 4). However, real lending rate was the highest in the region, almost double the regional average of 4.8 percent during the same period. In essence, it appears that competition among borrowers for domestic saving exists, but it is not evident whether growth of deposits in the commercial bank sector along with the rising inflow of foreign capital, be it foreign direct investment (FDI) or official development assistance (ODA), could keep pace with the surge in credit demand
22 Binding Constraints on Economic Growth in Cambodia: A Growth Diagnostic Approach
given that nominal lending rate has been high (between 16.2 percent and 18.8 percent) and barely changed during the period.
More importantly, the high real lending rate in 2009 stemmed primarily from the decline in overall price level, but not risk premium/interest rate spread. Real lending rate has traditionally been high between 10.0 percent and 19.5 percent during 1999-2009 (see also Table 2). The rising interest rate spread results from the shrinking in nominal deposit rate, from 8.8 percent in 1996 to 1.6 percent in 2009. Thus, low, but surging, domestic saving is not a constraint for the time being, but it could be in the longer term.
Table 4: Gross Saving as % of GDP in ASEAN, 1999-2009Year BRN IDN KHM LAO MMR MYS PHL SGP THA VNM Average1999 28.8 19.5 3.9 - 13.0 47.4 18.9 48.7 33.1 24.8 26.52000 44.6 32.8 5.6 14.2 12.3 46.1 23.1 46.9 31.5 27.1 28.42001 44.8 30.8 10 17.9 11.5 41.8 15.8 41.4 30.6 28.9 27.42002 46.8 27.7 9.3 19.3 10.2 42.0 17.2 40.4 30.5 28.0 27.12003 48.4 32.9 10.1 21.1 11.0 42.5 10.9 43.5 31.8 27.1 27.92004 50.5 28.7 8.9 16.4 12.1 43.4 13.1 47.1 31.6 27.9 28.02005 54.2 29.2 9.8 18.8 - 42.8 10.4 47.1 30.3 31.4 30.42006 57.0 30.8 13.1 22.5 - 43.1 13.8 48.3 31.8 31.7 32.52007 52.8 29.0 13.6 23.1 - 42.1 15.7 49.5 34.8 28.2 32.12008 - 28.9 16.4 25.5 - 42.3 13.9 47.0 31.5 24.5 28.82009 - 33.8 18.3 - - 36.0 15.5 - 32.4 27.8 27.3Average 47.5 29.5 10.8 19.9 11.7 42.7 15.3 46.0 31.8 27.9 28.8
Source: World Bank’s World Development Indicators Online 2011 (retrieved 27th July 2011)
Table 5: Interest Rate Spread (Lending Rate minus Deposit Rate)Year BRN IDN KHM LAO MMR MYS PHL SGP THA VNM Average1999 - 1.9 10.3 18.6 5.1 4.4 3.6 4.1 4.2 5.3 6.42000 - 6.0 10.5 20.0 5.5 4.3 2.6 4.1 4.5 6.9 7.22001 - 3.1 12.1 19.7 5.5 3.8 3.7 4.1 4.7 4.1 6.82002 - 3.4 13.7 23.3 5.5 3.3 4.5 4.5 4.9 2.6 7.32003 - 6.3 16.5 23.9 5.5 3.2 4.3 4.8 4.6 2.9 8.02004 4.5 7.7 15.8 21.4 5.5 3.0 3.9 4.9 4.5 3.6 7.52005 4.5 6.0 15.4 22.1 5.5 3.0 4.6 4.9 3.9 3.9 7.42006 4.5 4.6 14.6 25.0 4.7 3.3 4.5 4.7 2.9 3.5 7.22007 4.3 5.9 14.3 23.5 5.0 3.2 5.0 4.8 4.2 3.7 7.42008 4.6 5.1 14.1 19.3 5.0 3.0 4.3 5.0 4.6 3.1 6.82009 4.8 5.2 17.2 - 5.0 3.0 5.9 5.1 5.0 2.2 5.9Average 4.5 5.0 14.0 21.7 5.3 3.4 4.3 4.6 4.4 3.8 7.1
Source: World Bank’s World Development Indicators Online 2011 (retrieved 27th July 2011)
There is no sign that access to international finance is a constraint as executives surveyed in the World Economic Forum Report ranked “foreign currency regulations” 14th in 2009 and 13th in 2010 out of 15 factors worrying investors in doing business in Cambodia (see also Table 3). On foreign capital inflows, foreign aid contributed approximately 45.8 percent of gross capital formation during 1999-2007, which was the highest in the region (Table 6). Aid inflows come in the forms of concessional loan and grant, a major proportion of which is concessional loan (Table 7). The joint debt sustainability analysis by the International Monetary Fund (IMF)
23CDRI Working Paper Series No. 80
and the World Bank in 2010 found that Cambodia would retain its moderate risk-of-debt distress rating, indicating no grave concern over excessive debt accumulation (IMF 2011:9). Share of FDI to GDP is above the regional average between 1999 and 2009, which is relatively high (Table 8). This indicates no serious constraint on access to, but significant dependency on international finance.
Table 6: Foreign Aid (Percentage of Gross Capital Formation)Year BRN IDN KHM LAO MMR MYS PHL SGP THA VNM Average1999 - 13.3 46.4 - - 0.8 4.8 - 4.0 18.0 14.62000 - 4.5 61.8 57.2 - 0.2 3.6 - 2.5 18.2 21.12001 - 4.0 56.6 51.0 - 0.1 4.2 - 1.0 14.1 18.72002 - 3.1 62.5 57.4 - 0.3 4.2 - 1.0 11.0 19.92003 - 2.9 55.4 50.0 - 0.4 5.4 - -2.6 12.9 17.82004 - 0.2 56.1 33.8 - 1.1 3.1 - 0.1 11.5 15.12005 - 3.5 46.1 32.2 - 0.1 3.9 - -0.3 10.2 13.72006 - 1.4 35.4 33.6 - 0.7 3.3 - -0.4 8.2 11.72007 - 0.8 37.6 24.1 - 0.5 2.9 - -0.5 8.2 10.52008 - 0.9 - 24.4 - - 0.2 - -0.8 6.8 4.52009 - - - - - - - - - - -Average - 3.5 45.8 40.4 - 0.4 3.6 - 0.4 11.9 14.8
Source: World Bank’s World Development Indicators Online 2011 (retrieved 27th July 2011)
Table 7: Concessional Debt as Percentage to External DebtYear BRN IDN KHM LAO MMR MYS PHL SGP THA VNM Average1999 - 21.4 90.2 97.8 78.4 6.5 23.1 - 9.8 24.2 43.92000 - 21.3 88.2 98.2 69.8 7.0 21.5 - 11.5 61.7 47.42001 - 21.4 88.4 98.5 69.6 7.0 19.0 - 13.0 66.7 48.02002 - 26.0 88.9 86.0 65.9 6.7 20.6 - 16.6 72.7 47.92003 - 28.1 89.5 81.4 65.9 7.3 22.4 - 18.8 74.4 48.52004 - 28.6 89.2 77.7 64.5 8.3 23.5 - 18.2 71.9 47.72005 - 27.6 89.5 69.6 63.6 8.6 20.4 - 15.4 68.3 45.42006 - 29.5 93.8 66.4 62.4 8.9 20.7 - 14.1 71.7 45.92007 - 28.6 93.7 56.9 61.7 5.3 20 - 12.5 67.8 43.32008 - 29.6 92.1 54.6 62.9 6.5 23.1 - 12.3 72.7 44.22009 - 27.7 93.7 52.4 63.7 5.6 22.9 - 10.7 71.1 43.5Average - 26.3 90.7 76.3 66.2 7.1 21.6 - 13.9 65.7 46.0
Source: World Bank’s World Development Indicators Online 2011 (retrieved 27th July 2011)
24 Binding Constraints on Economic Growth in Cambodia: A Growth Diagnostic Approach
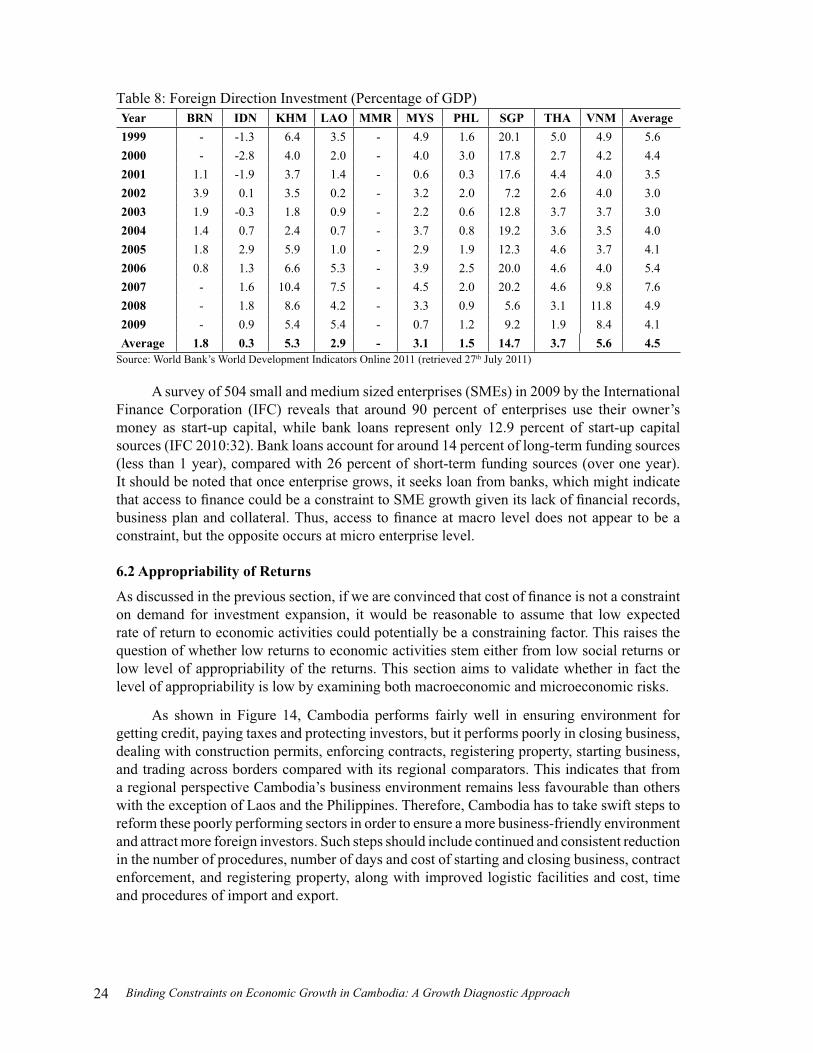
Table 8: Foreign Direction Investment (Percentage of GDP)Year BRN IDN KHM LAO MMR MYS PHL SGP THA VNM Average1999 - -1.3 6.4 3.5 - 4.9 1.6 20.1 5.0 4.9 5.62000 - -2.8 4.0 2.0 - 4.0 3.0 17.8 2.7 4.2 4.42001 1.1 -1.9 3.7 1.4 - 0.6 0.3 17.6 4.4 4.0 3.52002 3.9 0.1 3.5 0.2 - 3.2 2.0 7.2 2.6 4.0 3.02003 1.9 -0.3 1.8 0.9 - 2.2 0.6 12.8 3.7 3.7 3.02004 1.4 0.7 2.4 0.7 - 3.7 0.8 19.2 3.6 3.5 4.02005 1.8 2.9 5.9 1.0 - 2.9 1.9 12.3 4.6 3.7 4.12006 0.8 1.3 6.6 5.3 - 3.9 2.5 20.0 4.6 4.0 5.42007 - 1.6 10.4 7.5 - 4.5 2.0 20.2 4.6 9.8 7.62008 - 1.8 8.6 4.2 - 3.3 0.9 5.6 3.1 11.8 4.92009 - 0.9 5.4 5.4 - 0.7 1.2 9.2 1.9 8.4 4.1Average 1.8 0.3 5.3 2.9 - 3.1 1.5 14.7 3.7 5.6 4.5
Source: World Bank’s World Development Indicators Online 2011 (retrieved 27th July 2011)
A survey of 504 small and medium sized enterprises (SMEs) in 2009 by the International Finance Corporation (IFC) reveals that around 90 percent of enterprises use their owner’s money as start-up capital, while bank loans represent only 12.9 percent of start-up capital sources (IFC 2010:32). Bank loans account for around 14 percent of long-term funding sources (less than 1 year), compared with 26 percent of short-term funding sources (over one year). It should be noted that once enterprise grows, it seeks loan from banks, which might indicate that access to finance could be a constraint to SME growth given its lack of financial records, business plan and collateral. Thus, access to finance at macro level does not appear to be a constraint, but the opposite occurs at micro enterprise level.
6.2 Appropriability of Returns
As discussed in the previous section, if we are convinced that cost of finance is not a constraint on demand for investment expansion, it would be reasonable to assume that low expected rate of return to economic activities could potentially be a constraining factor. This raises the question of whether low returns to economic activities stem either from low social returns or low level of appropriability of the returns. This section aims to validate whether in fact the level of appropriability is low by examining both macroeconomic and microeconomic risks.
As shown in Figure 14, Cambodia performs fairly well in ensuring environment for getting credit, paying taxes and protecting investors, but it performs poorly in closing business, dealing with construction permits, enforcing contracts, registering property, starting business, and trading across borders compared with its regional comparators. This indicates that from a regional perspective Cambodia’s business environment remains less favourable than others with the exception of Laos and the Philippines. Therefore, Cambodia has to take swift steps to reform these poorly performing sectors in order to ensure a more business-friendly environment and attract more foreign investors. Such steps should include continued and consistent reduction in the number of procedures, number of days and cost of starting and closing business, contract enforcement, and registering property, along with improved logistic facilities and cost, time and procedures of import and export.
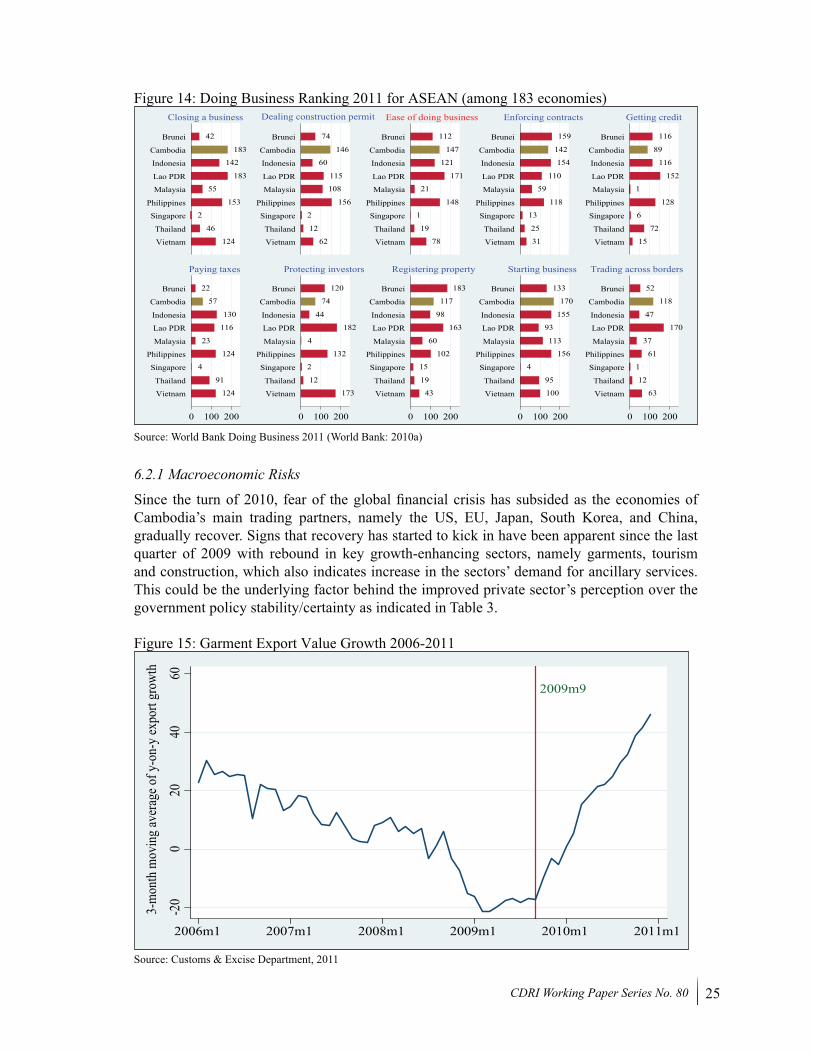
25CDRI Working Paper Series No. 80
Figure 14: Doing Business Ranking 2011 for ASEAN (among 183 economies)
124
46
2
153
55
183
142
183
42
62
12
2
156
108
115
60
146
74
78
19
1
148
21
171
121
147
112
31
25
13
118
59
110
154
142
159
15
72
6
128
1
152
116
89
116
124
91
4
124
23
116
130
57
22
173
12
2
132
4
182
44
74
120
43
19
15
102
60
163
98
117
183
100
95
4
156
113
93
155
170
133
63
12
1
61
37
170
47
118
52
0 100 200 0 100 200 0 100 200 0 100 200 0 100 200
Vietnam
Thailand
Singapore
Philippines
Malaysia
Lao PDR
Indonesia
Cambodia
Brunei
Vietnam
Thailand
Singapore
Philippines
Malaysia
Lao PDR
Indonesia
Cambodia
Brunei
Vietnam
Thailand
Singapore
Philippines
Malaysia
Lao PDR
Indonesia
Cambodia
Brunei
Vietnam
Thailand
Singapore
Philippines
Malaysia
Lao PDR
Indonesia
Cambodia
Brunei
Vietnam
Thailand
Singapore
Philippines
Malaysia
Lao PDR
Indonesia
Cambodia
Brunei
Vietnam
Thailand
Singapore
Philippines
Malaysia
Lao PDR
Indonesia
Cambodia
Brunei
Vietnam
Thailand
Singapore
Philippines
Malaysia
Lao PDR
Indonesia
Cambodia
Brunei
Vietnam
Thailand
Singapore
Philippines
Malaysia
Lao PDR
Indonesia
Cambodia
Brunei
Vietnam
Thailand
Singapore
Philippines
Malaysia
Lao PDR
Indonesia
Cambodia
Brunei
Vietnam
Thailand
Singapore
Philippines
Malaysia
Lao PDR
Indonesia
Cambodia
Brunei
Closing a business Dealing construction permit Ease of doing business Enforcing contracts Getting credit
Paying taxes Protecting investors Registering property Starting business Trading across borders
Source: World Bank Doing Business 2011 (World Bank: 2010a)
6.2.1 Macroeconomic Risks
Since the turn of 2010, fear of the global financial crisis has subsided as the economies of Cambodia’s main trading partners, namely the US, EU, Japan, South Korea, and China, gradually recover. Signs that recovery has started to kick in have been apparent since the last quarter of 2009 with rebound in key growth-enhancing sectors, namely garments, tourism and construction, which also indicates increase in the sectors’ demand for ancillary services. This could be the underlying factor behind the improved private sector’s perception over the government policy stability/certainty as indicated in Table 3.
Figure 15: Garment Export Value Growth 2006-2011
2009m9
-20
020
4060
3-m
onth
mov
ing
aver
age o
f y-o
n-y
expo
rt gr
owth
2006m1 2007m1 2008m1 2009m1 2010m1 2011m1
Source: Customs & Excise Department, 2011
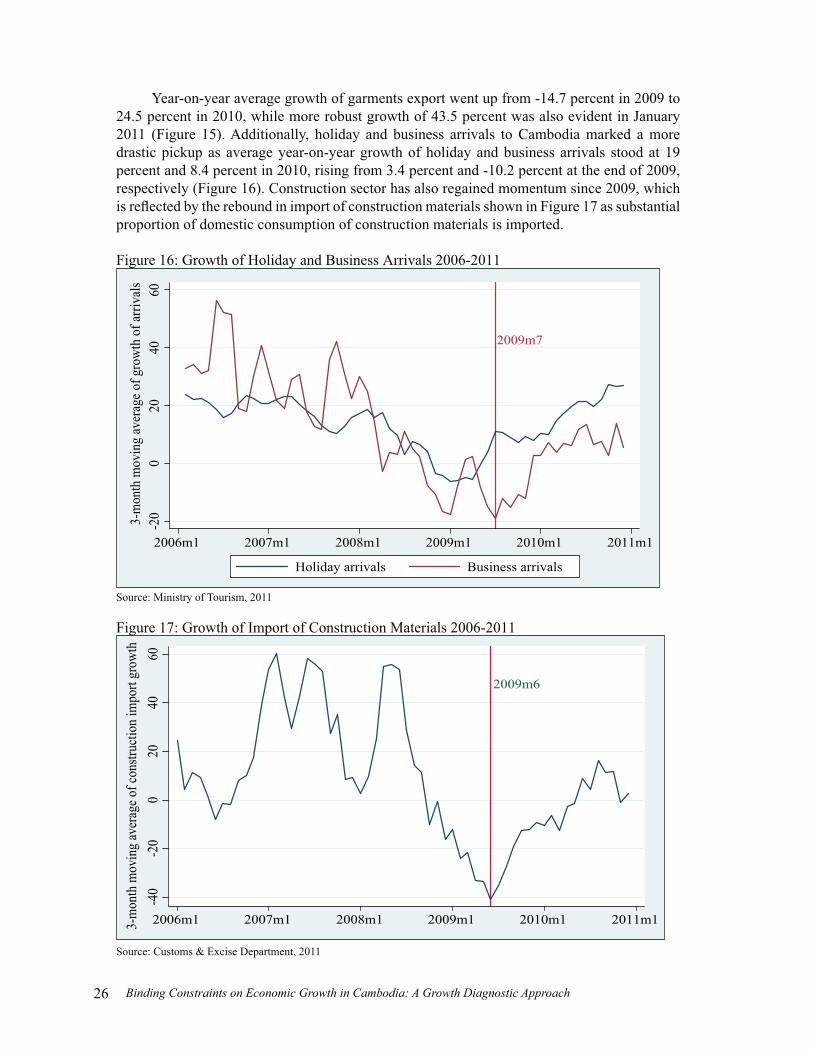
26 Binding Constraints on Economic Growth in Cambodia: A Growth Diagnostic Approach
Year-on-year average growth of garments export went up from -14.7 percent in 2009 to 24.5 percent in 2010, while more robust growth of 43.5 percent was also evident in January 2011 (Figure 15). Additionally, holiday and business arrivals to Cambodia marked a more drastic pickup as average year-on-year growth of holiday and business arrivals stood at 19 percent and 8.4 percent in 2010, rising from 3.4 percent and -10.2 percent at the end of 2009, respectively (Figure 16). Construction sector has also regained momentum since 2009, which is reflected by the rebound in import of construction materials shown in Figure 17 as substantial proportion of domestic consumption of construction materials is imported.
Figure 16: Growth of Holiday and Business Arrivals 2006-2011
2009m7
-20
020
4060
3-m
onth
mov
ing
aver
age o
f gro
wth
of a
rriva
ls
2006m1 2007m1 2008m1 2009m1 2010m1 2011m1
Holiday arrivals Business arrivals
Source: Ministry of Tourism, 2011
Figure 17: Growth of Import of Construction Materials 2006-2011
2009m6
-40
-20
020
4060
3-m
onth
mov
ing
aver
age o
f con
struc
tion
impo
rt gr
owth
2006m1 2007m1 2008m1 2009m1 2010m1 2011m1
Source: Customs & Excise Department, 2011
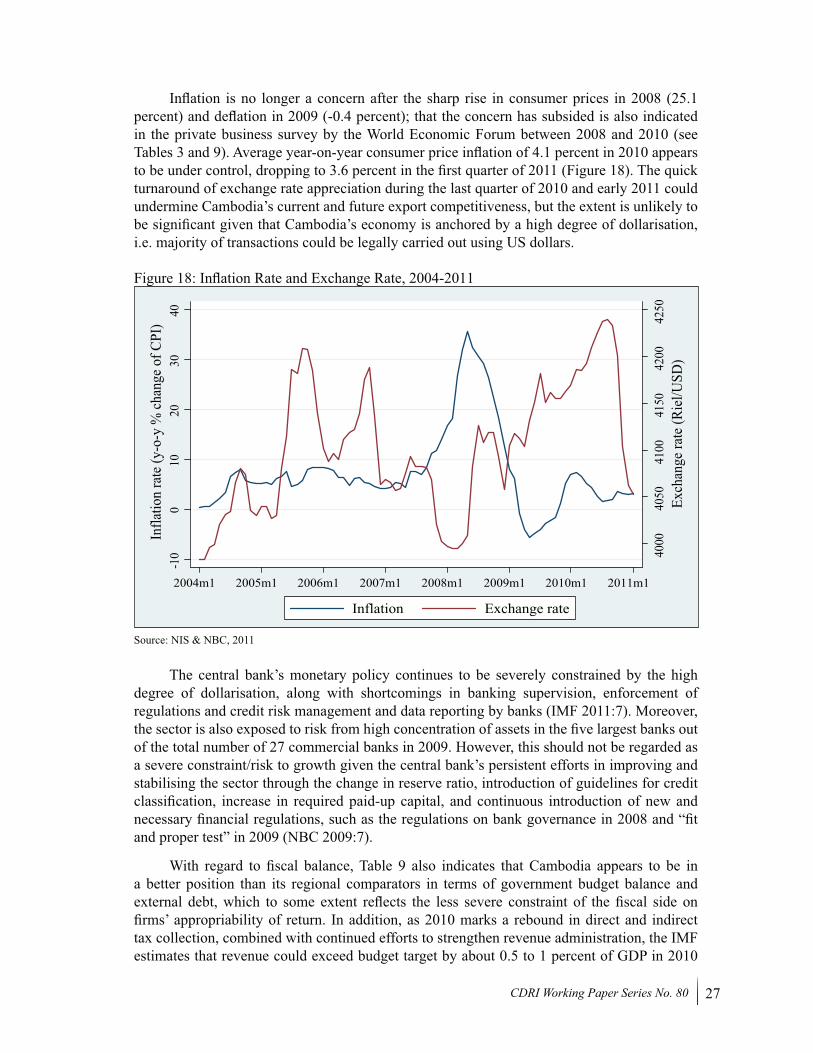
27CDRI Working Paper Series No. 80
Inflation is no longer a concern after the sharp rise in consumer prices in 2008 (25.1 percent) and deflation in 2009 (-0.4 percent); that the concern has subsided is also indicated in the private business survey by the World Economic Forum between 2008 and 2010 (see Tables 3 and 9). Average year-on-year consumer price inflation of 4.1 percent in 2010 appears to be under control, dropping to 3.6 percent in the first quarter of 2011 (Figure 18). The quick turnaround of exchange rate appreciation during the last quarter of 2010 and early 2011 could undermine Cambodia’s current and future export competitiveness, but the extent is unlikely to be significant given that Cambodia’s economy is anchored by a high degree of dollarisation, i.e. majority of transactions could be legally carried out using US dollars.
Figure 18: Inflation Rate and Exchange Rate, 2004-2011
4000
4050
4100
4150
4200
4250
Exch
ange
rate
(Rie
l/USD
)
-10
010
2030
40In
flatio
n ra
te (y
-o-y
% ch
ange
of C
PI)
2004m1 2005m1 2006m1 2007m1 2008m1 2009m1 2010m1 2011m1
Inflation Exchange rate
Source: NIS & NBC, 2011
The central bank’s monetary policy continues to be severely constrained by the high degree of dollarisation, along with shortcomings in banking supervision, enforcement of regulations and credit risk management and data reporting by banks (IMF 2011:7). Moreover, the sector is also exposed to risk from high concentration of assets in the five largest banks out of the total number of 27 commercial banks in 2009. However, this should not be regarded as a severe constraint/risk to growth given the central bank’s persistent efforts in improving and stabilising the sector through the change in reserve ratio, introduction of guidelines for credit classification, increase in required paid-up capital, and continuous introduction of new and necessary financial regulations, such as the regulations on bank governance in 2008 and “fit and proper test” in 2009 (NBC 2009:7).
With regard to fiscal balance, Table 9 also indicates that Cambodia appears to be in a better position than its regional comparators in terms of government budget balance and external debt, which to some extent reflects the less severe constraint of the fiscal side on firms’ appropriability of return. In addition, as 2010 marks a rebound in direct and indirect tax collection, combined with continued efforts to strengthen revenue administration, the IMF estimates that revenue could exceed budget target by about 0.5 to 1 percent of GDP in 2010
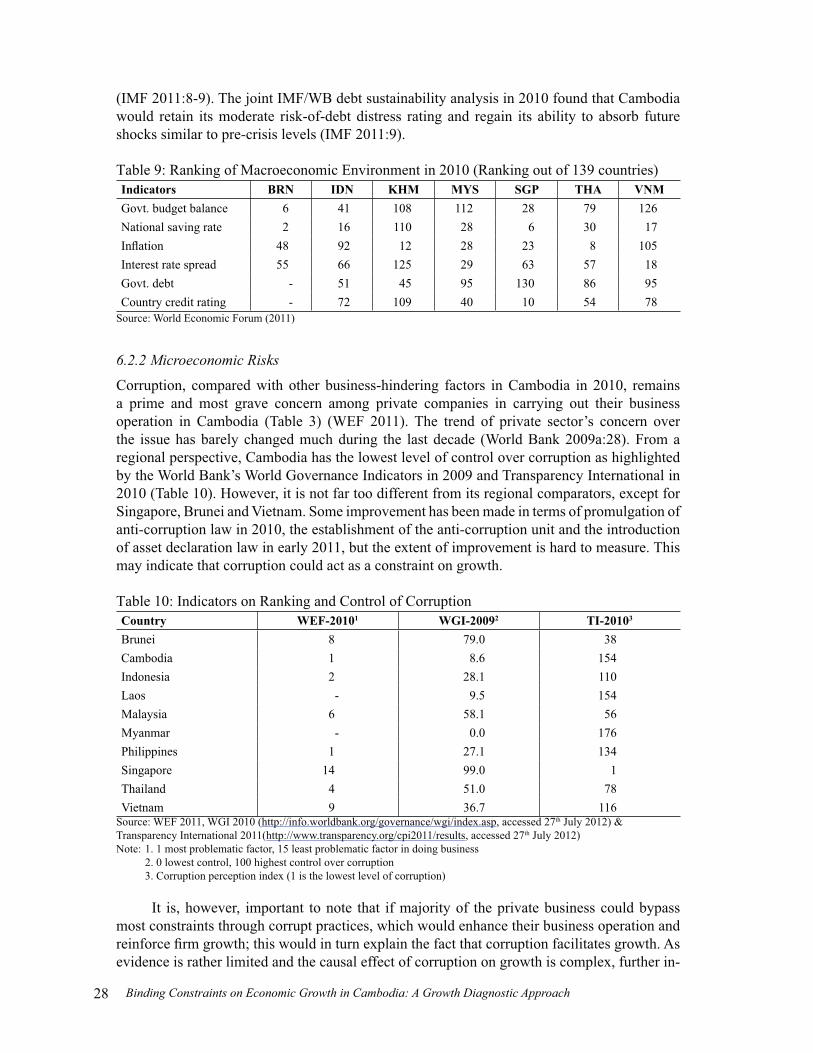
28 Binding Constraints on Economic Growth in Cambodia: A Growth Diagnostic Approach
(IMF 2011:8-9). The joint IMF/WB debt sustainability analysis in 2010 found that Cambodia would retain its moderate risk-of-debt distress rating and regain its ability to absorb future shocks similar to pre-crisis levels (IMF 2011:9).
Table 9: Ranking of Macroeconomic Environment in 2010 (Ranking out of 139 countries) Indicators BRN IDN KHM MYS SGP THA VNMGovt. budget balance 6 41 108 112 28 79 126National saving rate 2 16 110 28 6 30 17Inflation 48 92 12 28 23 8 105Interest rate spread 55 66 125 29 63 57 18Govt. debt - 51 45 95 130 86 95Country credit rating - 72 109 40 10 54 78
Source: World Economic Forum (2011)
6.2.2 Microeconomic Risks
Corruption, compared with other business-hindering factors in Cambodia in 2010, remains a prime and most grave concern among private companies in carrying out their business operation in Cambodia (Table 3) (WEF 2011). The trend of private sector’s concern over the issue has barely changed much during the last decade (World Bank 2009a:28). From a regional perspective, Cambodia has the lowest level of control over corruption as highlighted by the World Bank’s World Governance Indicators in 2009 and Transparency International in 2010 (Table 10). However, it is not far too different from its regional comparators, except for Singapore, Brunei and Vietnam. Some improvement has been made in terms of promulgation of anti-corruption law in 2010, the establishment of the anti-corruption unit and the introduction of asset declaration law in early 2011, but the extent of improvement is hard to measure. This may indicate that corruption could act as a constraint on growth.
Table 10: Indicators on Ranking and Control of CorruptionCountry WEF-20101 WGI-20092 TI-20103
Brunei 8 79.0 38Cambodia 1 8.6 154Indonesia 2 28.1 110Laos - 9.5 154Malaysia 6 58.1 56Myanmar - 0.0 176Philippines 1 27.1 134Singapore 14 99.0 1Thailand 4 51.0 78Vietnam 9 36.7 116
Source: WEF 2011, WGI 2010 (http://info.worldbank.org/governance/wgi/index.asp, accessed 27th July 2012) & Transparency International 2011(http://www.transparency.org/cpi2011/results, accessed 27th July 2012) Note: 1. 1 most problematic factor, 15 least problematic factor in doing business 2. 0 lowest control, 100 highest control over corruption 3. Corruption perception index (1 is the lowest level of corruption)
It is, however, important to note that if majority of the private business could bypass most constraints through corrupt practices, which would enhance their business operation and reinforce firm growth; this would in turn explain the fact that corruption facilitates growth. As evidence is rather limited and the causal effect of corruption on growth is complex, further in-
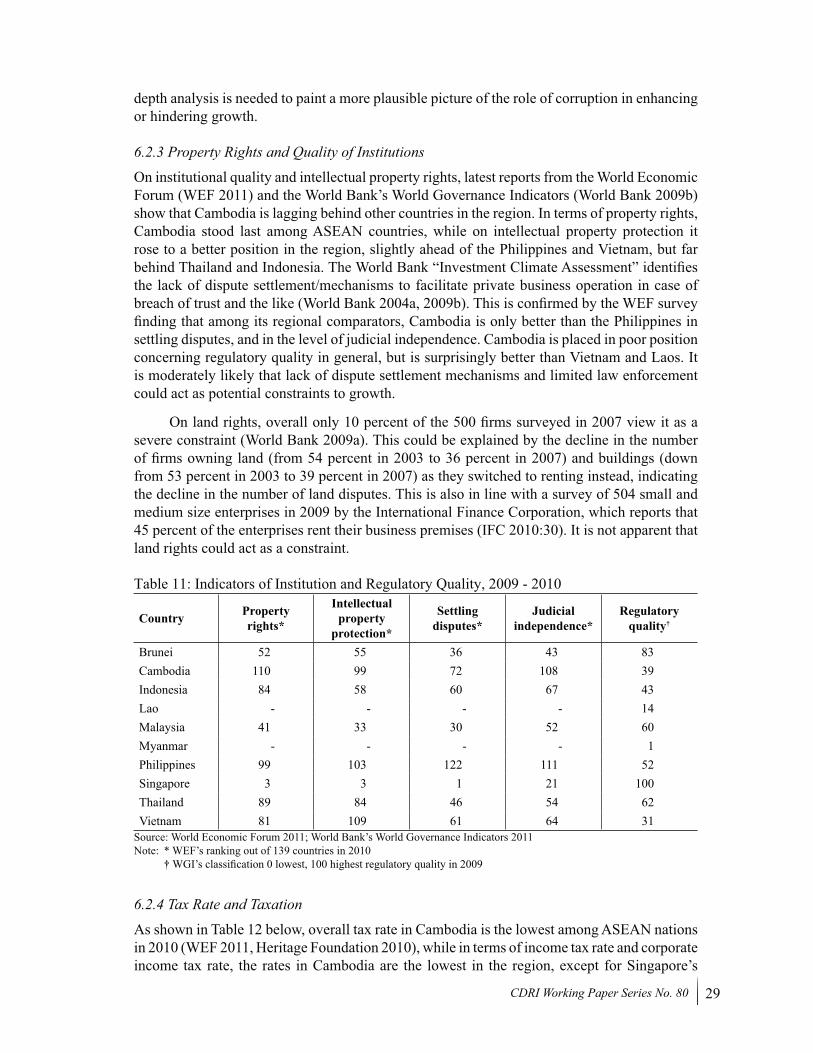
29CDRI Working Paper Series No. 80
depth analysis is needed to paint a more plausible picture of the role of corruption in enhancing or hindering growth.
6.2.3 Property Rights and Quality of Institutions
On institutional quality and intellectual property rights, latest reports from the World Economic Forum (WEF 2011) and the World Bank’s World Governance Indicators (World Bank 2009b) show that Cambodia is lagging behind other countries in the region. In terms of property rights, Cambodia stood last among ASEAN countries, while on intellectual property protection it rose to a better position in the region, slightly ahead of the Philippines and Vietnam, but far behind Thailand and Indonesia. The World Bank “Investment Climate Assessment” identifies the lack of dispute settlement/mechanisms to facilitate private business operation in case of breach of trust and the like (World Bank 2004a, 2009b). This is confirmed by the WEF survey finding that among its regional comparators, Cambodia is only better than the Philippines in settling disputes, and in the level of judicial independence. Cambodia is placed in poor position concerning regulatory quality in general, but is surprisingly better than Vietnam and Laos. It is moderately likely that lack of dispute settlement mechanisms and limited law enforcement could act as potential constraints to growth.
On land rights, overall only 10 percent of the 500 firms surveyed in 2007 view it as a severe constraint (World Bank 2009a). This could be explained by the decline in the number of firms owning land (from 54 percent in 2003 to 36 percent in 2007) and buildings (down from 53 percent in 2003 to 39 percent in 2007) as they switched to renting instead, indicating the decline in the number of land disputes. This is also in line with a survey of 504 small and medium size enterprises in 2009 by the International Finance Corporation, which reports that 45 percent of the enterprises rent their business premises (IFC 2010:30). It is not apparent that land rights could act as a constraint.
Table 11: Indicators of Institution and Regulatory Quality, 2009 - 2010
Country Property rights*
Intellectual property
protection*
Settling disputes*
Judicial independence*
Regulatory quality†
Brunei 52 55 36 43 83Cambodia 110 99 72 108 39Indonesia 84 58 60 67 43Lao - - - - 14Malaysia 41 33 30 52 60Myanmar - - - - 1Philippines 99 103 122 111 52Singapore 3 3 1 21 100Thailand 89 84 46 54 62Vietnam 81 109 61 64 31
Source: World Economic Forum 2011; World Bank’s World Governance Indicators 2011Note: * WEF’s ranking out of 139 countries in 2010 † WGI’s classification 0 lowest, 100 highest regulatory quality in 2009
6.2.4 Tax Rate and Taxation
As shown in Table 12 below, overall tax rate in Cambodia is the lowest among ASEAN nations in 2010 (WEF 2011, Heritage Foundation 2010), while in terms of income tax rate and corporate income tax rate, the rates in Cambodia are the lowest in the region, except for Singapore’s
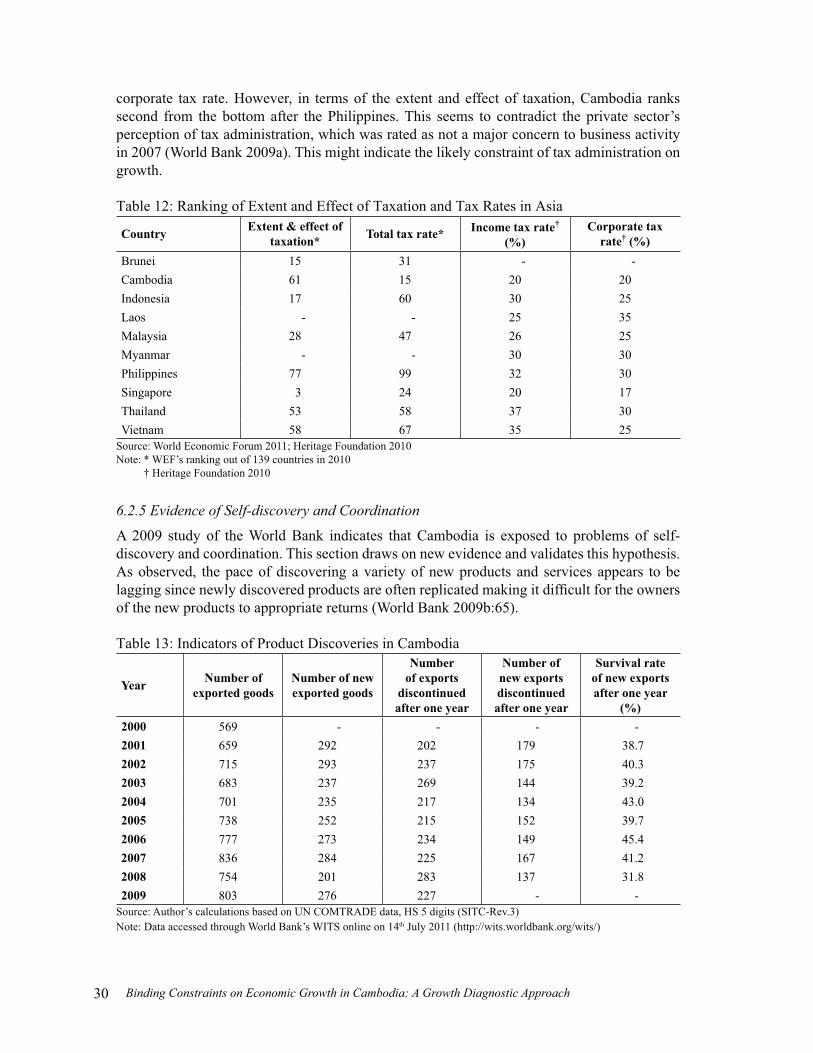
30 Binding Constraints on Economic Growth in Cambodia: A Growth Diagnostic Approach
corporate tax rate. However, in terms of the extent and effect of taxation, Cambodia ranks second from the bottom after the Philippines. This seems to contradict the private sector’s perception of tax administration, which was rated as not a major concern to business activity in 2007 (World Bank 2009a). This might indicate the likely constraint of tax administration on growth.
Table 12: Ranking of Extent and Effect of Taxation and Tax Rates in Asia
Country Extent & effect of taxation* Total tax rate* Income tax rate†
(%)Corporate tax
rate† (%)Brunei 15 31 - -Cambodia 61 15 20 20Indonesia 17 60 30 25Laos - - 25 35Malaysia 28 47 26 25Myanmar - - 30 30Philippines 77 99 32 30Singapore 3 24 20 17Thailand 53 58 37 30Vietnam 58 67 35 25
Source: World Economic Forum 2011; Heritage Foundation 2010Note: * WEF’s ranking out of 139 countries in 2010 † Heritage Foundation 2010
6.2.5 Evidence of Self-discovery and Coordination
A 2009 study of the World Bank indicates that Cambodia is exposed to problems of self-discovery and coordination. This section draws on new evidence and validates this hypothesis. As observed, the pace of discovering a variety of new products and services appears to be lagging since newly discovered products are often replicated making it difficult for the owners of the new products to appropriate returns (World Bank 2009b:65).
Table 13: Indicators of Product Discoveries in Cambodia
Year Number of exported goods
Number of new exported goods
Number of exports
discontinued after one year
Number of new exports discontinued after one year
Survival rate of new exports after one year
(%)2000 569 - - - -2001 659 292 202 179 38.72002 715 293 237 175 40.32003 683 237 269 144 39.22004 701 235 217 134 43.02005 738 252 215 152 39.72006 777 273 234 149 45.42007 836 284 225 167 41.22008 754 201 283 137 31.82009 803 276 227 - -
Source: Author’s calculations based on UN COMTRADE data, HS 5 digits (SITC-Rev.3)Note: Data accessed through World Bank’s WITS online on 14th July 2011 (http://wits.worldbank.org/wits/)
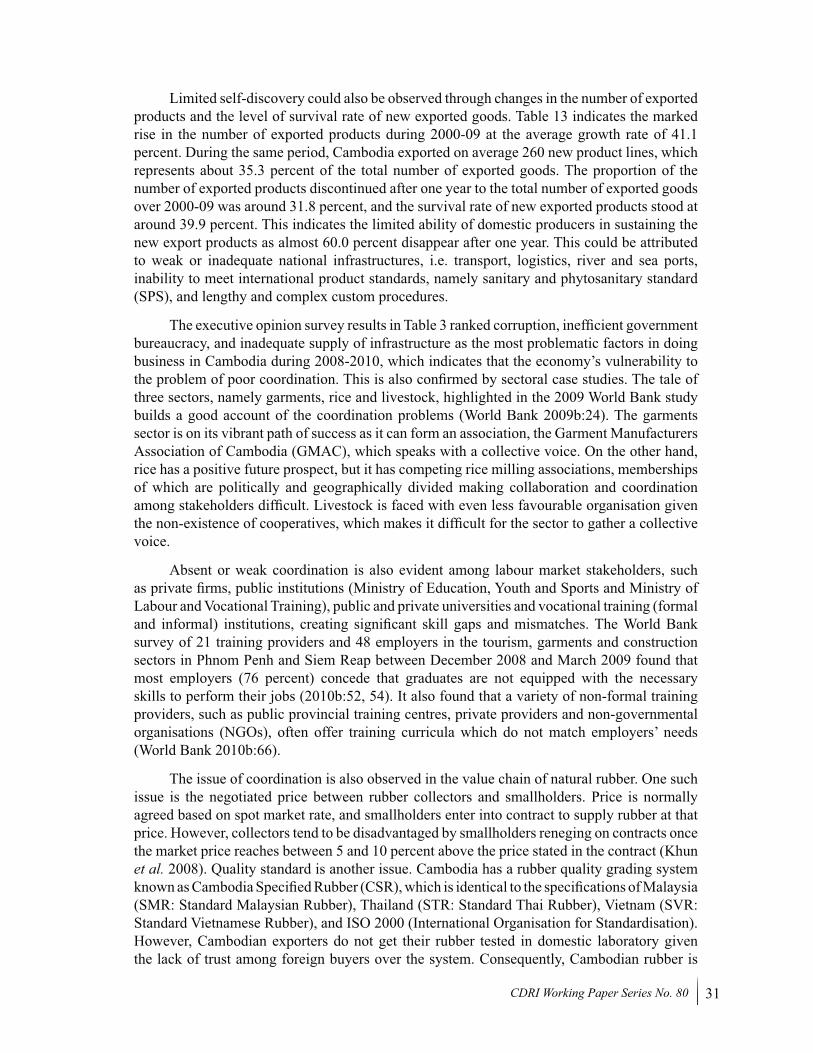
31CDRI Working Paper Series No. 80
Limited self-discovery could also be observed through changes in the number of exported products and the level of survival rate of new exported goods. Table 13 indicates the marked rise in the number of exported products during 2000-09 at the average growth rate of 41.1 percent. During the same period, Cambodia exported on average 260 new product lines, which represents about 35.3 percent of the total number of exported goods. The proportion of the number of exported products discontinued after one year to the total number of exported goods over 2000-09 was around 31.8 percent, and the survival rate of new exported products stood at around 39.9 percent. This indicates the limited ability of domestic producers in sustaining the new export products as almost 60.0 percent disappear after one year. This could be attributed to weak or inadequate national infrastructures, i.e. transport, logistics, river and sea ports, inability to meet international product standards, namely sanitary and phytosanitary standard (SPS), and lengthy and complex custom procedures.
The executive opinion survey results in Table 3 ranked corruption, inefficient government bureaucracy, and inadequate supply of infrastructure as the most problematic factors in doing business in Cambodia during 2008-2010, which indicates that the economy’s vulnerability to the problem of poor coordination. This is also confirmed by sectoral case studies. The tale of three sectors, namely garments, rice and livestock, highlighted in the 2009 World Bank study builds a good account of the coordination problems (World Bank 2009b:24). The garments sector is on its vibrant path of success as it can form an association, the Garment Manufacturers Association of Cambodia (GMAC), which speaks with a collective voice. On the other hand, rice has a positive future prospect, but it has competing rice milling associations, memberships of which are politically and geographically divided making collaboration and coordination among stakeholders difficult. Livestock is faced with even less favourable organisation given the non-existence of cooperatives, which makes it difficult for the sector to gather a collective voice.
Absent or weak coordination is also evident among labour market stakeholders, such as private firms, public institutions (Ministry of Education, Youth and Sports and Ministry of Labour and Vocational Training), public and private universities and vocational training (formal and informal) institutions, creating significant skill gaps and mismatches. The World Bank survey of 21 training providers and 48 employers in the tourism, garments and construction sectors in Phnom Penh and Siem Reap between December 2008 and March 2009 found that most employers (76 percent) concede that graduates are not equipped with the necessary skills to perform their jobs (2010b:52, 54). It also found that a variety of non-formal training providers, such as public provincial training centres, private providers and non-governmental organisations (NGOs), often offer training curricula which do not match employers’ needs (World Bank 2010b:66).
The issue of coordination is also observed in the value chain of natural rubber. One such issue is the negotiated price between rubber collectors and smallholders. Price is normally agreed based on spot market rate, and smallholders enter into contract to supply rubber at that price. However, collectors tend to be disadvantaged by smallholders reneging on contracts once the market price reaches between 5 and 10 percent above the price stated in the contract (Khun et al. 2008). Quality standard is another issue. Cambodia has a rubber quality grading system known as Cambodia Specified Rubber (CSR), which is identical to the specifications of Malaysia (SMR: Standard Malaysian Rubber), Thailand (STR: Standard Thai Rubber), Vietnam (SVR: Standard Vietnamese Rubber), and ISO 2000 (International Organisation for Standardisation). However, Cambodian exporters do not get their rubber tested in domestic laboratory given the lack of trust among foreign buyers over the system. Consequently, Cambodian rubber is
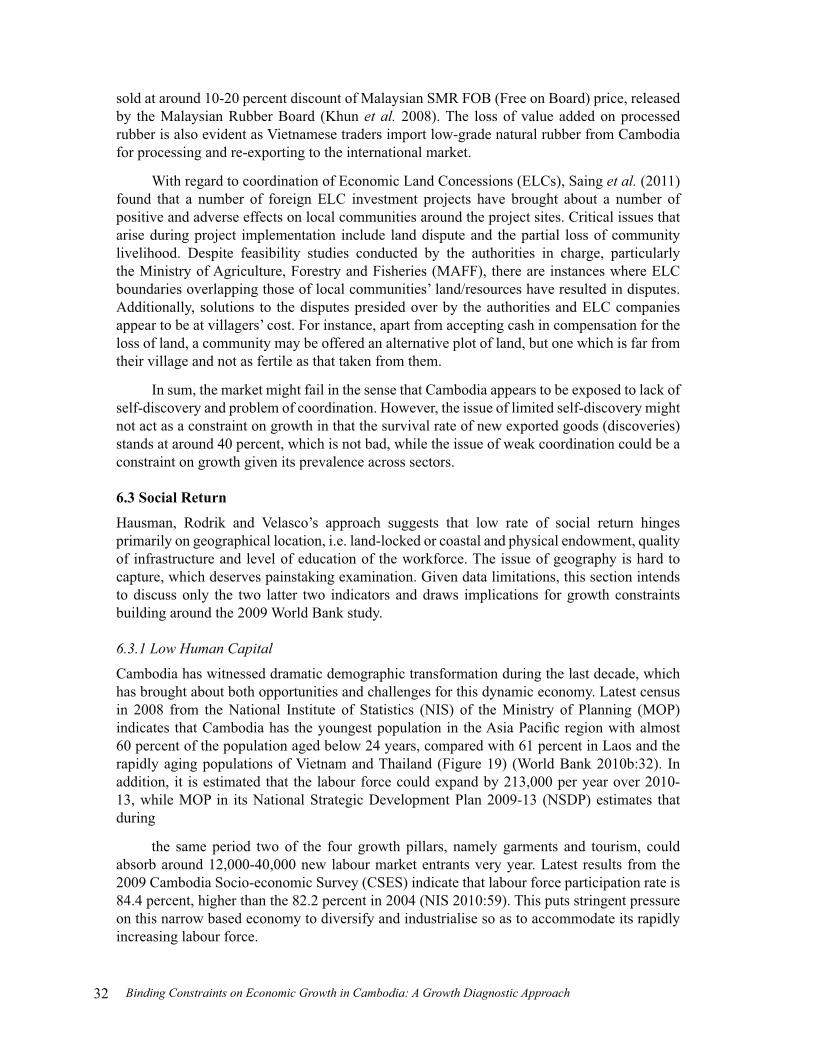
32 Binding Constraints on Economic Growth in Cambodia: A Growth Diagnostic Approach
sold at around 10-20 percent discount of Malaysian SMR FOB (Free on Board) price, released by the Malaysian Rubber Board (Khun et al. 2008). The loss of value added on processed rubber is also evident as Vietnamese traders import low-grade natural rubber from Cambodia for processing and re-exporting to the international market.
With regard to coordination of Economic Land Concessions (ELCs), Saing et al. (2011) found that a number of foreign ELC investment projects have brought about a number of positive and adverse effects on local communities around the project sites. Critical issues that arise during project implementation include land dispute and the partial loss of community livelihood. Despite feasibility studies conducted by the authorities in charge, particularly the Ministry of Agriculture, Forestry and Fisheries (MAFF), there are instances where ELC boundaries overlapping those of local communities’ land/resources have resulted in disputes. Additionally, solutions to the disputes presided over by the authorities and ELC companies appear to be at villagers’ cost. For instance, apart from accepting cash in compensation for the loss of land, a community may be offered an alternative plot of land, but one which is far from their village and not as fertile as that taken from them.
In sum, the market might fail in the sense that Cambodia appears to be exposed to lack of self-discovery and problem of coordination. However, the issue of limited self-discovery might not act as a constraint on growth in that the survival rate of new exported goods (discoveries) stands at around 40 percent, which is not bad, while the issue of weak coordination could be a constraint on growth given its prevalence across sectors.
6.3 Social Return
Hausman, Rodrik and Velasco’s approach suggests that low rate of social return hinges primarily on geographical location, i.e. land-locked or coastal and physical endowment, quality of infrastructure and level of education of the workforce. The issue of geography is hard to capture, which deserves painstaking examination. Given data limitations, this section intends to discuss only the two latter two indicators and draws implications for growth constraints building around the 2009 World Bank study.
6.3.1 Low Human Capital
Cambodia has witnessed dramatic demographic transformation during the last decade, which has brought about both opportunities and challenges for this dynamic economy. Latest census in 2008 from the National Institute of Statistics (NIS) of the Ministry of Planning (MOP) indicates that Cambodia has the youngest population in the Asia Pacific region with almost 60 percent of the population aged below 24 years, compared with 61 percent in Laos and the rapidly aging populations of Vietnam and Thailand (Figure 19) (World Bank 2010b:32). In addition, it is estimated that the labour force could expand by 213,000 per year over 2010-13, while MOP in its National Strategic Development Plan 2009-13 (NSDP) estimates that during
the same period two of the four growth pillars, namely garments and tourism, could absorb around 12,000-40,000 new labour market entrants very year. Latest results from the 2009 Cambodia Socio-economic Survey (CSES) indicate that labour force participation rate is 84.4 percent, higher than the 82.2 percent in 2004 (NIS 2010:59). This puts stringent pressure on this narrow based economy to diversify and industrialise so as to accommodate its rapidly increasing labour force.
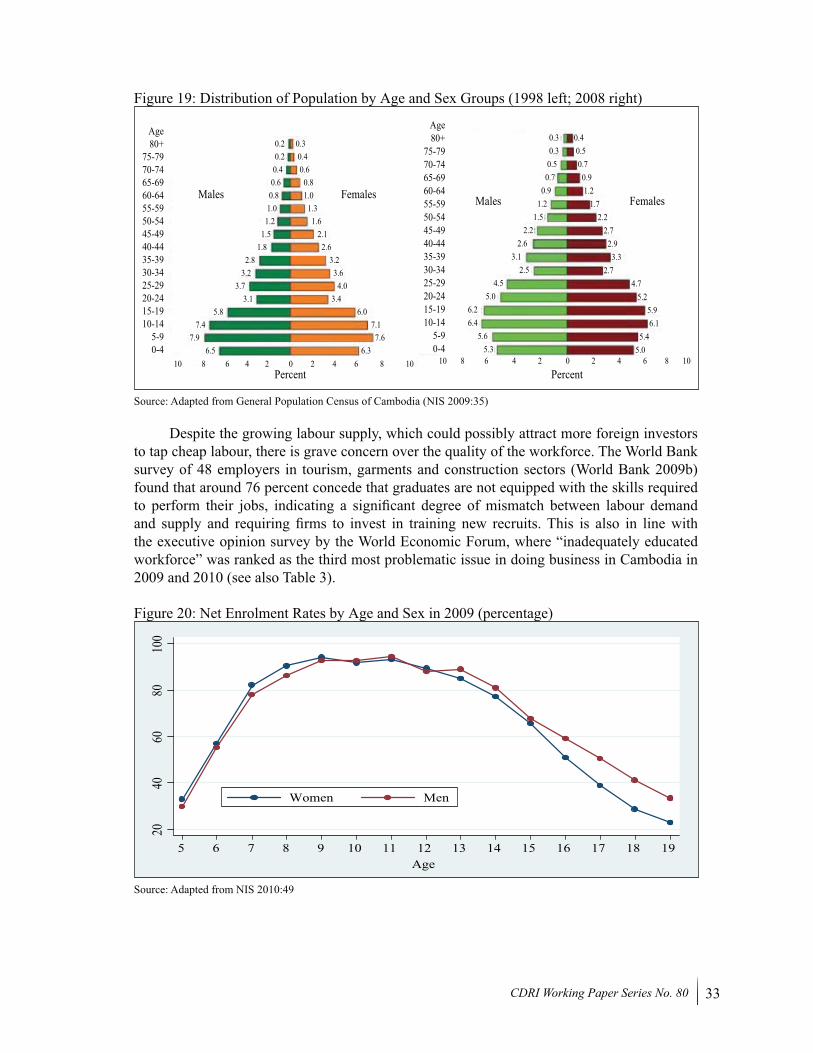
33CDRI Working Paper Series No. 80
Figure 19: Distribution of Population by Age and Sex Groups (1998 left; 2008 right)
Males MalesFemales Females
Age80+
75-7970-7465-6960-6455-5950-5445-4940-4435-3930-3425-2920-2415-1910-14
5-90-4
Age80+
75-7970-7465-6960-6455-5950-5445-4940-4435-3930-3425-2920-2415-1910-14
5-90-4
PercentPercent10 8 6 4 2 0 2 4 6 8 10 10 8 6 4 2 0 2 4 6 8 10
0.20.20.4
0.6 0.8
1.0 1.2
1.5 1.8
2.8 3.2
3.7 3.1
5.8 7.4
7.9 6.5
0.30.30.5
0.7 0.9
1.2 1.5
2.2 2.6
3.1 2.5
4.5 5.0
6.2 6.4
5.6 5.3
0.4 0.5 0.7 0.9 1.2 1.7 2.2 2.7 2.9 3.3 2.7 4.7 5.2 5.9 6.1 5.4 5.0
0.3 0.4 0.6 0.8 1.0 1.3 1.6 2.1 2.6 3.2 3.6 4.0 3.4 6.0 7.1 7.6 6.3
Source: Adapted from General Population Census of Cambodia (NIS 2009:35)
Despite the growing labour supply, which could possibly attract more foreign investors to tap cheap labour, there is grave concern over the quality of the workforce. The World Bank survey of 48 employers in tourism, garments and construction sectors (World Bank 2009b) found that around 76 percent concede that graduates are not equipped with the skills required to perform their jobs, indicating a significant degree of mismatch between labour demand and supply and requiring firms to invest in training new recruits. This is also in line with the executive opinion survey by the World Economic Forum, where “inadequately educated workforce” was ranked as the third most problematic issue in doing business in Cambodia in 2009 and 2010 (see also Table 3).
Figure 20: Net Enrolment Rates by Age and Sex in 2009 (percentage)
2040
6080
100
5 6 7 8 9 10 11 12 13 14 15 16 17 18 19Age
Women Men
Source: Adapted from NIS 2010:49
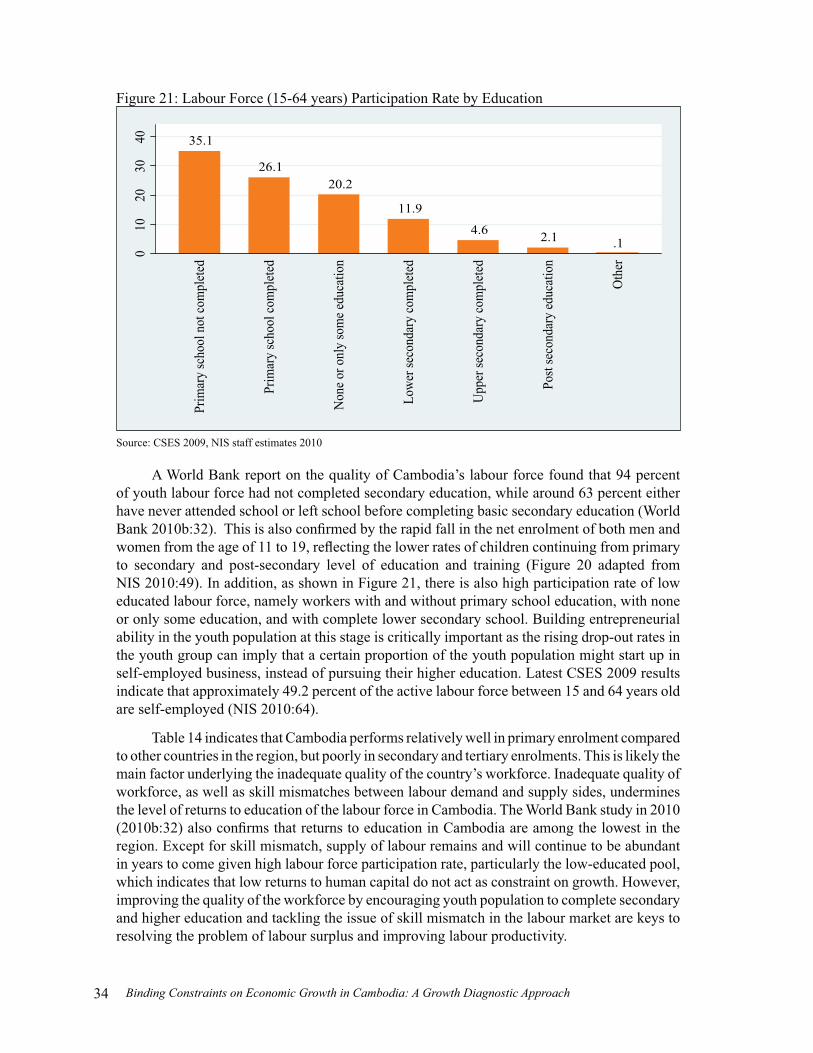
34 Binding Constraints on Economic Growth in Cambodia: A Growth Diagnostic Approach
Figure 21: Labour Force (15-64 years) Participation Rate by Education
35.1
26.120.2
11.9
4.6 2.1 .1
010
2030
40
Prim
ary
scho
ol n
ot co
mpl
eted
Prim
ary
scho
ol co
mpl
eted
Non
e or o
nly
som
e edu
catio
n
Low
er se
cond
ary
com
plet
ed
Upp
er se
cond
ary
com
plet
ed
Post
seco
ndar
y ed
ucat
ion
Oth
er
Source: CSES 2009, NIS staff estimates 2010
A World Bank report on the quality of Cambodia’s labour force found that 94 percent of youth labour force had not completed secondary education, while around 63 percent either have never attended school or left school before completing basic secondary education (World Bank 2010b:32). This is also confirmed by the rapid fall in the net enrolment of both men and women from the age of 11 to 19, reflecting the lower rates of children continuing from primary to secondary and post-secondary level of education and training (Figure 20 adapted from NIS 2010:49). In addition, as shown in Figure 21, there is also high participation rate of low educated labour force, namely workers with and without primary school education, with none or only some education, and with complete lower secondary school. Building entrepreneurial ability in the youth population at this stage is critically important as the rising drop-out rates in the youth group can imply that a certain proportion of the youth population might start up in self-employed business, instead of pursuing their higher education. Latest CSES 2009 results indicate that approximately 49.2 percent of the active labour force between 15 and 64 years old are self-employed (NIS 2010:64).
Table 14 indicates that Cambodia performs relatively well in primary enrolment compared to other countries in the region, but poorly in secondary and tertiary enrolments. This is likely the main factor underlying the inadequate quality of the country’s workforce. Inadequate quality of workforce, as well as skill mismatches between labour demand and supply sides, undermines the level of returns to education of the labour force in Cambodia. The World Bank study in 2010 (2010b:32) also confirms that returns to education in Cambodia are among the lowest in the region. Except for skill mismatch, supply of labour remains and will continue to be abundant in years to come given high labour force participation rate, particularly the low-educated pool, which indicates that low returns to human capital do not act as constraint on growth. However, improving the quality of the workforce by encouraging youth population to complete secondary and higher education and tackling the issue of skill mismatch in the labour market are keys to resolving the problem of labour surplus and improving labour productivity.
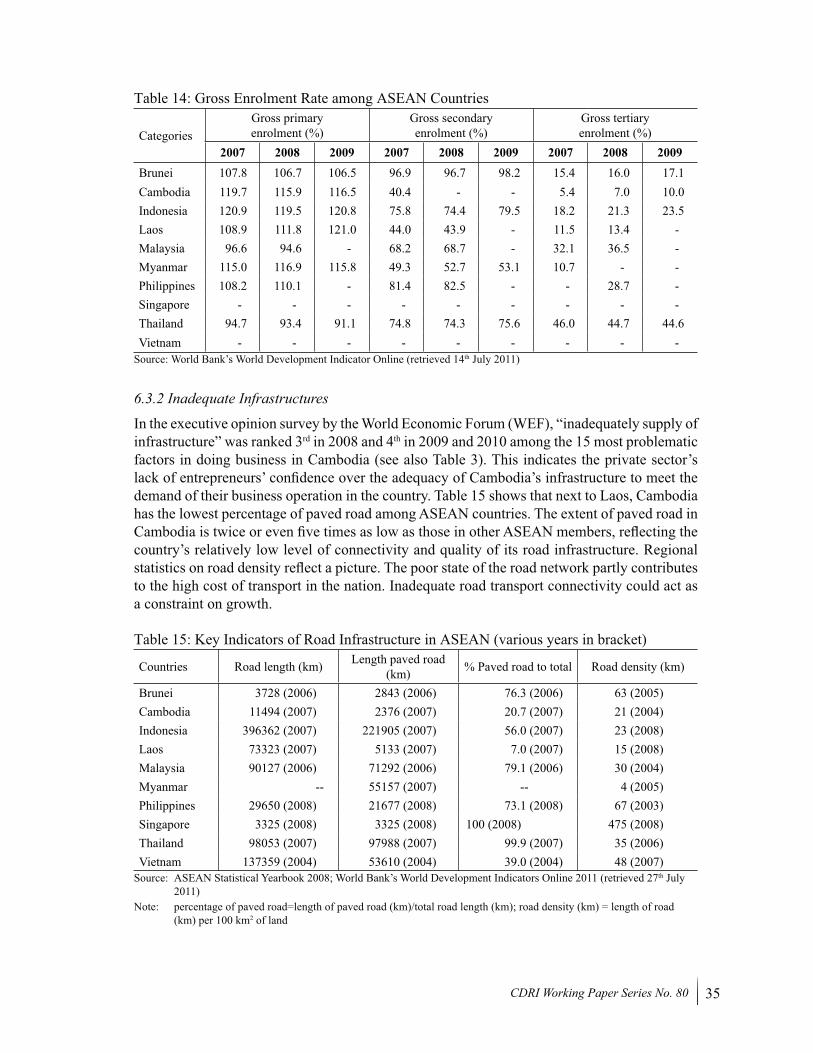
35CDRI Working Paper Series No. 80
Table 14: Gross Enrolment Rate among ASEAN Countries
CategoriesGross primary enrolment (%)
Gross secondary enrolment (%)
Gross tertiary enrolment (%)
2007 2008 2009 2007 2008 2009 2007 2008 2009Brunei 107.8 106.7 106.5 96.9 96.7 98.2 15.4 16.0 17.1Cambodia 119.7 115.9 116.5 40.4 - - 5.4 7.0 10.0Indonesia 120.9 119.5 120.8 75.8 74.4 79.5 18.2 21.3 23.5Laos 108.9 111.8 121.0 44.0 43.9 - 11.5 13.4 -Malaysia 96.6 94.6 - 68.2 68.7 - 32.1 36.5 -Myanmar 115.0 116.9 115.8 49.3 52.7 53.1 10.7 - -Philippines 108.2 110.1 - 81.4 82.5 - - 28.7 -Singapore - - - - - - - - -Thailand 94.7 93.4 91.1 74.8 74.3 75.6 46.0 44.7 44.6Vietnam - - - - - - - - -
Source: World Bank’s World Development Indicator Online (retrieved 14th July 2011)
6.3.2 Inadequate Infrastructures
In the executive opinion survey by the World Economic Forum (WEF), “inadequately supply of infrastructure” was ranked 3rd in 2008 and 4th in 2009 and 2010 among the 15 most problematic factors in doing business in Cambodia (see also Table 3). This indicates the private sector’s lack of entrepreneurs’ confidence over the adequacy of Cambodia’s infrastructure to meet the demand of their business operation in the country. Table 15 shows that next to Laos, Cambodia has the lowest percentage of paved road among ASEAN countries. The extent of paved road in Cambodia is twice or even five times as low as those in other ASEAN members, reflecting the country’s relatively low level of connectivity and quality of its road infrastructure. Regional statistics on road density reflect a picture. The poor state of the road network partly contributes to the high cost of transport in the nation. Inadequate road transport connectivity could act as a constraint on growth.
Table 15: Key Indicators of Road Infrastructure in ASEAN (various years in bracket)
Countries Road length (km) Length paved road (km) % Paved road to total Road density (km)
Brunei 3728 (2006) 2843 (2006) 76.3 (2006) 63 (2005)Cambodia 11494 (2007) 2376 (2007) 20.7 (2007) 21 (2004)Indonesia 396362 (2007) 221905 (2007) 56.0 (2007) 23 (2008)Laos 73323 (2007) 5133 (2007) 7.0 (2007) 15 (2008)Malaysia 90127 (2006) 71292 (2006) 79.1 (2006) 30 (2004)Myanmar -- 55157 (2007) -- 4 (2005)Philippines 29650 (2008) 21677 (2008) 73.1 (2008) 67 (2003)Singapore 3325 (2008) 3325 (2008) 100 (2008) 475 (2008)Thailand 98053 (2007) 97988 (2007) 99.9 (2007) 35 (2006)Vietnam 137359 (2004) 53610 (2004) 39.0 (2004) 48 (2007)
Source: ASEAN Statistical Yearbook 2008; World Bank’s World Development Indicators Online 2011 (retrieved 27th July 2011)
Note: percentage of paved road=length of paved road (km)/total road length (km); road density (km) = length of road (km) per 100 km2 of land
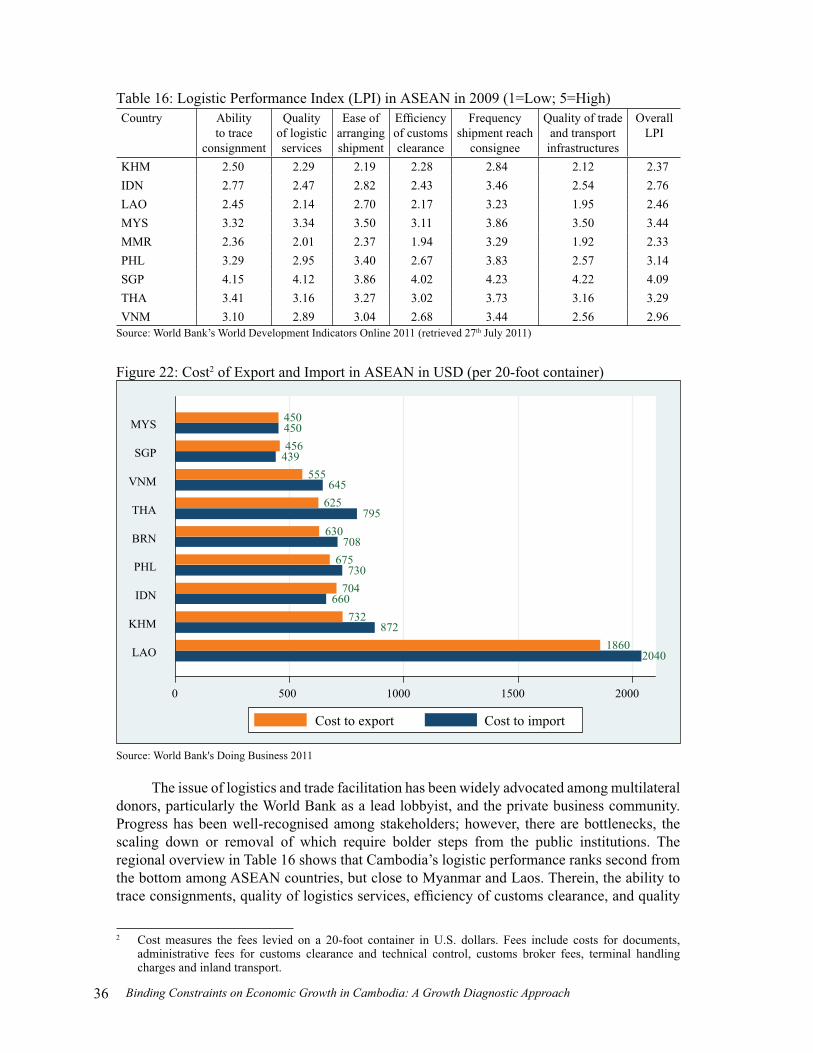
36 Binding Constraints on Economic Growth in Cambodia: A Growth Diagnostic Approach
Table 16: Logistic Performance Index (LPI) in ASEAN in 2009 (1=Low; 5=High)Country Ability
to trace consignment
Quality of logistic services
Ease of arranging shipment
Efficiency of customs clearance
Frequency shipment reach
consignee
Quality of trade and transport
infrastructures
Overall LPI
KHM 2.50 2.29 2.19 2.28 2.84 2.12 2.37IDN 2.77 2.47 2.82 2.43 3.46 2.54 2.76LAO 2.45 2.14 2.70 2.17 3.23 1.95 2.46MYS 3.32 3.34 3.50 3.11 3.86 3.50 3.44MMR 2.36 2.01 2.37 1.94 3.29 1.92 2.33PHL 3.29 2.95 3.40 2.67 3.83 2.57 3.14SGP 4.15 4.12 3.86 4.02 4.23 4.22 4.09THA 3.41 3.16 3.27 3.02 3.73 3.16 3.29VNM 3.10 2.89 3.04 2.68 3.44 2.56 2.96
Source: World Bank’s World Development Indicators Online 2011 (retrieved 27th July 2011)
Figure 22: Cost2 of Export and Import in ASEAN in USD (per 20-foot container)
20401860
872732
660704730
675708
630795
625645
555439456450450
0 500 1000 1500 2000
LAO
KHM
IDN
PHL
BRN
THA
VNM
SGP
MYS
Cost to export Cost to import
Source: World Bank's Doing Business 2011
The issue of logistics and trade facilitation has been widely advocated among multilateral donors, particularly the World Bank as a lead lobbyist, and the private business community. Progress has been well-recognised among stakeholders; however, there are bottlenecks, the scaling down or removal of which require bolder steps from the public institutions. The regional overview in Table 16 shows that Cambodia’s logistic performance ranks second from the bottom among ASEAN countries, but close to Myanmar and Laos. Therein, the ability to trace consignments, quality of logistics services, efficiency of customs clearance, and quality
2 Cost measures the fees levied on a 20-foot container in U.S. dollars. Fees include costs for documents, administrative fees for customs clearance and technical control, customs broker fees, terminal handling charges and inland transport.
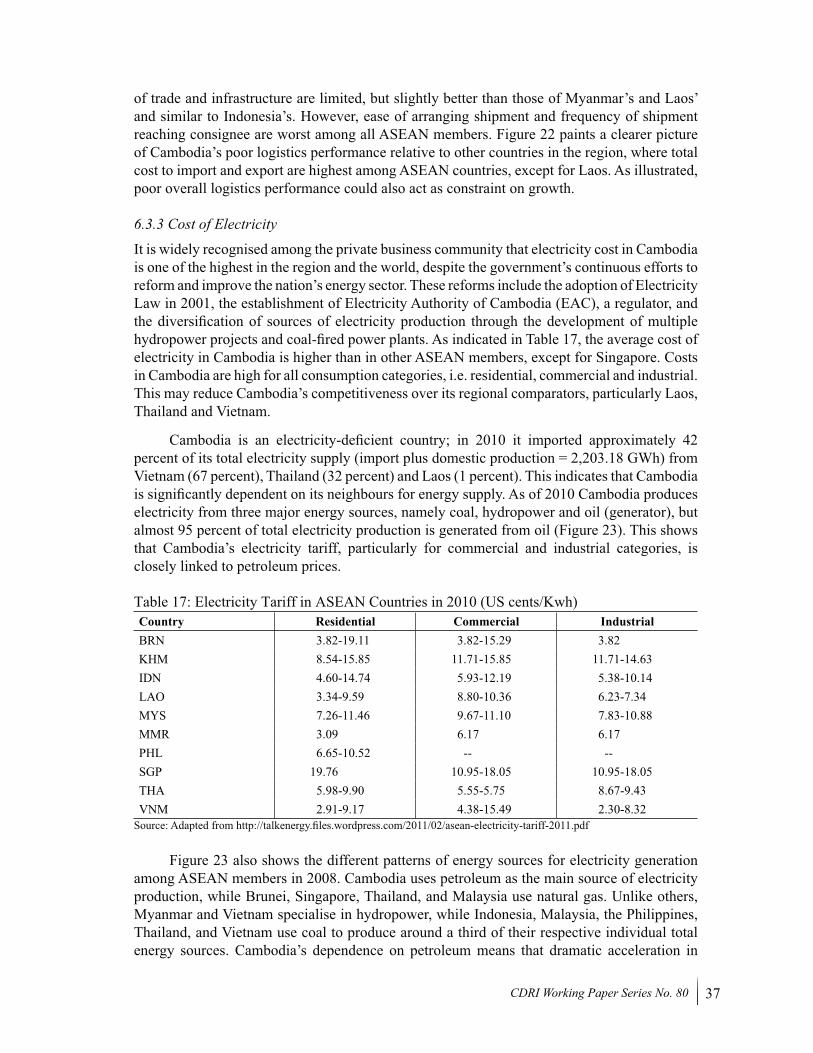
37CDRI Working Paper Series No. 80
of trade and infrastructure are limited, but slightly better than those of Myanmar’s and Laos’ and similar to Indonesia’s. However, ease of arranging shipment and frequency of shipment reaching consignee are worst among all ASEAN members. Figure 22 paints a clearer picture of Cambodia’s poor logistics performance relative to other countries in the region, where total cost to import and export are highest among ASEAN countries, except for Laos. As illustrated, poor overall logistics performance could also act as constraint on growth.
6.3.3 Cost of Electricity
It is widely recognised among the private business community that electricity cost in Cambodia is one of the highest in the region and the world, despite the government’s continuous efforts to reform and improve the nation’s energy sector. These reforms include the adoption of Electricity Law in 2001, the establishment of Electricity Authority of Cambodia (EAC), a regulator, and the diversification of sources of electricity production through the development of multiple hydropower projects and coal-fired power plants. As indicated in Table 17, the average cost of electricity in Cambodia is higher than in other ASEAN members, except for Singapore. Costs in Cambodia are high for all consumption categories, i.e. residential, commercial and industrial. This may reduce Cambodia’s competitiveness over its regional comparators, particularly Laos, Thailand and Vietnam.
Cambodia is an electricity-deficient country; in 2010 it imported approximately 42 percent of its total electricity supply (import plus domestic production = 2,203.18 GWh) from Vietnam (67 percent), Thailand (32 percent) and Laos (1 percent). This indicates that Cambodia is significantly dependent on its neighbours for energy supply. As of 2010 Cambodia produces electricity from three major energy sources, namely coal, hydropower and oil (generator), but almost 95 percent of total electricity production is generated from oil (Figure 23). This shows that Cambodia’s electricity tariff, particularly for commercial and industrial categories, is closely linked to petroleum prices.
Table 17: Electricity Tariff in ASEAN Countries in 2010 (US cents/Kwh)Country Residential Commercial IndustrialBRN 3.82-19.11 3.82-15.29 3.82KHM 8.54-15.85 11.71-15.85 11.71-14.63IDN 4.60-14.74 5.93-12.19 5.38-10.14LAO 3.34-9.59 8.80-10.36 6.23-7.34MYS 7.26-11.46 9.67-11.10 7.83-10.88MMR 3.09 6.17 6.17PHL 6.65-10.52 -- --SGP 19.76 10.95-18.05 10.95-18.05THA 5.98-9.90 5.55-5.75 8.67-9.43VNM 2.91-9.17 4.38-15.49 2.30-8.32
Source: Adapted from http://talkenergy.files.wordpress.com/2011/02/asean-electricity-tariff-2011.pdf
Figure 23 also shows the different patterns of energy sources for electricity generation among ASEAN members in 2008. Cambodia uses petroleum as the main source of electricity production, while Brunei, Singapore, Thailand, and Malaysia use natural gas. Unlike others, Myanmar and Vietnam specialise in hydropower, while Indonesia, Malaysia, the Philippines, Thailand, and Vietnam use coal to produce around a third of their respective individual total energy sources. Cambodia’s dependence on petroleum means that dramatic acceleration in
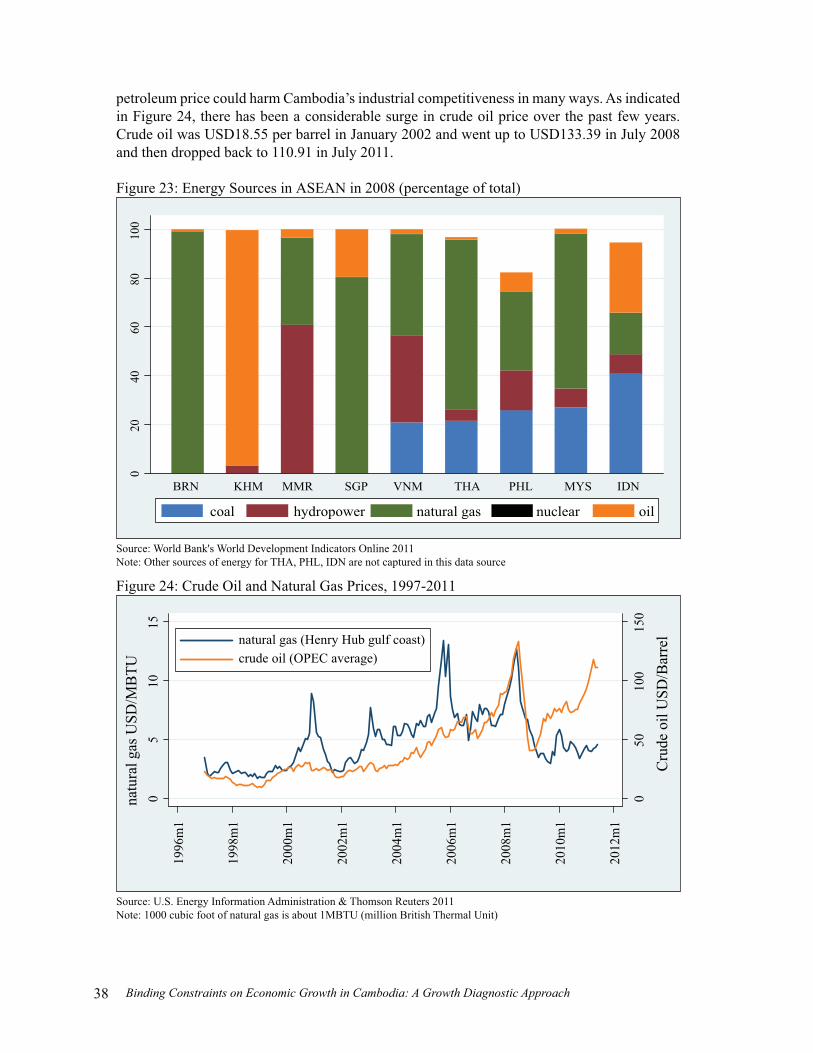
38 Binding Constraints on Economic Growth in Cambodia: A Growth Diagnostic Approach
petroleum price could harm Cambodia’s industrial competitiveness in many ways. As indicated in Figure 24, there has been a considerable surge in crude oil price over the past few years. Crude oil was USD18.55 per barrel in January 2002 and went up to USD133.39 in July 2008 and then dropped back to 110.91 in July 2011.
Figure 23: Energy Sources in ASEAN in 2008 (percentage of total)
020
4060
8010
0
BRN KHM MMR SGP VNM THA PHL MYS IDN
coal hydropower natural gas nuclear oil
Source: World Bank's World Development Indicators Online 2011Note: Other sources of energy for THA, PHL, IDN are not captured in this data source
Figure 24: Crude Oil and Natural Gas Prices, 1997-2011
050
100
150
Cru
de o
il U
SD/B
arre
l
05
1015
natu
ral g
as U
SD/M
BTU
1996
m1
1998
m1
2000
m1
2002
m1
2004
m1
2006
m1
2008
m1
2010
m1
2012
m1
natural gas (Henry Hub gulf coast)crude oil (OPEC average)
Source: U.S. Energy Information Administration & Thomson Reuters 2011Note: 1000 cubic foot of natural gas is about 1MBTU (million British Thermal Unit)
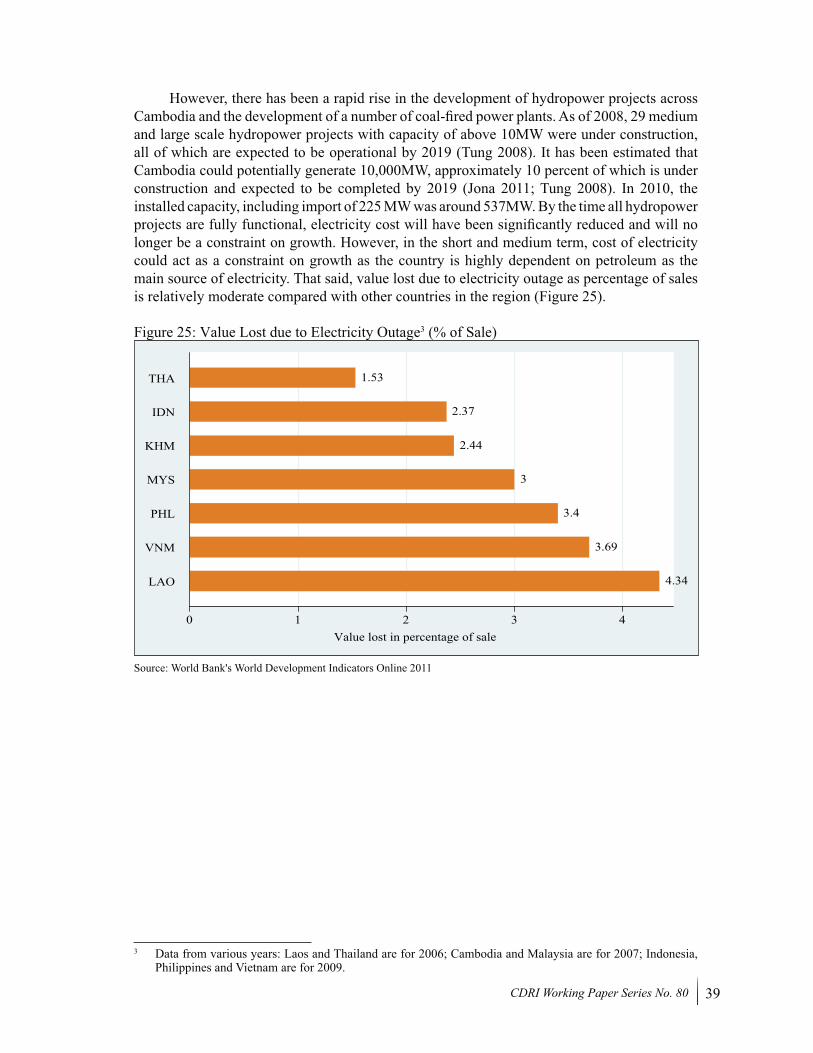
39CDRI Working Paper Series No. 80
However, there has been a rapid rise in the development of hydropower projects across Cambodia and the development of a number of coal-fired power plants. As of 2008, 29 medium and large scale hydropower projects with capacity of above 10MW were under construction, all of which are expected to be operational by 2019 (Tung 2008). It has been estimated that Cambodia could potentially generate 10,000MW, approximately 10 percent of which is under construction and expected to be completed by 2019 (Jona 2011; Tung 2008). In 2010, the installed capacity, including import of 225 MW was around 537MW. By the time all hydropower projects are fully functional, electricity cost will have been significantly reduced and will no longer be a constraint on growth. However, in the short and medium term, cost of electricity could act as a constraint on growth as the country is highly dependent on petroleum as the main source of electricity. That said, value lost due to electricity outage as percentage of sales is relatively moderate compared with other countries in the region (Figure 25).
Figure 25: Value Lost due to Electricity Outage3 (% of Sale)
4.34
3.69
3.4
3
2.44
2.37
1.53
0 1 2 3 4Value lost in percentage of sale
LAO
VNM
PHL
MYS
KHM
IDN
THA
Source: World Bank's World Development Indicators Online 2011
3 Data from various years: Laos and Thailand are for 2006; Cambodia and Malaysia are for 2007; Indonesia, Philippines and Vietnam are for 2009.
40 Binding Constraints on Economic Growth in Cambodia: A Growth Diagnostic Approach
7
CONCLUSION
Cambodia’s output growth has been remarkable during the last decade and a half, except for the downturn in 2008 and contraction in 2009. Growth rebounded in 2010 following the recovery of its regional and global trading partners. Inflation was under control in 2010 registering at 4.0 percent. Export also surged after the crisis, but negative trade balance remains and is highly likely to continue. Garments, tourism, construction and agriculture (the latter dominated by paddy rice) remained the key drivers after the crisis, but a slower pace of expansion was evident in the construction sector and renewed actions to promote paddy rice production and milled rice export emerged in mid 2010. Overall concern about macroeconomic risk started to dissipate gradually once the rebound of the growth-enhancing sectors became apparent.
On binding constraints to growth, the study finds that as of 2009 the cost of finance does not appear to have been a constraint. Even though real lending rate went up to 19.5 percent in 2009, the highest among ASEAN members, from -9.0 percent in 2008, the increase resulted primarily from the surge in consumer prices. Credit to private sector continued to grow by 5 percent in 2009 despite sluggish economic activities during the year, but lower than the 77 percent growth of credit to private sector in 2007 and 50 percent growth in 2008. In addition, there is sign of constraint on access to international finance as executives surveyed in the World Economic Forum Report rank “foreign currency regulations” 14th in 2009 and 13th in 2010 out of 15 factors worrying investors in doing business in Cambodia. Macroeconomic risk was no longer a concern for firms’ appropriability of return in 2010 after inflation has returned to the pre-crisis rate and the exchange rate fluctuations had been brought under control. Corporate tax rate and land right do not appear to be constraint, but corruption, lack of dispute settlement mechanisms, limited law enforcement and tax administration are likely to be constraints on growth.
The problem of limited self-discovery is also evident during 2000-2009. Although Cambodia exported on average 260 new products, approximately 35.3 percent of the total number of exported goods, the proportion of the number of exported products discontinued after one year to total number of exported goods over 2000-09 period was around 31.8 percent, and the survival rate of new exported products stood at around 39.9 percent, which is not bad and indicates that level of self-discovery is not a strong constraint on growth. On the other hand, the issue of lack of coordination could constrain growth as evidence across various sectors of the economy has been highlighted on how coordination problem distorts the market outcome and exacerbates the inefficient use of productive resources.
On the human capital side, there has been significant turnaround in Cambodia’s demography. The country has the youngest population in the region, which creates a critical challenge for the current narrow-based economy to generate sufficient employment for its young workforce. Despite skill mismatch in the labour market and low education of the workforce resulting in low returns to education, low human capital at aggregate level does not act as constraint on growth. However, there is need for improvement in the quality of the labour force by encouraging youth population to stay and complete secondary and higher education, as well as providing relevant vocational training, which is highly relevant to self-employed youth.
41CDRI Working Paper Series No. 80
From the demand side, that “inadequate supply of infrastructure” was scored highly and ranked as the 3rd and 4th most problematic factors in doing business in Cambodia in 2008 and 4th in 2010, reflects the high cost of transport in the country. On the supply side, the extent of Cambodia’s paved road is twice or even five times as low as in those of other ASEAN members, and road density is also the lowest in the region, which indicates the relatively low level of road connectivity and quality. Also, its poor logistic performance in comparison with ASEAN members also contributes to the high cost of transport in the country. Therefore, road and logistics infrastructure could act as a constraint on growth. Last, given that the cost of electricity is highest in the region, the price of energy could also act as constraint on growth but only in the short and medium term, as considerable number of hydropower and coal-fired plants are underway and expected to be fully functional by 2020.
42 Binding Constraints on Economic Growth in Cambodia: A Growth Diagnostic Approach
REFERENCES
CDRI (2010), “Annual Development Review 2009-2010” (Phnom Penh: CDRI)Development Consulting International (2003), “Private Sector Assessment for the Kingdom
of Cambodia,” TA Report for the Asian Development Bank, TA No.4030-CAM (December 2003)
Guimbert, S. (2010), “Cambodia 1998-2008: An Episode of Rapid Growth”, Policy Research Working Paper No. 5271 (Washington, DC: World Bank)
Hang, C.N. (2009), “Cambodian Economy: Charting the Course of a Brighter Future, A Survey of Progress, Problems and Prospects” (Phnom Penh: ADB)
Hausmann, R., Rodrik, D. & Velasco, A. (2005), “Growth Diagnostics” (Cambridge, MA: Harvard University)
Heritage Foundation (2010), “2010 Index of Economic Freedom”, http://www.heritage.org/index/download (accessed 27th July 2012)
IFC (2010), “Understanding Cambodian Small and Medium Enterprise Needs for Financial Services and Products” (Phnom Penh: IFC)
IMF (2011), “Cambodia: 2010 Article IV Consultation—Staff Report; Staff Statement and Supplement; Public Information Notice on the Executive Board Discussion; and Statement by the Executive Director for Cambodia,” IMF Country Report No.11/45 (Phnom Penh: IMF)
IMF (2009), “Cambodia: Statistical Appendix”, IMF Country Report No. 9/48 (Phnom Penh: IMF)
Jona, V. (2011), “Cambodia Energy Status & Its Development”, Presentation at the 2011 Cambodia Outlook Conference, Phnom Penh, March 16, 2011
Khun, K., Chhe, P. & Hun, K. (2008), “Quality Standards and Returns for Natural Rubber Export” Trade Analysis and Reform Project (Unpublished)
MAFF (2010), “Annual Report for the Agriculture, Forestry and Fisheries 2009-2010” (Phnom Penh: MAFF)
MAFF (2009), “Annual Report for the Agriculture, Forestry and Fisheries 2008-2009” (Phnom Penh: MAFF)
MOT (2008), “Tourism Statistical Report 2008” (Phnom Penh: MOT)MOT (2009), “Tourism Statistical Report October 2009” (Phnom Penh: MOT)NBC (2009), “Annual Report 2009”, Report of the Banking Supervision Department (Phnom
Penh: NBC)NBC (2008), “Annual Report 2008”, Report of the Banking Supervision Department (Phnom
Penh: NBC)NBC (2007), “Annual Report 2007”, Report of the Banking Supervision Department (Phnom
Penh: NBC)NIS (2010), “Cambodia Socio-Economic Survey 2009”, (Phnom Penh: MOP)NIS (2008), “Cambodia Statistic Yearbook 2008”, (Phnom Penh: MOP)NIS (2006), “Cambodia Statistic Yearbook 2006”, (Phnom Penh: MOP)Patrinos, H.A., Ridao-Cano, C. & Sakellariou, C. (2006), “Estimating the Return to Education:
Accounting for Heterogeneity in Ability” World Bank Policy Research Working Paper 4040 (Washington, DC: World Bank)
43CDRI Working Paper Series No. 80
Saing, C. H., Hem, S. & Ouch, C. (2011), “Foreign Investment in Agriculture in Cambodia” (forthcoming)
Sakellariou, C. (2008), “Demand for Skills, Supply of Skills and Returns to Schooling in Cambodia” Economic Growth Center Working Paper No. 2008/5 (Singapore: Nanyang Technology University)
Tung, S. (2008), “Hydropower Development in Cambodia”, Presentation at Regional Multi-Stakeholder on MRC’s Hydropower Program on 25-26 September 2008, Vientiane, Laos http://www.mrcmekong.org/download/Presentations/regional-hydro/2.1%20Cambodia-PresentationMRC_lao_Final.pdf (accessed 9th June 2011)
World Bank (2011), “World Development Indicators 2011” (Washington, DC: World Bank) World Bank (2010a), “Doing Business 2011: Making a Difference for Entrepreneurs”
(Washington, DC: World Bank)World Bank (2010b), “Providing Skills for Equity and Growth: Preparing Cambodia’s Youth
for the Labour Market” (Washington, DC: World Bank)World Bank (2009a), “Second Investment Climate Assessment: A Better Investment Climate
to Sustain Growth in Cambodia” (Phnom Penh: World Bank)World Bank (2009b), “Sustaining Rapid Growth in a Challenging Environment: Cambodia
Country Economic Memorandum” (Phnom Penh: World Bank)World Bank (2007), “Sharing Growth: Equity and Development in Cambodia,” Equity Report
2007 (Phnom Penh: World Bank)World Bank (2006a), “Halving Poverty by 2015? Poverty Assessment 2006,” (Phnom Penh:
World Bank)World Bank (2006b), “Development and the Next Generation: World Development Report
2007” (Washington, DC: World Bank) World Bank (2004a), “Cambodia at the Crossroads: Strengthening Accountability to Reduce
Poverty”, (Phnom Penh: World Bank)World Bank (2004b), “Seizing Global Opportunity: Investment Climate Assessment and
Reform Strategy for Cambodia” (Phnom Penh: World Bank)World Economic Forum (2011), “The Global Competitiveness Report 2011-2012” (Geneva:
World Economic Forum) World Economic Forum (2010), “The Global Competitiveness Report 2010-2011” (Geneva:
World Economic Forum) World Economic Forum (2009), “The Global Competitiveness Report 2009-2010” (Geneva:
World Economic Forum)
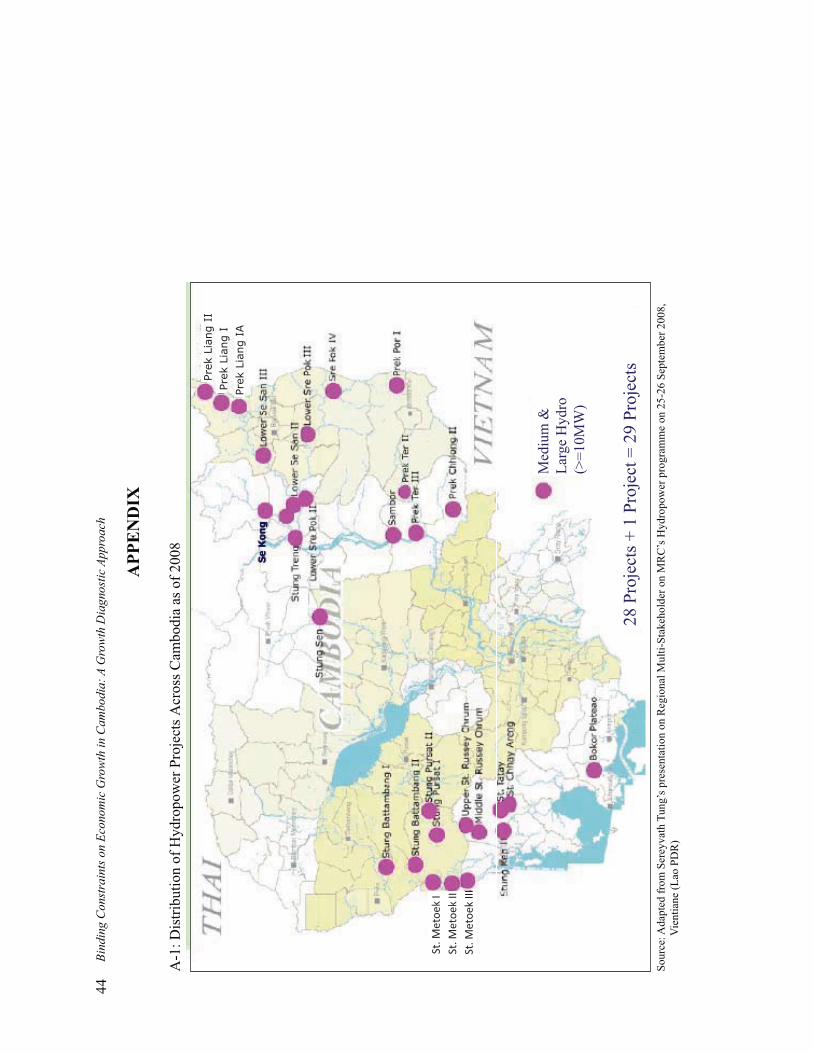
44Bi
ndin
g C
onst
rain
ts o
n Ec
onom
ic G
row
th in
Cam
bodi
a: A
Gro
wth
Dia
gnos
tic A
ppro
ach
APP
EN
DIX
A-1
: Dis
tribu
tion
of H
ydro
pow
er P
roje
cts A
cros
s Cam
bodi
a as
of 2
008
28 P
roje
cts +
1 P
roje
ct =
29
Proj
ects
Med
ium
&
Larg
e H
ydro
(>=1
0MW
)
St. M
etoe
k I
St. M
etoe
k II
St. M
etoe
k III
Prek
Lia
ng I
Prek
Lia
ng I
I
Se K
on
g
Prek
Lia
ng I
A
Sour
ce: A
dapt
ed fr
om S
erey
vath
Tun
g’s p
rese
ntat
ion
on R
egio
nal M
ulti-
Stak
ehol
der o
n M
RC
’s H
ydro
pow
er p
rogr
amm
e on
25-
26 S
epte
mbe
r 200
8,
Vie
ntia
ne (L
ao P
DR
)
45CDRI Working Paper Series No. 80
CDRI WORKING PAPERS
1) Kannan, K.P. (November 1995), Construction of a Consumer Price Index for Cambodia: A Review of Current Practices and Suggestions for Improvement.
2) McAndrew, John P. (January 1996), Aid Infusions, Aid Illusions: Bilateral and Multilateral Emergency and Development Assistance in Cambodia. 1992-1995.
3) Kannan, K.P. (January 1997), Economic Reform, Structural Adjustment and Development in Cambodia.
4) Chim Charya, Srun Pithou, So Sovannarith, John McAndrew, Nguon Sokunthea, Pon Dorina & Robin Biddulph (June 1998), Learning from Rural Development Programmes in Cambodia.
5) Kato, Toshiyasu, Chan Sophal & Long Vou Piseth (September 1998), Regional Economic Integration for Sustainable Development in Cambodia.
6) Murshid, K.A.S. (December 1998), Food Security in an Asian Transitional Economy: The Cambodian Experience.
7) McAndrew, John P. (December 1998), Interdependence in Household Livelihood Strategies in Two Cambodian Villages.
8) Chan Sophal, Martin Godfrey, Toshiyasu Kato, Long Vou Piseth, Nina Orlova, Per Ronnås & Tia Savora (January 1999), Cambodia: The Challenge of Productive Employment Creation.
9) Teng You Ky, Pon Dorina, So Sovannarith & John McAndrew (April 1999), The UNICEF/Community Action for Social Development Experience—Learning from Rural Development Programmes in Cambodia.
10) Gorman, Siobhan, with Pon Dorina & Sok Kheng (June 1999), Gender and Development in Cambodia: An Overview.
11) Chan Sophal & So Sovannarith (June 1999), Cambodian Labour Migration to Thailand: A Preliminary Assessment.
12) Chan Sophal, Toshiyasu Kato, Long Vou Piseth, So Sovannarith, Tia Savora, Hang Chuon Naron, Kao Kim Hourn & Chea Vuthna (September 1999), Impact of the Asian Financial Crisis on the SEATEs: The Cambodian Perspective.
13) Ung Bunleng, (January 2000), Seasonality in the Cambodian Consumer Price Index. 14) Toshiyasu Kato, Jeffrey A. Kaplan, Chan Sophal & Real Sopheap (May 2000), Enhancing
Governance for Sustainable Development. 15) Godfrey, Martin, Chan Sophal, Toshiyasu Kato, Long Vou Piseth, Pon Dorina, Tep
Saravy, Tia Savara & So Sovannarith (August 2000), Technical Assistance and Capacity Development in an Aid-dependent Economy: the Experience of Cambodia.
16) Sik Boreak, (September 2000), Land Ownership, Sales and Concentration in Cambodia.17) Chan Sophal, & So Sovannarith, with Pon Dorina (December 2000), Technical Assistance
and Capacity Development at the School of Agriculture Prek Leap. 18) Godfrey, Martin, So Sovannarith, Tep Saravy, Pon Dorina, Claude Katz, Sarthi Acharya,
Sisowath D. Chanto & Hing Thoraxy (August 2001), A Study of the Cambodian Labour Market: Reference to Poverty Reduction, Growth and Adjustment to Crisis.
19) Chan Sophal, Tep Saravy & Sarthi Acharya (October 2001), Land Tenure in Cambodia: a Data Update.
46 Binding Constraints on Economic Growth in Cambodia: A Growth Diagnostic Approach
20) So Sovannarith, Real Sopheap, Uch Utey, Sy Rathmony, Brett Ballard & Sarthi Acharya (November 2001), Social Assessment of Land in Cambodia: A Field Study.
21) Bhargavi Ramamurthy, Sik Boreak, Per Ronnås and Sok Hach (December 2001), Cambodia 1999-2000: Land, Labour and Rural Livelihood in Focus.
22) Chan Sophal & Sarthi Acharya (July 2002), Land Transactions in Cambodia: An Analysis of Transfers and Transaction Records.
23) McKenney, Bruce & Prom Tola. (July 2002), Natural Resources and Rural Livelihoods in Cambodia.
24) Kim Sedara, Chan Sophal & Sarthi Acharya (July 2002), Land, Rural Livelihoods and Food Security in Cambodia.
25) Chan Sophal & Sarthi Acharya (December 2002), Facing the Challenge of Rural Livelihoods: A Perspective from Nine Villages in Cambodia.
26) Sarthi Acharya, Kim Sedara, Chap Sotharith & Meach Yady (February 2003), Off-farm and Non-farm Employment: A Perspective on Job Creation in Cambodia.
27) Yim Chea & Bruce McKenney (October 2003), Fish Exports from the Great Lake to Thailand: An Analysis of Trade Constraints, Governance, and the Climate for Growth.
28) Prom Tola & Bruce McKenney (November 2003), Trading Forest Products in Cambodia: Challenges, Threats, and Opportunities for Resin.
29) Yim Chea & Bruce McKenney (November 2003), Domestic Fish Trade: A Case Study of Fish Marketing from the Great Lake to Phnom Penh.
30) Hughes, Caroline & Kim Sedara with the assistance of Ann Sovatha (February 2004), The Evolution of Democratic Process and Conflict Management in Cambodia: A Comparative Study of Three Cambodian Elections.
31) Oberndorf, Robert B. (May 2004), Law Harmonisation in Relation to the Decentralisation Process in Cambodia.
32) Murshid, K.A.S. & Tuot Sokphally (April 2005), The Cross Border Economy of Cambodia: An Exploratory Study.
33) Hansen, Kasper K. & Neth Top (December 2006), Natural Forest Benefits and Economic Analysis of Natural Forest Conversion in Cambodia.
34) Pak Kimchoeun, Horng Vuthy, Eng Netra, Ann Sovatha, Kim Sedara, Jenny Knowles & David Craig (March 2007), Accountability and Neo-patrimonialism in Cambodia: A Critical Literature Review.
35) Kim Sedara & Joakim Öjendal with the assistance of Ann Sovatha (May 2007), Where Decentralisation Meets Democracy: Civil Society, Local Government, and Accountability in Cambodia.
36) Lim Sovannara (November 2007), Youth Migration and Urbanisation in Cambodia. 37) Chem Phalla et al. (May 2008), Framing Research on Water Resources Management and
Governance in Cambodia: A Literature Review.38) Pak Kimchoeun and David Craig (July 2008), Accountability and Public Expenditure
Management in Decentralised Cambodia.39) Horng Vuthy and David Craig (July 2008), Accountability and Planning in Decentralised
Cambodia.40) Eng Netra and David Craig (March 2009), Accountability and Human Resource Management
in Decentralised Cambodia.
47CDRI Working Paper Series No. 80
41) Hing Vutha and Hossein Jalilian (April 2009), The Environmental Impacts of the ASEAN-China Free Trade Agreement for Countries in the Greater Mekong Sub-region.
42) Thon Vimealea, Ou Sivhuoch, Eng Netra and Ly Tem (October 2009), Leadership in Local Politics of Cambodia: A Study of Leaders in Three Communes of Three Provinces.
43) Hing Vutha and Thun Vathana (December 2009), Agricultural Trade in the Greater Mekong Sub-region: The Case of Cassava and Rubber in Cambodia.
44) Chan Sophal (December 2009), Economic Costs and Benefits of Cross-border Labour Migration in the GMS: Cambodia Country Study.
45) CDRI Publication (December 2009), Economic Costs and Benefits of Cross-country Labour Migration in the GMS: Synthesis of the Case Studies in Thailand, Cambodia, Laos and Vietnam.
46) CDRI Publication (December 2009), Agriculture Trade in the Greater Mekong Sub-region: Synthesis of the Case Studies on Cassava and Rubber Production and Trade in GMS Countries.
47) Chea Chou (August 2010), The Local Governance of Common Pool Resources: The case of Irrigation Water in Cambodia.
48) CDRI Publication (August 2010), Empirical Evidence of Irrigation Management in the Tonle Sap Basin: Issues and Challenges.
49) Chem Phalla and Someth Paradis (March 2011), Use of Hydrological knowledge and Community Participation for Improving Decision-making on Irrigation Water Allocation.
50) Pak Kimchoeun (May 2011), Fiscal Decentralisation in Cambodia: A Review of Progress and Challenges
51) Christopher Wokker, Paulo Santos, Ros Bansok and Kate Griffiths (June 2011), Irrigation Water Productivity in Cambodian Rice System
52) Ouch Chandarany, Saing Chanhang and Phann Dalis (June 2011), Assessing China’s Impact on Poverty Reduction In the Greater Mekong Sub-region: The Case of Cambodia
53) SO Sovannarith, Blake D. Ratner, Mam Kosal and Kim Sour (June 2011), Conflict and Collective Action in Tonle Sap Fisheries: Adapting Institutions to Support Community Livelihoods
54) Nang Phirun, Khiev Daravy, Philip Hirsch and Isabelle Whitehead (June 2011), Improving the Governance of Water Resources in Cambodia: A Stakeholder Analysis
55) Kem Sothorn, Chhim Chhun, Theng Vuthy and SO Sovannarith (July 2011), Policy coherence in agricultural and rural development: Cambodia
56) Tong Kimsun, Hem Socheth and Paulo Santos (July 2011), What Limits Agricultural intensification in Cambodia? The Role of Emigration, Agricultural Extension Services and Credit Constraints
57) Tong Kimsun, Hem Socheth and Paulo Santos (August 2011), The Impact of Irrigation on Household Assets
58) Hing Vutha, Lun Pide and Phann Dalis (August 2011), Irregular Migration from Cambodia: Characteristics, Challenges and Regulatory Approach.
59) Chem Phalla, Philip Hirsch and Someth Paradis (September 2011), Hydrological Analysis in Support of Irrigation Management: A Case Study of Stung Chrey Bak Catchment, Cambodia
48 Binding Constraints on Economic Growth in Cambodia: A Growth Diagnostic Approach
60) Saing Chan Hang, Hem Socheth and Ouch Chandarany with Phann Dalis and Pon Dorina (November 2011), Foreign Investment in Agriculture in Cambodia
61) Ros Bandeth, Ly Tem and Anna Thompson (September 2011), Catchment Governance and Cooperation Dilemmas: A Case Study from Cambodia.
62) Chea Chou, Nang Phirun, Isabelle Whitehead, Phillip Hirsch and Anna Thompson (October 2011), Decentralised Governance of Irrigation Water in Cambodia: Matching Principles to Local Realities.
63) Heng Seiha, Kim Sedara and So Sokbunthoeun (October 2011), Decentralised Governance in Hybrid Polity: Localisation of Decentralisation Reform in Cambodia
64) Tong Kimsun and Sry Bopharath (November 2011), Poverty and Environment Links: The Case of Rural Cambodia.
65) Ros Bansok, Nang Phirun and Chhim Chhun (December 2011), Agricultural Development and Climate Change: The Case of Cambodia
66) TONG Kimsun (February 2012), Analysing Chronic Poverty in Rural Cambodia Evidence from Panel Data
67) Keith Carpenter with assistance from PON Dorina (February 2012), A Basic Consumer Price Index for Cambodia 1993–2009
68) Roth Vathana (March 2012), Sectoral Composition of China’s Economic Growth, Poverty Reduction and Inequality: Development and Policy Implications for Cambodia
69) CDRI Publication (March 2012), Understanding Poverty Dynamics: Evidence from Nine Villages in Cambodia
70) Hing Vutha, Saing Chan Hang and Khieng Sothy (August 2012), Baseline Survey for Socioeconomic Impact Assessment: Greater Mekong Sub-region Transmission Project
71) Kim Sedara and Joakim Öjendal with Chhoun Nareth and Ly Tem (December 2012), A Gendered Analysis of Decentralisation Reform in Cambodia
72) Hem Socheth (March 2013), Impact of the Global Financial Crisis on Cambodian Economy at Macro and Sectoral Levels
73) Hay Sovuthea (March 2013), Government Response to Inflation Crisis and Global Financial Crisis
74) Ngin Chanrith (March 2013), Impact of the Global Financial Crisis on Employment in SMEs in Cambodia
75) Tong Kimsun (March 2013), Impact of the Global Financial Crisis on Poverty: Evidence from Nine Villages in Cambodia
76) Hing Vutha (March 2013), Impact of the Global Financial Crisis on the Rural Labour Market: Evidence from Nine Villages in Cambodia
77) Saing Chan Hang (March 2013), Households’ Vulnerability to Global Financial Crisis and Their Risk Coping Strategies: Evidence from Nine Rural Villages in Cambodia
78) Tong Kimsun and Phay Sokcheng (March 2013), The Role of Income Diversification during the Global Financial Crisis: Evidence from Nine Villages in Cambodia
79) Lun Pidé (March 2013), The Role of Rural Credit during the Global Financial Crisis: Evidence From Nine Villages in Cambodia

� 56 Street 315, Tuol Kork� PO Box 622, Phnom Penh, Cambodia℡ (855 23) 881 384/881 701/881 916/883 603� (855 23) 880 734
E-mail: [email protected]: www.cdri.org.kh
Price: USD3.00
CDRI - Cambodia’s leading independent development policy research institute