Embed Size (px)
Citation preview

BIM and Building Performance Modeling Integration, in Minimizing the Annual Energy
Demand of Typical Cypriot Dwellings
Yashar Mohamadi
Submitted to the
Institute of Graduate Studies and Research In partial fulfillment of the requirements for the degree of
Master of Science in
Civil Engineering
Eastern Mediterranean University August 2012
Gazimağusa, North Cyprus
Approval of the Institute of Graduate Studies and Research
Prof. Dr. Elvan Yılmaz Director
I certify that this thesis satisfies the requirements as a thesis for the degree of Master of Science in Civil Engineering.
Asst. Prof. Dr. Murude Çelikağ Chair, Department of Civil Engineering
We certify that we have read this thesis and that in our opinion it is fully adequate in scope and quality as a thesis for the degree of Master of Science in Civil Engineering.
Prof. Dr. Tahir Çelik Supervisor
Examining Committee
1 Prof. Dr. Tahir Çelik
2 Asst. Prof. Dr. Mehmedali Egemen
3 Asst. Prof. Dr. Serhan Sensoy

iii
ABSTRACT
The significance of energy conservation cannot be overstated. Besides, in hot and
humid climate conditions annual energy demands is comparatively higher due to air
conditioning usage for cooling the living spaces. Total annual energy consumption
adds up to nearly 50% of the total energy consumption in Cyprus where thermal
insulation is not applied to most dwellings’ external envelopes.
In the current study, the integration of Building Information Modeling (BIM) and
Building Performance Modeling was carried out in order to identify measures to
minimize annual energy consumption in a Cypriot single family detached house. For
the modeling process two prominent BIM programs namely, Autodesk Revit and
Autodesk Ecotect were used. Furthermore, P1-P2 mathematical method and Net
Present Value were used for optimization and comparison purposes.
As a result, the best combination of conventional construction materials used in
Cyprus from energy consumption point of view was proposed. Additionally, in order
to improve thermal performance of residences, applying 1.6cm high density
Rockwool as the outside insulation layer of roof, using double glazed windows and
using solid core doors found to be the most effective and economic measures taking
which leads to 8654 Turkish Lira saving in 30 years horizon (July 2012 Prices and
rates). In addition, by taking the aforementioned measures, thermal comfort will be
increased by 41%.
Besides, the sensitivity analysis divulged the intense dependency of net saving as
the result of improving thermal performance of dwellings, on the interest rate,
material price and electricity tariff changes. A rise in insulation material’s price as

iv
well as interest rate increased the payback period while the trend was different for
electricity tariff.
Additionally, the effect of low quality construction implementation was studied
by altering the air change rate in the simulation program. The impact found
noticeable, accounting for up to 2300 kWh increase in electricity consumption if the
project is poorly implemented.
Similarly, increasing the glazing size led to a surge in annual energy demand, as if
the fenestration area enlarged to 60%, neutralizes the effect of improving thermal
performance of a 20%-glazed residential unit.
Keywords: BIM, building performance modeling, Autodesk Revit, Autodesk
Ecotect, Cypriot typical houses, annual energy consumption

v
ÖZ
Enerji tasarrufu konusu yeterince önemsenmemektedir. Özellikle sıcak ve nemli
hava koşullarında yaşam alanlarında soğutma amaçlı ihtiyaç duyulan enerji miktarı
oldukça yüksektir. Kıbrıs’ta yıllık toplam enerji tüketiminin yaklaşık %50’si dış
kabukta ısı izolasyonu uygulanmayan evlerde meydana gelmektedir.
Bu çalışmada normal bir Kıbrıs evi ele alınarak yıllık enerji tüketimini en aza
indirmek amacı ile Bina Bilgi Modellemesi (BIM) ve Bina Performans Modellemesi
tekniği uygulanmıştır. Modelleme işlemi için Autodesk Revit ve Autodesk Ecotect
bilgisayar programları kullanılmıştır. Ayrıca, optimizasyon ve karşılaştırmalar
yapmak amacı ile P1–P2 matematik metodu ve “bugünkü net değer” hesabı
kullanılmıştır.
Yapılan çalışmalar neticesinde enerji tüketimini en aza indirme amacı ile,
Kıbrıs’ta ev yapımında kullanılabilecek en uygun yapı malzemeleri önerilmiştir.
Ayrıca evlerin ısı izlasyonu performansını artırmak amacı ile çatıda taş yünü
kaplaması, pencerelerin çift cam yapılması ve kapıların dolu kapı olması enerji
harcamalarında tasarrufa sebep olmasından dolayı 30 yıl içerisinde yaklaşık 8,654
TL tasarruf sağlamaktadır. Ayrıca ısı konforunda %41’lik bir artış sağlamaktadır.
Yapılan “hassasiyet analizi” neticesinde, evlerde ısı izolasyonu performansının en
çok malzeme fiyatlarına, para faizine ve elektrik tarifesine bağlı olduğu ortaya
çıkmıştır. İzolasyon malzemesi ve faiz oranlarının artması geri ödeme periodunu
artırmakta iken elektirk tarifeleri artışında bu eğilim farklıdır.
Ayrıca, hava değişim simulasyonu uygulanarak düşük kaliteli inşaat
uygulamalarının elekrik tüketimi üzerindeki etkisi de çalışılmıştır. Bu çalışmaların

vi
sonucunda düşük kaliteli proje uygulamalarında yıllık elektrik enerjisi harcamasında
2300 kWH artış gözlemlenmiştir.
Evlerdeki kapı ve pencere açıklıklarının bina enerji performansı üzerine olan
etkileri de araştırılmıştır. Elde edilen verilere gore, binalardaki bu tip açıklıklar %20
oranından %60 oranına çıkarılması halinde, binanın enerji tasarrufundaki tüm
kazanımları ortadan kalkmaktadır.
Anahtar kelimeler: BIM, bina performans modellemesi, Autodesk Revit,
Autodesk Ecotect, Kıbrıs'ın geleneksel evleri, yıllık enerji tüketimin

vii
TABLE OF CONTENTS
ABSTRACT ........................................................................................................... iii
ÖZ ............................................................................................................................ v
LIST OF TABLES ................................................................................................ xii
LIST OF FIGURES ............................................................................................... xv
LIST OF GRAPHS .............................................................................................. xvii
LIST OF FORMULAS ....................................................................................... xviii
1 INTRODUCTION ................................................................................................ 1
1.1 Background .................................................................................................... 1
1.2 Scope and Objectives .................................................................................... 3
1.3 Works Undertaken ......................................................................................... 4
1.4 Achievements ................................................................................................ 6
1.5 Limitations of Study ...................................................................................... 7
1.6 Guide to Thesis .............................................................................................. 8
2 LITERATURE REVIEW ................................................................................... 10
2.1 Introduction ................................................................................................. 10
2.2 Insulation Material’s Optimum Thickness .................................................. 11
2.2.1 Introduction .......................................................................................... 11
2.2.2 Insulation Thickness Optimization ....................................................... 12
2.3 Thermal Insulation Materials ...................................................................... 19
2.4 Researches Utilizing Computer Programs for Thermal Simulation ............ 21
2.4.1 Introduction .......................................................................................... 21
2.4.2 Autodesk Ecotect .................................................................................. 22
viii
2.4.2 EnergyPlus ........................................................................................... 22
2.4.3 eQuest ................................................................................................... 24
2.4.4 TRNSYS ............................................................................................... 25
2.4.5 Studies Based on Less Popular Programs ............................................ 25
2.4.6 Investigations Providing Comparative Analysis of Simulation Tools . 27
2.5 Energy Life Cycle Costing .......................................................................... 28
2.5.1 Introduction .......................................................................................... 28
2.5.2 Energy Life Cycle Costs ...................................................................... 29
2.6 Airtightness Effect on Building Energy Consumption ............................... 32
2.7 Cyprus as Case Study in Literatures ........................................................... 33
2.8 Non-Monetary Benefits of Improving Thermal Performance ..................... 39
3 METHODOLOGY ............................................................................................. 41
3.1 Introduction ................................................................................................. 41
3.2 Modeling Process ........................................................................................ 42
3.2.1 Autodesk Revit ..................................................................................... 42
3.2.2 Autodesk Ecotect .................................................................................. 50
3.3 Available Thermal Insulation Materials in Cyprus ..................................... 58
3.4 Conventional Building External Envelopes in Cyprus ............................... 60
3.4.1 Walls ..................................................................................................... 61
3.4.1.1 Wall Type 1 ................................................................................ 61
3.4.1.2 Wall Type 2 ................................................................................ 62
3.4.1.3 Wall Type 3 ................................................................................ 63
3.4.1.4 Wall Type 4 ................................................................................ 64
3.4.1.5 Wall Type 5 ................................................................................ 65
ix
3.4.1.6 Wall Type 6 ................................................................................ 66
3.4.1.7 Wall Type 7 ................................................................................ 67
3.4.1.8 Wall Type 8 ................................................................................ 68
3.4.1.9 Wall Type 9 ................................................................................ 69
3.4.1.10 Wall Type 10 ............................................................................ 70
3.4.2 Floors .................................................................................................... 71
3.4.2.1 Floor Type 1 ............................................................................... 71
3.4.2.2 Floor Type 2 ............................................................................... 72
3.4.2.3 Floor Type 3 ............................................................................... 73
3.4.2.4 Floor Type 4 ............................................................................... 74
3.4.3 Roofs .................................................................................................... 75
3.4.3.1 Roof Type 1 ................................................................................ 75
3.4.3.2 Roof Type2 ................................................................................. 76
3.4.3.3 Roof Type3 ................................................................................. 77
3.4.4 Windows ............................................................................................... 78
3.4.4.1 Window Type 1 .......................................................................... 78
3.4.4.2 Window Type 2 .......................................................................... 79
3.4.5 Doors .................................................................................................... 80
3.4.5.1 Door Type 1 ............................................................................... 80
3.4.5.2 Door Type 2 ............................................................................... 81
3.5 Airtightness Effect ....................................................................................... 82
3.6 Effect of Fenestration Area ......................................................................... 83
4 OPTIMIZATION METHODS ........................................................................... 84
4.1 Introduction ................................................................................................. 84
4.2 Optimization Methods ................................................................................. 85

x
4.2.1 P1-P2 Method ....................................................................................... 85
4.2.1.1 Formula Description ................................................................... 85
4.2.1.2 Figure Assignment ..................................................................... 89
4.2.2 Present Worth Analysis ........................................................................ 89
4.2.2.1 Formula Description ................................................................... 89
4.2.2.2 Figure Assignments .................................................................... 91
5 RESULTS AND DISCUSSION ........................................................................ 92
5.1 Introduction ................................................................................................. 92
5.2 Results ......................................................................................................... 93
5.2.1 Life Cycle Cost Analysis Based on P1-P2 Mathematical Model ......... 93
5.2.2 Payback Period Calculation Based on P1-P2 Mathematical Model..... 94
5.2.3 Insulation Thickness Optimization, Based on P1-P2 Mathematical
Model ................................................................................................................. 94
5.2.4 Annual Energy Demand Based on Conventional Construction Materials
............................................................................................................................ 95
5.2.5 Construction Costs of Each Combination .......................................... 101
5.2.6 Present Worth Saving, and Total Cost Calculation for Applying Each
Insulation Material After 6 Years .................................................................... 107
5.2.7 Present Worth Saving, and Total Cost Calculation for Taking Separate
Measures After 30 Years .................................................................................. 112
5.2.8 Investment Prioritizing ....................................................................... 115
5.2.9 Sensitivity Analysis ............................................................................ 116
5.2.10 Thermal Comfort Comparison ......................................................... 120
5.2.11 Airtightness Effect ............................................................................ 121
5.2.12 Effect of Increasing Glazing Area .................................................... 123

xi
6 CONCLUSIONS AND RECOMMENDATIONS ........................................... 125
6.1 Conclusions ............................................................................................... 125
6.2 Recommendations ..................................................................................... 128
REFERENCES .................................................................................................... 129

xii
LIST OF TABLES
Table 1 Parameters used in the modeling process by TRNSYS type 19 .................. 38
Table 2 Wall parameters used in the modeling process by TRNSYS type 19 .......... 38
Table 3 Window parameters used in the modeling process by TRNSYS type 19 ... 38
Table 4 Energy consumption as thermal analysis result .......................................... 58
Table 5 Available thermal insulation materials’ information ................................... 60
Table 6 Wall type 1 layers ....................................................................................... 61
Table 7 Wall type 1 thermal properties .................................................................... 61
Table 8 Wall type 2 layers ....................................................................................... 62
Table 9 Wall type 2 thermal properties .................................................................... 62
Table 10 Wall type 3 layers ..................................................................................... 63
Table 11 Wall type 3 thermal properties .................................................................. 63
Table 12 Wall type 4 layers ..................................................................................... 64
Table 13 Wall type 4 thermal properties .................................................................. 64
Table 14 Wall type 5 layers ..................................................................................... 65
Table 15 Wall type 5 thermal properties .................................................................. 65
Table 16 Wall type 6 layers ..................................................................................... 66
Table 17 Wall type 6 thermal properties .................................................................. 66
Table 18 Wall type 7 layers ..................................................................................... 67
Table 19 Wall type 7 thermal properties .................................................................. 67
Table 20 Wall type 8 layers ..................................................................................... 68
Table 21 Wall type 8 thermal properties .................................................................. 68
Table 22 Wall type 9 layers ..................................................................................... 69
Table 23 Wall type 9 thermal properties .................................................................. 69

xiii
Table 24 Wall type 10 layers ................................................................................... 70
Table 25 Wall type 10 thermal properties ................................................................ 70
Table 26 Floor type 1 Layers ................................................................................... 71
Table 27 Floor type 1 thermal properties ................................................................. 71
Table 28 Floor type 2 Layers ................................................................................... 72
Table 29 Floor type 2 thermal properties ................................................................. 72
Table 30 Floor type 3 Layers ................................................................................... 73
Table 31 Floor type 3 thermal properties ................................................................. 73
Table 32 Floor type 4 Layers ................................................................................... 74
Table 33 Floor type 4 thermal properties ................................................................. 74
Table 34 Roof type 1 Layers .................................................................................... 75
Table 35 Roof type 1 thermal properties .................................................................. 75
Table 36 Roof type 2 Layers .................................................................................... 76
Table 37 Roof type 2 thermal properties .................................................................. 76
Table 38 Roof type 3 Layers .................................................................................... 77
Table 39 Roof type 3 thermal properties .................................................................. 77
Table 40 Window type 1 Layers .............................................................................. 78
Table 41 Window type 1 thermal properties ............................................................ 78
Table 42 Window type 2 Layers .............................................................................. 79
Table 43 Window type 2 thermal properties ............................................................ 79
Table 44 Door type 1 Layers .................................................................................... 80
Table 45 Door type 1 thermal properties ................................................................. 80
Table 46 Door type 2 Layers .................................................................................... 81
Table 47 Door type2 thermal properties .................................................................. 81
Table 48 Annual loads demand (Wh) for series 1 and 2 ........................................... 96
xiv
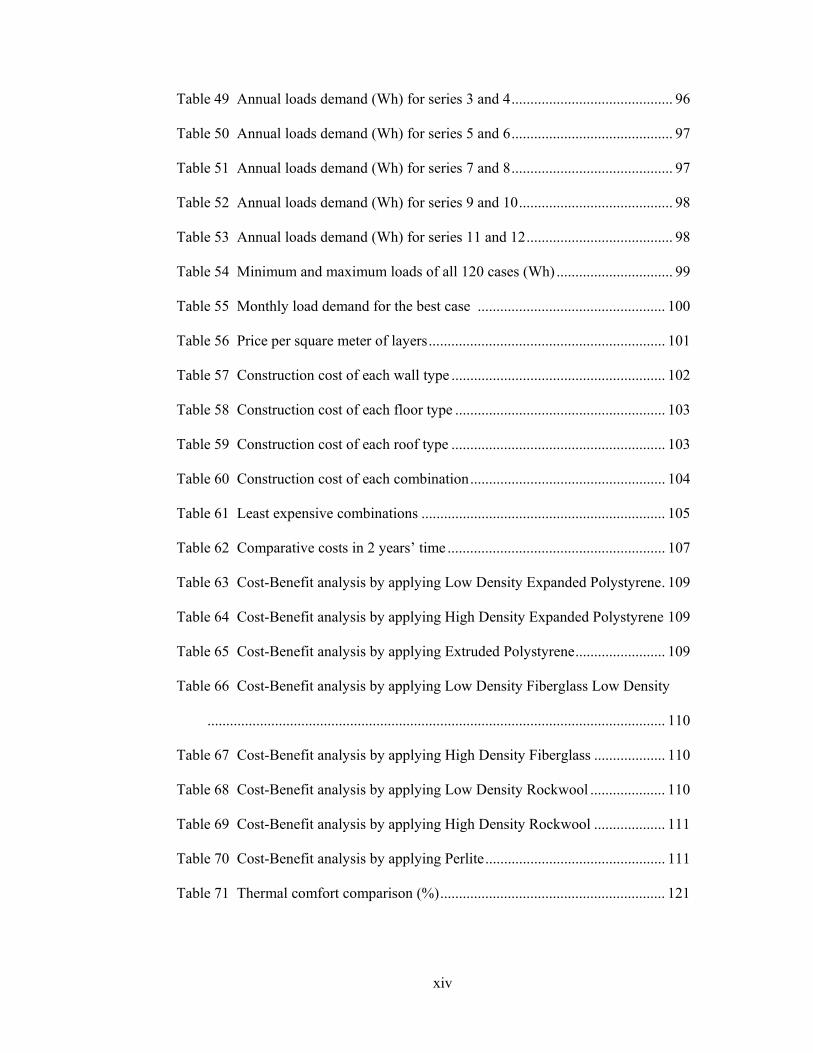
Table 49 Annual loads demand (Wh) for series 3 and 4 ........................................... 96
Table 50 Annual loads demand (Wh) for series 5 and 6 ........................................... 97
Table 51 Annual loads demand (Wh) for series 7 and 8 ........................................... 97
Table 52 Annual loads demand (Wh) for series 9 and 10 ......................................... 98
Table 53 Annual loads demand (Wh) for series 11 and 12 ....................................... 98
Table 54 Minimum and maximum loads of all 120 cases (Wh) ............................... 99
Table 55 Monthly load demand for the best case .................................................. 100
Table 56 Price per square meter of layers ............................................................... 101
Table 57 Construction cost of each wall type ......................................................... 102
Table 58 Construction cost of each floor type ........................................................ 103
Table 59 Construction cost of each roof type ......................................................... 103
Table 60 Construction cost of each combination .................................................... 104
Table 61 Least expensive combinations ................................................................. 105
Table 62 Comparative costs in 2 years’ time .......................................................... 107
Table 63 Cost-Benefit analysis by applying Low Density Expanded Polystyrene . 109
Table 64 Cost-Benefit analysis by applying High Density Expanded Polystyrene 109
Table 65 Cost-Benefit analysis by applying Extruded Polystyrene ........................ 109
Table 66 Cost-Benefit analysis by applying Low Density Fiberglass Low Density
.......................................................................................................................... 110
Table 67 Cost-Benefit analysis by applying High Density Fiberglass ................... 110
Table 68 Cost-Benefit analysis by applying Low Density Rockwool .................... 110
Table 69 Cost-Benefit analysis by applying High Density Rockwool ................... 111
Table 70 Cost-Benefit analysis by applying Perlite ................................................ 111
Table 71 Thermal comfort comparison (%) ............................................................ 121

xv
LIST OF FIGURES
Figure 1 Optimum insulation material thickness ..................................................... 12
Figure 2 New project template ................................................................................ 43
Figure 3 Defining building elevation ....................................................................... 44
Figure 4 Defining wall constraints ........................................................................... 45
Figure 5 Completed plan drawing ............................................................................ 46
Figure 6 Assigning floor and topography to model ................................................. 46
Figure 7 Making room boundaries by walls ............................................................ 47
Figure 8 Assigned room boundaries ........................................................................ 48
Figure 9 Volume and area calculation preferences .................................................. 49
Figure 10 gbXML export from Revit ........................................................................ 49
Figure 11 Importing gbXML format from Revit .................................................... 50
Figure 12 Successfully imported model using gbXML schema ............................. 51
Figure 13 Thermal comfort factors assignment ...................................................... 52
Figure 14 HVAC assignments, settings, and schedules .......................................... 53
Figure 15 Envelope design by layers ...................................................................... 54
Figure 16 Envelope thermal properties ................................................................... 55
Figure 17 Weather data and specifications ............................................................. 56
Figure 18 Thermal analysis procedure .................................................................... 57
Figure 19 Wall type 1 layout .................................................................................. 61
Figure 20 Wall type 2 layout .................................................................................. 62
Figure 21 Wall type 3 layout .................................................................................. 63
Figure 22 Wall type 4 layout .................................................................................. 64
Figure 23 Wall type 5 layout .................................................................................. 65

xvi
Figure 24 Wall type 6 layout .................................................................................. 66
Figure 25 Wall type 7 layout .................................................................................. 67
Figure 26 Wall type 8 layout .................................................................................. 68
Figure 27 Wall type 9 layout .................................................................................. 69
Figure 28 Wall type 10 layout ................................................................................ 70
Figure 29 Floor type 1 layout ................................................................................. 71
Figure 30 Floor type 2 layout ................................................................................. 72
Figure 31 Floor type 3 layout ................................................................................. 73
Figure 32 Floor type 4 layout ................................................................................. 74
Figure 33 Roof type 1 layout ................................................................................. 75
Figure 34 Roof type 2 layout ................................................................................. 76
Figure 35 Roof type 3 layout ................................................................................. 77
Figure 36 Window type 1 layout ............................................................................ 78
Figure 37 Window type2 layout ............................................................................. 79
Figure 38 Door type 1 layout ................................................................................. 80
Figure 39 Door type 2 layout ................................................................................. 81
Figure 40 ACH setting ........................................................................................... 82
Figure 41 Ecotect weather tool .............................................................................. 87

xvii
LIST OF GRAPHS
Graph 1 Heating and cooling load graph according to months ............................... 57
Graph 2 Life cycle cost analysis based on P1-P2 mathematical model .................... 93
Graph 3 Payback period calculation based on P1-P2 mathematical model .............. 94
Graph 4 Insulation thickness optimization based on P1-P2 mathematical model .... 95
Graph 5 Monthly load demand for the best case ................................................... 100
Graph 6 Comparative costs in 10 years’ time ......................................................... 106
Graph 7 Comparative costs in 10 years’ time (compared to case 6) ....................... 107
Graph 8 Saving of each material in 6 years’ time ................................................... 112
Graph 9 Impacts of applying independent factors up to 30 years ........................... 113
Graph 10 Saving by roof insulation and windows substitution .............................. 114
Graph 11 Saving by roof insulation, windows and doors substitution ................... 115
Graph 12 Independent saving of each factor ........................................................... 116
Graph 13 Sensitivity of net saving to electricity tariff ............................................ 117
Graph 14 Sensitivity of net saving to interest rate .................................................. 118
Graph 15 Sensitivity of net saving to insulation material’s price ........................... 119
Graph 16 ACH Rate effect on annual energy consumption .................................... 122
Graph 17 ACH Rate effect on annual expenditures ................................................ 122
Graph 18 Effect of enlarging glazing area on the annual energy consumption ...... 123
Graph 19 Difference from the best uninsulated case .............................................. 124

xviii
LIST OF FORMULAS
Formula 1 Calculating P1 factor ........................................................................... 85
Formula 2 Calculating P2 factor ........................................................................... 86
Formula 3 Total energy life cycle as a result of insulation ................................... 86
Formula 4 Heating and cooling degree hour calculation ......................................... 87
Formula 5 Sol-air temperature calculation ............................................................... 87
Formula 6 Total energy life cycle savings as a result of insulation ...................... 88
Formula 7 Difference between U-Values of insulated and uninsulated cases ...... 88
Formula 8 Optimum thermal insulation thickness ................................................ 88
Formula 9 Payback period calculation .................................................................. 88
Formula 10 Calculating DD factor ........................................................................ 89
Formula 11 Uniform series formulas ....................................................................... 90
1
Chapter 1
INTRODUCTION
1.1 Background
The significance of energy conservation cannot be overstated. Besides, a
considerable share (up to 40%) of total energy demand is consumed by residential
sector (Chwieduk 2003). Furthermore, most of the energy consumption in residences
is attributed to air conditioning, especially in hot climates (Al-Homoud 2004). On the
other hand, the annual heating and cooling load demand can be noticeably decreased
by applying thermal insulation materials to building external envelopes.
Cyprus, with more than 21000 annual cooling degree hours is a representative of a
hot and humid country in which household energy consumption is responsible for
nearly half of the total final, and the share is rising considerably as a result of global
warming. However, construction industry in Cyprus does not consider insulation in
building external envelopes as thermal performances of residences are comparatively
low. Moreover, although an increasing number of literature has studied the effect of
improving thermal performance of buildings on the annual energy consumption and
consequently money saving in several countries and climate conditions, there are
rather little literature published on such effect in Cyprus (Panayi ,2004), (Kalogirou,
Florides , & Tassou ,2002), (Florides , Tassou , Kalogirou, & Wrobel ,2001)
,(Florides, Kalogirou, Tassou, & Wrobel ,2000). As a result, the application of
insulation materials is conventionally regarded as an action which solely increases
the initial costs of a project. Besides, as there is not enough information on the

2
optimum thickness of insulation materials, thicker layers may be added to envelope
layers and/or in the wrong place, which reduces the performance, as well as imposing
extra initial costs which cannot possibly be compensated in the near future. Thermal
comfort on the other hand, has never been mentioned in the current literature about
Cyprus, while it is one of the most important non-monetary benefits improving
which makes the living space more comfortable whether or not the inside air is
conditioned.
Kitsios (2009) reported that 43% of total energy usage is attributed to dwellings
and Zachariadis (2010) predicted that the electricity consumption will be three times
higher in 2030 in Cyprus. However, after examining 482 dwellings among which
most of them were 100-150 m2 and built between mid-80 and 2001, it is concluded
by Panayiotou, et al. (2010) that, 80% of total building envelopes do not apply
thermal insulation at all.
In the current study first, the most proper types of conventional building
envelopes were identified. The most proper combination of them was then insulated
with different types of available insulation materials and the most economic one was
figured out. Subsequently, optimum insulation thickness was calculated and offered
for each type of insulation method. Accordingly, the best insulation material was
proposed. Finally, the impact of enlarging fenestration area, rate of air change per
hour (ACH) as well as the sensitivity of cash flow on changes in interest rate,
material price, and electricity price was also studied.
Is it not to say that monetary benefits attributed to the improvement in thermal
performance of the case study, is an additional benefit to non-monetary benefits that
contribute to the improvement of living spaces’ quality and security as well as
providing comparatively healthier environment for living.
3
As the result, in order to reduce annual energy consumption of residences,
replacing normal single-glazed windows with double-glazed aluminum frames,
insulating roof with 1.6 centimeter high density polystyrene from outside and,
substituting doors with solid core ones are proposed as the most proper measures
respectively.
1.2 Scope and Objectives
Current investigation principally focuses on detecting measures towards the
diminution of annual energy consumption, in conventional single family dwellings of
Cyprus. Accordingly, the objectives are presented in chronological order below:
1- To identify the best combination of typical walls, roofs and floors which are
normally being used in the residential construction industry of Cyprus, from energy
consumption point of view.
2- To calculate the construction cost of each combination and provide a
comparison in order to figure out the best one from cost point of view.
3- To come across the available thermal insulation materials in Cyprus.
4- To compute the optimum thickness of each thermal insulation material.
5- To detect the most proper thermal insulation material for Cypriot detached
houses.
6- To study the effect of improving thermal performance of residences by
replacing doors and windows.
7- To analyze the sensitivity of savings attributed to the aforementioned measures
on the variation of thermal insulation material’s cost, interest rate and electricity
tariff.
8- To demonstrate the effect of enhancing building's thermal performance on the
thermal comfort of inhabitants.
4
9- To investigate on the effect of construction implementation's quality on the
annual electricity consumption.
10- To study the impact of increasing the glazing area on the total energy demand
of residences.
1.3 Works Undertaken
To achieve the aforesaid objectives, several methods and computer programs
where utilized which are listed below in the same chronological order as the
objectives:
1- One hundred and twenty possible combination of conventional materials used
as external envelopes were generated according to probability formulas and, the
thermal performance modeling of each was studied by employing Autodesk Ecotect
thermal simulation engine.
2- As each envelope comprises several layers, by calculating the price per square
meter of each layer based on the official published unit prices, adding them up and
multiplying by total area of each envelope, corresponding construction prices were
calculated. Therefore, total construction price of each combination was computed
and compared consequently.
3- Types of available thermal insulation materials and corresponding prices could
be derived from official unit prices while; more realistic data in this area could be
collected from local suppliers. In this case, data including 8 types of insulation
materials and their prices was gathered from C.E.E LTD, one of the prominent
material suppliers in Cyprus.
4- To calculate the optimum insulation thickness of each thermal insulation
materials, which is related to the specifications of the external envelope and
5
insulation material, electricity and insulation material's price, weather condition,
interest rate and analysis period, P1-P2 method was employed.
5- The best combination of typical envelopes was insulated with each thermal
insulation type and, annual energy demand of each case was computed using
Autodesk simulation tool subsequently. Finally, by comparing expenditures at the
initial and the operation phase, the most proper insulation material was identified.
6- The most proper case was then revised by substituting windows and doors with
more appropriate ones from energy consumption point of view and, the impact of
such revisions was investigated by employing Ecotect program.
7- Taking the first 10 year of case study's life span, the sensitivity analysis on
changes in the interest rate, insulation material price and electricity price in Cyprus
was performed by utilizing Microsoft Excel.
8- Thermal comfort level was studied by using Ecotect software and, a
comparison was made between the insulated and uninsulated cases.
9- The effect of construction implementation's quality on the annual electricity
consumption was investigated by changing the air change rate per hour - which
difference in post construction phase with the designed one in the early design stage
is a proper representative for poor construction implementation - in thermal zone
properties of Autodesk Ecotect program.
10- Glazing area was increased from 20 to 60% by 20% increments in Autodesk
Revit, exported to Ecotect using gbXML schema and, the impact of such alteration
was studied by providing a comparison between the estimated annual load demands
of each case, computed by Ecotect simulation engine.

6
1.4 Achievements
Results corresponding to each step are presented below in the same chronological
order as the objectives and works undertaken.
1- The best combination of envelopes from energy consumption point of view was
the combination of floor type 4, roof type 1 and wall type 1 which led to 7864 kWh
electricity usage yearly. The difference with the worst case added up to 11526 kWh
annually. Envelope types are described in methodology chapter, construction
materials’ section.
2- Six minimum combinations were derived from 120 cases and the net present
value of their incremental cash flow, over 10 years' time was calculated.
Consequently, the best case was the combination of floor type 4, roof type 1 and wall
type 1. Choosing any other combination imposed a minimum extra expenditure of
3224 Turkish lira to the project in 10 years.
3- Eight thermal insulation materials namely low density expanded polystyrene ,
high density expanded polystyrene, extruded polystyrene, low density fiberglass,
high density fiberglass, low density Rockwool, high density Rockwool and perlite
were suggested as available and most popular thermal insulation materials in Cyprus.
Technical specifications and prices are provided in the methodology chapter.
4- The least optimum thickness was calculated for high density Rockwool (1.6cm)
while, 28.2cm was computed for perlite which was the maximum amongst.
5- The most beneficial material was high density Rockwool, applying 1.6cm of
which, along with other measures, pays back in 6 years' time which was the
minimum payback period amongst.
7
6- Replacing windows, in addition to insulating roofs with high density
Rockwool, saved 8610 Turkish Lira in 30 years. This amount increased to 8654
Turkish Lira in case of substituting doors, in the same period.
7- Project's net saving was significantly sensitive on the electricity tariff as more
than 10200TL was saved, in case of an increase in electricity tariff to 0.8TL/Kwh in
10 years, compared to less than 200TL in the same period for 0.2TL/kWh. Similarly,
an increase in high density Rockwool’s price to 15TL/m2 saved as little as 422TL in
10 years while, figures surge to the net saving of 2547TL if the price was reduced to
6TL/m2. Interest rate on the other hand, led to 1406TL net saving in 10 years if
raised to 0.06, compared to 2410TL if reduced to 0.02.
8- 41% increase in thermal comfort was observed in case of applying 1.6cm high
density Rockwool to the best combination of typical envelopes, based on the degree
hour concept and the percentage of time that the temperature of thermal zone was
outside the comfort range.
9- As the ACH rate was increased to 2.5, which represents leaky construction, up
to 2300 kWh increase in annual load demand was observed comparing to 0.5 ACH
for the optimum case.
10- Annual energy consumption surged from 5800kWh to 10219kWh, as the
fenestration area enlarged from 20 to 60% for the optimum case.
1.5 Limitations of Study
Because of small amount of published literature on the case study of the current
investigation and to avoid adding excess detail to the research, some simplifications
was considered in number of study’s stages. Indeed, these simplifications led to
limitations that are listed below:
8
1- The only energy source for maintaining the inside air’s temperature in the
comfort band is considered electricity
2- Air conditioners assumed to be employed 24 hours 7 days a week
3- One study with fixed architectural plan, floor area and height is opted as the
representative of typical Cypriot family house
4- Study carried out based on construction and insulation materials which were
the conventional and available ones in Summer 2012
1.6 Guide to Thesis
In the second chapter - literature review - previous investigations relating to the
current research are mentioned and important relevant information and findings are
addressed accordingly. Highlighted areas covered optimum thermal insulation
material's thickness, computer based thermal performance simulation, energy life
cycle costing in residential buildings, the effect of airtightness on building energy
demand and studies which considered Cyprus as their case study, from energy profile
and energy consumption point of view.
In the third chapter - methodology - data, data collecting methods and building
simulation computer programs namely Autodesk Revit and Autodesk Ecotect are
presented. Besides, the modeling process and set-factors in simulation engines are
also described. Additionally, the process during which the effect of airtightness and
enlarging glazing area was carried out is also explained.

9
In the fourth chapter, optimization methods namely net present value and P1-P2
method are described. The aforementioned methods were utilized to calculate the
optimum thickness of insulation materials and to identify the most economic cases.
In the fifth chapter - results and discussion - optimization, calculation, and
modeling results is demonstrated using graphs and tables. Furthermore,
corresponding additional explanation and discussion is provided were needed.
In the sixth chapter - conclusion - highlights and significant findings of this
investigation are mentioned and recommendations for future studies in this area are
provided.

10
Chapter 2
LITERATURE REVIEW
2.1 Introduction
It is generally believed that, the importance of energy conservation is increasing
significantly. Besides, residential sector consumes a large proportion of total energy.
In Cyprus, Zachariadis (2010) predicted that the electricity consumption will be three
times higher in 2030 which magnifies the need for reducing energy consumption.
The electricity consumption of residential sector in mostly as a result of using air
conditioner systems to achieve thermal comfort in houses especially in Cyprus since,
the water heating is efficiently performed by solar water heating systems which are
cheap and their performance is high.
The electricity consumption of dwelling as a result of using air conditioners could
be decreased significantly by applying thermal insulation materials which are
available in different costs and performances. In the current study, available
insulating materials in Cyprus are identified and the impact of applying them to
building external envelopes, from annual electricity consumption point of view is
investigated.
A considerable amount of investigation has been performed on the effect of
insulation materials on energy consumption of buildings using different calculation
methods and, the optimum insulation thickness is computed consequently.
In this chapter, a comprehensive background study is carried out on the following
subjects and presented in the same order:
11
1- The optimization of thermal insulating material's thickness, employing
degree time concept and dynamic thermal conditions in different parts of the
world having diverse construction methods and climate conditions.
2- Insulation materials which have the application feasibility in building
external envelopes for thermal insulation purposes.
3- Building performance modeling using computer-based simulation engines
focusing on Autodesk Ecotect, EnergyPlus, Equest and, TRNSYS thermal
simulation tools. Additionally, less popular computer programs were also
mentioned.
4- Life cycle costing of residences from the energy consumption point of view
focusing on the embodied energy versus the energy demand in the operational
phase and, the effect of applying insulation.
5- The effect of air leakage in building load demand.
6- Investigations in which Cyprus was taken as case study with respect to the
energy consumption profile and predictions, construction method and
preferences, conventional construction materials and architectural plans and,
statistical analysis of the building types and lifestyle.
2.2 Insulation Material’s Optimum Thickness
2.2.1 Introduction
According to figure 1, by choosing the optimum point for insulation material
thickness, life cycle cost of the residence will be lowered as much as possible
(Kaynakli, 2012).

12
Figure 1: Optimum insulation material thickness, Kaynakli (2012)
The aforementioned thickness indeed, is mainly influenced by the following
factors:
1- The type of the energy and its cost (Fuel, Electricity, Gas, Renewable,
Etc.)
2- HVAC type and efficiency
3- The cost of the material used for insulation
4- Place of the project which configures a specific weather condition
5- Construction type and materials
6- Building orientation and shape (Al-Homoud, 2005; Ansari, Mokhtar,
Abbas, & Adam, 2005; Al-Khawaja, 2004; Yu, Yang, L. Tian, & Liao, 2009).
2.2.2 Insulation Thickness Optimization
Calculations based on degree time concept which normally being used for simple
modeling and applications, is based on the difference between the desired and
defined inside temperature and outside air temperature.
13
Three cities in the cold regions of Turkey namely Erzincan, Erzurum and Kars
were analyzed for 10 years of life-time by Comaklı & Yuksel (2003), and the
optimum thickness for the insulation material (stropor in this case) was computed.
Ucar and Balo (2009) concluded that under the effect of fuel type and place of the
building, insulation thickness differs from 1.06 and 7.64cm which leads to the
payback period of 1.8 and 3.7 years respectively, analyzing four different cities in
Turkey. In China, considering both cold and hot regions which are represented by
Changsha, Shanghai, Chengdu and Shaoguan, analysis was performed on 5
insulation materials comprising foamed polyurethane, foamed polyvinyl chloride,
expanded polystyrene, perlite and extruded polystyrene by Yu, Yang, Tian, & Liao
(2009), the result was between 0.053 to 0.236m of optimum thickness and the most
eminent material was polystyrene due to maximum saving and shortest payback
period. Besides, the varieties of orientations and surface colors were taken into
account in this study. Using HTB2 simulation software for calculating heat transfer
in buildings, the effect of moving the insulating layer's position in a layered wall,
based on the cooling load and demand throughout the year was investigated by Bojic,
Yik, & Sat (2001) for two high-rises in Hong Kong. A decrease of 6.8% in cooling
load and, 7.3% reduction in the demand for cooling load was calculated in this study.
Additionally, some increases in cooling load, by increasing the thickness of concrete
and insulation was also observed in their research. Another research based on the
same city was carried out by Cheung, Fuller, & Luther (2005), that proposed adding
10cm of extruded polystyrene facing indoor to external walls of high-rise apartments
which along with some other modification in glass type, wall color and shading led
to a reduction of 31.4% in cooling load. Different fuel types for heating were studied
by Kaynakli (2008) in Turkey, Bursa and, the optimum insulation thickness was
14
estimated between 0.053 and 0.124m. Al-Khawaja, (2004) concluded that wallmate
was the best choice amongst fiberglass, wallmate and polyethylene foam for hot
regions like his case study Qatar but since it was a comparatively expensive material,
others might have been be preferred. Additionally, instead of air temperature, he used
sol-air temperature in his computations. Farhanieh & Sattari (2006) used a rather
different method, investigating on Iranian typical buildings in the capital of the
country Tehran. Their method called Nodal Network was capable of taking into
account "both temperature field and, heat flux from composite external walls which,
is not possible with analytical or experimental methods". Accordingly, saving more
than 10 cubic meter of gas by insulating external walls was the result of their work.
The initial and operating cost of air conditioning systems was studied by Aktacir,
Buyukalaca, & Yılmaz (2010). As the result, a reduction of 22% in the initial costs as
well as 25% and 33% decrease in the running cots of constant-air-volume system and
variable-air-volume system was observed in insulated buildings respectively.
Focusing on the position of insulation layer in walls, Kossecka & Kosny (2002)
claimed that differences in total energy demand between the configuration ‘‘all
insulation inside’’ and, the most effective configuration (from the point of view of
energy savings) ‘‘all insulation outside’’ may exceed 11% for a continuously used
residential building. Taking Sri Lanka as case study, Halwatura & Jayasinghe (2009)
concluded that rooftop vegetation contributes to significant cooling energy saving.
Jaber (2002) focused on reducing the combustion of fossil fuels in Jordan and other
Arab countries living with similar standards and, demonstrated a 50% diminution of
space heating load, by applying insulation to typical buildings of that region where
there wasn't any insulation applied to the roofs and very little to the walls (5% of all
buildings). Employing RENCON program Al-Sallal (2003) figured out that the
15
payback period in cold regions was comparatively short. He focused on two different
states of United States (Texas and Minnesota) and, two different materials for
insulation namely fiberglass and polystyrene. Emphasizing on the distribution of
insulation layers, Ozel & Pihtili (2007a, 2007b) suggested that three pieces of
insulation with equal thicknesses, which are placed in the outer, middle and inner
layers of wall and roof, brings out the most desired thermal performance. Kossecka
& Kosny (2002) compared six walls with the same R-value and materials, with
different placement of insulation and concrete layer, in 6 United States’ cities
(Miami, Denver, Atlanta, Phoenix, Washington DC and Minneapolis), which
represent different climate conditions of US, using DOE-2 modeling software and,
showed that if massive layers are placed as internal layers, the most effective thermal
performance is achieved. The impact of modifying the glass space of double glazed
windows was cogitated by Arıcı & Karabay (2010) and, a 60% net saving attributed
to optimum air layer thickness of 12-15mm was observed. Furthermore, the thickness
found to be a function of fuel type and climate conditions and, the effect was
reported to be less in cold climates. Similar result observed for the city Kars, Turkey,
by Aydin (2000). He also computed the space of 15-18mm for Trabzon and Ankara
and, 18-21mm for Antalya.
Another factor having noticeable impact on the optimum insulation thickness is
the electricity tariff. In addition, choosing a thermal insulation material, the initial
cost is obviously one of the main factors that should be considered and, taken into
account to perform energy life cycle costing. Running costs of the aforementioned
LCC study can be appointed to electricity tariff. This factor was investigated by
Gustafsson & Karlsson (1989) and Al-Sanea, Zedan, & Al-Aj (2005). Al-Sanea,
Zedan, & Al-Aj (2005) computed the thickness of 4.8-16cm for the average

16
electricity tariff of 0.05 to 0.4 SR/kWh (1 US$ = 3.75 Saudi) for Riyadh, Saudi
Arabia, choosing polystyrene as insulation material. The base case was conventional
wall in the construction industry of Riyadh which was concrete blocks, that was
insulated with fixed 2.5-2.75cm of insulation. Bolatturk (2008) suggested that it is
more economical to base the optimization on the cooling load in warm regions since
the thickness of polystyrene as thermal insulator calculated less for heating degree
hours(HDD) than cooling degree hours(CDD). The same method was employed for
the determination of optimum insulation thickness by M. Ozel, K. Pihtili (2008a,
2008b). Considering polystyrene, similar investigation was done by Aytac & Aksoy
(2006) and Bolatturk (2006). Concentrating on external walls and ceiling Sisman,
Kahya, Aras, & Aras (2007) calculated optimum insulation (Rockwool) thickness for
the lifespan of N years for each degree day areas of Turkey, based on Turkish
standard BS825. They stated that to improve the comfort quality of residences,
providing walls and roofs with insulation is indispensably more economic than other
solutions. Building parameters in general, and the effect of their modification on
cooling load estimation was also studied by Ansari, Mokhtar, Abbas, & Adam
(2005). Rather simple approach – one simplified computer software - was developed
in their research, which basically tried to eliminate mathematical complexities. By
the way, the software declared to be comprehensive and user-friendly compared to
others in market.
There have been several researches on building performance under the effect of
multifarious physical conditions, using numerical or computer-aided methods, which
consider all aspect of building construction or milieu in detail. Quintessentially, there
have always been differences between modeling and real conditions since; numerical
methods cannot possibly take into account every detail and, modeling software also
17
cannot simulate human behavior toward energy consumption. The reason behind is
that the behavior is directly related to thermal comfort and, the construction itself is
not as perfect as software simulates it. However, some studies are carried out on
empirical basis. Cabeza, et al. (2010) built 2.4 x 2.4 x 2.4 m cubes with perforated
bricks and plasters that represents conventional Mediterranean construction in
Lleida, Spain which represents Mediterranean climate conditions. Three insulation
materials (polyurethane, mineral wool and polystyrene) were compared and as a
result, energy consumption was reduced by 64% in summer and 37% in winter for
the cube which had been insulated with polyurethane. In addition, up to 14%
difference experienced between theoretical and experimental transmittance value. By
the way, some researchers preferred not to calculate the insulation thickness; a case
in point is Durmayaz, Kadıoglu, & Sen (2000) and Durmayaz & Kadıoglu (2003)
who limited their work to energy requirements and consumption in Turkey's big
cities.
Compared to the simple degree time method, quite little researches have been
going on based on dynamic thermal conditions. Indeed, calculating the accurate
amount of gains and losses by building elements (roofs, walls, floors and ceilings),
contributes to more realistic calculations of loads and subsequently, optimizing
insulation layers or projecting the thermal performance of a building. Employing this
concept, Daouas (2011) discovered the great impact of wall orientation on annual
transmission loads with 71.33% of saving in energy and 3.29 years for payback
period by south orientations in Tunisian climates, for 30 years’ lifetime. Trying to
achieve a desirable combination of wall type and insulation material, Daouas ,
Hassen, & Aissia (2010) found the most economic choice to be stone/brick sandwich
wall, insulated with 5.7cm expanded polystyrene, which led to 58% of saving,

18
applying Complex Finite Fourier Transform method. Kaska, Yumrutas, & Arpa
(2009) compared theoretical and experimental findings in Gaziantep Turkey, for 8
conventional layered walls and 2 roofs and found similar results computing
decrement factor, time lag and total equivalent temperature difference. Focusing on
total equivalent temperature difference solely, Kaska &Yumrutas(2009) carried out
similar experimental study and reasoned out that "Meteorological values,
absorptivity of surfaces, thermo physical properties and directions of the walls have
significant effects on the TETD values". Yumrutas, Unsal, & Kanoglu (2005) and
Yumrutas, Kaska, & Yıldırım (2007) developed an analytical method for calculating
heat transfer for multi-layer building elements, by employing Complex finite Fourier
Transform method, regarding 6 wall types and 2 roofs in Gaziantep, Turkey climate
condition. A rather different objective namely achieving thermal comfort, which is
represented by Predicted Percentage of Dissatisfied, was followed by Djuric,
Novakovic, Holst, & Mitrovic, (2007). Combining EnergyPlus thermal modeling
software with the mathematical method, which was used by GenOpt optimizing
program, total cost was minimized at 60 degrees centigrade for water supply
temperature while, the desired thermal comfort requirement was satisfied for
Belgrade, Serbia climate condition. The same modeling computer program was used
by Masoso & Grobler (2008) to simulate the thermal performance of a typical office
in Botswana. They challenged the common knowledge of ‘‘the lower the u-value the
better’’ and discovered an anti-insulation behavior for the aforesaid building, during
the process of increasing cooling set point temperature, studying its effect on the fuel
consumption throughout a year. As a result, for 6 different set points, the variation of
0 to 160mm of extruded polystyrene was considered and the anti-insulation behavior
was observed at 25.72 degrees centigrade and for 80mm of the mentioned material.

19
Additionally, they reported that the saving happened only for the set points lower
than 25.72. Radhi (2009) evaluated envelope thermal insulation codes, which had
been proposed by the electricity and water authority in Bahrain. The codes were
supposed to diminish the electricity consumption and CO2 emissions by 40% while,
results showed at least 15% difference for electricity consumption and almost 33%
difference in CO2 emissions simulated by DOE modeling computer program. By
using the same program (DOE), in order to conserve energy in a 5 story office
building in Dammam, Saudi Arabia, Iqbal & Al-Homoud (2007) recommended
replacing HAVC and glazing system as well as lighting equipment in brief.
2.3 Thermal Insulation Materials
There are several studies on the properties and performances of thermal insulating
building materials. Some researchers tried to make a comparison between thermal
properties, benefits and drawbacks of conventional insulating materials while, others
focused on an specific one to investigate on its feasibility of becoming a widely used
material in construction industry. Although the function and characteristics of every
single material may alter due to the context in which the material is installed, a
comparison table may narrow the options and lighten the passive building analysis
burden. Detailed information on existing thermal insulation building materials was
provided by Lyons (2007). Al-Homoud (2005) compared the performance
characteristics of five common building insulation materials
(Polyurethane/Polyisocyanurate-Foam, Fiber Glass-Rigid Board, Polystyrene-
Expanded, Fiber Glass-Blanket, Polyethylene-Blanket and Vermiculite) based on
their R-Value for 5cm of thickness, giving concrete block as reference. There were
also some recommendations and sketches for the application of materials available in
his work. Papadopoulos (2005) demonstrated the increasing trend of insulation

20
thickness, applicable in European countries and provided the anticipated U-values for
building external envelopes in the same region. Besides, feature tables, installation
procedure’s briefings, place and the environmental concerns of insulation materials
were also provided. Mahlia, Taufiq, Ismail, & Masjuki (2007) carried out an
analytical study over the relation between the insulation material thickness for walls
and the corresponding thermal conductivity feature. As a result, a nonlinear function
was developed and, fiberglass–urethane was proposed as the most economic material
for insulation which saved more than 70 thousand US dollars in Malaysian weather.
"Currently, there exist no single insulation material or solution capable of fulfilling
all the requirements with respect to the most crucial properties" states Jelle (2011).
He has performed one of the most recent and quite comprehensive studies and
comparisons on all insulation materials in past, present and future and their
characteristics. He took into account specifications such as "thermal conductivity,
perforation vulnerability, building site adaptability and cuttability, mechanical
strength, fire protection, fume emission during fire, robustness, climate ageing
durability, resistance towards freezing/thawing cycles, water resistance, costs and
environmental impact". In addition, the future application’s feasibility of using some
insulation materials such as dynamic insulation materials, nano insulation materials
and NanoCon, which is a load-bearing insulation material, was also investigated. In
another similar work by Jelle, Gustavsen, & Baetens, (2010) that compared the
potential of, present state of the art materials to become future materials, NIM (Nano
insulation materials) was suggested as the most feasible one due to its low thermal
conductivity. Basically, to develop dynamic materials, which can regulate their
thermal conductivity in a wide range, was the objective of their research. The
sensitivity of 7 different insulation materials on altering operating temperature was
21
discussed by Abdou & Budaiwi (2005) and polyethylene reported to be highly
sensitive among others, while polystyrene was the least sensitive one and the reason
behind was considered to be the different density of each subject of the analyzed
group. An investigation on the environmental performance of the production process
of two insulation materials namely extruded polystyrene and stone wool was done
by Papadopoulos & Giama, (2007), using Global Emission Model for Integrated
Systems computer program and, corresponding tables were provided based on ISO
14031 standard. Another study by Liang & Ho (2007) focused on the toxicity
properties of conventional insulation materials in Taiwan, based on an experimental
study according to United Kingdom Naval Engineering standards 713. They
computed Toxicity Index for tested materials and concluded that toxicity
characteristic index of all tested materials was bigger than untreated wood,
polyurethane foam, organic foamy materials and polyethylene, which were not
approvable in foreclosing fire in buildings. As a result, to install insulation materials
in the middle or outside of the building external envelope and to cover those with
fireproof materials were suggested.
2.4 Researches Utilizing Computer Programs for Thermal Simulation
2.4.1 Introduction
Computer programs for building simulation provide us with cherished knowledge of
building performance in several aspects before the project is initiated. The projection indeed
is cost effective since, myriads of shortcomings in the life cycle of the project are foreseeable
by aforementioned software. Thermal modeling with computer is the most recent approach
in construction schemes and there has been a strong tendency to employ them, due to their
simplicity, versatility and their result compatibility with reality.
22
2.4.2 Autodesk Ecotect
Kanagaraj & Mahalingam, (2011), developed a framework titled "Integrated
Energy-Efficient Building Design Process" which provided guidelines for designers
to choose the proper strategy to design energy efficient buildings in commercial
sector of New Delhi, India. Thermal performance of their case study was carried out
by Ecotect v5.6 simulation program and, it was suggested by them to use Ecotect for
site vegetation, open space and activity zoning, building roof form, building
fenestration design and building skylight design. Concentrating on high rise
buildings, Ling, Ahmad, & Ossen (2007) tried to achieve the optimum shape and
orientation for these types of buildings in order to minimize solar radiation that
contributes to cooling load demand in hot and humid weather conditions.
Accordingly, utilizing ECOTECT V5.2, north-south oriented square shape high-rise
with width-length ratio of 1:1, reported to receive the least solar radiation. Taking
Fajar Harapan Hostel in the University Science Malaysia as case study, Al-Tamimi
& Fadzil (2011) validated the ECOTECT simulation tool in terms of indoor
temperature development and concluded that the application of natural ventilation as
well as shrinking the glazing area leads to a surge in comfort period. The most
effective solution to provide thermal comfort in Chongqing, China was proper
natural ventilation, stated Zhao, Gao, & Cheng (2011), and the optimum strategy was
improving the heat storage capacity of building along with the aforementioned
measure. ECOTECT software was used in their study.
2.4.2 EnergyPlus
Crawley, et al. (2001) compared EnergyPlus with DOE-2, IBLAST and BLAST,
the older generations of modeling programs, which were supported by United States
government and concluded that most of the shortcomings of these programs was met
23
in EnergyPlus. Tian & Love (2009) pointed out the significant role of radiant heating
and cooling systems in energy consumption optimization, taking University of
Calgary’s ICT Building as case study. They found modeling with EnergyPlus time
consuming and not fulfilling, in term of "allocating cooling loads between the air and
radiant cooling systems, especially at part load". Furthermore, assessing current
building external envelopes, they concluded that a properly designed system would
consume 80% less energy than the existing one. EnergyPlus was also used by Guo &
Nutter (2010) to simulate k-12 school buildings, to calculate suitable temperature for
United States different climate conditions and various types of construction.
Accordingly, glazing area and building orientation found to have minor effects on
current setup and setback temperatures. Fumo, Mago, & Luck (2010) retrieved some
coefficients for calculating energy consumption by "EnergyPlus Benchmark Models
simulations" from bills, without the need to generate simulations that needs expertise
and time. Their case studies located in Meridian and Atlanta, United states. Errors
of this method were investigated in a later study by Smith, Fumo, Luck, & Mago
(2011), by testing 72 buildings. It was suggested that the possible applicability of this
method for every single user for their corresponding case studies can be assessed
based on these error evaluations. Krartia & Ihmb (2009) computed 20%
overestimation of annual loads by EnergyPlus for a conventional dwelling, in case of
inadequately integration of calculation in the software, simulating heat transfer
characteristic of building foundation. EnergyPlus was also used by Djuric,
Novakovic, Holst, & Mitrovic, (2007) and Masoso & Grobler (2008), whose work is
mentioned in "Insulation thickness optimization" section.

24
2.4.3 eQuest
"Computer-based simulation is a valuable technique to assist facility managers in
determining energy conservation solutions" states Zhu (2006). However, he found
the modeling and data collection process time and resource consuming. Trying to
achieve energy star designation he combined portfolio manager and eQuest program,
and figured out the importance of the "combination of resetting heating set points
and controlling the fan operation of air handling", that led to the adequate saving.
Besides, the drawback to eQuest program mentioned to be incapable of modeling
different operation schedules and lack of incorporation capacity with other programs.
Medrano, Brouwer, Mauzey, & Samuelsen (2008) employed eQuest to analyze the
impact of the combination of three types of different advanced distributed generation
technologies in mild climate condition. Using eQuest software, Yu, Yang, & Tian
(2008) computed 11.31% and 11.55% of net saving in electricity consumption of air
conditioning systems in hot and cold climates of China, for shading and exterior wall
insulation respectively. 25.92% of saving was the result of implementing versatile
strategies at the same time. One of the latest studies using eQuest by Moon & Han
(2011) described thermostat strategies’ effect on building energy saving in terms of
parameters, in family residences of two different climate conditions of United States,
and computed the heating system more sensitive to thermostat strategies than cooling
systems. Hester, Li, Schramski, & Crittenden (2012) conducted the most recent
research on energy saving measures namely daylight control, glazing area and
structural insulated panels, and concluded that the application of these strategies
together which led to 6.1% reduction in energy consumption is four times more
effective than mitigations in operating phase, for United States dwellings in Phoenix.
Lai & Wang (2011) stated that roof construction and window type play the most
25
significant role in energy consumption of residences and, calculated 4.9% decrease in
energy demand in Taiwan, by modifying the aforesaid factors in eQuest simulation
program. The thermal performance part of the environmental impact assessment of
dwelling, based on various wall constructions was done by Kahhat, et al. (2009)
using eQuest and, 94% of the whole energy consumption was reported to happen in
the operational phase of residential projects.
2.4.4 TRNSYS
Al-ajmi & Hanby (2008), trying to propose modifications to future energy
conservation codes, which had been originally issued in 1983, simulated 7 case
studies in Kuwait with TRNSYS-IISIBAT program, and pointed out the significant
effect of infiltration and glazing area and type on energy consumption of Kuwaiti
dwellings. Employing TRNSYS simulation tool, Bhaskoro & Haq Gilani (2011)
proposed the application of air conditioners with adjustable set points to academic
buildings of Malaysia, which led to achieve 27.4% reduction in cooling load, since
50% of the total cooling load was wasted during off peak and peak time. The main
contributor to cooling load demand (52.57%) reported to be the heat gain through
building external envelopes.
2.4.5 Studies Based on Less Popular Programs
In Sweden, glazed office buildings and the effect of adding more glass to the
building’s façade was studied by Poirazis, Blomsterberg, & Wall (2008), using IDA
ICE 3.0 simulation tool. They studied 30, 60 and 100% glazed buildings and
recommended that the construction type must be regarded carefully, since its impact
on the energy consumption level was huge. They declared that choosing proper glass
from transmittance point of view would add only 15% to energy usage in 100%
glazed building compared to 30% one, and increasing window area imposed
26
negligible effect of lighting load due to the disqualifying visual comfort character of
extra daylight in office building. Chirarattananon & Taveekun (2004) "utilized DOE-
2 simulation program in a series of parametric runs, to develop an overall thermal
transfer value formulation each for four types of commercial buildings". Taking a
building in Sheffield, England, simulated by Radiance program, Altan, Ward,
Mohelnikova, & Vajkay, (2009) assessed the effect of glazed façade on thermal
comfort and working conditions. Frank (2005) criticized Switzerland’s SIA standard
based on which designers neglect climate change, while buildings have a normal
lifetime of 50 to 100 years. As a result, up to 1050% surge in cooling load demand
for office buildings was predicted using HELIOS simulation program, considering
4.4 degrees centigrade rise in temperature for a 50 years period between 2050 and
2100. The heating load demand in the same sector was projected to fall by almost
60% while, in residential sector it was less than 45%. Gugliermetti, Passerini, &
Bisegna (2004) employed Integrated Energy Use Simulation to perform “an analysis
of the stochastic component to understand the reliability of reduced data
characterized by only the climatic deterministic component, versus more complex
series of one year hourly data". Bojit, Milovanovic , & Loveday (1997) computed
20% saving in cooling load, for pitched roof facing north, in case of choosing the
right angle, using BRE-ADMIT simulation tool. The saving reported as small as 11%
for the same roof facing south. Monthly loads based on heating, ventilation and air
conditioning for three case studies in Jeddah, Saudi Arabia was calculated by Al-
Rabghi & Douglas (2001), utilizing BLAST simulation tool. Some works using
thermal simulation tools were mentioned before in the “Insulation thickness
optimization" section namely Bojic, Yik, & Sat (2001) who utilized HTB2, Kossecka
27
& Kosny (2002) who used DOE tool and Al-Sallal (2003) who performed thermal
simulation with RENCON simulation software.
2.4.6 Investigations Providing Comparative Analysis of Simulation Tools
A comprehensive comparison between twenty prominent thermal simulation
programs was performed by Crawley, Hand, Kummert, & Griffith (2008) and
summarized in corresponding tables for each category of research; although, the
ability to perform mentioned features was not investigated. Yazoo, Dong, & Leite
(2008) used artificial neural network to evaluate building energy performance, and
compared the method with results from Green Building Studio web tool, Energy_10,
EnergyPlus and eQuest simulation programs. They found 3% and 0.9% error to
mathematical method respectively. In a similar research, Neto & Fiorelli (2008)
compared ANN with EnergyPlus, taking the Administration Building of the
University of Sao Paulo as the case study and, 13% error was recorded for 80% of
tryouts while, for ANN the error was 10%. They suggested that human behavior
could be a major cause of inaccuracy and complexity of energy modeling. A
comparison between EnergyPlus and DOE-2.1e was done by Andolsun, Culp,
Haberl, & Witteb (2011), and different results were reported for the "ground coupled
heat transfer (GCHT) with basements". "The results revealed that the ground isolated
EnergyPlus houses used 3–23% more cooling, 12–29% less heating and 3–7% lower
overall HVAC electricity use when compared to the ground isolated DOE-2 houses"
(Andolsun, Culp, Haberl, & Witteb, 2011). Tenório & Pedrini (2002) compared Esp-
r, PV Design PRRO 4.0, Ecotect and VisualDOE-2.1 in the process of sustainable
design of dwellings in Brazil. "Low energy design feature combined with the
production of energy through a PV grid connected system installed on top of roof,
demonstrated that the energy loads were minimal and close to zero" they reported.

28
2.5 Energy Life Cycle Costing
2.5.1 Introduction
Minimizing costs has always been one of the most important challenges for
construction engineers and managers, since it plays a significant role in the feasibility
analysis of every project. The focus of this area of interest however, was merely on
the initial phase historically, before the impact of operating costs was discovered
during the 1930's (Dale, 1993).
By definition, "Life Cycle Cost (LCC) analysis provides a framework for
specifying the estimated total incremental cost of developing, producing, using, and
retiring a particular item"(Asiedu & Gu, 1998). LCC is a propitious tool to compare
different projects which function analogously, in term of costs which pertain diverse
phases during the life cycle of each project, by calculating net saving of every single
case.
Broadly speaking, five categories must be considered in the process of life cycle
costing of buildings:
1- Initial
2- Operation
3- Maintenance
4- Replacement
5- Salvage value
29
2.5.2 Energy Life Cycle Costs
A noticeable amount of studies were published on the life cycle costing of
residences from the energy consumption point of view. In 2012 Ramesh, Prakash, &
Shukla published their research in which they evaluated the energy demand of a
dwelling located in Hyderabad, India during its life-time using DesignBuilder as an
interface for EnergyPlus simulation engine. Different construction materials with
diverse thicknesses and varying climate conditions were investigated in their work.
Being dependent on the climate, up to 30% of life cycle energy saving was observed
in their study and the humid and warm weather reported the most suitable condition
to install insulation, because it led to the maximum energy saving. Insulation layer's
thickness’ limit was also calculated for walls and roofs taking into account life cycle
costs. In Denmark, Marszal & Heiselberg (2011) maintained that the installation of
renewable technologies needs more budget than making multi-story residential
buildings energy efficient, with 2011 prices and producing electricity with
photovoltaic systems. Utama & Gheewala (2008) pointed to single landed dwellings
in Indonesia and concluded that the energy performance of cement based building
enclosures is low, compared to the typical clay and brick roofs, using Autodesk
ECOTECT as thermal modeling engine. Two major energy categories namely
"embodied energy" and "energy demand during operational phase" was regarded in
their energy life cycle analysis. Gustavsson & Joelsson (2010) investigated on the
CO2 emission and energy use of low energy and typical dwellings in Sweden in two
different stages, namely operation and construction. Various systems, by which
energy was supplied for the aforementioned phases of case studies during their life
time, were considered. "The primary energy used and the CO2 emission resulting
from production is lower for wood-framed constructions than for concrete-framed
30
constructions" said Gustavsson & Joelsson (2010). Hernandez & Kenny (2010)
argued for neglected factors like embodies energy in net-zero residences regulations,
which were issued by some countries recently, and defined a methodology which
explains both energy during operation phase and embodied energy together, and
provided a comprehensive definition of "life cycle zero energy building (LC-ZEB)".
Pointing to the varying parameters in the analysis phase of embodied energy, which
leads to inaccuracy of energy data and consequently causing these data being
unreliable, Dixit, Fernández-Solís, Lavy, & Culp (2010) signalized a standard
process, during which data related to embodied energy is being collected. Ramesh,
Prakash, & Shukla (2010) mentioned operating and embodied energy as the most
important contributors to life cycle energy, with 80-90% and 10-20% contribution
respectively; They provided a statistical investigation on 73 case studies (office
buildings as well as dwellings) from 13 different developed countries, having rather
cold climate conditions. Furthermore, the impact of reducing operating energy
regarding a possible rise in the embodied energy reported to be dramatic. Fay,
Treloar, & Iyer-Raniga (2000) calculated 12 years energy payback period of an
Australian case study, in case of increasing the insulation level in buildings, and
reported that the saving of total energy use was minimal in 100 years’ horizon.
Accordingly, other possible strategies suggested to be studied before increasing the
insulation level. A rather different and opposing idea is expressed later in 2011,
employing AccuRate thermal simulation tool by Morrissey & Horne (2011), who
criticized current requirements of Australian energy codes, and demonstrated that in
terms of money it is more economical to refine current code requirements and
construct more energy efficient residences, taking Melbourne Victoria as Australian
weather representative in 25 & 40 years’ time, taking into account the rise in energy

31
price. Shu-hua, Yuan, & Xue (2010) calculated 76.5% total energy usage in the
operational phase in urban dwellings in China, and mentioned electricity and
specially coal, the major resources for energy supplication. The effect of building
orientation and shape on the energy consumption was addressed by Bostancioğlu
(2010), and a maximum 26.92% increase in energy demand was computed.
Conversely, the effect of building orientation was reported minimal with as little as
0.86% rise in energy usage. Asif, Muneer, & Kelley (2007) calculated the embodied
energy for different construction materials like "wood, aluminium, glass, concrete
and ceramic tiles" that were used in a semi-detached house in Scotland. Total
embodied energy reported to be 227.4 GJ, among which concrete's share was the
biggest following by timber and ceramic tiles with 61, 13 and 14% of total
respectively. The whole energy consumption of three prefabricated single-unit
houses in Sweden was evaluated by Adalberth (1997) who computed 85% and 15%
energy usage as operation and embodied energy respectively. The required energy to
produce heat insulation materials was then concluded to be equal to two years of
energy usage, during the management phase of case studies which, was mainly
employed for providing electricity or water and space heating purposes. Sartori &
Hestnes (2007) showed a linear relationship between total energy and operating
energy, as a result of an investigation on 60 case studies from 9 different countries,
comprising both non-residential and residential buildings. Low-energy units reported
more economical than conventional ones although, the embodied energy was
comparatively higher in the latter. "The embodied energy of buildings along with the
transport energy of their users, represent, together, the largest share of the life cycle
energy" stated Stephan, Crawford, & de Myttenaere (2011), attributing 23% of the
whole life cycle energy to space heating, which added up to 47%, taking into account

32
appliances and water heating. The embodied energy reported significantly high in
suburb low-energy residences, due to some factors such as transportation (39.5%
higher than urban dwellings).
2.6 Airtightness Effect on Building Energy Consumption
A number of investigations have mentioned infiltration as one of the most
important contributors to the superfluous energy consumption in the existing
buildings. Emmerich & Persily (1998) analyzed United Stated office buildings and
found that the infiltration accounts for 13% and 25% of heating load demand in old
and recent US buildings respectively while, this share for cooling load demand in
both cases was 3%. The impact of unrestrained air change on the "ventilation heating
energy" was reported to be significant, causing more than 50% loss in this type of
heating energy (Binamu, 2002). Jokisalo (2009) studied the effect of different factors
on the infiltration rate, as well as the impact of infiltration rate on total energy
demand of detached houses of Finland. It was concluded that 15-30% of energy is
consumed as the result of infiltration. They also concluded that airtightness and
annual infiltration rate is correlated linearly. More temperature fluctuation as a result
of higher leakage rates was reported by Kurnitski (2005), investigating the effect of
airtightness on thermal comfort characteristics of buildings. Kalamees (2007)
investigated on Estonian buildings and concluded that near 60% of buildings do not
meet the airtightness requirements of Estonian construction standards, using infrared
cameras and smoke detectors. Chan, Nazaroff, Price, Sohn, & Gadgil (2005)
performed a statistical analysis of 70000 leakage areas in residential sector of United
States, and mentioned construction date and building areas as the most important
factors of air leakage anticipation, in single-family detached dwellings.

33
2.7 Cyprus as Case Study in Literatures
Although there are numerous studies on building thermal performance, thermal
insulation materials, effect of different factors on the heating and specially cooling
load demand of dwellings and, optimum insulation thickness in the Mediterranean
climate, very little research has been performed taking Cyprus, which is located right
in the middle of the Mediterranean Sea, as case study.
The electricity consumption profile of service and residential sector, and their
relationship to climate condition changes, as well as prices and people's income in
Cyprus was studied by Zachariadis & Pashourtidou (2007). They drew a conclusion
that climate conditions’ changes have noticeable impact on the electricity
consumption in short term. Conversely, people's income as well as market prices had
little effect on the electricity consumption in the same period while; their effect was
reported significant in the long run. Employing econometric analysis, Zachariadis
(2010) predicted that the electricity consumption will be three times higher in 2030
in Cyprus. He also took global warming into account, as an effect of which, 1 degree
centigrade increase in temperature is expected in the Mediterranean area by 2030,
and calculated 2.9% increase in the electricity consumption by the aforementioned
time horizon as a result of which, 200 million euros (based on 2007) of welfare loss
might be tolerated. Egelioglu, Mohamad, & Guven (2001) found that three important
factors are major contributors to electricity consumptions yearly. These factors were
"the number of customers, the price of electricity and the number of tourists"
(Egelioglu, Mohamad, & Guven 2001). In addition, modeling based on these factors,
declared to possess the prediction capability of future energy consumptions.
Koroneos, Fokaidis, & Moussiopoulos (2005) discussed the feasibility of Cyprus
to employ renewable energy resources in order to reduce the amount of imported fuel

34
and coal for electricity production purposes. Introduction of building codes, focusing
on thermal insulation and developing public transport systems were two major
suggestions as a result of their study. "Climatically responsive houses and
settlements in Northern Cyprus" was analyzed by Ozay (2005) in different
architectural periods. Some elements of buildings like windows and fenestration
areas as well as the design were considered in her analysis. Besides, "the impact of
socio-economy, technology, culture, politics and building management strategies"
was also taken into account. Isik & Tulbentci (2008) provided an investigation on the
possible contribution of "gypsum-stabilized earth" which is called "Alker" in the
sustainable construction as wall material as it is widely used in Cyprus for
construction purposes. They concluded that the possibility is quite high since not
only Alker has a comparatively low heat transfer characteristic, but also it provides
health advantages. Embodied energy for this construction material on the other hand,
is considerably low. Florides, Kalogirou, Tassou, & Wrobel (2002) modeled an
"absorption solar cooling system" and determined several factors such as
"appropriate type of collector, the optimum size of storage tank, the optimum
collector slope and area, and the optimum thermostat setting of the auxiliary boiler"
using TRNSYS simulation engine. Panayi (2004) studied the effect of building
orientation, applying thermal mass, fenestration type and thermal insulation on the
energy (Heating and cooling load) demand of Cypriot houses, using TAS Building
Designer software, taking a detached house and an apartment as case studies. Double
glazing was suggested as the first measure and 2.5 centimeter wall insulation as the
second measure to take for both cases while, applying 0.6 and 0.4 meter of thermal
mass was suggested for apartments and detached houses respectively in order to
reduce energy consumption. Additionally, the effect of orientation reported to be

35
minimal. "The application of wall insulation and thermal mass leads to an increase of
air-conditioning and dehumidification energy" Panayi (2004) concluded. Kalogirou,
Florides, & Tassou (2002) emphasized on thermal mass usage for buildings in
Cyprus, using TRNSYS software. As a result, nearly 50% reduction in heating load
demand was observed. Accordingly, optimum overhang size calculated 1.2 meter and
the effect of wall cover, double glazing and altering air gap reported minimal.
Besides, the impact of roof insulation found significant and, ventilation by the rate of
3 ACH per hour led to 7.5% reduction in cooling load. The evolution of residential
buildings during 20th century in Cyprus, taking into account their energy (heating
and cooling load) demand was carried out by Florides, Tassou, Kalogirou, & Wrobel
(2001) using TRNSYS thermal simulation tool. Inside temperature of insulated and
traditional dwelling was 16-20 degrees centigrade in winter time and, 25-30 degrees
for summer. For the same seasons, corresponding temperatures was 11-20 degrees
and 33-46 degrees centigrade for flat roof residences. Accordingly, a drop of 5
degrees was observed as a result of imposing ventilation during summer time and
they draw a conclusion that construction methods and precautions such as “allowing
high ceilings and doors and positioning doors and windows towards the prevailing
night winds" provide the same inside temperature as modern, expensive and
insulated houses. Panayiotou, et al. (2010) performed a statistical study on energy
consumption profile of the residential sector of Cyprus, examining 482 dwellings
among which most cases were 100-150 square meter, and build between mid-80's
and 2001. 68% of case studies were single house, 80% of total did not apply
insulation to building external envelopes, where double glazed windows were
installed to more than fifty percent of case studies and, 82% of residences employed
solar heating systems for water heating purpose. Finally, the most comprehensive
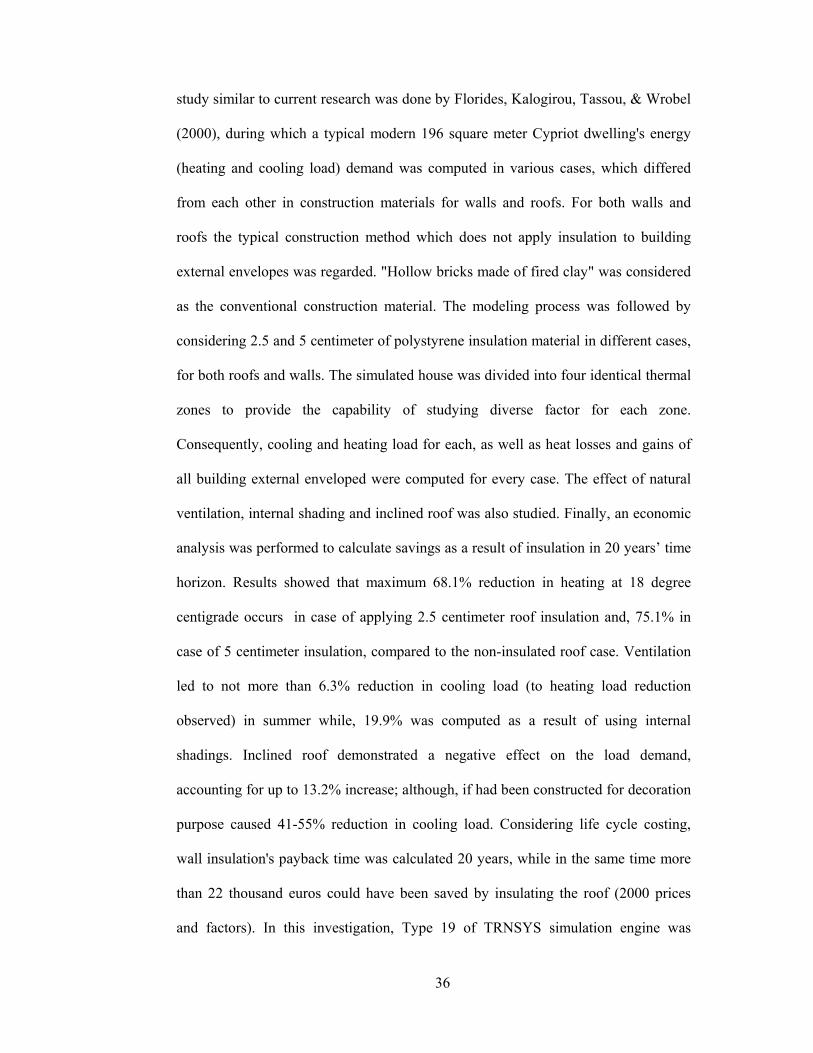
36
study similar to current research was done by Florides, Kalogirou, Tassou, & Wrobel
(2000), during which a typical modern 196 square meter Cypriot dwelling's energy
(heating and cooling load) demand was computed in various cases, which differed
from each other in construction materials for walls and roofs. For both walls and
roofs the typical construction method which does not apply insulation to building
external envelopes was regarded. "Hollow bricks made of fired clay" was considered
as the conventional construction material. The modeling process was followed by
considering 2.5 and 5 centimeter of polystyrene insulation material in different cases,
for both roofs and walls. The simulated house was divided into four identical thermal
zones to provide the capability of studying diverse factor for each zone.
Consequently, cooling and heating load for each, as well as heat losses and gains of
all building external enveloped were computed for every case. The effect of natural
ventilation, internal shading and inclined roof was also studied. Finally, an economic
analysis was performed to calculate savings as a result of insulation in 20 years’ time
horizon. Results showed that maximum 68.1% reduction in heating at 18 degree
centigrade occurs in case of applying 2.5 centimeter roof insulation and, 75.1% in
case of 5 centimeter insulation, compared to the non-insulated roof case. Ventilation
led to not more than 6.3% reduction in cooling load (to heating load reduction
observed) in summer while, 19.9% was computed as a result of using internal
shadings. Inclined roof demonstrated a negative effect on the load demand,
accounting for up to 13.2% increase; although, if had been constructed for decoration
purpose caused 41-55% reduction in cooling load. Considering life cycle costing,
wall insulation's payback time was calculated 20 years, while in the same time more
than 22 thousand euros could have been saved by insulating the roof (2000 prices
and factors). In this investigation, Type 19 of TRNSYS simulation engine was

37
employed. Set values for the most important factors which are normally applied in
thermal zone during the process of modeling, are demonstrated in tables 1-3:
38
Table 1: Parameters used in the modeling process by TRNSYS type 19, Florides, Kalogirou, Tassou, & Wrobel (2000)
Table 2: Wall parameters used in the modeling process by TRNSYS type 19,
Florides, Kalogirou, Tassou, & Wrobel (2000)
Table 3: Window parameters used in the modeling process by TRNSYS type 19,
Florides, Kalogirou, Tassou, & Wrobel (2000)
39
2.8 Non-Monetary Benefits of Improving Thermal Performance
The improvement of building's thermal performance has monetary benefits as
well as non-monetary advantages. Intangible benefits regarding this specific
characteristic of residences are attributed to the quality of inside air, changing which
the quality of the living space and inhabitants’ behavior toward their lives in these
spaces alters. Besides, according to Harvard health letter, 80-90% of people's lifetime
is spent in indoor spaces which highlight the importance of inside air's quality
assurance. In addition, Harvard health letter (2002) reported that "A good, strong fan
certainly helps, but at around 90º F and at a humidity of 35%, fans don’t protect
against heat-related illness" that intensifies the need to employ air conditioners.
Some diseases and specially allergies are because of small particles in the air
which are mostly a result of industrial processes, power plans and vehicle emissions.
Particles are actually quite small for the filters inside the conditioning system but,
using such systems requires doors and windows to be closed which contributes to
lowering air change rate per hour and consequently decreasing the existing level of
such pollution particles in the inside air.
Harvard health letter (2002) reports that "For several years now, researchers have
documented that hospital admissions for cardiovascular and lung disease go up when
air pollution levels are high". They also mentioned that these particles "May get into
the blood, increasing the levels of proteins that cause blood clots; triggering
inflammatory responses; constricting blood vessels; or some mix of all three".
Additionally, those who suffer from asthma, hayfever which causes constant
sneezing and dripping, and allergies to humidity and changes in temperature should
find air conditioning a cure to their diseases because of providing even temperature
and moisture reduction as well as resulting in less harmful particles in the air. Heat in

40
some residences, specially detached houses, may be provided with natural fire via
fireplace or fuel combustion which can fill the house with smoke and fine ash that
contribute to allergies and respiratory disease of any kind. In addition, storing wood
make an ideal place for insects and snakes, states Shopperholic,(2012).
Another disadvantage of living outside the comfort band is decreased
productivity, concentration and intellectual activity. "Recent studies have shown that
the ideal temperature to work in is around 20°C. and when the temperature rises by
just 4°C to 24°C, productivity drops by as much as 15%" declares cross-group,
(2012). An improvement in comfort level and dehydration risk reduction was also
highlighted as two important advantages of air conditioning by HelloDailyNews
(2012). Climachill (2012) concluded that human body's endeavor to maintain body
temperature, can cause extreme fatigue when exposed to too hot or too cold
temperatures.
Additionally, an increase in security assurance of dwellings as well as diminishing
the level of unnecessary racket are results of keeping doors and windows closed as
long as possible, reports apolloair, (2012).
41
Chapter 3
METHODOLOGY
3.1 Introduction
A typical single-family Cypriot residential unit is modeled with Autodesk REVIT.
The floor area of the case study is approximately 110 square meters, which is a
representative for the majority of family houses in Cyprus, based on a statistical
investigation carried out by Panayiotou, et al. (2010). The architectural plan is also a
typical plan for dwellings in modern architectural period, as a result of a research by
Ozay (2005).
Consequently, the model is exported to Autodesk Ecotect in order to perform
thermal analysis. For the base run, conventional construction materials of Cyprus,
comprising 10 types of wall, 4 types of floor and 3 types of roof, is assigned to the
model and, every single possible combination of these envelopes - totally 120 cases -
is analyzed from energy consumption point of view. As a result, the best
combination that leads to the least annual energy consumption is chosen. This
combination is going to be referred as “the best case”. At this stage, no insulation
material is considered since it is concluded by Panayiotou, et al. (2010) that
normally, buildings are not thermally insulated in Cyprus.
Additionally, required information's for available thermal insulation materials in
Cyprus is gathered and, according to heating and cooling degree hours, the optimum
insulation thickness for the best case study is calculated, utilizing p1-p2 optimization
method.

42
Then, the best case is insulated with available materials considering each
material’s optimum thickness, the placement of insulation layer in the envelope and
the assignment of doors and windows with better thermal performance characteristics
and, annual energy consumption is compared to the best case.
Moreover, an economic analysis is carried out on each case, and based on the net
present value of each insulation material, the most proper one for Cyprus’ residential
sector in figured out. This case is going to be referred as “the optimum case”.
Furthermore, the impact of two important factors namely increasing fenestration
area and airtightness, on the energy consumption profile of the optimum case are
studied.
Finally, a sensitivity analysis is performed to figure out the sensitivity level of the
optimum case’s payback period, on different factors such as material price, interest
and inflation rates fluctuation and electricity tariff.
Detailed information of the integration process of Autodesk Revit and Ecotect, as
well as mathematical optimization methods’ description and information regarding
the economic analysis is provided in this chapter.
3.2 Modeling Process
3.2.1 Autodesk Revit
The software is specifically created for Building Information Modeling (BIM) and
provides engineers and managers with adequate facilities and tools, to model a
project at the most detailed level available, in order to preserve consistency in all
possible phases of a construction project. Inconsistencies emerge in several stages of
design, which are carried out by totally different teams of engineers. For instance, at
the architectural design stage, the design is carried out regardless of particularized
structural, mechanical, electrical and plumbing consideration. Accordingly, later
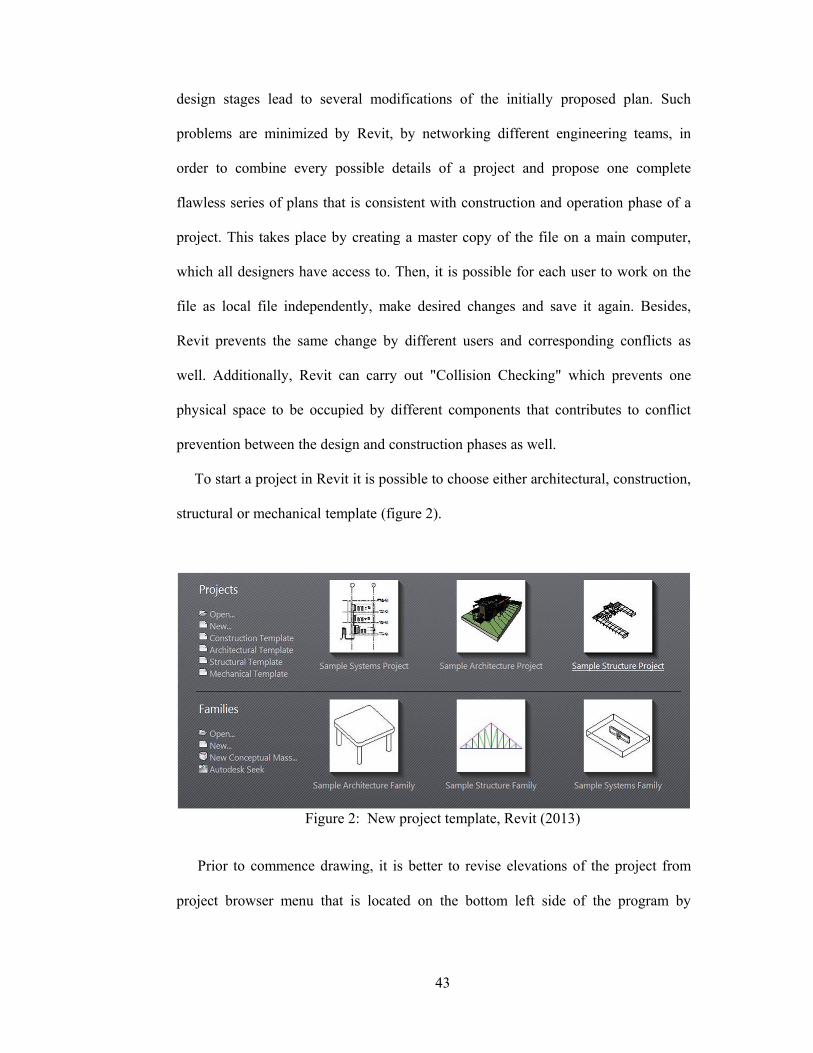
43
design stages lead to several modifications of the initially proposed plan. Such
problems are minimized by Revit, by networking different engineering teams, in
order to combine every possible details of a project and propose one complete
flawless series of plans that is consistent with construction and operation phase of a
project. This takes place by creating a master copy of the file on a main computer,
which all designers have access to. Then, it is possible for each user to work on the
file as local file independently, make desired changes and save it again. Besides,
Revit prevents the same change by different users and corresponding conflicts as
well. Additionally, Revit can carry out "Collision Checking" which prevents one
physical space to be occupied by different components that contributes to conflict
prevention between the design and construction phases as well.
To start a project in Revit it is possible to choose either architectural, construction,
structural or mechanical template (figure 2).
Figure 2: New project template, Revit (2013)
Prior to commence drawing, it is better to revise elevations of the project from
project browser menu that is located on the bottom left side of the program by
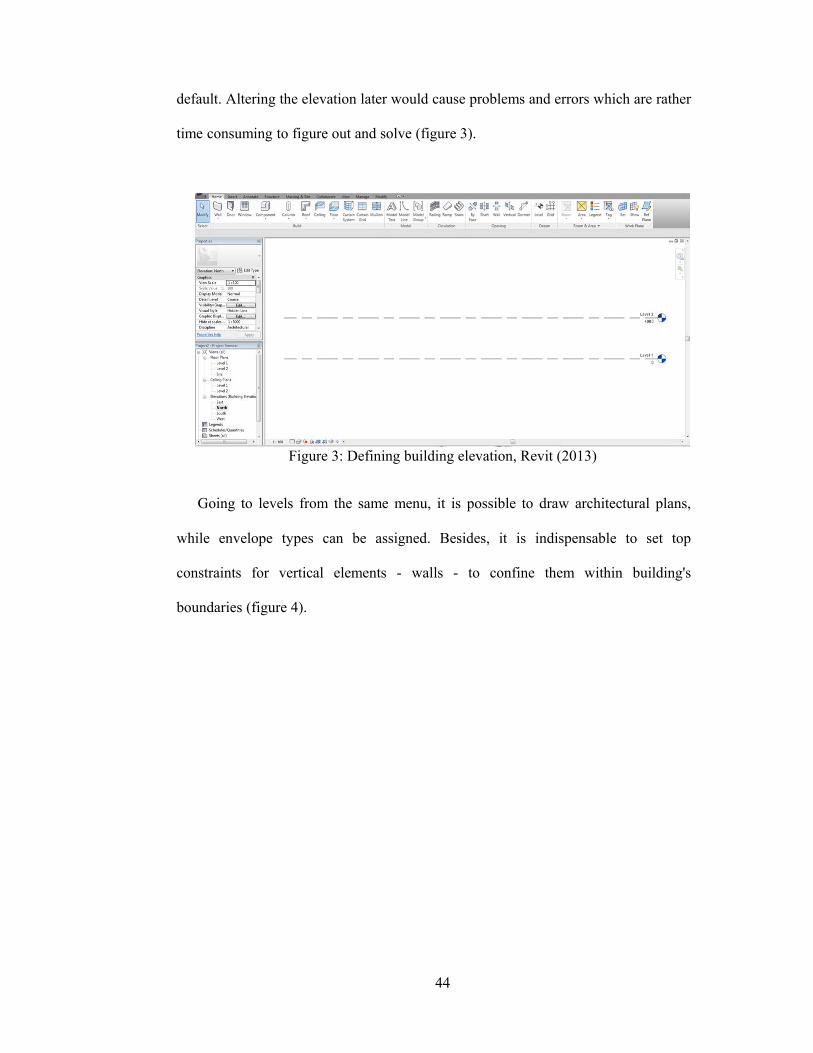
44
default. Altering the elevation later would cause problems and errors which are rather
time consuming to figure out and solve (figure 3).
Figure 3: Defining building elevation, Revit (2013)
Going to levels from the same menu, it is possible to draw architectural plans,
while envelope types can be assigned. Besides, it is indispensable to set top
constraints for vertical elements - walls - to confine them within building's
boundaries (figure 4).

45
Figure 4: Defining wall constraints, Revit (2013)
Selecting desired types of doors and windows as well, the process of modeling
continues (figure 5).
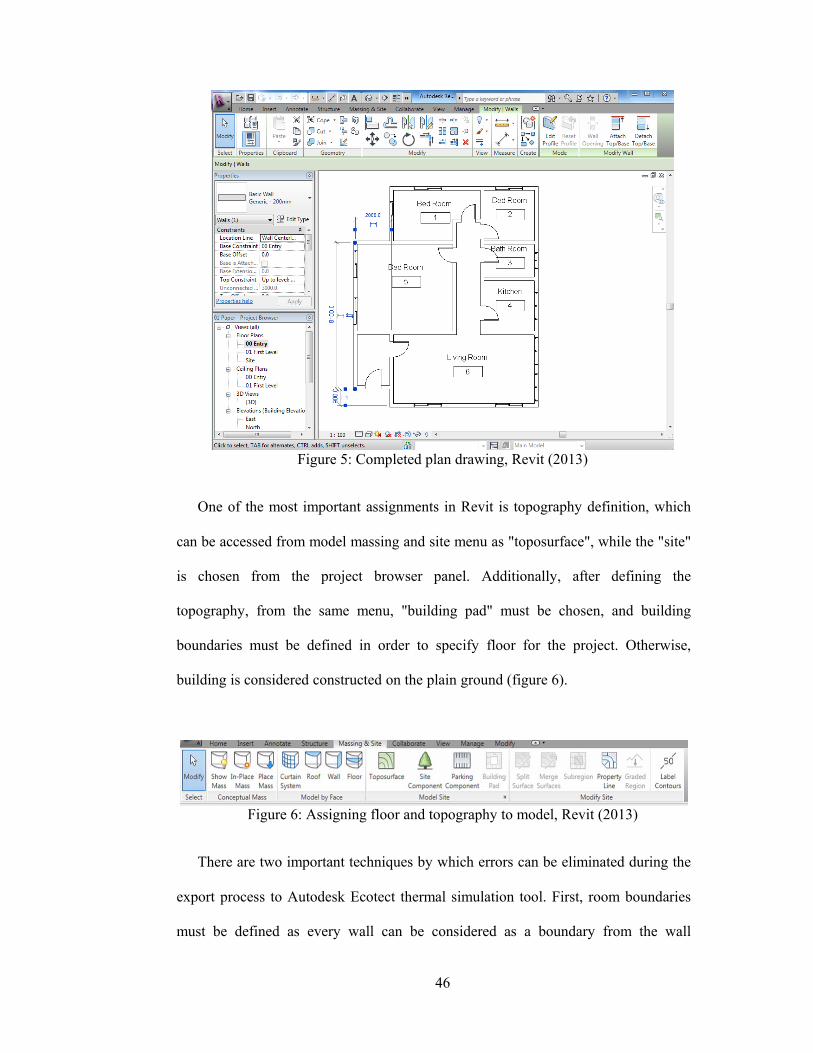
46
Figure 5: Completed plan drawing, Revit (2013)
One of the most important assignments in Revit is topography definition, which
can be accessed from model massing and site menu as "toposurface", while the "site"
is chosen from the project browser panel. Additionally, after defining the
topography, from the same menu, "building pad" must be chosen, and building
boundaries must be defined in order to specify floor for the project. Otherwise,
building is considered constructed on the plain ground (figure 6).
Figure 6: Assigning floor and topography to model, Revit (2013)
There are two important techniques by which errors can be eliminated during the
export process to Autodesk Ecotect thermal simulation tool. First, room boundaries
must be defined as every wall can be considered as a boundary from the wall
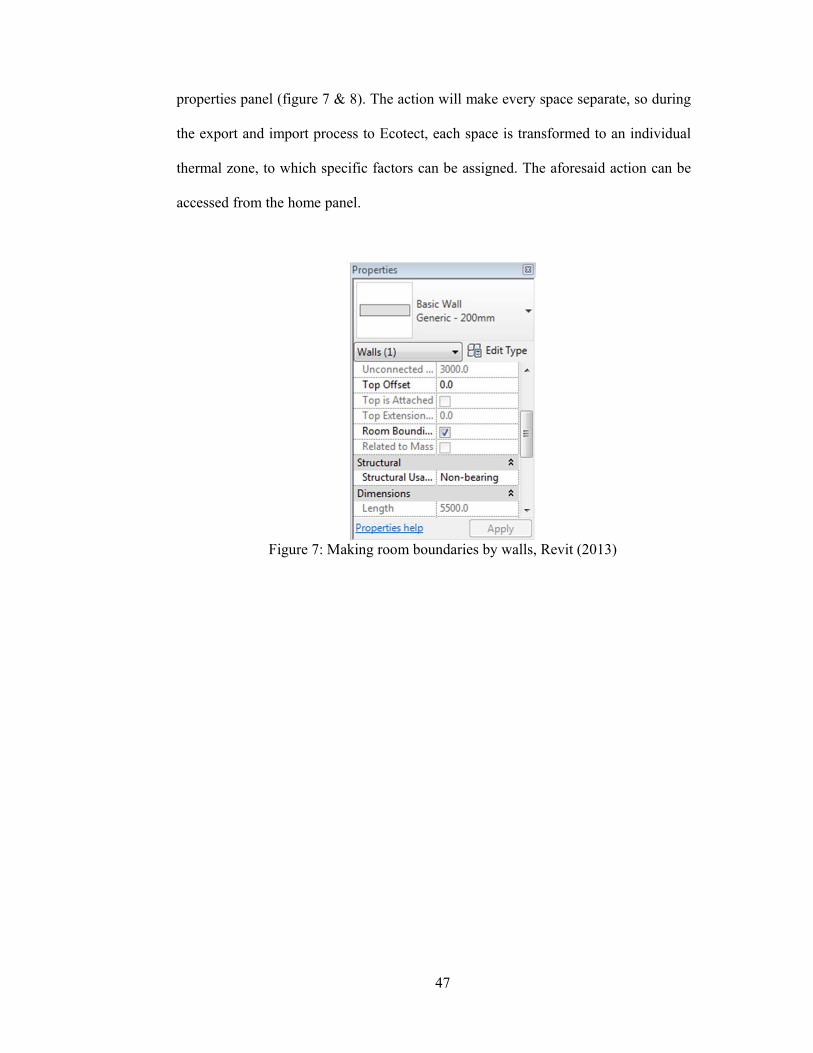
47
properties panel (figure 7 & 8). The action will make every space separate, so during
the export and import process to Ecotect, each space is transformed to an individual
thermal zone, to which specific factors can be assigned. The aforesaid action can be
accessed from the home panel.
Figure 7: Making room boundaries by walls, Revit (2013)

48
Figure 8: Assigned room boundaries, Revit (2013)
Second, there is area and volume computation function, in which it is possible to
define volume and room area computation preferences. To prevent errors and to
make the program able to perform the export process, both areas and volumes must
be chosen to be computed in Revit software and room area computations must be
opted to be computed at wall centers (figure 9).
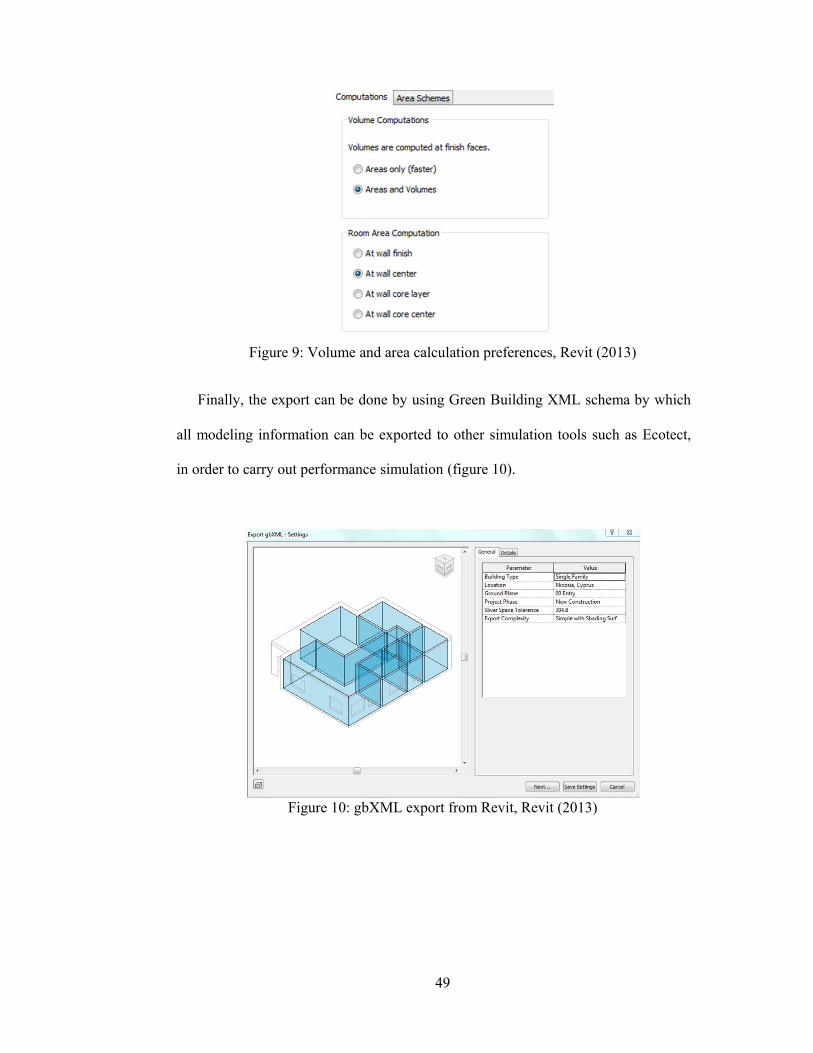
49
Figure 9: Volume and area calculation preferences, Revit (2013)
Finally, the export can be done by using Green Building XML schema by which
all modeling information can be exported to other simulation tools such as Ecotect,
in order to carry out performance simulation (figure 10).
Figure 10: gbXML export from Revit, Revit (2013)

50
3.2.2 Autodesk Ecotect
Autodesk Ecotect is one of the most important simulation engines, which is being
universally used for building performance modeling purposes, as it provides
engineers the tool to estimate carbon emission, water and energy demand or
consumption of a project. Besides, it is also capable of visualizing solar radiation as
well as day lighting, shadows and reflections. The specialty of Ecotect is the ability
of performance modeling in the early design stage, when simple modifications can
cause a surge in the quality of project's performance or energy saving.
The import process is done by using Green Building schema (figure 11) - gbXML
- which "facilitates the transfer of building information stored in CAD building
information models, enabling integrated interoperability between building design
models and a wide variety of engineering analysis tools and models available
today"(gbXML, 2012).
Figure 11: Importing gbXML format from Revit, Ecotect (2011)
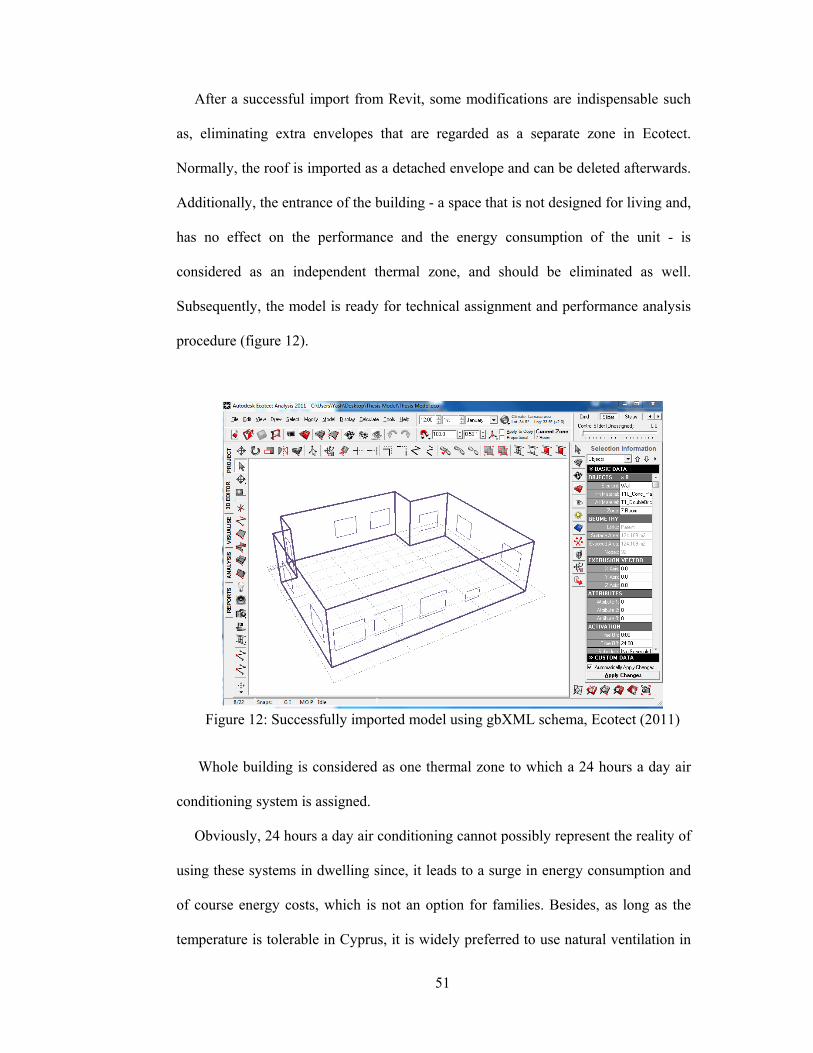
51
After a successful import from Revit, some modifications are indispensable such
as, eliminating extra envelopes that are regarded as a separate zone in Ecotect.
Normally, the roof is imported as a detached envelope and can be deleted afterwards.
Additionally, the entrance of the building - a space that is not designed for living and,
has no effect on the performance and the energy consumption of the unit - is
considered as an independent thermal zone, and should be eliminated as well.
Subsequently, the model is ready for technical assignment and performance analysis
procedure (figure 12).
Figure 12: Successfully imported model using gbXML schema, Ecotect (2011)
Whole building is considered as one thermal zone to which a 24 hours a day air
conditioning system is assigned.
Obviously, 24 hours a day air conditioning cannot possibly represent the reality of
using these systems in dwelling since, it leads to a surge in energy consumption and
of course energy costs, which is not an option for families. Besides, as long as the
temperature is tolerable in Cyprus, it is widely preferred to use natural ventilation in
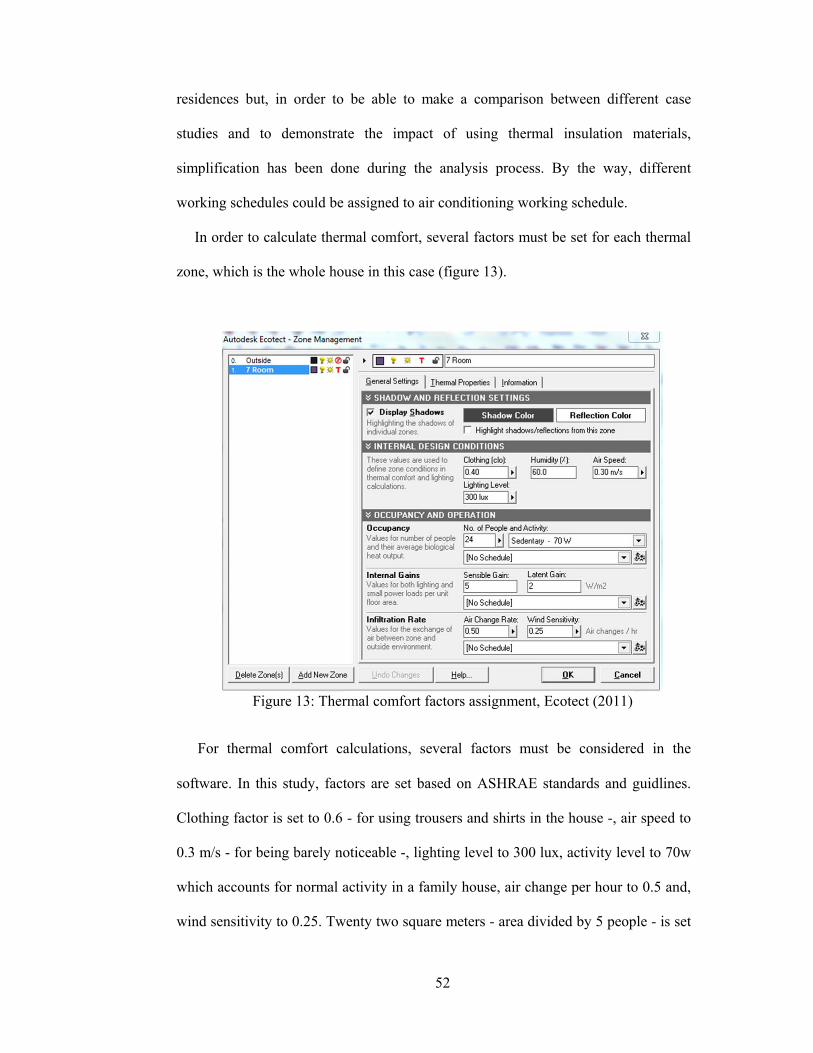
52
residences but, in order to be able to make a comparison between different case
studies and to demonstrate the impact of using thermal insulation materials,
simplification has been done during the analysis process. By the way, different
working schedules could be assigned to air conditioning working schedule.
In order to calculate thermal comfort, several factors must be set for each thermal
zone, which is the whole house in this case (figure 13).
Figure 13: Thermal comfort factors assignment, Ecotect (2011)
For thermal comfort calculations, several factors must be considered in the
software. In this study, factors are set based on ASHRAE standards and guidlines.
Clothing factor is set to 0.6 - for using trousers and shirts in the house -, air speed to
0.3 m/s - for being barely noticeable -, lighting level to 300 lux, activity level to 70w
which accounts for normal activity in a family house, air change per hour to 0.5 and,
wind sensitivity to 0.25. Twenty two square meters - area divided by 5 people - is set

53
for each person's activities in the model house. These factors kept unchanged for all
case studies. Besides, for heating and cooling load calculations, a 95% efficient air
conditioning system is assigned to the model, to achieve thermal comfort during day
and night. Additionally, lower band of the temperature range was set to 18 while 26
degrees of centigrade was set for the upper band (figure 14).
Figure 14: HVAC assignments, settings, and schedules, Ecotect (2011)
Thermal comfort was calculated by “monthly comfort times” method which
shows total uncomfortable times each month. Applying “average adaptive comfort”
according to Ecotect simulation tool, “assumes that people are adaptive in more
controlled buildings but not as much as in free running”. By using the formula
“T(c)=24.2+0.43(tave-22)x exp(-[(tave-22)/28.284]^2“ total thermal uncomfortable
times were calculated.

54
Making an envelope with desired construction layers is possible by modifying the
element library (figure 15).
Figure 15: Envelope design by layers, Ecotect (2011)
All types of layers all available in the library by which a specific wall could be
modified. Furthermore, by modifying the thickness - width - of any layer, envelopes
with multifarious thicknesses are created. Entering desired figures for the density,
specific heat, and thermal conductivity, it is possible to define new materials.
Finally, the overall thermal specifications of envelopes are calculated (figure 16)
and, the envelopes are ready to be assigned to the model.
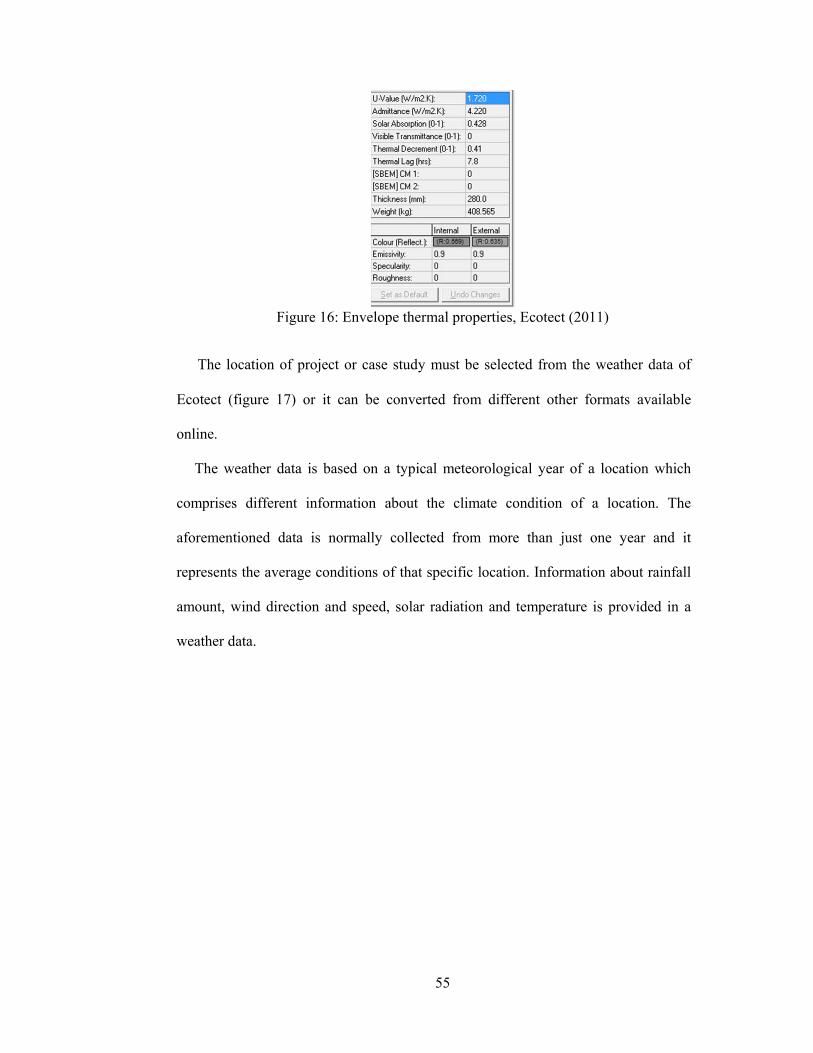
55
Figure 16: Envelope thermal properties, Ecotect (2011)
The location of project or case study must be selected from the weather data of
Ecotect (figure 17) or it can be converted from different other formats available
online.
The weather data is based on a typical meteorological year of a location which
comprises different information about the climate condition of a location. The
aforementioned data is normally collected from more than just one year and it
represents the average conditions of that specific location. Information about rainfall
amount, wind direction and speed, solar radiation and temperature is provided in a
weather data.

56
Figure 17: Weather data and specifications, Ecotect (2011)
At last, from the "calculate" tab, thermal analysis can be performed using which
function, thermal zones’ outside and inside temperature, relative contribution of
different heat flow paths, heating, ventilation and cooling supply loads to maintain
thermostat temperatures, times outside comfort or radiant temperature effects and
comparative graphs for loads and temperatures could be calculated.
The assignment of air conditioning systems must be done prior to analysis
performance else, no loads will be calculated (figure 18).
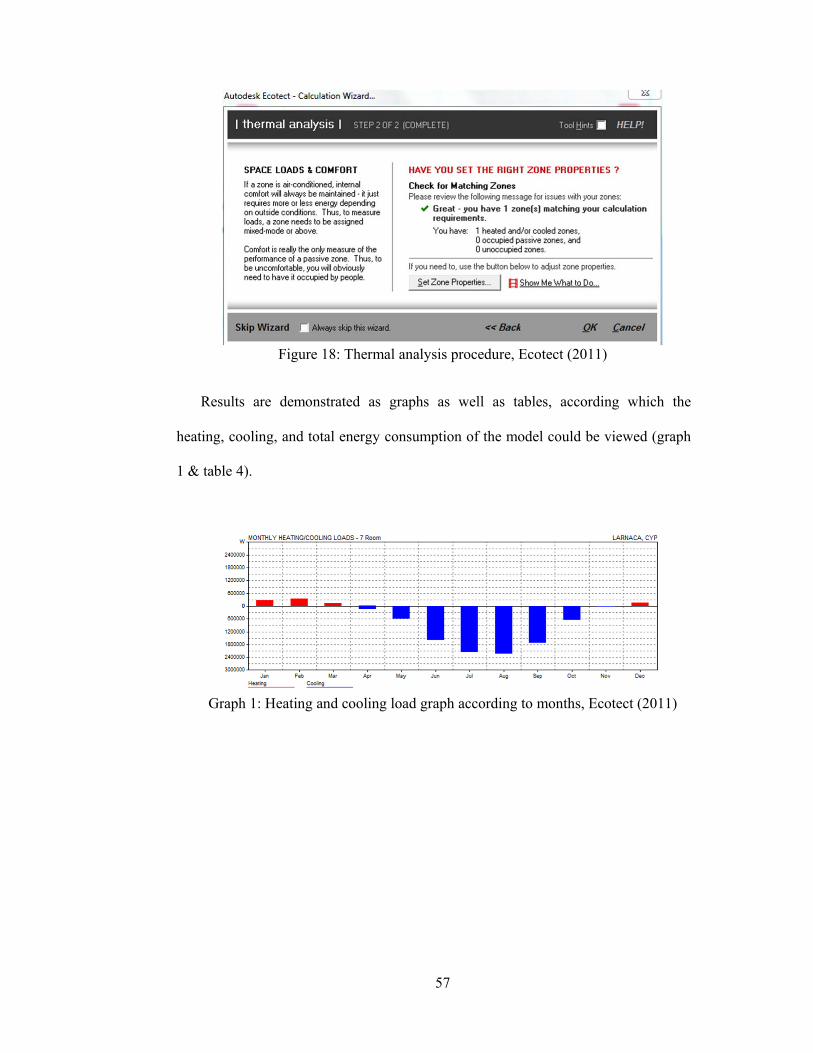
57
Figure 18: Thermal analysis procedure, Ecotect (2011)
Results are demonstrated as graphs as well as tables, according which the
heating, cooling, and total energy consumption of the model could be viewed (graph
1 & table 4).
Graph 1: Heating and cooling load graph according to months, Ecotect (2011)

58
Table 4: Energy consumption as thermal analysis result, Ecotect (2011)
3.3 Available Thermal Insulation Materials in Cyprus
There are a variety of insulation materials available in the construction industry of
Cyprus. Normally, the costs of the aforementioned materials are comparatively low
but, due to high transportation costs in Cyprus, the final cost of these materials
increases significantly.
Furthermore, as the majority of owners do not apply insulation to their buildings,
the demand for such materials are noticeably low, which is another factor that
contributes to the rise in the prices.
The most common materials available in Cyprus, could be derived from the
official unit prices while, more precise and up-to-date information can be collected
from local suppliers. In this case, data is gathered from C.E.E LTD which is one of
the prominent material suppliers in Cyprus. A summary of the face to face interview
is presented below (June 2012 prices):
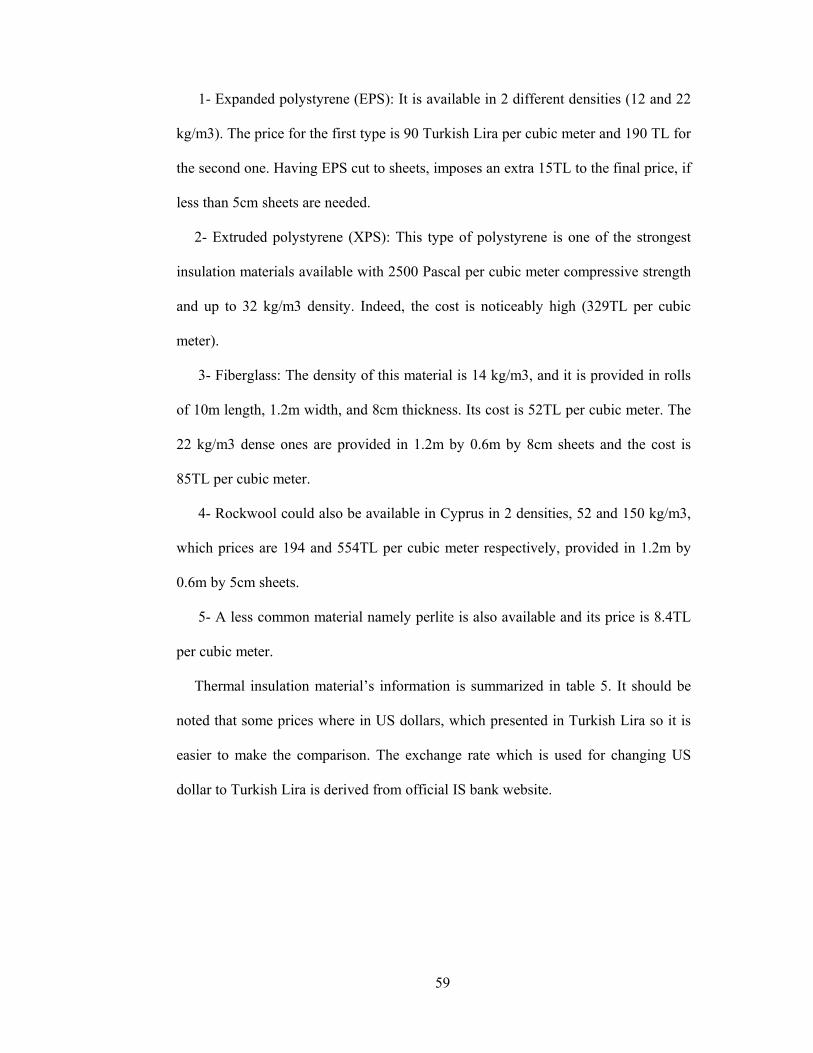
59
1- Expanded polystyrene (EPS): It is available in 2 different densities (12 and 22
kg/m3). The price for the first type is 90 Turkish Lira per cubic meter and 190 TL for
the second one. Having EPS cut to sheets, imposes an extra 15TL to the final price, if
less than 5cm sheets are needed.
2- Extruded polystyrene (XPS): This type of polystyrene is one of the strongest
insulation materials available with 2500 Pascal per cubic meter compressive strength
and up to 32 kg/m3 density. Indeed, the cost is noticeably high (329TL per cubic
meter).
3- Fiberglass: The density of this material is 14 kg/m3, and it is provided in rolls
of 10m length, 1.2m width, and 8cm thickness. Its cost is 52TL per cubic meter. The
22 kg/m3 dense ones are provided in 1.2m by 0.6m by 8cm sheets and the cost is
85TL per cubic meter.
4- Rockwool could also be available in Cyprus in 2 densities, 52 and 150 kg/m3,
which prices are 194 and 554TL per cubic meter respectively, provided in 1.2m by
0.6m by 5cm sheets.
5- A less common material namely perlite is also available and its price is 8.4TL
per cubic meter.
Thermal insulation material’s information is summarized in table 5. It should be
noted that some prices where in US dollars, which presented in Turkish Lira so it is
easier to make the comparison. The exchange rate which is used for changing US
dollar to Turkish Lira is derived from official IS bank website.
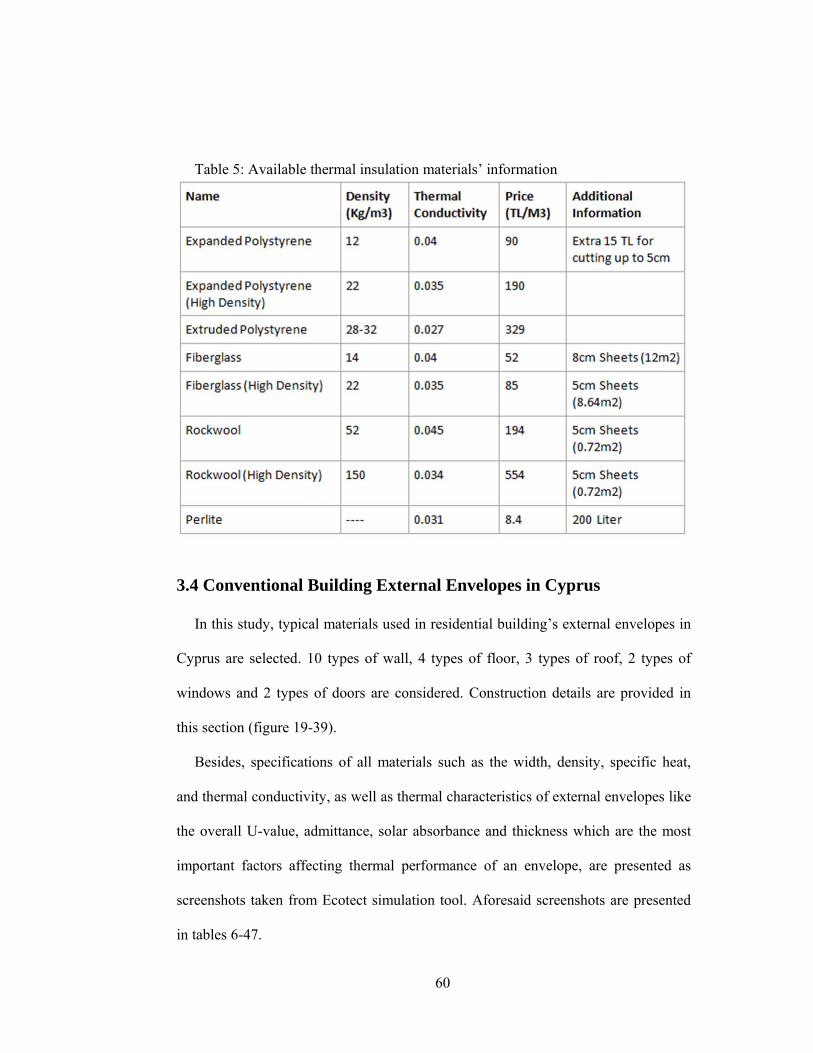
60
Table 5: Available thermal insulation materials’ information
3.4 Conventional Building External Envelopes in Cyprus
In this study, typical materials used in residential building’s external envelopes in
Cyprus are selected. 10 types of wall, 4 types of floor, 3 types of roof, 2 types of
windows and 2 types of doors are considered. Construction details are provided in
this section (figure 19-39).
Besides, specifications of all materials such as the width, density, specific heat,
and thermal conductivity, as well as thermal characteristics of external envelopes like
the overall U-value, admittance, solar absorbance and thickness which are the most
important factors affecting thermal performance of an envelope, are presented as
screenshots taken from Ecotect simulation tool. Aforesaid screenshots are presented
in tables 6-47.
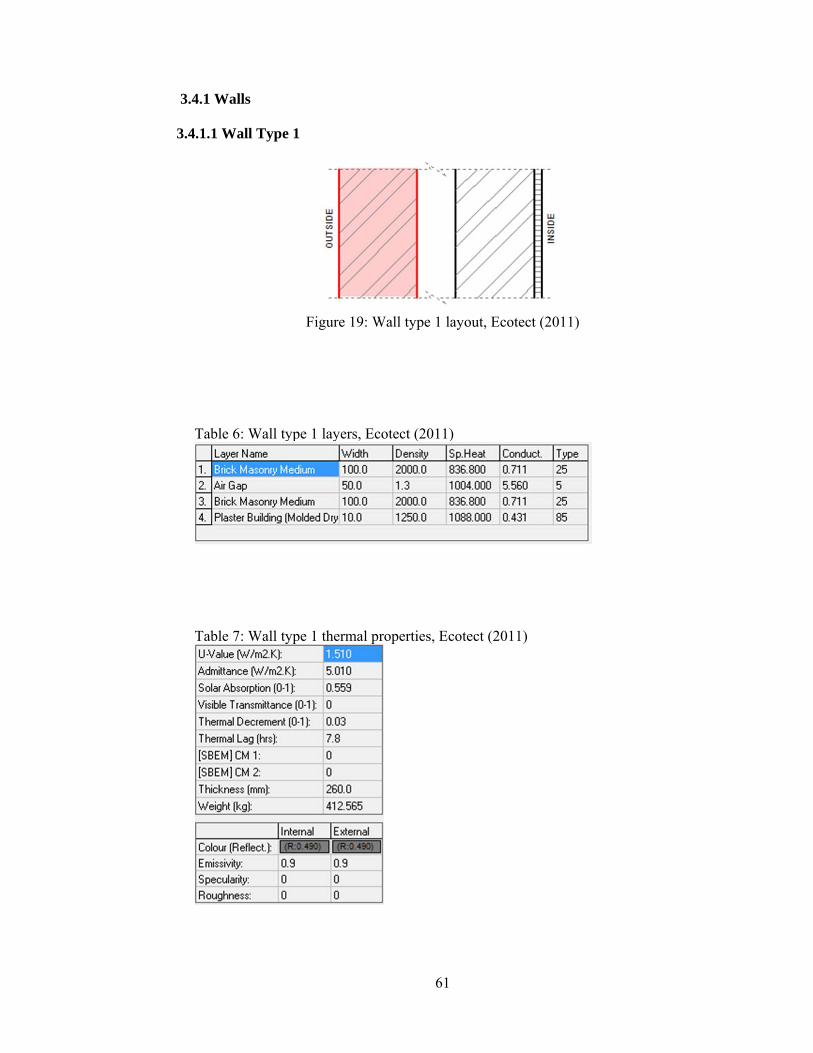
61
3.4.1 Walls
3.4.1.1 Wall Type 1
Figure 19: Wall type 1 layout, Ecotect (2011)
Table 6: Wall type 1 layers, Ecotect (2011)
Table 7: Wall type 1 thermal properties, Ecotect (2011)
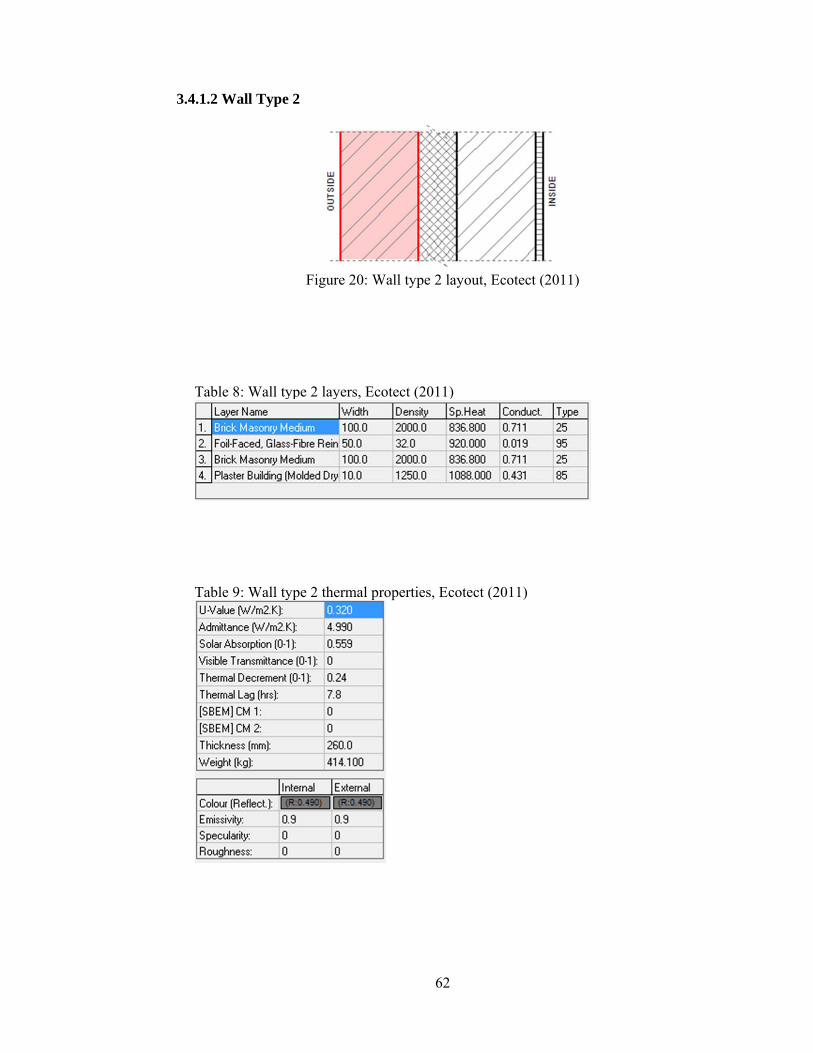
62
3.4.1.2 Wall Type 2
Figure 20: Wall type 2 layout, Ecotect (2011)
Table 8: Wall type 2 layers, Ecotect (2011)
Table 9: Wall type 2 thermal properties, Ecotect (2011)

63
3.4.1.3 Wall Type 3
Figure 21: Wall type 3 layout, Ecotect (2011)
Table 10: Wall type 3layers, Ecotect (2011)
Table 11: Wall type 3 thermal properties, Ecotect (2011)
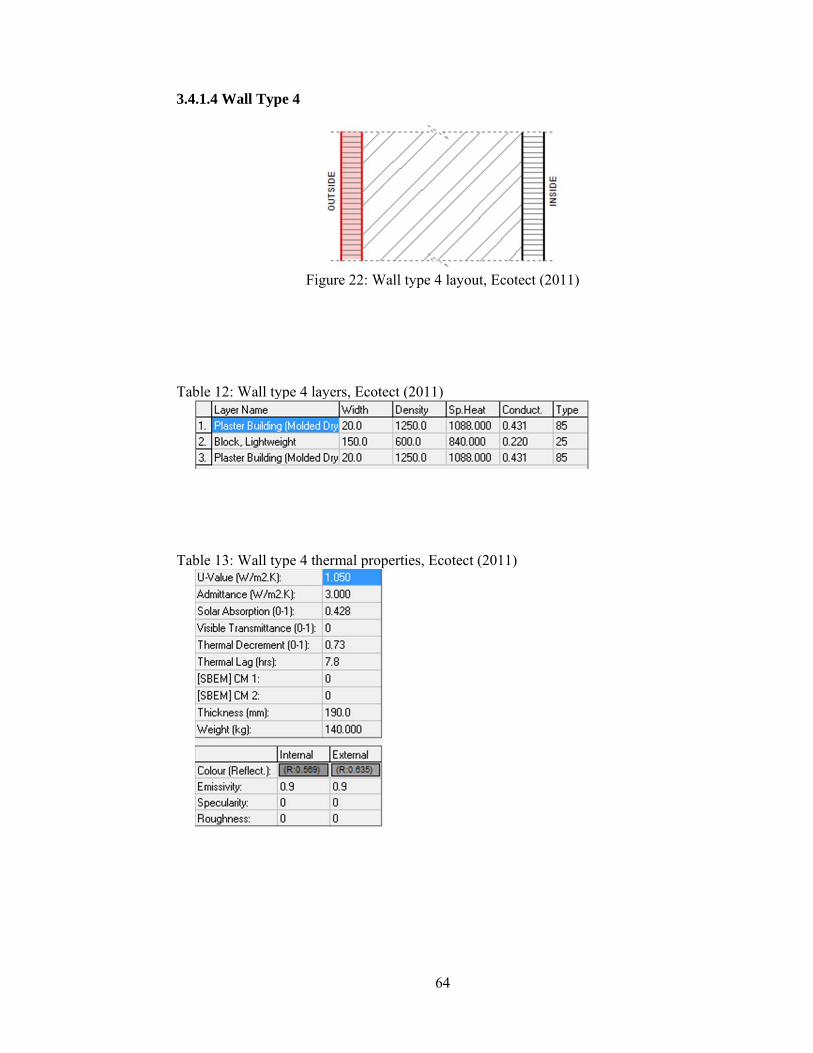
64
3.4.1.4 Wall Type 4
Figure 22: Wall type 4 layout, Ecotect (2011)
Table 12: Wall type 4 layers, Ecotect (2011)
Table 13: Wall type 4 thermal properties, Ecotect (2011)

65
3.4.1.5 Wall Type 5
Figure 23: Wall type 5 layout, Ecotect (2011)
Table 14: Wall type 5 layers, Ecotect (2011)
Table 15: Wall type 5 thermal properties, Ecotect (2011)

66
3.4.1.6 Wall Type 6
Figure 24: Wall type 6 layout, Ecotect (2011)
Table 16: Wall type 6 layers, Ecotect (2011)
Table 17: Wall type 6 thermal properties, Ecotect (2011)

67
3.4.1.7 Wall Type 7
Figure 25: Wall type 7 layout, Ecotect (2011)
Table 18: Wall type 7 layers, Ecotect (2011)
Table 19: Wall type 7 thermal properties, Ecotect (2011)

68
3.4.1.8 Wall Type 8
Figure 26: Wall type 8 layout, Ecotect (2011)
Table 20: Wall type 8 layers, Ecotect (2011)
Table 21: Wall type 8 thermal properties, Ecotect (2011)

69
3.4.1.9 Wall Type 9
Figure 27: Wall type 9 layout, Ecotect (2011)
Table 22: Wall type 9 layers, Ecotect (2011)
Table 23: Wall type 9 thermal properties, Ecotect (2011)
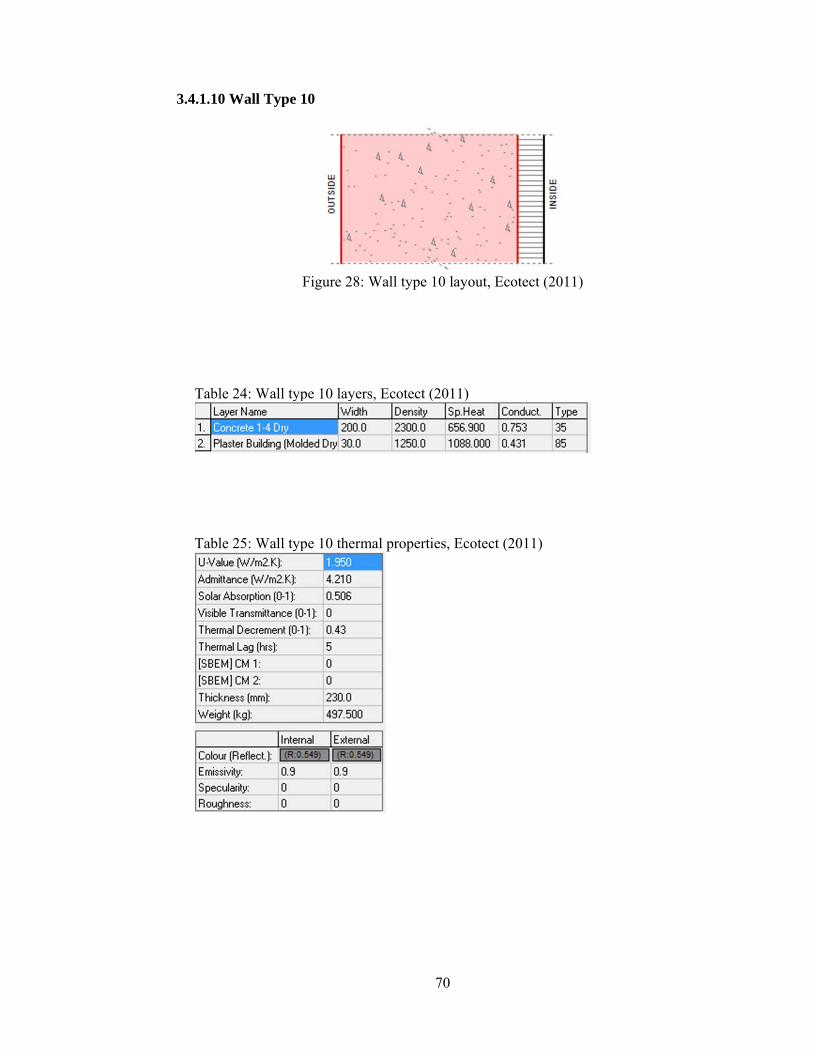
70
3.4.1.10 Wall Type 10
Figure 28: Wall type 10 layout, Ecotect (2011)
Table 24: Wall type 10 layers, Ecotect (2011)
Table 25: Wall type 10 thermal properties, Ecotect (2011)

71
3.4.2 Floors
3.4.2.1 Floor Type 1
Figure 29: Floor type 1 layout, Ecotect (2011)
Table 26: Floor type 1 Layers, Ecotect (2011)
Table 27: Floor type 1 thermal properties, Ecotect (2011)

72
3.4.2.2 Floor Type 2
Figure 30: Floor type 2 layout, Ecotect (2011)
Table 28: Floor type 2 Layers, Ecotect (2011)
Table 29: Floor type 2 thermal properties, Ecotect (2011)

73
3.4.2.3 Floor Type 3
Figure 31: Floor type 3 layout, Ecotect (2011)
Table 30: Floor type 3 Layers, Ecotect (2011)
Table 31: Floor type 3 thermal properties, Ecotect (2011)

74
3.4.2.4 Floor Type 4
Figure 32: Floor type 4 layout, Ecotect (2011)
Table 32: Floor type 4 Layers, Ecotect (2011)
Table 33: Floor type 4 thermal properties, Ecotect (2011)

75
3.4.3 Roofs
3.4.3.1 Roof Type 1
Figure 33: Roof type 1 layout, Ecotect (2011)
Table 34: Roof type 1 Layers, Ecotect (2011)
Table 35: Roof type 1 thermal properties, Ecotect (2011)

76
3.4.3.2 Roof Type2
Figure 34: Roof type 2 layout, Ecotect (2011)
Table 36: Roof type 2 Layers, Ecotect (2011)
Table 37: Roof type 2 thermal properties, Ecotect (2011)
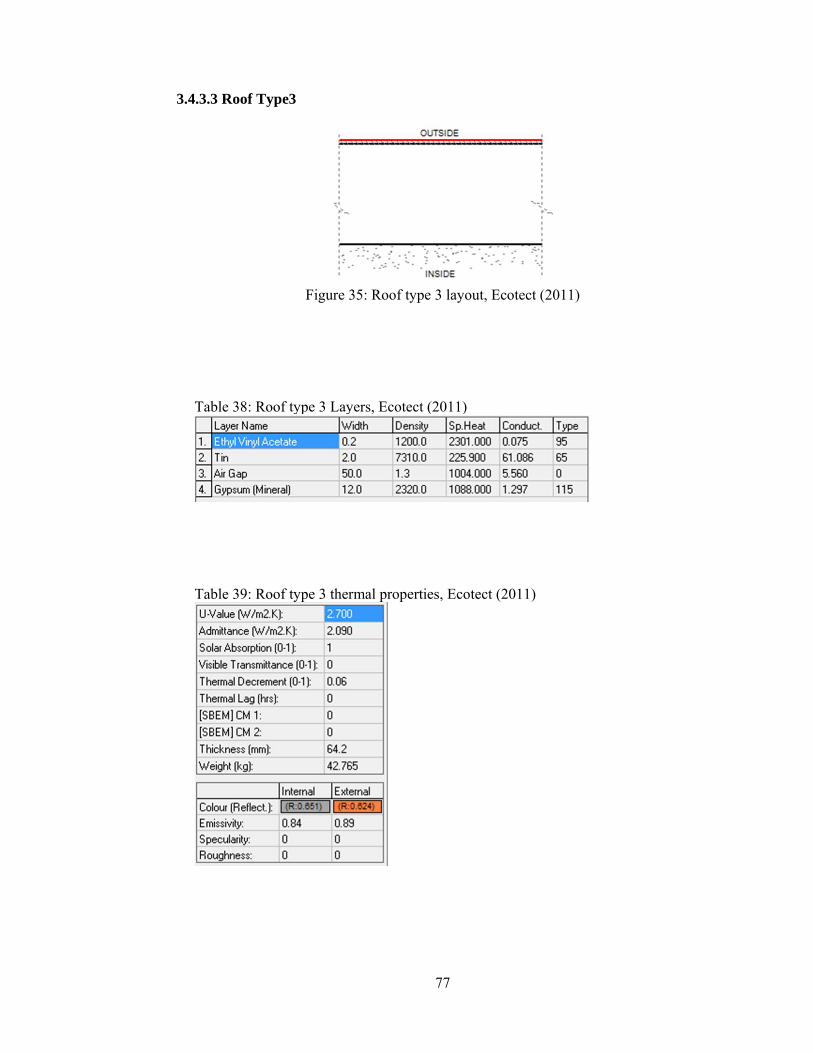
77
3.4.3.3 Roof Type3
Figure 35: Roof type 3 layout, Ecotect (2011)
Table 38: Roof type 3 Layers, Ecotect (2011)
Table 39: Roof type 3 thermal properties, Ecotect (2011)

78
3.4.4 Windows
3.4.4.1 Window Type 1
Figure 36: Window type 1 layout, Ecotect (2011)
Table 40: Window type 1 Layers, Ecotect (2011)
Table 41: Window type 1 thermal properties, Ecotect (2011)
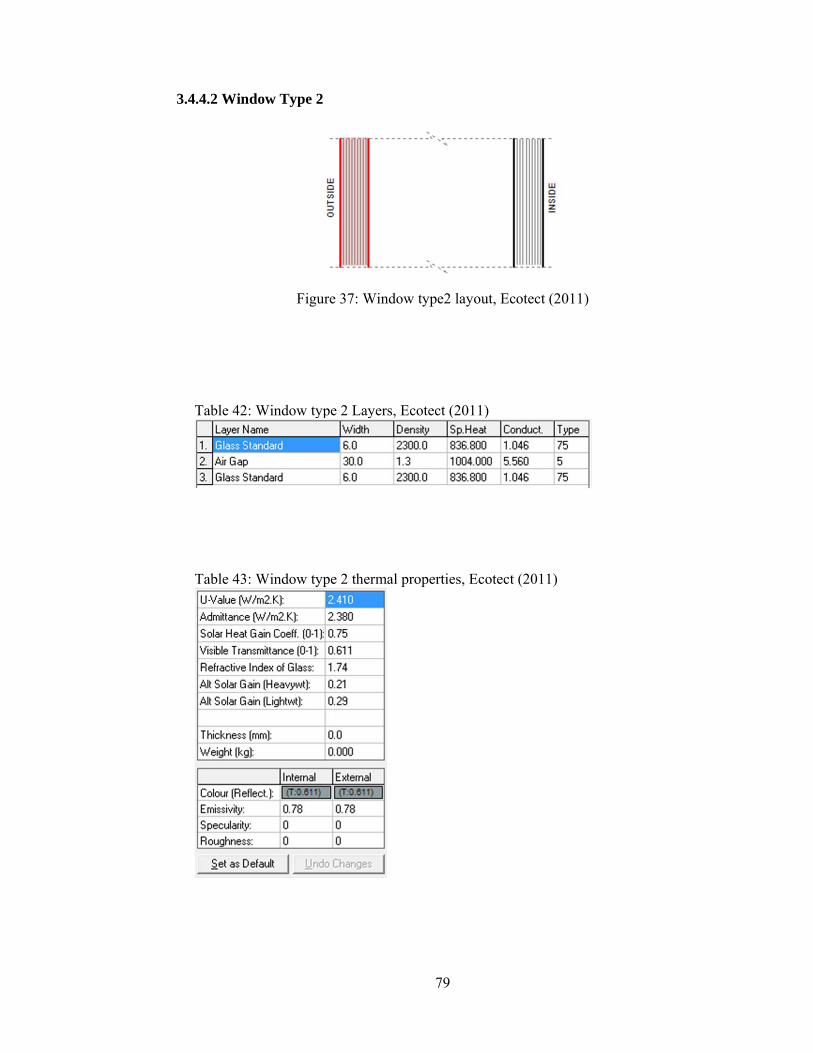
79
3.4.4.2 Window Type 2
Figure 37: Window type2 layout, Ecotect (2011)
Table 42: Window type 2 Layers, Ecotect (2011)
Table 43: Window type 2 thermal properties, Ecotect (2011)
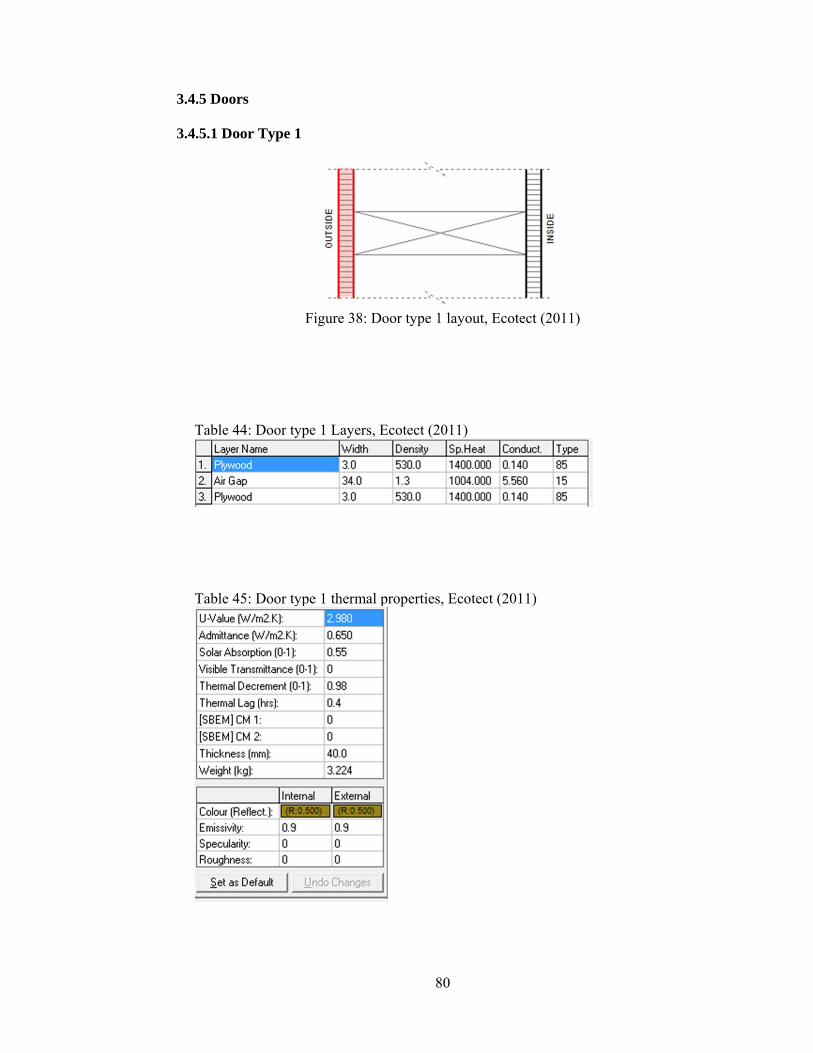
80
3.4.5 Doors
3.4.5.1 Door Type 1
Figure 38: Door type 1 layout, Ecotect (2011)
Table 44: Door type 1 Layers, Ecotect (2011)
Table 45: Door type 1 thermal properties, Ecotect (2011)

81
3.4.5.2 Door Type 2
Figure 39: Door type 2 layout, Ecotect (2011)
Table 46: Door type 2 Layers, Ecotect (2011)
Table 47: Door type2 thermal properties, Ecotect (2011)
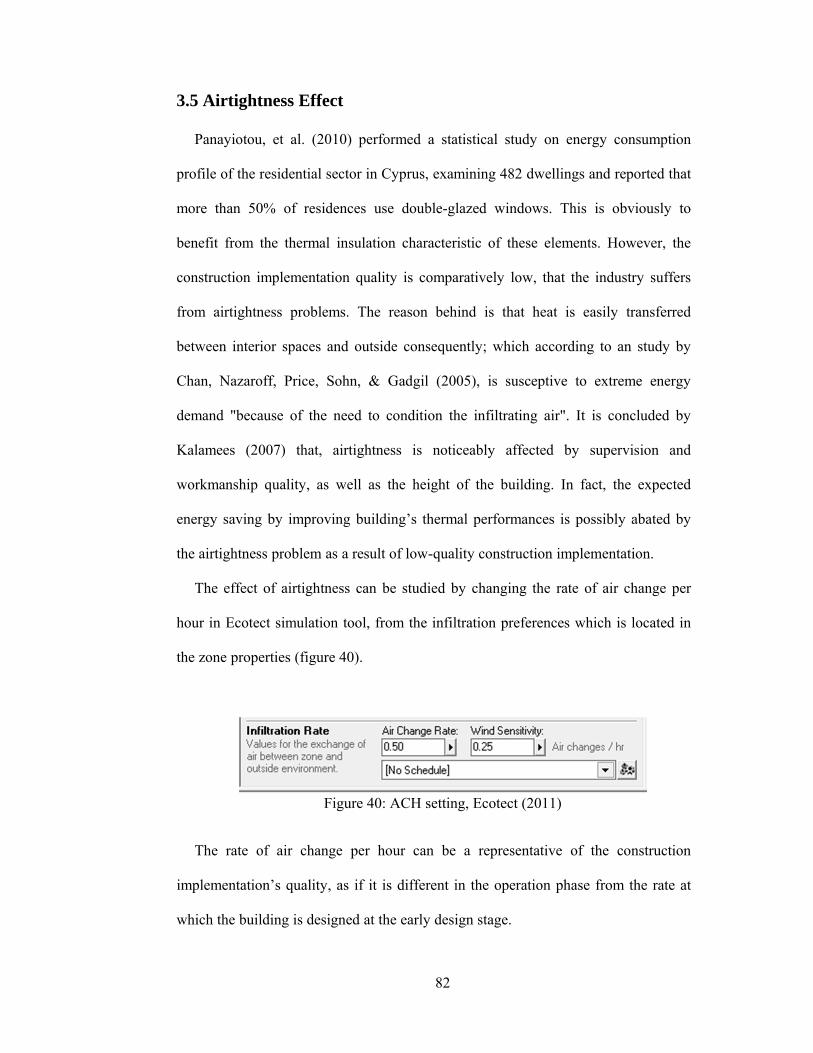
82
3.5 Airtightness Effect
Panayiotou, et al. (2010) performed a statistical study on energy consumption
profile of the residential sector in Cyprus, examining 482 dwellings and reported that
more than 50% of residences use double-glazed windows. This is obviously to
benefit from the thermal insulation characteristic of these elements. However, the
construction implementation quality is comparatively low, that the industry suffers
from airtightness problems. The reason behind is that heat is easily transferred
between interior spaces and outside consequently; which according to an study by
Chan, Nazaroff, Price, Sohn, & Gadgil (2005), is susceptive to extreme energy
demand "because of the need to condition the infiltrating air". It is concluded by
Kalamees (2007) that, airtightness is noticeably affected by supervision and
workmanship quality, as well as the height of the building. In fact, the expected
energy saving by improving building’s thermal performances is possibly abated by
the airtightness problem as a result of low-quality construction implementation.
The effect of airtightness can be studied by changing the rate of air change per
hour in Ecotect simulation tool, from the infiltration preferences which is located in
the zone properties (figure 40).
Figure 40: ACH setting, Ecotect (2011)
The rate of air change per hour can be a representative of the construction
implementation’s quality, as if it is different in the operation phase from the rate at
which the building is designed at the early design stage.
83
The effect of ACH is studied in the range of 0.25 ACH to 2.5 ACH for the
optimum case.
3.6 Effect of Fenestration Area
Residential construction’s characteristics have altered in different architectural
periods due to people's preferences. The glazing area for instance, is increased from
9.15% in Ottoman period to an average of 19.25% in the modern period of Cypriot
construction in urban areas Ozay (2005). The trend seems to be the same afterwards,
as a result of the influence of modern architectural on the conventional construction.
Although there are some studies on the design, construction, and operation phase of
conventional dwellings in Cyprus, there has been little investigation done on the
thermal performance of aforementioned facilities, taking into account the
transformation of these dwellings to highly glazed houses. As the tendency is grown
to live in houses with more fenestration areas, the importance of precise estimation
of cooling and heating demand increases significantly; "the energy use for different
highly glazed buildings may vary more than for buildings with traditional façades
since the glazed alternatives are particularly sensitive to the outdoor conditions” said
Poirazis, Blomsterberg, & Wall (2008).
Consequently, different glazing areas ranging from 20% to 60% are applied to
walls in every directions and the impact of the aforesaid increase on the energy
consumption profile of the optimum case is investigated.
Then, glazing area is modified in Autodesk Revit and the model is exported to
Ecotect since modifications of such type is rather difficult and time consuming in
Ecotect, as it is definitely not a drawing tool and, user-friendly tools for drawing
purposes are not provided in this software.
84
Chapter 4
OPTIMIZATION METHODS
4.1 Introduction
There are several optimization methods used in construction sector to minimize
costs and expenditures as much as possible, considering the required performance.
Most popular optimization methods fall in engineering economics category, which
are a function of analysis period as well as the interest rate. Optimization methods
are as follow (Revelle, Whitlatch, & Wright, 2004):
1- Present worth analysis
2- Annual cash flow analysis
3- Incremental benefit-cost ratio analysis
4- Incremental rate of return analysis
5- Payback period
Among the aforementioned methods, "present worth analysis is the most commonly
applied techniques in civil and environmental engineering economics" Revelle, Whitlatch, &
Wright (2004) declared.
On the other hand, present worth analysis can satisfactorily be employed to
investigate on the impact of a specific factor, by taking into account the costs and
benefits as a result of the factor under-study, independently.
Additionally, while the optimum thickness of insulation materials can be
calculated by employing computer simulation tools and applying present worth
analysis technique, a rather simple mathematical optimization method namely P1-P2,

85
could be used. P1-P2 is used to calculate the optimum insulation thickness, taking
into account the climate condition, as well as the price of electivity, materials and the
external envelope to which insulation is going to be applied.
4.2 Optimization Methods
4.2.1 P1-P2 Method
4.2.1.1 Formula Description
P1-P2 method is initially proposed by (Duffie & Beckman , 1991) as one of the
most prominent methods among which it is possible to calculate the present worth of
the energy savings, as a result of applying insulation to building envelopes.
Additionally, the optimization of insulation layer’s thickness can be carried out by
employing this method.
P1 is the factor for calculating the present worth of number of payments in future
and can be calculated by formula 1:
Formula 1: Calculating P1 factor, (Yu, Yang, Tian, & Liao, 2009)
Where Ne is the analysis period, i is the inflation rate for electricity cost and d is
the discount rate.
P2 is the ratio of life cycle costs which imposed as a result of extra initial
expenditure, to the capital investment, and is calculated by formula 2:
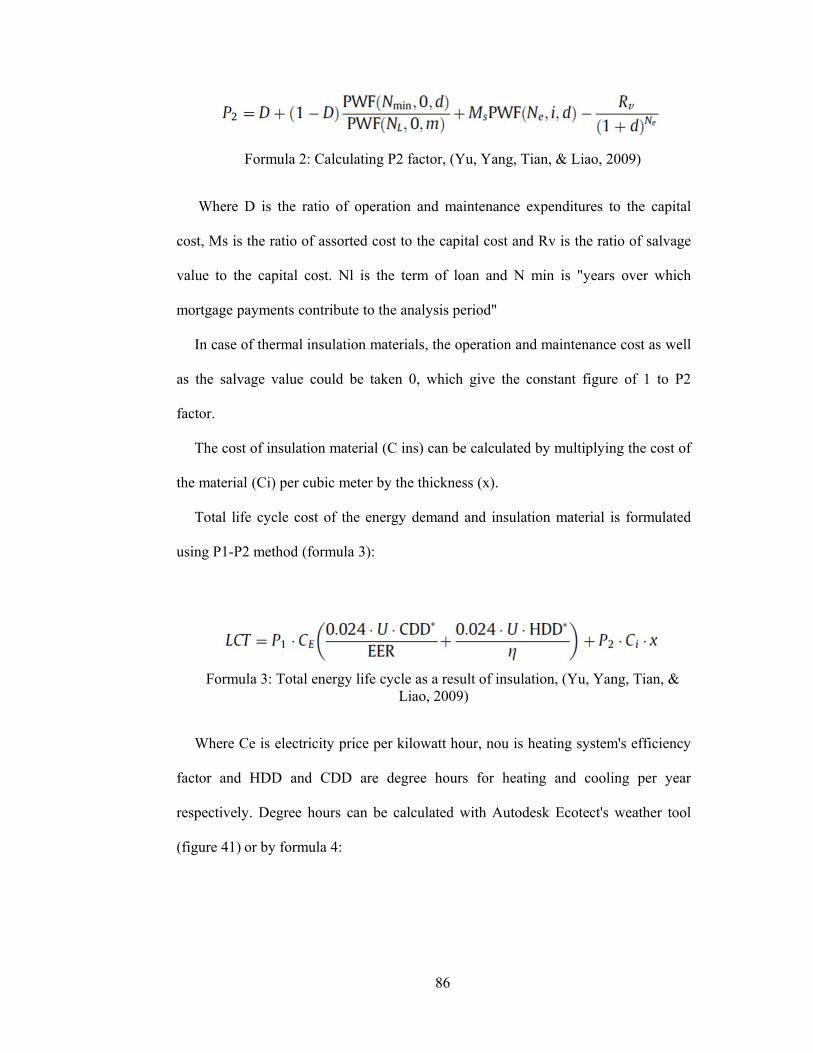
86
Formula 2: Calculating P2 factor, (Yu, Yang, Tian, & Liao, 2009)
Where D is the ratio of operation and maintenance expenditures to the capital
cost, Ms is the ratio of assorted cost to the capital cost and Rv is the ratio of salvage
value to the capital cost. Nl is the term of loan and N min is "years over which
mortgage payments contribute to the analysis period"
In case of thermal insulation materials, the operation and maintenance cost as well
as the salvage value could be taken 0, which give the constant figure of 1 to P2
factor.
The cost of insulation material (C ins) can be calculated by multiplying the cost of
the material (Ci) per cubic meter by the thickness (x).
Total life cycle cost of the energy demand and insulation material is formulated
using P1-P2 method (formula 3):
Formula 3: Total energy life cycle as a result of insulation, (Yu, Yang, Tian, &
Liao, 2009)
Where Ce is electricity price per kilowatt hour, nou is heating system's efficiency
factor and HDD and CDD are degree hours for heating and cooling per year
respectively. Degree hours can be calculated with Autodesk Ecotect's weather tool
(figure 41) or by formula 4:

87
Figure 41: Ecotect weather tool, Ecotect (2011)
Formula 4: Heating and cooling degree hour calculation, (Bolatturk, 2008)
Where Tsa is sol-air temperature for each hour and Tb is the base temperature.
Tsa can be calculated by the aforementioned weather tool or by formula 5:
Formula 5: Sol-air temperature calculation, (Bolatturk, 2008)
The life cycle saving which is the difference between cumulative saving of
expenditures for energy and the extra capital cost of the insulation is calculated
(formula 6):
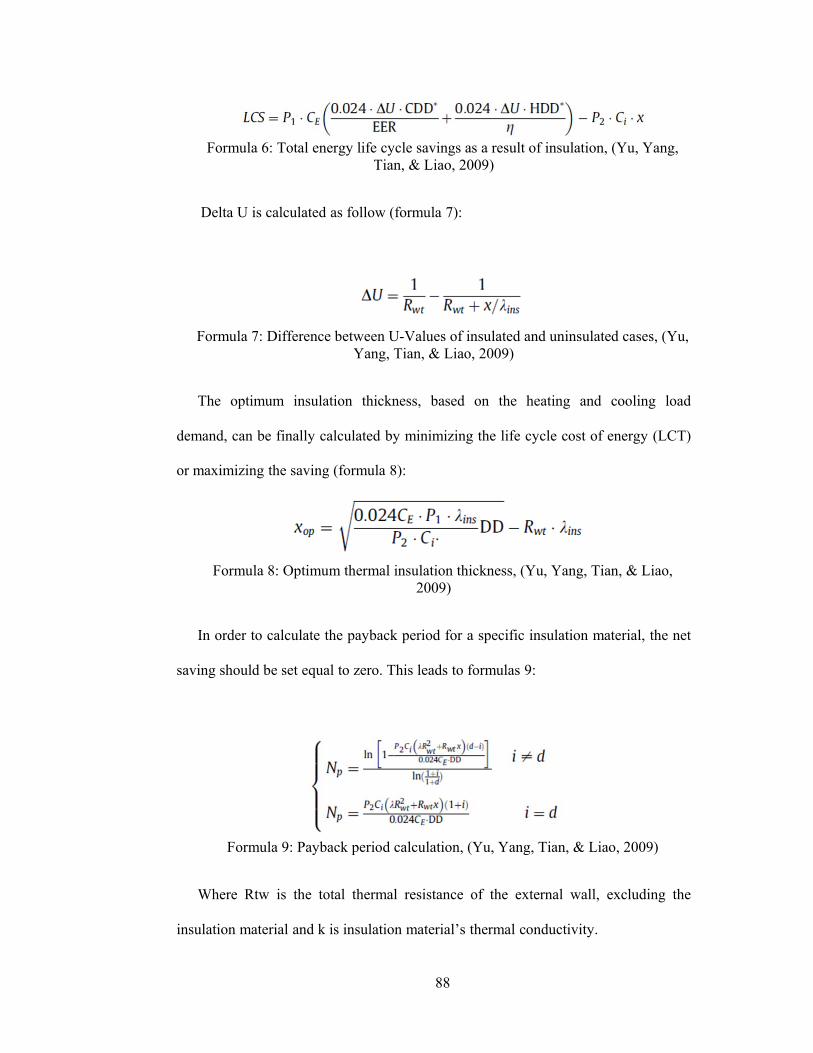
88
Formula 6: Total energy life cycle savings as a result of insulation, (Yu, Yang,
Tian, & Liao, 2009)
Delta U is calculated as follow (formula 7):
Formula 7: Difference between U-Values of insulated and uninsulated cases, (Yu,
Yang, Tian, & Liao, 2009)
The optimum insulation thickness, based on the heating and cooling load
demand, can be finally calculated by minimizing the life cycle cost of energy (LCT)
or maximizing the saving (formula 8):
Formula 8: Optimum thermal insulation thickness, (Yu, Yang, Tian, & Liao,
2009)
In order to calculate the payback period for a specific insulation material, the net
saving should be set equal to zero. This leads to formulas 9:
Formula 9: Payback period calculation, (Yu, Yang, Tian, & Liao, 2009)
Where Rtw is the total thermal resistance of the external wall, excluding the
insulation material and k is insulation material’s thermal conductivity.

89
DD is explained "as the function of climate and energy efficiency of cooling and
heating systems" (Yu, Yang, Tian, & Liao, 2009) which can be computed by formula
10:
Formula 10: Calculating DD factor, (Yu, Yang, Tian, & Liao, 2009)
Where EER is performance coefficient of the cooling system.
4.2.1.2 Figure Assignment
Initially, price and thermal conductivity is defined for each thermal insulating
material separately, and the overall thermal resistance of an insulated envelope is
retrieved from Ecotect software.
Next, the electricity cost (C e) is retrieved from bills by subtracting extra charges
for membership and electricity meter reading. The result is approximately 0.3
Turkish liras that make 0.16 US dollar (isbank, 2012).
Finally, heating and cooling degree hours are retrieved from the weather tool of
Ecotect software and multiplied by 0.04166 to convert to degree days which are the
proper format to use in formulas.
Besides, the energy efficiency ratio of the cooling load and the efficiency factor of
heating system are set to 2.3 and 1.9 respectively (Yu, Yang, Tian, & Liao, 2009).
Consequently, the optimum insulation thickness for each wall type and each
insulation material is calculated, following by the payback period and energy life
cycle saving of each case.
4.2.2 Present Worth Analysis
4.2.2.1 Formula Description
Net present value (NPV) concept takes into account the present value of the future
cash flow of any project, comprising costs and benefits. Without employing NPV

90
concept, it is impossible to figure out the net present value of the project, since
expenditures and benefits which enter to the project's cash flow in the future, has
different value than the present time. Therefore, in order to calculate the net present
value of every single project, present value of costs is calculated and subtracted from
the present value of benefits.
In the current study it is assumed that the project finished in the first year, which
is quite realistic for a single family detached residence’s project. Hence, the present
worth calculations are not applied to costs which are spent in present year.
Conversely, paying bills are commenced after the second year and the expenditure
must be adjusted to transform to present values. Besides, the saving as a result of
applying insulation is the same every year so, uniform series formulas are applied in
this case (formula 11).
Formula 11: Uniform series formulas, Revelle, Whitlatch, & Wright (2004)
The present worth formula is applied to annual saving and the accumulative
savings are then compared to total expenditures.

91
4.2.2.2 Figure Assignments
4% interest rate is considered in calculations, according to long term interest rates
of money deposit in banks, and the analysis period is varied from 1 to 30 years in
order to provide comparative analysis.

92
Chapter 5
RESULTS AND DISCUSSION
5.1 Introduction
Different categories of results were generated using optimization method as well
as computer simulations. First, the insulation thickness of the available thermal
insulation materials in Cyprus was optimized using P1-P2 method. Second, using
computer simulation, among 120 combinations of conventional building envelopes in
Cyprus, the best case which consumes the least energy annually was figured out.
Results of the aforesaid simulation were summarized in the tables 48-54. Third,
materials with corresponding optimum thicknesses were applied to the best case, and
the annul energy consumption of each case under effect of applying each insulation
material was computed. In the aforementioned stage, the effect of applying insulation
to wall and roof, as well as the effect of replacing windows with double glazed
windows and substituting doors were also studied and presented. Besides, thermal
comfort of each case was also computed by Ecotect simulation engine. Forth, a
sensitivity analysis of the number of years was carried out on the cost benefit
analysis of the best insulation material. Then, the impact of airtightness on the
optimum case was investigated using Ecotect software. Finally, the effect of
increasing fenestration area on the load demand of the optimum case was also
studied.

93
5.2 Results
5.2.1 Life Cycle Cost Analysis Based on P1-P2 Mathematical Model
According to graph 2, applying high density Rockwool led to the least life cycle
saving, accounting for 6.73 Turkish Lira per square meter, followed by low density
Rockwool using which, saving nearly doubled. Conversely, perlite was the best
material from life cycle saving point of view, which could lead to a saving as much
as 32.6 TL per square meter. However, the available perlite in Cyprus was expanded
perlite which is inappropriate for wall and roof installation. Expectedly, the cost of
materials is quite low for perlite (4.9 TL/M2) while high density Rockwool imposed
the highest initial cost - almost 31 TL/M2 - to the project.
Graph 2: Life cycle cost analysis based on P1-P2 mathematical model
30.8
23.8 2123.6
15.23
16.5
13
4.96.73
13.7
16
13.85
22.3
21
24.5
32.6
0
5
10
15
20
25
30
35
Total Life Cycle Cost(TL/M2)
Total Life Cycle Saving(TL/M2)
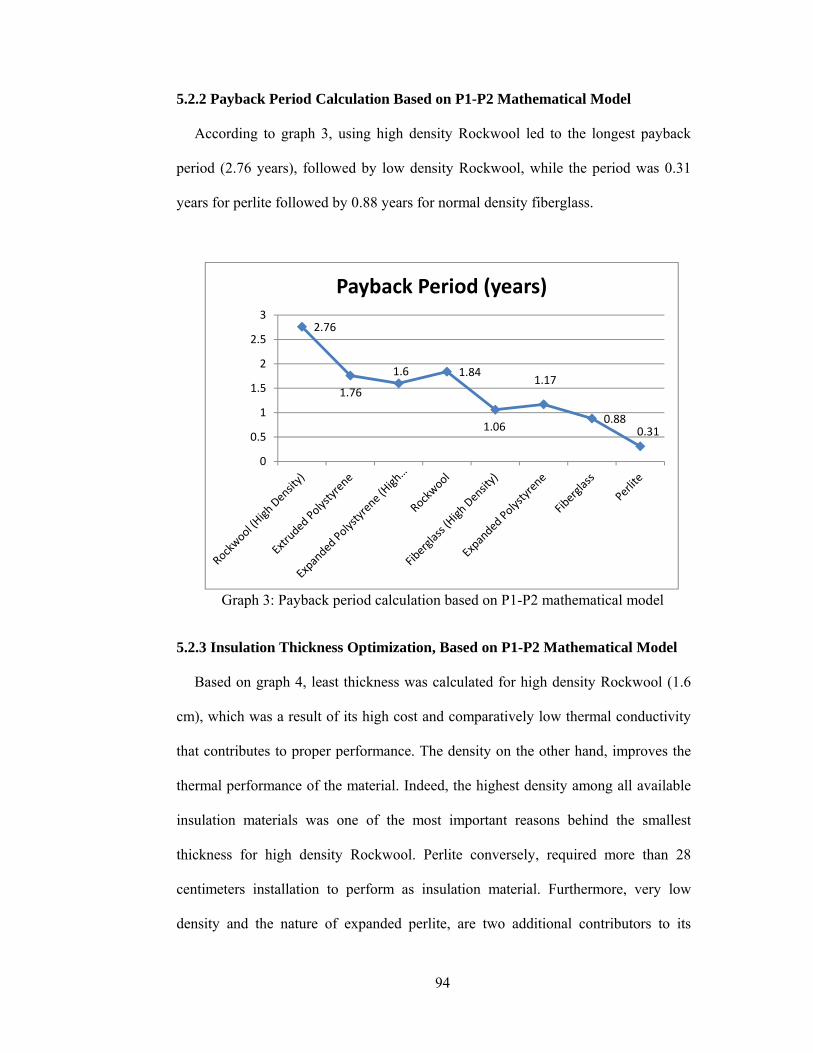
94
5.2.2 Payback Period Calculation Based on P1-P2 Mathematical Model
According to graph 3, using high density Rockwool led to the longest payback
period (2.76 years), followed by low density Rockwool, while the period was 0.31
years for perlite followed by 0.88 years for normal density fiberglass.
Graph 3: Payback period calculation based on P1-P2 mathematical model
5.2.3 Insulation Thickness Optimization, Based on P1-P2 Mathematical Model
Based on graph 4, least thickness was calculated for high density Rockwool (1.6
cm), which was a result of its high cost and comparatively low thermal conductivity
that contributes to proper performance. The density on the other hand, improves the
thermal performance of the material. Indeed, the highest density among all available
insulation materials was one of the most important reasons behind the smallest
thickness for high density Rockwool. Perlite conversely, required more than 28
centimeters installation to perform as insulation material. Furthermore, very low
density and the nature of expanded perlite, are two additional contributors to its
2.76
1.76
1.6 1.84
1.06
1.17
0.880.31
0
0.5
1
1.5
2
2.5
3
Payback Period (years)

95
inapplicability in residential construction. Therefore, fiberglass was considered as the
material which required the greatest thickness for building envelope applications,
with as much as 11 centimeters.
Graph 4: Insulation thickness optimization based on P1-P2 mathematical model
5.2.4 Annual Energy Demand Based on Conventional Construction Materials
12 series comprising a total of 120 cases were studied and the results
demonstrated that the minimum energy demand corresponds to the application of
floor type4, roof type 1 and wall type 1 together, which accounted for 7864 kwh
energy consumption. This figure solely, was the result of consuming electricity to
condition the inside air, in order to achieve desired temperature in different seasons
while, the combination of floor type1, roof type 2 and wall type 7 created the worst
combination amongst, from total load demand point of view (table 48-54).
1.6 2.7 4.4 4.67.8
7.8
11.1
28.2
0
5
10
15
20
25
30
Optimum Insulation Thickness (cm)
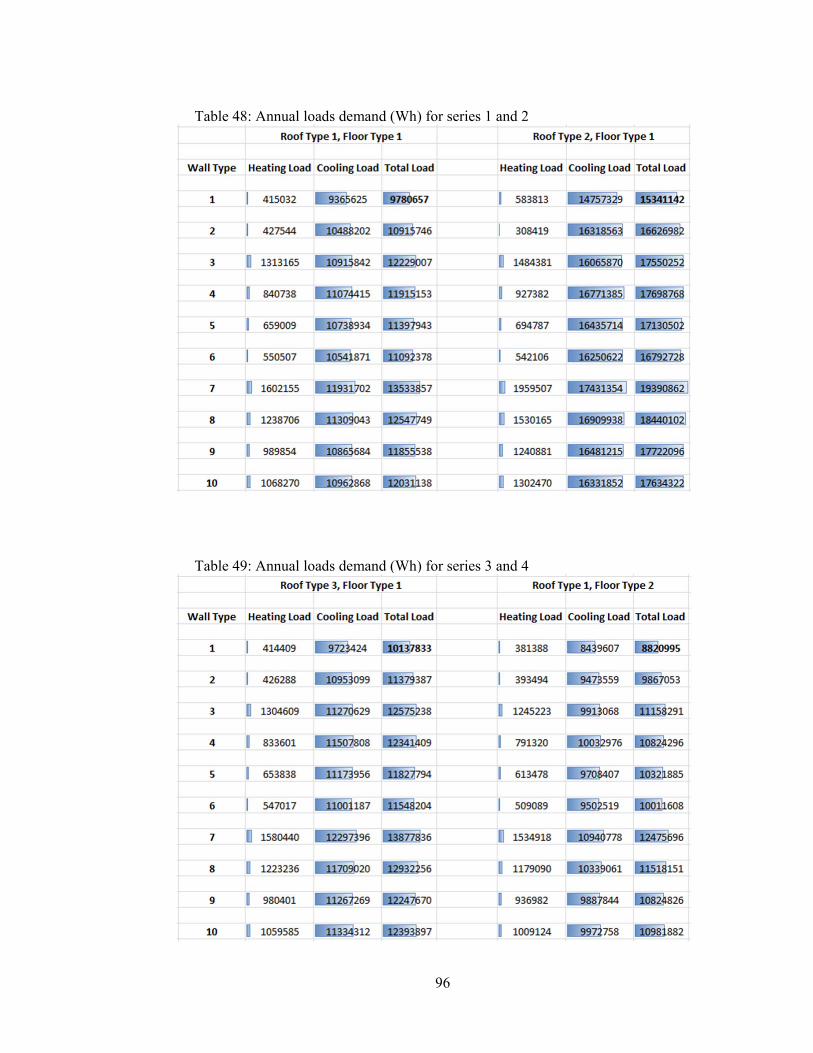
96
Table 48: Annual loads demand (Wh) for series 1 and 2
Table 49: Annual loads demand (Wh) for series 3 and 4
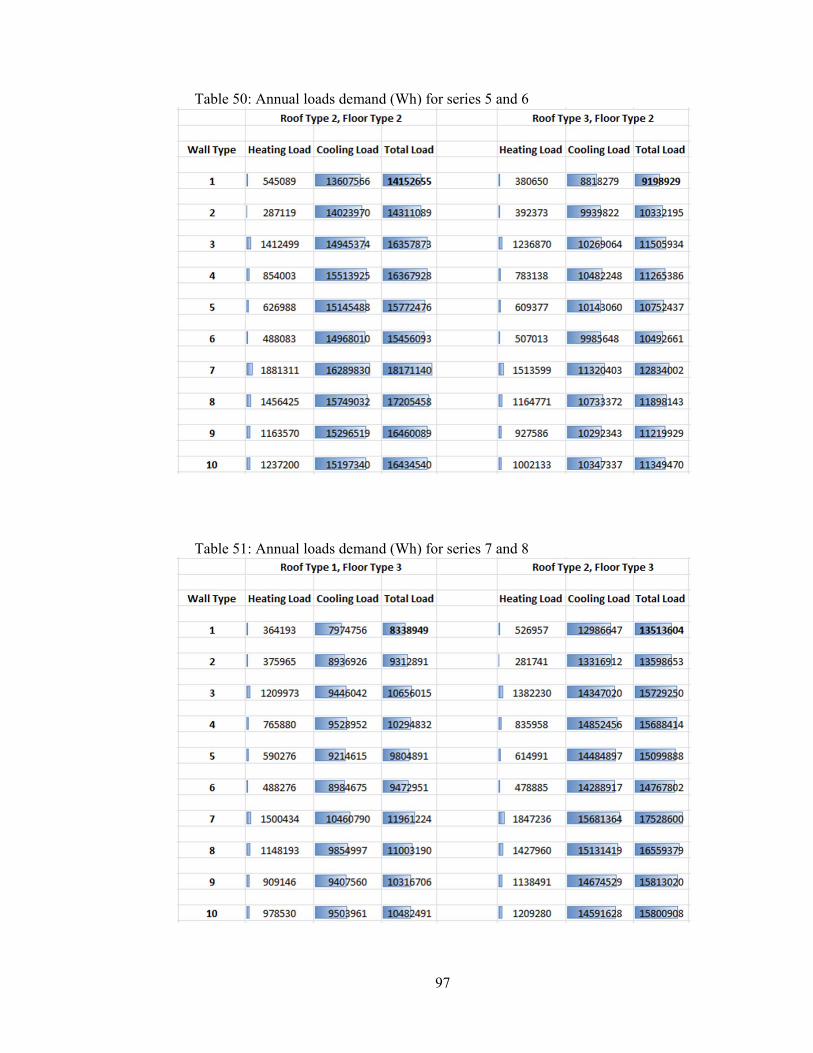
97
Table 50: Annual loads demand (Wh) for series 5 and 6
Table 51: Annual loads demand (Wh) for series 7 and 8
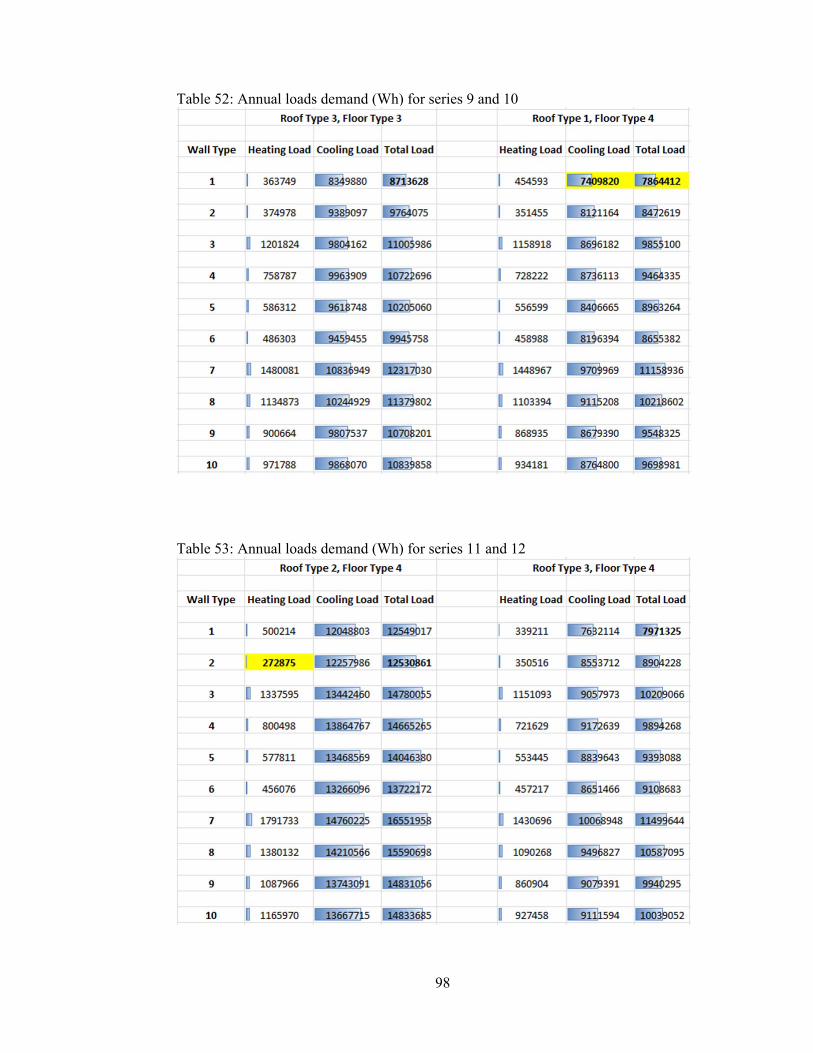
98
Table 52: Annual loads demand (Wh) for series 9 and 10
Table 53: Annual loads demand (Wh) for series 11 and 12
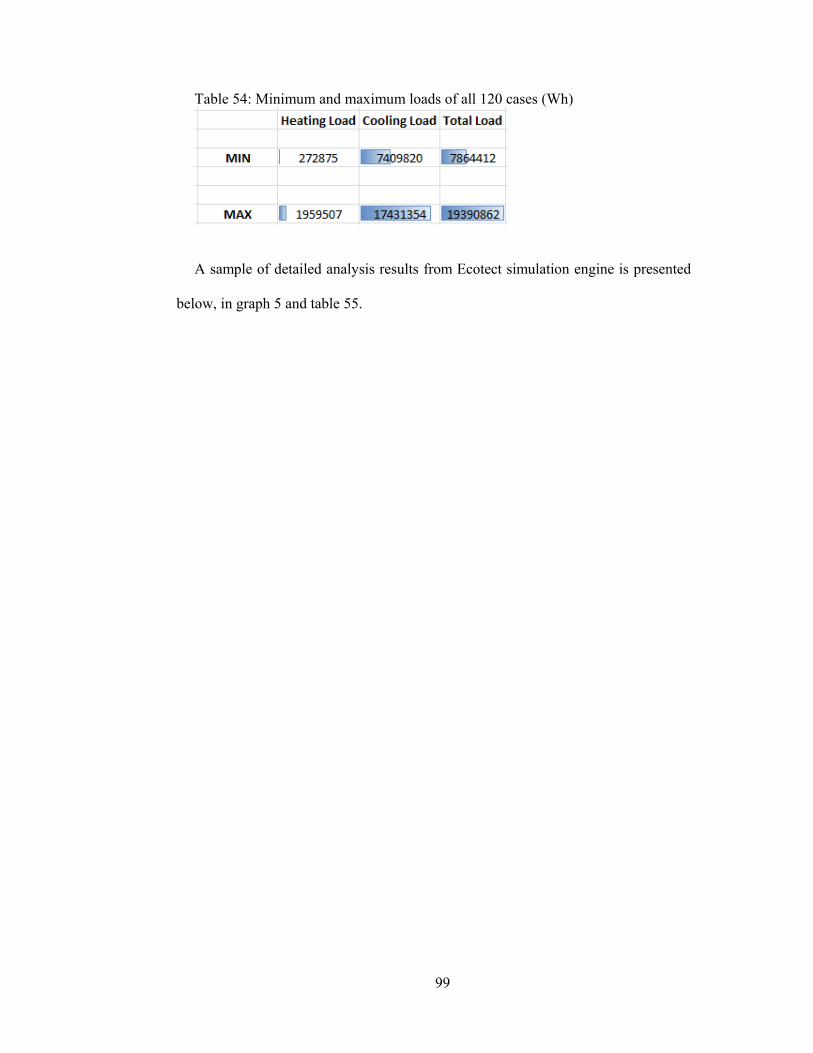
99
Table 54: Minimum and maximum loads of all 120 cases (Wh)
A sample of detailed analysis results from Ecotect simulation engine is presented
below, in graph 5 and table 55.

100
Graph 5: Monthly load demand for the best case, Ecotect (2011)
Table 55: Monthly load demand for the best case, Ecotect (2011)
MONTHLY HEATING/COOLING LOA
All Visible Thermal Zones
Comfort: Zonal Bands
Max Heating: 2939 W at 05:00 on 4th February
Max Cooling: 6400 W at 13:00 on 15th August
HEATING COOLING TOTAL
MONTH (Wh) (Wh) (Wh)
Jan 122024 0 122024
Feb 200300 0 200300
Mar 47135 0 47135
Apr 15399 105222 120620
May 0 429985 429985
Jun 0 1293165 1293165
Jul 0 1786999 1786999
Aug 0 1843707 1843707
Sep 0 1443000 1443000
Oct 0 493063 493063
Nov 2520 14678 17199
Dec 67215 0 67215
TOTAL 454593 7409820 7864412
PER M² 4059 66159 70218
Floor Area: 112.000 m2
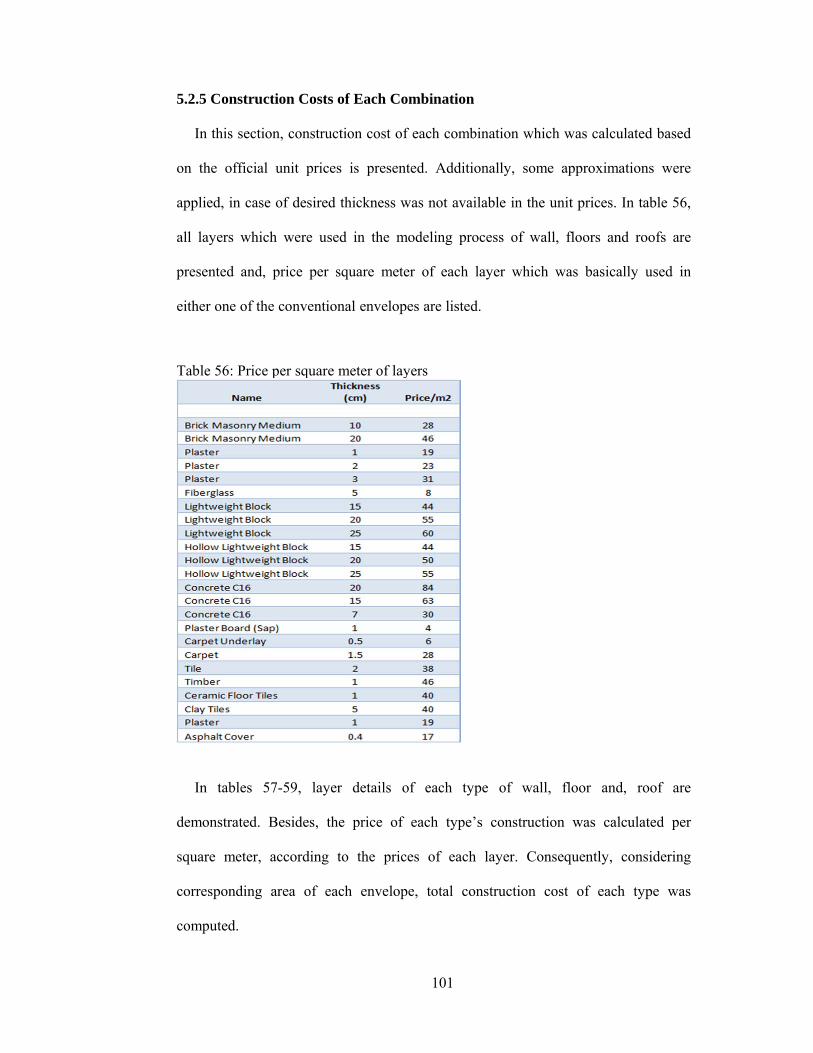
101
5.2.5 Construction Costs of Each Combination
In this section, construction cost of each combination which was calculated based
on the official unit prices is presented. Additionally, some approximations were
applied, in case of desired thickness was not available in the unit prices. In table 56,
all layers which were used in the modeling process of wall, floors and roofs are
presented and, price per square meter of each layer which was basically used in
either one of the conventional envelopes are listed.
Table 56: Price per square meter of layers
In tables 57-59, layer details of each type of wall, floor and, roof are
demonstrated. Besides, the price of each type’s construction was calculated per
square meter, according to the prices of each layer. Consequently, considering
corresponding area of each envelope, total construction cost of each type was
computed.
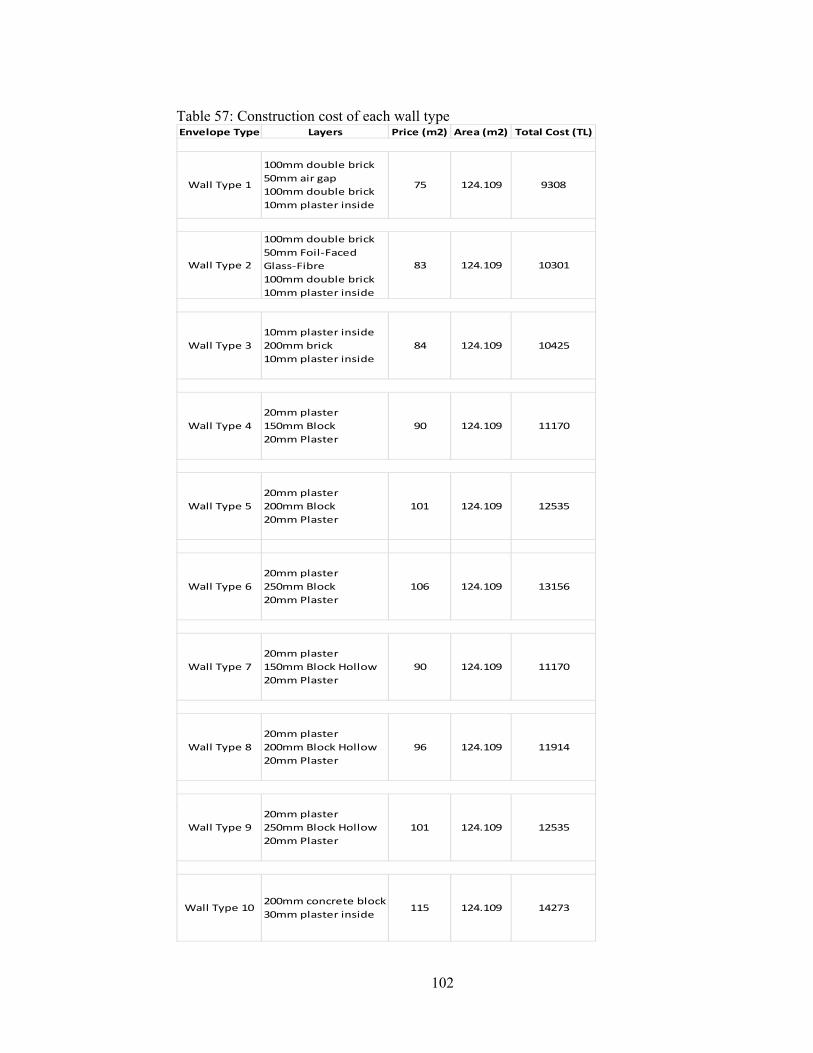
102
Table 57: Construction cost of each wall type
Envelope Type Layers Price (m2) Area (m2) Total Cost (TL)
124.109
124.109
124.109
124.109
124.109
124.109
124.109
124.109
124.109
Wall Type 4
20mm plaster
150mm Block
20mm Plaster
90 124.109 11170
83
100mm double brick
50mm Foil‐Faced
Glass‐Fibre
100mm double brick
10mm plaster inside
Wall Type 2
13156
11170
11914
12535
14273
9308
10301
10425
12535
Wall Type 9
20mm plaster
250mm Block Hollow
20mm Plaster
101
Wall Type 10200mm concrete block
30mm plaster inside115
Wall Type 7
20mm plaster
150mm Block Hollow
20mm Plaster
90
Wall Type 8
20mm plaster
200mm Block Hollow
20mm Plaster
96
Wall Type 5
20mm plaster
200mm Block
20mm Plaster
101
Wall Type 6
20mm plaster
250mm Block
20mm Plaster
106
Wall Type 3
10mm plaster inside
200mm brick
10mm plaster inside
84
100mm double brick
50mm air gap
100mm double brick
10mm plaster inside
Wall Type 1 75

103
Table 58: Construction cost of each floor type
Table 59: Construction cost of each roof type
Envelope Type Layers Price (m2) Area (m2) Total Cost (TL)
112
112
112
Floor Type 4
10mm Plaster Board
70mm Concrete
5mm Carpet Underlay
10mm Ceramic
95 112 10640
9296
10416
11312
Floor Type 2
10mm Plaster Board
70mm Concrete
5mm Carpet Underlay
20mm Tiles
93
Floor Type 3
10mm Plaster Board
70mm Concrete
5mm Carpet Underlay
10mm Timber
101
Floor Type 1
10mm Plaster Board
70mm Concrete
5mm CarpetUnderlay
15mm Carpet
83
Envelope Type Layers Price (m2) Area (m2) Total Cost (TL)
112
112
112
6608
11088
7840Roof Type 3
0.2mm
EthylVinylAcetate
2mm Tin
50mm air gap
12mm Gypsum
70
Roof Type 2
4mm AsphaltCover
150mm Concrete
10mm plaster inside
99
Roof Type 1
50mm Clay Tiles
75mm Air Gap
10mm Plaster inside
59

104
Cosnstruction cost of each 120 combinations combinations are then calculated and
listed in table 60.
Table 60: Construction cost of each combination
Minimum cases were identified step by step untill the best case - which presents
best thermal performance and least annual electricity consumption - is reached.
Totally, including the best case, 6 combinations were minimum, from the initial cost
Roof Type Wall Type Floor Type 1 Floor Type 2 Floor Type 3 Floor Type 4
Wall Type 1 25212 26332 27228 26556
Wall Type 2 26205 27325 28221 27549
Wall Type 3 26329 27449 28345 27673
Wall Type 4 27074 28194 29090 28418
Wall Type 5 28439 29559 30455 29783
Wall Type 6 29060 30180 31076 30404
Wall Type 7 27074 28194 29090 28418
Wall Type 8 27818 28938 29834 29162
Wall Type 9 28439 29559 30455 29783
Wall Type 10 30177 31297 32193 31521
Wall Type 1 29692 30812 31708 31036
Wall Type 2 30685 31805 32701 32029
Wall Type 3 30809 31929 32825 32153
Wall Type 4 31554 32674 33570 32898
Wall Type 5 32919 34039 34935 34263
Wall Type 6 33540 34660 35556 34884
Wall Type 7 31554 32674 33570 32898
Wall Type 8 32298 33418 34314 33642
Wall Type 9 32919 34039 34935 34263
Wall Type 10 34657 35777 36673 36001
Wall Type 1 26444 27564 28460 27788
Wall Type 2 27437 28557 29453 28781
Wall Type 3 27561 28681 29577 28905
Wall Type 4 28306 29426 30322 29650
Wall Type 5 29671 30791 31687 31015
Wall Type 6 30292 31412 32308 31636
Wall Type 7 28306 29426 30322 29650
Wall Type 8 29050 30170 31066 30394
Wall Type 9 29671 30791 31687 31015
Wall Type 10 31409 32529 33425 32753
Roof Typ
e 1Roof Typ
e 2Roof Typ
e 3
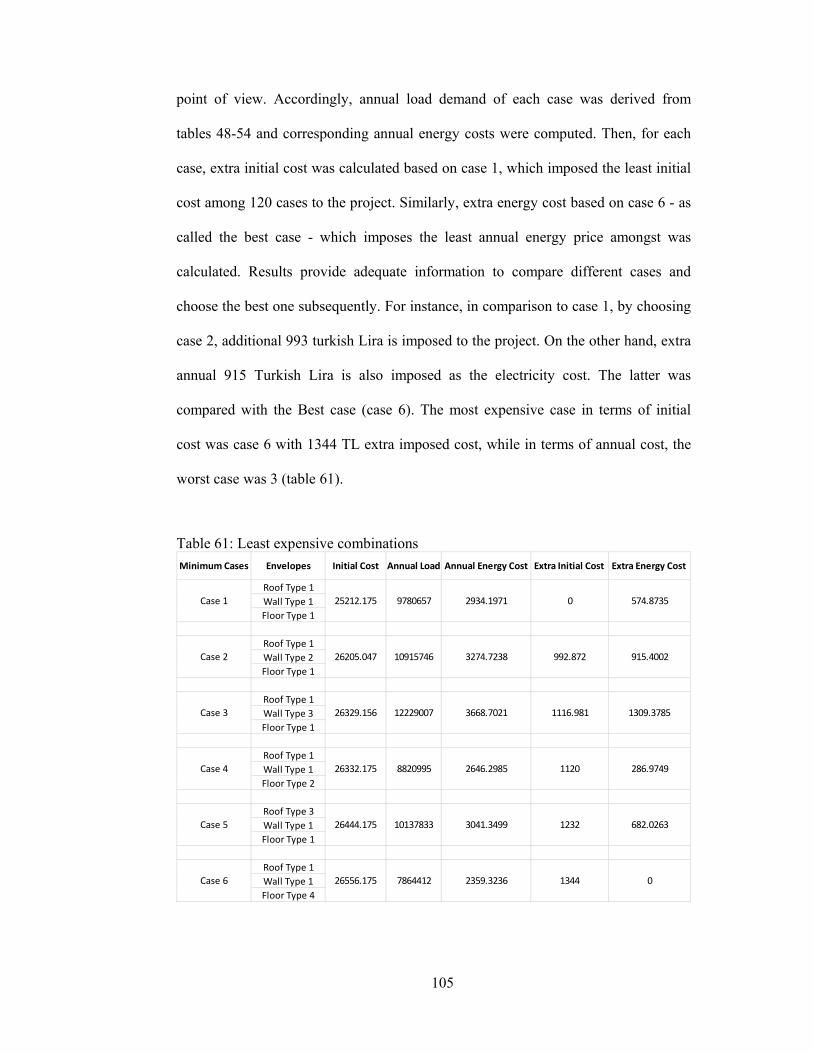
105
point of view. Accordingly, annual load demand of each case was derived from
tables 48-54 and corresponding annual energy costs were computed. Then, for each
case, extra initial cost was calculated based on case 1, which imposed the least initial
cost among 120 cases to the project. Similarly, extra energy cost based on case 6 - as
called the best case - which imposes the least annual energy price amongst was
calculated. Results provide adequate information to compare different cases and
choose the best one subsequently. For instance, in comparison to case 1, by choosing
case 2, additional 993 turkish Lira is imposed to the project. On the other hand, extra
annual 915 Turkish Lira is also imposed as the electricity cost. The latter was
compared with the Best case (case 6). The most expensive case in terms of initial
cost was case 6 with 1344 TL extra imposed cost, while in terms of annual cost, the
worst case was 3 (table 61).
Table 61: Least expensive combinations
Roof Type 1
Wall Type 1
Floor Type 1
Roof Type 1
Wall Type 2
Floor Type 1
Roof Type 1
Wall Type 3
Floor Type 1
Roof Type 1
Wall Type 1
Floor Type 2
Roof Type 3
Wall Type 1
Floor Type 1
Roof Type 1
Wall Type 1
Floor Type 4
Extra Initial Cost Extra Energy Cost Minimum Cases Envelopes Initial Cost Annual Load Annual Energy Cost
682.0263
26556.175 7864412 2359.3236 1344 0
1309.3785
26332.175 8820995 2646.2985 1120 286.9749
574.8735
26205.047 10915746 3274.7238 992.872 915.4002
Case 6
25212.175 9780657 2934.1971 0
26329.156 12229007 3668.7021 1116.981
26444.175 10137833 3041.3499 1232
Case 1
Case 2
Case 3
Case 4
Case 5
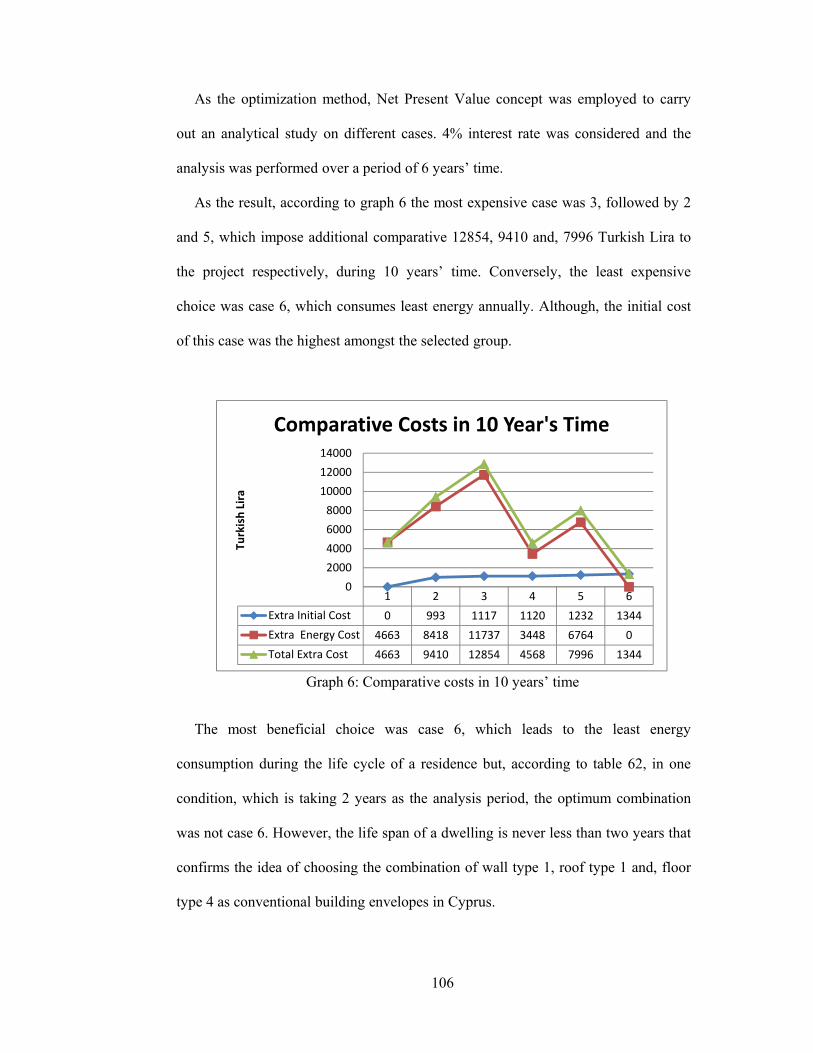
106
As the optimization method, Net Present Value concept was employed to carry
out an analytical study on different cases. 4% interest rate was considered and the
analysis was performed over a period of 6 years’ time.
As the result, according to graph 6 the most expensive case was 3, followed by 2
and 5, which impose additional comparative 12854, 9410 and, 7996 Turkish Lira to
the project respectively, during 10 years’ time. Conversely, the least expensive
choice was case 6, which consumes least energy annually. Although, the initial cost
of this case was the highest amongst the selected group.
Graph 6: Comparative costs in 10 years’ time
The most beneficial choice was case 6, which leads to the least energy
consumption during the life cycle of a residence but, according to table 62, in one
condition, which is taking 2 years as the analysis period, the optimum combination
was not case 6. However, the life span of a dwelling is never less than two years that
confirms the idea of choosing the combination of wall type 1, roof type 1 and, floor
type 4 as conventional building envelopes in Cyprus.
1 2 3 4 5 6
Extra Initial Cost 0 993 1117 1120 1232 1344
Extra Energy Cost 4663 8418 11737 3448 6764 0
Total Extra Cost 4663 9410 12854 4568 7996 1344
0
2000
4000
6000
8000
10000
12000
14000
Turkish Lira
Comparative Costs in 10 Year's Time
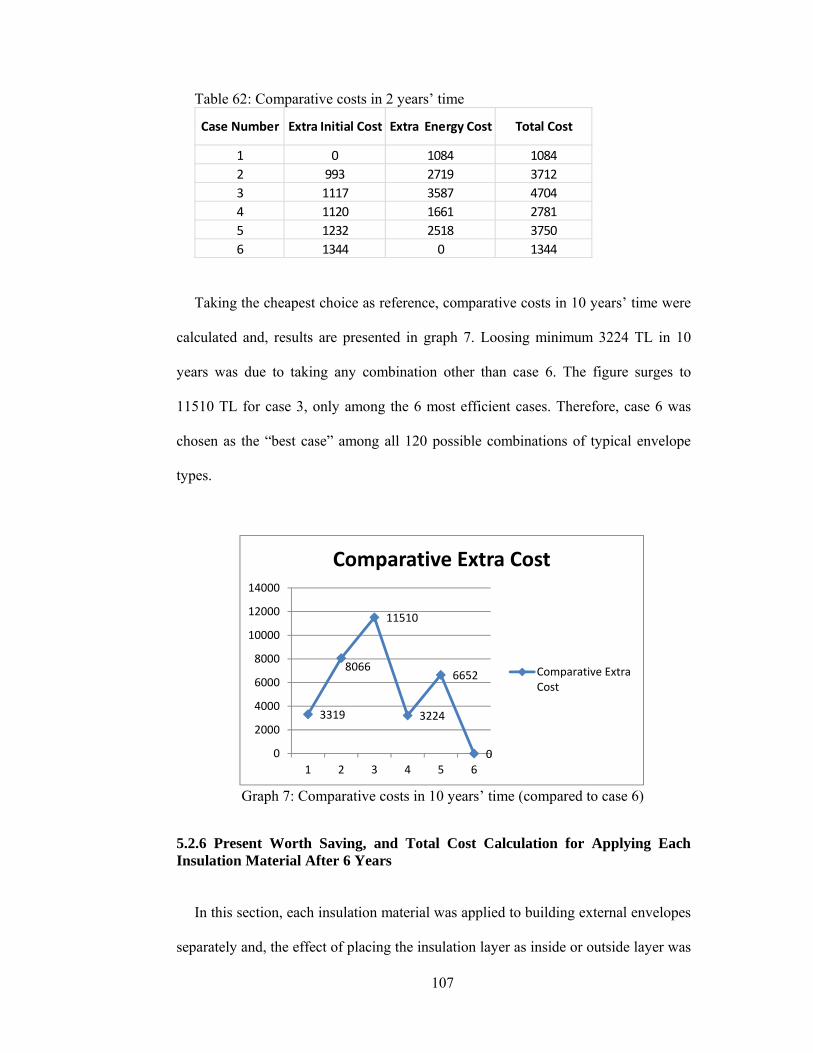
107
Table 62: Comparative costs in 2 years’ time
Taking the cheapest choice as reference, comparative costs in 10 years’ time were
calculated and, results are presented in graph 7. Loosing minimum 3224 TL in 10
years was due to taking any combination other than case 6. The figure surges to
11510 TL for case 3, only among the 6 most efficient cases. Therefore, case 6 was
chosen as the “best case” among all 120 possible combinations of typical envelope
types.
Graph 7: Comparative costs in 10 years’ time (compared to case 6)
5.2.6 Present Worth Saving, and Total Cost Calculation for Applying Each Insulation Material After 6 Years
In this section, each insulation material was applied to building external envelopes
separately and, the effect of placing the insulation layer as inside or outside layer was
1 0 1084 1084
2 993 2719 3712
3 1117 3587 4704
4 1120 1661 2781
5 1232 2518 3750
6 1344 0 1344
Extra Initial Cost Extra Energy Cost Total CostCase Number
3319
8066
11510
3224
6652
00
2000
4000
6000
8000
10000
12000
14000
1 2 3 4 5 6
Comparative Extra Cost
Comparative ExtraCost
108
also studied separately. Additionally, substitutes for windows and doors were
considered and, the annual energy consumption was computed in every stage.
Annual saving, as a result of applying all revisions was then calculated. Finally, the
net present value of every incremental change was compared with the extra
expenditure that caused by the corresponding alteration (tables 63-70). Best
insulation material, which leads to the most saving, was then proposed.
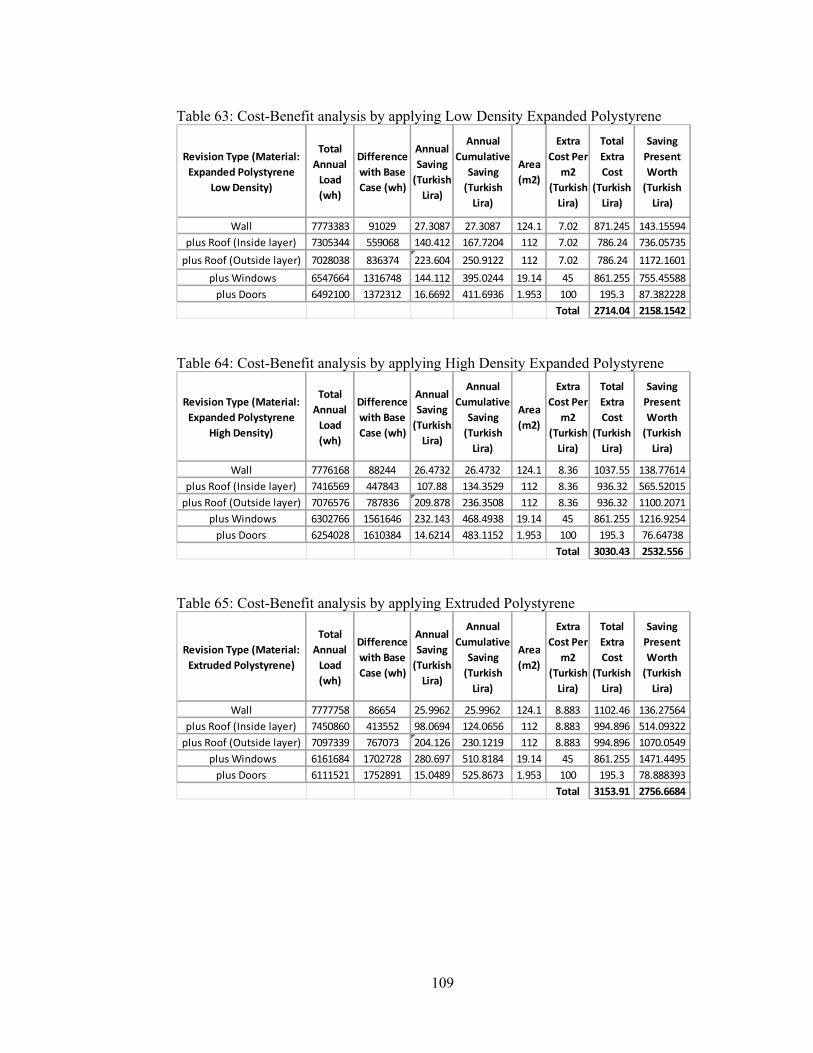
109
Table 63: Cost-Benefit analysis by applying Low Density Expanded Polystyrene
Table 64: Cost-Benefit analysis by applying High Density Expanded Polystyrene
Table 65: Cost-Benefit analysis by applying Extruded Polystyrene
Revision Type (Material:
Expanded Polystyrene
Low Density)
Total
Annual
Load
(wh)
Difference
with Base
Case (wh)
Annual
Saving
(Turkish
Lira)
Annual
Cumulative
Saving
(Turkish
Lira)
Area
(m2)
Extra
Cost Per
m2
(Turkish
Lira)
Total
Extra
Cost
(Turkish
Lira)
Saving
Present
Worth
(Turkish
Lira)
Wall 7773383 91029 27.3087 27.3087 124.1 7.02 871.245 143.15594
plus Roof (Inside layer) 7305344 559068 140.412 167.7204 112 7.02 786.24 736.05735
plus Roof (Outside layer) 7028038 836374 223.604 250.9122 112 7.02 786.24 1172.1601
plus Windows 6547664 1316748 144.112 395.0244 19.14 45 861.255 755.45588
plus Doors 6492100 1372312 16.6692 411.6936 1.953 100 195.3 87.382228
Total 2714.04 2158.1542
Revision Type (Material:
Expanded Polystyrene
High Density)
Total
Annual
Load
(wh)
Difference
with Base
Case (wh)
Annual
Saving
(Turkish
Lira)
Annual
Cumulative
Saving
(Turkish
Lira)
Area
(m2)
Extra
Cost Per
m2
(Turkish
Lira)
Total
Extra
Cost
(Turkish
Lira)
Saving
Present
Worth
(Turkish
Lira)
Wall 7776168 88244 26.4732 26.4732 124.1 8.36 1037.55 138.77614
plus Roof (Inside layer) 7416569 447843 107.88 134.3529 112 8.36 936.32 565.52015
plus Roof (Outside layer) 7076576 787836 209.878 236.3508 112 8.36 936.32 1100.2071
plus Windows 6302766 1561646 232.143 468.4938 19.14 45 861.255 1216.9254
plus Doors 6254028 1610384 14.6214 483.1152 1.953 100 195.3 76.64738
Total 3030.43 2532.556
Revision Type (Material:
Extruded Polystyrene)
Total
Annual
Load
(wh)
Difference
with Base
Case (wh)
Annual
Saving
(Turkish
Lira)
Annual
Cumulative
Saving
(Turkish
Lira)
Area
(m2)
Extra
Cost Per
m2
(Turkish
Lira)
Total
Extra
Cost
(Turkish
Lira)
Saving
Present
Worth
(Turkish
Lira)
Wall 7777758 86654 25.9962 25.9962 124.1 8.883 1102.46 136.27564
plus Roof (Inside layer) 7450860 413552 98.0694 124.0656 112 8.883 994.896 514.09322
plus Roof (Outside layer) 7097339 767073 204.126 230.1219 112 8.883 994.896 1070.0549
plus Windows 6161684 1702728 280.697 510.8184 19.14 45 861.255 1471.4495
plus Doors 6111521 1752891 15.0489 525.8673 1.953 100 195.3 78.888393
Total 3153.91 2756.6684
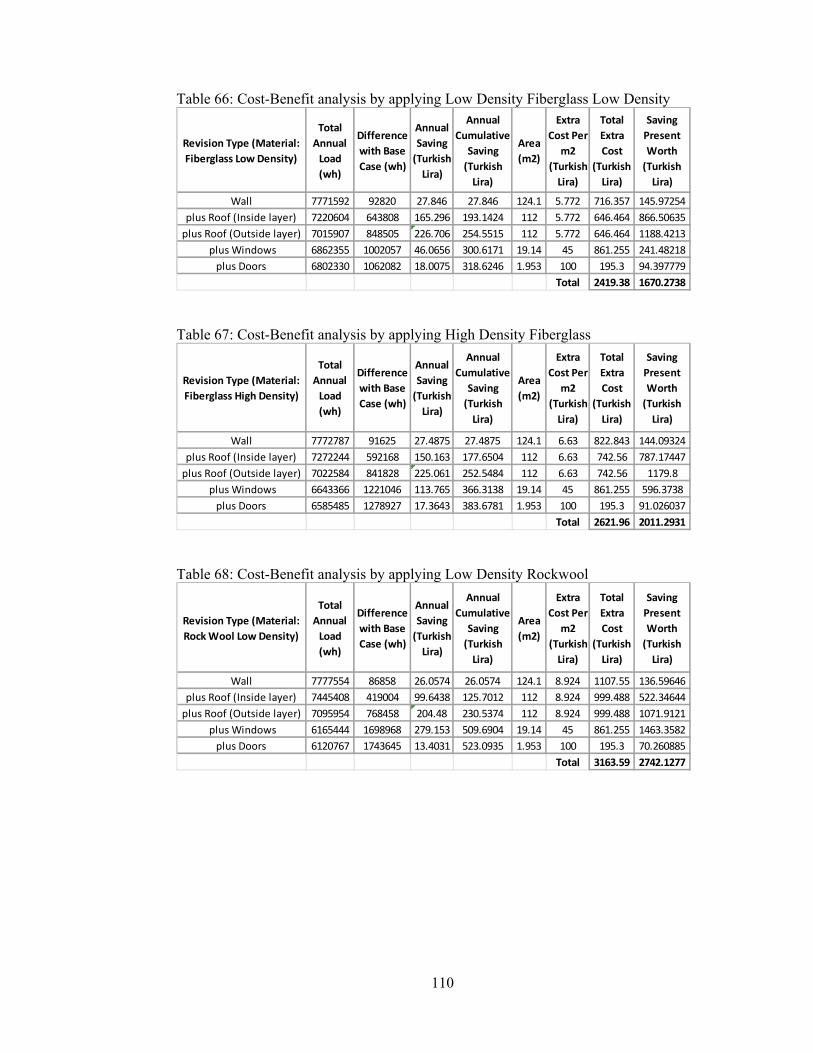
110
Table 66: Cost-Benefit analysis by applying Low Density Fiberglass Low Density
Table 67: Cost-Benefit analysis by applying High Density Fiberglass
Table 68: Cost-Benefit analysis by applying Low Density Rockwool
Revision Type (Material:
Fiberglass Low Density)
Total
Annual
Load
(wh)
Difference
with Base
Case (wh)
Annual
Saving
(Turkish
Lira)
Annual
Cumulative
Saving
(Turkish
Lira)
Area
(m2)
Extra
Cost Per
m2
(Turkish
Lira)
Total
Extra
Cost
(Turkish
Lira)
Saving
Present
Worth
(Turkish
Lira)
Wall 7771592 92820 27.846 27.846 124.1 5.772 716.357 145.97254
plus Roof (Inside layer) 7220604 643808 165.296 193.1424 112 5.772 646.464 866.50635
plus Roof (Outside layer) 7015907 848505 226.706 254.5515 112 5.772 646.464 1188.4213
plus Windows 6862355 1002057 46.0656 300.6171 19.14 45 861.255 241.48218
plus Doors 6802330 1062082 18.0075 318.6246 1.953 100 195.3 94.397779
Total 2419.38 1670.2738
Revision Type (Material:
Fiberglass High Density)
Total
Annual
Load
(wh)
Difference
with Base
Case (wh)
Annual
Saving
(Turkish
Lira)
Annual
Cumulative
Saving
(Turkish
Lira)
Area
(m2)
Extra
Cost Per
m2
(Turkish
Lira)
Total
Extra
Cost
(Turkish
Lira)
Saving
Present
Worth
(Turkish
Lira)
Wall 7772787 91625 27.4875 27.4875 124.1 6.63 822.843 144.09324
plus Roof (Inside layer) 7272244 592168 150.163 177.6504 112 6.63 742.56 787.17447
plus Roof (Outside layer) 7022584 841828 225.061 252.5484 112 6.63 742.56 1179.8
plus Windows 6643366 1221046 113.765 366.3138 19.14 45 861.255 596.3738
plus Doors 6585485 1278927 17.3643 383.6781 1.953 100 195.3 91.026037
Total 2621.96 2011.2931
Revision Type (Material:
Rock Wool Low Density)
Total
Annual
Load
(wh)
Difference
with Base
Case (wh)
Annual
Saving
(Turkish
Lira)
Annual
Cumulative
Saving
(Turkish
Lira)
Area
(m2)
Extra
Cost Per
m2
(Turkish
Lira)
Total
Extra
Cost
(Turkish
Lira)
Saving
Present
Worth
(Turkish
Lira)
Wall 7777554 86858 26.0574 26.0574 124.1 8.924 1107.55 136.59646
plus Roof (Inside layer) 7445408 419004 99.6438 125.7012 112 8.924 999.488 522.34644
plus Roof (Outside layer) 7095954 768458 204.48 230.5374 112 8.924 999.488 1071.9121
plus Windows 6165444 1698968 279.153 509.6904 19.14 45 861.255 1463.3582
plus Doors 6120767 1743645 13.4031 523.0935 1.953 100 195.3 70.260885
Total 3163.59 2742.1277

111
Table 69: Cost-Benefit analysis by applying High Density Rockwool
Table 70: Cost-Benefit analysis by applying Perlite
All revision types were applied together finally but, the application of insulation
layer to roof, was done either as the inside layer or, as the outside layer. Hence, the
calculation of total costs and benefits must be based on one of them. Since the energy
consumption was comparatively low in case of the outside layer, figures
corresponding to the inside layer case were not considered in the calculations. For
instance, in table 69, saving’s present worth is 339TL for applying the insulation
layer as the inside layer of the roof, while the figure for outside is 965TL.
Considering 6 years as the analysis period in the calculations, demonstrated that
the application of high density Rockwool and perlite leads to a positive annual saving
of 95 and 351 Turkish Lira respectively (graph 8).
Revision Type (Material:
Rock Wool High Density)
Total
Annual
Load
(wh)
Difference
with Base
Case (wh)
Annual
Saving
(Turkish
Lira)
Annual
Cumulative
Saving
(Turkish
Lira)
Area
(m2)
Extra
Cost Per
m2
(Turkish
Lira)
Total
Extra
Cost
(Turkish
Lira)
Saving
Present
Worth
(Turkish
Lira)
Wall 7785526 78886 23.6658 23.6658 124.1 8.864 1100.1 124.05936
plus Roof (Inside layer) 7569764 294648 64.7286 88.3944 112 8.864 992.768 339.31618
plus Roof (Outside layer) 7171870 692542 184.097 207.7626 112 8.864 992.768 965.06062
plus Windows 5847205 2017207 397.4 605.1621 19.14 45 861.255 2083.2226
plus Doors 5801244 2063168 13.7883 618.9504 1.953 100 195.3 72.280156
Total 3149.43 3244.6227
Revision Type (Material:
Perlite)
Total
Annual
Load
(wh)
Difference
with Base
Case (wh)
Annual
Saving
(Turkish
Lira)
Annual
Cumulative
Saving
(Turkish
Lira)
Area
(m2)
Extra
Cost Per
m2
(Turkish
Lira)
Total
Extra
Cost
(Turkish
Lira)
Saving
Present
Worth
(Turkish
Lira)
Wall 7767820 96592 28.9776 28.9776 124.1 2.3688 293.989 151.90454
plus Roof (Inside layer) 7040781 823631 218.112 247.0893 112 2.3688 265.306 1143.3714
plus Roof (Outside layer) 6995720 868692 231.63 260.6076 112 2.3688 265.306 1214.2362
plus Windows 6686386 1178026 92.8002 353.4078 19.14 45 861.255 486.47135
plus Doors 6613798 1250614 21.7764 375.1842 1.953 100 195.3 114.15487
Total 1615.85 1966.7669

112
Graph 8: Saving of each material in 6 years’ time
On the other hand, the optimum thicknesses for the aforementioned materials
were totally different (1.6 and 28 centimeter respectively). Besides, perlite comes
with a very low density and it is not available in sheets. Therefore, two barrier layers
must be set and the material is poured in between, which is not applicable to walls
and roofs. Consequently, however using perlite increases the annual saving
dramatically; it was eliminated from available options. So, high density Rockwool
was chosen as the best thermal insulation material in Cyprus, the optimum thickness
is 1.6 centimeters and it should be applied as the outside layer of roof.
5.2.7 Present Worth Saving, and Total Cost Calculation for Taking Separate Measures After 30 Years
The saving as a result of applying 1.6cm high density Rockwool to wall, inside
and outside layer of roof, substituting doors and windows are presented in graph 9.
The expenditure for wall insulation does not pay back even after 30 years and the
trend seems to be the same until the project’s lifetime is thorough so, it is more
beneficial to eliminate the extra imposed initial cost of wall insulation. Besides,
substituting doors seems not to be a logical option since it commences to give
‐749.1
‐610.7 ‐555.9‐497.9
‐421.5
‐397.2
95.2
350.9
‐1000.0
‐800.0
‐600.0
‐400.0
‐200.0
0.0
200.0
400.0
600.0
F LD F HD EPS LD EPS HD R LD EXP R HD PL
Saving after 6 years
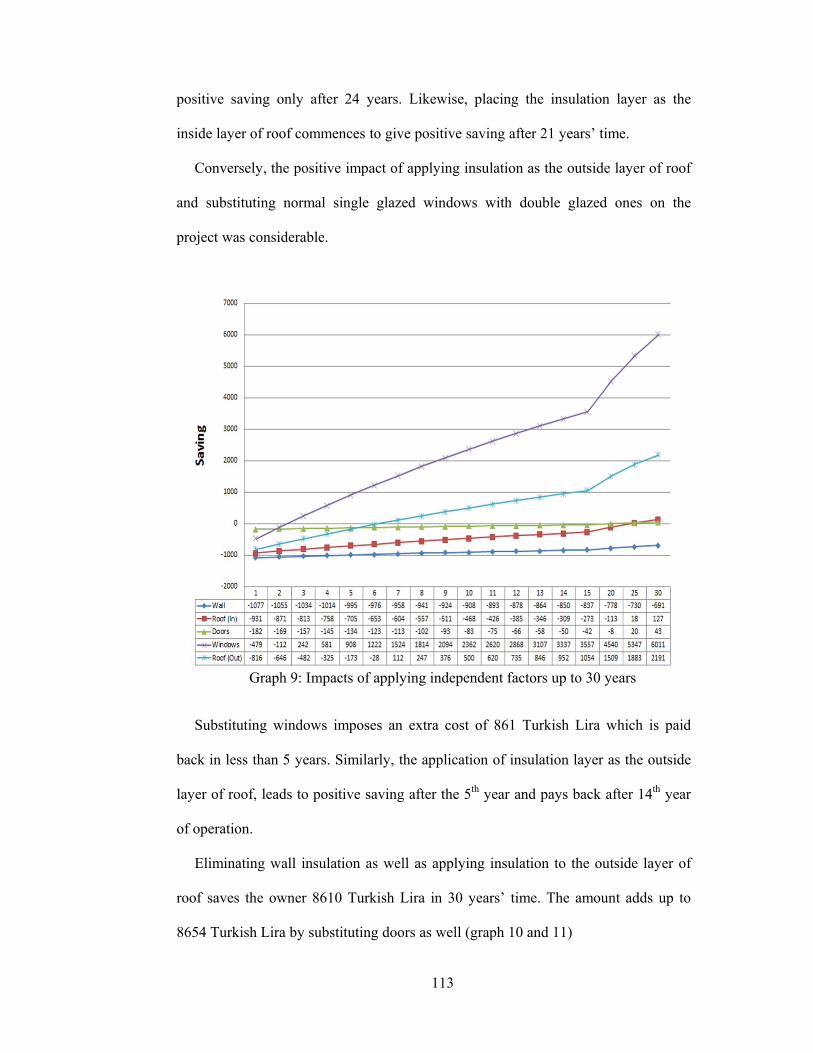
113
positive saving only after 24 years. Likewise, placing the insulation layer as the
inside layer of roof commences to give positive saving after 21 years’ time.
Conversely, the positive impact of applying insulation as the outside layer of roof
and substituting normal single glazed windows with double glazed ones on the
project was considerable.
Graph 9: Impacts of applying independent factors up to 30 years
Substituting windows imposes an extra cost of 861 Turkish Lira which is paid
back in less than 5 years. Similarly, the application of insulation layer as the outside
layer of roof, leads to positive saving after the 5th year and pays back after 14th year
of operation.
Eliminating wall insulation as well as applying insulation to the outside layer of
roof saves the owner 8610 Turkish Lira in 30 years’ time. The amount adds up to
8654 Turkish Lira by substituting doors as well (graph 10 and 11)

114
The investment on enhancing building’s performance, by insulating roof and
replacing windows with double glazed windows, which undoubtedly improves
thermal performance of the house, imposes less than 1900 Turkish Lira extra
investment cost, which leads to positive saving after the third year that adds up to
343 TL in forth year and accumulates to more than 8500 TL saving in 30 years’ time
(graph 10).
Graph 10: Saving by roof insulation and windows substitution
The investment on enhancing building’s performance, by insulating roof and
replacing windows with double glazed windows, which undoubtedly improves
thermal performance of the house and, substituting doors with quality ones, imposes
less than 2100 Turkish Lira extra investment cost which leads to positive saving after
the third year that adds up to 197 TL in forth year and accumulates to more than
8654 TL saving in 30 years’ time (graph 11).
‐1272‐713‐175
3438401318177822202646305434473825418945384874
63707600
8610
‐5000 0 5000 10000
1
3
5
7
9
11
13
15
25
Roof (Outside) + Windows
Roof (Outside) +Windows

115
Graph 11: Saving by roof insulation, windows and doors substitution
5.2.8 Investment Prioritizing
According to the imposed costs of each factor as well as the corresponding annual
savings, in case of limited budget, the investment could be prioritized. Three factors
which contribute to saving, taking 30 years as the analysis period were figured out.
Independent savings are demonstrated in graph 12:
‐1454‐882‐332
1977061195166621182553297133733760413144894832
63627620
8654
‐2000 0 2000 4000 6000 8000 10000
1
3
5
7
9
11
13
15
25
Roof (Outside) + Windows +Door
Roof (Outside) +Windows +Door

116
Graph 12: Independent saving of each factor
Based on results, in case of limited budget, it is suggested to invest on windows,
insulating roofs with 1.6cm high density Rockwool from outside and substituting
doors, respectively.
5.2.9 Sensitivity Analysis
All calculations are carried out based on the current prices and rates. Hence,
results are reliable unless the aforesaid factors are altered. Electricity tariff, interest
rate and material prices for instance, are main factors which influence the costs and
benefits of the project during its life time.
The sensitivity analysis was done regarding a span of 1 to10 years of analysis
period. Obviously, the life span of a residence is quite longer than 10 years but,
according to results after 10 years’ time, projects leads to more saving and the
situation is not critical as the analytical investigation is not required.
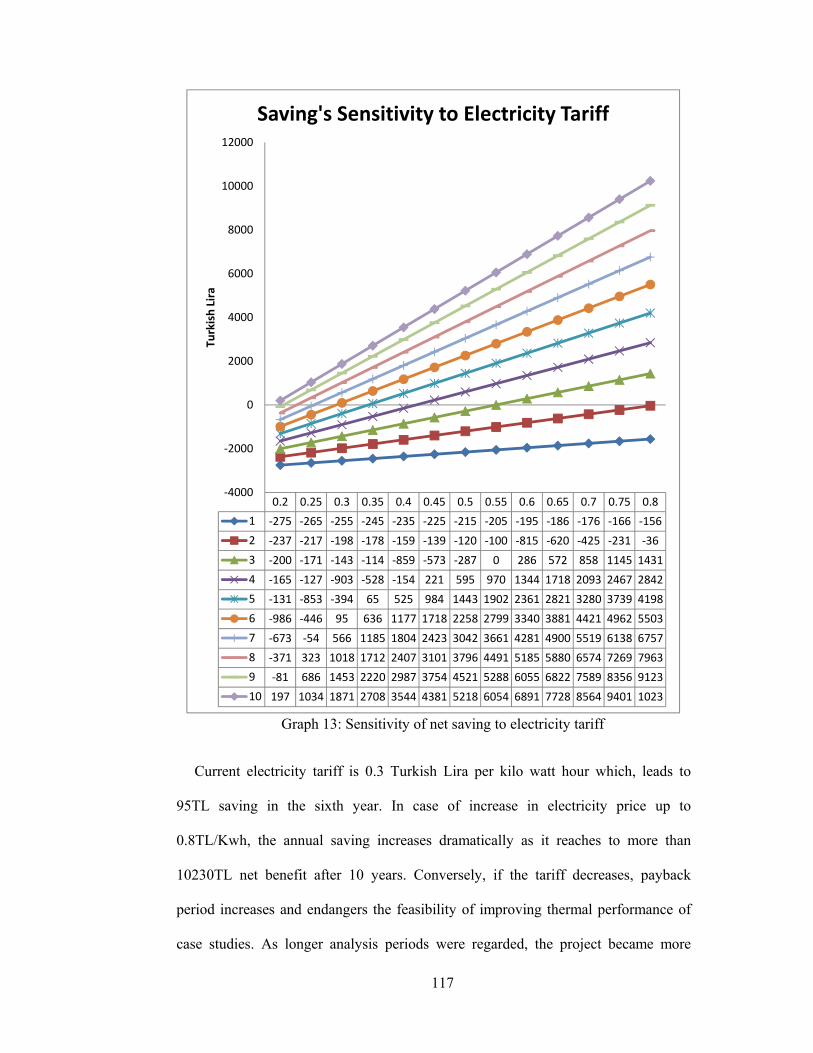
117
Graph 13: Sensitivity of net saving to electricity tariff
Current electricity tariff is 0.3 Turkish Lira per kilo watt hour which, leads to
95TL saving in the sixth year. In case of increase in electricity price up to
0.8TL/Kwh, the annual saving increases dramatically as it reaches to more than
10230TL net benefit after 10 years. Conversely, if the tariff decreases, payback
period increases and endangers the feasibility of improving thermal performance of
case studies. As longer analysis periods were regarded, the project became more
0.2 0.25 0.3 0.35 0.4 0.45 0.5 0.55 0.6 0.65 0.7 0.75 0.8
1 ‐275 ‐265 ‐255 ‐245 ‐235 ‐225 ‐215 ‐205 ‐195 ‐186 ‐176 ‐166 ‐156
2 ‐237 ‐217 ‐198 ‐178 ‐159 ‐139 ‐120 ‐100 ‐815 ‐620 ‐425 ‐231 ‐36
3 ‐200 ‐171 ‐143 ‐114 ‐859 ‐573 ‐287 0 286 572 858 1145 1431
4 ‐165 ‐127 ‐903 ‐528 ‐154 221 595 970 1344 1718 2093 2467 2842
5 ‐131 ‐853 ‐394 65 525 984 1443 1902 2361 2821 3280 3739 4198
6 ‐986 ‐446 95 636 1177 1718 2258 2799 3340 3881 4421 4962 5503
7 ‐673 ‐54 566 1185 1804 2423 3042 3661 4281 4900 5519 6138 6757
8 ‐371 323 1018 1712 2407 3101 3796 4491 5185 5880 6574 7269 7963
9 ‐81 686 1453 2220 2987 3754 4521 5288 6055 6822 7589 8356 9123
10 197 1034 1871 2708 3544 4381 5218 6054 6891 7728 8564 9401 1023
‐4000
‐2000
0
2000
4000
6000
8000
10000
12000
Turkish Lira
Saving's Sensitivity to Electricity Tariff

118
beneficial. For instance, for 10 years’ time, no matter how much is the electricity
price, it leads to positive net present value. Conversely, if the period is considered 1
or 2 years, regardless of the electricity price, NPV is negative according to which the
project is not feasible at all (graph 13).
Graph 14: Sensitivity of net saving to interest rate
According to graph 14, the effect of increasing interest rate on the net saving as a
result of enhancing the quality of thermal performance in dwellings seems to be
negative. For instance, if the interest rate is raised to more than 0.50, the extra initial
costs are not paid back by the sixth year. Although, as the life span of a residence is
always considered much longer than 6 years, alteration of such type still seems to be
0.020 0.025 0.030 0.035 0.040 0.045 0.050 0.055 0.060
1 ‐2543 ‐2546 ‐2549 ‐2551 ‐2554 ‐2557 ‐2560 ‐2563 ‐2566
2 ‐1948 ‐1956 ‐1965 ‐1974 ‐1982 ‐1990 ‐1999 ‐2007 ‐2015
3 ‐1364 ‐1382 ‐1399 ‐1415 ‐1432 ‐1448 ‐1464 ‐1480 ‐1495
4 ‐793 ‐821 ‐849 ‐876 ‐903 ‐929 ‐955 ‐980 ‐1005
5 ‐232 ‐274 ‐315 ‐355 ‐394 ‐432 ‐470 ‐506 ‐542
6 318 260 204 149 95 43 ‐8 ‐57 ‐106
7 856 781 707 635 566 498 432 368 306
8 1385 1289 1195 1105 1018 933 851 771 694
9 1903 1784 1670 1559 1453 1350 1250 1154 1060
10 2410 2268 2130 1998 1871 1748 1630 1516 1406
‐3000
‐2000
‐1000
0
1000
2000
3000
Turkish Lira
Saving's Sensitivity to Interest Rate
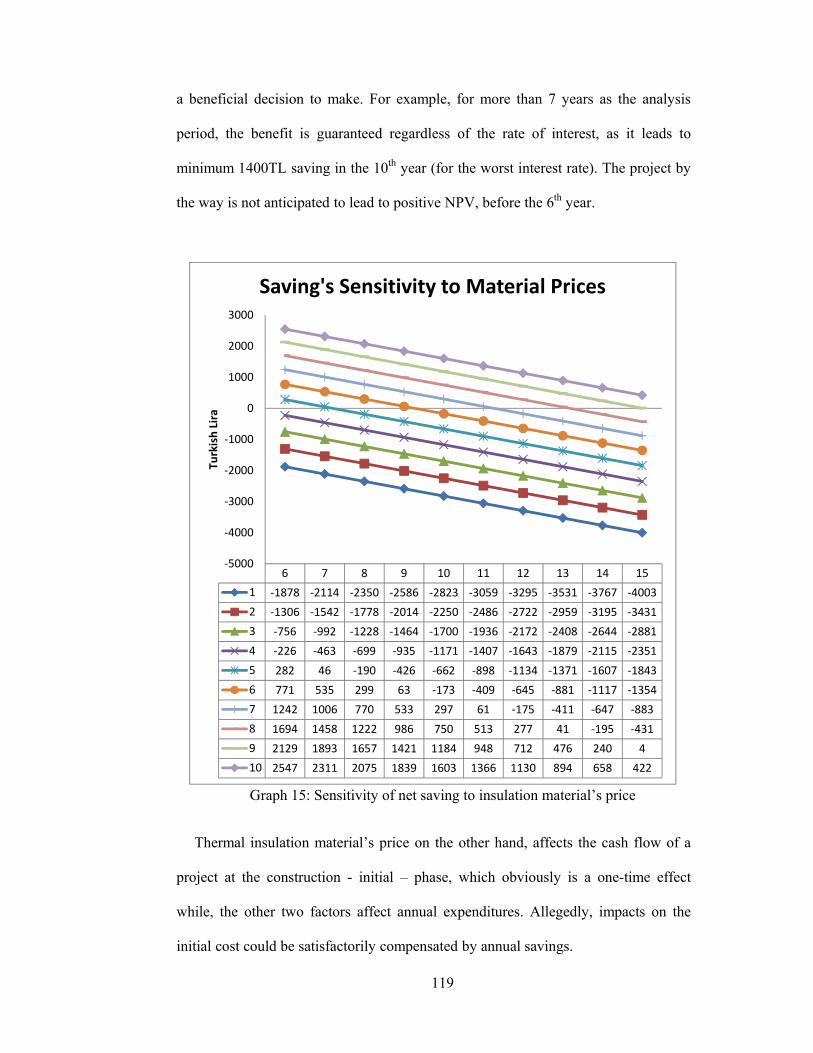
119
a beneficial decision to make. For example, for more than 7 years as the analysis
period, the benefit is guaranteed regardless of the rate of interest, as it leads to
minimum 1400TL saving in the 10th year (for the worst interest rate). The project by
the way is not anticipated to lead to positive NPV, before the 6th year.
Graph 15: Sensitivity of net saving to insulation material’s price
Thermal insulation material’s price on the other hand, affects the cash flow of a
project at the construction - initial – phase, which obviously is a one-time effect
while, the other two factors affect annual expenditures. Allegedly, impacts on the
initial cost could be satisfactorily compensated by annual savings.
6 7 8 9 10 11 12 13 14 15
1 ‐1878 ‐2114 ‐2350 ‐2586 ‐2823 ‐3059 ‐3295 ‐3531 ‐3767 ‐4003
2 ‐1306 ‐1542 ‐1778 ‐2014 ‐2250 ‐2486 ‐2722 ‐2959 ‐3195 ‐3431
3 ‐756 ‐992 ‐1228 ‐1464 ‐1700 ‐1936 ‐2172 ‐2408 ‐2644 ‐2881
4 ‐226 ‐463 ‐699 ‐935 ‐1171 ‐1407 ‐1643 ‐1879 ‐2115 ‐2351
5 282 46 ‐190 ‐426 ‐662 ‐898 ‐1134 ‐1371 ‐1607 ‐1843
6 771 535 299 63 ‐173 ‐409 ‐645 ‐881 ‐1117 ‐1354
7 1242 1006 770 533 297 61 ‐175 ‐411 ‐647 ‐883
8 1694 1458 1222 986 750 513 277 41 ‐195 ‐431
9 2129 1893 1657 1421 1184 948 712 476 240 4
10 2547 2311 2075 1839 1603 1366 1130 894 658 422
‐5000
‐4000
‐3000
‐2000
‐1000
0
1000
2000
3000
Turkish Lira
Saving's Sensitivity to Material Prices

120
The price of the insulation material - high density Rockwool - that had been
identified as the most beneficial thermal insulation material for Cyprus had
considerable effect on net saving of the project. If the price is increased to 15 Turkish
Lira per square meter, instead of a benefit of 95TL in the sixth year, 1354TL cost
should be tolerated. It is not to say that, the payback period is comparatively longer
in this case. Similar to the findings of other two sensitivity analysis, after 10 years’
time, positive NPV is guaranteed regardless of insulation material’s cost. Actually, it
leads to minimum 4 and 422 Turkish Lira in the 9th and 10th year respectively (in
case of 15TL per square meter). Additionally, the project is not feasible for less than
four years of analysis period (graph 15).
5.2.10 Thermal Comfort Comparison
Thermal comfort figures of the best case - modeled based on conventional
construction materials - was compared with the optimum case (table 71).
Thermal comfort calculations were performed by Ecotect software according to
degree hour concept and the percentage of time that the temperature of thermal zone
was outside the comfort range.

121
Table 71: Thermal comfort comparison (%)
Base on the results, comparing 806% discomfort time to 765% for insulated case,
improving thermal performance of residences led to noticeable rise in total comfort
hours during which, without using air conditioner systems, inhabitants experience
comfortable inside temperature in houses.
Besides, it seems that insulation increases thermal comfort in hot seasons
significantly, which is due to the high Cyprus’ summer temperature in July, August
as September.
To conclude from this section, not only enhancing building thermal performance
leads to a surge in monetary benefits, but also non-monetary benefits are achieved.
5.2.11 Airtightness Effect
The effect of increasing air change per hour which is a representative of low
quality construction implementation was studied on the total load demand of the
optimum case in a range of 0.5 to 2.5 ACH and results are demonstrated in the graph
16.
MONTH TOO HOT TOO COOL TOTAL TOO HOT TOO COOL TOTAL
Jan 0 98.79 98.79 0 85.22 85.22
Feb 0 92.41 92.41 0 71.43 71.43
Mar 0 90.32 90.32 0 60.22 60.22
Apr 3.47 24.58 28.06 9.58 10 19.58
May 11.96 0 11.96 34.27 0 34.27
Jun 74.72 0 74.72 91.25 0 91.25
Jul 100 0 100 100 0 100
Aug 100 0 100 100 0 100
Sep 96.67 0 96.67 100 0 100
Oct 17.61 0 17.61 43.15 0 43.15
Nov 0 18.33 18.33 4.58 1.67 6.25
Dec 0 77.02 77.02 0 53.76 53.76
TOTAL 404.4 401.5 805.9 482.8 282.3 765.1
InsulatedUninsulated

122
Graph 16: ACH Rate effect on annual energy consumption
Undoubtedly, total energy consumption increases dramatically as the result of
leaky construction. Up to 2300 kWh increase in electricity consumption was
observed as the ACH rate was increased to 2.5. This imposes up to 700 Turkish lira
extra annual expenditure to the project (graph 17).
Graph 17: ACH Rate effect on annual expenditures
In comparison with 618 TL saving as the result of applying insulation as well as
substituting windows and doors, the impact of poor construction implementation
which imposes 700 TL annual expenditures can obviously overcome the desired
5801
6800
8477
10499
12832
9991677
2022 2333
0
2000
4000
6000
8000
10000
12000
14000
0.5 1 1.5 2 2.5
Total Load
Difference
0
299.7
503.1
606.6
699.9
0
100
200
300
400
500
600
700
800
0.5 1 1.5 2 2.5
Difference in TL
Difference in TL

123
savings. Consequently the importance of quality assurance in construction
implementation and the significance of providing as less ACH rate as possible in
residences were highlighted. Least ACH rate possible for residences should be 0.5
ACH according to ASHRAE standards, which was regarded in the whole modeling
process for every case.
5.2.12 Effect of Increasing Glazing Area
The impact of enlarging the glazing area of the optimum case, from 20% to 40
and 60%, on the annual electricity consumption was investigated.
Graph 18: Effect of enlarging glazing area on the annual energy consumption
Expectedly, as the glazing area was enlarged, total annual energy consumption
was increased. The trend is similar for heating and cooling load (graph 18) however,
the impact on the cooling load is comparatively higher than the heating load.
Heating Cooling Total
20% 81 5721 5801
40% 205 8348 8553
60% 554 9665 10219
Best Uninsulated 455 7410 7864
0
2000
4000
6000
8000
10000
12000
KWh
Anual Load Demand

124
Besides, the rise in load demand as the result of increasing windows area from 20 to
40% is higher than 40 to 60% increase.
Results of this study highlights the noticeable effect of glazing area on total load
demand of residences in Cyprus, as 20% increase in the glazing area leads to such a
surge in electricity usage that overcomes expected savings by applying insulation and
double glazing windows.
Consequently, it is suggested that the glazing area is minimized as much as
possible, in order to develop the most energy efficient building design.
In graph 19, differences of each case from the best case – uninsulated, normal
windows - are presented.
Graph 19: Difference from the best uninsulated case
‐374‐1689
‐2063
‐250
938
689100
22552355
‐2500
‐2000
‐1500
‐1000
‐500
0
500
1000
1500
2000
2500
3000
Heating Cooling Total
20%
40%
60%

125
Chapter 6
CONCLUSIONS AND RECOMMENDATIONS
6.1 Conclusions
This research aimed at identifying measures taking which, higher security and
living standards are achieved by minimizing the annual heating and cooling load
demand of residential buildings in Cyprus. Furthermore, the impact of several factors
such as the analysis period, interest rate, insulation material prices, airtightness and
increasing glazing area on the effect of aforesaid measures was also studied.
Accordingly, an approximately 110 square meters residence, as a representative of
typical single family house in Cyprus was modeled with Autodesk Revit and
exported to Autodesk Ecotect to perform thermal performance modeling.
Consequently, it was established that the proper choice of conventional envelopes,
reduces the annual load demand significantly. Constructing the house with the
combination of floor type 4, roof type 1 and wall type 1 saved 11526kWh, in
comparison with the combination of floor type 1, roof type 2 and wall type 7.
Besides, from the initial cost point of view, the best combination was floor type 1,
roof type 1 and wall type 1. However, taking more than 2 years as the analysis
period, the choice remained the same since annual savings was compensated for the
extra initial expenditure.
Subsequently, in order to amend thermal performance of the best combination,
most beneficial measure with respect to their payback period is listed below:

126
1- To replace normal single-glazed windows with double glazed aluminum frame
ones which payback period was less than 3 years with 242TL saving at the end of the
third year.
2- To insulate the roof from outside, with 1.6 centimeter high density Rockwool
which payback period was less than 7 years with 112TL saving at the end of the
seventh year.
3- Substituting normal doors with solid core doors that present higher thermal
performance which payback period was roughly 22 years with 20TL saving at the
end of the twenty fifth years.
Undoubtedly, taking all the aforementioned measures maximizes the saving in
long term to 8654TL at the end of thirtieth year but, in case of shorter analysis period
or limited budget, a selective option would be preferred.
Besides, the sensitivity analysis divulged the intense dependency of net saving as
the result of improving thermal performance of dwellings, on the interest rate,
material price and electricity tariff changes. If the price of high density Rockwool
was surged to 15TL/M2, payback period was increased to 9 years. Similarly a growth
in the interest rate to 0.06, would alter the period to 7 years while, a rise in electricity
tariff to 0.8TL/kWh reduced the payback period to less than 3 years.
Thermal comfort on the other hand, was 41% more in case of enhancing thermal
characteristics of Cypriot dwellings, as inhabitants experience longer comfort times
if they choose not to condition the inside air.
Furthermore, the effect of low quality construction implementation was found
significant as up to 2300 kWh increase in electricity consumption was observed as
the air change rate per hour was increased from the standard 0.5 to 2.5 which
represents a poorly implemented construction project.
127
Similarly, enlarging fenestration area led to a surge in the annual load demand, as
if increased from 20 to 60%, overcomes net saving of the 20%-glazed case which
thermal performance had been improved. Hence, it is recommended that the glazing
are is designed as small as possible.
Finally, it is highlighted that monetary benefits that were computed in this study,
are additional benefits to non-monetary advantages which contribute to the
improvement of living quality, standard, and security of the case study. Most
important non-monetary benefits as the result of improving thermal performance of
residential units are listed below:
1- Higher thermal comfort levels inside the building
2- Better physical and intellectual activities of inhabitants
3- Lower dehydration possibility
4- Decreased risk of diseases and allergies such as cardiovascular and lung
diseases, blood clots, triggering inflammatory responses, constricting blood
vessels, asthma, hayfever, allergies to humidity and changes in temperature
5- Increased productivity
6- Decreased fatigue
7- Reduced presence of insects inside the house
8- Improved security
128
9- Reduced unnecessary racket level
6.2 Recommendations
According to the current research which was based on one typical residential unit
of Cyprus which floor area and architectural plan was considered fixed, a list of
recommendation for future studies is provided as follow:
1- Taking into account the variety of plans and floor areas
2- Considering multi-story buildings as case studies for studying the annual
energy demand and the proper placement of insulation layer
3- Performing complete life cycle costing
4- Assigning precise air conditioning schedule attributable to conventional living
style of inhabitants
5- Considering the possibility of using other means of air conditioning for
instance fuel or wood for winter time
129
REFERENCES
Abdou, A. A., & Budaiwi, I. M. (2005). Comparison of Thermal Conductivity
Measurements of Building Insulation Materials under Various Operating
Temperatures. Journal of Building Physics, 171-184.
Adalberth, K. (1997). Energy use during the Life Cycle of Single- Unit Dwellings:
Examples. Bullding and Enoironment, 321-329.
Aktacir, M., Buyukalaca, O., & Yılmaz, T. (2010). A case study for influence of
building thermal insulation on cooling load and air-conditioning system in the hot
and humid regions. Applied Energy, 599–607.
Al-ajmi, F. F., & Hanby, V. I. (2008). Simulation of energy consumption for Kuwaiti
domestic buildings. Energy and Buildings , 1101–1109.
Al-Homoud, M. (2005). Performance characteristics and practical applications of
common building thermal insulation materials. Build Environment, 353-366.
Al-Homoud, M. S. (2004 ). The Effectiveness of Thermal Insulation in Different
Types of Buildings in Hot Climates. Journal of Thermal Envelope and Building
Science, 235-247.
Al-Homoud, M. S. (2005). Performance characteristics and practical applications of
common building thermal insulation materials. Building and Environment , 353–
366.
130
Al-Khawaja, M. (2004). Determination and selecting the optimum thickness of
insulation for buildings in hot countries by accounting for solar radiation. Applied
Thermal Engineering, 2601–2610.
Al-Khawaja, M. J. (2004). Determination and selecting the optimum thickness of
insulation for buildings in hot countries by accounting for solar radiation. Applied
Thermal Engineering , 2601–2610.
Al-Rabghi, O. M., & Douglas, C. H. (2001). Energy simulation in buildings:
overview and BLAST sample. Energy Conversion and Management, 1623-1635.
Al-Sallal, K. A. (2003). Comparison between polystyrene and fiberglass roof
insulation in warm and cold climates. Renewable Energy , 603–611.
Al-Sanea , S. A., Zedan , M. F., & Al-Aj, S. A. (2005). Effect of electricity tariff on
the optimum insulation-thickness in building walls as determined by a dynamic
heat-transfer model. Applied Energy, 313–330.
Al-Tamimi , N. M., & Fadzil, S. S. (2011). Thermal Performance Analysis for
Ventilated and Unventilated Glazed Rooms in Malaysia (Comparing Simulated
and Field Data). Indoor Built Environ, 534–542.
Altan , H., Ward , I., Mohelnikova , J., & Vajkay, F. (2009). An internal assessment
of the thermal comfort and daylighting conditions of a naturally ventilated
building with an active glazed facade in a temperate climate. Energy and
Buildings , 36–50.

131
Andolsun, S., Culp, C. H., Haberl, J., & Witteb, M. J. (2011). EnergyPlus vs. DOE-
2.1e: The effect of ground-coupling on energy use of a code house with basement
in a hot-humid climate. Energy and Buildings , 1663–1675.
Ansari, F., Mokhtar, A., Abbas, K., & Adam, N. (2005). Simple approach for
building cooling load estimation. American Journal of Invironmental Science,
209-212.
apolloair. (2012, August 20). What are the benefits of Air Conditioning ? Retrieved
from apolloair: http://apolloair.eu/answer%204.htm
Arıcı, M., & Karabay, H. (2010). Determination of optimum thickness of double-
glazed windows for the climatic regions of Turkey. Energy and Buildings , 1773–
1778.
Asiedu, Y., & Gu, P. (1998). Product life cycle cost analysis: State of the art review.
International Journal of Production Research, 883-908.
Asif, M., Muneer, T., & Kelley, R. (2007). Life cycle assessment: A case study of a
dwelling home in Scotland. Building and Environment, 1391–1394.
Aydin, O. (2000). Determination of optimum air-layer thickness in double-pane
windows. Energy and Buildings, 303–308.
132
Aytac, A., & Aksoy, U. (2006). The relation between optimum insulation thickness
and heating cost on external walls for energy saving (in Turkish). Journal of the
Faculty of Engineering and Architecture of Gazi University, 753–758.
Bhaskoro, P. T., & Haq Gilani, S. U. (2011). Transient Cooling Load Characteristic
of an Academic Building, using TRNSYS. Journal of Applied Sciences, 1777-
1783.
Binamu , A. (2002). Integrating building design properties ‘‘air tightness’’ and
ventilation heat recovery for minimum heating energy consumption in cold
climates . Dissertation. Tampere University of Technology.
Bojic, M., Yik, F., & Sat, P. (2001). Influence of thermal insulation position in
cuilding envelope on the spave cooling of high-rise residential buildings in Hong
Kong. Energy and Buildings, 269-581.
Bojit, M. L., Milovanovic , M., & Loveday, D. L. (1997). Thermal behavior of a
building with a slanted roof. Energy and Buildings , 145-151.
Bolatturk, A. (2006). Determination of optimum insulation thickness for building
walls with respect to various fuels and climate zones in Turkey. Applied Thermal
Engineering, 1301–1309.
Bolatturk, A. (2008). Optimum insulation thicknesses for building walls with respect
to cooling and heating degree-hours in the warmest zone of Turkey. Building and
Environment, 1055–1064.
133
Bostancioğlu , E. (2010). Effect of building shape on a residential building's
construction, energy and life cycle costs. Architectural Science Review, 441-467.
Cabeza , L. F., Castell , A., Medrano, M., Martorell , I., Perez, G., & Fernandez , I.
(2010). Experimental study on the performance of insulation materials in
Mediterranean construction. Energy and Buildings, 630–636.
Chan, W. R., Nazaroff, W. W., Price, P. N., Sohn, M. D., & Gadgil, A. J. (2005).
Analyzing a database of residential air leakage in the United States. Atmospheric
Environment , 3445–3455.
Cheung, C., Fuller, R., & Luther, M. (2005). Energy-efficient envelope design for
high-rise apartments. Energy and Buildings, 37–48.
Chirarattananon, S., & Taveekun, J. (2004). An OTTV-based energy estimation
model for commercial buildings in Thailand. Energy and Buildings , 680–689.
Chwieduk, D. (2003). Towards sustainable-energy buildings. Applied Energy, 211–
217.
Climachill. (2012, August 20). widepr. Retrieved from The All Round Health
Benefits Of Air Conditioning:
http://www.widepr.com/press_release/11736/the_all_round_health_benefits_of_ai
r_conditioning.html
134
Comaklı, K., & Yuksel, B. (2003). Optimum insulation thickness of external walls
for energy saving. Applied Thermal Engineering , 473–479.
Crawley, D. B., Hand, J. W., Kummert, M., & Griffith, B. T. (2008). Contrasting the
capabilities of building energy performance simulation programs. Building and
Environment, 661–673.
Crawley, D. B., Lawrie, L. K., Winkelmann, F. C., Buhl, W. F., Huang, Y. J.,
Pedersen, C. O., . . . Glazer, J. (2001). EnergyPlus: creating a new-generation
building energy simulation program. Energy and Buildings , 319-331.
cross-group. (2012, August 20). The Benefits of Air Conditioning. Retrieved from
Cross Air Conditioning: http://www.cross-group.org/air-conditioning/aircon-
benefits.php
Dale, S. J. (1993). Introduction to life cycle costing. Glasgow: Blackie Academic &
Professional.
Daouas , N., Hassen, Z., & Aissia, H. B. (2010). Analytical periodic solution for the
study of thermal performance and optimum insulation thickness of building walls
in Tunisia. Applied Thermal Engineering, 319–326.
Daouas, N. (2011). A study on optimum insulation thickness in walls and energy
savings in Tunisian buildings based on analytical calculation of cooling and
heating transmission loads. Applied Energy, 156–164.
135
Dixit , M. K., Fernández-Solís, J. L., Lavy, S., & Culp, C. H. (2010). Identification
of parameters for embodied energy measurement: A literature review. Energy and
Buildings , 1238–1247.
Djuric , N., Novakovic, V., Holst , J., & Mitrovic, Z. (2007). Optimization of energy
consumption in buildings with hydronic heating systems considering thermal
comfort by use of computer-based tools. Energy and Buildings , 471–477.
Duffie, J. A., & Beckman , W. a. (1991). Solar engineering of thermal processes.
New York: Wiley.
Durmayaz, A., & Kadıoglu, M. (2003). Heating energy requirements and fuel
consumptions in the biggest city centers of Turkey. Energy Conversion and
Management, 1177–1192.
Durmayaz, A., Kadıoglu, M., & Sen, Z. (2000). An application of the degree-hours
method to estimate the residential heating energy requirement and fuel
consumption in Istanbul. Energy, 1245–1256.
Egelioglu, F., Mohamad , A. A., & Guven, H. (2001). Economic variables and
electricity consumption in Northern Cyprus. Energy , 355–362.
Emmerich, S. J., & Persily , A. K. (1998). Energy impacts of infiltration and
ventilation in US office buildings using multi-zone airflow simulation.
Proceedings of ASHRAE IAQ and energy 98 conference, (pp. 191–203). New
Orleans.
136
Farhanieh, B., & Sattari, S. (2006). Simulation of energy saving in Iranian buildings
using integrative modelling for insulation. Renewable Energy, 417–425.
Fay, R., Treloar, G., & Iyer-Raniga, U. (2000). Life-cycle energy analysis of
buildings: a case study. Building Research & Information, 31-41.
Florides , G. A., Tassou , S. A., Kalogirou, S. A., & Wrobel, L. C. (2001). Evolution
of domestic dwellings in Cyprus and energy analysis. Renewable Energy , 219–
234.
Florides, G. A., Kalogirou, S. A., Tassou, S. A., & Wrobel, L. C. (2000). Modeling
of the modern houses of Cyprus and energy consumption analysis. Energy , 915–
937.
Florides, G. A., Kalogirou, S. A., Tassou, S. A., & Wrobel, L. C. (2002). Modelling
and Simulation of an Absorption Solar Cooling System for Cyprus. Solar Energy,
43–51.
Frank, T. (2005). Climate change impacts on building heating and cooling energy
demand in Switzerland. Energy and Buildings , 1175–1185.
Fumo, N., Mago, P., & Luck, R. (2010). Methodology to estimate building energy
consumption using EnergyPlus Benchmark Models. Energy and Buildings , 2331–
2337.
137
gbXML. (2012, 6 20). About gbXML. Retrieved from gbXML:
http://www.gbxml.org/aboutgbxml.php
Gugliermetti, F., Passerini, G., & Bisegna, F. (2004). Climate models for the
assessment of o"ce buildings energy performance. Building and Environment, 39
– 50.
Guo, W., & Nutter , D. W. (2010). Setback and setup temperature analysis for a
classic double-corridor classroom building. Energy and Buildings, 189–197.
Gustafsson , S.-I., & Karlsson, B. G. (1989). Insulation and Bivalent Heating System
Optimization: Residential Housing Retrofits and Time-of-Use Tariffs for
Electricity. Applied Energy , 303-315.
Gustavsson, L., & Joelsson, A. (2010). Life cycle primary energy analysis of
residential buildings. Energy and Buildings , 210–220.
Halwatura, R., & Jayasinghe, M. (2009). Influence of insulated roof slabs on air
conditioned spaces in tropical climatic conditions—A life cycle cost approach.
Energy and Buildings, 678–686.
HelloDailyNews. (2012, August 20). Air Conditioning: too cool to be good for you?
Retrieved from hellomagazine:
http://www.hellomagazine.com/healthandbeauty/health-and-
fitness/201007053811/air-conditioning/health/risks/
138
Hernandez , P., & Kenny, P. (2010). From net energy to zero energy buildings:
Defining life cycle zero energy buildings. Energy and Buildings , 815–821.
Hester , N., Li, K., Schramski , J. R., & Crittenden, J. (2012). Dynamic modeling of
potentially conflicting energy reduction strategies for residential structures in
semi-arid climates. Journal of Environmental Management , 148-153.
Iqbal, I., & Al-Homoud, M. S. (2007). Parametric analysis of alternative energy
conservation measures in an office building in hot and humid climate. Building
and Environment , 2166–2177.
isbank. (2012, 6 19). Turkiye IS bankasi. Retrieved from IS bank:
http://www.isbank.com.tr/
Isik, B., & Tulbentci, T. (2008). Sustainable housing in island conditions using
Alker-gypsum-stabilized earth: A case study from northern Cyprus. Building and
Environment , 1426–1432.
Jaber, J. O. (2002). Prospects of energy savings in residential space heating. Energy
and Buildings, 311–319.
Jelle, B. P. (2011). Traditional, state-of-the-art and future thermal building insulation
materials and solutions – Properties, requirements and possibilities. Energy and
Buildings, 2549–2563.

139
Jelle, B. P., Gustavsen , A., & Baetens, R. (2010). The path to the high performance
thermal building insulation materials and solutions of tomorrow. Journal of
Building Physics, 99–123.
Jokisalo , J., Kurnitski , J., Korpi, M., Kalamees, T., & Vinha, J. (2009). Building
leakage, infiltration, and energy performance analyses for Finnish detached
houses. Building and Environment, 377–387.
Jokisalo, J. K. (2009). Building leakage, infiltration, and energy performance
analyses for Finnish detached houses. Building and Environment, 377–387.
Kahhat, R., Crittenden, J., Sharif, F., Fonseca, E., Li, K., Sawhney, A., & Zhang, P.
(2009). Environmental Impacts over the Life Cycle of Residential Buildings
Using Different Exterior Wall Systems. JOURNAL OF INFRASTRUCTURE
SYSTEMS, 211-221.
Kalamees, T. (2007). Air tightness and air leakages of new lightweight single-family
detached houses in Estonia. Building and Environment , 2369–2377.
Kalogirou, S. A., & Papamarcou, C. (2000). Modelling of a thermosyphon solar
water heating system and simple model validation. Renewable Energy , 471- 493.
Kalogirou, S. A., Florides , G., & Tassou, S. (2002). Energy analysis of buildings
employing thermal mass in Cyprus. Renewable Energy , 353–368.
140
Kanagaraj, G., & Mahalingam, A. (2011). Designing energy efficient commercial
buildings—A systems framework. Energy and Buildings, 2329–2343.
Kaska , Ö., Yumrutas, R., & Arpa , O. (2009). Theoretical and experimental
investigation of total equivalent temperature difference (TETD) values for
building walls and flat roofs in Turkey. Applied Energy, 737–747.
Kaska, Ö., & Yumrutas, R. (2009). Experimental investigation for total equivalent
temperature difference (TETD) values of building walls and flat roofs. Energy
Conversion and Management , 2818–2825.
Kaynakli, O. (2008). A study on residential heating energy requirement and optimum
insulation thickness. Renewable Energy, 1164-1172.
Kaynakli, O. (2012). A review of the economical and optimum thermal insulation
thickness for building applications. Renewable and Sustainable Energy Reviews,
415-425.
Kishk, M., Al-Hajj, A., Aouad, G., Bakis, N., & Sun, M. (2003). Whole life costing
in construction: A state of the art review. London: RICS Foundation.
Kitsios, K. (2009, September). Energy Efficiency Policies and Measures in CYPRUS.
Retrieved from Energy Efficiency Indicators in Europe: http://www.odyssee-
indicators.org/publications/PDF/cyprus_nr.pdf
141
Koroneos, C., Fokaidis, P., & Moussiopoulos, N. (2005). Cyprus energy system and
the use of renewable energy sources. Energy , 1889–1901.
Kossecka, E., & Kosny, J. (2002). Influence of insulation configuration on heating
and cooling loads in a continuously used building. Energy and Buildings , 321–
331.
Krartia, M., & Ihmb, P. (2009). Implementation of a building foundation heat
transfer model in EnergyPlus. Journal of Building Performance Simulation, 127–
142.
Kurnitski J, E. J. (2005). Ventilation in 102 Finnish single-family houses.
Proceedings of the eighth REHVA world congress clima. Lausanne.
Lai , C.-M., & Wang, Y.-H. (2011). Energy-Saving Potential of Building Envelope
Designs in Residential Houses in Taiwan. Energies , 2061-2076.
Liang , H.-H., & Ho, M.-C. (2007). Toxicity characteristics of commercially
manufactured insulation materials for building applications in Taiwan.
Construction and Building Materials , 1254–1261.
Ling , C. S., Ahmad , M. H., & Ossen, D. R. (2007). The Effect of Geometric Shape
and Building Orientation on Minimising Solar Insolation on High-Rise Buildings
in Hot Humid Climate. Journal of Construction in Developing Countries, 27 - 38.
142
Lyons, A. (2007). Materials for Architects and Builders. Boston: Butterworth-
Heinemann.
Mahlia , T., Taufiq , B. N., Ismail, & Masjuki, H. H. (2007). Correlation between
thermal conductivity and the thickness of selected insulation materials for
building wall. Energy and Buildings , 182–187.
Marszal, A. J., & Heiselberg, P. (2011). Life cycle cost analysis of a multi-storey
residential Net Zero Energy Building in Denmark. Energy , 5600-5609.
Masoso , O. T., & Grobler, L. J. (2008). A new and innovative look at anti-insulation
behaviour in building energy consumption. Energy and Buildings , 1889–1894.
Medrano, M., Brouwer, J., Mauzey, J., & Samuelsen, S. (2008). Integration of
distributed generation systems into generic types of commercial buildings in
California. Energy and Buildings , 537–548.
Mohamadi, Y., & Mirnoori, S. (2012). BIM and Thermal Performance Modeling
Integration: A Case Study of Cyprus Highly Glazed Dwellings. Proceedings of
2012 3rd International Conference on Construction and Project Management.
Dubai.
Moon, J. W., & Han, S.-H. (2011). Thermostat strategies impact on energy
consumption in residential buildings. Energy and Buildings , 338–346.
143
Morrissey, J., & Horne, R. E. (2011). Life cycle cost implications of energy
efficiency measures in new. Energy and Buildings , 915–924.
Neto , A. H., & Fiorelli, F. S. (2008). Comparison between detailed model simulation
and artificial neural network for forecasting building energy consumption. Energy
and Buildings, 2169–2176.
Oǧulata, R. (2002). Sectoral energy consumption in Turkey. Renewable and
Sustainable Energy Reviews, 471-480.
Ozay, N. (2005). A comparative study of climatically responsive house design at
various periods of Northern Cyprus architecture. Building and Environment , 841–
852.
Ozel , M., & Pihtili, K. (2007). Optimum location and distribution of insulation
layers on building walls with various orientations. Building and Environment ,
3051–3059.
Ozel, M., & Pihtili, K. (2007). Investigation of the most suitable location of
insulation applying on building roof from maximum load levelling point of view.
Building and Environment , 2360–2368.
Ozel, M., & Pihtili, K. (2008). Determination of optimum insulation thickness by
using heating and cooling degree-day values (in Turkish). International Journal of
Engineering and Natural Sciences, 191–197.

144
Ozel, M., & Pihtili, K. (2008). Investigation of effect of wall on window areas (in
Turkish). Journal of the Faculty of Engineering and Architecture of Gazi
University, 655–662.
Panayi, P. (2004). Prioritising energy investments in new dwellings constructed in
Cyprus. Renewable Energy, 789–819.
Panayiotou, G. P., Kalogirou, S. A., Florides, G. A., Maxoulis, C. N., Papadopoulos,
A. M., Neophytou, M., . . . Georgakis, G. (2010). The characteristics and the
energy behaviour of the residential building stock of Cyprus in view of Directive
2002/91/EC. Energy and Buildings , 2083–2089.
Papadopoulos, A. M. (2005). State of the art in thermal insulation materials and aims
for future developments. Energy and Buildings, 77–86.
Papadopoulos, A. M., & Giama, E. (2007). Environmental performance evaluation of
thermal insulation materials and its impact on the building. Building and
Environment , 2178–2187.
Poirazis , H., Blomsterberg, A., & Wall, M. (2008). Energy simulations for glazed
office buildings in Sweden. Energy and Buildings, 1161–1170.
Radhi, H. (2009). Can envelope codes reduce electricity and CO2 emissions in
different types of buildings in the hot climate of Bahrain? Energy , 205–215.

145
Ramesh, T., Prakash, R., & Shukla, K. K. (2010). Life cycle energy analysis of
buildings: An overview. Energy and Buildings, 1592–1600.
Ramesh, T., Prakash, R., & Shukla, K. K. (2012). Life cycle energy analysis of a
residential building with different envelopes and climates in Indian context.
Applied Energy , 193–202.
Revelle, C. S., Whitlatch, E. E., & Wright, J. R. (2004). Civil and environmental
systems engineering. Upper Saddle River: Pearson.
Sartori , I., & Hestnes, A. G. (2007). Energy use in the life cycle of conventional and
low-energy buildings: A review article. Energy and Buildings , 249–257.
Shopperholic. (2012, August 20). Air Conditioning Benefits. Retrieved from
HubPages: http://shopperholic.hubpages.com/hub/Air-Conditioning-Benefits
Shu-hua , L., Yuan, C., & Xue , Z. (2010). Life-cycle energy assessment of urban
residential buildings in China. Advanced Management Science (ICAMS) (pp. 186-
190 ). Chengdu: IEEE .
Sisman, N., Kahya, E., Aras, N., & Aras, H. (2007). Determination of optimum
insulation thicknesses of the external walls and roof (ceiling) for Turkey’s
different degree-day regions. Haydar , 5151–5155.

146
Smith, A., Fumo, N., Luck, R., & Mago, P. J. (2011). Robustness of a methodology
for estimating hourly energy consumption of buildings using monthly utility bills.
Energy and Buildings , 779–786.
Stephan, A., Crawford, R. H., & de Myttenaere, K. (2011). Towards a more holistic
approach to reducing the energy demand of dwellings. Procedia Engineering (pp.
1033-1041). Bologna: Elsevier.
Tenório, R., & Pedrini, A. (2002). Sustainable house design: Fernando de Noronha-
Brazil. Environmental Management and Health, 330 - 338.
Tian , Z., & Love , J. A. (2009). Energy performance optimization of radiant slab
cooling using building simulation and field measurements. Energy and Buildings ,
320–330.
Ucar, A., & Balo, F. (2009). Effect of fuel type on the optimum thickness of selected
insulation materials for the four different climatic regions of Turkey. Applied
Energy, 730–736.
Utama, A., & Gheewala, S. H. (2008). Life cycle energy of single landed houses in
Indonesia. Energy and Buildings , 1911–1916.
Yezioro , A., Dong , B., & Leite, F. (2008). An applied artificial intelligence
approach towards assessing building performance simulation tools. Energy and
Buildings, 612–620.

147
Yu , J., Yang, C., & Tian, L. (2008). Low-energy envelope design of residential
building in hot summer and cold winter zone in China. Energy and Buildings ,
1536–1546.
Yu, J., Yang, C., L. Tian, & Liao, D. (2009). A study on optimum insulation
thicknesses of external walls in hot summer and cold winter zone of China.
Applied Energy, 2520–2529.
Yu, J., Yang, C., Tian, L., & Liao, D. (2009). A study on optimum insulation
thicknesses of external walls in hot summer and cold winter zone of China.
Applied Energy, 2520–2529.
Yumrutas, R., Kaska, O., & Yıldırım, E. (2007). Estimation of total equivalent
temperature difference values for multilayer walls and flat roofs by using periodic
solution. Building and Environment , 1878–1885.
Yumrutas, R., Unsal, M., & Kanoglu, M. (2005). Periodic solution of transient heat
flow through multilayer walls and flat roofs bycomplex finite Fourier transform
technique. Building and Environment, 1117–1125.
Zachariadis, T. (2010). Forecast of electricity consumption in Cyprus up to the year
2030:The potential impact of climate change. Energy Policy, 744–750.
Zachariadis, T., & Pashourtidou, N. (2007). An empirical analysis of electricity
consumption in Cyprus. Energy Economics , 183–198.

148
Zhao, M., Gao, G., & Cheng, Y. (2011). Applicability Analysis of Passive Energy-
saving Strategy in Chongqing. International Conference on Electronics,
Communications and Control (ICECC) (pp. 4179 - 4183). Ningbo: IEEE.
Zhu, Y. (2006). Applying computer-based simulation to energy auditing: A case
study. Energy and Buildings, 421–428.


![Integrated Demand Management: Minimizing Unanticipated ...mid-term concept called Integrated Demand Management (IDM) [1]. The overarching goal of the IDM is to explore more effective](https://img.pdfslide.us/doc/110x75/5ecafbf6e7aa29671b3b295d/integrated-demand-management-minimizing-unanticipated-mid-term-concept-called.jpg)