Embed Size (px)
Citation preview

July 2017
Bilfinger SE Company Presentation
Bilfinger SE

Overview
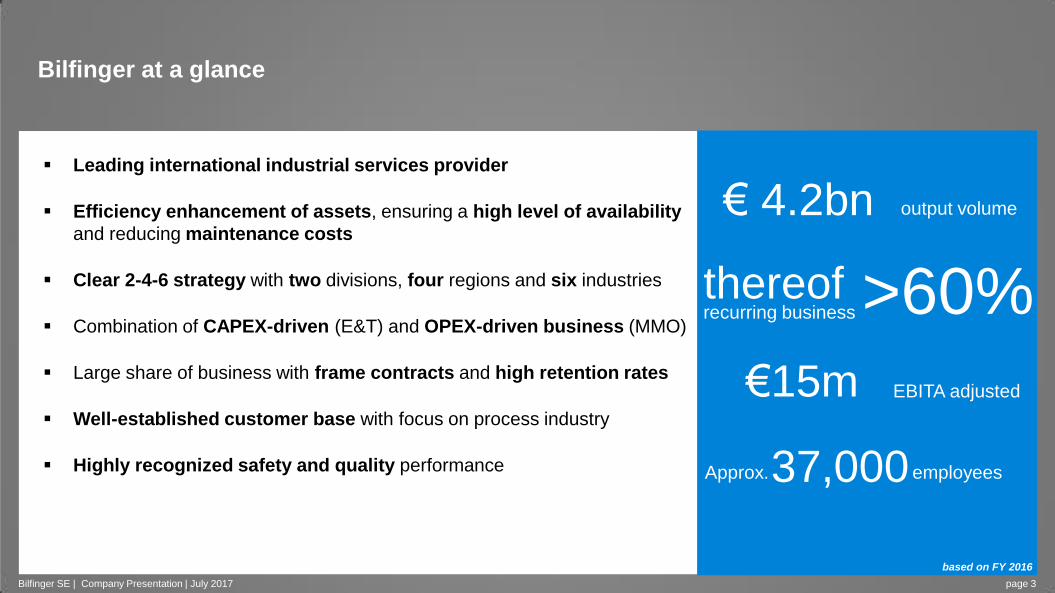
Bilfinger at a glance
Bilfinger SE | Company Presentation | July 2017 page 3
€ 4.2bn output volume
EBITA adjusted
employees
recurring business thereof >60%
€15m
37,000 Approx.
Leading international industrial services provider
Efficiency enhancement of assets, ensuring a high level of availability
and reducing maintenance costs
Clear 2-4-6 strategy with two divisions, four regions and six industries
Combination of CAPEX-driven (E&T) and OPEX-driven business (MMO)
Large share of business with frame contracts and high retention rates
Well-established customer base with focus on process industry
Highly recognized safety and quality performance
based on FY 2016
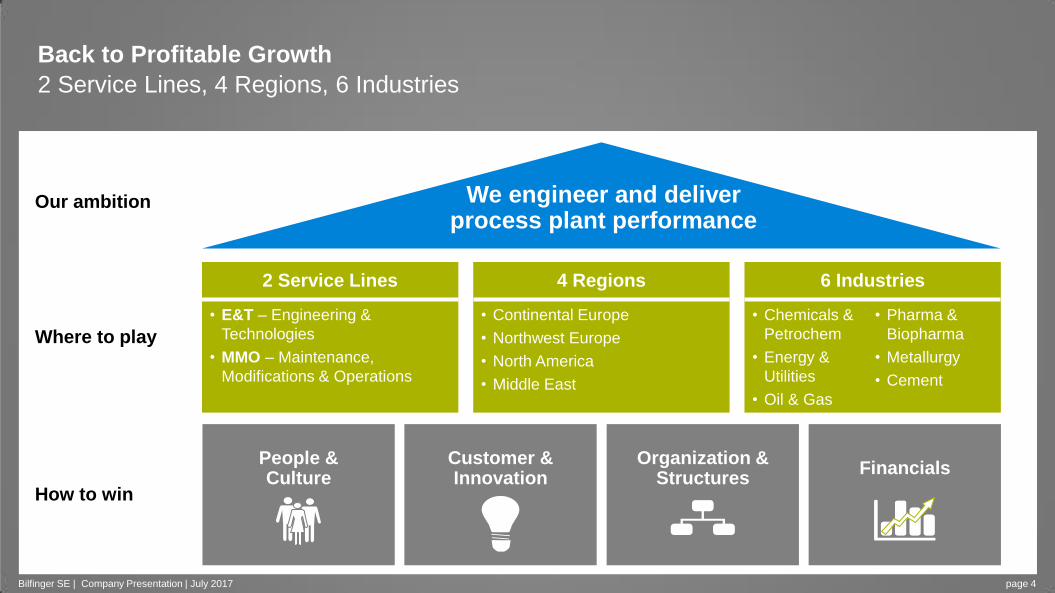
Back to Profitable Growth
2 Service Lines, 4 Regions, 6 Industries
Our ambition
• E&T – Engineering &
Technologies
• MMO – Maintenance,
Modifications & Operations
• Continental Europe
• Northwest Europe
• North America
• Middle East
• Chemicals &
Petrochem
• Energy &
Utilities
• Oil & Gas
• Pharma &
Biopharma
• Metallurgy
• Cement
2 Service Lines 4 Regions 6 Industries
People & Culture
Organization & Structures
Financials Customer & Innovation
Where to play
How to win
We engineer and deliver process plant performance
page 4 Bilfinger SE | Company Presentation | July 2017
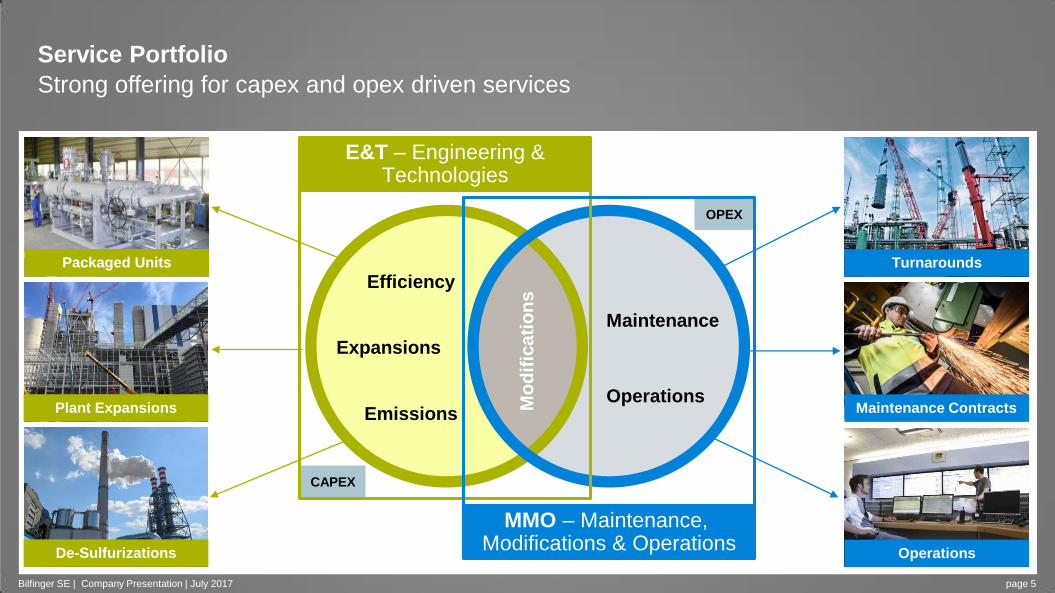
Service Portfolio
Strong offering for capex and opex driven services
page 5
Operations
E&T – Engineering & Technologies
Maintenance
MMO – Maintenance, Modifications & Operations
Expansions
Efficiency
Emissions
Turnarounds
Maintenance Contracts
Operations
Packaged Units
Plant Expansions
De-Sulfurizations
Mo
dif
ica
tio
ns
Bilfinger SE | Company Presentation | July 2017
OPEX
CAPEX

Go-To-Market organization
Market focus, customer centric
page 6
MMO – Maintenance, Modifications & Operations
Re
gio
na
l E&T – Engineering &
Technologies
Inte
rnation
al
North America
Middle East
Northwest Europe
Continental Europe
Construction
Technologies
Execution
Planning Oil & Gas
Chemicals & Petrochem
Energy & Utilities
Pharma & Biopharma
Metallurgy
Cement
22 plant types
6 industries
Bilfinger SE | Company Presentation | July 2017
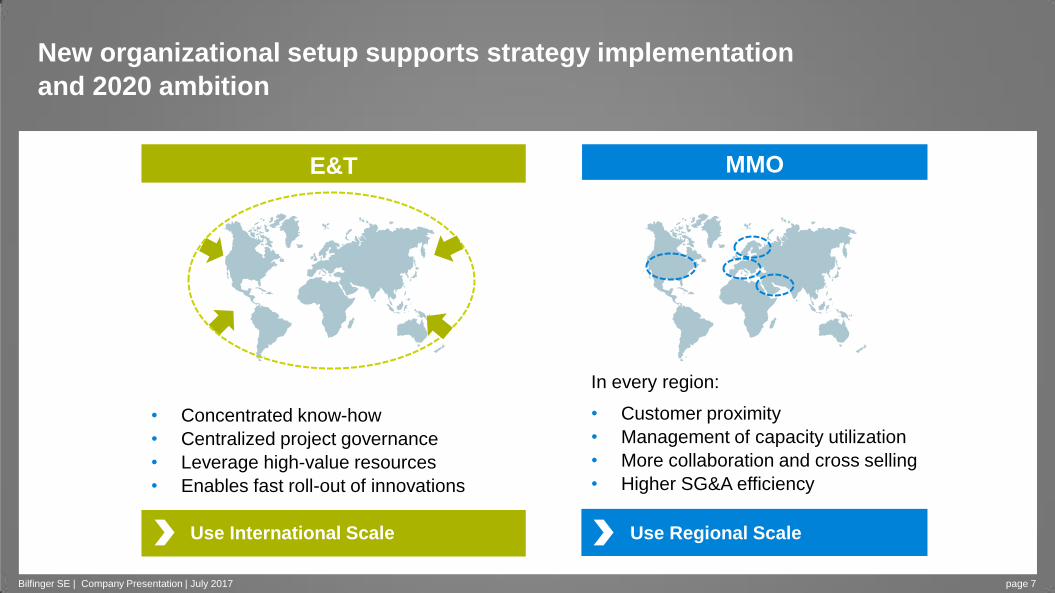
New organizational setup supports strategy implementation
and 2020 ambition
• Concentrated know-how
• Centralized project governance
• Leverage high-value resources
• Enables fast roll-out of innovations
In every region:
• Customer proximity
• Management of capacity utilization
• More collaboration and cross selling
• Higher SG&A efficiency
E&T MMO
Use International Scale Use Regional Scale
Bilfinger SE | Company Presentation | July 2017 page 7

Raising the growth potential
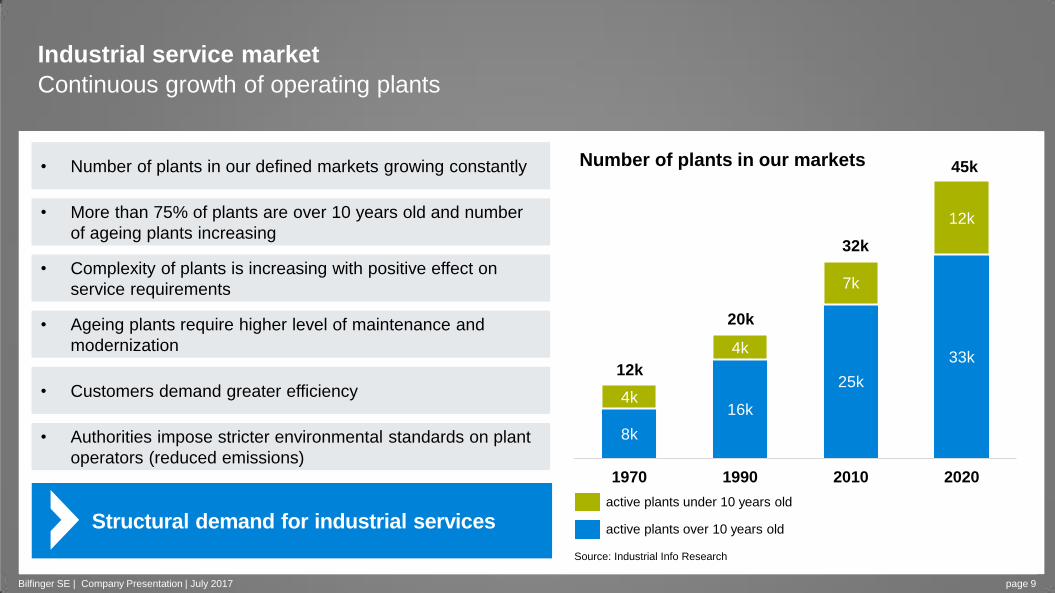
• Number of plants in our defined markets growing constantly
8k
16k
25k
33k
4k
4k
7k
12k
1970 1990 2010 2020
12k
20k
32k
45k
Industrial service market
Continuous growth of operating plants
page 9
active plants under 10 years old
Source: Industrial Info Research
active plants over 10 years old
• More than 75% of plants are over 10 years old and number
of ageing plants increasing
• Complexity of plants is increasing with positive effect on
service requirements
• Ageing plants require higher level of maintenance and
modernization
• Authorities impose stricter environmental standards on plant
operators (reduced emissions)
• Customers demand greater efficiency
Structural demand for industrial services
Number of plants in our markets
Bilfinger SE | Company Presentation | July 2017
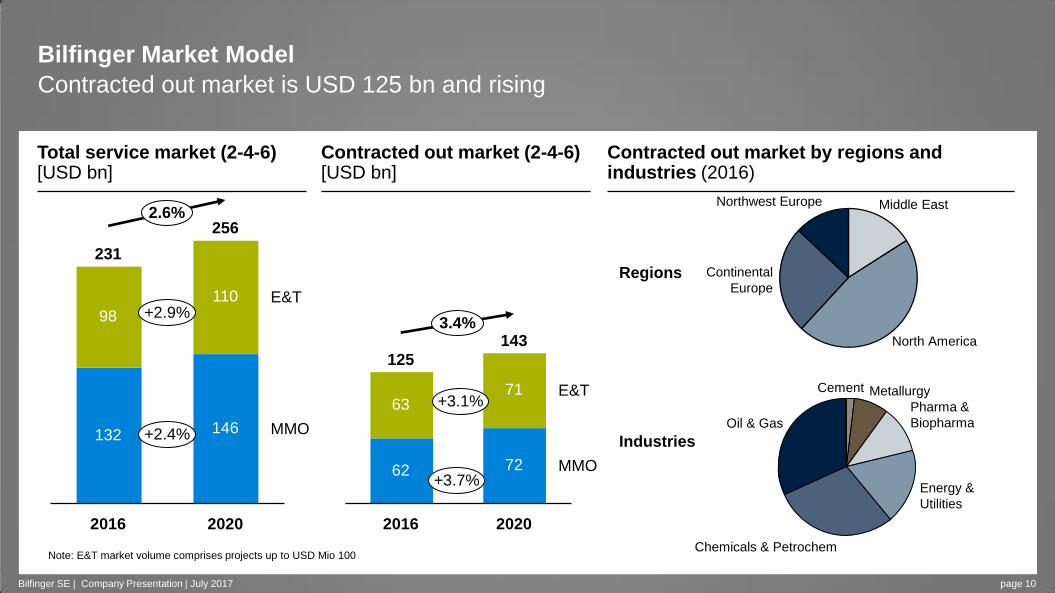
Bilfinger Market Model
Contracted out market is USD 125 bn and rising
page 10
MMO
E&T
2020
256
146
110
2016
231
132
98
2.6%
MMO
E&T
2020
143
72
71
2016
125
62
63
3.4%
Note: E&T market volume comprises projects up to USD Mio 100
Regions
Industries
Northwest Europe
Continental
Europe
North America
Middle East
Chemicals & Petrochem
Oil & Gas
Cement Metallurgy
Energy &
Utilities
Pharma &
Biopharma
+3.1%
+3.7%
+2.9%
+2.4%
Total service market (2-4-6) [USD bn]
Contracted out market (2-4-6) [USD bn]
Contracted out market by regions and industries (2016)
Bilfinger SE | Company Presentation | July 2017
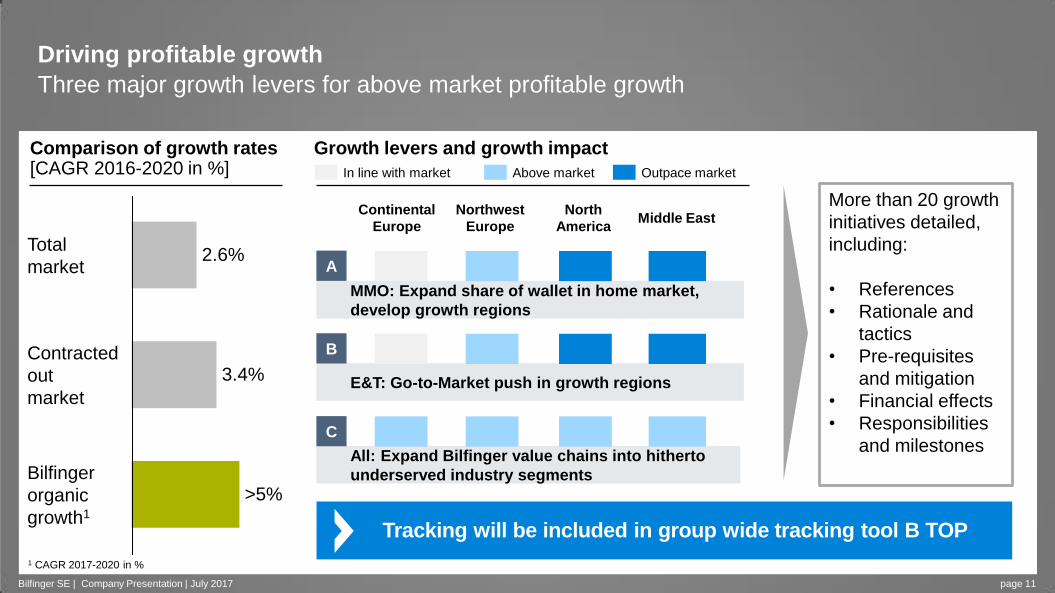
Driving profitable growth
Three major growth levers for above market profitable growth
page 11 Bilfinger SE | Company Presentation | July 2017
Comparison of growth rates [CAGR 2016-2020 in %]
Bilfinger
organic
growth1
>5%
Contracted
out
market
3.4%
Total
market 2.6%
More than 20 growth
initiatives detailed,
including:
• References
• Rationale and
tactics
• Pre-requisites
and mitigation
• Financial effects
• Responsibilities
and milestones
Tracking will be included in group wide tracking tool B TOP
Growth levers and growth impact
MMO: Expand share of wallet in home market,
develop growth regions
E&T: Go-to-Market push in growth regions
All: Expand Bilfinger value chains into hitherto
underserved industry segments
A
B
C
Continental
Europe
Northwest
Europe
North
America Middle East
In line with market Above market Outpace market
1 CAGR 2017-2020 in %
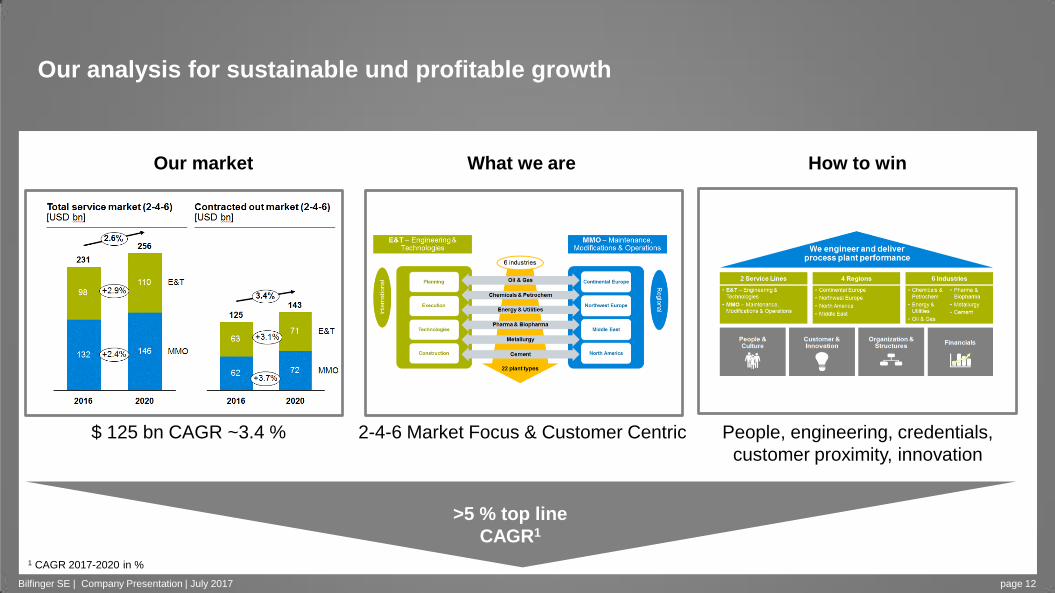
Our analysis for sustainable und profitable growth
page 12 Bilfinger SE | Company Presentation | July 2017
Our market What we are How to win
>5 % top line
CAGR1
$ 125 bn CAGR ~3.4 % 2-4-6 Market Focus & Customer Centric People, engineering, credentials,
customer proximity, innovation
1 CAGR 2017-2020 in %

Improving our financial performance
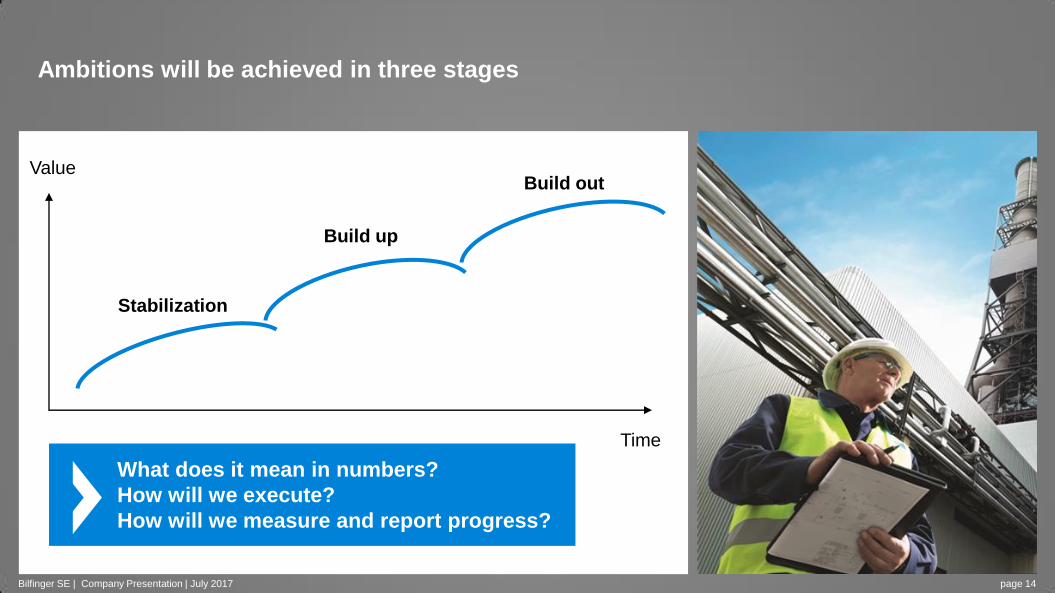
Ambitions will be achieved in three stages
Stabilization
Build up
Build out
What does it mean in numbers?
How will we execute?
How will we measure and report progress?
Time
Value
Bilfinger SE | Company Presentation | July 2017 page 14
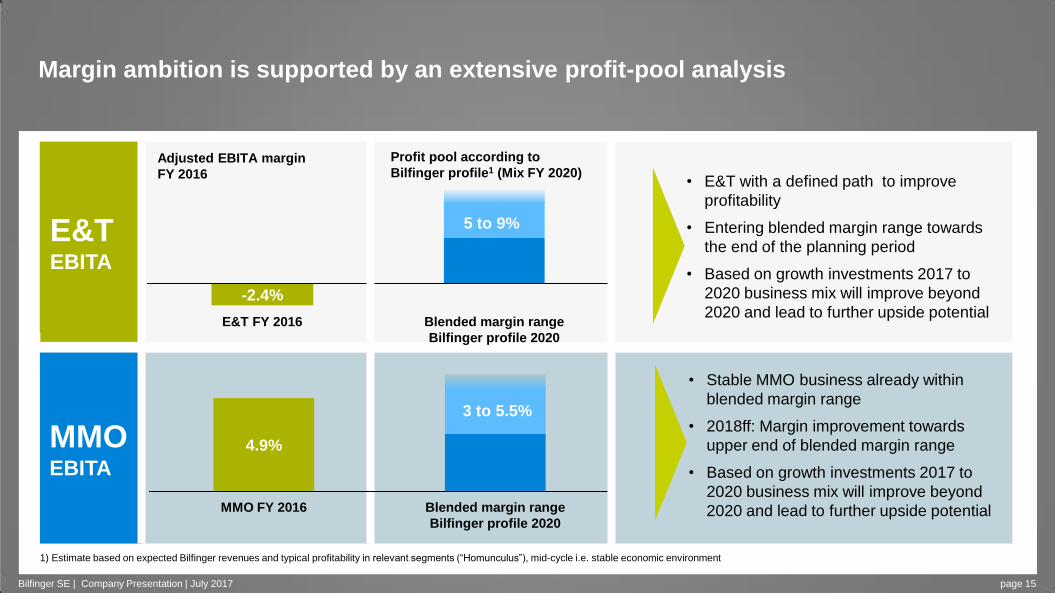
MMO EBITA
E&T
-2.4%
E&T FY 2016 Blended margin range
Bilfinger profile 2020
Profit pool according to
Bilfinger profile1 (Mix FY 2020)
1) Estimate based on expected Bilfinger revenues and typical profitability in relevant segments (“Homunculus”), mid-cycle i.e. stable economic environment
5 to 9%
Adjusted EBITA margin
FY 2016
Margin ambition is supported by an extensive profit-pool analysis
E&T EBITA
Bilfinger SE | Company Presentation | July 2017 page 15
• E&T with a defined path to improve
profitability
• Entering blended margin range towards
the end of the planning period
• Based on growth investments 2017 to
2020 business mix will improve beyond
2020 and lead to further upside potential
• Stable MMO business already within
blended margin range
• 2018ff: Margin improvement towards
upper end of blended margin range
• Based on growth investments 2017 to
2020 business mix will improve beyond
2020 and lead to further upside potential MMO FY 2016 Blended margin range
Bilfinger profile 2020
4.9%
3 to 5.5%
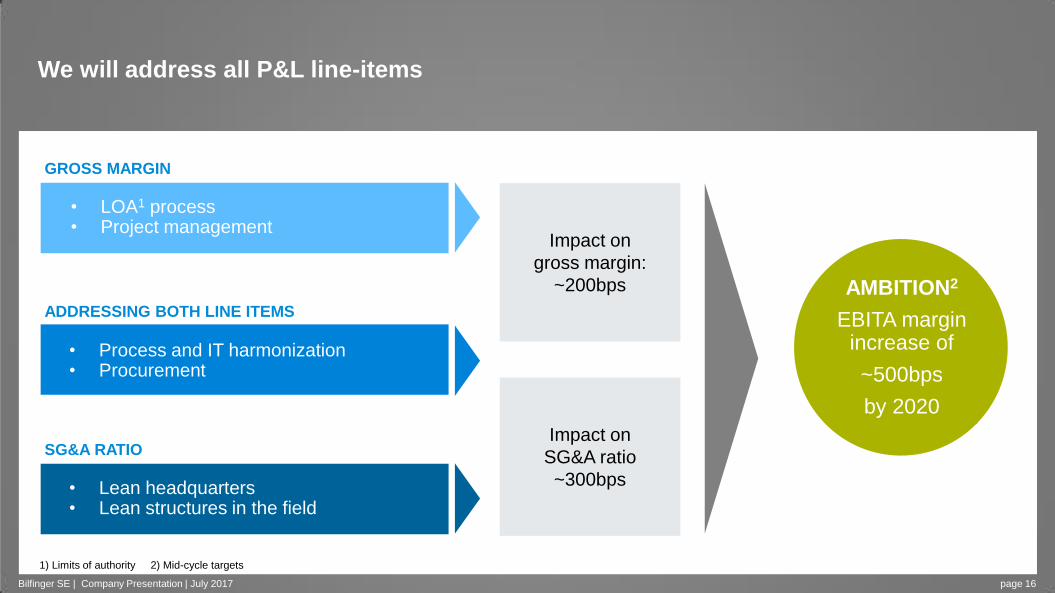
We will address all P&L line-items
Impact on
gross margin:
~200bps
Impact on
SG&A ratio
~300bps
AMBITION2
EBITA margin increase of
~500bps
by 2020
• LOA1 process • Project management
• Process and IT harmonization • Procurement
GROSS MARGIN
ADDRESSING BOTH LINE ITEMS
SG&A RATIO
• Lean headquarters • Lean structures in the field
1) Limits of authority 2) Mid-cycle targets
Bilfinger SE | Company Presentation | July 2017 page 16
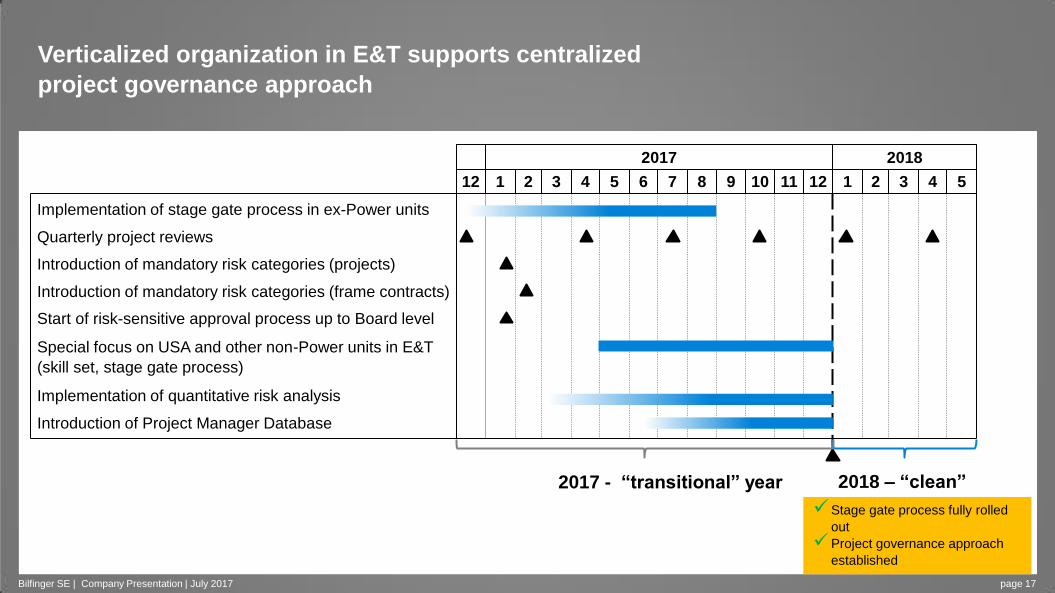
Verticalized organization in E&T supports centralized
project governance approach
2017 2018
12 1 2 3 4 5 6 7 8 9 10 11 12 1 2 3 4 5
Start of risk-sensitive approval process up to Board level
Introduction of mandatory risk categories (projects)
Introduction of Project Manager Database
Special focus on USA and other non-Power units in E&T
(skill set, stage gate process)
Implementation of quantitative risk analysis
Quarterly project reviews
Implementation of stage gate process in ex-Power units
Introduction of mandatory risk categories (frame contracts)
2017 - “transitional” year 2018 – “clean”
Stage gate process fully rolled
out
Project governance approach
established
Bilfinger SE | Company Presentation | July 2017 page 17

Current Trading – Guidance 2017 – Targets 2020
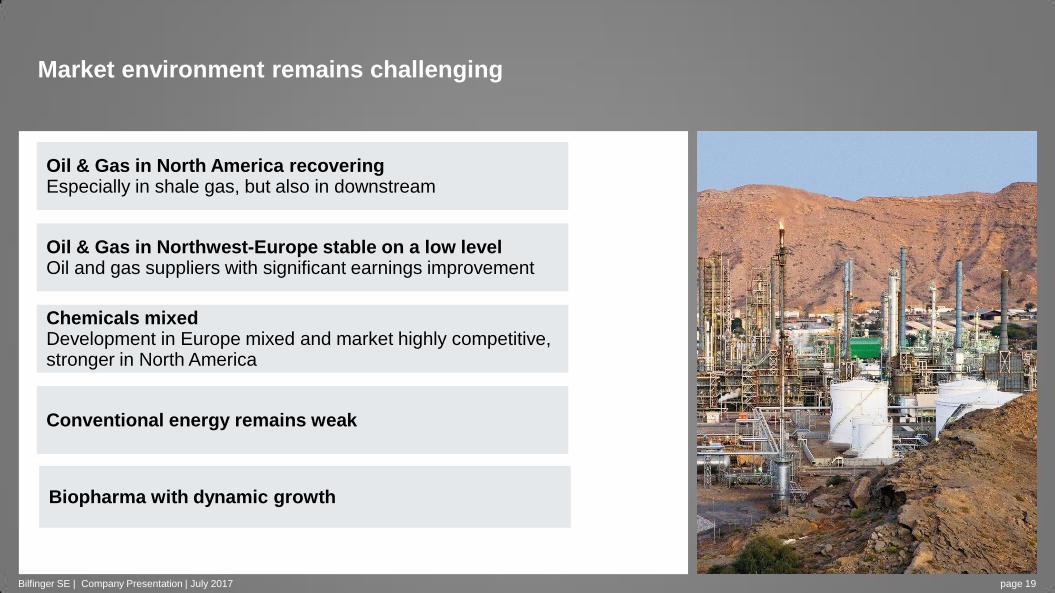
Market environment remains challenging
Oil & Gas in North America recovering Especially in shale gas, but also in downstream
Oil & Gas in Northwest-Europe stable on a low level Oil and gas suppliers with significant earnings improvement
Chemicals mixed Development in Europe mixed and market highly competitive, stronger in North America
Conventional energy remains weak
Biopharma with dynamic growth
Bilfinger SE | Company Presentation | July 2017 page 19
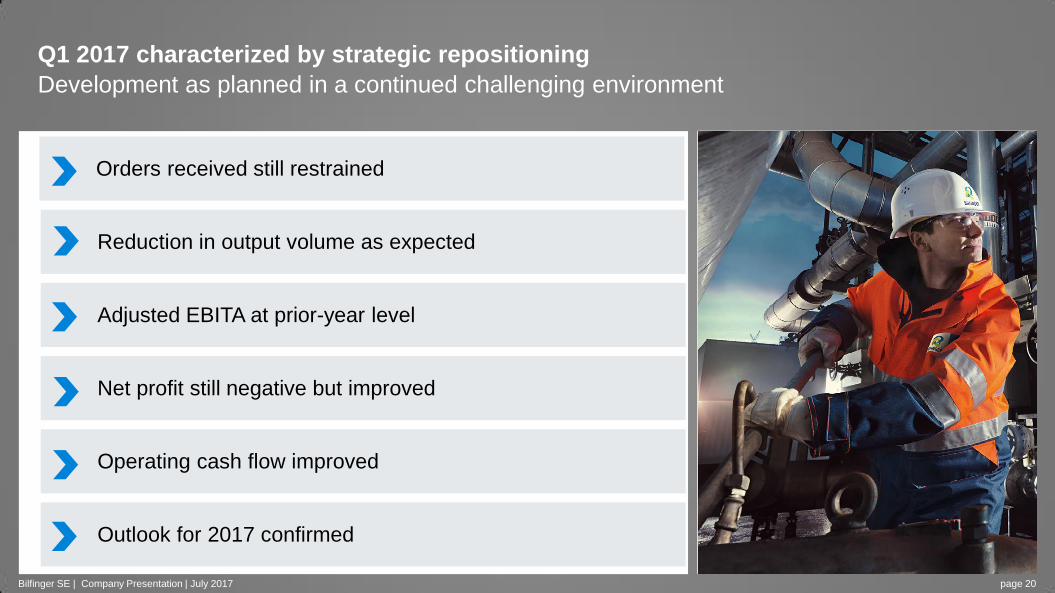
Q1 2017 characterized by strategic repositioning
Development as planned in a continued challenging environment
Bilfinger SE | Company Presentation | July 2017 page 20
Orders received still restrained
Adjusted EBITA at prior-year level
Net profit still negative but improved
Operating cash flow improved
Outlook for 2017 confirmed
Reduction in output volume as expected
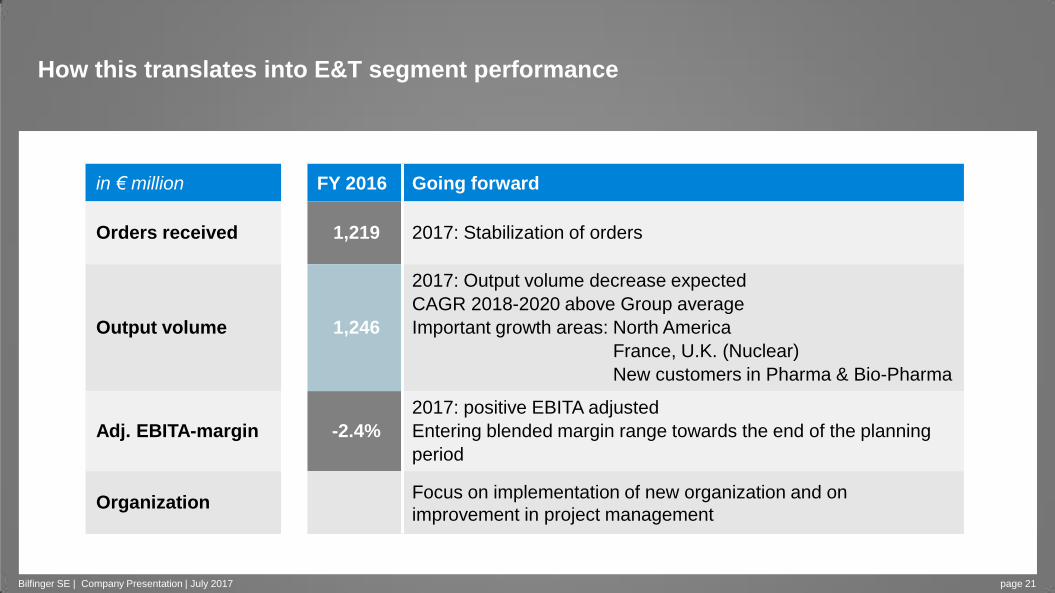
How this translates into E&T segment performance
in € million FY 2016 Going forward
Orders received 1,219 2017: Stabilization of orders
Output volume 1,246
2017: Output volume decrease expected
CAGR 2018-2020 above Group average
Important growth areas: North America
France, U.K. (Nuclear)
New customers in Pharma & Bio-Pharma
Adj. EBITA-margin -2.4%
2017: positive EBITA adjusted
Entering blended margin range towards the end of the planning
period
Organization Focus on implementation of new organization and on
improvement in project management
Bilfinger SE | Company Presentation | July 2017 page 21
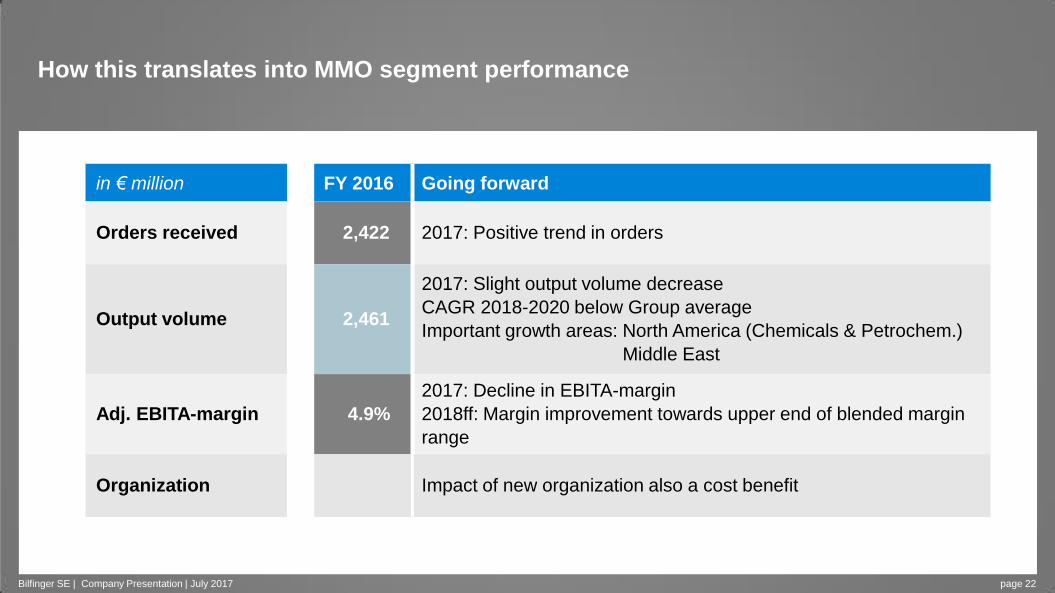
How this translates into MMO segment performance
in € million FY 2016 Going forward
Orders received 2,422 2017: Positive trend in orders
Output volume 2,461
2017: Slight output volume decrease
CAGR 2018-2020 below Group average
Important growth areas: North America (Chemicals & Petrochem.)
Middle East
Adj. EBITA-margin 4.9%
2017: Decline in EBITA-margin
2018ff: Margin improvement towards upper end of blended margin
range
Organization Impact of new organization also a cost benefit
Bilfinger SE | Company Presentation | July 2017 page 22
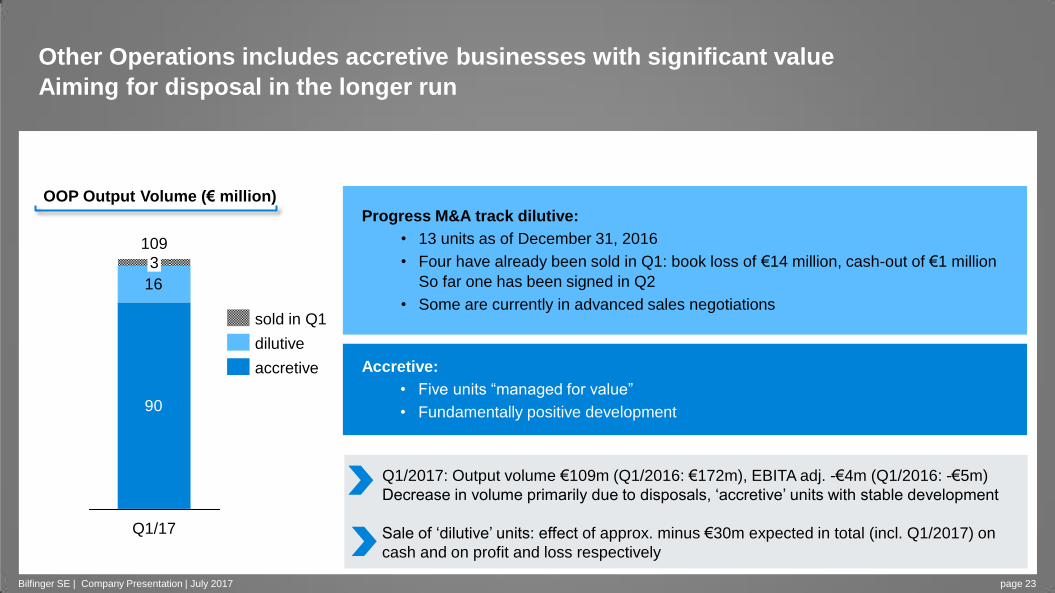
Other Operations includes accretive businesses with significant value
Aiming for disposal in the longer run
Bilfinger SE | Company Presentation | July 2017 page 23
Progress M&A track dilutive:
• 13 units as of December 31, 2016
• Four have already been sold in Q1: book loss of €14 million, cash-out of €1 million
So far one has been signed in Q2
• Some are currently in advanced sales negotiations
Accretive:
• Five units “managed for value”
• Fundamentally positive development
OOP Output Volume (€ million)
Q1/2017: Output volume €109m (Q1/2016: €172m), EBITA adj. -€4m (Q1/2016: -€5m)
Decrease in volume primarily due to disposals, ‘accretive’ units with stable development
Sale of ‘dilutive’ units: effect of approx. minus €30m expected in total (incl. Q1/2017) on
cash and on profit and loss respectively
90
16
3
Q1/17
109
dilutive
sold in Q1
accretive
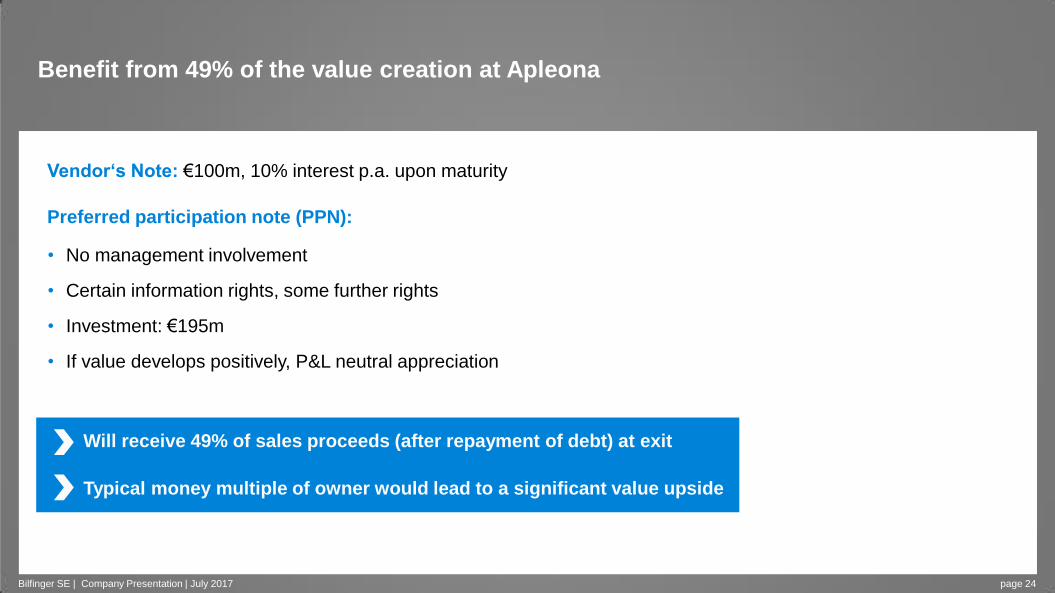
Will receive 49% of sales proceeds (after repayment of debt) at exit
Typical money multiple of owner would lead to a significant value upside
Benefit from 49% of the value creation at Apleona
Vendor‘s Note: €100m, 10% interest p.a. upon maturity
Preferred participation note (PPN):
• No management involvement
• Certain information rights, some further rights
• Investment: €195m
• If value develops positively, P&L neutral appreciation
Bilfinger SE | Company Presentation | July 2017 page 24
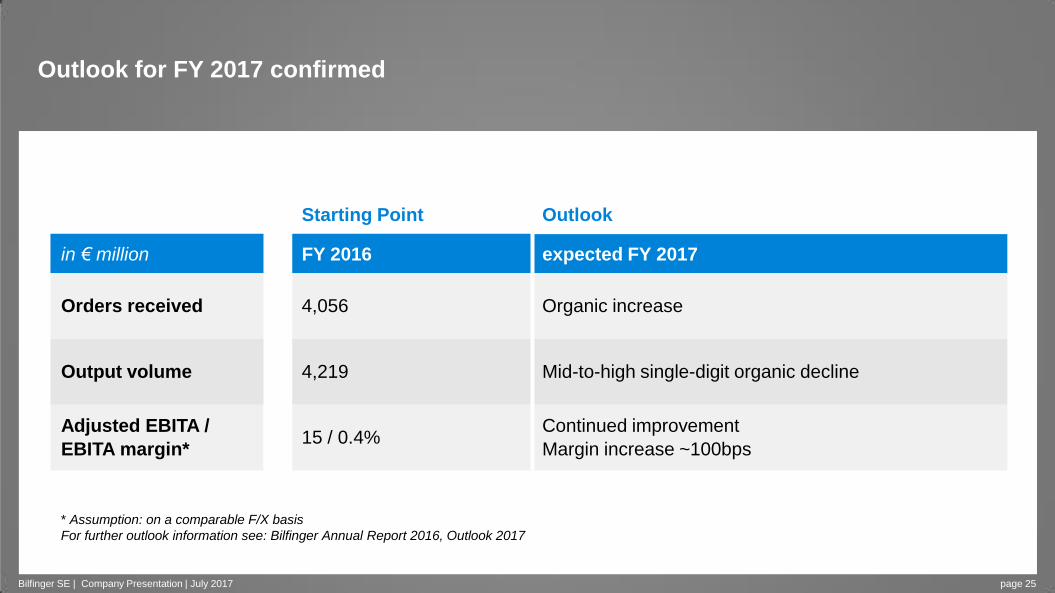
Outlook for FY 2017 confirmed
Starting Point Outlook
in € million FY 2016 expected FY 2017
Orders received 4,056 Organic increase
Output volume 4,219 Mid-to-high single-digit organic decline
Adjusted EBITA /
EBITA margin* 15 / 0.4%
Continued improvement
Margin increase ~100bps
Bilfinger SE | Company Presentation | July 2017 page 25
* Assumption: on a comparable F/X basis
For further outlook information see: Bilfinger Annual Report 2016, Outlook 2017
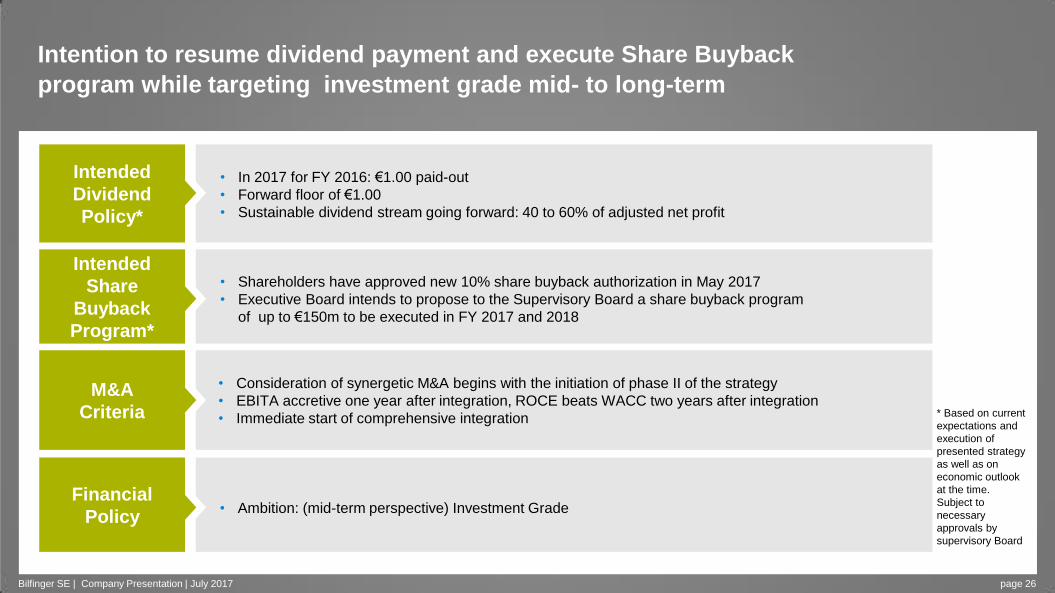
Intention to resume dividend payment and execute Share Buyback
program while targeting investment grade mid- to long-term
• Consideration of synergetic M&A begins with the initiation of phase II of the strategy
• EBITA accretive one year after integration, ROCE beats WACC two years after integration
• Immediate start of comprehensive integration
M&A
Criteria
• Shareholders have approved new 10% share buyback authorization in May 2017
• Executive Board intends to propose to the Supervisory Board a share buyback program
of up to €150m to be executed in FY 2017 and 2018
Intended
Share
Buyback
Program*
• In 2017 for FY 2016: €1.00 paid-out
• Forward floor of €1.00
• Sustainable dividend stream going forward: 40 to 60% of adjusted net profit
Intended
Dividend
Policy*
• Ambition: (mid-term perspective) Investment Grade Financial
Policy
* Based on current
expectations and
execution of
presented strategy
as well as on
economic outlook
at the time.
Subject to
necessary
approvals by
supervisory Board
Bilfinger SE | Company Presentation | July 2017 page 26
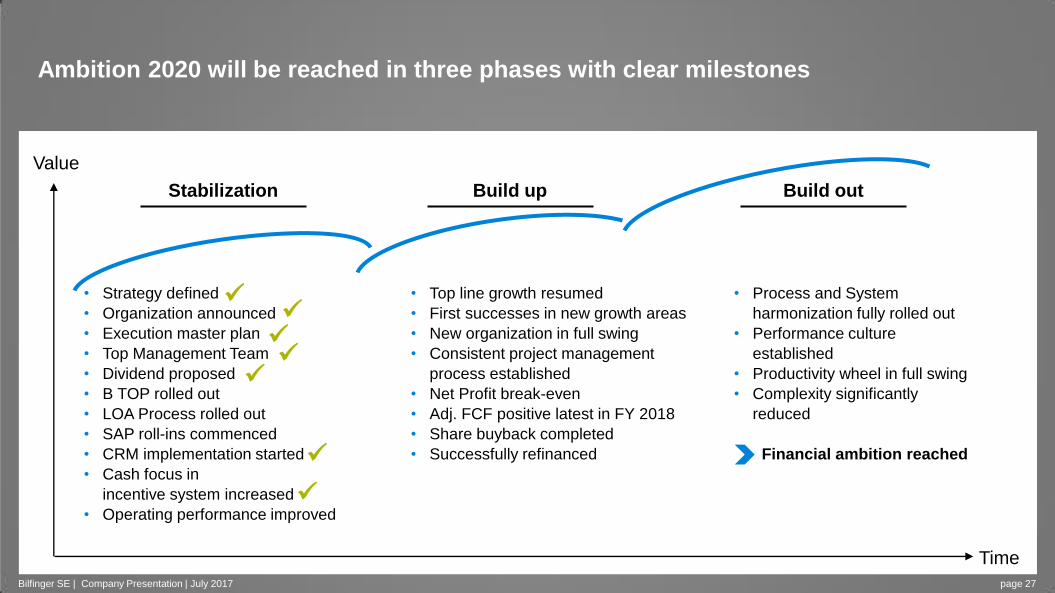
• Top line growth resumed
• First successes in new growth areas
• New organization in full swing
• Consistent project management
process established
• Net Profit break-even
• Adj. FCF positive latest in FY 2018
• Share buyback completed
• Successfully refinanced
• Process and System
harmonization fully rolled out
• Performance culture
established
• Productivity wheel in full swing
• Complexity significantly
reduced
Financial ambition reached
• Strategy defined
• Organization announced
• Execution master plan
• Top Management Team
• Dividend proposed
• B TOP rolled out
• LOA Process rolled out
• SAP roll-ins commenced
• CRM implementation started
• Cash focus in
incentive system increased
• Operating performance improved
Ambition 2020 will be reached in three phases with clear milestones
Time
Value
Stabilization Build up Build out
Bilfinger SE | Company Presentation | July 2017 page 27

Wrap-up
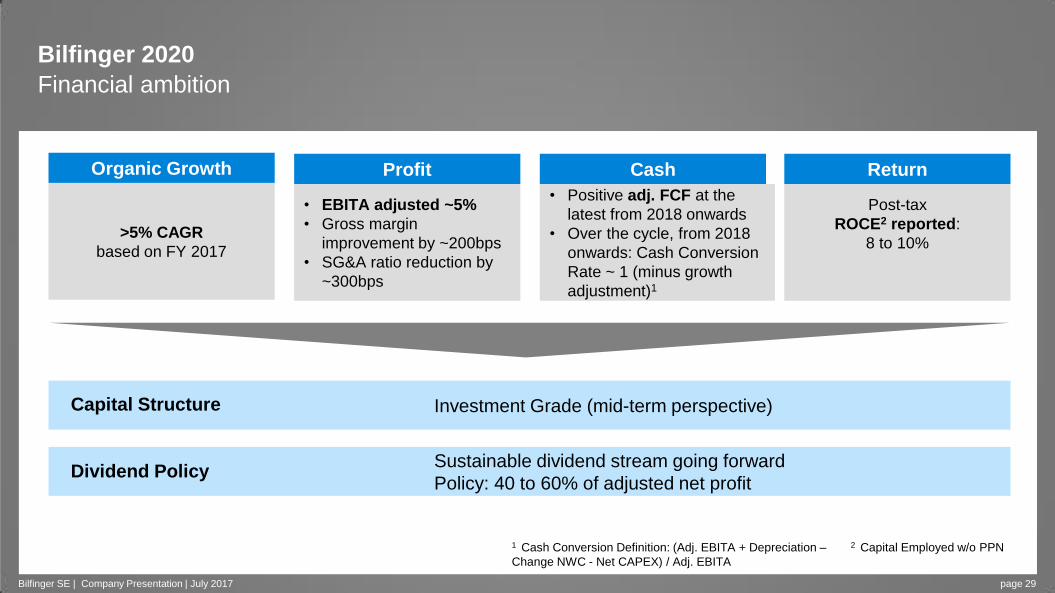
Bilfinger 2020
Financial ambition
page 29
• Positive adj. FCF at the
latest from 2018 onwards
• Over the cycle, from 2018
onwards: Cash Conversion
Rate ~ 1 (minus growth
adjustment)1
>5% CAGR
based on FY 2017
Post-tax
ROCE2 reported:
8 to 10%
Investment Grade (mid-term perspective)
Sustainable dividend stream going forward
Policy: 40 to 60% of adjusted net profit
• EBITA adjusted ~5%
• Gross margin
improvement by ~200bps
• SG&A ratio reduction by
~300bps
2 Capital Employed w/o PPN
Organic Growth Profit Cash Return
Capital Structure
Dividend Policy
Bilfinger SE | Company Presentation | July 2017
1 Cash Conversion Definition: (Adj. EBITA + Depreciation –
Change NWC - Net CAPEX) / Adj. EBITA
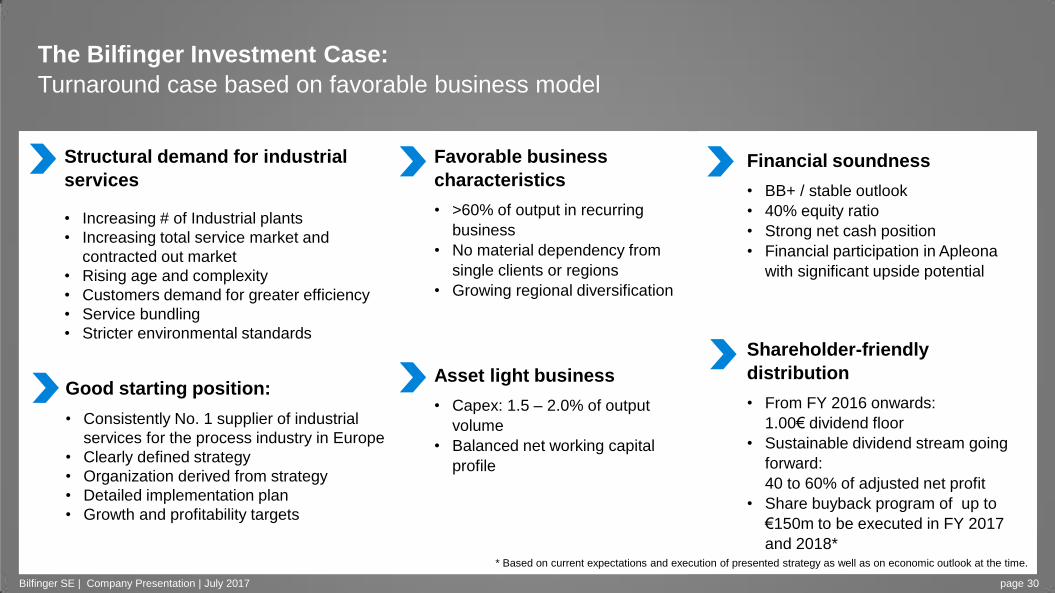
The Bilfinger Investment Case:
Turnaround case based on favorable business model
Bilfinger SE | Company Presentation | July 2017 page 30
Structural demand for industrial
services
• Increasing # of Industrial plants
• Increasing total service market and
contracted out market
• Rising age and complexity
• Customers demand for greater efficiency
• Service bundling
• Stricter environmental standards
Financial soundness
• BB+ / stable outlook
• 40% equity ratio
• Strong net cash position
• Financial participation in Apleona
with significant upside potential
Favorable business
characteristics
• >60% of output in recurring
business
• No material dependency from
single clients or regions
• Growing regional diversification
Good starting position:
• Consistently No. 1 supplier of industrial
services for the process industry in Europe
• Clearly defined strategy
• Organization derived from strategy
• Detailed implementation plan
• Growth and profitability targets
Asset light business
• Capex: 1.5 – 2.0% of output
volume
• Balanced net working capital
profile
Shareholder-friendly
distribution
• From FY 2016 onwards:
1.00€ dividend floor
• Sustainable dividend stream going
forward:
40 to 60% of adjusted net profit
• Share buyback program of up to
€150m to be executed in FY 2017
and 2018*
* Based on current expectations and execution of presented strategy as well as on economic outlook at the time.
Bilfinger SE | Company Presentation | July 2017 page 31